Embed Size (px)
Citation preview
Golar LNG Partners Fourth Quarter Results 2012
28 February 2013
This presentation contains forward-looking statements (as defined in Section 21E of the Securities Exchange Act of 1934, as amended) which reflects management’s current expectations, estimates and projections about its operations. All statements, other than statements of historical facts, that address activities and events that will, should, could or may occur in the future are forward-looking statements. Words such as “may,” “could,” “should,” “would,” “expect,” “plan,” “anticipate,” “intend,” “forecast,” “believe,” “estimate,” “predict,” “propose,” “potential,” “continue” or the negative of these terms and similar expressions are intended to identify such forward-looking statements. These statements are not guarantees of future performance and are subject to certain risks, uncertainties and other factors, some of which are beyond our control and are difficult to predict. Therefore, actual outcomes and results may differ materially from what is expressed or forecasted in such forward-looking statements. You should not place undue reliance on these forward-looking statements, which speak only as of the date of this presentation. Unless legally required, Golar LNG Partners undertakes no obligation to update publicly any forward-looking statements whether as a result of new information, future events or otherwise. Among the important factors that could cause actual results to differ materially from those in the forward-looking statements are: changes in liquified natural gas (LNG) and floating storage and regasification unit (FSRU) market trends, including charter rates; changes in the supply and demand for LNG; changes in trading patterns that affect the opportunities for the profitable operation of LNG carriers and FSRUs; Golar LNG Partners ability to acquire new vessels from Golar LNG or third parties; increases in costs; the potential for the exercise of purchase options or early termination of charters by the Partnerships charterers and Golar Partners inability to replace assets and/or long-term contracts; and changes in the ability of Golar LNG Partners to obtain additional financing, in particular, in connection with the recent turmoil in financial markets. Unpredictable or unknown factors herein also could have material adverse effects on forward-looking statements. Please read Golar LNG Partners' filings with the Securities and Exchange Commission for more information regarding these factors and the risks faced by Golar LNG Partners.
2
Forward Looking Statements
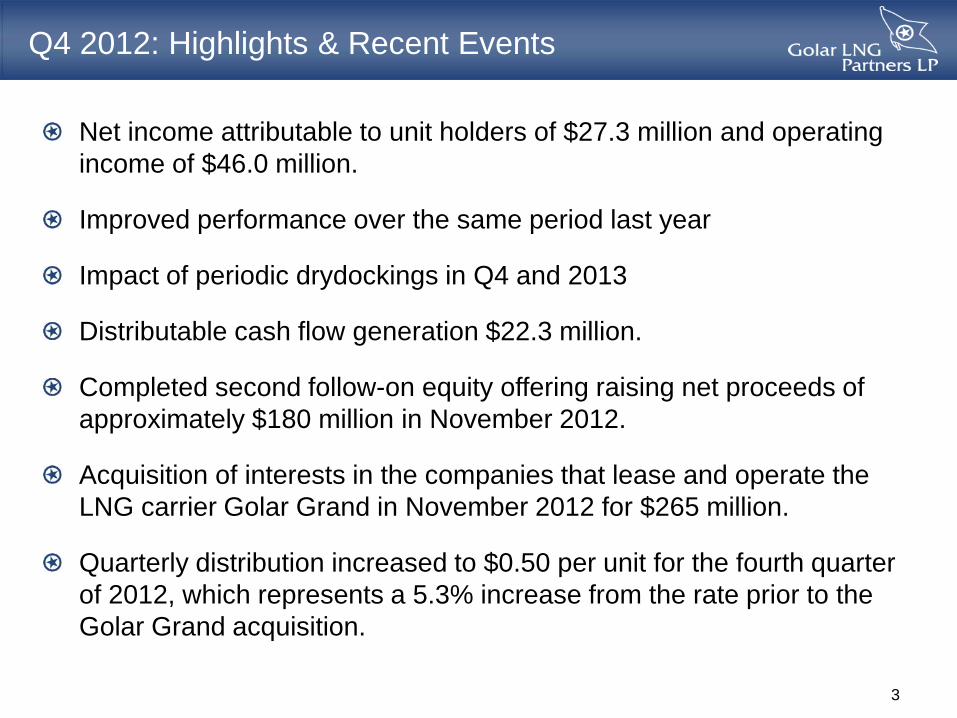
Net income attributable to unit holders of $27.3 million and operating income of $46.0 million.
Improved performance over the same period last year
Impact of periodic drydockings in Q4 and 2013
Distributable cash flow generation $22.3 million.
Completed second follow-on equity offering raising net proceeds of approximately $180 million in November 2012.
Acquisition of interests in the companies that lease and operate the LNG carrier Golar Grand in November 2012 for $265 million.
Quarterly distribution increased to $0.50 per unit for the fourth quarter of 2012, which represents a 5.3% increase from the rate prior to the Golar Grand acquisition.
3
Q4 2012: Highlights & Recent Events
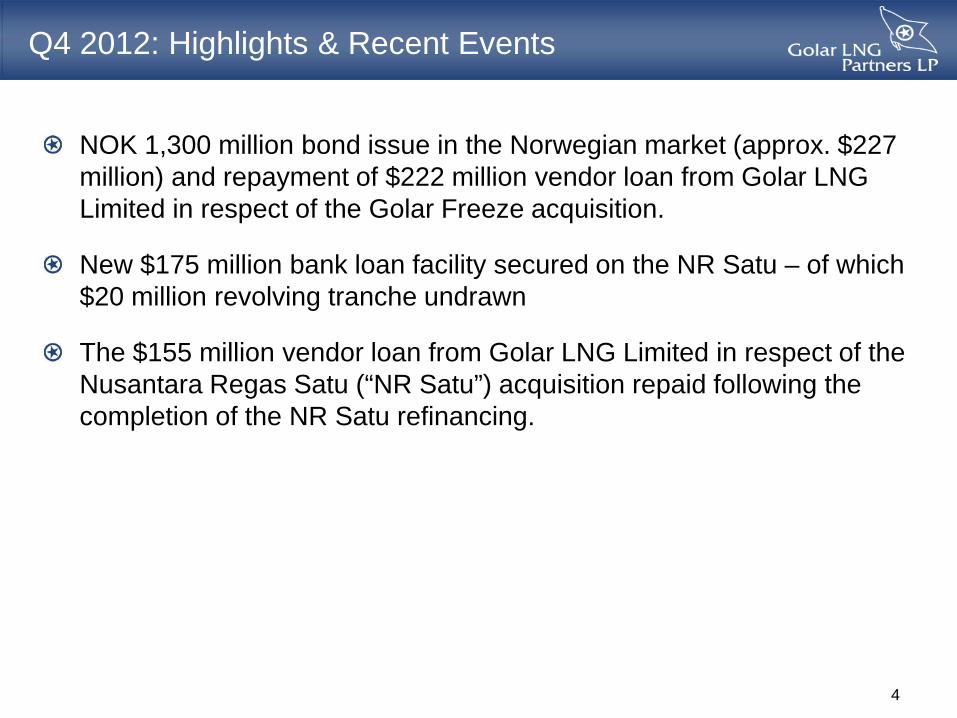
NOK 1,300 million bond issue in the Norwegian market (approx. $227 million) and repayment of $222 million vendor loan from Golar LNG Limited in respect of the Golar Freeze acquisition.
New $175 million bank loan facility secured on the NR Satu – of which $20 million revolving tranche undrawn
The $155 million vendor loan from Golar LNG Limited in respect of the Nusantara Regas Satu (“NR Satu”) acquisition repaid following the completion of the NR Satu refinancing.
4
Q4 2012: Highlights & Recent Events
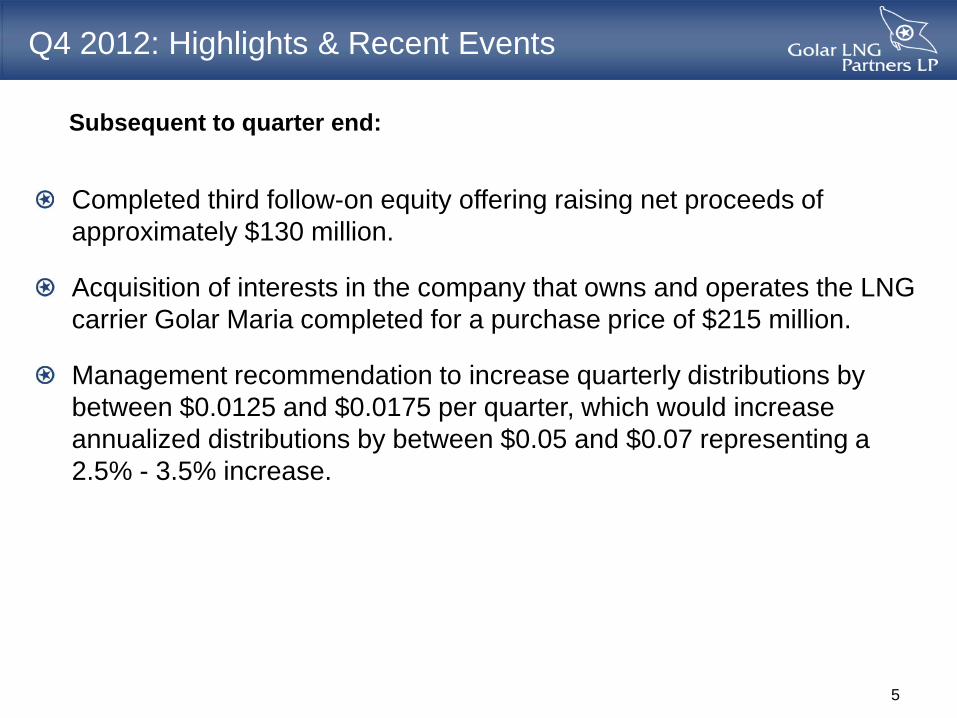
Completed third follow-on equity offering raising net proceeds of approximately $130 million.
Acquisition of interests in the company that owns and operates the LNG carrier Golar Maria completed for a purchase price of $215 million.
Management recommendation to increase quarterly distributions by between $0.0125 and $0.0175 per quarter, which would increase annualized distributions by between $0.05 and $0.07 representing a 2.5% - 3.5% increase.
5
Q4 2012: Highlights & Recent Events
Subsequent to quarter end:
(USD thousands)
2012 Oct-Dec (unaudited)
2012 Jul-Sep (unaudited)
(1)
2011 Oct-Dec (unaudited)
(1)
2012 Jan-Dec (unaudited)
(1)
2011 Jan-Dec (unaudited)
(1)
Operating revenues Vessel operating expenses Voyage expenses Administrative expenses Depreciation and Amortisation Total operating expenses Operating income Interest income Interest expense Other financial items Income before tax & non-controlling interests Tax Net income attributable to non-controlling interests Net income attributable to Golar LNG Partners LP Owners
77,172 13,037 2,252 1,555
14,367 31,211
45,961
333
(11,012) (516)
34,766
(4,478)
(2,988)
27,300
79,662 10,891 1,177 1,677
13,911 27,656
52,006
439
(10,678) (1,043)
40,724
(3,332)
(2,760)
34,632
57,399
9,114 (55)
1,742 11,134 21,935
35,464
547
(7,366) (540)
28,105
(516)
(2,439)
25,150
286,630 45,474 4,471 7,269
51,167 108,381
178,249
1,797
(38,090) (5,389)
136,567
(9,426)
(10,723)
116,418
225,452 39,212
785 8,234
45,316 93,547
131,905
1,640
(19,581) (18,521)
95,443
(45)
(9,863)
85,535
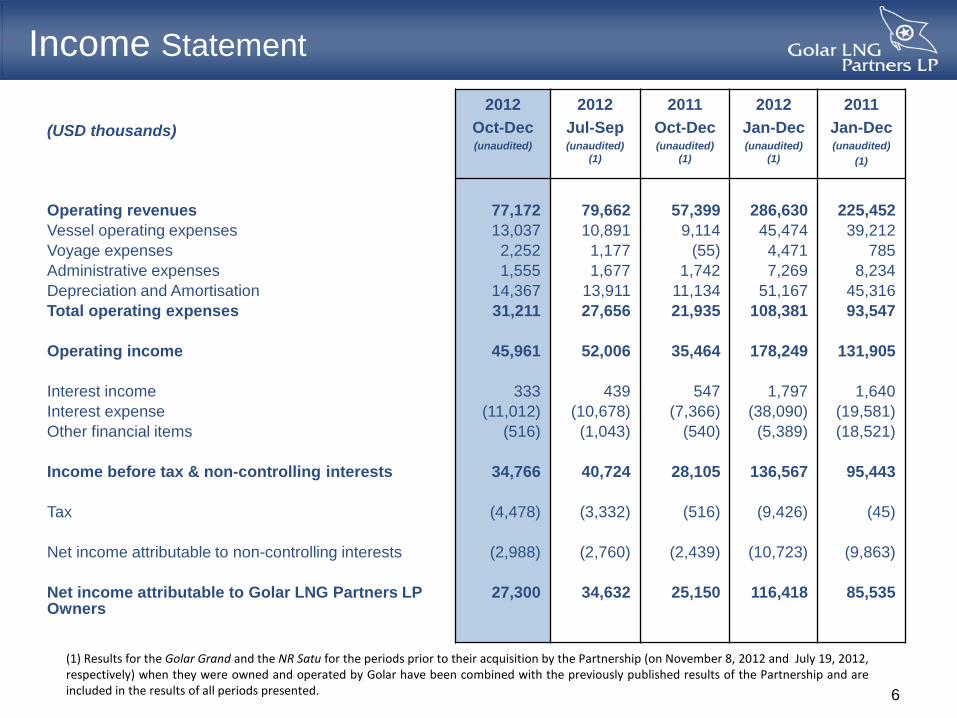
Income Statement
6
(1) Results for the Golar Grand and the NR Satu for the periods prior to their acquisition by the Partnership (on November 8, 2012 and July 19, 2012, respectively) when they were owned and operated by Golar have been combined with the previously published results of the Partnership and are included in the results of all periods presented.
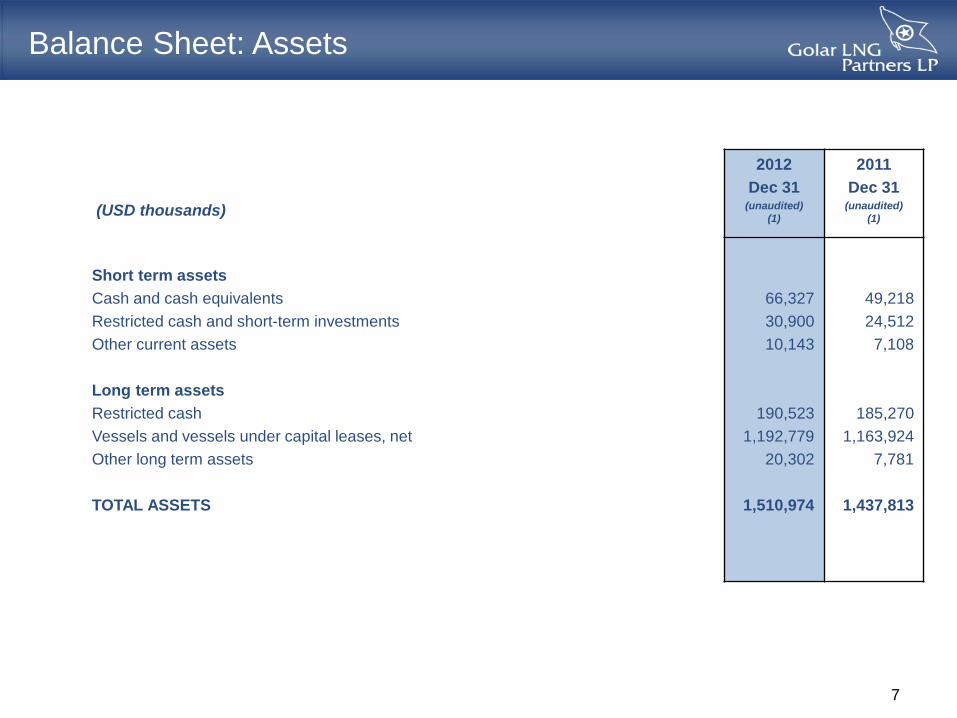
(USD thousands)
2012 Dec 31
(unaudited) (1)
2011 Dec 31
(unaudited) (1)
Short term assets Cash and cash equivalents Restricted cash and short-term investments Other current assets Long term assets Restricted cash Vessels and vessels under capital leases, net Other long term assets TOTAL ASSETS
66,327 30,900 10,143
190,523 1,192,779
20,302
1,510,974
49,218 24,512 7,108
185,270 1,163,924
7,781
1,437,813
Balance Sheet: Assets
7
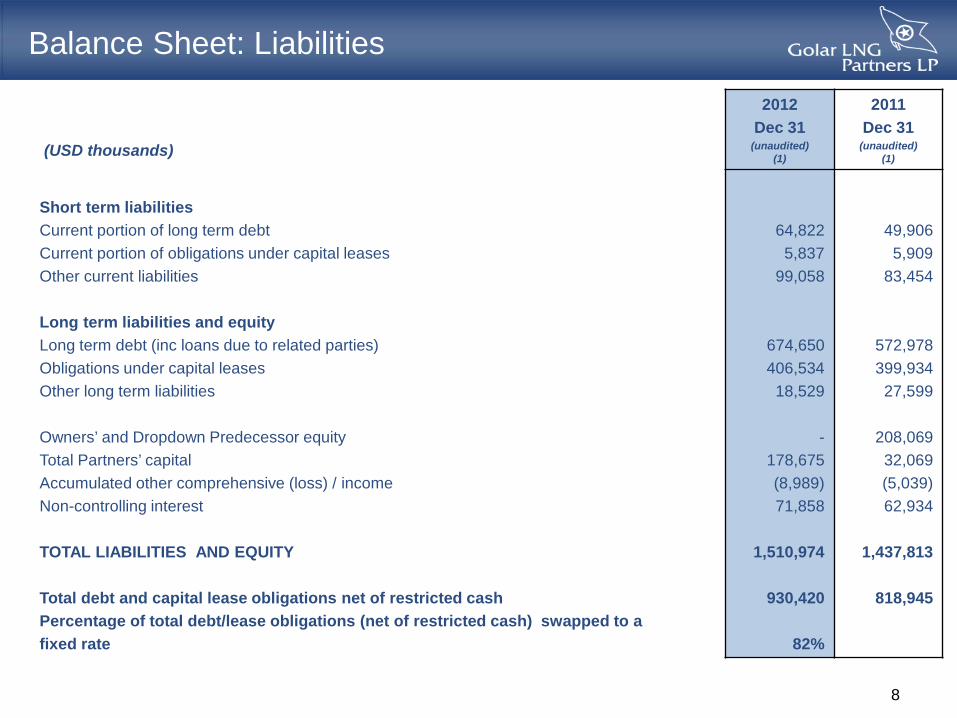
(USD thousands)
2012 Dec 31
(unaudited) (1)
2011 Dec 31
(unaudited) (1)
Short term liabilities Current portion of long term debt Current portion of obligations under capital leases Other current liabilities Long term liabilities and equity Long term debt (inc loans due to related parties) Obligations under capital leases Other long term liabilities Owners’ and Dropdown Predecessor equity Total Partners’ capital Accumulated other comprehensive (loss) / income Non-controlling interest TOTAL LIABILITIES AND EQUITY Total debt and capital lease obligations net of restricted cash Percentage of total debt/lease obligations (net of restricted cash) swapped to a fixed rate
64,822 5,837
99,058
674,650 406,534
18,529
- 178,675 (8,989) 71,858
1,510,974
930,420
82%
49,906 5,909
83,454
572,978 399,934 27,599
208,069 32,069 (5,039) 62,934
1,437,813
818,945
Balance Sheet: Liabilities
8
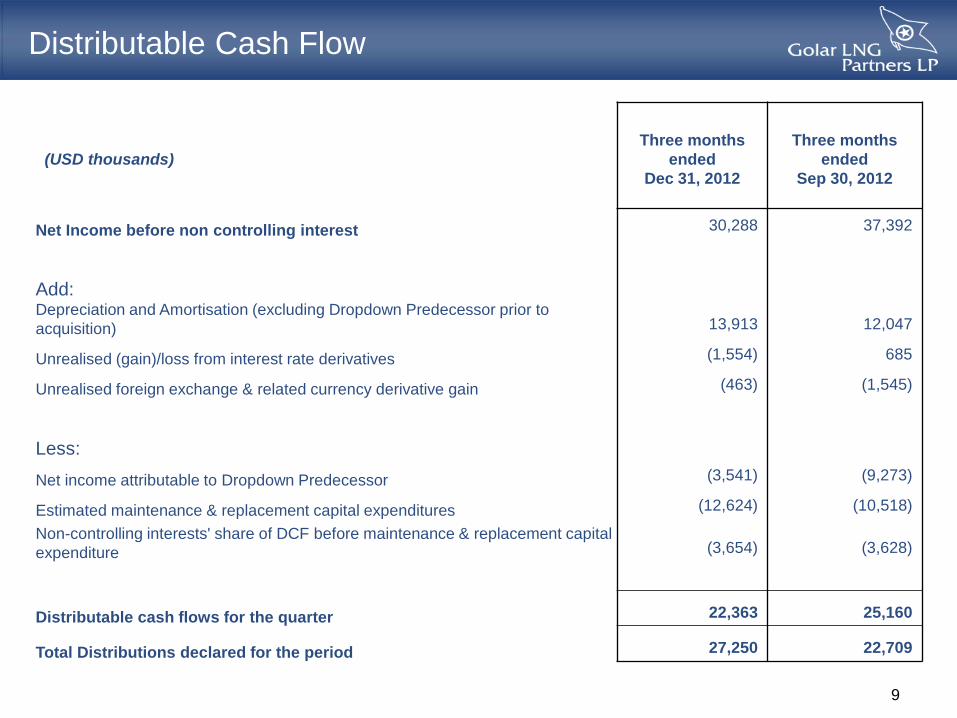
Distributable Cash Flow
(USD thousands)
Three months
ended Dec 31, 2012
Three months
ended Sep 30, 2012
Net Income before non controlling interest 30,288 37,392
Add: Depreciation and Amortisation (excluding Dropdown Predecessor prior to acquisition) 13,913 12,047
Unrealised (gain)/loss from interest rate derivatives (1,554) 685
Unrealised foreign exchange & related currency derivative gain (463) (1,545)
Less: Net income attributable to Dropdown Predecessor (3,541) (9,273)
Estimated maintenance & replacement capital expenditures (12,624) (10,518)
Non-controlling interests' share of DCF before maintenance & replacement capital expenditure (3,654) (3,628)
Distributable cash flows for the quarter 22,363 25,160
Total Distributions declared for the period 27,250 22,709
9
10
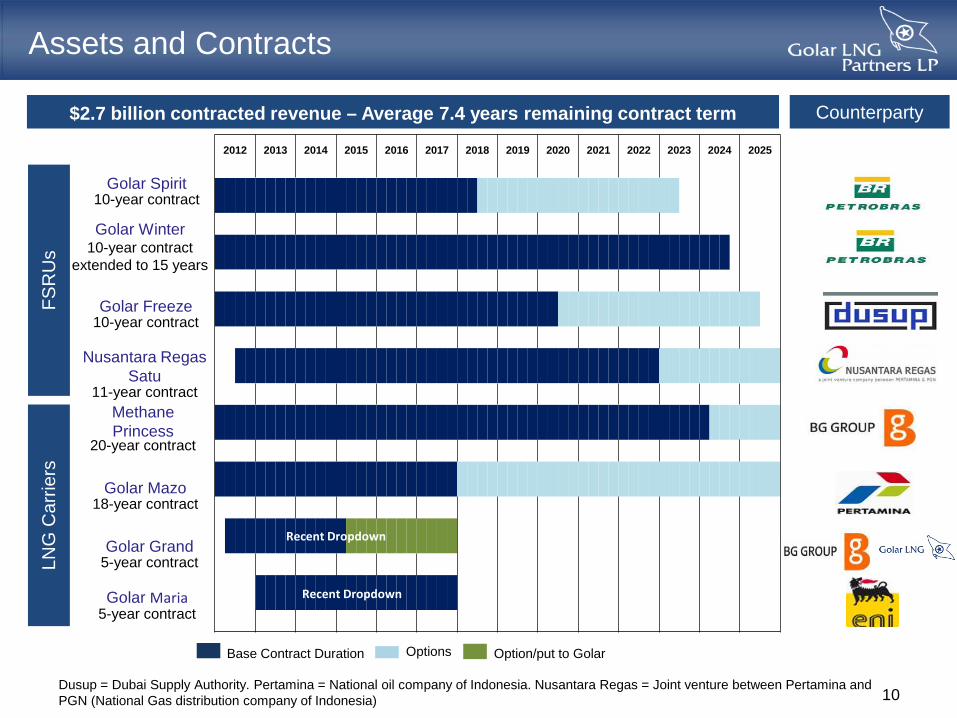
Options Base Contract Duration
Counterparty
FSR
Us
LNG
Car
riers
Golar Spirit 10-year contract
Golar Winter 10-year contract
extended to 15 years
Methane Princess
20-year contract
Golar Mazo 18-year contract
Assets and Contracts
Golar Freeze 10-year contract
Dusup = Dubai Supply Authority. Pertamina = National oil company of Indonesia. Nusantara Regas = Joint venture between Pertamina and PGN (National Gas distribution company of Indonesia)
Nusantara Regas Satu
11-year contract
$2.7 billion contracted revenue – Average 7.4 years remaining contract term
Golar Grand 5-year contract
Recent dropdown
Option/put to Golar
Golar Maria 5-year contract Recent dropdown
2012 2013 2014 2015 2016 2017 2018 2019 2020 2021 2022 2023 2024 2025
Recent Dropdown
Recent Dropdown
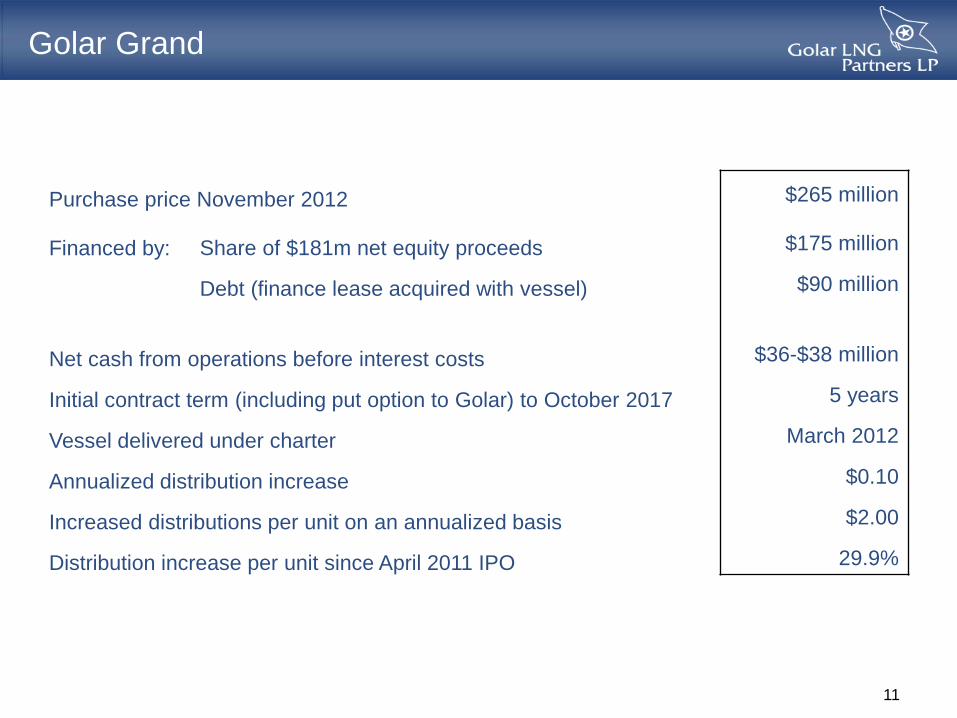
Golar Grand
Purchase price November 2012 $265 million
Financed by: Share of $181m net equity proceeds $175 million
Debt (finance lease acquired with vessel) $90 million
Net cash from operations before interest costs $36-$38 million
Initial contract term (including put option to Golar) to October 2017 5 years
Vessel delivered under charter March 2012
Annualized distribution increase $0.10
Increased distributions per unit on an annualized basis $2.00
Distribution increase per unit since April 2011 IPO 29.9%
11
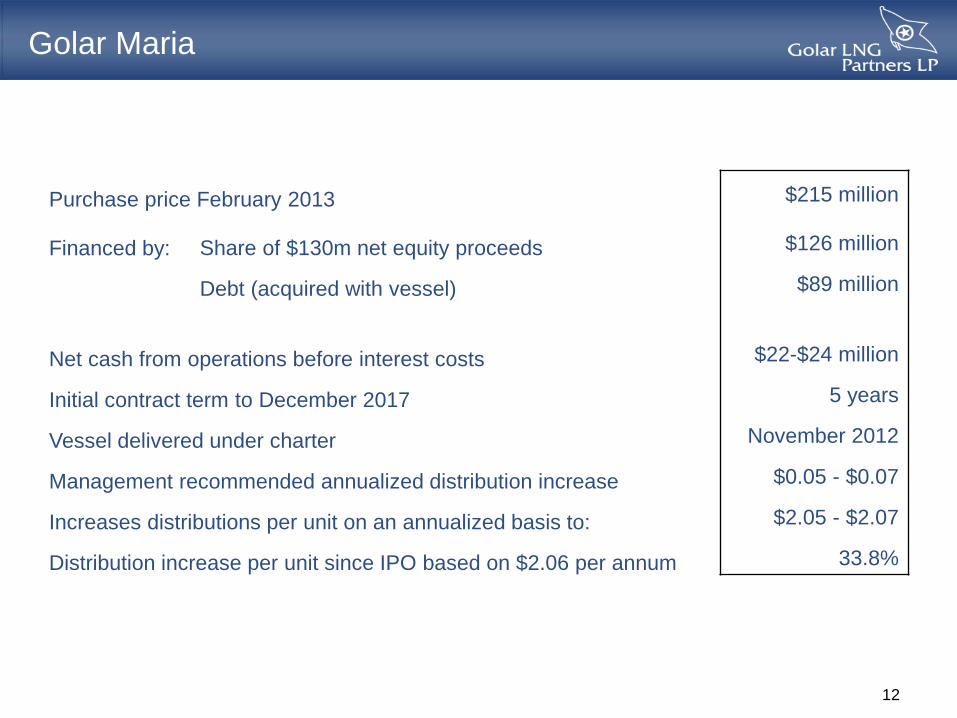
Golar Maria
Purchase price February 2013 $215 million
Financed by: Share of $130m net equity proceeds $126 million
Debt (acquired with vessel) $89 million
Net cash from operations before interest costs $22-$24 million
Initial contract term to December 2017 5 years
Vessel delivered under charter November 2012
Management recommended annualized distribution increase $0.05 - $0.07
Increases distributions per unit on an annualized basis to: $2.05 - $2.07
Distribution increase per unit since IPO based on $2.06 per annum 33.8%
12
13
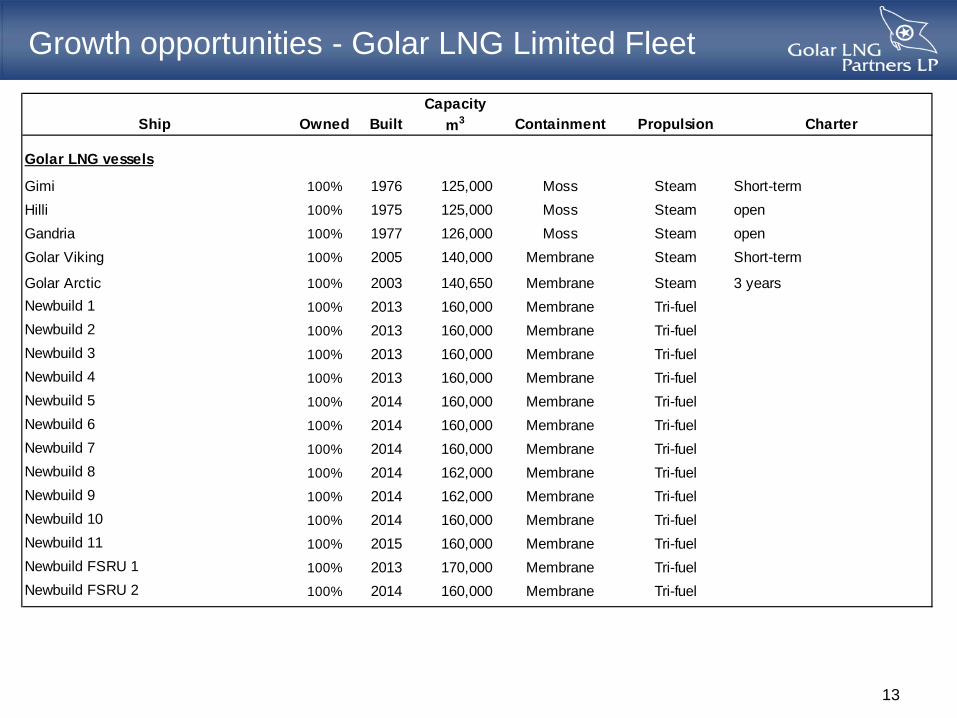
Growth opportunities - Golar LNG Limited Fleet
CapacityShip Owned Built m3 Containment Propulsion Charter
Golar LNG vessels
Gimi 100% 1976 125,000 Moss Steam Short-term Hilli 100% 1975 125,000 Moss Steam openGandria 100% 1977 126,000 Moss Steam openGolar Viking 100% 2005 140,000 Membrane Steam Short-term
Golar Arctic 100% 2003 140,650 Membrane Steam 3 yearsNewbuild 1 100% 2013 160,000 Membrane Tri-fuelNewbuild 2 100% 2013 160,000 Membrane Tri-fuelNewbuild 3 100% 2013 160,000 Membrane Tri-fuelNewbuild 4 100% 2013 160,000 Membrane Tri-fuelNewbuild 5 100% 2014 160,000 Membrane Tri-fuelNewbuild 6 100% 2014 160,000 Membrane Tri-fuelNewbuild 7 100% 2014 160,000 Membrane Tri-fuelNewbuild 8 100% 2014 162,000 Membrane Tri-fuelNewbuild 9 100% 2014 162,000 Membrane Tri-fuelNewbuild 10 100% 2014 160,000 Membrane Tri-fuelNewbuild 11 100% 2015 160,000 Membrane Tri-fuelNewbuild FSRU 1 100% 2013 170,000 Membrane Tri-fuelNewbuild FSRU 2 100% 2014 160,000 Membrane Tri-fuel
14
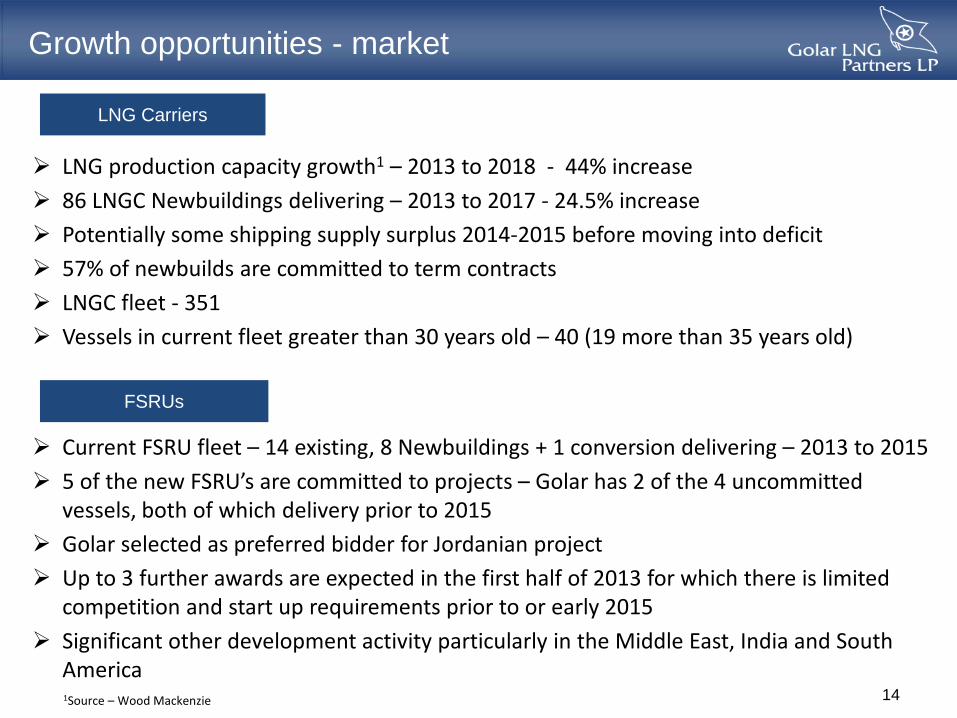
Growth opportunities - market
FSRUs
LNG Carriers
LNG production capacity growth1 – 2013 to 2018 - 44% increase 86 LNGC Newbuildings delivering – 2013 to 2017 - 24.5% increase Potentially some shipping supply surplus 2014-2015 before moving into deficit 57% of newbuilds are committed to term contracts LNGC fleet - 351 Vessels in current fleet greater than 30 years old – 40 (19 more than 35 years old)
Current FSRU fleet – 14 existing, 8 Newbuildings + 1 conversion delivering – 2013 to 2015 5 of the new FSRU’s are committed to projects – Golar has 2 of the 4 uncommitted
vessels, both of which delivery prior to 2015 Golar selected as preferred bidder for Jordanian project Up to 3 further awards are expected in the first half of 2013 for which there is limited
competition and start up requirements prior to or early 2015 Significant other development activity particularly in the Middle East, India and South
America 1Source – Wood Mackenzie
15
Golar Spirit
Golar Winter
Golar Freeze
Khannur
Increased distribution to $0.50 per unit for Q4 2012 following acquisition of the Golar Grand
Golar Maria contract increases revenue backlog – now $2.7 billion
Management recommendation to further increase distribution to between $0.5125 and $0.5175
Strong growth outlook for LNG demand and supply and related infrastructure including LNG carriers and FSRU’s
Golar LNG fleet, including 13 newbuildings, provides substantial dropdown growth potential
Summary