Embed Size (px)
Citation preview
Interim Report and Financial Statements for the period ended 30 June 2012
GOLDEN PROSPECT PRECIOUS METALS LIMITED
Golden Prospect Precious Metals Limited Unaudited Interim Report and Financial Statements
1
Chairman’s Statement 2
Board Members 3
Investment Manager’s Report 4
Financial Statements
• Statement of Comprehensive Income (Unaudited) 5
• Statement of Changes in Equity (Unaudited) 6
• Balance Sheet (Unaudited) 7
• Cash Flow Statement (Unaudited) 8
• Notes to the Financial Statements 9
Portfolio Statement 24
Management and Administration 26
Contents

Golden Prospect Precious Metals Limited Unaudited Interim Report and Financial Statements
32
I am pleased to present the Chairman’s statement to Shareholders for
the six months under review.
Over the six months to 30 June, gold prices were range bound beginning
the year at $1,563.70 per ounce going up to $1,784.23 per ounce on 28
February and falling to $1,539.57 per ounce on 16 May before staging
a recovery to finish the half year at $1,597.40 per ounce. This gave the
investor a return of 2.16% in US dollars or 1.01% in Sterling terms. The NAV
of the company opened the year at 97.85p and finished at 77.67p, a
negative return of 20.6%. As I write, the NAV is 101.22p.
The shares in gold mining companies underperformed gold during
the six months primarily due to lack of capital discipline and the
pursuit of a growth strategy at any price. As a consequence, investors
have expressed their disappointment and new Chief Executives
have been appointed at five significant gold mining companies. I
foresee greater focus on dividends and the shelving or deferment of
expensive projects.
On the macro view, gold is and will remain the best insurance
policy against:
(1) the global debt crises;
(2) the deflation to inflation cycle;
(3) geopolitical uncertainties with specific reference to Middle East
situation and
(4) continued decline in the US dollar.
Additional factors include demand still outstripping supply, central
bank buying reflecting a positive stance towards long term bullion
prices, the large emerging markets still generating wealth creation
with much of it being channelled into bullion. An anticipated
sustained appreciation in gold prices over the next few years will
enable the better quality producers to generate increasing cash
flows from which earnings will support stronger dividend policies at a
time when the investment community is demanding better yields from
asset allocation.
Gold and silver shares as a consequence should benefit substantially
going forward and some will be subject to healthy premiums from an
expected rise in M&A activity.
Malcolm Burne Chairman
Chairman’s Statement
Directors of the CompanyThe Directors have overall responsibility for the Company’s activities
including the review of its activities and performance.
The Directors of the Company at the date of signing the accounts, all
of whom are non-executive are listed below:
Malcolm BurneMalcolm Burne is a former stockbroker and financial journalist with The
Financial Times. He has controlled and managed fund management,
venture capital and investment banking companies in London,
Australia, Hong Kong and North America. He has been a director of
over 20 companies, many of which have been in the mineral resource
and gold exploration fields. In 1997, he founded Golden Prospect plc
and was executive chairman until 2007 when the company changed
its name to Ambrian Capital plc. In addition, he was executive
chairman of the Australian Bullion Company (Pty) Limited, which at the
time was Australia’s leading gold dealer and member of the Sydney
Futures Exchange. He is currently a director of several other resources
companies in Australia, the UK and Canada.
Kaare FoyKaare Foy has been a director of Great Panther Silver Limited (formerly
Great Panther Resources Limited), a silver exploration and mining
company based in Vancouver, from 1994 until the beginning of 2012.
He is currently executive chairman of Great Panther and has been
heavily involved with its silver and gold projects in North America. He
also serves as executive chairman for Canadian exploration company
Cangold Limited. Kaare has been a director of several other resource
exploration and mining companies over the past eight years and
worked with Malcolm Burne at the Australian Bullion Company (Pty)
Ltd during the 1980s.
Robert KingRobert King is an independent non-executive director and holds a
number of board appointments in other investment companies. Until
February 2011 he was a director of Cannon Asset Management Limited
and from 1990 to 2007 he was a director of Northern Trust International
Fund Administration Services (Guernsey) Limited, specialising in
offshore open and closed ended investment funds. He has been in the
offshore finance industry since 1986.
Paul CraigPaul Craig, is a Director of Multi-Manager at Henderson Global
Investors. Mr. Craig has over 20 years of investment experience,
including 10 years at Exeter Investment Group and 6 years at New
Star Asset Management, where Mr. Craig was a Director of the asset
management subsidiary. During the past 18 years, Mr. Craig’s focus has
been multi-manager products with an emphasis on closed-end funds.
Mr. Craig is an Associate of the UK Society for Investment Professionals.
John BowlesJohn Bowles, for 40 years, Dr. Bowles has been active as an economic
geologist and mineralogist specialising in gold and platinum resources.
He has worked in University, Government Survey and Industry and
is currently Honorary Visitor at the University of Manchester and
Director of Mineral Science Ltd, a consultancy specialising in mineral
assessment. He was a Director of the Company from its inception until
2008 and he has recently published a definitive reference work on the
oxide minerals in the DHZ Rock-Forming Minerals series.
Board Members
Golden Prospect Precious Metals Limited Unaudited Interim Report and Financial Statements
54
Within the gold and silver mining space, the first six months were not
encouraging. After a brief rally in February, gold mining companies
underperformed gold and in absolute terms declined fairly aggressively
until May. There were a number of reasons for this. Firstly, some major
gold mining companies have not had much capital discipline. These
companies had been pursuing a strategy of growth at any price. As
a result, whether it was poor acquisitions, or whether it was building
projects with low returns on capital, or simply mining lower grade
material we saw lower returns and hence erosion of capital. Secondly,
investors have not favoured ‘risk on’ assets, preferring securities
perceived as defensive.
On the positive side, investors have since made their views known and
over the last few months, we had changes in CEOs of a number of gold
mining companies, including Barrick Gold, Kinross, Semafo, Centerra
Gold and Great Basin Gold. I believe the message at last is getting
through and we are seeing companies starting to pay or increase
their dividends to shareholders. In addition, large capital projects are
now being shelved or deferred indefinitely. These steps are crucial
in restoring the health of gold mining companies, especially when
capital markets are difficult to access.
One side development of this changing view is the impact on explorers.
As a consequence, I believe that this will make gold exploration
much more difficult to finance and only projects which indicate high
grades and low capital costs are likely to succeed in the future. Those
companies who are finding gold in remote locations with very high
capital costs are going to find it very difficult to finance their projects
while those with very low grades might also potentially struggle.
This de-rating in gold mining companies has presented us with a very
interesting and challenging opportunity. We see clearly the path to
navigate through these difficult times and we have been adjusting the
portfolio to reflect our strategy. We have increased our weighting in
quality producers in both gold and silver miners with good management
teams. We have also taken our explorers’ weighting down. We are re-
positioning the type of explorers in our portfolio to include only those
which we believe have a high chance of being developed or acquired
by larger companies in the future.
Our medium and long term views of gold and silver mining companies
have not changed. We believe that the macro environment is very
conducive for precious metals securities and hence have taken the
opportunity of recent lower share price levels to increase our gearing.
I am confident in the sector and believe the portfolio is well positioned
to enhance shareholder value.
John Wong New City Investment Managers Limited
Investment Manager’s Report Statement of Comprehensive Income (Unaudited)For the period from 1 January 2012 to 30 June 2012
01.01.12 01.01.11 to 30.06.12 to 30.06.11 Notes Revenue Capital Total Total £ £ £ £ Income Dividend income from equity securities designated at fair value through profit or loss 130,662 - 130,662 77,910
130,662 - 130,662 77,910 Net (losses) on financial assets at fair value through profit or loss 2,7 - (11,234,644) (11,234,644) (4,801,306)Net gains on foreign currency 2 149,862 - 149,862 343,289 Total income 280,524 (11,234,644) (10,954,120) (4,380,107) Expenses Investment Management fees 5 (388,510) - (388,510) (359,630)Administration fees 5 (27,606) - (27,606) (27,273)Directors’ fees 5 (39,803) - (39,803) (23,893)Audit fees (8,207) - (8,207) (5,951)Brokerage fees (9,909) - (9,909) (5,306)Directors’ insurance costs (3,827) - (3,827) - Registrar’s fees (14,522) - (14,522) (6,008)Sponsor fees (6,977) - (6,977) (15,688)Legal fees (26,243) - (26,243) (4,560)Printing (12,382) - (12,382) (11,777)Other expenses (32,334) - (32,334) (23,354)
Total operating expenses (570,320) - (570,320) (483,440) Operating (loss) before finance costs (289,796) (11,234,644) (11,524,440) (4,863,547)and tax Withholding tax 3 - - - (3,297)
Total comprehensive deficit for the period (£289,796) (£11,234,644) (£11,524,440) (£4,866,844) Basic earnings per Ordinary Share (pence) 6 (0.01p) (0.20p) (0.20p) (0.12p) Diluted earnings per Ordinary Share (pence) 6 (0.20p) (0.12p)
The ‘Total’ column of this statement represents the Company’s Statement of Comprehensive Income, prepared in accordance with IFRS. The supplementary ‘Revenue’ and ‘Capital’ columns are both prepared for information purposes only.
All the items in the above statement derive from continuing operations.
The notes on pages 9 to 23 form part of these Financial Statements.
Golden Prospect Precious Metals Limited Unaudited Interim Report and Financial Statements
76
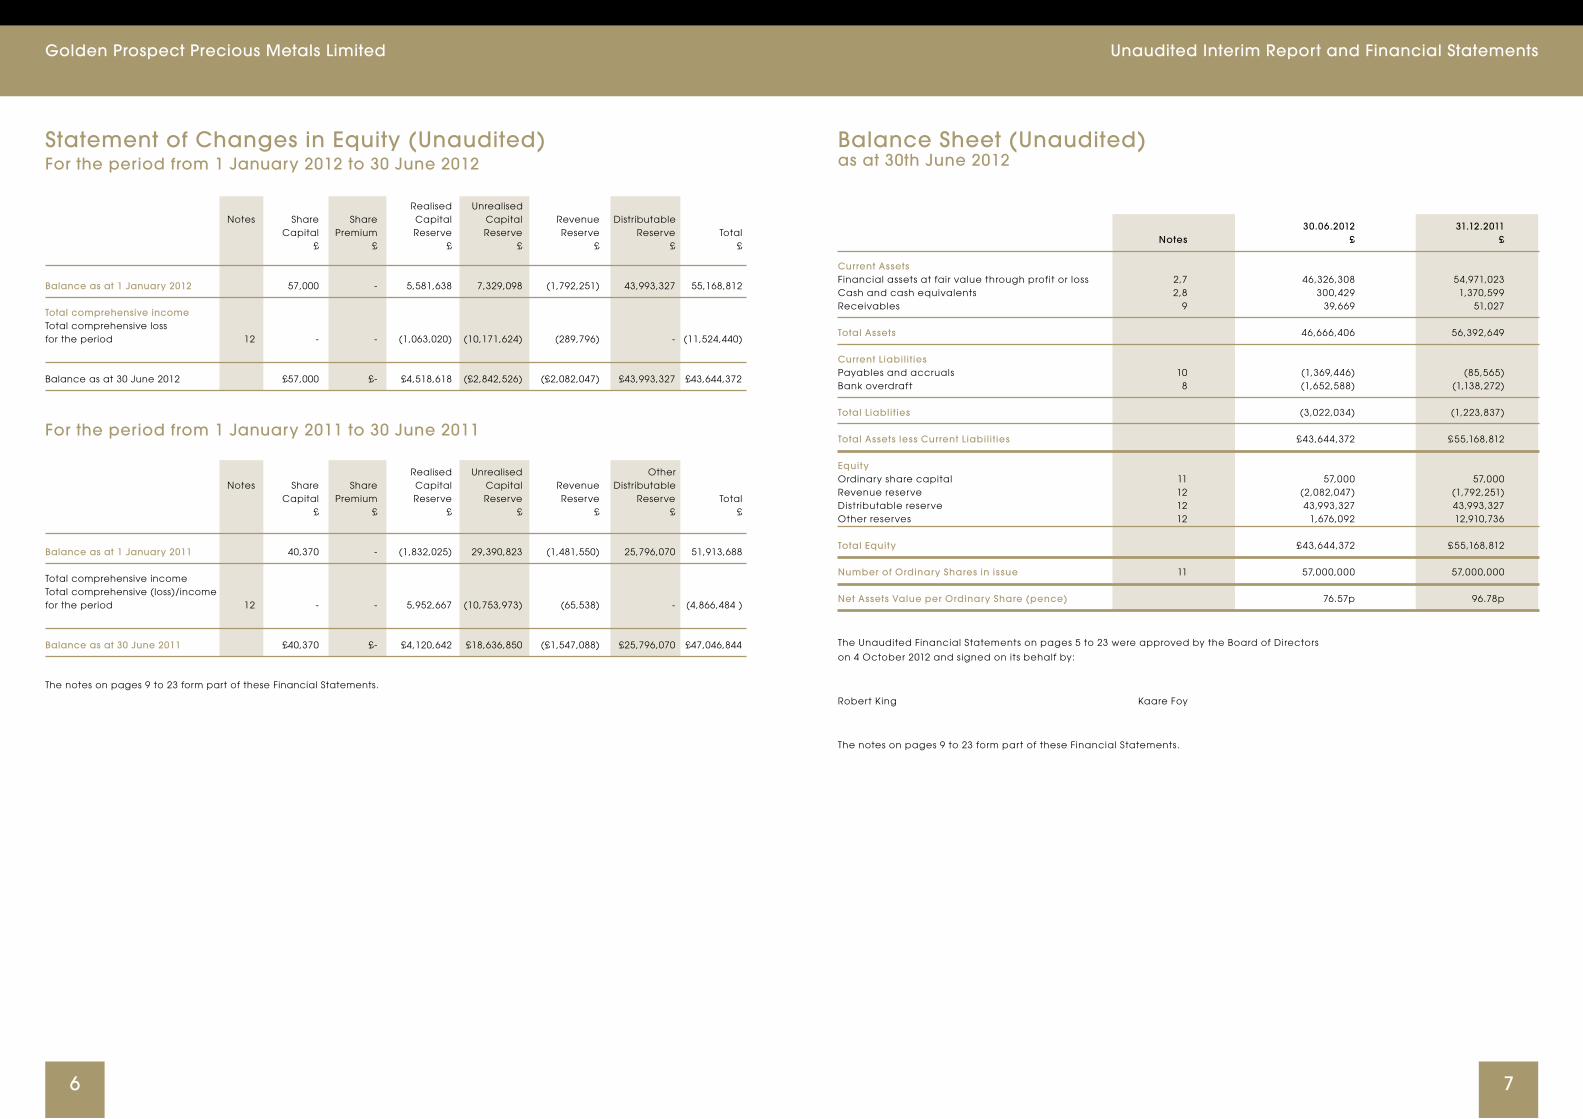
Statement of Changes in Equity (Unaudited)For the period from 1 January 2012 to 30 June 2012
Realised Unrealised Notes Share Share Capital Capital Revenue Distributable Capital Premium Reserve Reserve Reserve Reserve Total £ £ £ £ £ £ £
Balance as at 1 January 2012 57,000 - 5,581,638 7,329,098 (1,792,251) 43,993,327 55,168,812 Total comprehensive income Total comprehensive loss for the period 12 - - (1,063,020) (10,171,624) (289,796) - (11,524,440) Balance as at 30 June 2012 £57,000 £- £4,518,618 (£2,842,526) (£2,082,047) £43,993,327 £43,644,372
For the period from 1 January 2011 to 30 June 2011
Realised Unrealised Other Notes Share Share Capital Capital Revenue Distributable Capital Premium Reserve Reserve Reserve Reserve Total £ £ £ £ £ £ £
Balance as at 1 January 2011 40,370 - (1,832,025) 29,390,823 (1,481,550) 25,796,070 51,913,688 Total comprehensive income Total comprehensive (loss)/income for the period 12 - - 5,952,667 (10,753,973) (65,538) - (4,866,484 ) Balance as at 30 June 2011 £40,370 £- £4,120,642 £18,636,850 (£1,547,088) £25,796,070 £47,046,844
The notes on pages 9 to 23 form part of these Financial Statements.
Balance Sheet (Unaudited)as at 30th June 2012
30.06.2012 31.12.2011 Notes £ £
Current Assets Financial assets at fair value through profit or loss 2,7 46,326,308 54,971,023 Cash and cash equivalents 2,8 300,429 1,370,599 Receivables 9 39,669 51,027 Total Assets 46,666,406 56,392,649 Current Liabili t ies Payables and accruals 10 (1,369,446) (85,565)Bank overdraft 8 (1,652,588) (1,138,272) Total Liablities (3,022,034) (1,223,837) Total Assets less Current Liabili t ies £43,644,372 £55,168,812
Equity Ordinary share capital 11 57,000 57,000 Revenue reserve 12 (2,082,047) (1,792,251)Distributable reserve 12 43,993,327 43,993,327 Other reserves 12 1,676,092 12,910,736
Total Equity £43,644,372 £55,168,812 Number of Ordinary Shares in issue 11 57,000,000 57,000,000 Net Assets Value per Ordinary Share (pence) 76.57p 96.78p
The Unaudited Financial Statements on pages 5 to 23 were approved by the Board of Directors
on 4 October 2012 and signed on its behalf by:
Robert King Kaare Foy
The notes on pages 9 to 23 form part of these Financial Statements.
Golden Prospect Precious Metals Limited Unaudited Interim Report and Financial Statements
98
Notes to the Financial StatementsFor the period from 1 January 2012 to 30 June 2012
1. Company InformationGolden Prospect Precious Metals Limited (“the Company”)
was incorporated in Guernsey on 16 October 2006 under the
Companies Law (Guernsey) 1994 as a limited liability closed-end
investment company.
The Company’s ordinary shares were admitted to trading on AIM, the
market of that name operated by the London Stock Exchange on
28 November 2006. On 5 June 2009, a special resolution was passed
authorising the cancellation of the admission to trading on AIM. On
16 June 2009, the Company was simultaneously admitted to trading
on the International Bulletin Board of the London Stock Exchange
(ITBB) and cancelled from trading on AIM. As from September 2009,
the shares have been traded on London Stock Exchange SETS with the
code GPM.
The Company’s ordinary shares were admitted to the Official List of the
Channel Islands Stock Exchange (“CISX”) on 24 June 2008.
During the year to 31 December 2011 the Company issued 16,630,000
new Ordinary shares at a value of £18,213,887 after issue costs; a
further 200 shares were issued in the current period on exercise of
Subscription Shares. In addition to the ordinary shares the company
issued 28,499,974 Subscription shares for further details see note 11.
Investment Objective and Policy
The Company’s investment objective is to generate above average
returns for Shareholders primarily through the capital appreciation of
its investments. The Directors believe that such returns can be obtained
by investing in a selective portfolio of securities and other instruments
in the precious metals, diamond and uranium sectors.
2. Principal Accounting PoliciesThe following accounting policies have been applied consistently in
dealing with items which are considered to be material in relation to
the Company’s Financial Statements:
Statement of Compliance
The Financial Statements have been prepared in accordance with
International Financial Reporting Standards (IFRS) which comprise
standards and interpretations by the International Accounting
Standards Board (IASB) as endorsed by the European Union and the
additional disclosures required regarding income and capital within
the Income Statement and in accordance with the Investments Trusts
Statement of Recommended Practice (SORP) 2009 (Revised).
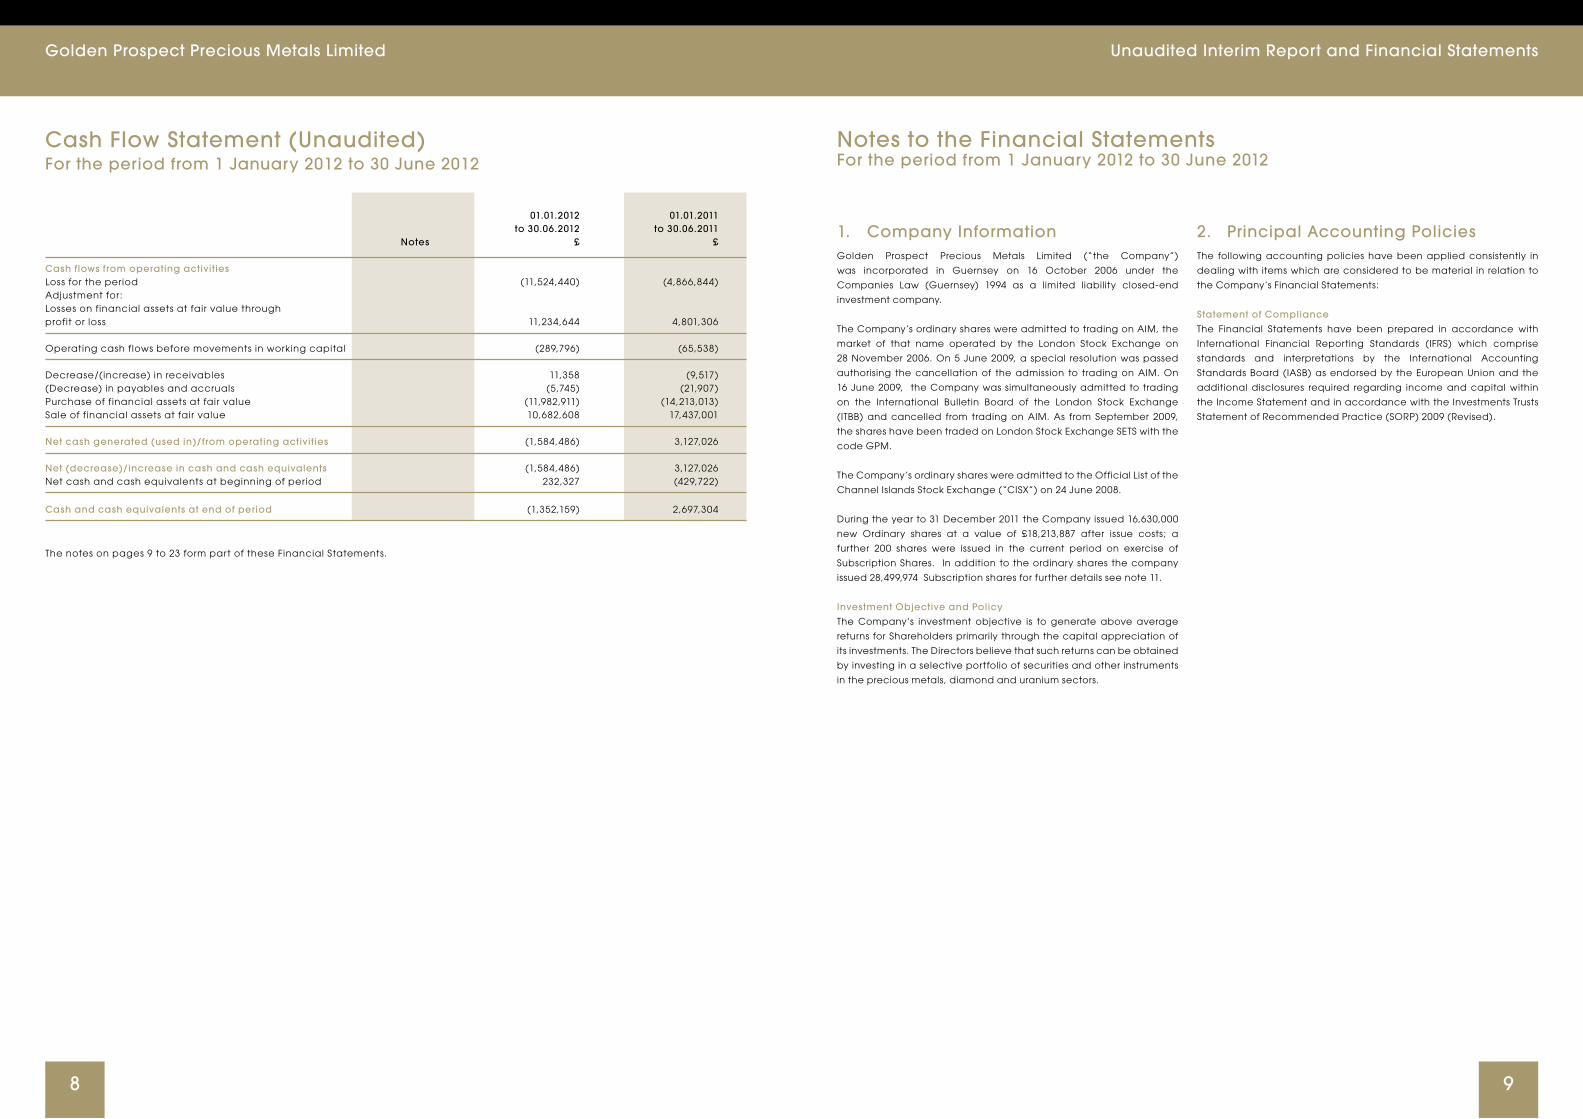
Cash Flow Statement (Unaudited)For the period from 1 January 2012 to 30 June 2012
01.01.2012 01.01.2011 to 30.06.2012 to 30.06.2011 Notes £ £
Cash flows from operating activities Loss for the period (11,524,440) (4,866,844)Adjustment for: Losses on financial assets at fair value through profit or loss 11,234,644 4,801,306 Operating cash flows before movements in working capital (289,796) (65,538) Decrease/(increase) in receivables 11,358 (9,517)(Decrease) in payables and accruals (5,745) (21,907)Purchase of financial assets at fair value (11,982,911) (14,213,013)Sale of financial assets at fair value 10,682,608 17,437,001 Net cash generated (used in)/from operating activities (1,584,486) 3,127,026 Net (decrease)/increase in cash and cash equivalents (1,584,486) 3,127,026 Net cash and cash equivalents at beginning of period 232,327 (429,722)
Cash and cash equivalents at end of period (1,352,159) 2,697,304
The notes on pages 9 to 23 form part of these Financial Statements.
Golden Prospect Precious Metals Limited Unaudited Interim Report and Financial Statements
1110
Notes to the Financial Statements (continued)For the period from 1 January 2012 to 30 June 2012
Notes to the Financial Statements (continued)For the period from 1 January 2012 to 30 June 2012
2. Principal Accounting Policies (continued)Basis of preparation
The Financial Statements are presented in Sterling which is also the
functional currency of the Company as the majority of transactions
are effected in Sterling. The Financial Statements have been prepared
on a historical cost basis except for the measurement of financial
assets and financial liabilities at fair value through profit or loss.
The preparation of Financial Statements in conformity with IFRS requires
management to make judgements, estimates and assumptions that
affect the application of policies and the reported amounts of assets
and liabilities, income and expenses. The estimates and associated
assumptions are based on historical experience and various other
factors that are believed to be reasonable under the circumstances,
the results of which form the basis of making the judgements about
carrying values of assets and liabilities that are not readily apparent
from other sources. Actual results may differ from these estimates.
The estimates and underlying assumptions are reviewed on an ongoing
basis. Revisions to accounting estimates are recognised in the period
in which the estimate is revised if the revision affects only that period,
or in the period of revision and future periods if the revision affects both
current and future periods.
Financial assets
The classification of financial assets at initial recognition depends
on the purpose for which the financial asset was acquired and
its characteristics. The Company’s financial assets fall within the
following categories.
Receivables
These are non-derivative financial assets with fixed or determinable
payments that are not quoted in an active market. These are
measured at amortised cost using the effective interest method, less
any impairment.
Impairment provisions are recognised when there is objective
evidence (such as significant financial difficulties on the part of the
counterparty or default or significant delay in payment) that the
company will be unable to collect all of the amounts due under the
terms of the receivable, the amount of such a provision being the
difference between the net carrying amount and the present value
of the future expected cash flows associated with the impaired
receivable. For trade receivables, such impairments directly reduce
the carrying amount of the impaired asset and are recognised against
the relevant income category in the income statement.
Cash and cash equivalents are carried at cost and consist of cash in
hand and short term deposits in banks with an original maturity of three
months or less.
Financial assets at fair value
Classification
All investments are classified as “financial assets at fair value”. These
financial assets are designated by the Board of Directors at fair value
through profit or loss at its inception.
Financial assets designated at fair value through profit or loss at
inception are those that are managed and their performance
evaluated on a fair value basis in accordance with the Company’s
documented investment strategy. The Company’s policy is for the
Investment Manager and the Board of Directors to evaluate the
information about these financial assets on a fair value basis together
with other related financial information.
Recognition
Regular-way purchases and sales of investments are recognised on the
trade date, the date on which the Company commits to purchase or
sell the investment.
Measurement
Financial assets at fair value are initially recognised at fair value.
Subsequent to initial recognition, all financial assets at fair value
through profit or loss are measured at fair value. Gains and losses
arising from changes in the fair value of the ‘financial assets at fair
value’ category are presented in the income statement in the period
in which they arise.
Fair value estimation
The fair value of financial assets traded in active markets is based on
quoted market prices at the balance sheet date. The quoted market
price used for the financial assets held by the Company is the bid price
at the close of the respective market at the balance sheet date.
Derecognition of financial assets
A financial asset (in whole or in part) is derecognised either (i) when
the Company has transferred substantially all the risks and rewards
of ownership, or (ii) when it has neither transferred nor retained
substantially all the risks and rewards and when it no longer has
control over the asset or a proportion of the asset, or (iii) when the
contractual right to receive cash flows has expired. Any gain or loss on
derecognition is taken to the Income Statement as appropriate.
Financial liabili t ies
The classification of financial liabilities at initial recognition depends
on the purpose for which the financial liability was issued and its
characteristics. All financial liabilities are initially recognised at fair
value net of transaction costs incurred. The Company’s financial
liabilities only consist of financial liabilities measured at amortised cost.
2. Principal Accounting Policies (continued)Financial liabili t ies measured at amortised cost
These include trade payables and other short-term monetary liabilities,
which are initially recognised at fair value and subsequently carried at
amortised cost using the effective interest method. Bank borrowings
are initially recognised at fair value net of attributable transactions
costs incurred. Such interest bearing liabilities are subsequently
measured at amortised cost using the effective interest method.
Derecognition of financial liabili t ies
A financial liability (in whole or in part) is derecognised when the
Company has extinguished its contractual obligations, it expires or
is cancelled. Any gain or loss on derecognition is taken to the
Income Statement.
Fair value measurement hierarchy
Effective 1 January 2009, the Company adopted the amendment to
IFRS 7 for financial instruments that are measured in the Balance Sheet
at fair value. This requires disclosure of fair value measurements by
level of the following fair value measurement hierarchy:
- Quoted prices (unadjusted) in active markets for identical assets or
liabilities (level 1).
- Inputs other than quoted prices included within level 1 that are
observable for the asset or liability, either directly (that is, as prices) or
indirectly (that is, derived from prices)(level 2).
- Inputs for the asset or liability that are not based on observable
market data (that is, unobservable inputs) (level 3).
The level in the fair value hierarchy within which the financial asset or
financial liability is categorised is determined on the basis of the lowest
input that is significant to the fair value measurement. Financial assets
and financial liabilities are classified in their entirety into one of the
three levels.
Offsetting financial instruments
Financial assets and financial liabilities are only offset and the
net amount reported in the Balance Sheet and Statement of
Comprehensive Income when there is a currently enforceable legal
right to offset the recognised amounts and the Company intends to
settle on a net basis or realise the asset and liability simultaneously.
Interest income and expense
Interest income and interest expense are recognised within the
Statement of Comprehensive Income using the effective interest rate
method. The effective interest rate is the rate that exactly discounts
the future cash inflows and outflows of a financial instrument through
its expected life.
The calculation includes all incidental fees, discounts and transaction
costs, these cash flows are integral in calculating the Statement of
Comprehensive Income charge. Transaction costs are incremental
costs that are directly attributable to the purchase or disposal of a
financial instrument.
Income
All income is accounted for on an accruals basis and is recognised in
the Income Statement.
Expenses
Expenses are accounted for on an accruals basis. Expenses are
charged to the Statement of Comprehensive Income as items of a
revenue nature. Expenses incurred on the acquisition of investments
at fair value through profit or loss are included in the initial cost of
the investment.
Share Issue Expenses
During the period the Company did not issue any shares or incur share
issue costs (30 June 2011: £nil). Any expenses incurred would be treated
as a deduction from equity in the Statement of Changes in Equity, and
written off against the Share Premium Account.
Capital Reserves
Gains and losses recorded on the realisation of investments and
realised exchange differences of a capital nature are accounted for in
the Realised Capital Reserve. Unrealised gains and losses recorded on
the revaluation of investments held at the period end and unrealised
exchange differences of a capital nature are accounted for in the
Unrealised Capital Reserve.
Translation of foreign currency
Items included in the Company’s Financial Statements are measured
using the currency of the primary economic environment in which
it operates (“the functional currency”). The currency in which the
Company’s Shares are denominated and in which its operating
expenses are incurred is Sterling. The Company’s investments are
denominated in many different currencies. Accordingly, the Directors
regard Sterling as the functional currency. The Company has also
adopted Sterling as its presentational currency.
Transactions in currencies other than the functional currency are
recorded using the exchange rate prevailing at the transaction date.
Foreign exchange gains and losses resulting from the settlement
of such transactions and those from the translation at period end
exchange rates of monetary assets and liabilities denominated in
foreign currencies are recognised in the Statement of Comprehensive
Income . Translation differences on non-monetary items such as
financial assets held at fair value through profit or loss are reported as
part of net gains or losses on financial assets through profit or loss in the
Statement of Comprehensive Income .
Golden Prospect Precious Metals Limited Unaudited Interim Report and Financial Statements
1312
Notes to the Financial Statements (continued)For the period from 1 January 2012 to 30 June 2012
Notes to the Financial Statements (continued)For the period from 1 January 2012 to 30 June 2012
2. Principal Accounting Policies (continued)Segmental reporting
Operating segments are reported in a manner consistent with the
internal reporting provided to the Board. The chief operating decision-
maker, which is responsible for allocating resources and assessing
performance of the operating segments, has been identified as the
Board of Directors of the Company.
For management purposes, the Company is organised into one main
operating segment, which invests in precious metals securities which
are principally listed on the stock exchanges of London, Toronto and
Sydney. All of the company’s activities are interrelated, and each
activity is based upon analysis of the Company as one segment. On
a day to day basis investment decisions have been delegated to the
Investment manager, New City Investment Managers Ltd.
The Company does not hold any non-current assets which require
disclosure under IFRS 8. However, for additional information, the total
fair value of the segment and the equivalent percentages of the total
value of the Company can be found in the portfolio statement on
page 24.
Sales of investments awaiting settlement
Sales of investments awaiting settlement are sales of securities transacted
before the period end with a post period end settlement date.
3. TaxationThe Company is exempt from taxation in Guernsey under the provisions
of The Income Tax (Exempt Bodies) (Guernsey) Ordinance 1989 and
has paid an annual exemption fee of £600. With effect from 1 January
2008, Guernsey’s Corporate Tax changed, however there is no effect
on the Company’s tax position as a result of this change as the
Company continues to register as tax exempt.
4. Distribution to ShareholdersThe Directors do not expect income (net of expenses) to be significant
and do not currently expect to declare any cash dividends. In the
event that net income is significant, the Directors may consider the
distribution of net income in the form of cash dividends. To the extent
that any cash dividends are paid, they will be paid in accordance
with any applicable laws and the regulations of the Channel Islands
Stock Exchange.
5. Related Party Transactions Parties are considered to be related if one party has the ability to
control the other party or exercise significant influence over the other
party in making financial or operational decisions.
Directors Fees
The Directors are responsible for the determination of the investment
policy of the Company and have overall responsibility for the Company’s
activities. All Directors are entitled to remuneration for their services of
£16,000 per annum. During the period ended 30 June 2012, directors’
fees of £39,803 were charged to the Company (30 June 2011: £23,893)
and £16,091 was payable at the period end (31 December 2011: £74). All
Directors are non-executive.
The following contracts, not being contracts in the ordinary course of
business, have been entered into by the Company and are, or may
be material:
Investment Manager
The Company’s investment manager was novated on 15 September
2008 to New City Investment Managers Limited (the “Investment
Manager”). New City Investment Managers Limited changed its name
to CQS Asset Management Limited on 5 March 2010 but continued to
trade as New City Investment Managers. The Investment Manager is
entitled to an annual management fee, payable monthly in arrears, of
1.5 % of Net Asset Value.
The Investment Manager is also entitled to reimbursement of certain
expenses incurred by it in connection with its duties. During the period
ended 30 June 2012 investment management fees of £388,510 were
charged to the Company (30 June 2011: £359,630) and £52,682 was
payable at the period end (31 December 2011: £68,848).
The Investment Manager is also entitled to receive an annual
Performance Fee equal to 20% of the increase in the Company’s Net
Asset Value on the last Trading Day of each calendar year, above an
annual hurdle for growth of 8% and subject to a high water mark. During
the period ended 30 June 2012 no performance fees had accrued to
the Investment Manager (31 December 2011: £nil).
Administrator
The Company’s administrator is Legis Fund Services Limited (the
“Administrator”). In consideration for the services provided by the
Administrator under the Administration and Secretarial Agreement, the
Administrator is entitled to receive from the Company an annual fee
of £55,000 per annum payable monthly in arrears. During the period
ended 30 June 2012 administration fees of £27,606 were charged to
the Company (30 June 2011: £27,273) and £4,370 was payable at the
period end (31 December 2011: £4,673).
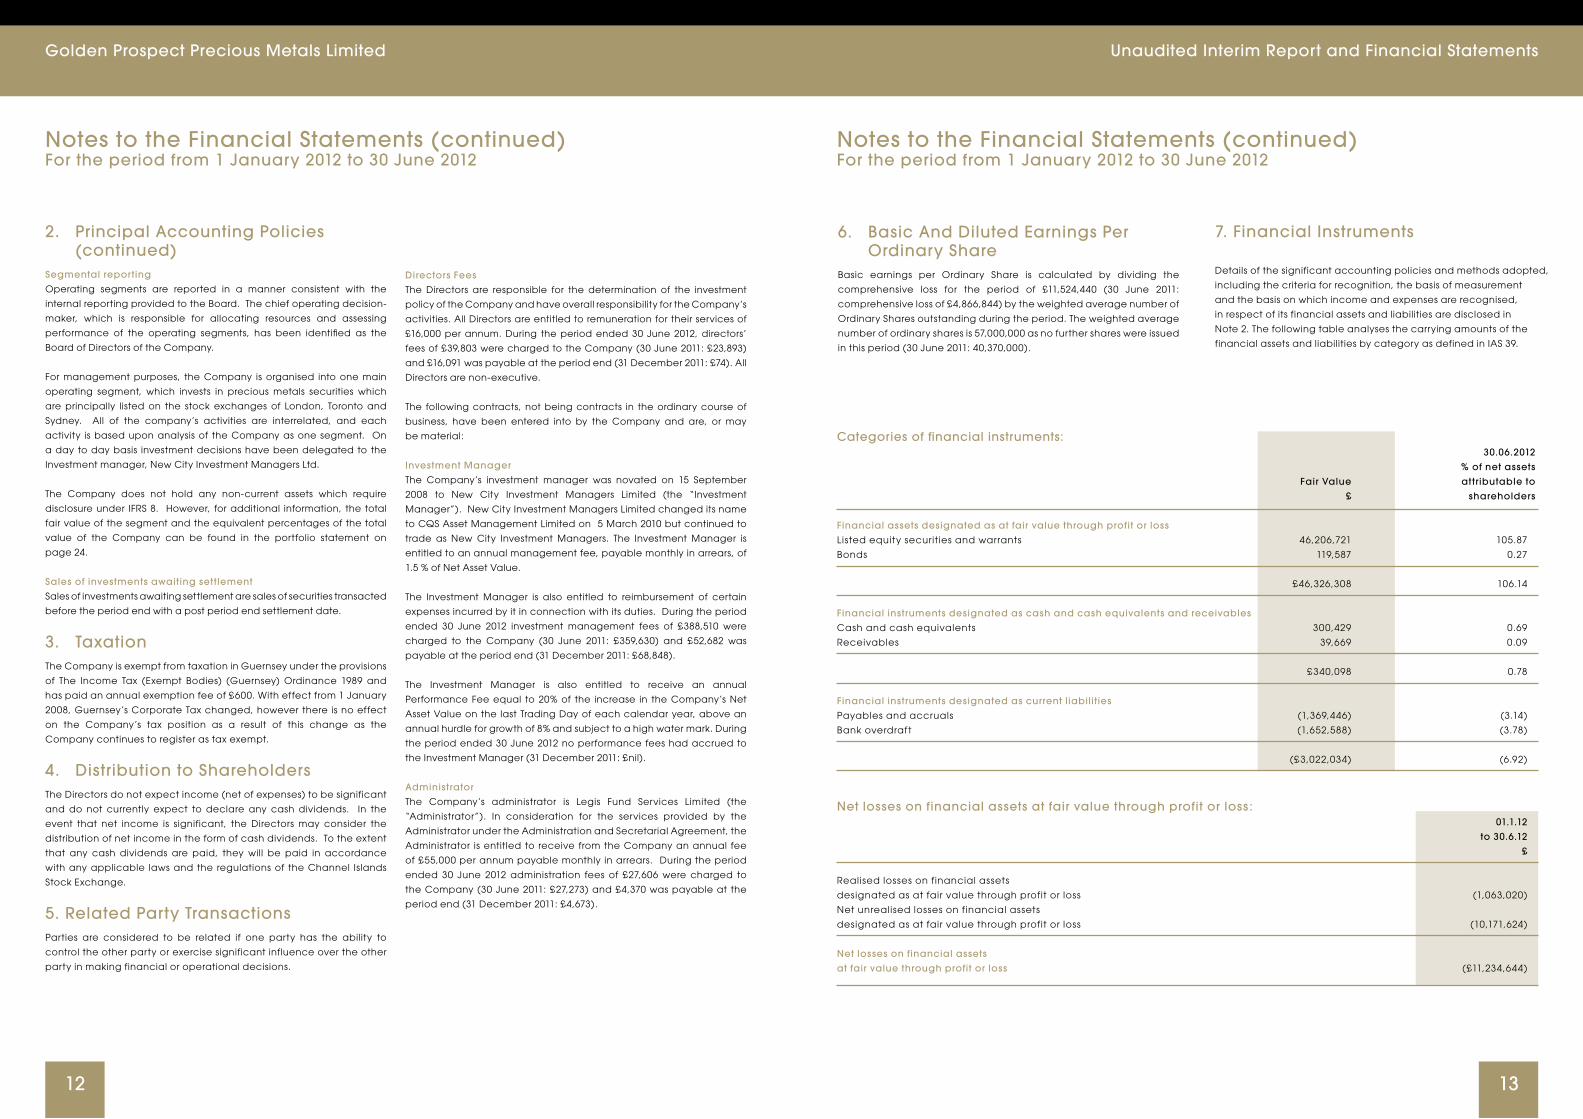
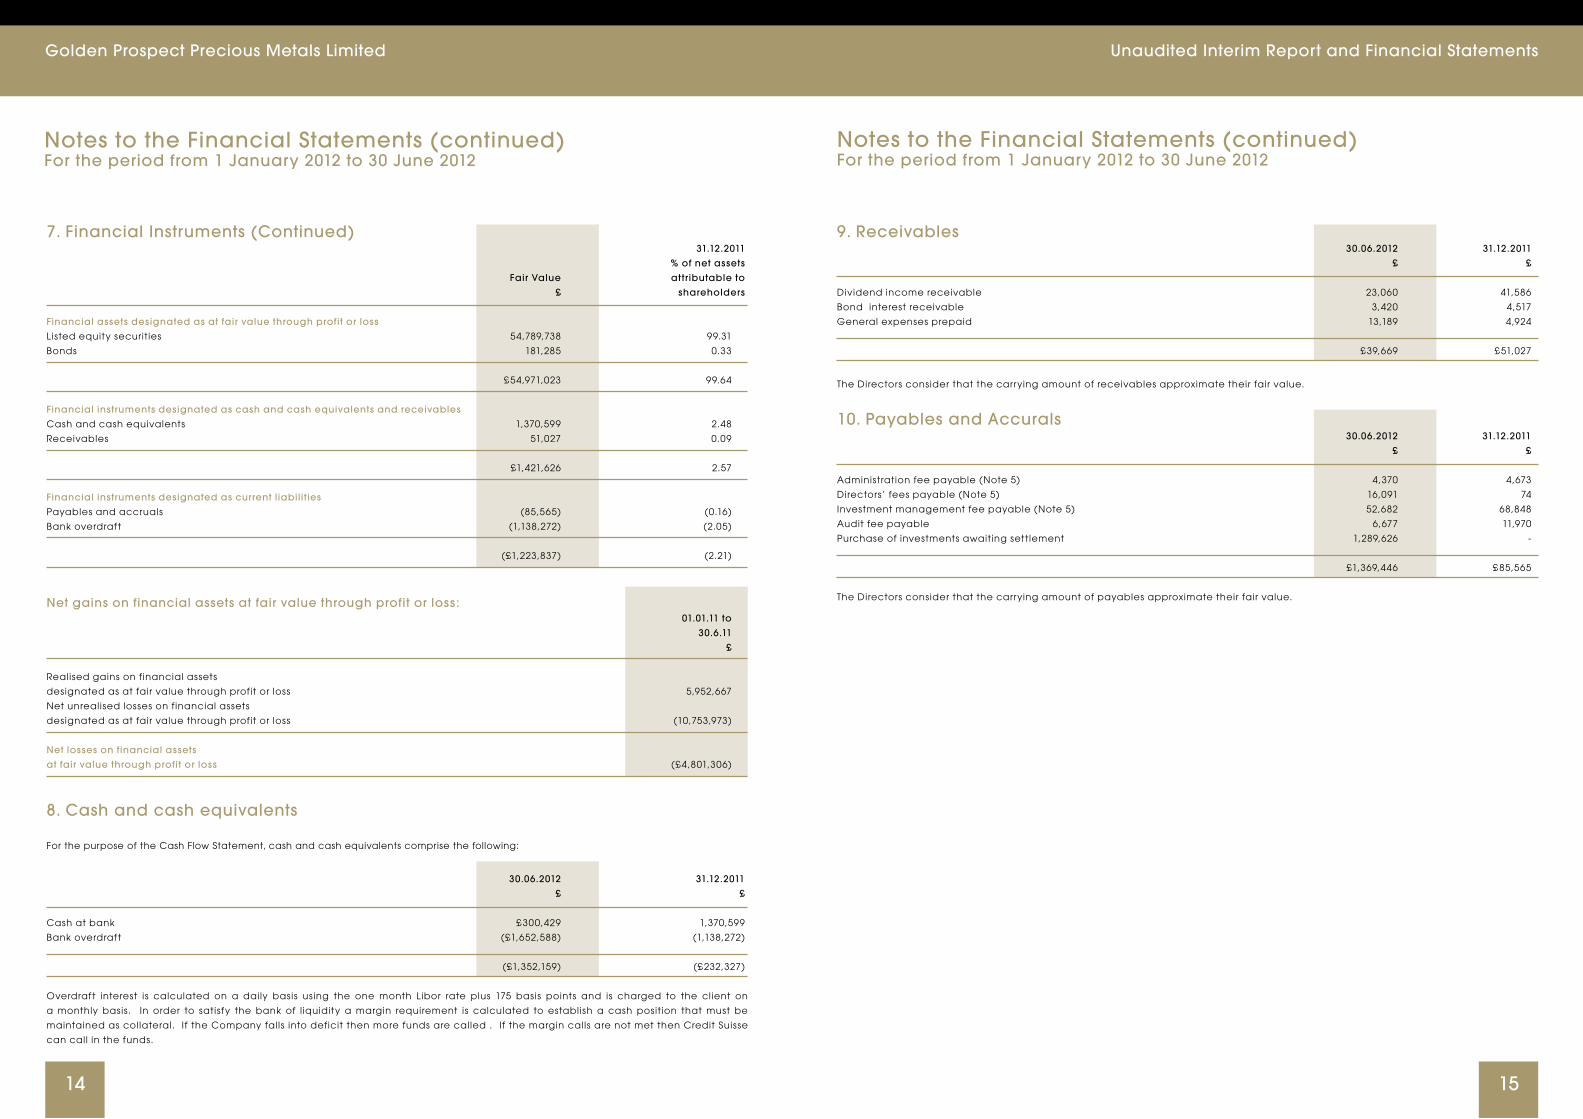
7. Financial Instruments
Details of the significant accounting policies and methods adopted,
including the criteria for recognition, the basis of measurement
and the basis on which income and expenses are recognised,
in respect of its financial assets and liabilities are disclosed in
Note 2. The following table analyses the carrying amounts of the
financial assets and liabilities by category as defined in IAS 39.
6. Basic And Diluted Earnings Per Ordinary ShareBasic earnings per Ordinary Share is calculated by dividing the
comprehensive loss for the period of £11,524,440 (30 June 2011:
comprehensive loss of £4,866,844) by the weighted average number of
Ordinary Shares outstanding during the period. The weighted average
number of ordinary shares is 57,000,000 as no further shares were issued
in this period (30 June 2011: 40,370,000).
Categories of financial instruments: 30.06.2012
% of net assets
Fair Value attributable to
£ shareholders
Financial assets designated as at fair value through profit or loss
Listed equity securities and warrants 46,206,721 105.87
Bonds 119,587 0.27
£46,326,308 106.14
Financial instruments designated as cash and cash equivalents and receivables
Cash and cash equivalents 300,429 0.69
Receivables 39,669 0.09
£340,098 0.78
Financial instruments designated as current liabili t ies
Payables and accruals (1,369,446) (3.14)
Bank overdraft (1,652,588) (3.78)
(£3,022,034) (6.92)
Net losses on financial assets at fair value through profit or loss:
01.1.12
to 30.6.12
£
Realised losses on financial assets
designated as at fair value through profit or loss (1,063,020)
Net unrealised losses on financial assets
designated as at fair value through profit or loss (10,171,624)
Net losses on financial assets
at fair value through profit or loss (£11,234,644)
Golden Prospect Precious Metals Limited Unaudited Interim Report and Financial Statements
1514
Notes to the Financial Statements (continued)For the period from 1 January 2012 to 30 June 2012
Notes to the Financial Statements (continued)For the period from 1 January 2012 to 30 June 2012
7. Financial Instruments (Continued) 31.12.2011
% of net assets
Fair Value attributable to
£ shareholders
Financial assets designated as at fair value through profit or loss
Listed equity securities 54,789,738 99.31
Bonds 181,285 0.33
£54,971,023 99.64
Financial instruments designated as cash and cash equivalents and receivables
Cash and cash equivalents 1,370,599 2.48
Receivables 51,027 0.09
£1,421,626 2.57
Financial instruments designated as current liabili t ies
Payables and accruals (85,565) (0.16)
Bank overdraft (1,138,272) (2.05)
(£1,223,837) (2.21)
Net gains on financial assets at fair value through profit or loss:
01.01.11 to
30.6.11
£
Realised gains on financial assets
designated as at fair value through profit or loss 5,952,667
Net unrealised losses on financial assets
designated as at fair value through profit or loss (10,753,973)
Net losses on financial assets
at fair value through profit or loss (£4,801,306)
8. Cash and cash equivalents
For the purpose of the Cash Flow Statement, cash and cash equivalents comprise the following:
30.06.2012 31.12.2011
£ £
Cash at bank £300,429 1,370,599
Bank overdraft (£1,652,588) (1,138,272)
(£1,352,159) (£232,327)
Overdraft interest is calculated on a daily basis using the one month Libor rate plus 175 basis points and is charged to the client on
a monthly basis. In order to satisfy the bank of l iquidity a margin requirement is calculated to establish a cash position that must be
maintained as collateral. If the Company falls into deficit then more funds are called . If the margin calls are not met then Credit Suisse
can call in the funds.
9. Receivables 30.06.2012 31.12.2011
£ £
Dividend income receivable 23,060 41,586
Bond interest receivable 3,420 4,517
General expenses prepaid 13,189 4,924
£39,669 £51,027
The Directors consider that the carrying amount of receivables approximate their fair value.
10. Payables and Accurals 30.06.2012 31.12.2011
£ £
Administration fee payable (Note 5) 4,370 4,673
Directors’ fees payable (Note 5) 16,091 74
Investment management fee payable (Note 5) 52,682 68,848
Audit fee payable 6,677 11,970
Purchase of investments awaiting settlement 1,289,626 -
£1,369,446 £85,565
The Directors consider that the carrying amount of payables approximate their fair value.
Golden Prospect Precious Metals Limited Unaudited Interim Report and Financial Statements
1716
Notes to the Financial Statements (continued)For the period from 1 January 2012 to 30 June 2012
Notes to the Financial Statements (continued)For the period from 1 January 2012 to 30 June 2012
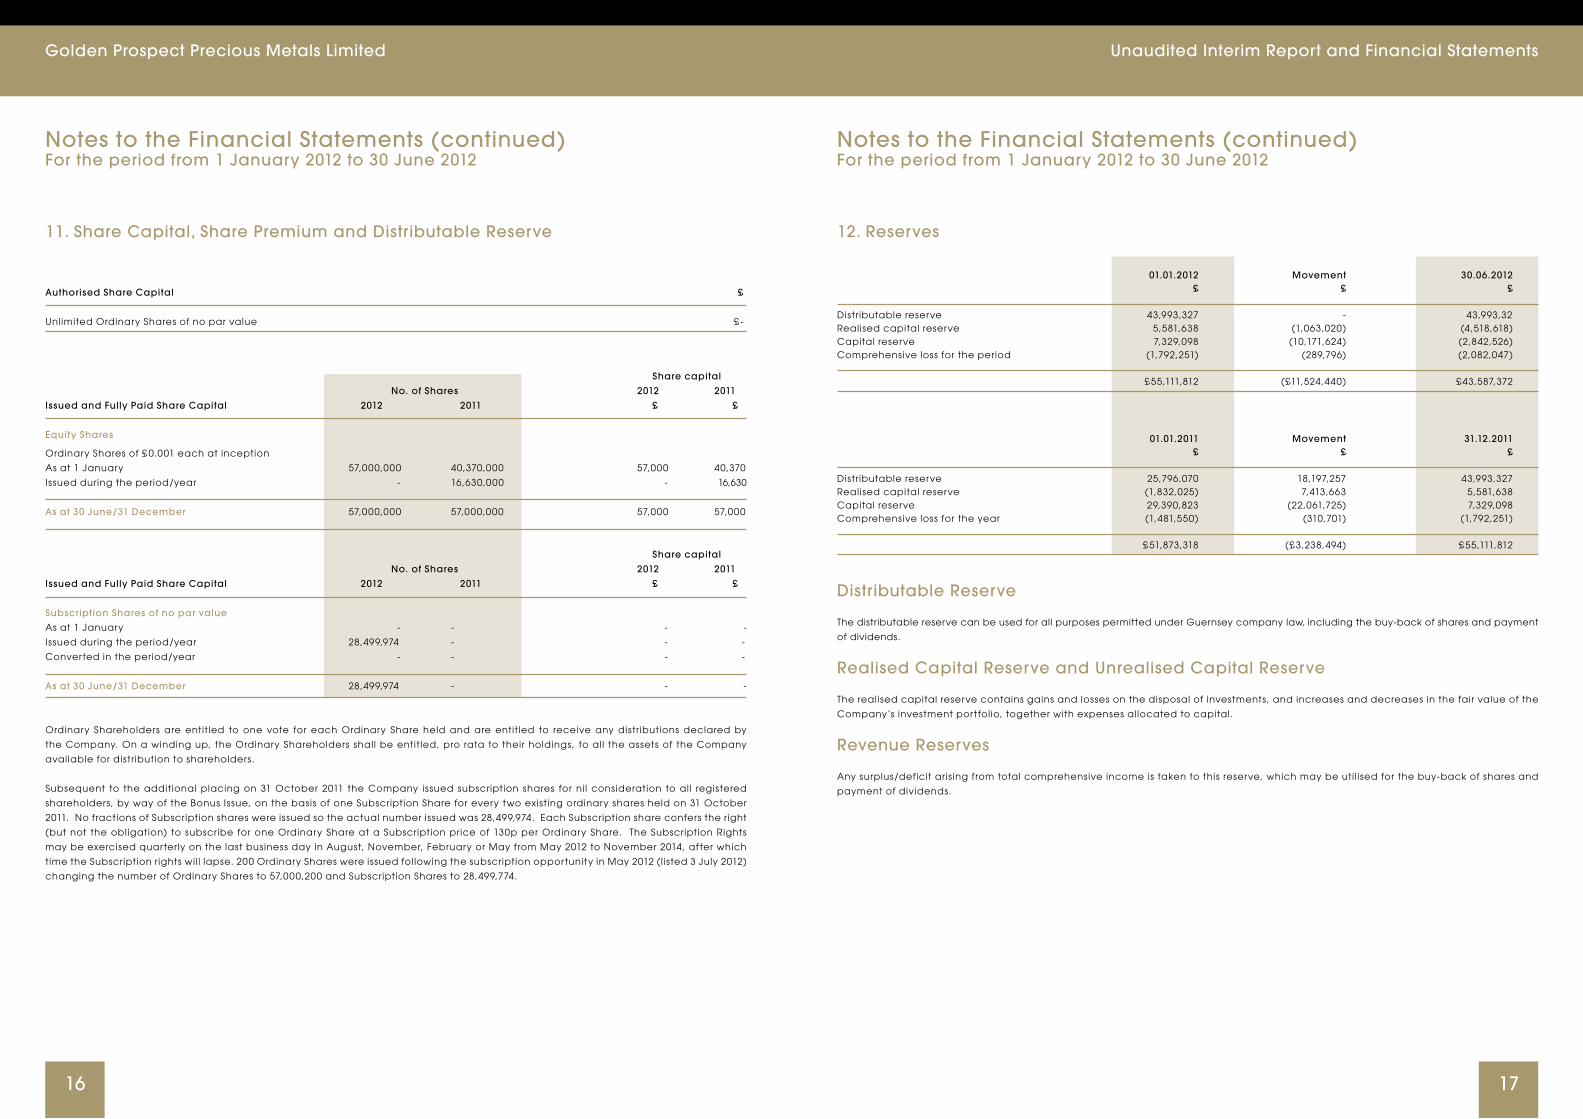
11. Share Capital, Share Premium and Distributable Reserve
Authorised Share Capital £
Unlimited Ordinary Shares of no par value £ -
Share capital
No. of Shares 2012 2011
Issued and Fully Paid Share Capital 2012 2011 £ £
Equity Shares
Ordinary Shares of £ 0.001 each at inception
As at 1 January 57,000,000 40,370,000 57,000 40,370
Issued during the period/year - 16,630,000 - 16,630
As at 30 June/31 December 57,000,000 57,000,000 57,000 57,000
Share capital
No. of Shares 2012 2011
Issued and Fully Paid Share Capital 2012 2011 £ £
Subscription Shares of no par value
As at 1 January - - - -
Issued during the period/year 28,499,974 - - -
Converted in the period/year - - - -
As at 30 June/31 December 28,499,974 - - -
Ordinary Shareholders are entitled to one vote for each Ordinary Share held and are entitled to receive any distributions declared by
the Company. On a winding up, the Ordinary Shareholders shall be entitled, pro rata to their holdings, to all the assets of the Company
available for distribution to shareholders.
Subsequent to the additional placing on 31 October 2011 the Company issued subscription shares for nil consideration to all registered
shareholders, by way of the Bonus Issue, on the basis of one Subscription Share for every two existing ordinary shares held on 31 October
2011. No fractions of Subscription shares were issued so the actual number issued was 28,499,974. Each Subscription share confers the right
(but not the obligation) to subscribe for one Ordinary Share at a Subscription price of 130p per Ordinary Share. The Subscription Rights
may be exercised quarterly on the last business day in August, November, February or May from May 2012 to November 2014, after which
time the Subscription rights wil l lapse. 200 Ordinary Shares were issued following the subscription opportunity in May 2012 (l isted 3 July 2012)
changing the number of Ordinary Shares to 57,000,200 and Subscription Shares to 28,499,774.
12. Reserves
01.01.2012 Movement 30.06.2012 £ £ £
Distributable reserve 43,993,327 - 43,993,32 Realised capital reserve 5,581,638 (1,063,020) (4,518,618) Capital reserve 7,329,098 (10,171,624) (2,842,526)Comprehensive loss for the period (1,792,251) (289,796) (2,082,047)
£55,111,812 (£11,524,440) £43,587,372
01.01.2011 Movement 31.12.2011 £ £ £
Distributable reserve 25,796,070 18,197,257 43,993,327Realised capital reserve (1,832,025) 7,413,663 5,581,638 Capital reserve 29,390,823 (22,061,725) 7,329,098Comprehensive loss for the year (1,481,550) (310,701) (1,792,251)
£51,873,318 (£3,238,494) £55,111,812
Distributable Reserve
The distributable reserve can be used for all purposes permitted under Guernsey company law, including the buy-back of shares and payment
of dividends.
Realised Capital Reserve and Unrealised Capital Reserve
The realised capital reserve contains gains and losses on the disposal of investments, and increases and decreases in the fair value of the
Company’s investment portfolio, together with expenses allocated to capital.
Revenue Reserves
Any surplus/deficit aris ing from total comprehensive income is taken to this reserve, which may be uti l ised for the buy-back of shares and
payment of dividends.
Golden Prospect Precious Metals Limited Unaudited Interim Report and Financial Statements
1918
Notes to the Financial Statements (continued)For the period from 1 January 2012 to 30 June 2012
Notes to the Financial Statements (continued)For the period from 1 January 2012 to 30 June 2012
13. Financial Risk Management
The Company is exposed to a variety of financial risks as a result of
its activities. These risks include credit risk, l iquidity risk and market
risk (including currency risk, fair value interest rate risk and price
risk). The Company’s risk management policies, approved by the
Board of Directors, seek to minimise the potential adverse effects of
these risks on the Company’s financial performance.
Credit risk
Credit risk refers to the risk that a counterparty wil l default on its
contractual obligations resulting in financial loss to the Company.
As at the date of the Balance Sheet, f inancial assets exposed to
credit risk comprise bank balances and receivables. It is in the
opinion of the Board of Directors that the carrying amount of these
financial assets represents the maximum credit risk exposure as at
the date of the Balance Sheet.
As at 30 June 2012 there were no debt instruments past due (31
December 2011: None).
The Board of Directors has a policy in place of spreading the
aggregate value of transactions concluded amongst approved
counterparties with an appropriate credit quality. The Company’s
exposure and the credit ratings of its counterparties are continuously
monitored by management. The following table i l lustrates the credit
concentration by institution:
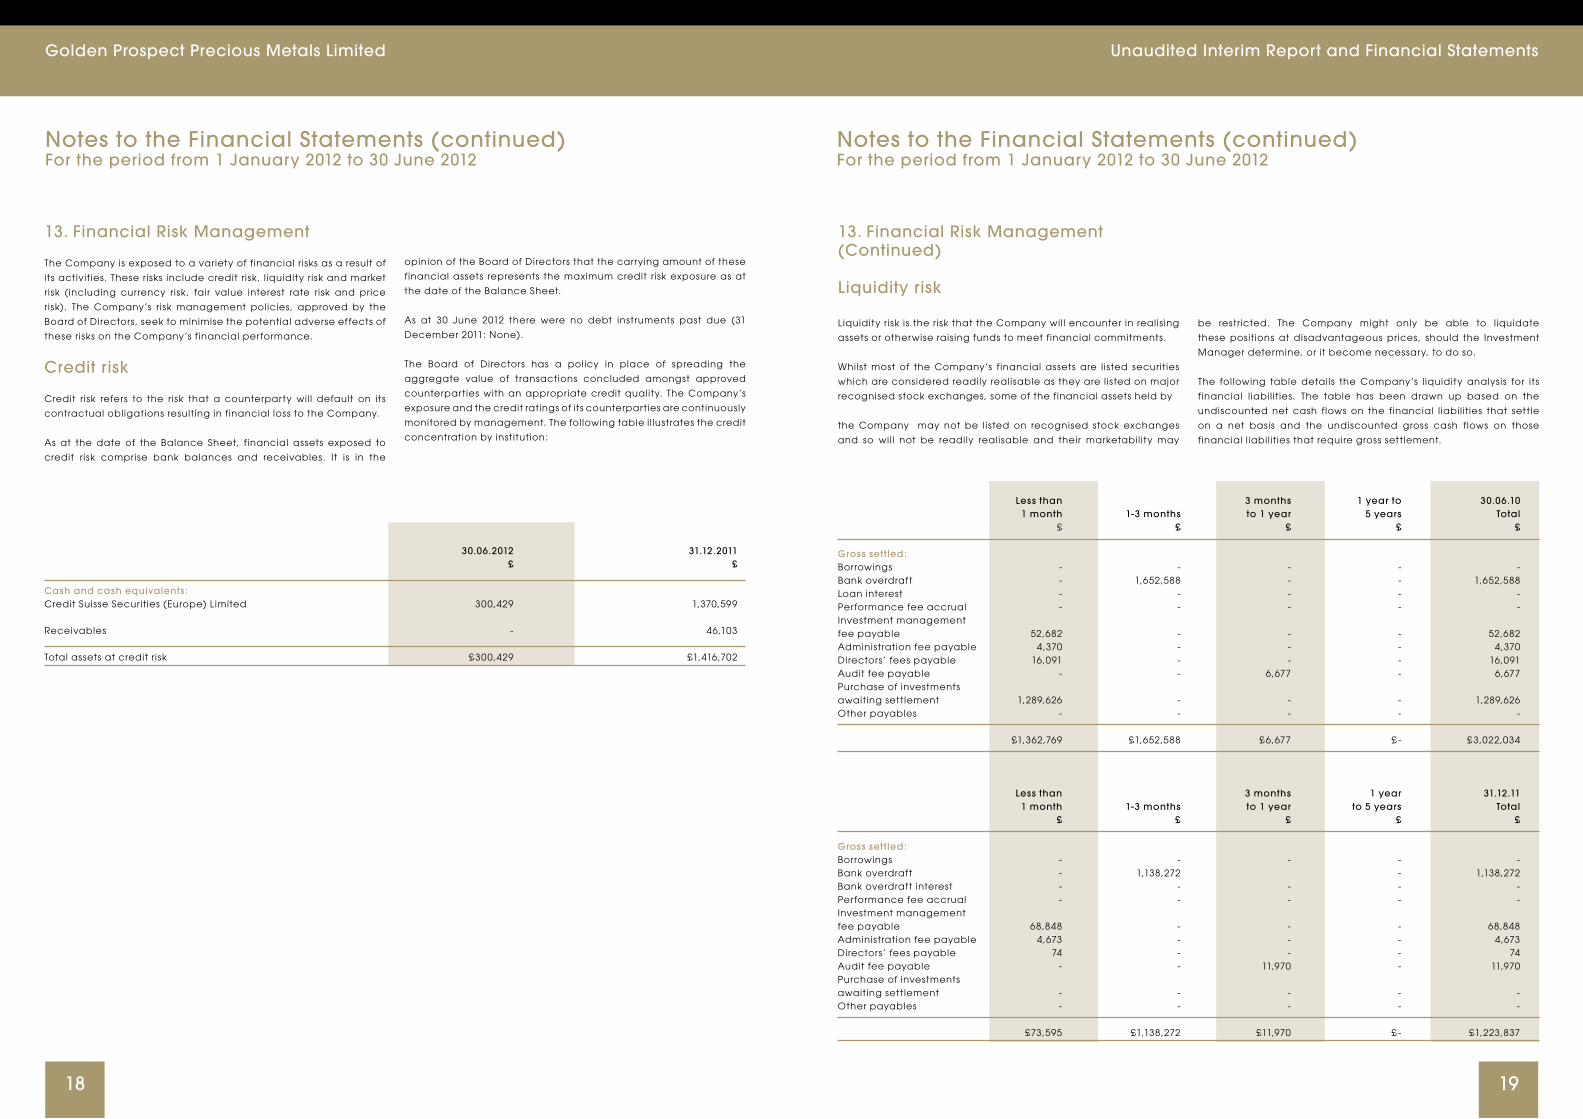
30.06.2012 31.12.2011 £ £
Cash and cash equivalents :Credit Suisse Securities (Europe) Limited 300,429 1,370,599
Receivables - 46,103
Total assets at credit risk £300,429 £1,416,702
13. Financial Risk Management (Continued)
Liquidity risk
Liquidity risk is the risk that the Company wil l encounter in realis ing
assets or otherwise rais ing funds to meet financial commitments.
Whilst most of the Company’s financial assets are l isted securities
which are considered readily realisable as they are l isted on major
recognised stock exchanges, some of the financial assets held by
the Company may not be l isted on recognised stock exchanges
and so wil l not be readily realisable and their marketabil ity may
be restricted. The Company might only be able to l iquidate
these positions at disadvantageous prices, should the Investment
Manager determine, or it become necessary, to do so.
The following table details the Company’s l iquidity analysis for its
f inancial l iabil it ies. The table has been drawn up based on the
undiscounted net cash flows on the financial l iabil it ies that settle
on a net basis and the undiscounted gross cash flows on those
financial l iabil it ies that require gross settlement.
Less than 3 months 1 year to 30.06.10 1 month 1-3 months to 1 year 5 years Total £ £ £ £ £
Gross set tled: Borrowings - - - - - Bank overdraft - 1,652,588 - - 1,652,588Loan interest - - - - - Performance fee accrual - - - - - Investment management fee payable 52,682 - - - 52,682Administration fee payable 4,370 - - - 4,370Directors’ fees payable 16,091 - - - 16,091Audit fee payable - - 6,677 - 6,677Purchase of investments awaiting settlement 1,289,626 - - - 1,289,626Other payables - - - - - £1,362,769 £1,652,588 £6,677 £ - £3,022,034
Less than 3 months 1 year 31.12.11 1 month 1-3 months to 1 year to 5 years Total £ £ £ £ £
Gross set tled: Borrowings - - - - - Bank overdraft - 1,138,272 - 1,138,272Bank overdraft interest - - - - - Performance fee accrual - - - - - Investment management fee payable 68,848 - - - 68,848Administration fee payable 4,673 - - - 4,673Directors’ fees payable 74 - - - 74Audit fee payable - - 11,970 - 11,970Purchase of investments awaiting settlement - - - - - Other payables - - - - -
£73,595 £1,138,272 £11,970 £ - £1,223,837
Golden Prospect Precious Metals Limited Unaudited Interim Report and Financial Statements
2120
Notes to the Financial Statements (continued)For the period from 1 January 2012 to 30 June 2012
13. Financial Risk Management (Continued)
The Investment Manager manages l iquidity on a daily basis. The
Company’s overall exposure to l iquidity risk is monitored by the
Board of Directors on a quarterly basis.
The Company expects to meet its other obligations for operating
cash flows at the Balance Sheet date. The Company expects to
maintain current debt to equity ratio within 30% of NAV.
Market risk
The Company’s activities expose it primarily to the market risks of
changes in market prices, interest rates and foreign currency ex-
change rates.
Price risk
Price risk is the risk that the fair value of future cash flows of a financial
instrument will fluctuate because of changes in market prices (other
than those arising from interest rate risk or currency risk).
The Company is exposed to market price risk aris ing from its
f inancial assets designated as at fair value through profit or loss.
The performance of these financial assets wil l be affected by
the performance of the investee companies. The exploration,
development and production of metal and mineral deposits
involves significant uncertainties and the investee companies
wil l be subject to all the hazards and risks normally encountered
in such activities. Many of these are dif ficult to predict and are
outside the control of the investee companies. They include,
amongst others, issues relating to the environment, the climate,
the geopolitical environment, local and international regulatory
requirements, l icensing terms, planning permission, unexpected
geological formations, rock falls, f looding, pollution, legal
l iabil it ies, the availabil ity and reliabil ity of plant and equipment,
the scaling-up of operations, the reliance on key individuals, local
finance and tax regimes, foreign currency repatriation, capital and
budget constraints, contractors and suppliers, local employment
regulations and practices, employment unions and the availabil ity
of suitable labour. In addition, there is often no guarantee that the
estimates of quantities and grades of metals and minerals disclosed
by investee companies wil l be available for extraction.
The Company’s financial assets are exposed to market price
fluctuations which are monitored by the Investment Manager in
pursuance of the investment objectives and policies. Adherence to
investment guidelines and to investment and borrowing powers set
out in the Placing and Offer for Subscription document mitigates
the risk of excessive exposure to any particular type of security or
issuer. However, with respect to the investment strategy uti l ised
by the Company there is always some, and occasionally some
significant, degree of market risk.
Price sensitivity
The value of the Company’s financial assets had a sensitivity of
£2,316,315 (31 December 2011: £2,748,551) to a 5% increase or de-
crease in the market prices with other variables being held constant
as at 30 June 2012. A 5% change is the sensitivity rate used when re-
porting price risk internally to key management personnel.
Interest rate risk
Interest rate risk is the risk that the fair value or future cash flows of
a financial instrument wil l f luctuate because of changes in market
interest rates.
The Company is exposed to interest rate risk as it has cash and cash
equivalents which are invested at short term rates. The Investment
Manager manages the Company’s exposure to interest rate risk
on a daily basis in accordance with the Company’s investment
objective and policies. The Company’s overall exposure to interest
rate risk is monitored on a quarterly basis by the Board of Directors.
Interest rate sensitivity
The sensitivity analysis below has been determined based on the
Company’s exposure to interest rates for interest bearing assets
and l iabil it ies at the date of the Balance Sheet and the stipulated
change taking place at the beginning of the financial year and
held constant throughout the reporting period in the case of
instruments that have floating rates.
If interest rates had been 25 basis points higher or lower and all
other variables had been held constant, the Company’s net assets
attributable to holders of Ordinary Shares for the period to 30 June
2012 would have been £338 (31 December 2011: £13,364) higher
or lower due to the change in the interest payable on the bank
overdraft and the interest receivable on cash and cash equivalents.
13. Financial Risk Management (Continued)
Currency risk
Currency risk is the risk that the fair value or future cash flows of a
financial instrument wil l f luctuate because of changes in foreign
currency exchange rates. The presentation currency of the
Company is Sterl ing. The Company’s financial assets are currently
denominated in various currencies other than Sterling and the
Company may hold other financial instruments, the price of which
may be determined with reference to currencies other than Sterling.
To the extent that these financial instruments are unhedged, or are not adequately hedged, the value of the Company’s financial
instruments may fluctuate with exchange rates as well as with
price changes in various local markets and currencies. The value
of the financial assets may therefore be affected unfavourably by
fluctuations in currency rates and exchange control regulations.
The Investment Manager has the power to manage exposure to
currency movements by using hedging instruments. The Investment
Manager’s treatment of currency transactions is set out in Note 2 to
the Financial Statements under “Translation of foreign currency”.
There were no hedging instruments held at 30 June 2012 (31
December 2011: None).
The carrying amount of the Company’s foreign currency
denominated financial assets and financial l iabil it ies at the date of
the Balance Sheet was as follows:
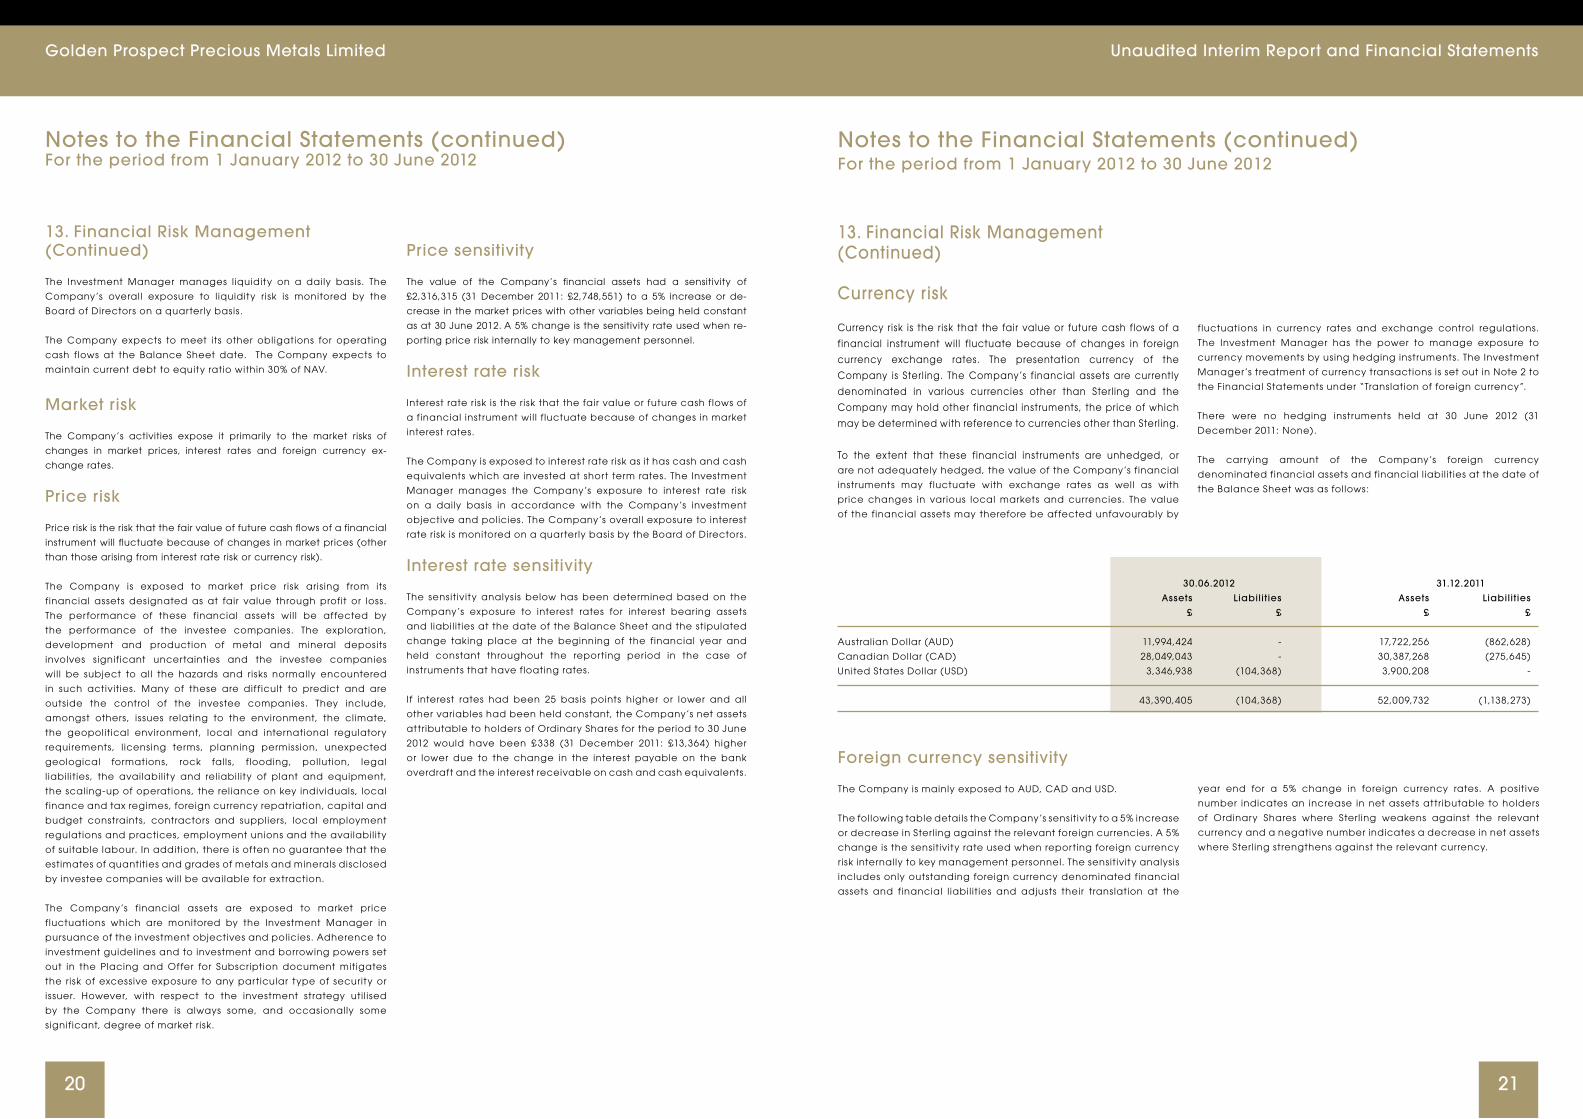
30.06.2012 31.12.2011
Assets Liabili t ies Assets Liabili t ies
£ £ £ £
Australian Dollar (AUD) 11,994,424 - 17,722,256 (862,628)
Canadian Dollar (CAD) 28,049,043 - 30,387,268 (275,645)
United States Dollar (USD) 3,346,938 (104,368) 3,900,208 -
43,390,405 (104,368) 52,009,732 (1,138,273)
Notes to the Financial Statements (continued)For the period from 1 January 2012 to 30 June 2012
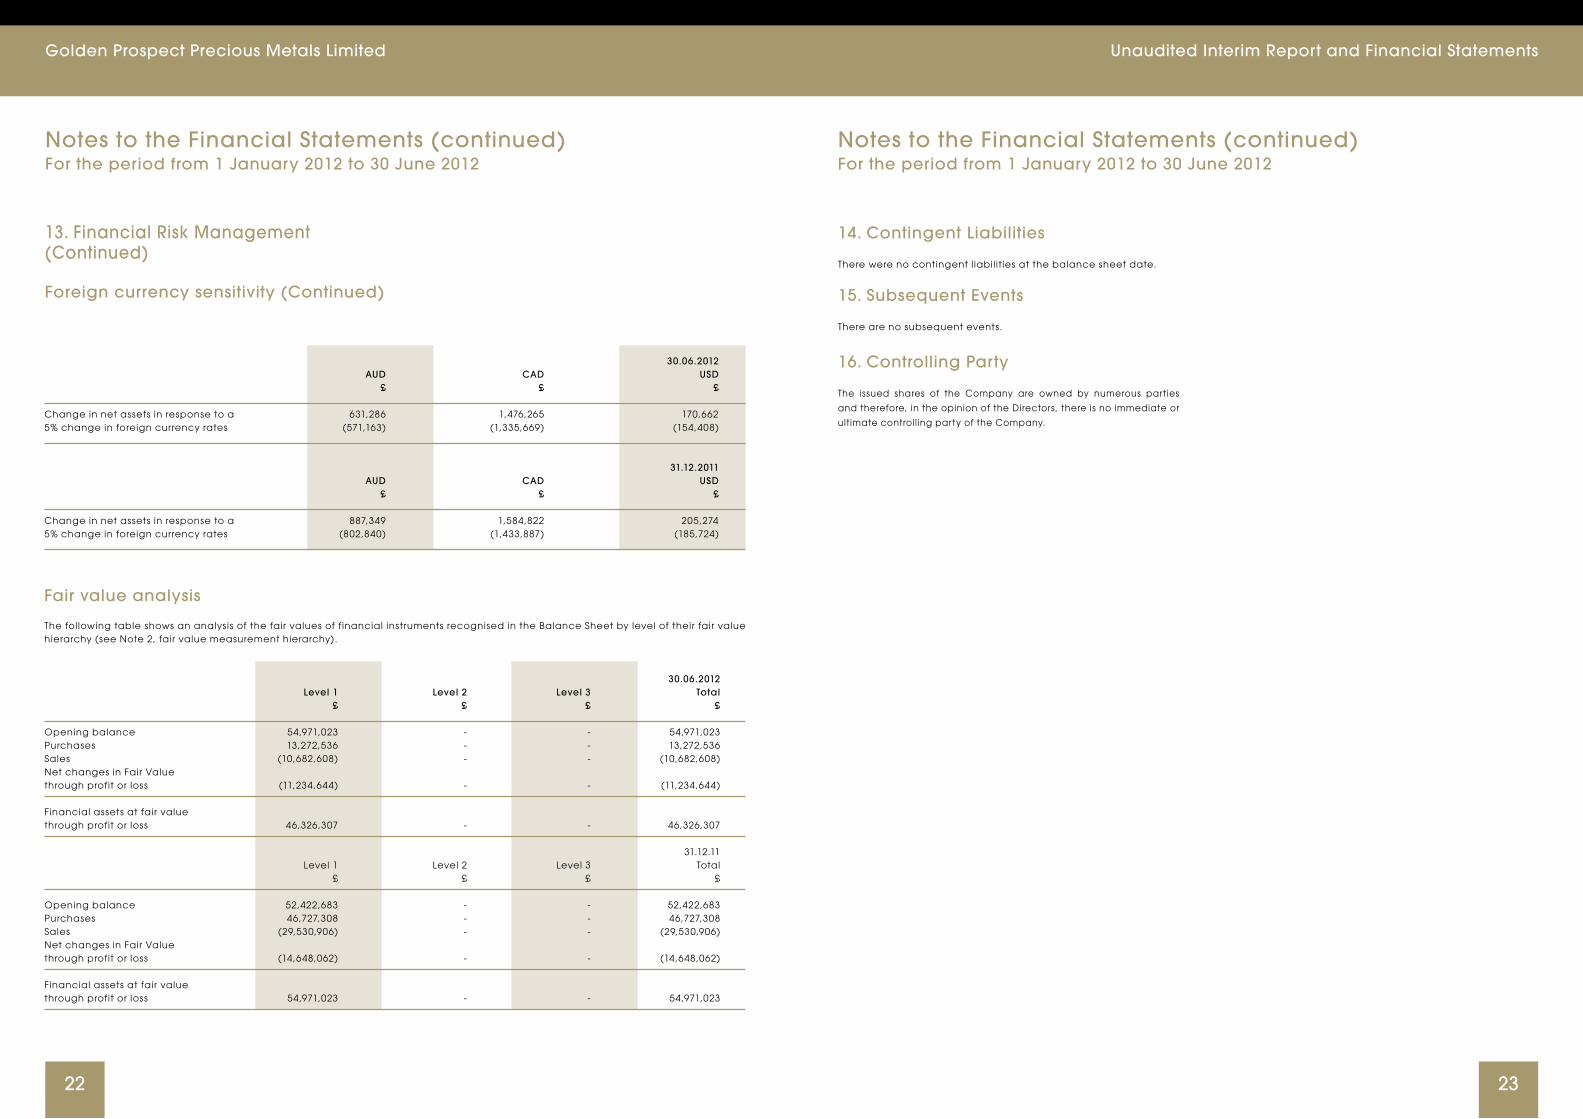
Foreign currency sensitivity
The Company is mainly exposed to AUD, CAD and USD.
The following table details the Company’s sensitivity to a 5% increase
or decrease in Sterl ing against the relevant foreign currencies. A 5%
change is the sensitivity rate used when reporting foreign currency
risk internally to key management personnel. The sensitivity analysis
includes only outstanding foreign currency denominated financial
assets and financial l iabil it ies and adjusts their translation at the
year end for a 5% change in foreign currency rates. A positive
number indicates an increase in net assets attributable to holders
of Ordinary Shares where Sterl ing weakens against the relevant
currency and a negative number indicates a decrease in net assets
where Sterl ing strengthens against the relevant currency.
Golden Prospect Precious Metals Limited Unaudited Interim Report and Financial Statements
2322
30.06.2012 AUD CAD USD £ £ £
Change in net assets in response to a 631,286 1,476,265 170,662 5% change in foreign currency rates (571,163) (1,335,669) (154,408)
31.12.2011 AUD CAD USD £ £ £
Change in net assets in response to a 887,349 1,584,822 205,274 5% change in foreign currency rates (802,840) (1,433,887) (185,724)
Fair value analysis
The following table shows an analysis of the fair values of financial instruments recognised in the Balance Sheet by level of their fair value hierarchy (see Note 2, fair value measurement hierarchy).
30.06.2012 Level 1 Level 2 Level 3 Total £ £ £ £
Opening balance 54,971,023 - - 54,971,023Purchases 13,272,536 - - 13,272,536Sales (10,682,608) - - (10,682,608)Net changes in Fair Value through profit or loss (11,234,644) - - (11,234,644)
Financial assets at fair value through profit or loss 46,326,307 - - 46,326,307 31.12.11 Level 1 Level 2 Level 3 Total £ £ £ £
Opening balance 52,422,683 - - 52,422,683Purchases 46,727,308 - - 46,727,308Sales (29,530,906) - - (29,530,906)Net changes in Fair Value through profit or loss (14,648,062) - - (14,648,062)
Financial assets at fair value through profit or loss 54,971,023 - - 54,971,023
Notes to the Financial Statements (continued)For the period from 1 January 2012 to 30 June 2012
13. Financial Risk Management (Continued)
Foreign currency sensitivity (Continued)
14. Contingent Liabilities
There were no contingent l iabil it ies at the balance sheet date.
15. Subsequent Events
There are no subsequent events.
16. Controlling Party
The issued shares of the Company are owned by numerous parties
and therefore, in the opinion of the Directors, there is no immediate or
ultimate controll ing party of the Company.
Notes to the Financial Statements (continued)For the period from 1 January 2012 to 30 June 2012
Golden Prospect Precious Metals Limited Unaudited Interim Report and Financial Statements
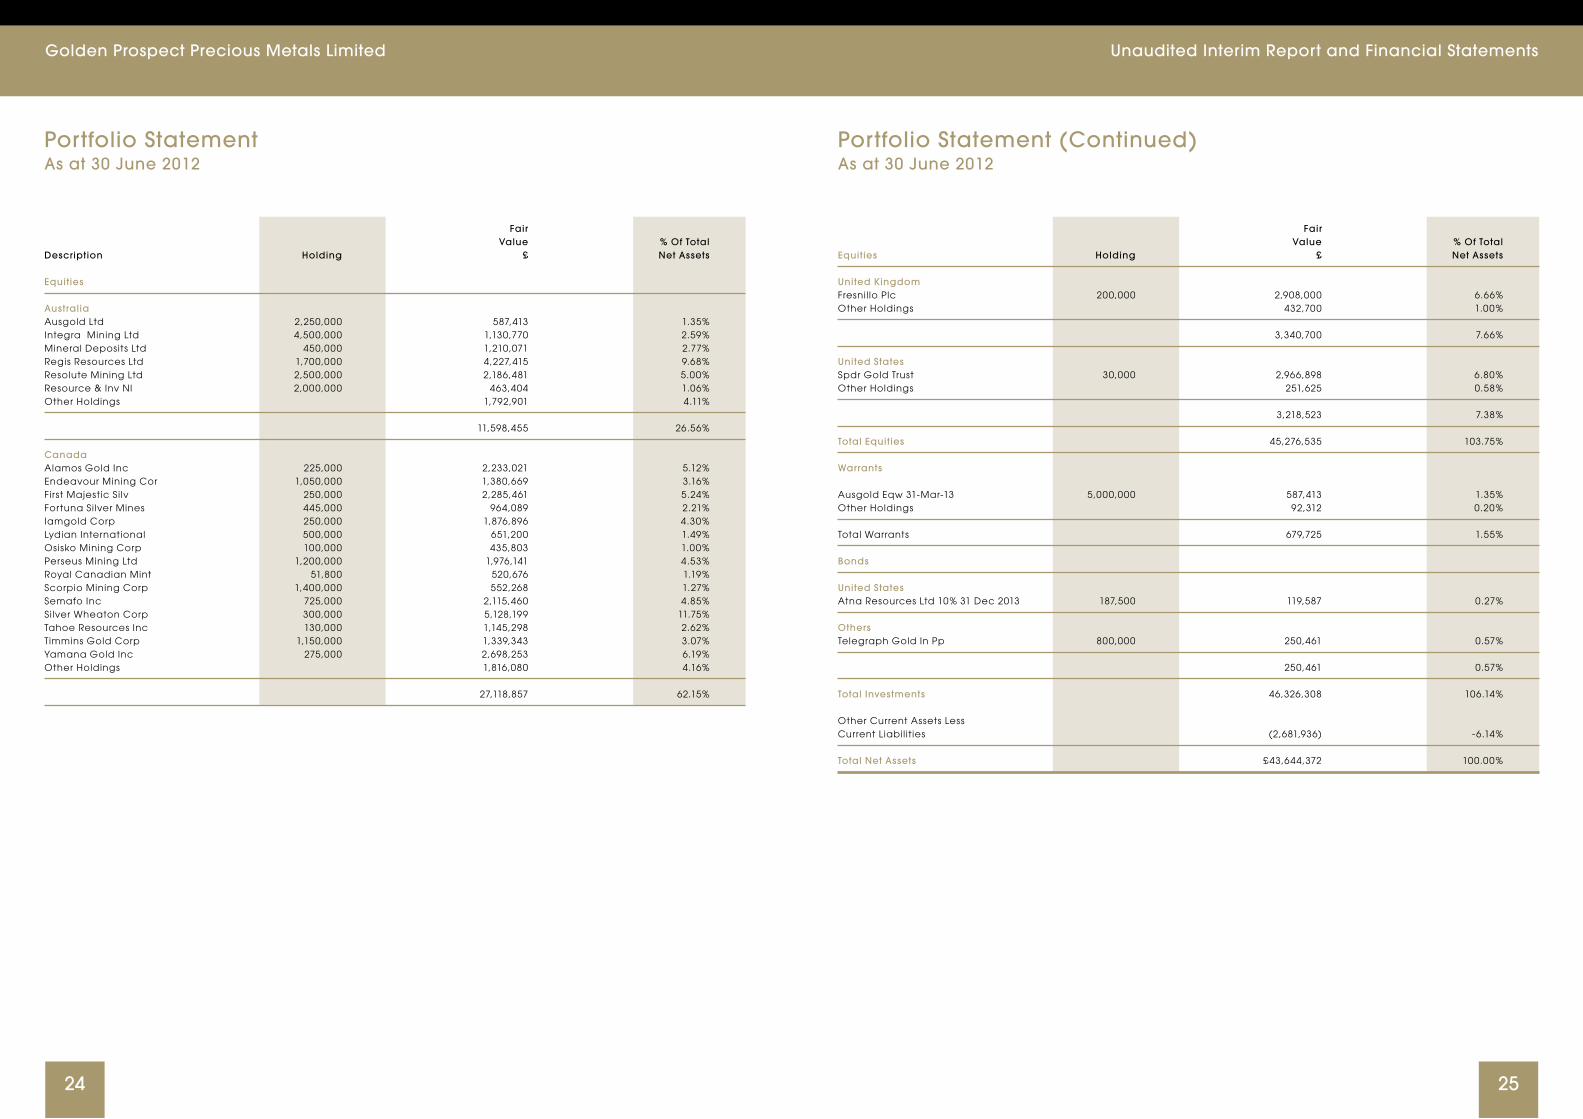
2524
Fair Value % Of TotalDescription Holding £ Net Assets Equities Australia Ausgold Ltd 2,250,000 587,413 1.35%Integra Mining Ltd 4,500,000 1,130,770 2.59%Mineral Deposits Ltd 450,000 1,210,071 2.77%Regis Resources Ltd 1,700,000 4,227,415 9.68%Resolute Mining Ltd 2,500,000 2,186,481 5.00%Resource & Inv Nl 2,000,000 463,404 1.06%Other Holdings 1,792,901 4.11%
11,598,455 26.56%
Canada Alamos Gold Inc 225,000 2,233,021 5.12%Endeavour Mining Cor 1,050,000 1,380,669 3.16%First Majestic Si lv 250,000 2,285,461 5.24%Fortuna Silver Mines 445,000 964,089 2.21%Iamgold Corp 250,000 1,876,896 4.30%Lydian International 500,000 651,200 1.49%Osisko Mining Corp 100,000 435,803 1.00%Perseus Mining Ltd 1,200,000 1,976,141 4.53%Royal Canadian Mint 51,800 520,676 1.19%Scorpio Mining Corp 1,400,000 552,268 1.27%Semafo Inc 725,000 2,115,460 4.85%Silver Wheaton Corp 300,000 5,128,199 11.75%Tahoe Resources Inc 130,000 1,145,298 2.62%Timmins Gold Corp 1,150,000 1,339,343 3.07%Yamana Gold Inc 275,000 2,698,253 6.19%Other Holdings 1,816,080 4.16%
27,118,857 62.15%
Portfolio StatementAs at 30 June 2012
Portfolio Statement (Continued)As at 30 June 2012
Fair Value % Of TotalEquities Holding £ Net Assets
United Kingdom Fresnil lo Plc 200,000 2,908,000 6.66%Other Holdings 432,700 1.00%
3,340,700 7.66% United States Spdr Gold Trust 30,000 2,966,898 6.80%Other Holdings 251,625 0.58%
3,218,523 7.38% Total Equities 45,276,535 103.75%
Warrants Ausgold Eqw 31-Mar-13 5,000,000 587,413 1.35%Other Holdings 92,312 0.20%
Total Warrants 679,725 1.55%
Bonds
United States Atna Resources Ltd 10% 31 Dec 2013 187,500 119,587 0.27%
Others Telegraph Gold In Pp 800,000 250,461 0.57%
250,461 0.57% Total Investments 46,326,308 106.14% Other Current Assets Less Current Liabil it ies (2,681,936) -6.14%
Total Net Assets £43,644,372 100.00%

Golden Prospect Precious Metals Limited
2726
Unaudited Interim Report and Financial Statements
DirectorsMalcolm Alec Burne
Kaare Glenne Foy
Robert Paul King
John Bowles (appointed 3.1.12)
Paul Craig (appointed 3.1.12)
All of
11 New Street, St. Peter Port
Guernsey GY1 2PF
Management and Administration
Secretary, Administrator and CISX SponsorLegis Fund Services Limited
11 New Street, St Peter Port
Guernsey GY1 2PF
Investment ManagerCQS Cayman Limited Partnership
P.O. Box 242, 45 Market Street
Gardenia, Camana Bay
Grand Cayman KY1-1104
Cayman Is lands
New City Investment Managers
(a trading name of CQS Asset Management Limited)
5th Floor, 33 Chester Street
London SW1X 7BLt
Financial Adviser and Broker to the CompanySinger Capital Markets Limited
One Hanover Street
London W1S 1YZ
Auditors to the Company Solicitors to the Company as to English LawBDO Limited
Place du Pré, Rue du Pré, St. Peter Port,
Guernsey GY1 3LL
Lawrence Graham LLP
P O Box 180, 4 More London Riverside
London SE1 2AU
Advocates to the Company as to Guernsey Law Custodian and Principal BankersBabbé
18-20 Smith Street, St Peter Port
Guernsey GY1 4BL
Credit Suisse Securities (Europe) Limited
One Cabot Square
London E14 4QJ
Registrar and CREST AgentCapita Registrars (Guernsey) Limited
Mont Crevelt House, Bulwer Avenue, St Sampson
Guernsey GY2 4LH
Market MakersSinger Capital Markets
1 Hanover Street
London W1S 1AX
Winterflood Securities
25 Dowgate Hill
London EC4R 2GA
Cantor Fitzgerald Europe Limited
1 America Square, 3rd Floor
17 Crosswell
London EC3N 2LB
KBC Peel Hunt
111 Old Broad Street
London EC2N 1PH
Further details are available on the Investment Manager’s website - www.ncim.co.uk
Note: The Company has appointed CQS as its investment manager However, CQS
has, with the agreement of the Board, delegated that function to NCIM.
Notes

Golden Prospect Precious Metals Limited Unaudited Interim Report and Financial Statements
2928
Notes

Golden Prospect Precious Metals Limited
11 New Street St Peter Port, GuernseyGY1 2PF
Tel: +44(0)1481 726034Fax: +44(0)1481 726029
www.ncim.co.uk