Embed Size (px)
Citation preview
Goldsmith’s teachers lecture 2008
Medical statisticsSandra Eldridge
Professor of biostatistics
Aims
• To introduce medical statistics• To highlight (without much detail)
various different mathematical contributions
• To give examples of where medical statistics has contributed to society

Statistics - definition
Statistics is a mathematical science pertaining to the collection, analysis, interpretation or explanation, and
presentation of data. It is applicable to a wide variety of academic disciplines,
from the natural and social sciences to the humanities, and to government and
business. quantitative


Structure of lecture
• Historical– Interpretation and explanation – John Graunt – Collection – Smoking and lung cancer, folic acid and
neural tube defects– Presentation – Graphs and confidence intervals– Analysis – Odds ratios
• More recent developments– Analysis, interpretation and presentation – Forest
plots– Interpretation and presentation – Funnel plots– *** Design – Cluster randomised trials ***
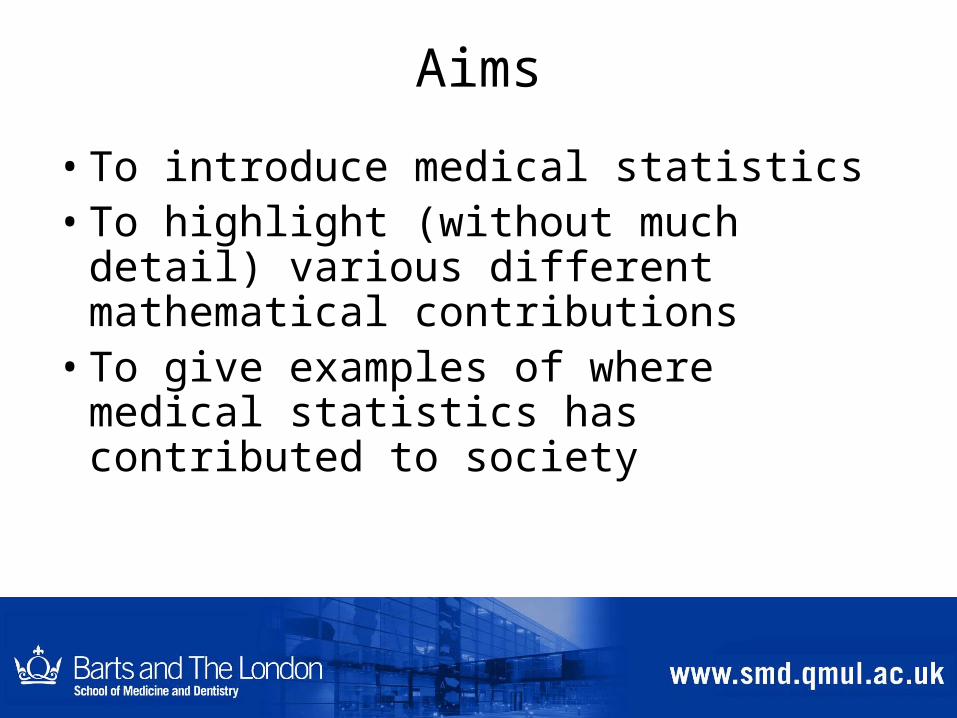
Natural and Political Observations Made upon the Bills of Mortality (1662)

John Graunt’s pioneering work
• used analysis of the mortality bills
• to create a system to warn of the onset and spread of bubonic plague
• work resulted in the first statistically-based estimation of the London’s population
collection, analysis, interpretation or explanation, and presentation
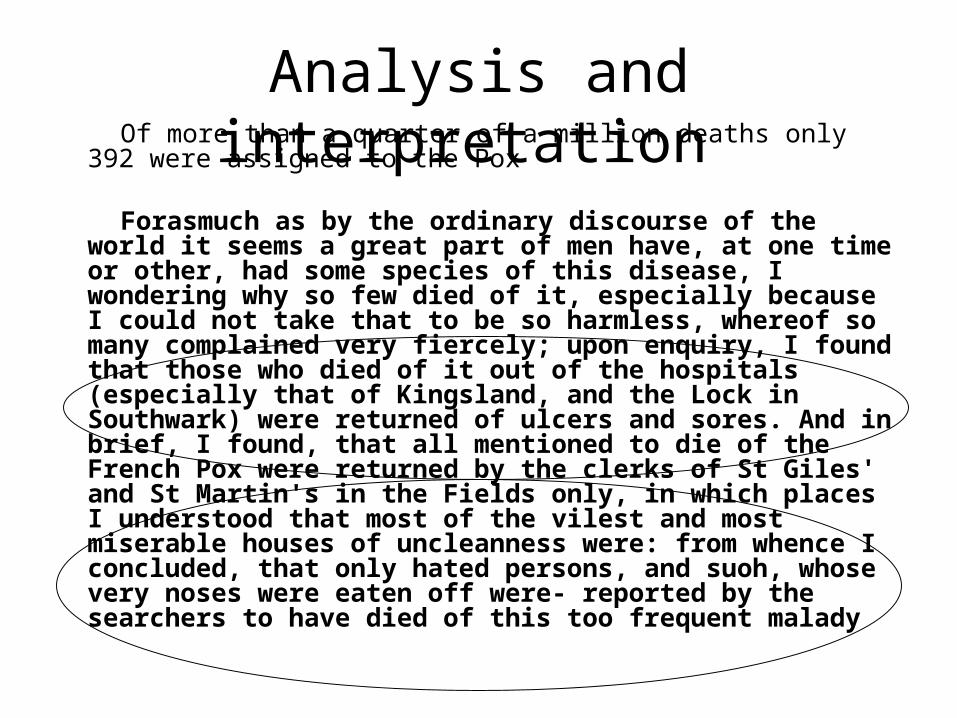
Analysis and interpretation Of more than a quarter of a million deaths only 392 were assigned to
the Pox
Forasmuch as by the ordinary discourse of the world it seems a great part of men have, at one time or other, had some species of this disease, I wondering why so few died of it, especially because I could not take that to be so harmless, whereof so many complained very fiercely; upon enquiry, I found that those who died of it out of the hospitals (especially that of Kingsland, and the Lock in Southwark) were returned of ulcers and sores. And in brief, I found, that all mentioned to die of the French Pox were returned by the clerks of St Giles' and St Martin's in the Fields only, in which places I understood that most of the vilest and most miserable houses of uncleanness were: from whence I concluded, that only hated persons, and suoh, whose very noses were eaten off were- reported by the searchers to have died of this too frequent malady

Mortality bills = routinely collected data (largely legal rationale so estates could be
disposed of etc) Q. How collected? Quality of data?
Sometimes need to collected data to answer specific question
Q. How should data be collected?
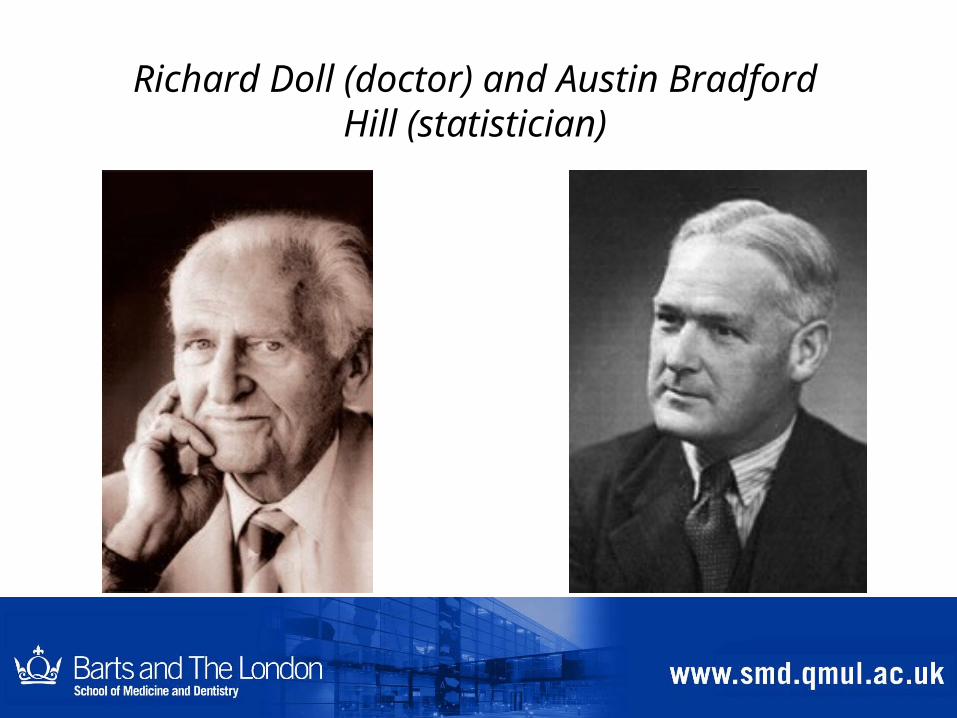
Richard Doll (doctor) and Austin Bradford Hill (statistician)
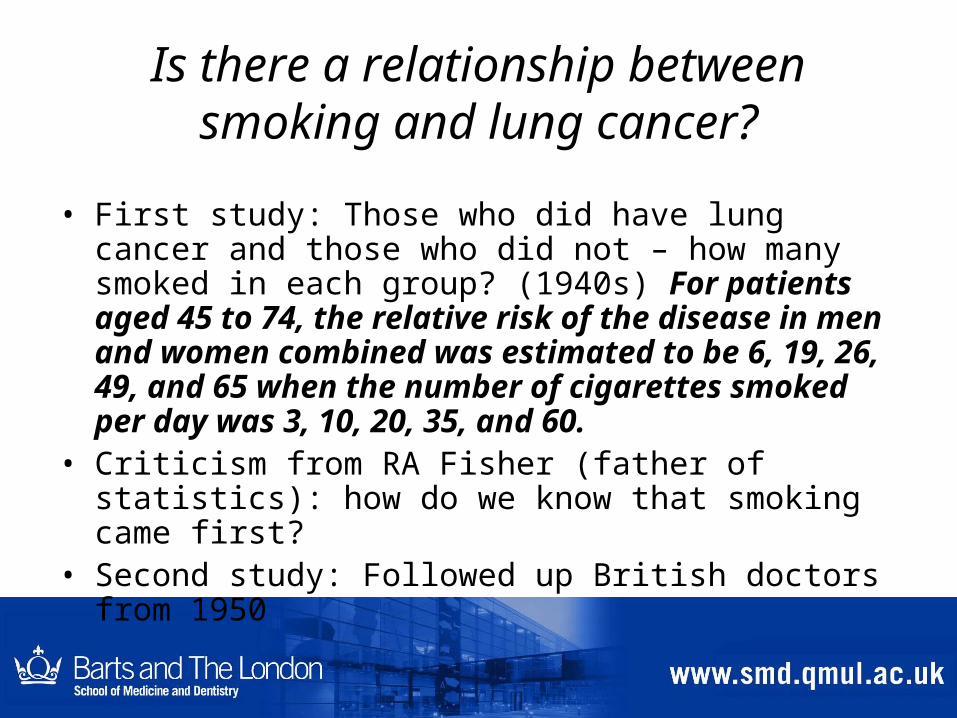
Is there a relationship between smoking and lung cancer?
• First study: Those who did have lung cancer and those who did not – how many smoked in each group? (1940s) For patients aged 45 to 74, the relative risk of the disease in men and women combined was estimated to be 6, 19, 26, 49, and 65 when the number of cigarettes smoked per day was 3, 10, 20, 35, and 60.
• Criticism from RA Fisher (father of statistics): how do we know that smoking came first?
• Second study: Followed up British doctors from 1950
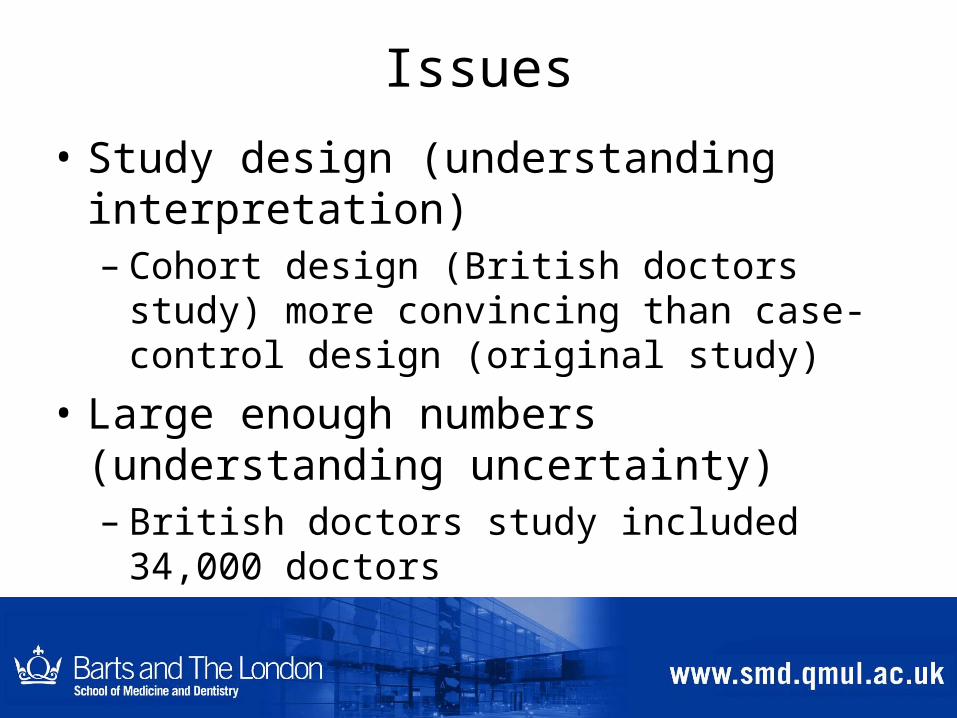
Issues
• Study design (understanding interpretation) – Cohort design (British doctors study) more
convincing than case-control design (original study)
• Large enough numbers (understanding uncertainty)– British doctors study included 34,000 doctors
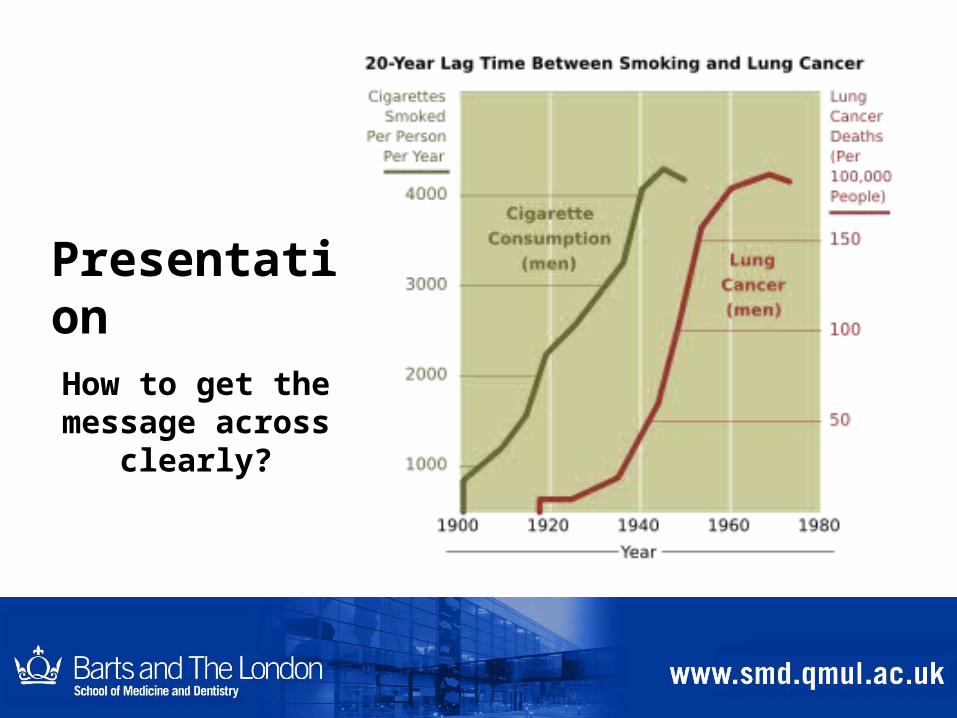
PresentationHow to get the
message across clearly?
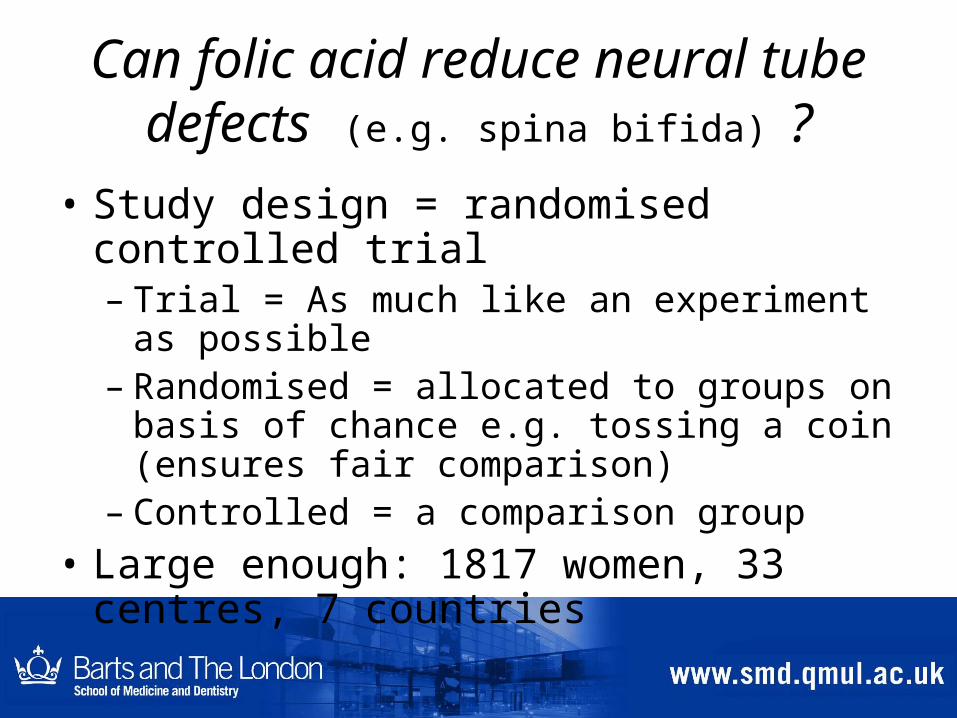
Can folic acid reduce neural tube defects (e.g. spina bifida) ?
• Study design = randomised controlled trial – Trial = As much like an experiment as
possible – Randomised = allocated to groups on basis of
chance e.g. tossing a coin (ensures fair comparison)
– Controlled = a comparison group
• Large enough: 1817 women, 33 centres, 7 countries

Folic acid and neural tube defects
• Data collection – whether neural tube defect or not– 1% NTD for women given folic acid, 3.5% for women
not given folic acid• Statistical analysis = mathematical calculations • Statistically significant result• Interpretation: Result unlikely to have arisen by
chance• Presentation??

Presentation “72% protective effect (relative risk 0.28, 95%
confidence interval 0.12-0.71)” • Relative risk = 1%/3.5% = 0.28• Confidence interval = range within which 95% certain
that ‘true’ value lies
• ‘True’ value not the same as value in sample, acknowledging uncertainty – Calculations based on what would happen if took a large number of
samples
– The central limit theorem: the sum of a large number of independent and identically-distributed random variables will be approximately normally distributed if the random variables have a finite variance

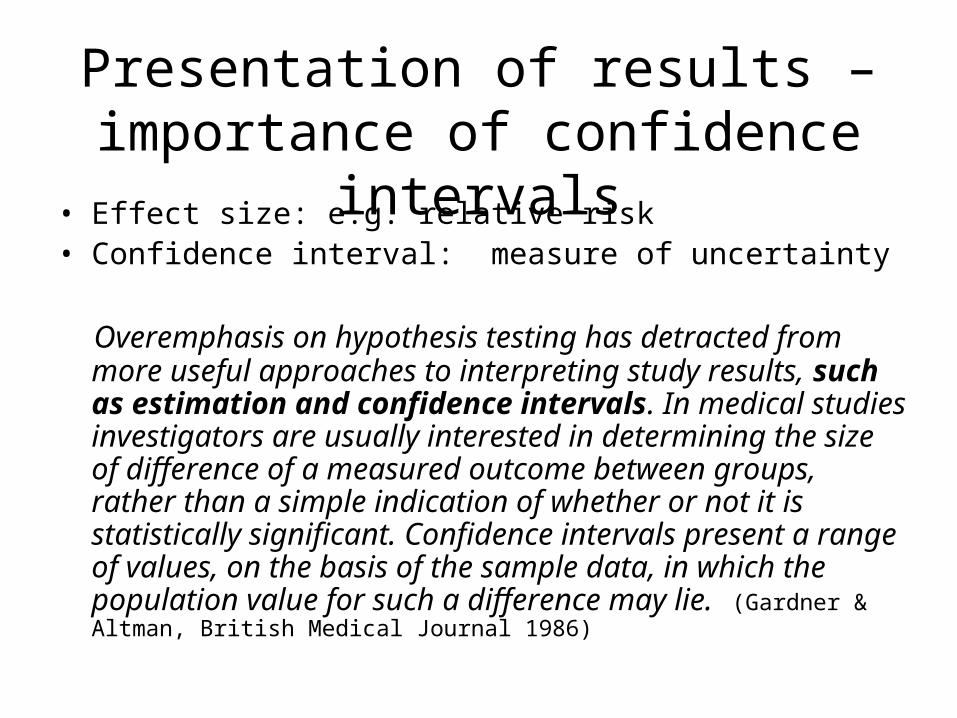
Presentation of results – importance of confidence intervals
• Effect size: e.g. relative risk• Confidence interval: measure of uncertainty
Overemphasis on hypothesis testing has detracted from more useful approaches to interpreting study results, such as estimation and confidence intervals. In medical studies investigators are usually interested in determining the size of difference of a measured outcome between groups, rather than a simple indication of whether or not it is statistically significant. Confidence intervals present a range of values, on the basis of the sample data, in which the population value for such a difference may lie. (Gardner & Altman, British Medical Journal 1986)
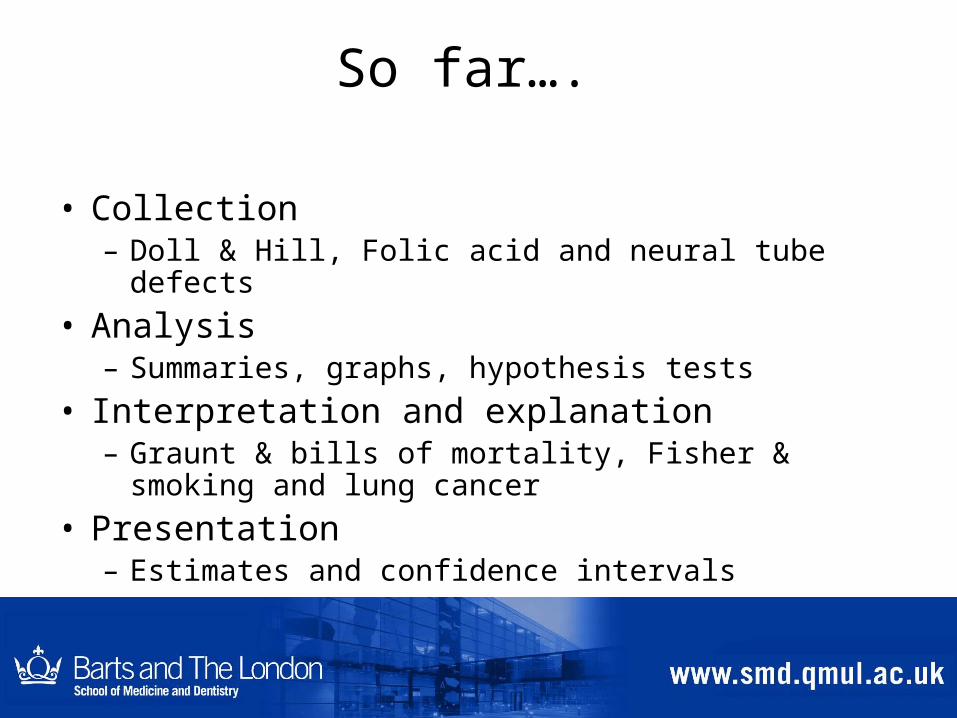
So far….
• Collection – Doll & Hill, Folic acid and neural tube defects
• Analysis – Summaries, graphs, hypothesis tests
• Interpretation and explanation – Graunt & bills of mortality, Fisher & smoking and lung
cancer
• Presentation – Estimates and confidence intervals

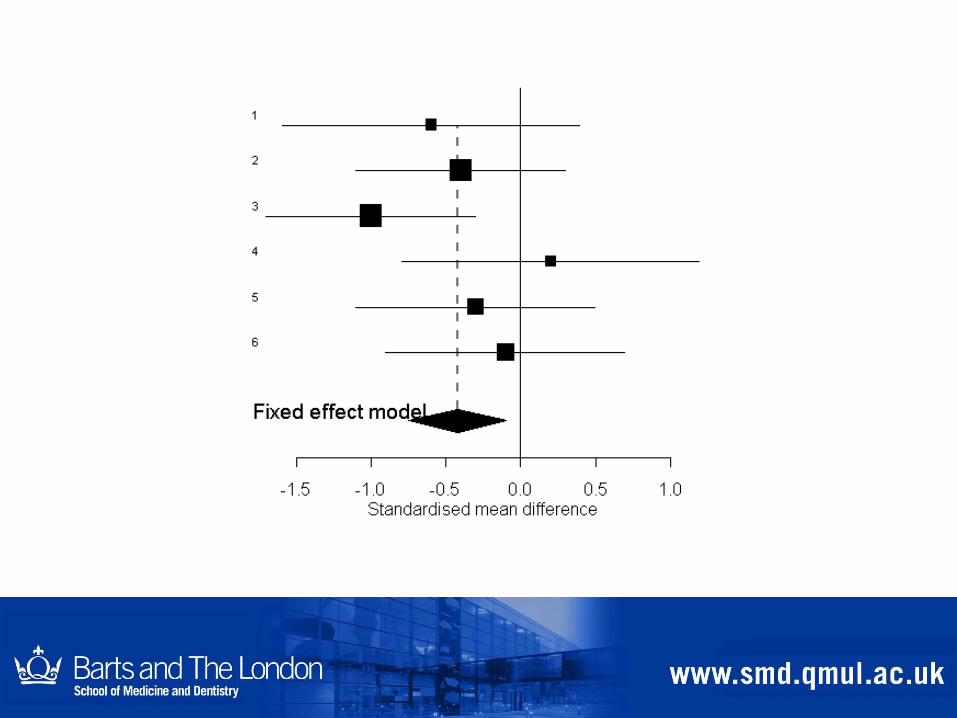
More recent developments
• Analysis, interpretation, presentation – forest plots and funnel plots
• Collection – Cluster randomised trials

Several studies looking at the same thing
• Each study may be relatively inconclusive because of too much uncertainty (being too small)
• Statistical (mathematical) method of combining results from several studies and presenting results
• Can indicate more robust results
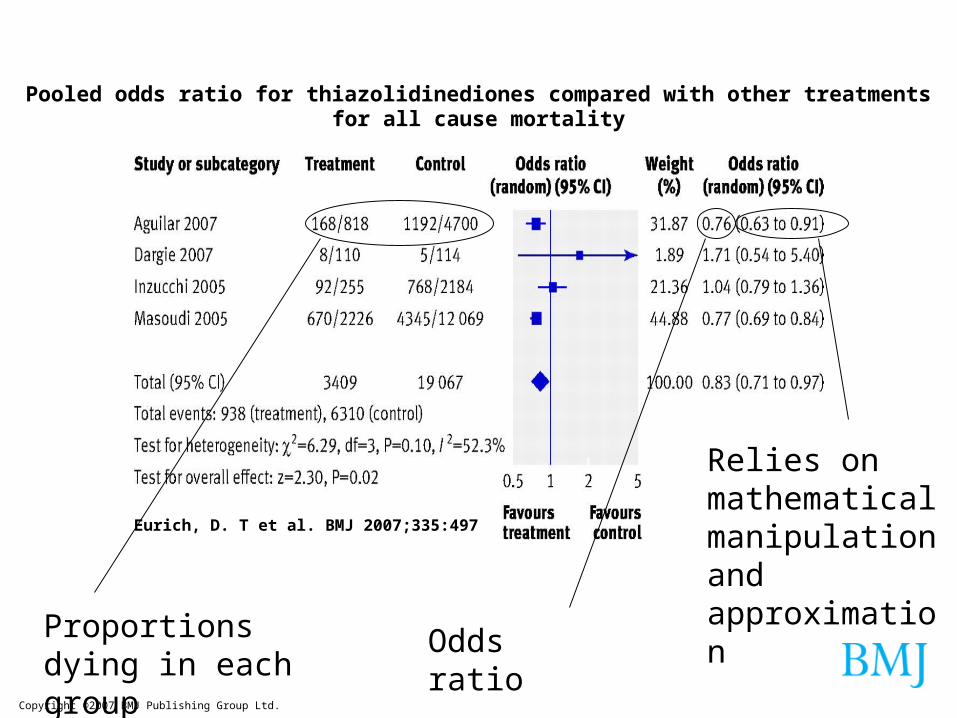
Copyright ©2007 BMJ Publishing Group Ltd.
Eurich, D. T et al. BMJ 2007;335:497
Pooled odds ratio for thiazolidinediones compared with other treatments for all cause mortality
Proportions dying in each group
Odds ratio
Relies on mathematical manipulation and approximation
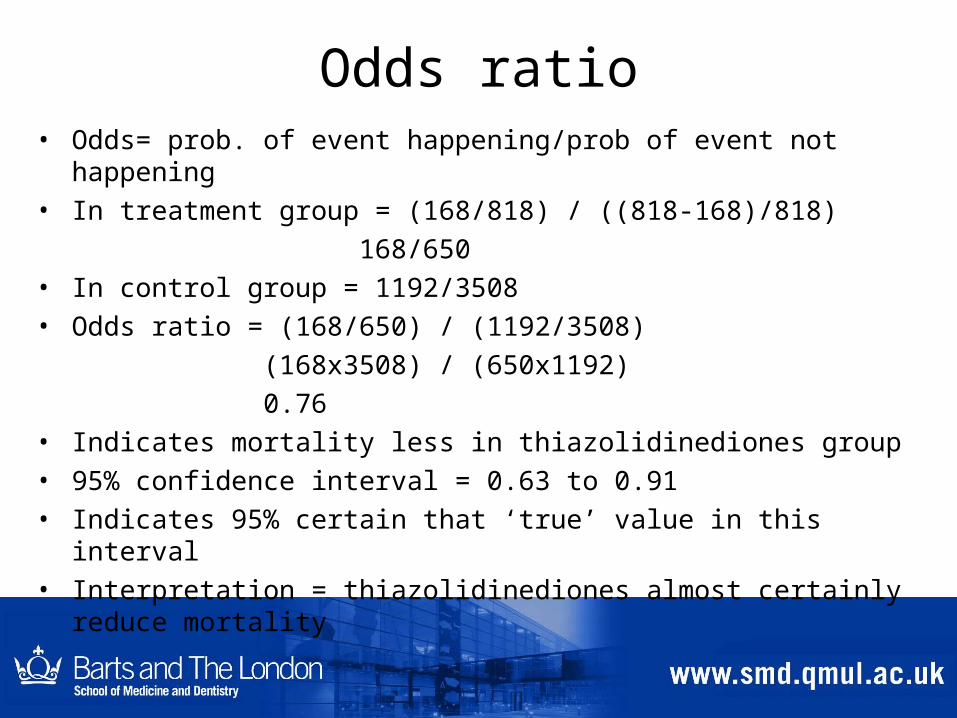
Odds ratio• Odds= prob. of event happening/prob of event not happening • In treatment group = (168/818) / ((818-168)/818)
168/650• In control group = 1192/3508• Odds ratio = (168/650) / (1192/3508)
(168x3508) / (650x1192)
0.76• Indicates mortality less in thiazolidinediones group• 95% confidence interval = 0.63 to 0.91• Indicates 95% certain that ‘true’ value in this interval• Interpretation = thiazolidinediones almost certainly reduce mortality


Comparing institutions, individual doctors and identifying outliers
• What’s the problem?– Lots of variables important
– Random variation
– Random variation greater for smaller units or institutions
• Way of presenting the values for units so that this is taken into account
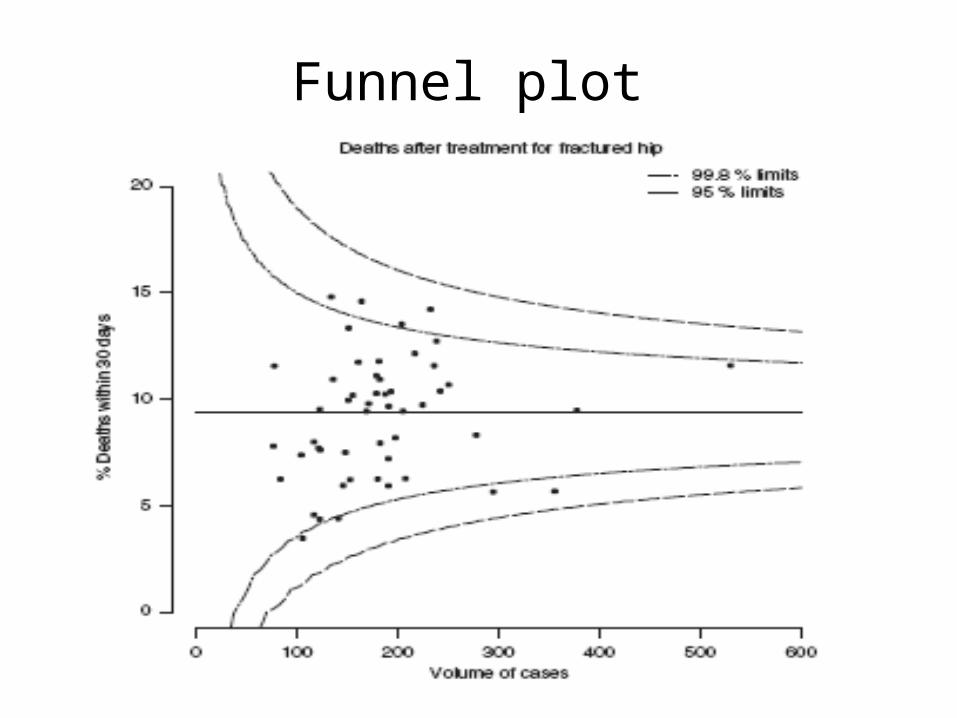
Funnel plot
Increase in chronic conditions
Trials to evaluate methods for improving the management,
treatment, symptoms, quality of life of those suffering from
Different from evaluating a drug
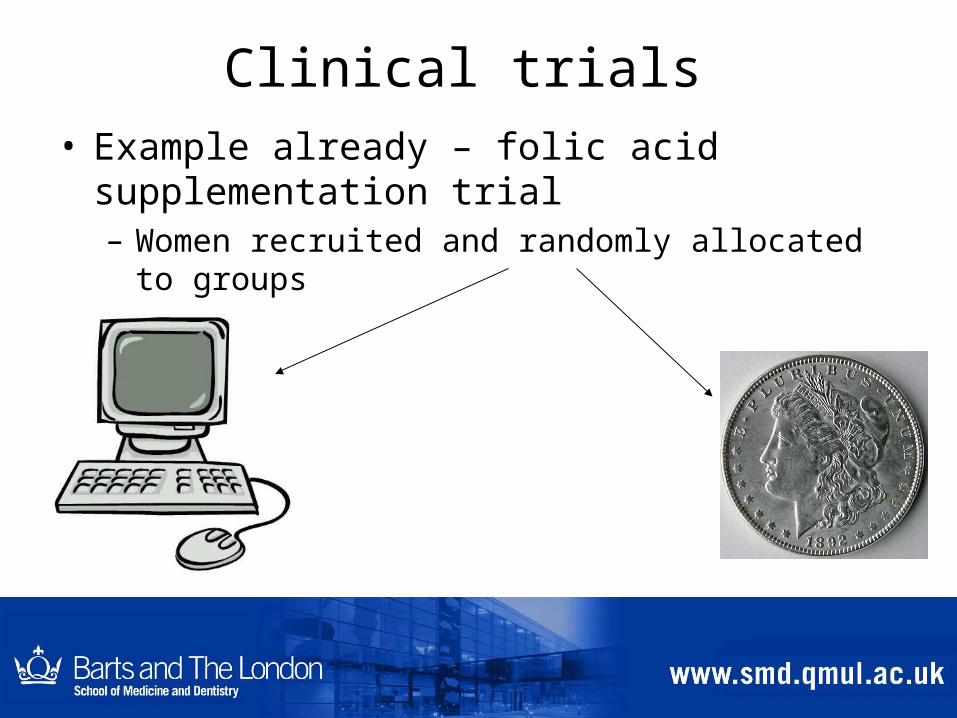
Clinical trials • Example already – folic acid supplementation
trial– Women recruited and randomly allocated to groups
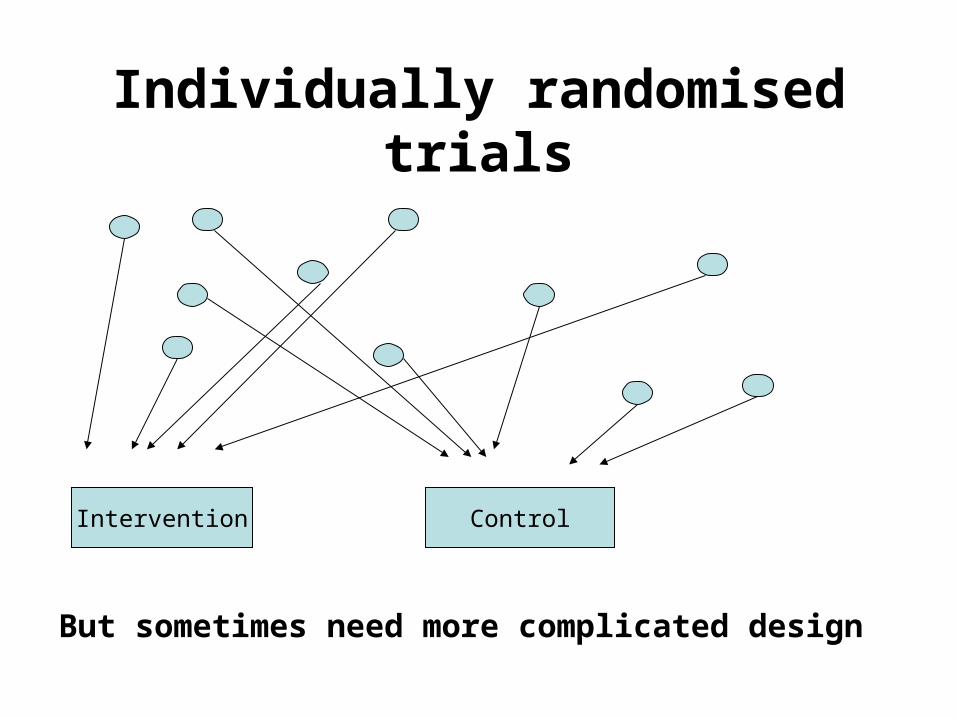
Individually randomised trials
Intervention Control
But sometimes need more complicated design
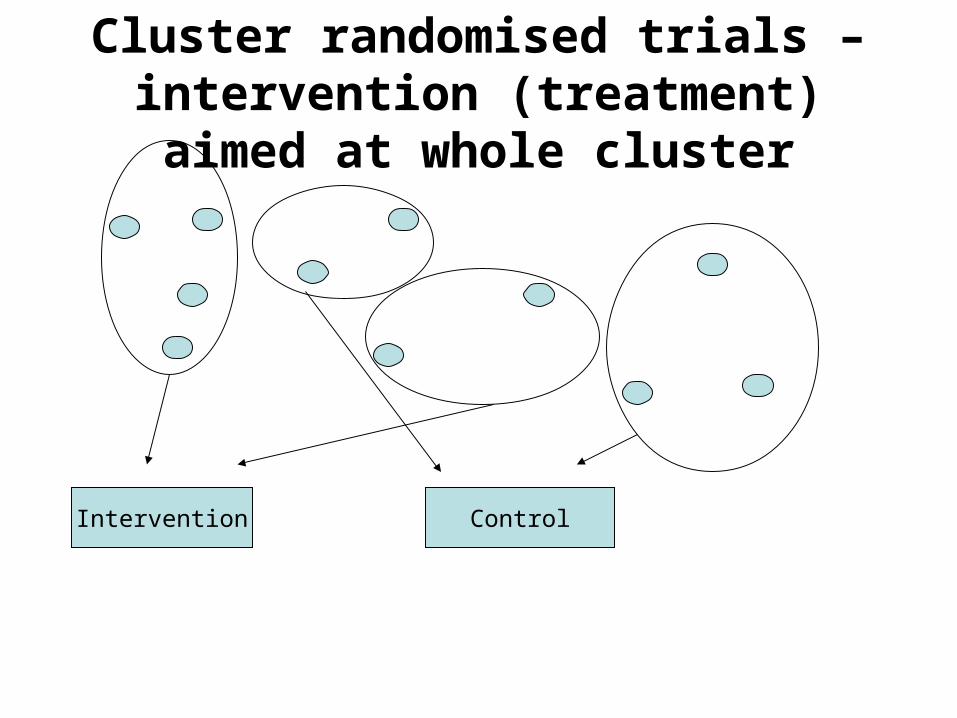
Cluster randomised trials – intervention (treatment) aimed at
whole cluster
Intervention Control
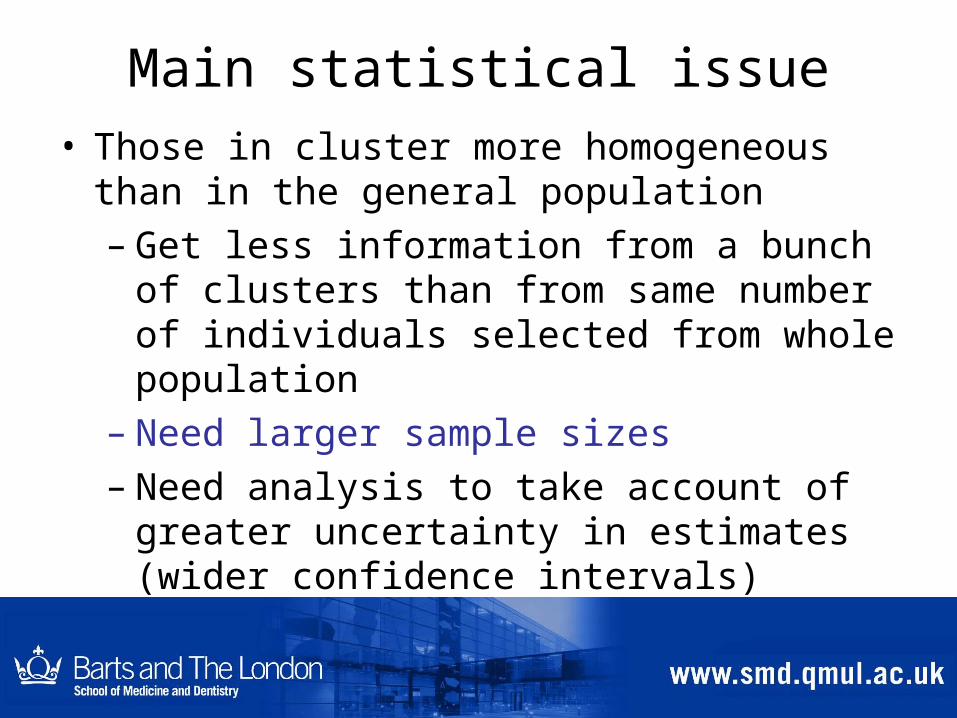
Main statistical issue• Those in cluster more homogeneous than in the
general population– Get less information from a bunch of clusters
than from same number of individuals selected from whole population
– Need larger sample sizes– Need analysis to take account of greater
uncertainty in estimates (wider confidence intervals)
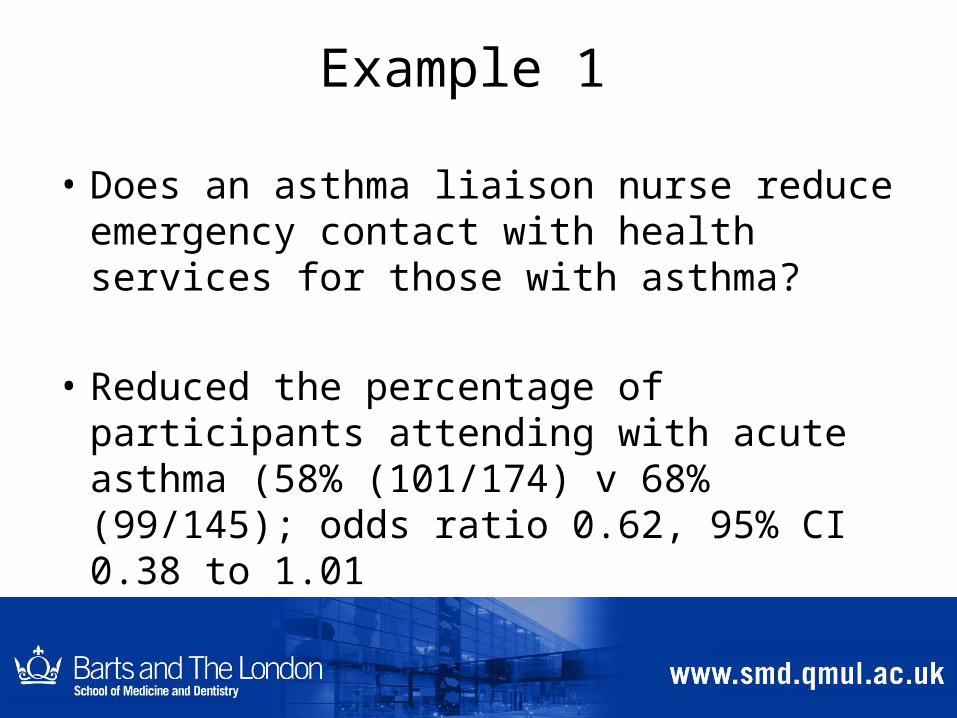
Example 1
• Does an asthma liaison nurse reduce emergency contact with health services for those with asthma?
• Reduced the percentage of participants attending with acute asthma (58% (101/174) v 68% (99/145); odds ratio 0.62, 95% CI 0.38 to 1.01
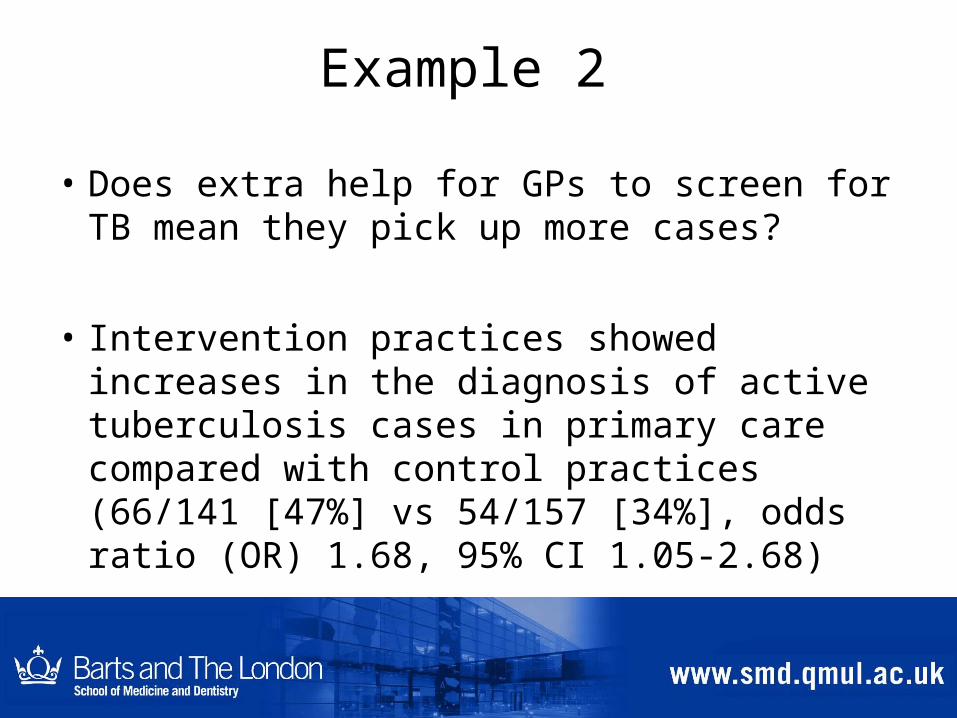
Example 2
• Does extra help for GPs to screen for TB mean they pick up more cases?
• Intervention practices showed increases in the diagnosis of active tuberculosis cases in primary care compared with control practices (66/141 [47%] vs 54/157 [34%], odds ratio (OR) 1.68, 95% CI 1.05-2.68)
Many trials are of interventions that show only very small effects
How can we design better interventions?
Developing mathematical models of
often complex interventions based on probability trees
Summary • Collection – mortality rolls & routine NHS data,
design of studies, clinical trials, cluster randomised trials
• Analysis – counting, summarising, hypothesis testing, always allowing for uncertainty
• Interpretation and explanation – John Graunt, Doll & Hill v. Fisher, Shipman & Bristol Royal Infirmary inquiries, league tables, clinical trials
• Presentation – estimates and confidence intervals to allow for uncertainty, forest plots, funnel plots
Conclusion
• As much about collection, interpretation and presentation as calculation
• Making sense out of uncertainty
• Changing techniques as times change