Embed Size (px)
Citation preview
Good Food, Good Life
Nestlé – C
orp
orate G
overnan
ce Rep
ort 2018 | C
om
pen
sation R
epo
rt 2018 | Finan
cial Statem
ents 2018
Corporate Governance Report 2018Compensation Report 2018Financial Statements 2018
Contents
1346
18222324252627
2949
51
61
6365666768707173
160166168
191193194195204206
Corporate Governance Report 2018Group structure and shareholdersCapital structureBoard of DirectorsExecutive BoardCompensation, shareholdings and loansShareholders’ participationChange of control and defence measuresAuditorsInformation policyGeneral Organization of Nestlé S.A.
Compensation Report 2018Statutory Auditor’s Report to the General Meeting
Articles of Association of Nestlé S.A.
Financial Statements 2018
Consolidated Financial Statements of the Nestlé Group 2018Principal exchange ratesConsolidated income statement for the year ended December 31, 2018Consolidated statement of comprehensive income for the year ended December 31, 2018Consolidated balance sheet as at December 31, 2018Consolidated cash flow statement for the year ended December 31, 2018Consolidated statement of changes in equity for the year ended December 31, 2018NotesStatutory Auditor’s Report – Report on the Audit of the Consolidated Financial StatementsFinancial information – 5 year reviewCompanies of the Nestlé Group, joint arrangements and associates
152nd Financial Statements of Nestlé S.A.Income statement for the year ended December 31, 2018Balance sheet as at December 31, 2018Notes to the annual accountsProposed appropriation of profitStatutory Auditor’s Report – Report on the Audit of the Financial Statements
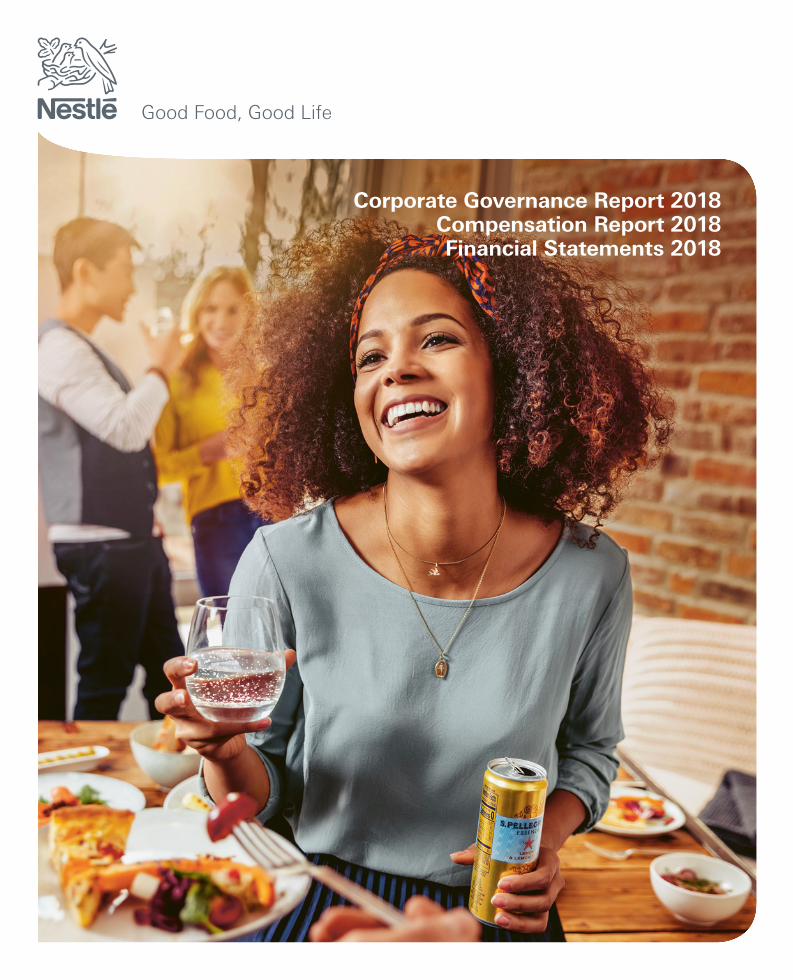
Front cover
S.Pellegrino Essenza: Capturing the consumer shift to healthy hydrationOur flagship premium waters brand is well positioned to strengthen its segment leadership with the addition of exciting fruit flavors. The new formats appeal to consumers shifting away from fruit juice and carbonated soft drinks.
Corporate Governance Report 2018 1
Corporate GovernanceReport 2018
Corporate Governance Report 20182
Situation at December 31, 2018
1. Group structure and shareholders
1.1 Group structure
1.2 Signifi cant shareholders
1.3 Cross-shareholdings
2. Capital structure
2.1 Capital
2.2 Conditional capital
2.3 Changes in capital
2.4 Shares and participation certifi cates
2.5 Dividend-right certifi cates
2.6 Limitations on transferability
and nominee registrations
2.7 Convertible bonds and options
3. Board of Directors (1)
3.1 Members of the Board of Directors
3.2 Professional background and other
activities and functions
3.3 Mandates outside Nestlé
3.4 Elections and terms of offi ce
3.5 Internal organizational structure
3.6 Defi nition of areas of responsibility
3.7 Information and control instruments
vis-à-vis the Executive Board (2)
4. Executive Board (2)
4.1 Members of the Executive Board
4.2 Professional background and other
activities and functions
4.3 Mandates outside Nestlé
4.4 Management contracts
3
4
6
18
22
23
24
25
26
27
29
51
(1) The full Board of Directors Regulations and Committee Charters are published on www.nestle.com/investors/corporate-governance/boardcommittees.
(2) The term Executive Committee, as used in the SIX Directive, is replaced by Executive Board throughout this document.
5. Compensation, shareholdings
and loans
6. Shareholders’ participation rights
6.1 Voting rights restrictions
and representation
6.2 Quorums required by the Articles
of Association
6.3 Convocation of the General Meeting
of shareholders
6.4 Inclusion of items on the agenda
6.5 Entries in the share register
7. Change of control and
defense measures
7.1 Duty to make an offer
7.2 Clauses on change of control
8. Auditors
8.1 Duration of the mandate and term
of offi ce of the lead auditor
8.2 Auditing fees
8.3 Additional fees
8.4 Information instruments pertaining
to the external audit
9. Information policy
General Organization of Nestlé S.A.
Compensation Report 2018
Articles of Association of Nestlé S.A.
Corporate Governance Report 2018 3
Group structure and shareholders
Preliminary remarks
The Nestlé Corporate Governance Report 2018 follows the
SIX Swiss Exchange Directive on Information relating to
Corporate Governance. Additional information can be found
in the Compensation Report. Nestlé S.A. complies with the
recommendations of the Swiss Code of Best Practice for
Corporate Governance, as in force at December 31, 2018.
To avoid duplication of information, cross-referencing to
other reports is made in some sections, namely the Annual
Review 2018, the Financial Statements 2018 that comprise
the Consolidated Financial Statements of the Nestlé Group
and the Financial Statements of Nestlé S.A., as well as the
Articles of Association of Nestlé S.A., whose full text can
be consulted in this report (page 51) or on:
www.nestle.com/investors/corporate-governance/articles.
The Consolidated Financial Statements of the Nestlé
Group 2018 comply with the International Financial
Reporting Standards (IFRS) issued by the International
Accounting Standards Board (IASB) and with Swiss law.
Where necessary, these disclosures have been extended
to comply with the requirements of the SIX Swiss Exchange
Directive on Financial Reporting.
1. Group structure and shareholders
1.1 Group structure
Please refer to the Annual Review 2018, page 60 for the
overview of Directors and Offi cers.
1.1.1 Description of the issuer’s operational group structure
For the general organization chart of Nestlé S.A., refer
to page 27 of this document. The Group’s Management
structure is represented in the analysis by operating
segments (refer to Note 3 of the Consolidated Financial
Statements of the Nestlé Group 2018, page 83).
1.1.2 All listed companies belonging to the issuer’s group
The registered offi ces of Nestlé S.A. are in Vevey and Cham
(Switzerland). Nestlé S.A. shares are listed on the SIX Swiss
Exchange in Switzerland (ISIN code: CH0038863350). At
December 31, 2018, the market capitalization of Nestlé S.A.
was CHF 237 363 463 000. For further information see also
page 65 of the Annual Review 2018 and visit our website on
www.nestle.com/investors.
Please refer to the Consolidated Financial Statements
of the Nestlé Group 2018, page 168, for the list of publicly
listed companies of the Nestlé Group, with an indication of
the company name, registered offi ce, share capital, place
of listing, securities’ ISIN number, their market capitalization
and the Company’s participation.
1.1.3 The non-listed companies belonging
to the issuer’s group
Please refer to the Consolidated Financial Statements of
the Nestlé Group 2018, page 168, for the enumeration
of companies of the Nestlé Group, joint arrangements
and associates, with an indication of the company name,
registered offi ce, share capital and the Company’s
participation.
Corporate Governance Report 20184
Capital structureGroup structure and shareholders
1.2 Signifi cant shareholders
BlackRock, Inc., New York, announced on August 31, 2017,
holding, directly or indirectly, 4.7% of Nestlé S.A.’s share
capital, and The Capital Group Companies, Inc., Los Angeles,
announced on October 30, 2017 holding, directly or indirectly,
3.55% of Nestlé S.A.’s share capital. Apart from the foregoing,
Nestlé S.A. is not aware of any other shareholder holding,
as at December 31, 2018, Nestlé S.A. shares in excess of 3%
of the share capital.
During 2018, the Company published on the electronic
publication platform of the SIX Swiss Exchange two
disclosure notifi cations pertaining to the holding of its own
shares. On May 30, 2018, the Company disclosed holding
3.01% of its own shares. This holding fell below the threshold
of 3% on June 25, 2018 as a consequence of the share capital
reduction by cancellation of own shares effected by the
Company.
With respect to nominees, Chase Nominees Ltd, London,
was a registered Nominee N (refer to point 2.6.3. below)
of 363 415 006 shares, i.e. 11.87% of the shares of the
Company as at December 31, 2018. At the same date,
Citibank N.A., London, as depositary for the shares
represented by American Depositary Receipts, was the
registered holder of 243 575 492 shares, i.e. 7.95% of
the shares of the Company. Also on December 31, 2018,
Nortrust Nominees Ltd, London, was a registered Nominee N
of 114 428 906 shares of the Company, representing 3.74%
of the shares.
1.3 Cross-shareholdings
The Company is not aware of cross-shareholdings
exceeding 5% of the capital or voting rights on both sides.
2. Capital structure
2.1 Capital
The ordinary share capital of Nestlé S.A. is CHF 306 300 000.
The conditional share capital is CHF 10 000 000. Nestlé S.A.
does not have any authorized share capital.
2.2 Conditional capital
The share capital may be increased (without time limitation)
in an amount not to exceed CHF 10 000 000 by issuing up
to 100 000 000 registered shares with a nominal value of
CHF 0.10 each (representing 3.26% of the currently issued
share capital) through the exercise of conversion rights
and/or option rights granted in connection with the issuance
by Nestlé or one of its subsidiaries of newly or already issued
convertible debentures, debentures with option rights or
other fi nancial market instruments. Thus the Board of
Directors has at its disposal a fl exible instrument enabling
it, if necessary, to fi nance the activities of the Company
through convertible debentures.
For a description of the group of benefi ciaries and of the
terms and conditions of the issuance of conditional capital,
refer to art. 3bis of the Articles of Association of Nestlé S.A.(*)
2.3 Changes in capital
The share capital was reduced twice in the last three
fi nancial years as a consequence of a share buy-back
program of CHF 8 billion, initiated by the Company on
August 25, 2014, and completed on December 7, 2015, and
of a further share buy-back program of up to CHF 20 billion,
launched on July 4, 2017. The resulting cancellations of
shares were approved at the 2016 and 2018 Annual General
Meetings.
On April 7, 2016, the Annual General Meeting resolved
to cancel 76 240 000 shares resulting in a reduction of the
share capital to CHF 311 216 000.
On April 12, 2018, the Annual General Meeting resolved
to reduce the share capital by 49 160 000 shares to the
present CHF 306 300 000.
For the breakdown of capital (“equity”) for 2018, 2017
and 2016 see the consolidated statement of changes in
equity in the Consolidated Financial Statements of the
Nestlé Group 2018, page 71, and 2017, page 69.
(www.nestle.com/asset-library/documents/library/
documents/fi nancial_statements/2017-fi nancial-
statements-en.pdf).
(*) Nestlé S.A.’s Articles of Association can be found on page 51 and on www.nestle.com/investors/corporate-governance/articles
Corporate Governance Report 2018 5
Capital structure
2.4 Shares and participation certifi cates
Nestlé S.A.’s capital is composed of registered shares only.
The number of registered shares with a nominal value
of CHF 0.10 each, fully paid up, was 3 063 000 000 at
December 31, 2018.
According to art. 11 par. 1 of the Articles of Association,
each share recorded in the share register as a share with
voting rights confers the right to one vote to its holder.
See also point 2.6.1 below.
Shareholders have the right to receive dividends. There
are no participation certifi cates.
2.5 Dividend-right certifi cates
There are no dividend-right certifi cates.
2.6 Limitations on transferability and nominee
registrations
2.6.1 Limitations on transferability along with an indication
of group clauses in the Articles of Association and
rules for granting exceptions
According to art. 5 par. 5 of the Articles of Association,
no person or entity shall be registered with voting rights
for more than 5% of the share capital as recorded in the
commercial register. This limitation on registration also
applies to persons who hold some or all their shares
through nominees pursuant to that article. Legal entities
that are linked to one another through capital, voting rights,
management or in any other manner, as well as all natural
persons or legal entities achieving an understanding or
forming a syndicate or otherwise acting in concert to
circumvent the regulations concerning the limitation
on registration or the nominees, shall be counted as one
person or nominee (art. 5 par. 7 of the Articles of Association).
The limitation on registration also applies to shares acquired
or subscribed by the exercise of subscription, option or
conversion rights (art. 5 par. 10 of the Articles of Association).
See also art. 5 par. 6 and par. 9 of the Articles of Association
and point 2.6.3 below.
2.6.2 Reasons for granting exceptions in the year under
review
Please refer to points 2.6.3 and 6.1.3 below.
2.6.3 Admissibility of nominee registrations, indication
of percent clauses and registration conditions
Pursuant to art. 5 par. 6 and par. 9 of the Articles of
Association, the Board of Directors has issued regulations
concerning the application of art. 5 of the Articles of
Association. The regulations on nominees set forth rules for
the entry of nominees as shareholders in the share register.
They allow the registration of:
– Nominees N (“N” as Name of benefi cial owner disclosed):
where trading and safekeeping practices make individual
registration of benefi cial owners diffi cult or impractical,
shareholders may register their holdings through
a Nominee N with voting rights, subject to the specifi c
understanding that the identity and holdings of benefi cial
owners are to be disclosed to the Company, periodically
or upon request. Voting rights of Nominees are to be
exercised on the basis of voting instructions received
from the benefi cial owners. For voting purposes, holdings
of a Nominee N, or Nominees N acting as an organized
group or pursuant to a common agreement, may not
exceed 5% of the share capital of the Company. Holdings
exceeding the 5% limit (respectively the limit fi xed by the
Board of Directors, see point 6.1.3 below) are registered
without voting rights. The responsibility for disclosure
of benefi cial owners and their holdings resides with the
nominees registered in the share register.
– Nominees A (“A” as Anonymous benefi cial owner):
registration without voting rights.
In line with its regulations, in order to facilitate trading of the
shares on the Stock Exchange, the Board of Directors has
authorized certain nominees to exceed the 5% limit to be
registered as nominees with voting rights.
2.6.4 Procedure and conditions for cancelling statutory
privileges and limitations on transferability
Please refer to point 6.1.3 below.
2.7 Convertible bonds and options
As at December 31, 2018, there are no outstanding
convertible bonds or warrants/options issued by Nestlé S.A.
or by subsidiaries on Nestlé S.A. shares. The only options
issued by Nestlé S.A. are employee options allocated under
the Nestlé Management Stock Option Plan (MSOP). Grants
under this plan were discontinued in 2013.
Corporate Governance Report 20186
Board of Directors
3. Board of Directors
3.1 Members of the Board of Directors
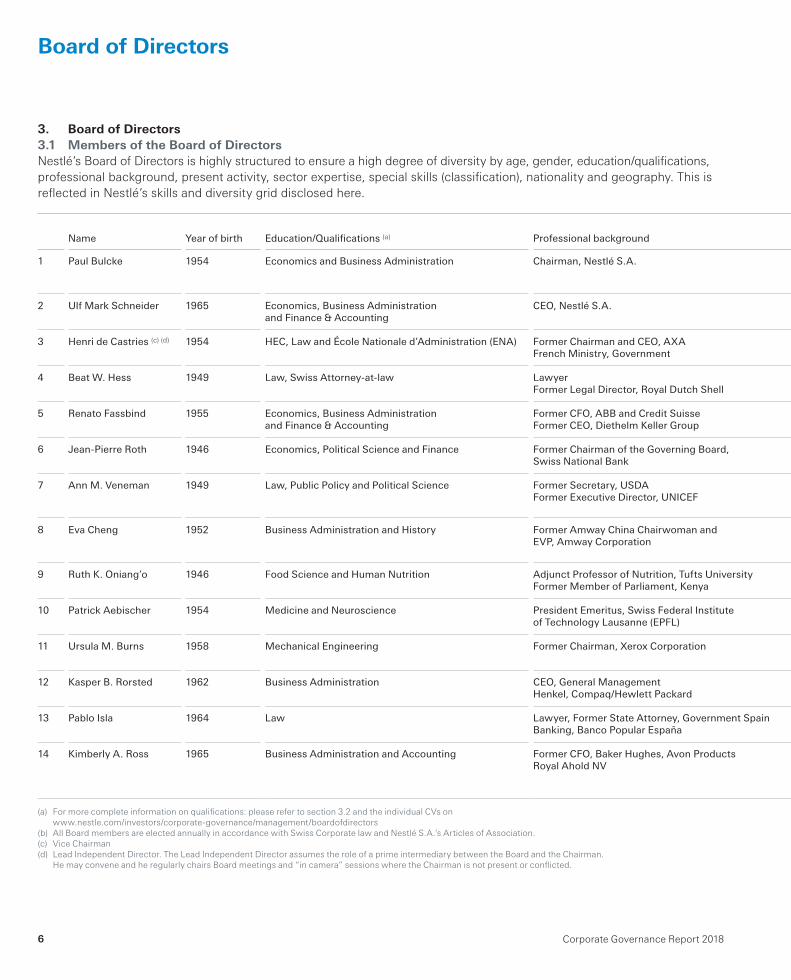
Nestlé’s Board of Directors is highly structured to ensure a high degree of diversity by age, gender, education/qualifi cations,
professional background, present activity, sector expertise, special skills (classifi cation), nationality and geography. This is
refl ected in Nestlé’s skills and diversity grid disclosed here.
Name Year of birth Education/Qualifi cations (a) Professional background
1 Paul Bulcke 1954 Economics and Business Administration Chairman, Nestlé S.A.
2 Ulf Mark Schneider 1965 Economics, Business Administrationand Finance & Accounting
CEO, Nestlé S.A.
3 Henri de Castries (c) (d) 1954 HEC, Law and École Nationale d’Administration (ENA) Former Chairman and CEO, AXA French Ministry, Government
4 Beat W. Hess 1949 Law, Swiss Attorney-at-law Lawyer Former Legal Director, Royal Dutch Shell
5 Renato Fassbind 1955 Economics, Business Administration and Finance & Accounting
Former CFO, ABB and Credit SuisseFormer CEO, Diethelm Keller Group
6 Jean-Pierre Roth 1946 Economics, Political Science and Finance Former Chairman of the Governing Board, Swiss National Bank
7 Ann M. Veneman 1949 Law, Public Policy and Political Science Former Secretary, USDAFormer Executive Director, UNICEF
8 Eva Cheng 1952 Business Administration and History Former Amway China Chairwoman and EVP, Amway Corporation
9 Ruth K. Oniang’o 1946 Food Science and Human Nutrition Adjunct Professor of Nutrition, Tufts UniversityFormer Member of Parliament, Kenya
10 Patrick Aebischer 1954 Medicine and Neuroscience President Emeritus, Swiss Federal Institute of Technology Lausanne (EPFL)
11 Ursula M. Burns 1958 Mechanical Engineering Former Chairman, Xerox Corporation
12 Kasper B. Rorsted 1962 Business Administration CEO, General ManagementHenkel, Compaq/Hewlett Packard
13 Pablo Isla 1964 Law Lawyer, Former State Attorney, Government SpainBanking, Banco Popular España
14 Kimberly A. Ross 1965 Business Administration and Accounting Former CFO, Baker Hughes, Avon ProductsRoyal Ahold NV
(a) For more complete information on qualifi cations: please refer to section 3.2 and the individual CVs on
www.nestle.com/investors/corporate-governance/management/boardofdirectors
(b) All Board members are elected annually in accordance with Swiss Corporate law and Nestlé S.A.’s Articles of Association.
(c) Vice Chairman
(d) Lead Independent Director. The Lead Independent Director assumes the role of a prime intermediary between the Board and the Chairman.
He may convene and he regularly chairs Board meetings and “in camera” sessions where the Chairman is not present or confl icted.
Corporate Governance Report 2018 7
Board of Directors
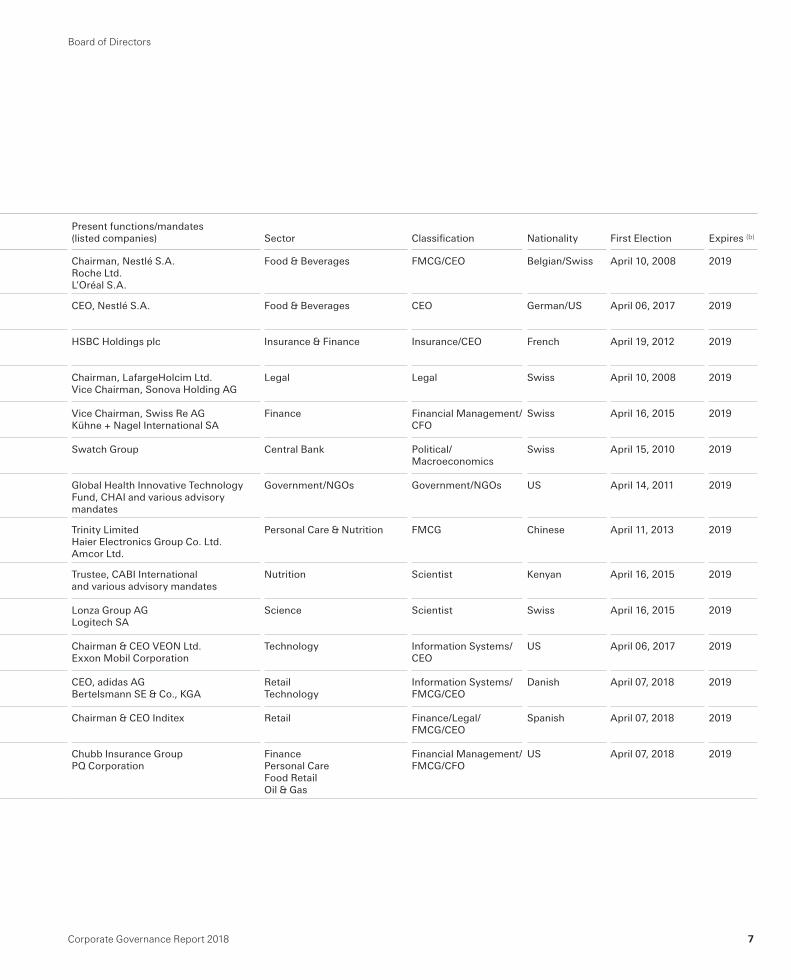
Present functions/mandates (listed companies) Sector Classifi cation Nationality First Election Expires (b)
Chairman, Nestlé S.A.Roche Ltd.L’Oréal S.A.
Food & Beverages FMCG/CEO Belgian/Swiss April 10, 2008 2019
CEO, Nestlé S.A. Food & Beverages CEO German/US April 06, 2017 2019
HSBC Holdings plc Insurance & Finance Insurance/CEO French April 19, 2012 2019
Chairman, LafargeHolcim Ltd. Vice Chairman, Sonova Holding AG
Legal Legal Swiss April 10, 2008 2019
Vice Chairman, Swiss Re AG Kühne + Nagel International SA
Finance Financial Management/CFO
Swiss April 16, 2015 2019
Swatch Group Central Bank Political/ Macroeconomics
Swiss April 15, 2010 2019
Global Health Innovative Technology Fund, CHAI and various advisory mandates
Government/NGOs Government/NGOs US April 14, 2011 2019
Trinity Limited Haier Electronics Group Co. Ltd. Amcor Ltd.
Personal Care & Nutrition FMCG Chinese April 11, 2013 2019
Trustee, CABI International and various advisory mandates
Nutrition Scientist Kenyan April 16, 2015 2019
Lonza Group AGLogitech SA
Science Scientist Swiss April 16, 2015 2019
Chairman & CEO VEON Ltd. Exxon Mobil Corporation
Technology Information Systems/CEO
US April 06, 2017 2019
CEO, adidas AGBertelsmann SE & Co., KGA
RetailTechnology
Information Systems/FMCG/CEO
Danish April 07, 2018 2019
Chairman & CEO Inditex Retail Finance/Legal/FMCG/CEO
Spanish April 07, 2018 2019
Chubb Insurance GroupPQ Corporation
FinancePersonal CareFood RetailOil & Gas
Financial Management/FMCG/CFO
US April 07, 2018 2019
Corporate Governance Report 20188
Board of Directors
Board diversity
The working guidelines used for the selection of new Board
members state that the Board of Directors should at all
times be well-balanced, including with respect to Swiss and
non-Swiss nationals, the members’ individual experiences,
expertise, competencies and personal attributes (so as
to support regular succession planning for the Board
as a whole and for its various Committees).
The Nomination and Sustainability Committee shall
periodically review the composition of the Board using
various criteria, including, without limitation:
– the Board’s cumulative experience and expertise in
(international) business leadership, legal/compliance/risk
management, science, fi nance, marketing, IT, technology,
government/politics and other relevant fi elds;
– diversity of competencies including education, function,
industry and geographic business experience;
– the Board’s diversity of personal attributes including
gender, age, nationality, culture and leadership approach.
The Board should at all times be composed of:
– a majority of independent members; and
– members with the specifi c abilities or skills to serve
on one or more of the various Board Committees.
3.1.1 Management tasks of the members
of the Board of Directors
With the exception of Ulf Mark Schneider, all members
of the Board of Directors are non-executive members.
Paul Bulcke is active Chairman and has certain responsibilities
for the direction and control of the Group including Nestlé
Health Science S.A., Nestlé Skin Health S.A. and Nestlé’s
engagement with L’Oréal.
3.1.2 Information on non-executive members
of the Board of Directors
With the exception of Paul Bulcke, all non-executive
members of the Board of Directors are independent, were
not previously members of the Nestlé management and
have no important business connections with Nestlé.
Pursuant to Nestlé’s Board Regulations, a Director shall
be considered independent, if he/she is not and has not
been employed as an executive offi cer at the Company or
any of its principal subsidiaries or as employee or affi liate
of the Group’s external auditor for the past three years and
does not maintain, in the sole determination of the Board,
a material direct or indirect business relationship with
the Company or any of its subsidiaries. Directors with
immediate family members who would not qualify as
independent shall not be considered independent, subject
to a three-year cooling-off period.
Nestlé’s succession planning process is highly structured
and managed by the Board’s Nomination and Sustainability
Committee with the support of outside consultants when
necessary.
Subject to specifi c exceptions granted by the Board,
members are subject to twelve-year term limits. According
to Nestlé’s Board Regulations (a), an age limit of 72 years
applies. This allows for continuous refreshment and long-
term succession planning according to Nestlé’s skills and
diversity grid.
3.1.3 Cross-involvement
None.
(a) Nestlé S.A.’s Board Regulations can be found on www.nestle.com/investors/corporate-governance/boardcommittees
Corporate Governance Report 2018 9
Board of Directors
3.2 Professional background and other activities
and functions (*)
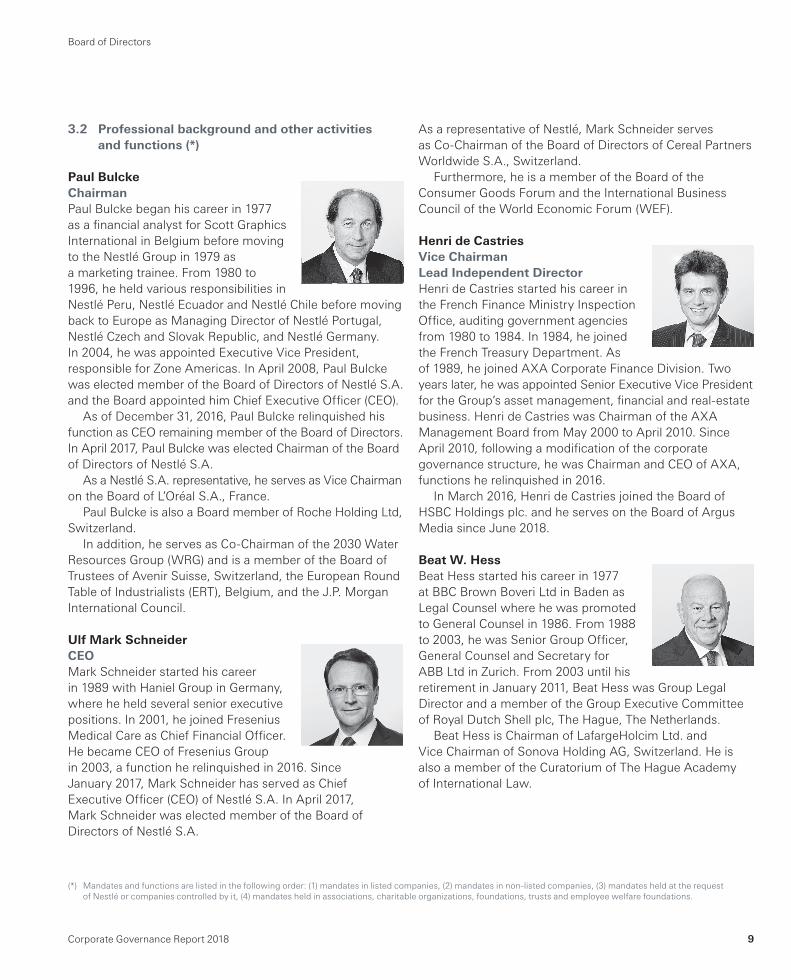
Paul Bulcke
Chairman
Paul Bulcke began his career in 1977
as a fi nancial analyst for Scott Graphics
International in Belgium before moving
to the Nestlé Group in 1979 as
a marketing trainee. From 1980 to
1996, he held various responsibilities in
Nestlé Peru, Nestlé Ecuador and Nestlé Chile before moving
back to Europe as Managing Director of Nestlé Portugal,
Nestlé Czech and Slovak Republic, and Nestlé Germany.
In 2004, he was appointed Executive Vice President,
responsible for Zone Americas. In April 2008, Paul Bulcke
was elected member of the Board of Directors of Nestlé S.A.
and the Board appointed him Chief Executive Offi cer (CEO).
As of December 31, 2016, Paul Bulcke relinquished his
function as CEO remaining member of the Board of Directors.
In April 2017, Paul Bulcke was elected Chairman of the Board
of Directors of Nestlé S.A.
As a Nestlé S.A. representative, he serves as Vice Chairman
on the Board of L’Oréal S.A., France.
Paul Bulcke is also a Board member of Roche Holding Ltd,
Switzerland.
In addition, he serves as Co-Chairman of the 2030 Water
Resources Group (WRG) and is a member of the Board of
Trustees of Avenir Suisse, Switzerland, the European Round
Table of Industrialists (ERT), Belgium, and the J.P. Morgan
International Council.
Ulf Mark Schneider
CEO
Mark Schneider started his career
in 1989 with Haniel Group in Germany,
where he held several senior executive
positions. In 2001, he joined Fresenius
Medical Care as Chief Financial Offi cer.
He became CEO of Fresenius Group
in 2003, a function he relinquished in 2016. Since
January 2017, Mark Schneider has served as Chief
Executive Offi cer (CEO) of Nestlé S.A. In April 2017,
Mark Schneider was elected member of the Board of
Directors of Nestlé S.A.
As a representative of Nestlé, Mark Schneider serves
as Co-Chairman of the Board of Directors of Cereal Partners
Worldwide S.A., Switzerland.
Furthermore, he is a member of the Board of the
Consumer Goods Forum and the International Business
Council of the World Economic Forum (WEF).
Henri de Castries
Vice Chairman
Lead Independent Director
Henri de Castries started his career in
the French Finance Ministry Inspection
Offi ce, auditing government agencies
from 1980 to 1984. In 1984, he joined
the French Treasury Department. As
of 1989, he joined AXA Corporate Finance Division. Two
years later, he was appointed Senior Executive Vice President
for the Group’s asset management, fi nancial and real-estate
business. Henri de Castries was Chairman of the AXA
Management Board from May 2000 to April 2010. Since
April 2010, following a modifi cation of the corporate
governance structure, he was Chairman and CEO of AXA,
functions he relinquished in 2016.
In March 2016, Henri de Castries joined the Board of
HSBC Holdings plc. and he serves on the Board of Argus
Media since June 2018.
Beat W. Hess
Beat Hess started his career in 1977
at BBC Brown Boveri Ltd in Baden as
Legal Counsel where he was promoted
to General Counsel in 1986. From 1988
to 2003, he was Senior Group Offi cer,
General Counsel and Secretary for
ABB Ltd in Zurich. From 2003 until his
retirement in January 2011, Beat Hess was Group Legal
Director and a member of the Group Executive Committee
of Royal Dutch Shell plc, The Hague, The Netherlands.
Beat Hess is Chairman of LafargeHolcim Ltd. and
Vice Chairman of Sonova Holding AG, Switzerland. He is
also a member of the Curatorium of The Hague Academy
of International Law.
(*) Mandates and functions are listed in the following order: (1) mandates in listed companies, (2) mandates in non-listed companies, (3) mandates held at the request
of Nestlé or companies controlled by it, (4) mandates held in associations, charitable organizations, foundations, trusts and employee welfare foundations.
Corporate Governance Report 201810
Board of Directors
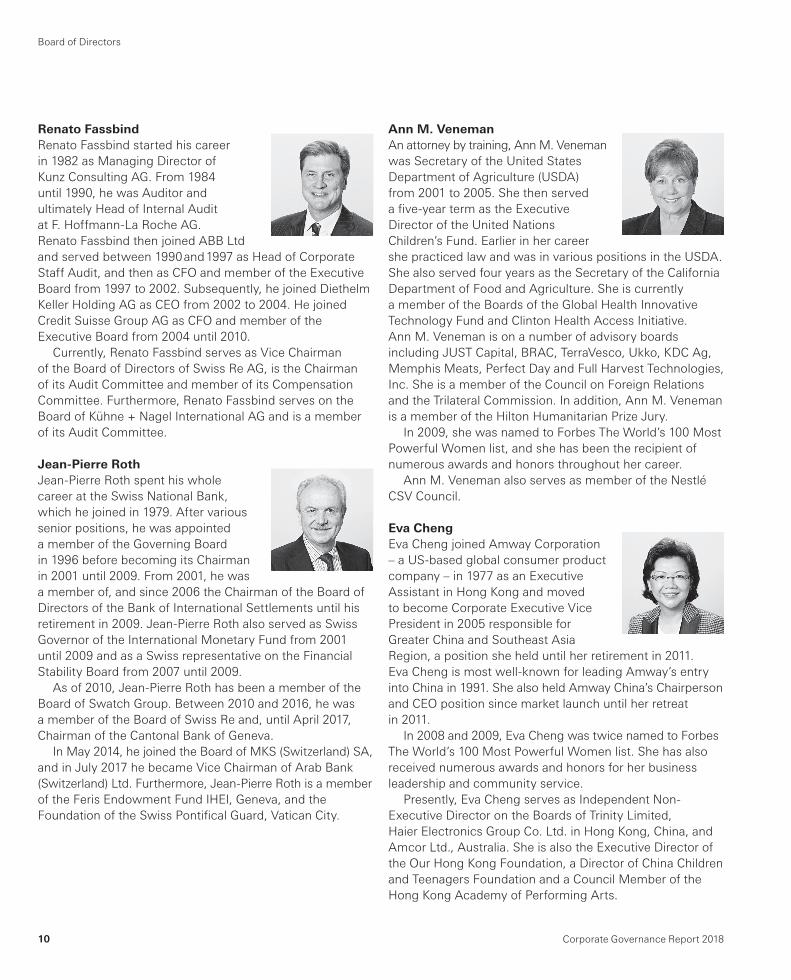
Renato Fassbind
Renato Fassbind started his career
in 1982 as Managing Director of
Kunz Consulting AG. From 1984
until 1990, he was Auditor and
ultimately Head of Internal Audit
at F. Hoffmann-La Roche AG.
Renato Fassbind then joined ABB Ltd
and served between 1990 and 1997 as Head of Corporate
Staff Audit, and then as CFO and member of the Executive
Board from 1997 to 2002. Subsequently, he joined Diethelm
Keller Holding AG as CEO from 2002 to 2004. He joined
Credit Suisse Group AG as CFO and member of the
Executive Board from 2004 until 2010.
Currently, Renato Fassbind serves as Vice Chairman
of the Board of Directors of Swiss Re AG, is the Chairman
of its Audit Committee and member of its Compensation
Committee. Furthermore, Renato Fassbind serves on the
Board of Kühne + Nagel International AG and is a member
of its Audit Committee.
Jean-Pierre Roth
Jean-Pierre Roth spent his whole
career at the Swiss National Bank,
which he joined in 1979. After various
senior positions, he was appointed
a member of the Governing Board
in 1996 before becoming its Chairman
in 2001 until 2009. From 2001, he was
a member of, and since 2006 the Chairman of the Board of
Directors of the Bank of International Settlements until his
retirement in 2009. Jean-Pierre Roth also served as Swiss
Governor of the International Monetary Fund from 2001
until 2009 and as a Swiss representative on the Financial
Stability Board from 2007 until 2009.
As of 2010, Jean-Pierre Roth has been a member of the
Board of Swatch Group. Between 2010 and 2016, he was
a member of the Board of Swiss Re and, until April 2017,
Chairman of the Cantonal Bank of Geneva.
In May 2014, he joined the Board of MKS (Switzerland) SA,
and in July 2017 he became Vice Chairman of Arab Bank
(Switzerland) Ltd. Furthermore, Jean-Pierre Roth is a member
of the Feris Endowment Fund IHEI, Geneva, and the
Foundation of the Swiss Pontifi cal Guard, Vatican City.
Ann M. Veneman
An attorney by training, Ann M. Veneman
was Secretary of the United States
Department of Agriculture (USDA)
from 2001 to 2005. She then served
a fi ve-year term as the Executive
Director of the United Nations
Children’s Fund. Earlier in her career
she practiced law and was in various positions in the USDA.
She also served four years as the Secretary of the California
Department of Food and Agriculture. She is currently
a member of the Boards of the Global Health Innovative
Technology Fund and Clinton Health Access Initiative.
Ann M. Veneman is on a number of advisory boards
including JUST Capital, BRAC, TerraVesco, Ukko, KDC Ag,
Memphis Meats, Perfect Day and Full Harvest Technologies,
Inc. She is a member of the Council on Foreign Relations
and the Trilateral Commission. In addition, Ann M. Veneman
is a member of the Hilton Humanitarian Prize Jury.
In 2009, she was named to Forbes The World’s 100 Most
Powerful Women list, and she has been the recipient of
numerous awards and honors throughout her career.
Ann M. Veneman also serves as member of the Nestlé
CSV Council.
Eva Cheng
Eva Cheng joined Amway Corporation
– a US-based global consumer product
company – in 1977 as an Executive
Assistant in Hong Kong and moved
to become Corporate Executive Vice
President in 2005 responsible for
Greater China and Southeast Asia
Region, a position she held until her retirement in 2011.
Eva Cheng is most well-known for leading Amway’s entry
into China in 1991. She also held Amway China’s Chairperson
and CEO position since market launch until her retreat
in 2011.
In 2008 and 2009, Eva Cheng was twice named to Forbes
The World’s 100 Most Powerful Women list. She has also
received numerous awards and honors for her business
leadership and community service.
Presently, Eva Cheng serves as Independent Non-
Executive Director on the Boards of Trinity Limited,
Haier Electronics Group Co. Ltd. in Hong Kong, China, and
Amcor Ltd., Australia. She is also the Executive Director of
the Our Hong Kong Foundation, a Director of China Children
and Teenagers Foundation and a Council Member of the
Hong Kong Academy of Performing Arts.
Corporate Governance Report 2018 11
Board of Directors
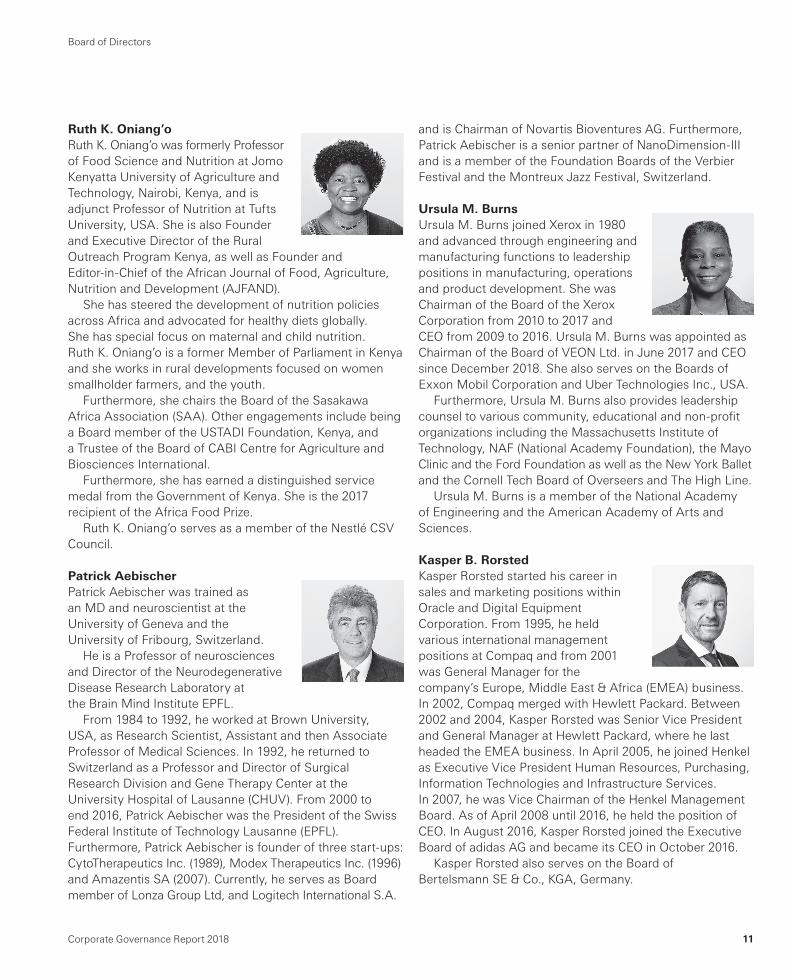
Ruth K. Oniang’o
Ruth K. Oniang’o was formerly Professor
of Food Science and Nutrition at Jomo
Kenyatta University of Agriculture and
Technology, Nairobi, Kenya, and is
adjunct Professor of Nutrition at Tufts
University, USA. She is also Founder
and Executive Director of the Rural
Outreach Program Kenya, as well as Founder and
Editor-in-Chief of the African Journal of Food, Agriculture,
Nutrition and Development (AJFAND).
She has steered the development of nutrition policies
across Africa and advocated for healthy diets globally.
She has special focus on maternal and child nutrition.
Ruth K. Oniang’o is a former Member of Parliament in Kenya
and she works in rural developments focused on women
smallholder farmers, and the youth.
Furthermore, she chairs the Board of the Sasakawa
Africa Association (SAA). Other engagements include being
a Board member of the USTADI Foundation, Kenya, and
a Trustee of the Board of CABI Centre for Agriculture and
Biosciences International.
Furthermore, she has earned a distinguished service
medal from the Government of Kenya. She is the 2017
recipient of the Africa Food Prize.
Ruth K. Oniang’o serves as a member of the Nestlé CSV
Council.
Patrick Aebischer
Patrick Aebischer was trained as
an MD and neuroscientist at the
University of Geneva and the
University of Fribourg, Switzerland.
He is a Professor of neurosciences
and Director of the Neurodegenerative
Disease Research Laboratory at
the Brain Mind Institute EPFL.
From 1984 to 1992, he worked at Brown University,
USA, as Research Scientist, Assistant and then Associate
Professor of Medical Sciences. In 1992, he returned to
Switzerland as a Professor and Director of Surgical
Research Division and Gene Therapy Center at the
University Hospital of Lausanne (CHUV). From 2000 to
end 2016, Patrick Aebischer was the President of the Swiss
Federal Institute of Technology Lausanne (EPFL).
Furthermore, Patrick Aebischer is founder of three start-ups:
CytoTherapeutics Inc. (1989), Modex Therapeutics Inc. (1996)
and Amazentis SA (2007). Currently, he serves as Board
member of Lonza Group Ltd, and Logitech International S.A.
and is Chairman of Novartis Bioventures AG. Furthermore,
Patrick Aebischer is a senior partner of NanoDimension-III
and is a member of the Foundation Boards of the Verbier
Festival and the Montreux Jazz Festival, Switzerland.
Ursula M. Burns
Ursula M. Burns joined Xerox in 1980
and advanced through engineering and
manufacturing functions to leadership
positions in manufacturing, operations
and product development. She was
Chairman of the Board of the Xerox
Corporation from 2010 to 2017 and
CEO from 2009 to 2016. Ursula M. Burns was appointed as
Chairman of the Board of VEON Ltd. in June 2017 and CEO
since December 2018. She also serves on the Boards of
Exxon Mobil Corporation and Uber Technologies Inc., USA.
Furthermore, Ursula M. Burns also provides leadership
counsel to various community, educational and non-profi t
organizations including the Massachusetts Institute of
Technology, NAF (National Academy Foundation), the Mayo
Clinic and the Ford Foundation as well as the New York Ballet
and the Cornell Tech Board of Overseers and The High Line.
Ursula M. Burns is a member of the National Academy
of Engineering and the American Academy of Arts and
Sciences.
Kasper B. Rorsted
Kasper Rorsted started his career in
sales and marketing positions within
Oracle and Digital Equipment
Corporation. From 1995, he held
various international management
positions at Compaq and from 2001
was General Manager for the
company’s Europe, Middle East & Africa (EMEA) business.
In 2002, Compaq merged with Hewlett Packard. Between
2002 and 2004, Kasper Rorsted was Senior Vice President
and General Manager at Hewlett Packard, where he last
headed the EMEA business. In April 2005, he joined Henkel
as Executive Vice President Human Resources, Purchasing,
Information Technologies and Infrastructure Services.
In 2007, he was Vice Chairman of the Henkel Management
Board. As of April 2008 until 2016, he held the position of
CEO. In August 2016, Kasper Rorsted joined the Executive
Board of adidas AG and became its CEO in October 2016.
Kasper Rorsted also serves on the Board of
Bertelsmann SE & Co., KGA, Germany.
Corporate Governance Report 201812
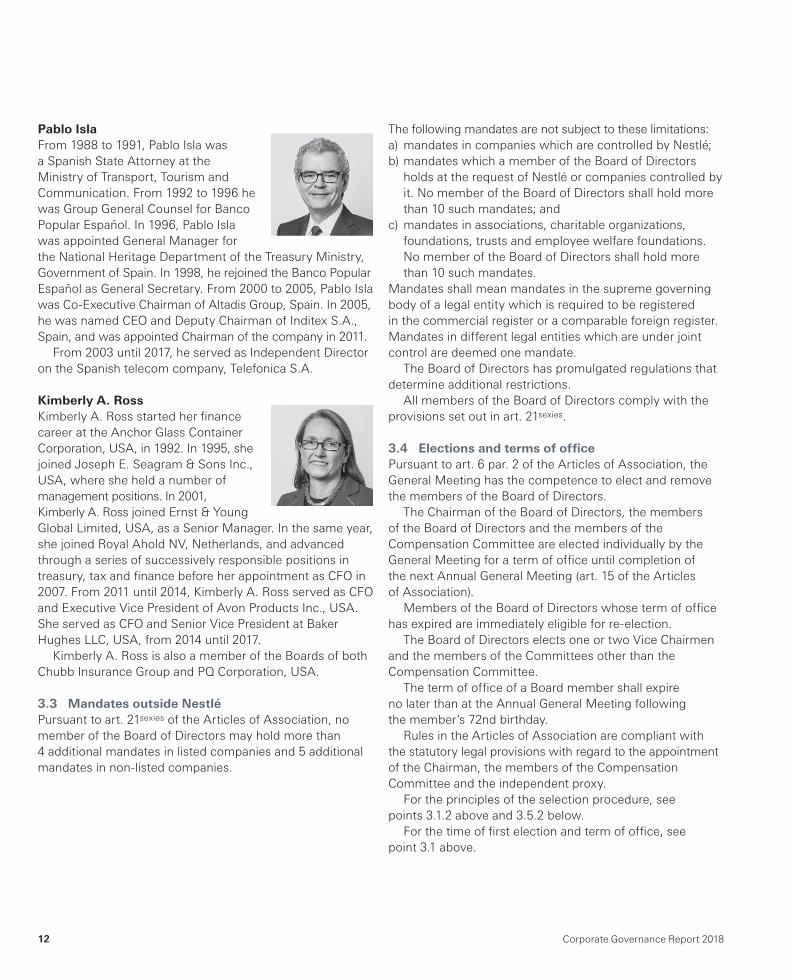
Pablo Isla
From 1988 to 1991, Pablo Isla was
a Spanish State Attorney at the
Ministry of Transport, Tourism and
Communication. From 1992 to 1996 he
was Group General Counsel for Banco
Popular Español. In 1996, Pablo Isla
was appointed General Manager for
the National Heritage Department of the Treasury Ministry,
Government of Spain. In 1998, he rejoined the Banco Popular
Español as General Secretary. From 2000 to 2005, Pablo Isla
was Co-Executive Chairman of Altadis Group, Spain. In 2005,
he was named CEO and Deputy Chairman of Inditex S.A.,
Spain, and was appointed Chairman of the company in 2011.
From 2003 until 2017, he served as Independent Director
on the Spanish telecom company, Telefonica S.A.
Kimberly A. Ross
Kimberly A. Ross started her fi nance
career at the Anchor Glass Container
Corporation, USA, in 1992. In 1995, she
joined Joseph E. Seagram & Sons Inc.,
USA, where she held a number of
management positions. In 2001,
Kimberly A. Ross joined Ernst & Young
Global Limited, USA, as a Senior Manager. In the same year,
she joined Royal Ahold NV, Netherlands, and advanced
through a series of successively responsible positions in
treasury, tax and fi nance before her appointment as CFO in
2007. From 2011 until 2014, Kimberly A. Ross served as CFO
and Executive Vice President of Avon Products Inc., USA.
She served as CFO and Senior Vice President at Baker
Hughes LLC, USA, from 2014 until 2017.
Kimberly A. Ross is also a member of the Boards of both
Chubb Insurance Group and PQ Corporation, USA.
3.3 Mandates outside Nestlé
Pursuant to art. 21sexies of the Articles of Association, no
member of the Board of Directors may hold more than
4 additional mandates in listed companies and 5 additional
mandates in non-listed companies.
The following mandates are not subject to these limitations:
a) mandates in companies which are controlled by Nestlé;
b) mandates which a member of the Board of Directors
holds at the request of Nestlé or companies controlled by
it. No member of the Board of Directors shall hold more
than 10 such mandates; and
c) mandates in associations, charitable organizations,
foundations, trusts and employee welfare foundations.
No member of the Board of Directors shall hold more
than 10 such mandates.
Mandates shall mean mandates in the supreme governing
body of a legal entity which is required to be registered
in the commercial register or a comparable foreign register.
Mandates in different legal entities which are under joint
control are deemed one mandate.
The Board of Directors has promulgated regulations that
determine additional restrictions.
All members of the Board of Directors comply with the
provisions set out in art. 21sexies.
3.4 Elections and terms of offi ce
Pursuant to art. 6 par. 2 of the Articles of Association, the
General Meeting has the competence to elect and remove
the members of the Board of Directors.
The Chairman of the Board of Directors, the members
of the Board of Directors and the members of the
Compensation Committee are elected individually by the
General Meeting for a term of offi ce until completion of
the next Annual General Meeting (art. 15 of the Articles
of Association).
Members of the Board of Directors whose term of offi ce
has expired are immediately eligible for re-election.
The Board of Directors elects one or two Vice Chairmen
and the members of the Committees other than the
Compensation Committee.
The term of offi ce of a Board member shall expire
no later than at the Annual General Meeting following
the member’s 72nd birthday.
Rules in the Articles of Association are compliant with
the statutory legal provisions with regard to the appointment
of the Chairman, the members of the Compensation
Committee and the independent proxy.
For the principles of the selection procedure, see
points 3.1.2 above and 3.5.2 below.
For the time of fi rst election and term of offi ce, see
point 3.1 above.
Corporate Governance Report 2018 13
Board of Directors
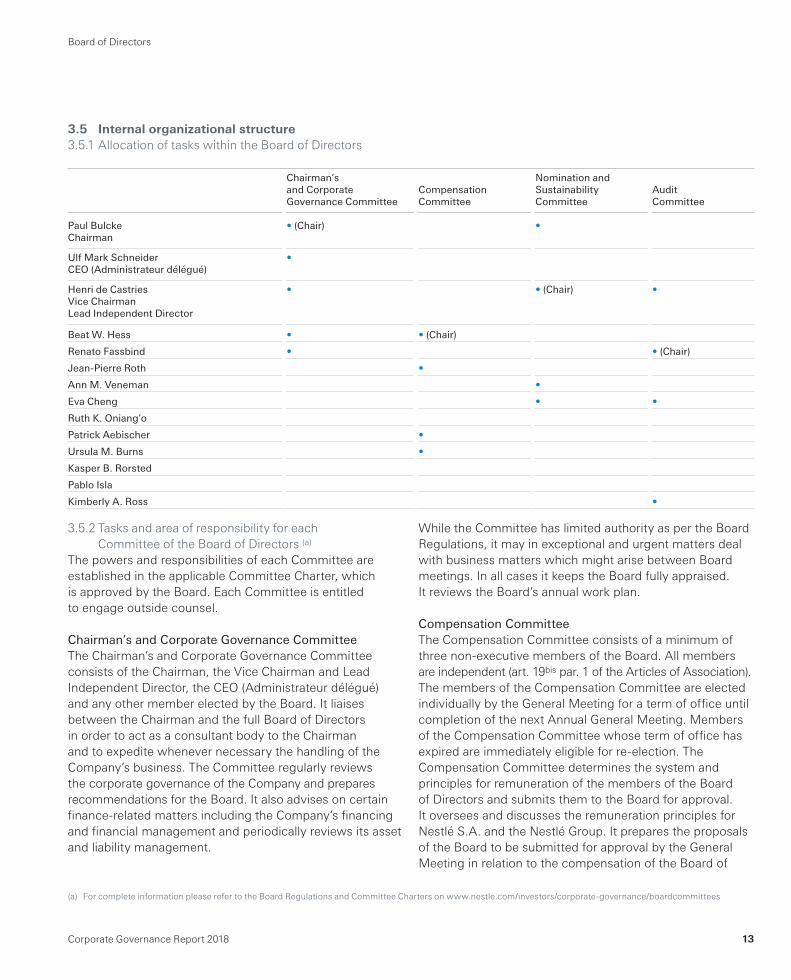
3.5 Internal organizational structure
3.5.1 Allocation of tasks within the Board of Directors
Chairman’s Nomination and and Corporate Compensation Sustainability Audit Governance Committee Committee Committee Committee
Paul Bulcke • (Chair) •Chairman
Ulf Mark Schneider •CEO (Administrateur délégué)
Henri de Castries • • (Chair) •Vice ChairmanLead Independent Director
Beat W. Hess • • (Chair)
Renato Fassbind • • (Chair)
Jean-Pierre Roth •
Ann M. Veneman •
Eva Cheng • •
Ruth K. Oniang’o
Patrick Aebischer •
Ursula M. Burns •
Kasper B. Rorsted
Pablo Isla
Kimberly A. Ross •
3.5.2 Tasks and area of responsibility for each
Committee of the Board of Directors (a)
The powers and responsibilities of each Committee are
established in the applicable Committee Charter, which
is approved by the Board. Each Committee is entitled
to engage outside counsel.
Chairman’s and Corporate Governance CommitteeThe Chairman’s and Corporate Governance Committee
consists of the Chairman, the Vice Chairman and Lead
Independent Director, the CEO (Administrateur délégué)
and any other member elected by the Board. It liaises
between the Chairman and the full Board of Directors
in order to act as a consultant body to the Chairman
and to expedite whenever necessary the handling of the
Company’s business. The Committee regularly reviews
the corporate governance of the Company and prepares
recommendations for the Board. It also advises on certain
fi nance-related matters including the Company’s fi nancing
and fi nancial management and periodically reviews its asset
and liability management.
While the Committee has limited authority as per the Board
Regulations, it may in exceptional and urgent matters deal
with business matters which might arise between Board
meetings. In all cases it keeps the Board fully appraised.
It reviews the Board’s annual work plan.
Compensation CommitteeThe Compensation Committee consists of a minimum of
three non-executive members of the Board. All members
are independent (art. 19bis par. 1 of the Articles of Association).
The members of the Compensation Committee are elected
individually by the General Meeting for a term of offi ce until
completion of the next Annual General Meeting. Members
of the Compensation Committee whose term of offi ce has
expired are immediately eligible for re-election. The
Compensation Committee determines the system and
principles for remuneration of the members of the Board
of Directors and submits them to the Board for approval.
It oversees and discusses the remuneration principles for
Nestlé S.A. and the Nestlé Group. It prepares the proposals
of the Board to be submitted for approval by the General
Meeting in relation to the compensation of the Board of
(a) For complete information please refer to the Board Regulations and Committee Charters on www.nestle.com/investors/corporate-governance/boardcommittees
Corporate Governance Report 201814
Board of Directors
Directors and the Executive Board. In addition, it proposes
the remuneration of the Chairman and the CEO, and approves
the individual remuneration of the members of the Executive
Board. It reports on its decisions to the Board and keeps the
Board updated on the overall remuneration policy of the
Nestlé Group. It reviews the annual Compensation Report.
Nomination and Sustainability CommitteeThe Nomination and Sustainability Committee consists of
a Chairperson, who is an independent and non-executive
member of the Board, preferably the Lead Independent
Director; the other members are the Chairman of the Board
of Directors and a minimum of two independent and
non-executive members of the Board. The Nomination
and Sustainability Committee oversees the long-term
succession planning of the Board, establishes the principles
and criteria for the selection of candidates to the Board,
performs a regular gap analysis, selects candidates for
election or re-election to the Board and prepares a proposal
for the Board’s decision.
The nomination process for the Board of Directors is highly
structured and long-term and seeks to ensure a balance
of relevant competencies and an appropriate diversity of
its members over time. The NSC regularly reviews the
Company’s skills and diversity grid (see 3.1. above). It ensures
an appropriately wide net is cast on key successions. The
candidates to the Board must possess the necessary profi le,
qualifi cations and experience to discharge their duties. Newly
appointed Board members receive an appropriate introduction
into the business and affairs of the Company and the Group.
If required, the Nomination and Sustainability Committee
arranges for further training.
The Nomination and Sustainability Committee reviews,
at least annually, the independence of the members of the
Board as well as their outside mandates, and prepares the
annual self-evaluation of the Board and its Committees.
Furthermore, it reviews reports and gives advice on
measures which ensure the long-term sustainability of
the Company in its economic, social and environmental
dimension and monitors the Company’s performance
against selected external sustainability indexes. It reviews
the Company’s commitments on environmental, social and
governance aspects as well as the annual Nestlé in society
report and discusses periodically how other material non-
fi nancial issues affect the Company’s fi nancial performance
and how its long-term strategy relates to its ability to create
shared value. It reviews as well the Company’s shareholder
base and other signifi cant stakeholders and their material
interests. It meets as frequently as necessary to fulfi l its
tasks and prepares the relevant in camera sessions of the
Board of Directors.
Audit CommitteeThe Audit Committee consists of a Chairperson, who is
an independent and non-executive member of the Board,
and a minimum of two other non-executive members of
the Board, excluding the CEO and any former member
of the Executive Board. All members shall be independent.
At least one member has to have recent and relevant
fi nancial expertise, the others must be familiar with the
issues of accounting and audit. In discharging its
responsibilities, it has unrestricted access to the Company’s
management, books and records. The Audit Committee
supports the Board of Directors in its supervision of fi nancial
controls through a direct link to KPMG (external auditors)
and the Nestlé Group Audit (corporate internal auditors).
The Audit Committee’s main duties include the following:
– to review, and challenge where necessary, the actions
and judgements of management, in relation to the
Company’s year-end fi nancial accounts;
– to make recommendations to the Board of Directors
regarding the nomination of external auditors to be
appointed by the shareholders;
– to discuss the audit procedures, including the proposed
scope and the results of the internal and external audit;
– to keep itself regularly informed on important fi ndings
of the audits and of their progress;
– to oversee the quality of the internal and external auditing;
– to present the conclusions on the approval of the
Financial Statements to the Board of Directors;
– to review certain reports regarding internal controls,
compliance and the Group’s annual risk assessment.
The Audit Committee regularly reports to the Board on its
fi ndings and proposes appropriate actions. The responsibility
for approving the annual Financial Statements remains with
the Board of Directors.
Corporate Governance Report 2018 15
Board of Directors
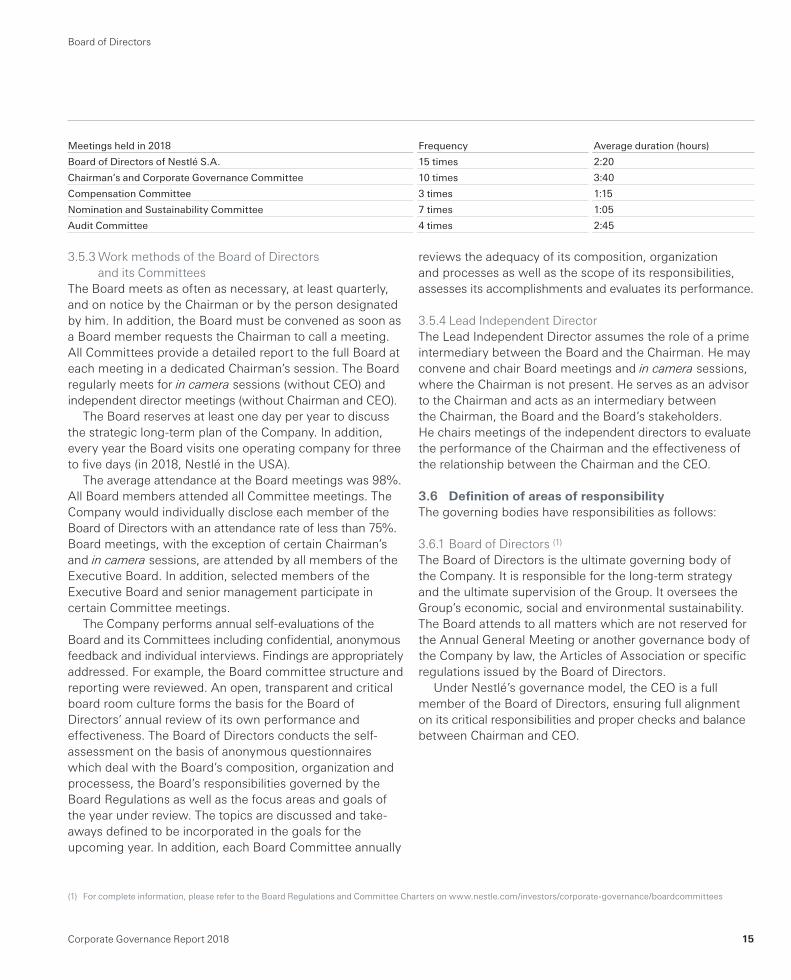
3.5.3 Work methods of the Board of Directors
and its Committees
The Board meets as often as necessary, at least quarterly,
and on notice by the Chairman or by the person designated
by him. In addition, the Board must be convened as soon as
a Board member requests the Chairman to call a meeting.
All Committees provide a detailed report to the full Board at
each meeting in a dedicated Chairman’s session. The Board
regularly meets for in camera sessions (without CEO) and
independent director meetings (without Chairman and CEO).
The Board reserves at least one day per year to discuss
the strategic long-term plan of the Company. In addition,
every year the Board visits one operating company for three
to fi ve days (in 2018, Nestlé in the USA).
The average attendance at the Board meetings was 98%.
All Board members attended all Committee meetings. The
Company would individually disclose each member of the
Board of Directors with an attendance rate of less than 75%.
Board meetings, with the exception of certain Chairman’s
and in camera sessions, are attended by all members of the
Executive Board. In addition, selected members of the
Executive Board and senior management participate in
certain Committee meetings.
The Company performs annual self-evaluations of the
Board and its Committees including confi dential, anonymous
feedback and individual interviews. Findings are appropriately
addressed. For example, the Board committee structure and
reporting were reviewed. An open, transparent and critical
board room culture forms the basis for the Board of
Directors’ annual review of its own performance and
effectiveness. The Board of Directors conducts the self-
assessment on the basis of anonymous questionnaires
which deal with the Board’s composition, organization and
processess, the Board’s responsibilities governed by the
Board Regulations as well as the focus areas and goals of
the year under review. The topics are discussed and take-
aways defi ned to be incorporated in the goals for the
upcoming year. In addition, each Board Committee annually
reviews the adequacy of its composition, organization
and processes as well as the scope of its responsibilities,
assesses its accomplishments and evaluates its performance.
3.5.4 Lead Independent Director
The Lead Independent Director assumes the role of a prime
intermediary between the Board and the Chairman. He may
convene and chair Board meetings and in camera sessions,
where the Chairman is not present. He serves as an advisor
to the Chairman and acts as an intermediary between
the Chairman, the Board and the Board’s stakeholders.
He chairs meetings of the independent directors to evaluate
the performance of the Chairman and the effectiveness of
the relationship between the Chairman and the CEO.
3.6 Defi nition of areas of responsibility
The governing bodies have responsibilities as follows:
3.6.1 Board of Directors (1)
The Board of Directors is the ultimate governing body of
the Company. It is responsible for the long-term strategy
and the ultimate supervision of the Group. It oversees the
Group’s economic, social and environmental sustainability.
The Board attends to all matters which are not reserved for
the Annual General Meeting or another governance body of
the Company by law, the Articles of Association or specifi c
regulations issued by the Board of Directors.
Under Nestlé’s governance model, the CEO is a full
member of the Board of Directors, ensuring full alignment
on its critical responsibilities and proper checks and balance
between Chairman and CEO.
(1) For complete information, please refer to the Board Regulations and Committee Charters on www.nestle.com/investors/corporate-governance/boardcommittees
Meetings held in 2018 Frequency Average duration (hours)
Board of Directors of Nestlé S.A. 15 times 2:20
Chairman’s and Corporate Governance Committee 10 times 3:40
Compensation Committee 3 times 1:15
Nomination and Sustainability Committee 7 times 1:05
Audit Committee 4 times 2:45
Corporate Governance Report 201816
Board of Directors
The Board has the following main duties:
a) the ultimate direction of the Company, in particular the
conduct, management and supervision of the business of
the Company, and the provision of necessary directions;
b) the determination of the Company’s organization;
c) the determination of accounting and fi nancial control
principles, as well as the principles of fi nancial planning;
d) the appointment and removal of any Vice Chairman,
the Committee members (except the members of the
Compensation Committee) and their Chairmen and
members of the Executive Board;
e) the ultimate supervision of the Chairman and the
members of the Executive Board, in particular with
respect to their compliance with the law, the Articles
of Association, the Board Regulations and instructions
given from time to time by the Board;
f) the preparation of the Annual Report including the
Compensation Report as well as the General Meetings
and execution of their resolutions;
g) the notifi cation of the court in the event of over
indebtedness;
h) the discussion and approval of:
– the Group’s long-term strategy and annual investment
budget;
– major fi nancial operations;
– any signifi cant policy issue dealing with the Company’s
or the Group’s general structure or with fi nancial,
commercial and industrial policy;
– Corporate Governance Principles of the Company;
– the review of and decision on any report submitted
to the Board;
– the Group’s annual risk assessment; and
– the compensation proposals to the General Meeting.
3.6.2 Executive Board
The Board of Directors delegates to the CEO, with the
authorization to subdelegate, the power to manage the
Company’s and the Group’s business, subject to law, the
Articles of Association and the Board Regulations.
The CEO chairs the Executive Board and delegates to
its members individually the powers necessary for carrying
out their responsibilities, within the limits fi xed in the
Executive Board Regulations.
3.7 Information and control instruments vis-à-vis
the Executive Board
The Board of Directors is, on a regular basis, informed on
material matters involving the Company’s and the Group’s
business. The members of the Executive Board attend the
Board of Directors meetings and report on signifi cant
projects and events. In addition, regular written reports
are provided, including consolidated fi nancial information,
capital investment, compliance and strategy progress reports.
The Chairman and the CEO ensure the proper information
fl ow between the Executive Board and the Board of Directors.
The Board of Directors receives regular and ad hoc reports
from the Board’s Committees, the Chairman, the CEO
as well as from the Executive Board. The minutes of
Committee meetings are made available to the full Board.
The Board pays a visit to a major market every year, where
it meets members of senior management. In 2018, the
Board visited the United States of America.
Furthermore, the Audit Committee reviews the fi nancial
performance and assesses the effectiveness of the internal
and external audit processes as well as the internal risk
management organization and processes.
Members of the Executive Board and other senior
management attend the Audit Committee meetings, except
for certain in camera sessions.
Additional information and control instruments include:
– the external auditors, KPMG (auditors of Nestlé S.A.
and of the Consolidated Financial Statements of the
Nestlé Group), who conduct their audit in compliance
with Swiss law and in accordance with Swiss Auditing
Standards and International Standards on Auditing;
– the Nestlé Group and Market Audit function, the
corporate internal auditors, which has a direct link to
the Audit Committee. It comprises a unit of international
auditors who travel worldwide, completing audit
assignments;
– Group Risk Management provides assistance to all
corporate entities with regard to risk management and
a top-level risk assessment is performed once a year for
all businesses. Group Risk Services provides assistance
to all corporate entities with regard to loss prevention,
claims handling and insurance. For more information,
please refer to page 54 of the Annual Review 2018;
Corporate Governance Report 2018 17
Board of Directors
– Group Compliance and other risk- and control-related
functions provide additional guidance and oversight.
Risk and compliance activities are regularly coordinated
through the Group Compliance Committee to ensure
a holistic, entity-wide approach. For more information,
please refer to page 64 of the Annual Review 2018.
Corporate Governance Report 201818
Executive Board
4. Executive Board
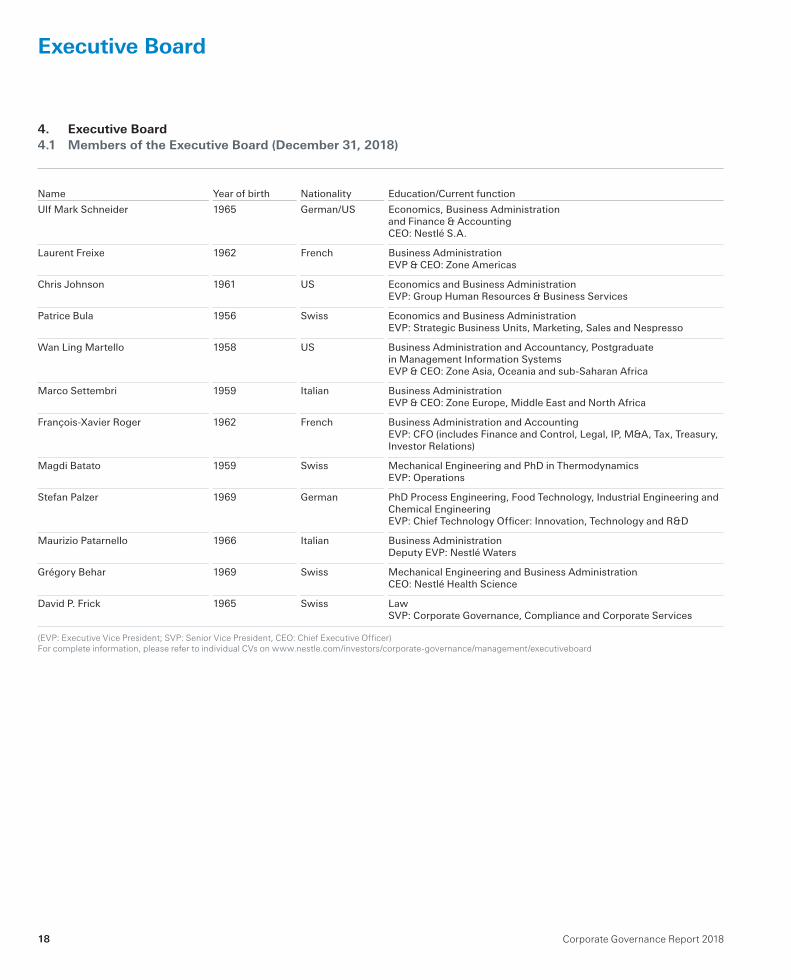
4.1 Members of the Executive Board (December 31, 2018)
Name Year of birth Nationality Education/Current function
Ulf Mark Schneider 1965 German/US Economics, Business Administration and Finance & Accounting CEO: Nestlé S.A.
Laurent Freixe 1962 French Business Administration EVP & CEO: Zone Americas
Chris Johnson 1961 US Economics and Business Administration EVP: Group Human Resources & Business Services
Patrice Bula 1956 Swiss Economics and Business Administration EVP: Strategic Business Units, Marketing, Sales and Nespresso
Wan Ling Martello 1958 US Business Administration and Accountancy, Postgraduate in Management Information Systems EVP & CEO: Zone Asia, Oceania and sub-Saharan Africa
Marco Settembri 1959 Italian Business Administration EVP & CEO: Zone Europe, Middle East and North Africa
François-Xavier Roger 1962 French Business Administration and Accounting EVP: CFO (includes Finance and Control, Legal, IP, M&A, Tax, Treasury, Investor Relations)
Magdi Batato 1959 Swiss Mechanical Engineering and PhD in Thermodynamics EVP: Operations
Stefan Palzer 1969 German PhD Process Engineering, Food Technology, Industrial Engineering and Chemical Engineering EVP: Chief Technology Offi cer: Innovation, Technology and R & D
Maurizio Patarnello 1966 Italian Business Administration Deputy EVP: Nestlé Waters
Grégory Behar 1969 Swiss Mechanical Engineering and Business Administration CEO: Nestlé Health Science
David P. Frick 1965 Swiss Law SVP: Corporate Governance, Compliance and Corporate Services
(EVP: Executive Vice President; SVP: Senior Vice President, CEO: Chief Executive Offi cer)
For complete information, please refer to individual CVs on www.nestle.com/investors/corporate-governance/management/executiveboard
Corporate Governance Report 2018 19
Executive Board
4.2 Professional background and other activities
and functions (*)
Ulf Mark Schneider
Please refer to point 3.2 above.
Laurent Freixe
Laurent Freixe joined Nestlé France
in 1986 as a sales representative and
got increasing responsibilities in the
fi eld of sales and marketing. In 1999,
he became a member of the
Management Committee and was
nominated Head of the Nutrition
Division. In 2003, Laurent Freixe became Market Head of
Nestlé Hungary. In January 2007, he was appointed Market
Head of the Iberian Region taking responsibility for Spain
and Portugal. From November 2008 to October 2014,
Laurent Freixe served as Executive Vice President in charge
of Zone Europe.
Effective October 2014, he was appointed Executive
Vice President for Zone Americas.
As a representative of Nestlé, he is a member of the
Board of Directors of Cereal Partners Worldwide S.A.,
Switzerland, and of the Regional Board of Directors of
the Consumer Goods Forum in Latin America.
Laurent Freixe has been named International Youth
Ambassador by the International Youth Organization
for Ibero-America.
Chris Johnson
Chris Johnson started his career
with Nestlé in 1983 as a marketing
trainee at Carnation Inc. During his
fi rst eight years, he took on increasing
responsibilities mainly in the commercial
area at Nestlé USA and then, from 1991,
in Japan. Senior Area Manager for the
Asian region of Nestlé Waters in Paris from 1995, he was
then transferred to Taiwan in 1998 as Market Head. From
2000, Chris Johnson led the worldwide development and
implementation of GLOBE (Global Business Excellence;
IS/IT), the Strategic Supply Chain as well as eNestlé. He was
appointed Deputy Executive Vice President in April 2001,
and later moved back to Japan in 2007 as Market Head.
From January 2011 to October 2014, Chris Johnson was
Executive Vice President responsible for Zone Americas.
Effective October 2014, he was appointed Executive
Vice President of Nestlé S.A. in charge of Nestlé Business
Excellence.
As of August 2018, Chris Johnson assumes new
responsibilities in addition to his current ones and was
appointed Head of Group Human Resources & Business
Services.
Chris Johnson is a Board member of GS1, Belgium, and
Treasurer of the Swiss-American Chamber of Commerce.
Patrice Bula
Patrice Bula joined Nestlé S.A.
in 1980 and was entrusted with
various responsibilities in Marketing
and Sales in Kenya, Japan and Taiwan
before being promoted to Market Head
for Taiwan in 1992, Market Head for
Czech Republic in 1995, then Head for
the South and Eastern Africa Region in 1997. In 2000,
he was appointed Head of Chocolate, Confectionery
and Biscuits Strategic Business Unit based at Nestlé’s
International Headquarters in Vevey. In October 2003,
Patrice Bula was transferred as Market Head of Nestlé
Germany and in August 2007 he took up the role as Market
Head for the Greater China Region.
Effective May 2011, Patrice Bula was appointed to the
Executive Board of Nestlé S.A. as Executive Vice President
with responsibility for the Strategic Business Units, Marketing,
Sales and Nespresso.
Patrice Bula serves on the Boards of Schindler Holding Ltd.
and Bobst Group SA, both in Switzerland.
As a representative of Nestlé, Patrice Bula serves
as Chairman of Blue Bottle Coffee Inc., USA, as a Board
member of Cereal Partners Worldwide S.A., Switzerland,
and of Froneri Ltd., UK.
He is also a Board member of Hsu Fu Chi Group
Companies, China.
(*) Mandates and functions are listed in the following order: (1) mandates in listed companies, (2) mandates in non-listed companies, (3) mandates held at the request
of Nestlé or companies controlled by it, (4) mandates held in associations, charitable organizations, foundations, trusts and employee welfare foundations.
Corporate Governance Report 201820
Executive Board
Wan Ling Martello
Wan Ling Martello joined Nestlé S.A.
as Executive Vice President in
November 2011 and was the Chief
Financial Offi cer from April 2012 until
May 2015. As of May 2015, she was
appointed Executive Vice President
of Nestlé S.A. in charge of Zone AOA
(Asia, Oceania and sub-Saharan Africa). Wan Ling Martello
came to Nestlé S.A. from Walmart Stores Inc., where she
was EVP, Global eCommerce in 2010 and 2011. From 2005
to 2009, she was SVP, CFO & Strategy for Walmart
International. Prior to Walmart, Wan Ling Martello built
her career in the consumer packaged goods industry. She
worked at Kraft in increasingly broader fi nance roles from
1985 to 1995. She was the Corporate Controller at Borden
Foods during its turnaround years owned by KKR in 1995
until 1998. Wan Ling Martello was the CFO and then the
President of the U.S. business of NCH, a former subsidiary
of AC Nielsen, from 1998 to 2005.
Wan Ling Martello serves on the Boards of Alibaba Group
Holding Ltd., China, and Uber Technologies Inc., USA.
As a representative of Nestlé, Wan Ling Martello is
a member of the Board of Cereal Partners Worldwide S.A.,
Switzerland, and Blue Bottle Coffee Inc., USA.
Marco Settembri
Marco Settembri joined the Nestlé
Group with Nestlé Italiana S.p.A.
in 1987 and was entrusted with various
responsibilities, mainly in the PetCare
area. He was appointed Managing
Director of the Sanpellegrino water
business in 2004 and largely contributed
to the successful consolidation of the water activities in Italy
and to the development of a strong export stream of the
emblematic Italian brands. In 2006, he took over the position
of Market Head in Italy in addition to his responsibility as
Head of Nestlé Waters Italy. In 2007, Marco Settembri was
appointed CEO of Nestlé Purina PetCare Europe.
Effective December 2013, Marco Settembri was appointed
to the Executive Board of Nestlé S.A. as Executive Vice
President, Head of Nestlé Waters of the Nestlé Group.
As of January 2017, Marco Settembri was appointed
Executive Vice President in charge of Zone EMENA
(Europe, Middle East and North Africa).
As a representative of Nestlé, he is Board member
of Lactalis Nestlé Produits Frais S.A.S, France, and of
Cereal Partners Worldwide S.A., Switzerland.
In addition, Marco Settembri is a member of the Boards
of FoodDrinkEurope and of the Association des Industries
de Marque de l’Union Européenne (AIM) in Belgium.
François-Xavier Roger
In July 2015, François-Xavier Roger
joined Nestlé S.A. as Executive Vice
President and Chief Financial Offi cer.
François-Xavier Roger came to
Nestlé S.A. from Takeda Pharmaceutical,
Tokyo, where he was CFO since 2013.
From 2008 to 2013, he was Chief
Financial Offi cer of Millicom based in Luxembourg.
From 2000 to 2008, he worked as Chief Financial Offi cer
for Danone Asia, followed by Head of Finance, Treasury
and Tax for the Danone Group based in Paris, France.
Magdi Batato
Magdi Batato is a mechanical engineer
and holds a PhD in Energetics of the
human body from the Swiss Federal
Institute of Technology Lausanne (EPFL).
He spent a few years teaching in
university and consulting before joining
Nestlé S.A. in 1991 in Switzerland as
Engineer in Industrial Services, Energy & Environment.
His factory and production management experiences took
him to Germany, Lebanon and South Africa. In 2004,
he was transferred to Malaysia as Executive Director of
Production and, in 2009, he moved to Nestlé UK & Ireland
as Head of Group Technical. In May 2012, he took up the
position of Market Head Pakistan.
Effective October 2015, he was appointed Executive
Vice President of Nestlé S.A. in charge of Operations.
Magdi Batato is a member of the Board of Carlsberg A/S.
Corporate Governance Report 2018 21
Executive Board
Stefan Palzer
Stefan Palzer studied food engineering
and marketing. He obtained a PhD
in Chemical Engineering from the
Technical University of Munich and
was appointed Professor for Food
and Chemical Engineering by the
Universities of Hamburg, Stuttgart and
Sheffi eld. Stefan Palzer joined the Nestlé Group in 2000
as project manager in the Product Technology Centre,
Kemptthal. From 2003 to 2010, he held positions of
increasing responsibility at the Product Technology Centre
Singen and the Nestlé Research Center in Lausanne.
In 2010, he took over the responsibility as Head of the
Product Technology Centre York. From 2013 to 2017,
Stefan Palzer was Global R&D Manager in the Strategic
Business Unit for Beverages. In 2016, he was appointed
Head of the Nestlé Research Center in Lausanne. As of
January 2018, Stefan Palzer joined the Executive Board
of Nestlé S.A. as Executive Vice President and Chief
Technology Offi cer.
In addition, he is a member of the Executive Board of the
European Academy of Food Engineering (EAFE), a Board
member of the Nutrition Cluster Berlin and a member of
the Strategic Advisory Board of the École Polytechnique
Fédérale de Lausanne (EPFL). In 2018, he was conferred
the title “Fellow” by the International Union of Food Science
and Technology (IUFOST).
Maurizio Patarnello
Maurizio Patarnello joined Nestlé S.A.
in 1993 and held several positions in
Finance before moving to Sanpellegrino
in 1999. In 2002, he was appointed
as Country Business Manager for
Lebanon and Jordan, where he led the
development of the Nestlé Waters business. In September
2004, he joined the regional management team in Dubai
and was promoted Chief Operating Offi cer and Regional
Business Head of Nestlé Waters for Middle East and Africa.
In 2007, Maurizio Patarnello took over the additional
responsibility for Nestlé Waters Asia. In October 2010,
he was promoted to Market Head for Ukraine and Moldava.
Maurizio Patarnello took up the position of Market Head
for Nestlé Russia and Eurasia Region in October 2012.
Effective January 2017, he was appointed Deputy
Executive Vice President of Nestlé S.A. and Head of
Nestlé Waters.
Grégory Behar
Grégory (Greg) Behar joined Nestlé S.A.
in 2014 as CEO of Nestlé Health Science.
Greg Behar came to Nestlé S.A. from
Boehringer Ingelheim Pharmaceuticals
Inc., USA, where he was President and
CEO since 2011. From 2010 to July 2011,
Greg Behar was Corporate Vice
President Region NECAR (North European Union, Canada
and Australasia) for Boehringer-Ingelheim GmbH and was
its Corporate Vice President of the Cardiovascular and
Metabolism Franchise from 2009 to 2010. Furthermore,
Greg Behar held previous roles at Bula & Fils, Nestlé and
Novartis Pharma. As of January 2017, he was appointed
to the Executive Board of Nestlé S.A.
He represents Nestlé S.A. on the Boards of various
companies in which Nestlé S.A. holds investments, including
Nutrition Science Partners, HK, Cerecin Inc., USA, Seres
Therapeutics Inc., USA, Aimmune Therapeutics Inc., USA,
and Axcella Health Inc., USA.
David P. Frick
David P. Frick began his career at
the Meilen District Court in Zurich and
as an assistant to the Banking Law Chair
at Zurich University Law School.
From 1994, he was an attorney
in the International Corporate and
Litigation practice groups of Cravath,
Swaine & Moore, the New York law fi rm.
In 1999, he became Group General Counsel and
Managing Director of Credit Suisse Group, Zurich, where
he was appointed a Member of the Executive Board and
served as the company’s Head of Legal and Compliance.
David Frick joined Nestlé S.A. in 2006 and serves
as Senior Vice President, Corporate Governance, Compliance
and Corporate Services.
Furthermore, he is a member of the Board of
economiesuisse and chairs its Legal Commission.
David Frick represents Nestlé at SwissHoldings and
serves on the SIX Regulatory Board, ICC Switzerland
and the Legal Committee for the Swiss-American Chamber
of Commerce.
Corporate Governance Report 201822
Compensation, shareholdings and loans
Executive Board
4.3 Mandates outside Nestlé
Pursuant to art. 21sexies of the Articles of Association,
no member of the Executive Board may hold more than
2 additional mandates in listed companies and 4 additional
mandates in non-listed companies. Each of these mandates
is subject to a specifi c approval by the Board of Directors.
The following mandates are not subject to these
limitations:
a) mandates in companies which are controlled by Nestlé;
b) mandates which a member of the Executive Board holds
at the request of Nestlé or companies controlled by it.
No member of the Executive Board shall hold more
than 10 such mandates; and
c) mandates in associations, charitable organizations,
foundations, trusts and employee welfare foundations.
No member of the Executive Board shall hold more
than 10 such mandates.
Mandates shall mean mandates in the supreme governing
body of a legal entity which is required to be registered in
the commercial register or a comparable foreign register.
Mandates in different legal entities which are under joint
control are deemed one mandate.
The Board of Directors has promulgated regulations
that determine additional restrictions.
All members of the Executive Board comply with the
provisions set out in art. 21sexies.
4.4 Management contracts
There are no management contracts with third parties
at Nestlé.
5. Compensation, shareholdings and loans
Please refer to the Compensation Report 2018, page 29.
Corporate Governance Report 2018 23
Shareholders’ participation
6. Shareholders’ participation rights
6.1 Voting rights restrictions and representation
6.1.1 Voting rights restrictions and rules on granting
exceptions
and
6.1.3 Reasons for granting exceptions in the year under
review
Each share registered with the right to vote entitles the
holder to one vote at General Meetings (“one share, one
vote”). Only persons entered in the share register as
shareholders with voting rights may exercise the voting
rights or the other rights related thereto (art. 5 par. 2 of
the Articles of Association).
No person may exercise, directly or indirectly, voting
rights, with respect to own shares or shares represented
by proxy, in excess of 5% of the share capital as recorded in
the commercial register. Legal entities that are linked to one
another through capital, voting rights, management or in
any other manner, as well as all natural persons or legal
entities achieving an understanding or forming a syndicate
or otherwise acting in concert to circumvent such a limit
shall be counted as one shareholder (art. 11 par. 2 of the
Articles of Association; see art. 11 par. 3 of the Articles
of Association for exceptions to this voting restriction).
To permit the exercise of voting rights in respect of
shares held by nominees, in line with art. 11 par. 4 of the
Articles of Association, the Board of Directors may by
means of regulations or agreements depart from the limit
of 5% of the share capital as recorded in the commercial
register (art. 5 par. 6 and par. 9 of the Articles of Association).
The Board of Directors has granted exceptions to vote shares
that in aggregate are in excess of 5% of the share capital
to the following Nominees N: Chase Nominees Ltd, London,
and Citibank N.A.,London, as depositary for shares
represented by American Depositary Receipts (please
refer to point 2.6.3).
Pursuant to art. 5 par. 9 and 11 par. 4 of the Articles
of Association, the Board of Directors has conferred to
Credit Suisse AG and UBS AG as custodians the right to
vote shares in excess of 5% on the basis of specifi c
instructions provided by their clients for General Meetings.
6.1.4 Procedure and conditions for abolishing voting rights
restrictions in the Articles of Association
A resolution to amend the provisions of the Articles of
Association relating to:
(i) restrictions on the exercise of voting rights and the
change or removal of such restrictions, or
(ii) the limitation on registration or the limitation on voting
rights and the change or removal of such limitations
requires a majority of two-thirds of the shares
represented and the absolute majority of the nominal
value represented at the General Meeting (art. 13 of
the Articles of Association). See also art. 11 par. 4
of the Articles of Association.
6.1.5 Rules on participation in the General Meeting
of shareholders
There are no restrictions to the legal regime set out by
Swiss law in the Articles of Association. Shareholders
with voting rights may have their shares represented
by the proxy of their choice.
6.1.6 Rules on instructions to the independent representative
and on the electronic participation in the General
Meeting of shareholders
The legal regime set out by Swiss law applies to instructions
in written or electronic form to the independent representative
for participation in the General Meeting of shareholders.
There are no specifi c provisions related thereto in the Articles
of Association.
6.2 Quorums required by the Articles of Association
Please refer to art. 13 of the Articles of Association.
6.3 Convocation of the General Meeting
of shareholders
Nestlé S.A. statutory rules (art. 7 to 9 of the Articles of
Association) do not differ from applicable legal provisions.
An Extraordinary General Meeting requested by one or
more shareholders whose combined holdings represent at
least 10% of the share capital as recorded in the commercial
register must be held as promptly as practicable following
such request (art. 8 par. 2 of the Articles of Association).
Corporate Governance Report 201824
Shareholders’ participation Change of control and defence measures
6.4 Inclusion of items on the agenda
One or more shareholders with voting rights whose
combined holdings represent at least 0.15% of the share
capital as recorded in the commercial register may request
that an item be included in the agenda of the General
Meeting by making the request in writing to the Board
of Directors at the latest 45 days before the meeting and
specifying the agenda items and the proposals made
(art. 9 par. 2 and par. 3 of the Articles of Association).
6.5 Entries in the share register
The relevant date to determine the shareholders’ right
to participate in the General Meeting on the basis of the
registrations appearing in the share register is set by
the Board of Directors.
7. Change of control and defense measures
7.1 Duty to make an offer
Nestlé S.A. does not have a provision on opting out or
opting up in the Articles of Association.
Thus, the provisions regarding the legally prescribed
threshold of 33¹⁄ ³% of the voting rights for making a public
takeover offer set out in art. 135 of the Swiss Financial
Market Infrastructure Act are applicable.
7.2 Clauses on change of control
There are no such agreements.
Corporate Governance Report 2018 25
Auditors
8. Auditors
8.1 Duration of the mandate and term of offi ce
of the lead auditor
KPMG Klynveld Peat Marwick Goerdeler SA were fi rst
appointed on May 22, 1993, and KPMG SA (replacing KPMG
Klynveld Peat Marwick Goerdeler SA) were fi rst appointed
on April 23, 2009 as auditors of Nestlé S.A.
On April 12, 2018, KPMG SA (hereafter “KPMG”) were
appointed as auditors of the Financial Statements of
Nestlé S.A. and of the Consolidated Financial Statements
of the Nestlé Group for a term of offi ce of one year.
The audit report is signed jointly by two KPMG partners
on behalf of KPMG. The fi rst year that Mr. Scott Cormack, in
his capacity as lead auditor, signed the Financial Statements
of Nestlé S.A. and the Consolidated Financial Statements of
the Nestlé Group was for the year ending December 31, 2013.
The lead auditor is rotated every seven years in accordance
with Swiss law.
8.2 Auditing fees
The auditing fees paid to KPMG in their capacity as Group
auditors for 2018 amount to CHF 42 million.
8.3 Additional fees
In addition, KPMG provided non-audit services amounting
to CHF 9.7 million, including CHF 5.6 million for mergers
and disposals services, CHF 1.2 million for tax services,
CHF 1.0 million for IS/IT advisory support, and CHF 1.9 million
for other various non-audit services.
8.4 Information instruments pertaining
to the external audit
KPMG presents to the Audit Committee a detailed report on
the conduct of the Financial Statements audit, the fi ndings
on signifi cant fi nancial accounting and reporting issues
together with the fi ndings on the internal control system as
well as an overview of issues found during the interim audit.
In 2018, KPMG participated in all four Audit Committee
meetings at the end of which they met with the Audit
Committee without the Group’s management being present.
Nestlé Internal Audit (corporate internal auditors) met
four times with the Audit Committee. In addition, the head
of internal audit regularly met with the Chairman of the
Audit Committee for interim updates.
The Audit Committee reviews annually the appropriateness
of renewing the mandate to KPMG as the auditor of the
Nestlé Group and Nestlé S.A., prior to submitting to the
Board and to the Annual General Meeting of Nestlé S.A. its
proposal for the election of the auditor. The Audit Committee
assesses the effectiveness of the work of the auditors in
accordance with Swiss law, based on their understanding
of the Group’s business, control, accounting and reporting
issues, together with the way in which matters signifi cant
at Group level or in the statutory accounts are identifi ed and
resolved.
The Audit Committee is also informed on the work of
the auditors through regular briefi ngs of its Chairman. Audit
fees are ultimately approved by the Audit Committee.
The Group and KPMG have agreed on clear guidelines
as to non-audit services which it is appropriate for KPMG
to provide. These services include due diligence on
mergers, acquisitions and disposals and certain tax and
business risk assurance and IS/IT advisory support. These
guidelines ensure KPMG’s independence in their capacity
as auditors to the Group. KPMG monitors its independence
throughout the year and confi rms its independence to the
Audit Committee annually.
In October 2018, the Audit Committee invited several audit
fi rms, including KPMG, to participate in a tender process
which will lead to the selection of the audit fi rm to be
proposed for election at the Annual General Meeting 2020.
Corporate Governance Report 201826
Information policy
9. Information policy
Investor Relations – guiding principles
Nestlé is committed to managing an open and consistent
communication policy with shareholders and other interested
parties. The objective is to ensure that the perception of those
parties about the historical record, current performance and
future prospects of Nestlé is in line with management’s
understanding of the actual situation at Nestlé. The guiding
principles of this policy are that Nestlé gives equal treatment
to shareholders in equal situations, that any price-sensitive
information is published in a timely fashion and that the
information is provided in a format that is as full, simple,
transparent and consistent as possible.
Methodology
Each year, Nestlé produces a detailed Annual Report, which
consists of i) the Annual Review, ii) the Consolidated Financial
Statements of the Nestlé Group, iii) the Financial Statements
of Nestlé S.A., iv) the Corporate Governance Report, and
v) the Compensation Report. The Consolidated Financial
Statements are prepared according to the International
Financial Reporting Standards (IFRS). The Half-Yearly Report,
consisting of the Half-Yearly Income Statement, Balance
Sheet and Cash Flow Statement, complements the Annual
Report. The Company also issues annually its Creating
Shared Value (CSV) report.
Nestlé publishes its full results for the full-year and
the half-year. Additionally, the Company publishes its
sales fi gures for the fi rst three-months and nine-months.
Press releases accompany the fi nancial results and sales
announcements, and are also issued at the time of
potentially price-sensitive events, such as signifi cant
acquisitions and divestments, joint venture agreements
or alliances. These communications are publically available
on the internet. Major announcements, such as results
of corporate activity, are accompanied by a presentation
which is broad cast “live” on the internet and which anyone
can access, whether or not that person is a shareholder.
Furthermore, Nestlé has an active investor relations (IR)
program. Throughout the year, IR engages with investors
(current or prospective) and the relevant sell-side analysts in
meetings, conference calls, roadshows, broker conferences,
or other events. In certain cases, members of management
might also participate in some meetings with the fi nancial
community, including both group meetings and one-to-one
meetings. Topics of discussion may include recently
announced fi nancial results, recent corporate activity, or the
longer-term strategy of the Group; they are not an occasion
for the disclosure of new information which might encourage
on investment decision. Specifi cally on governance topics,
the Company engages into an active dialogue with investors
through regular Chairman’s roundtables, surveys and bilateral
exchanges which are reported to the Chairman’s and
Corporate Governance Committee or the Board.
The Company uses the internet (www.nestle.com/
investors) to ensure a rapid and equitable distribution of
information. There are also links to non-fi nancial information
that may be of interest to investors, including areas such
as the environment, sustainability and news about brands
and innovation. A Corporate calendar of relevant dates
is displayed on page 65 of the Annual Review 2018 and
available on the IR events pages.
(www.nestle.com/investors/events).
The Nestlé Investor Relations Department can be
contacted via the following coordinates:
Contact
Investor Relations
Nestlé S.A., Avenue Nestlé 55
CH-1800 Vevey (Switzerland)
Tel. +41 (0)21 924 35 09
E-mail: [email protected]
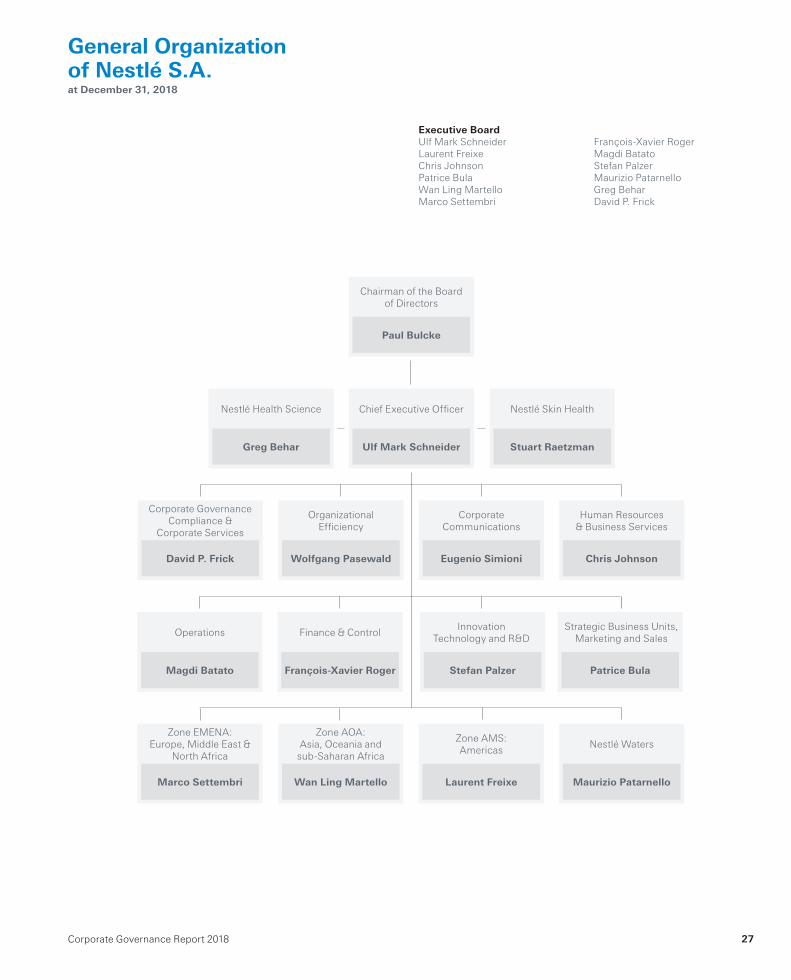
Corporate Governance Report 2018 27
General Organization of Nestlé S.A.at December 31, 2018
Executive Board
Ulf Mark Schneider
Laurent Freixe
Chris Johnson
Patrice Bula
Wan Ling Martello
Marco Settembri
François-Xavier Roger
Magdi Batato
Stefan Palzer
Maurizio Patarnello
Greg Behar
David P. Frick
Chairman of the Board
of Directors
Chief Executive Offi cer Nestlé Skin HealthNestlé Health Science
Zone AOA:
Asia, Oceania and
sub-Saharan Africa
Zone AMS:
Americas
Corporate
Communications
Organizational
Effi ciency
Human Resources
& Business Services
Corporate Governance
Compliance &
Corporate Services
Operations Finance & Control
Nestlé Waters
Zone EMENA:
Europe, Middle East &
North Africa
Strategic Business Units,
Marketing and Sales
Innovation
Technology and R & D
Paul Bulcke
Ulf Mark Schneider Stuart RaetzmanGreg Behar
Wan Ling Martello Laurent Freixe
Eugenio SimioniWolfgang Pasewald Chris JohnsonDavid P. Frick
Magdi Batato François-Xavier Roger
Maurizio Patarnello
Patrice BulaStefan Palzer
Marco Settembri

Corporate Governance Report 201828
CompensationReport 2018
Compensation Report 2018 29
30 Compensation Report 2018
Compensation Report 2018
Introduction
The future success of Nestlé is dependent on its ability to
attract, motivate and retain the right talented employees.
Among the various programs to support this ambition
is a competitive remuneration policy. Nestlé believes in
a performance culture as well as good corporate governance
and corporate social responsibility.
Therefore, remuneration at Nestlé is based on the following
principles:
– pay for performance to support the Company’s short-term
and long-term objectives;
– compensation aligned with long-term Group strategy
and shareholders’ interests;
– coherence in our remuneration plans and levels throughout
the Company;
– competitiveness versus external market comparisons;
– appropriate balance of fi xed and variable remuneration
and short-term and long-term rewards.
As in previous years, this Compensation Report shall be
submitted to the advisory vote of the shareholders at the
Annual General Meeting 2019.
At the 2018 Annual General Meeting, shareholders approved
the total compensation budgets for the Board of Directors
and the Executive Board with large majorities.
As explained at that time, to ensure complete accountability,
the shareholders will this year be able to retrospectively vote
on the Compensation Report and payouts in a consultative
vote.
In light of the signifi cant changes to Nestlé’s Long-Term
Incentive plan in 2018, no additional structural changes will
be introduced for 2019 to maintain consistency.
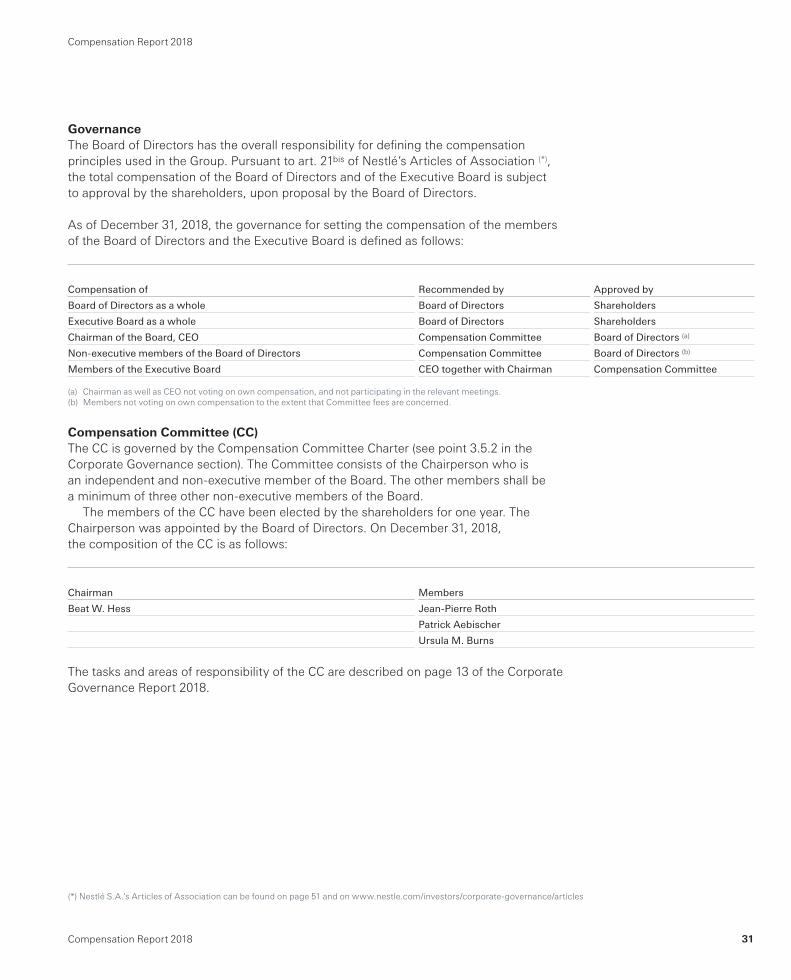
31Compensation Report 2018
Compensation Report 2018
Governance
The Board of Directors has the overall responsibility for defi ning the compensation
principles used in the Group. Pursuant to art. 21bis of Nestlé’s Articles of Association (*),
the total compensation of the Board of Directors and of the Executive Board is subject
to approval by the shareholders, upon proposal by the Board of Directors.
As of December 31, 2018, the governance for setting the compensation of the members
of the Board of Directors and the Executive Board is defi ned as follows:
Compensation of Recommended by Approved by
Board of Directors as a whole Board of Directors Shareholders
Executive Board as a whole Board of Directors Shareholders
Chairman of the Board, CEO Compensation Committee Board of Directors (a)
Non-executive members of the Board of Directors Compensation Committee Board of Directors (b)
Members of the Executive Board CEO together with Chairman Compensation Committee
(a) Chairman as well as CEO not voting on own compensation, and not participating in the relevant meetings.
(b) Members not voting on own compensation to the extent that Committee fees are concerned.
Compensation Committee (CC)
The CC is governed by the Compensation Committee Charter (see point 3.5.2 in the
Corporate Governance section). The Committee consists of the Chairperson who is
an independent and non-executive member of the Board. The other members shall be
a minimum of three other non-executive members of the Board.
The members of the CC have been elected by the shareholders for one year. The
Chairperson was appointed by the Board of Directors. On December 31, 2018,
the composition of the CC is as follows:
Chairman Members
Beat W. Hess Jean-Pierre Roth
Patrick Aebischer
Ursula M. Burns
The tasks and areas of responsibility of the CC are described on page 13 of the Corporate
Governance Report 2018.
(*) Nestlé S.A.’s Articles of Association can be found on page 51 and on www.nestle.com/investors/corporate-governance/articles
32 Compensation Report 2018
Compensation Report 2018
Board of Directors
Principles of compensation for the members of the Board of Directors
Governance
Pursuant to art. 21bis par. 1 of Nestlé’s Articles of Association, the General Meeting shall
approve annually the proposal of the Board of Directors in relation to the maximum
aggregate amount of the compensation of the Board of Directors for the period until
the next Annual General Meeting (a).
In the event the General Meeting has not approved a proposal of the Board of Directors,
the Board of Directors shall determine the respective maximum aggregate amount or
maximum partial amounts of compensation provided that:
a) the Board of Directors takes into account (i) the proposed maximum aggregate amount
of compensation; (ii) the decision of the General Meeting and, to the extent known
to the Board of Directors, the main reasons for the negative vote; and (iii) Nestlé’s
compensation principles; and
b) the Board of Directors submits the amount(s) so determined to approval by the same
General Meeting, a subsequent Extraordinary General Meeting or the next Annual
General Meeting (art. 21bis par. 2 of the Articles of Association).
The compensation of the members of the Board of Directors is subject to “claw back”
rules in accordance with art. 678 of the Swiss Code of Obligations. Members of the
Board of Directors could be obligated to return benefi ts received from the Company to
the extent these are manifestly disproportionate to the performance rendered in return
and to the Company’s economic situation (including as a result of fraud or accounting
misstatement).
Principles
The remuneration of the members of the Board of Directors is set to attract and retain
highly qualifi ed individuals to serve on the Board of Directors. The level of remuneration
refl ects the time and effort required from the members in fulfi lling their Board and
Committee responsibilities. The pay structure (cash and blocked shares) is designed to
ensure the Board’s focus on the long-term success of the Company. There is no variable
compensation for non-executive members of the Board of Directors, in order to ensure
a proper level of independence.
The principal benchmark used to defi ne Board remuneration is a selection of large
Swiss Market Index (SMI) companies (b), adjusted for the size of Nestlé. These fi gures
are periodically reviewed against this benchmark.
Compensation 2018 for the members of the Board of Directors
Board membership fees and allowances
With the exception of the Chairman and the CEO, each member of the Board of Directors
receives a Board membership fee of CHF 280 000 and an Expense Allowance of
CHF 15 000. These fi gures have remained unchanged since 2006.
(a) The Board of Directors may submit for approval by the General Meeting deviating or additional proposals relating to the
same or different periods.
(b) Novartis, Roche, Richemont, ABB, Syngenta, UBS and Credit Suisse.
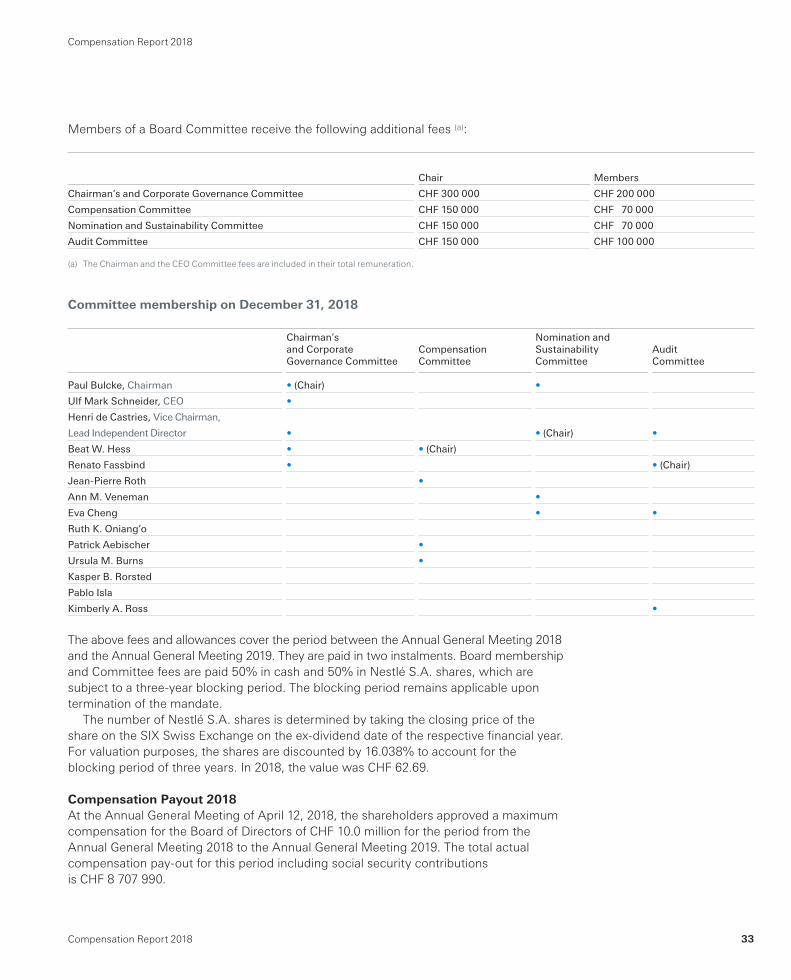
33Compensation Report 2018
Compensation Report 2018
Members of a Board Committee receive the following additional fees (a):
Chair Members
Chairman’s and Corporate Governance Committee CHF 300 000 CHF 200 000
Compensation Committee CHF 150 000 CHF 70 000
Nomination and Sustainability Committee CHF 150 000 CHF 70 000
Audit Committee CHF 150 000 CHF 100 000
(a) The Chairman and the CEO Committee fees are included in their total remuneration.
Committee membership on December 31, 2018
Chairman’s Nomination and and Corporate Compensation Sustainability Audit Governance Committee Committee Committee Committee
Paul Bulcke, Chairman • (Chair) •
Ulf Mark Schneider, CEO •
Henri de Castries, Vice Chairman,
Lead Independent Director • • (Chair) •
Beat W. Hess • • (Chair)
Renato Fassbind • • (Chair)
Jean-Pierre Roth •
Ann M. Veneman •
Eva Cheng • •
Ruth K. Oniang’o
Patrick Aebischer •
Ursula M. Burns •
Kasper B. Rorsted
Pablo Isla
Kimberly A. Ross •
The above fees and allowances cover the period between the Annual General Meeting 2018
and the Annual General Meeting 2019. They are paid in two instalments. Board membership
and Committee fees are paid 50% in cash and 50% in Nestlé S.A. shares, which are
subject to a three-year blocking period. The blocking period remains applicable upon
termination of the mandate.
The number of Nestlé S.A. shares is determined by taking the closing price of the
share on the SIX Swiss Exchange on the ex-dividend date of the respective fi nancial year.
For valuation purposes, the shares are discounted by 16.038% to account for the
blocking period of three years. In 2018, the value was CHF 62.69.
Compensation Payout 2018
At the Annual General Meeting of April 12, 2018, the shareholders approved a maximum
compensation for the Board of Directors of CHF 10.0 million for the period from the
Annual General Meeting 2018 to the Annual General Meeting 2019. The total actual
compensation pay-out for this period including social security contributions
is CHF 8 707 990.
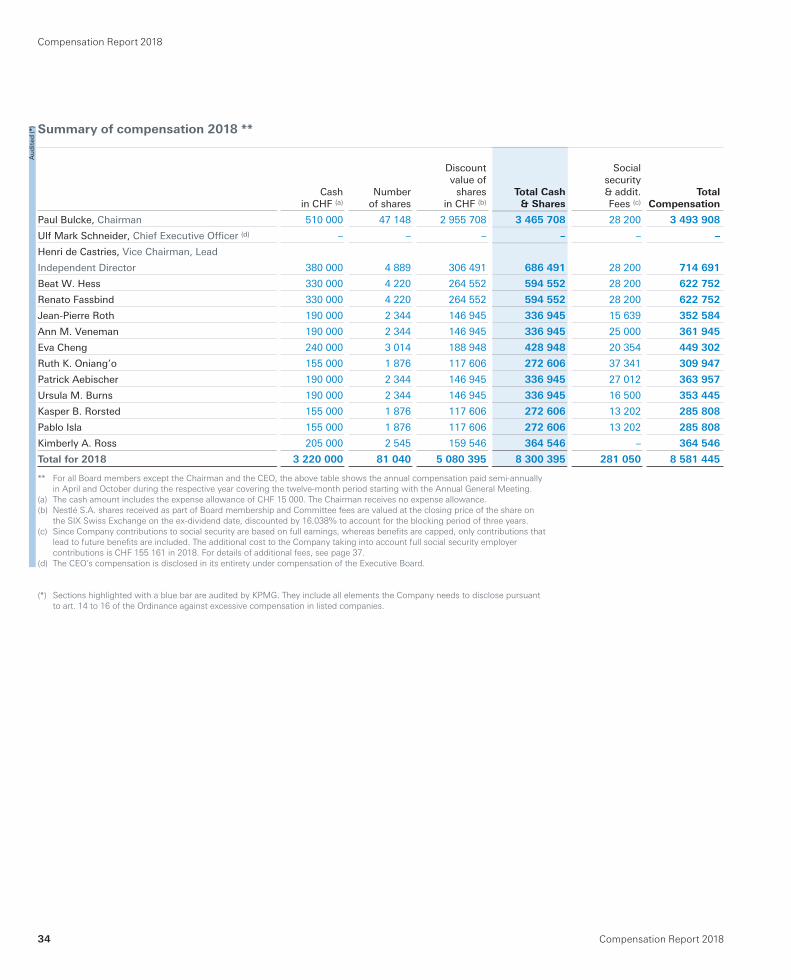
34 Compensation Report 2018
Compensation Report 2018
Summary of compensation 2018 **
Cash in CHF (a)
Numberof shares
Discount value of
shares in CHF (b)
Total Cash
& Shares
Social security& addit. Fees (c)
Total
Compensation
Paul Bulcke, Chairman 510 000 47 148 2 955 708 3 465 708 28 200 3 493 908
Ulf Mark Schneider, Chief Executive Offi cer (d) – – – – – –
Henri de Castries, Vice Chairman, Lead
Independent Director 380 000 4 889 306 491 686 491 28 200 714 691
Beat W. Hess 330 000 4 220 264 552 594 552 28 200 622 752
Renato Fassbind 330 000 4 220 264 552 594 552 28 200 622 752
Jean-Pierre Roth 190 000 2 344 146 945 336 945 15 639 352 584
Ann M. Veneman 190 000 2 344 146 945 336 945 25 000 361 945
Eva Cheng 240 000 3 014 188 948 428 948 20 354 449 302
Ruth K. Oniang’o 155 000 1 876 117 606 272 606 37 341 309 947
Patrick Aebischer 190 000 2 344 146 945 336 945 27 012 363 957
Ursula M. Burns 190 000 2 344 146 945 336 945 16 500 353 445
Kasper B. Rorsted 155 000 1 876 117 606 272 606 13 202 285 808
Pablo Isla 155 000 1 876 117 606 272 606 13 202 285 808
Kimberly A. Ross 205 000 2 545 159 546 364 546 – 364 546
Total for 2018 3 220 000 81 040 5 080 395 8 300 395 281 050 8 581 445
** For all Board members except the Chairman and the CEO, the above table shows the annual compensation paid semi-annually
in April and October during the respective year covering the twelve-month period starting with the Annual General Meeting.
(a) The cash amount includes the expense allowance of CHF 15 000. The Chairman receives no expense allowance.
(b) Nestlé S.A. shares received as part of Board membership and Committee fees are valued at the closing price of the share on
the SIX Swiss Exchange on the ex-dividend date, discounted by 16.038% to account for the blocking period of three years.
(c) Since Company contributions to social security are based on full earnings, whereas benefi ts are capped, only contributions that
lead to future benefi ts are included. The additional cost to the Company taking into account full social security employer
contributions is CHF 155 161 in 2018. For details of additional fees, see page 37.
(d) The CEO’s compensation is disclosed in its entirety under compensation of the Executive Board.
(*) Sections highlighted with a blue bar are audited by KPMG. They include all elements the Company needs to disclose pursuant
to art. 14 to 16 of the Ordinance against excessive compensation in listed companies.
Au
dit
ed (*)
Total Cash
& Shares
3 465 708
–
686 491
594 552
594 552
336 945
336 945
428 948
272 606
336 945
336 945
272 606
272 606
364 546
8 300 395
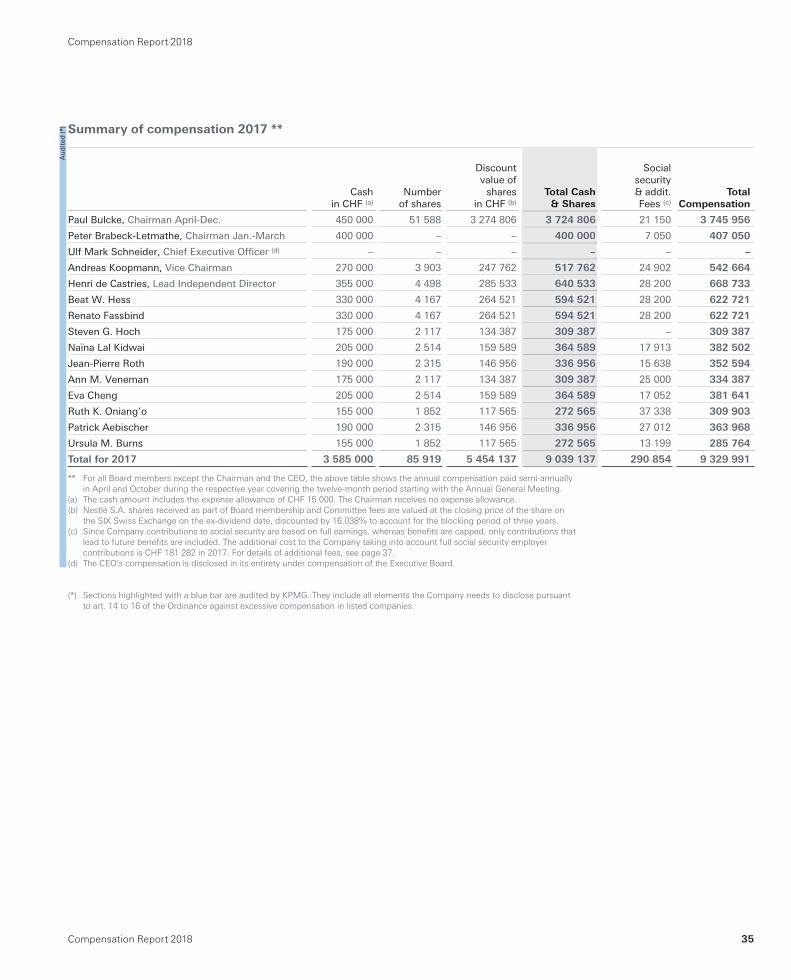
35Compensation Report 2018
Compensation Report 2018
Summary of compensation 2017 **
Cash in CHF (a)
Numberof shares
Discount value of
shares in CHF (b)
Total Cash
& Shares
Social security& addit. Fees (c)
Total
Compensation
Paul Bulcke, Chairman April-Dec. 450 000 51 588 3 274 806 3 724 806 21 150 3 745 956
Peter Brabeck-Letmathe, Chairman Jan.-March 400 000 – – 400 000 7 050 407 050
Ulf Mark Schneider, Chief Executive Offi cer (d) – – – – – –
Andreas Koopmann, Vice Chairman 270 000 3 903 247 762 517 762 24 902 542 664
Henri de Castries, Lead Independent Director 355 000 4 498 285 533 640 533 28 200 668 733
Beat W. Hess 330 000 4 167 264 521 594 521 28 200 622 721
Renato Fassbind 330 000 4 167 264 521 594 521 28 200 622 721
Steven G. Hoch 175 000 2 117 134 387 309 387 – 309 387
Naïna Lal Kidwai 205 000 2 514 159 589 364 589 17 913 382 502
Jean-Pierre Roth 190 000 2 315 146 956 336 956 15 638 352 594
Ann M. Veneman 175 000 2 117 134 387 309 387 25 000 334 387
Eva Cheng 205 000 2 514 159 589 364 589 17 052 381 641
Ruth K. Oniang’o 155 000 1 852 117 565 272 565 37 338 309 903
Patrick Aebischer 190 000 2 315 146 956 336 956 27 012 363 968
Ursula M. Burns 155 000 1 852 117 565 272 565 13 199 285 764
Total for 2017 3 585 000 85 919 5 454 137 9 039 137 290 854 9 329 991
** For all Board members except the Chairman and the CEO, the above table shows the annual compensation paid semi-annually
in April and October during the respective year covering the twelve-month period starting with the Annual General Meeting.
(a) The cash amount includes the expense allowance of CHF 15 000. The Chairman receives no expense allowance.
(b) Nestlé S.A. shares received as part of Board membership and Committee fees are valued at the closing price of the share on
the SIX Swiss Exchange on the ex-dividend date, discounted by 16.038% to account for the blocking period of three years.
(c) Since Company contributions to social security are based on full earnings, whereas benefi ts are capped, only contributions that
lead to future benefi ts are included. The additional cost to the Company taking into account full social security employer
contributions is CHF 181 282 in 2017. For details of additional fees, see page 37.
(d) The CEO’s compensation is disclosed in its entirety under compensation of the Executive Board.
(*) Sections highlighted with a blue bar are audited by KPMG. They include all elements the Company needs to disclose pursuant
to art. 14 to 16 of the Ordinance against excessive compensation in listed companies.
Total Cash
& Shares
3 724 806
400 000
–
517 762
640 533
594 521
594 521
309 387
364 589
336 956
309 387
364 589
272 565
336 956
272 565
9 039 137
Au
dit
ed (*)
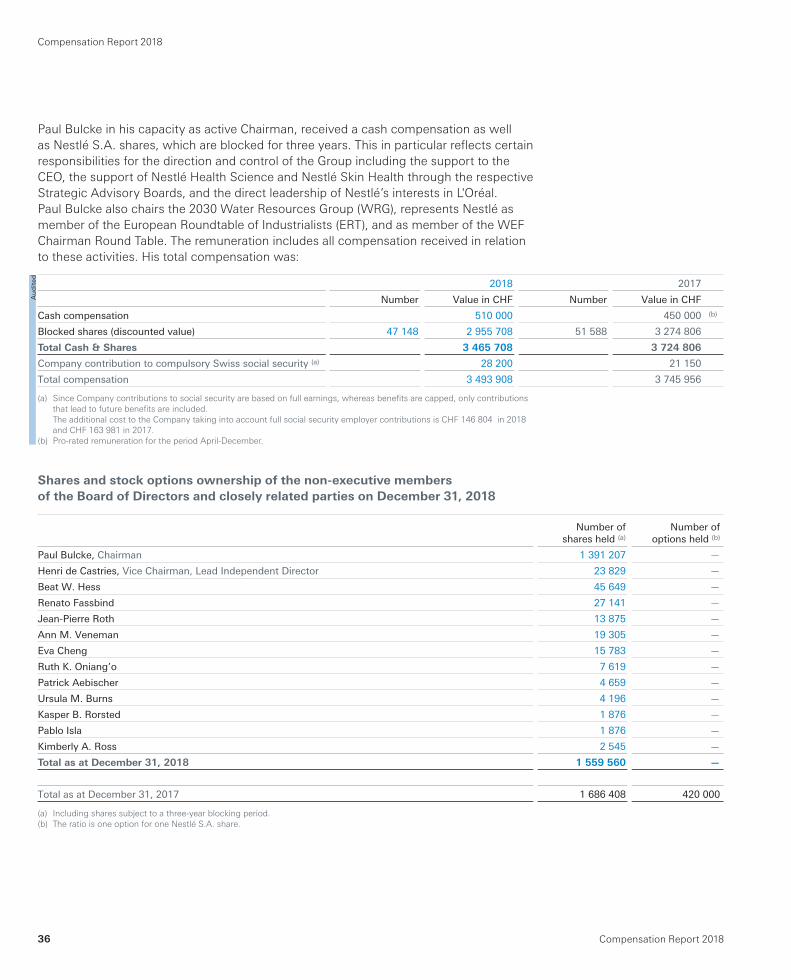
36 Compensation Report 2018
Compensation Report 2018
Paul Bulcke in his capacity as active Chairman, received a cash compensation as well
as Nestlé S.A. shares, which are blocked for three years. This in particular refl ects certain
responsibilities for the direction and control of the Group including the support to the
CEO, the support of Nestlé Health Science and Nestlé Skin Health through the respective
Strategic Advisory Boards, and the direct leadership of Nestlé’s interests in L'Oréal.
Paul Bulcke also chairs the 2030 Water Resources Group (WRG), represents Nestlé as
member of the European Roundtable of Industrialists (ERT), and as member of the WEF
Chairman Round Table. The remuneration includes all compensation received in relation
to these activities. His total compensation was:
2018 2017
Number Value in CHF Number Value in CHF
Cash compensation 510 000 450 000 (b)
Blocked shares (discounted value) 47 148 2 955 708 51 588 3 274 806
Total Cash & Shares 3 465 708 3 724 806
Company contribution to compulsory Swiss social security (a) 28 200 21 150
Total compensation 3 493 908 3 745 956
(a) Since Company contributions to social security are based on full earnings, whereas benefi ts are capped, only contributions
that lead to future benefi ts are included.
The additional cost to the Company taking into account full social security employer contributions is CHF 146 804 in 2018
and CHF 163 981 in 2017.
(b) Pro-rated remuneration for the period April-December.
Shares and stock options ownership of the non-executive members
of the Board of Directors and closely related parties on December 31, 2018
Number of shares held (a)
Number ofoptions held (b)
Paul Bulcke, Chairman 1 391 207 —
Henri de Castries, Vice Chairman, Lead Independent Director 23 829 —
Beat W. Hess 45 649 —
Renato Fassbind 27 141 —
Jean-Pierre Roth 13 875 —
Ann M. Veneman 19 305 —
Eva Cheng 15 783 —
Ruth K. Oniang’o 7 619 —
Patrick Aebischer 4 659 —
Ursula M. Burns 4 196 —
Kasper B. Rorsted 1 876 —
Pablo Isla 1 876 —
Kimberly A. Ross 2 545 —
Total as at December 31, 2018 1 559 560 —
Total as at December 31, 2017 1 686 408 420 000
(a) Including shares subject to a three-year blocking period.
(b) The ratio is one option for one Nestlé S.A. share.
Au
dit
ed
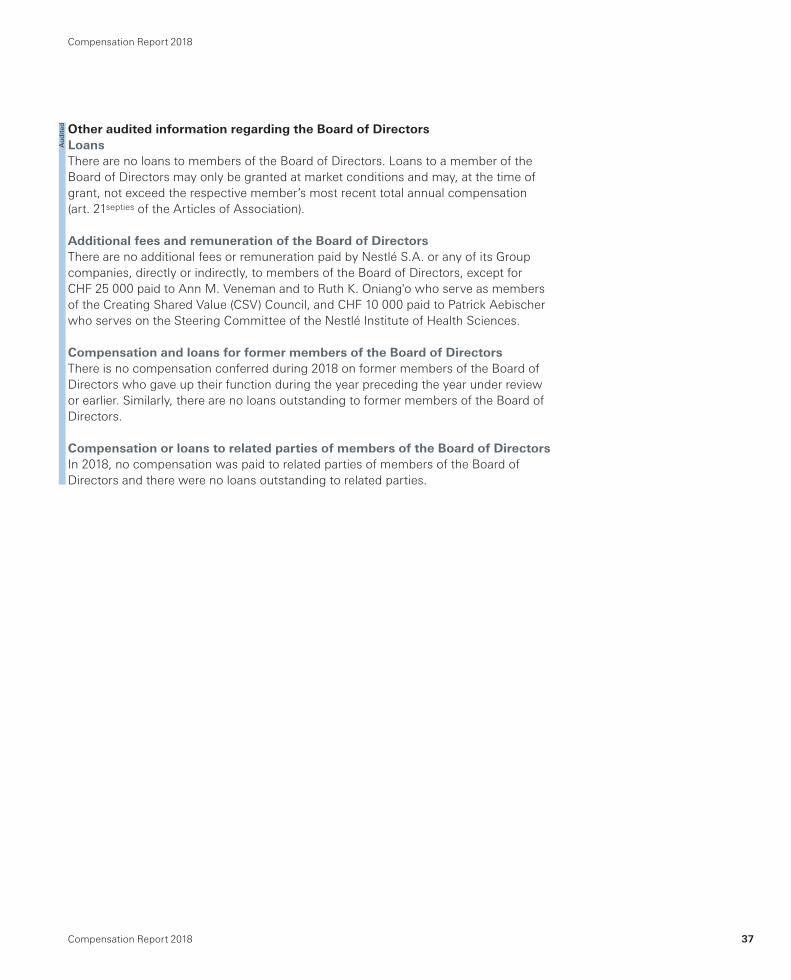
37Compensation Report 2018
Compensation Report 2018
Au
dit
ed Other audited information regarding the Board of Directors
Loans
There are no loans to members of the Board of Directors. Loans to a member of the
Board of Directors may only be granted at market conditions and may, at the time of
grant, not exceed the respective member’s most recent total annual compensation
(art. 21septies of the Articles of Association).
Additional fees and remuneration of the Board of Directors
There are no additional fees or remuneration paid by Nestlé S.A. or any of its Group
companies, directly or indirectly, to members of the Board of Directors, except for
CHF 25 000 paid to Ann M. Veneman and to Ruth K. Oniang'o who serve as members
of the Creating Shared Value (CSV) Council, and CHF 10 000 paid to Patrick Aebischer
who serves on the Steering Committee of the Nestlé Institute of Health Sciences.
Compensation and loans for former members of the Board of Directors
There is no compensation conferred during 2018 on former members of the Board of
Directors who gave up their function during the year preceding the year under review
or earlier. Similarly, there are no loans outstanding to former members of the Board of
Directors.
Compensation or loans to related parties of members of the Board of Directors
In 2018, no compensation was paid to related parties of members of the Board of
Directors and there were no loans outstanding to related parties.
38 Compensation Report 2018
Compensation Report 2018
Executive Board
Principles of compensation for members
of the Executive Board
Governance
Pursuant to art. 21bis par. 1 of Nestlé’s Articles of
Association (*), the General Meeting shall approve annually
the proposal of the Board of Directors in relation to the
maximum aggregate amount of the compensation of the
Executive Board for the following fi nancial year (**).
In the event the General Meeting has not approved
a proposal of the Board of Directors, the Board of Directors
shall determine the respective maximum aggregate amount
or maximum partial amounts of compensation, provided
that:
a) the Board of Directors takes into account: (i) the proposed
maximum aggregate amount of compensation; (ii) the
decision of the General Meeting and, to the extent known
to the Board of Directors, the main reasons for the
negative vote; and (iii) Nestlé’s compensation principles;
and
b) the Board of Directors submits the amount(s) so
determined to approval by the same General Meeting,
a subsequent Extraordinary General Meeting or the next
Annual General Meeting (art. 21bis par. 2 of the Articles
of Association).
If the maximum aggregate amount of compensation already
approved by the General Meeting is not suffi cient to also
cover compensation of one or more members who become
members of or are being promoted within the Executive
Board during a compensation period for which the General
Meeting has already approved the compensation of the
Executive Board, Nestlé or companies controlled by it shall
be authorized to pay such member(s) a supplementary
amount during the compensation period(s) already approved.
The total supplementary amount shall not exceed 40% of
the aggregate amount of compensation of the Executive
Board last approved by the General Meeting per compensation
period (art. 21ter of the Articles of Association).
Principles
The principles of compensation for members of the
Executive Board are the following:
Pay for performance
The Total Direct Compensation for the members of the
Executive Board includes a fi xed portion (Annual Base
Salary) and a variable portion (Short-Term Bonus and
Long-Term Incentives). The fi xed compensation takes into
account individual performance. Variable compensation is
determined based on collective and individual performance.
These are intended to ensure a major part of executive
rewards are contingent on achieving demanding
performance goals.
Alignment with long-term company strategy and
shareholder interests
Compensation for members of the Executive Board is
aligned with company strategy and shareholders’ interests.
The Short-Term Bonus payout is determined by the degree
of achievement of a number of objectives aligned to annual
business plans. Long-Term Incentives are provided in the
form of share-based instruments, therefore ensuring
alignment with shareholders’ interests. In 2018, the main
Long-Term Incentive instrument was the Performance Share
Unit Plan (PSUP). PSUs have a vesting period of three years,
with a further holding period of two years for Executive
Board members, leading to a total restriction period of fi ve
years. Their alignment with shareholder interests is reinforced
through pay-outs being tied to underlying Earnings per
Share (EPS) growth, relative Total Shareholder Return (TSR)
performance and Return on Invested Capital (ROIC).
Coherence in remuneration plans and levels throughout
the Company
The Company aims to align remuneration plans across the
Group and to ensure that compensation rewards appropriately
for the added responsibilities of positions held. This is refl ected
in the relative remuneration levels of the Executive Board.
(*) Nestlé S.A.’s Articles of Association can be found on page 51 and on www.nestle.com/investors/corporate-governance/articles
(**) The Board of Directors may submit for approval by the General Meeting deviating or additional proposals relating to the
same or different periods.
39Compensation Report 2018
Compensation Report 2018
Compensation to be internationally competitive by
using selected benchmarks
The compensation packages for the members of the
Executive Board need to be competitive in a dynamic
international environment. Nestlé targets its overall
remuneration policy to be between the median and
the 75th percentile of the selected external benchmarks
(please refer to page 43). Whenever appropriate, the
benchmark values are adjusted for the size of Nestlé.
The market competitiveness of the Executive Board is
therefore periodically assessed using the services of
Willis Towers Watson, a reputed international human
capital and benefi ts consultancy.
The total compensation package consists of the following
elements:
1. Base Salary
The Base Salary is the foundation of the total
compensation. It refl ects the experience, expertise and
sustained performance of the Executive Board member as
well as taking into account external market competitiveness.
It also serves as the basis for determining the Short-Term
Bonus target levels, and the allocation of Long-Term
Incentives. The Base Salary is reviewed annually by the
Compensation Committee. Criteria for adjustments are
individual contribution and the level of competitiveness
against the benchmarks.
2. Short-Term Bonus
The Short-Term Bonus is intended to reward results achieved
against annual collective and individual objectives related to
Nestlé’s overall business strategy. The Short-Term Bonus is
paid in cash and/or in Nestlé S.A. shares, which are subject
to a three-year blocking period.
Governance
Pursuant to art. 21quater of Nestlé’s Articles of Association (*),
variable compensation may comprise short-term
compensation elements, and shall be subject to caps
expressed as predetermined multipliers of the respective
target levels.
Short-term compensation elements are governed by
performance metrics that take into account the performance
of Nestlé and/or parts thereof, targets in relation to the
market, to other companies or to comparable benchmarks
and/or individual targets, and achievement of which is
generally measured based on a one-year period. The annual
target level of the short-term compensation elements is
determined as a percentage of the Base Salary; depending
on achieved performance, the compensation may amount
up to a pre-determined multiplier of target level.
The Board of Directors or, to the extent delegated to it,
the Compensation Committee determines performance
metrics and target levels, and their achievement.
(*) Nestlé S.A.’s Articles of Association can be found on page 51 and on www.nestle.com/investors/corporate-governance/articles
40 Compensation Report 2018
Compensation Report 2018
Objectives 2018
The Short-Term Bonus (Annual Bonus) is based on
a bonus target expressed in % of the Annual Base Salary.
In 2018, the following target levels were applicable
– CEO: 150%;
– Executive Vice President: 100%;
– Deputy Executive Vice President: 80%.
For the CEO, 100% of the target was linked to performance
against the Nestlé Group objectives (see below). For the
other members of the Executive Board, at least 50% of
the target is linked to business performance, to ensure
accountability for Nestlé’s results: for Function Heads, 50%
is tied to Group performance, 30% to functional objectives
and 20% to their individual performance (quantitative and
qualitative objectives); for Zone or Business Heads, 30%
is tied to Group performance, 50% to business objectives
they are directly responsible for, and 20% to individual
performance (quantitative and qualitative objectives).
In case an executive reaches all objectives in full, the
bonus payout will correspond to the targeted level. If one
or more objectives are not reached, the bonus is reduced.
The bonus payout is capped at a maximum of 130% of the
target. There is no guarantee for the payout of a minimum
bonus.
Members of the Executive Board can elect to receive
part or all of their Short-Term Bonus in Nestlé S.A. shares.
The CEO has to take a minimum of 50% in shares.
The number of shares granted is determined using the
average market closing price of the last ten trading days
of January 2019.
Group objectives
Every year, the Board of Directors defi nes a set of key
quantitative operational objectives, which comprise the main
elements in determining the annual Group performance for
the following year. These are linked to measurable fi nancial
objectives. In 2018, their weighting was 40% Organic Growth,
40% Profi tability (Underlying Trading Operating Profi t &
Trading Operating Profi t margins), 10% Cash Flow and
10% Structural Costs Optimization.
Additional quantitative and qualitative objectives, set by
the Board of Directors in line with Nestlé’s strategy are also
used to determine the Nestlé Group performance. This set
of additional objectives refl ects Nestlé’s Creating Shared
Value framework and includes the proportion of products
with Nutrition, Health & Wellness benefi ts, market shares,
capital expenditure, working capital reduction, progress
on digitalization, strengthening Nestlé’s values and culture,
or further progress on quality, safety, sustainability and
compliance.
The above objectives are kept under review by the Board
of Directors so as to ensure they are aligned with Nestlé’s
business objectives and its strategic ambition.
Business, Functional and Individual objectives
Business, functional and individual objectives are determined
by the CEO for each member of the Executive Board. They
are related to the individual area of responsibility and are
of a fi nancial or non-fi nancial nature.
41Compensation Report 2018
Compensation Report 2018
3. Long-Term Incentives
Long-Term Incentives are intended to reward sustained
business success and overall shareholder value creation
as well as to retain key senior management members.
Governance
Pursuant to art. 21quater of Nestlé’s Articles of Association (*),
variable compensation may comprise long-term compensation
elements, and shall be subject to caps expressed as pre-
determined multipliers of the respective target levels.
Long-term compensation elements are governed by
performance metrics that take into account strategic
objectives of Nestlé, and achievement of which is generally
measured based on a multi-annual period. The annual target
level of the long-term compensation elements is determined
as a percentage of the Base Salary; depending on the
achieved performance, the compensation may amount up
to a pre-determined multiplier of the target level. Vesting
periods, as determined by the Board of Directors or, to
the extent delegated to it, the Compensation Committee
shall be at least three years. See further art. 21quater par. 6
to par. 8 of the Articles of Association.
The Board of Directors or, to the extent delegated to it,
the Compensation Committee determines performance
metrics and target levels, and their achievement.
Target levels 2018
In 2018, members of Nestlé’s Executive Board were eligible
to receive Long-Term Incentives in the form of Performance
Share Units under the Performance Share Unit Plan (PSUP).
The grant value for Long-Term Incentives in 2018 was the
following:
– CEO: 150% of the Annual Base Salary
– Executive Vice President and Deputy Executive Vice
President: 100% of the Annual Base Salary
The fair value of Long-Term Incentives at grant is
determined by using generally accepted pricing models.
Please refer to explanations on page 45.
The PSUP provides units which entitle participants to receive
Nestlé S.A. shares at the end of the three-year vesting
period. These shares remain blocked for a further period
of two years for Executive Board members.
The level at which PSUs vest is determined by the degree
by which the three performance measures of the PSUP are
met over the full three-year vesting period. These three
criteria are:
– the growth of underlying Earnings per Share (EPS) in
constant currencies;
– the relative Total Shareholder Return (TSR) of the
Nestlé S.A. share in relation to the STOXX Global 1800
Food & Beverage Gross Return Index; and
– the Return on Invested Capital (ROIC).
Growth of underlying Earnings per Share, Total Shareholder
Return performance in relation to peers and Return on
Invested Capital are commonly used measures to determine
senior management long-term performance in the industry.
Growth of underlying Earnings per Share will be weighted
at 50%, Total Shareholder Return Performance (TSR) at 30%
and Return on Invested Capital (ROIC) at 20% to determine
the vesting level of the initial PSU award.
All three performance measures will be subject to
Compensation Committee review in case of extraordinary
events.
The PSUP will cover only Executive Board and Senior
Vice Presidents. A Restricted Stock Unit Plan (RSUP) has
been re-introduced for all other participants.
(*) Nestlé S.A.’s Articles of Association can be found on page 51 and on www.nestle.com/investors/corporate-governance/articles
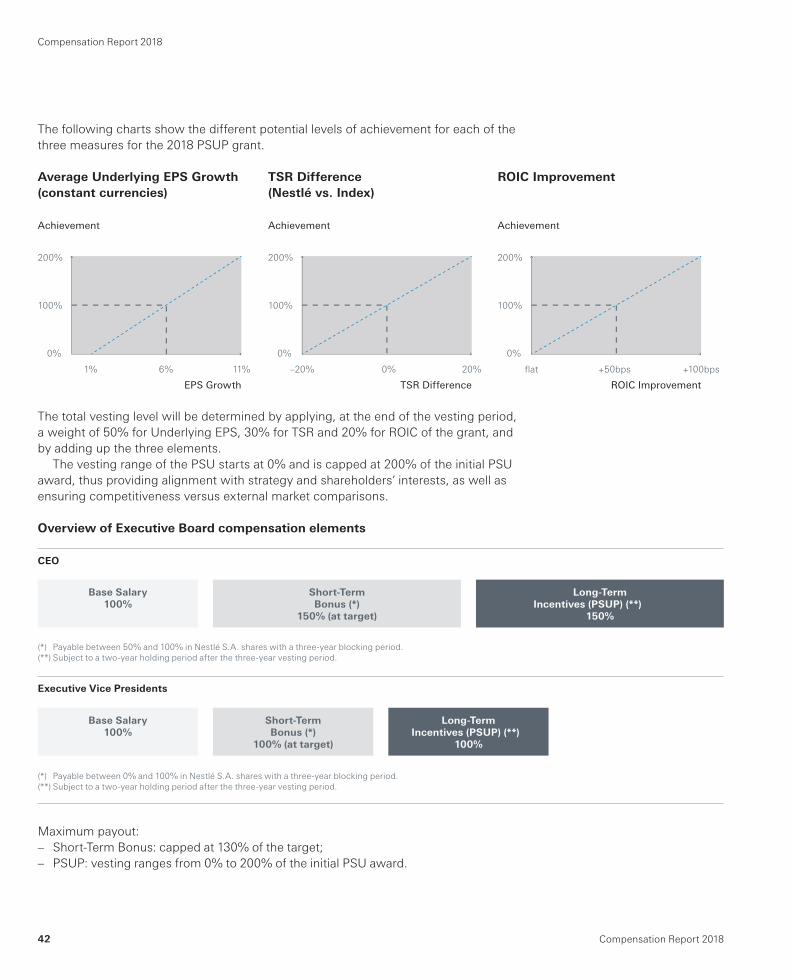
42 Compensation Report 2018
Compensation Report 2018
The following charts show the different potential levels of achievement for each of the
three measures for the 2018 PSUP grant.
The total vesting level will be determined by applying, at the end of the vesting period,
a weight of 50% for Underlying EPS, 30% for TSR and 20% for ROIC of the grant, and
by adding up the three elements.
The vesting range of the PSU starts at 0% and is capped at 200% of the initial PSU
award, thus providing alignment with strategy and shareholders’ interests, as well as
ensuring competitiveness versus external market comparisons.
Average Underlying EPS Growth
(constant currencies)
Achievement
200%
100%
0%
1% 6% 11%
EPS Growth
TSR Difference
(Nestlé vs. Index)
Achievement
200%
100%
0%
–20% 0% 20%
TSR Difference
ROIC Improvement
Achievement
200%
100%
0%
flat +50bps +100bps
ROIC Improvement
Overview of Executive Board compensation elements
CEO
(*) Payable between 50% and 100% in Nestlé S.A. shares with a three-year blocking period.
(**) Subject to a two-year holding period after the three-year vesting period.
Executive Vice Presidents
(*) Payable between 0% and 100% in Nestlé S.A. shares with a three-year blocking period.
(**) Subject to a two-year holding period after the three-year vesting period.
Maximum payout:
– Short-Term Bonus: capped at 130% of the target;
– PSUP: vesting ranges from 0% to 200% of the initial PSU award.
Base Salary
100%
Base Salary
100%
Short-Term
Bonus (*)
150% (at target)
Short-Term
Bonus (*)
100% (at target)
Long-Term
Incentives (PSUP) (**) (*)(*)
150%
Long-Term
Incentives (PSUP) (**) (
100%
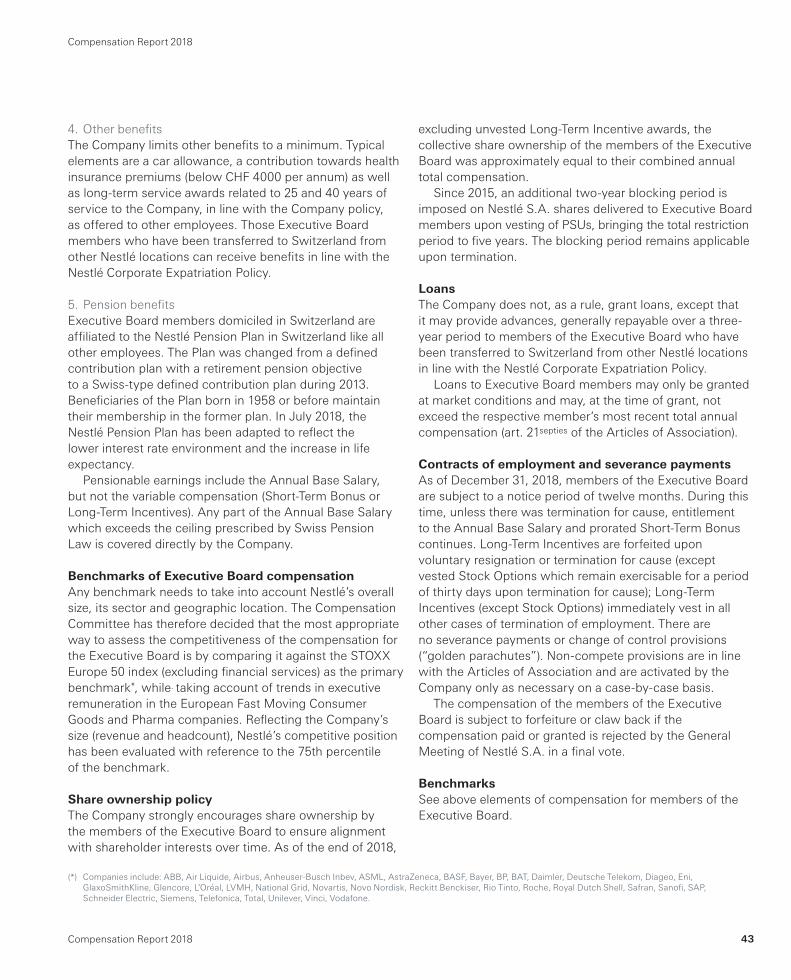
43Compensation Report 2018
Compensation Report 2018
4. Other benefi ts
The Company limits other benefi ts to a minimum. Typical
elements are a car allowance, a contribution towards health
insurance premiums (below CHF 4000 per annum) as well
as long-term service awards related to 25 and 40 years of
service to the Company, in line with the Company policy,
as offered to other employees. Those Executive Board
members who have been transferred to Switzerland from
other Nestlé locations can receive benefi ts in line with the
Nestlé Corporate Expatriation Policy.
5. Pension benefi ts
Executive Board members domiciled in Switzerland are
affi liated to the Nestlé Pension Plan in Switzerland like all
other employees. The Plan was changed from a defi ned
contribution plan with a retirement pension objective
to a Swiss-type defi ned contribution plan during 2013.
Benefi ciaries of the Plan born in 1958 or before maintain
their membership in the former plan. In July 2018, the
Nestlé Pension Plan has been adapted to refl ect the
lower interest rate environment and the increase in life
expectancy.
Pensionable earnings include the Annual Base Salary,
but not the variable compensation (Short-Term Bonus or
Long-Term Incentives). Any part of the Annual Base Salary
which exceeds the ceiling prescribed by Swiss Pension
Law is covered directly by the Company.
Benchmarks of Executive Board compensation
Any benchmark needs to take into account Nestlé’s overall
size, its sector and geographic location. The Compensation
Committee has therefore decided that the most appropriate
way to assess the competitiveness of the compensation for
the Executive Board is by comparing it against the STOXX
Europe 50 index (excluding fi nancial services) as the primary
benchmark*, while. taking account of trends in executive
remuneration in the European Fast Moving Consumer
Goods and Pharma companies. Refl ecting the Company’s
size (revenue and headcount), Nestlé’s competitive position
has been evaluated with reference to the 75th percentile
of the benchmark.
Share ownership policy
The Company strongly encourages share ownership by
the members of the Executive Board to ensure alignment
with shareholder interests over time. As of the end of 2018,
excluding unvested Long-Term Incentive awards, the
collective share ownership of the members of the Executive
Board was approximately equal to their combined annual
total compensation.
Since 2015, an additional two-year blocking period is
imposed on Nestlé S.A. shares delivered to Executive Board
members upon vesting of PSUs, bringing the total restriction
period to fi ve years. The blocking period remains applicable
upon termination.
Loans
The Company does not, as a rule, grant loans, except that
it may provide advances, generally repayable over a three-
year period to members of the Executive Board who have
been transferred to Switzerland from other Nestlé locations
in line with the Nestlé Corporate Expatriation Policy.
Loans to Executive Board members may only be granted
at market conditions and may, at the time of grant, not
exceed the respective member’s most recent total annual
compensation (art. 21septies of the Articles of Association).
Contracts of employment and severance payments
As of December 31, 2018, members of the Executive Board
are subject to a notice period of twelve months. During this
time, unless there was termination for cause, entitlement
to the Annual Base Salary and prorated Short-Term Bonus
continues. Long-Term Incentives are forfeited upon
voluntary resignation or termination for cause (except
vested Stock Options which remain exercisable for a period
of thirty days upon termination for cause); Long-Term
Incentives (except Stock Options) immediately vest in all
other cases of termination of employment. There are
no severance payments or change of control provisions
(“golden parachutes”). Non-compete provisions are in line
with the Articles of Association and are activated by the
Company only as necessary on a case-by-case basis.
The compensation of the members of the Executive
Board is subject to forfeiture or claw back if the
compensation paid or granted is rejected by the General
Meeting of Nestlé S.A. in a fi nal vote.
Benchmarks
See above elements of compensation for members of the
Executive Board.
(*) Companies include: ABB, Air Liquide, Airbus, Anheuser-Busch Inbev, ASML, AstraZeneca, BASF, Bayer, BP, BAT, Daimler, Deutsche Telekom, Diageo, Eni,
GlaxoSmithKline, Glencore, L’Oréal, LVMH, National Grid, Novartis, Novo Nordisk, Reckitt Benckiser, Rio Tinto, Roche, Royal Dutch Shell, Safran, Sanofi , SAP,
Schneider Electric, Siemens, Telefonica, Total, Unilever, Vinci, Vodafone.
44 Compensation Report 2018
Compensation Report 2018
Compensation 2018 for members of the Executive Board
At the Annual General Meeting of April 6, 2017, the shareholders approved a maximum
compensation for members of the Executive Board of CHF 60 million for 2018. The total
compensation paid to members of the Executive Board in 2018, including contributions
towards future pension benefi ts and total social security contributions, was
CHF 47 650 636.
Compensation for members of the Executive Board in CHF (including the CEO)
2018 2017
Annual Base Salary 13 211 669 14 102 798
Short-Term Bonus (cash) 8 529 175 8 469 438
Short-Term Bonus (discounted value of Nestlé S.A. share) 5 983 054 3 744 001
Performance Share Units (fair value at grant) 11 001 761 10 985 508
Other benefi ts 1 850 211 603 360
Total 40 575 870 37 905 105
% Fixed/Variable 37.1 – 62.9 38.8 – 61.2
Company contributions towards future pension benefi ts
(in line with Nestlé’s Pension Benefi t Policy described above) 4 444 147 2 639 785
Company contributions to compulsory Swiss social security (a) 354 850 394 800
Additional remuneration and fees paid to members of the Executive Board 551 106 522 074
Total including the elements above 45 925 973 41 461 764
The above compensation table includes the following:
2018 2017
Number of Nestlé S.A. shares granted 83 855 54 641
Number of Performance Share Units granted under the PSUP 183 485 196 310
(a) Since the Company contributions to social security are based on full earnings, whereas benefi ts are capped, only
contributions that lead to future benefi ts are included. The additional cost to the Company taking into account full social
security employer contributions is CHF 1 724 663 in 2018 and CHF 1 547 837 in 2017.
Au
dit
ed
45Compensation Report 2018
Compensation Report 2018
Explanations
– On December 31, 2018, the Executive Board consisted of 12 members.
– Mr. Peter Vogt retired on August 1, 2018.
– Other benefi ts include a car allowance, contribution towards health insurance
premiums, long-term service awards and expatriate benefi ts.
– Nestlé S.A. shares received as part of the Short-Term Bonus are valued at the average
closing price of the last ten trading days of January 2019, discounted by 16.038%
to account for the three-year blocking period.
– Performance Share Units granted in 2018 are disclosed at fair value at grant, which
corresponds to CHF 59.96. The fair value is determined using a valuation model which
refl ects the probability of overachievement or underachievement on the Total
Shareholder Return measure, which is a market condition, and based on fi ve-year
historical data. The other inputs incorporated into the valuation model comprise the
market price of Nestlé S.A. shares at grant date, discounted at a risk-free interest rate
and adjusted for the dividends that participants are not entitled to receive during
the vesting period of three years.
– The values in the table above differ in some respect from the compensation disclosure
in Note 18.1 of the Consolidated Financial Statements of the Nestlé Group 2018, which
have been prepared in accordance with International Financial Reporting Standards
(IFRS). The differences relate to the timing of valuation of Performance Share Units,
whose values are spread over three years under IFRS but reported fully at the grant
date in this report, and to the valuation of blocked shares, which are not subject to
a discount for the blocking period under IFRS.
Payout levels
– The Short-Term Bonus payout for the Executive Board was 113.7% in 2018, based
on the achievement of the relevant Group and individual quantitative and qualitative
objectives (2017: 89%).
– The Performance Share Units granted in 2016 vest in March 2019 with a payout
of 127% of the initial PSU award (PSUs granted in 2015 vested in 2018 with a payout
of 85%).
Events after the balance sheet date (all effective on January 1, 2019)
– Mrs. Wan Ling Martello retired, succeeded by Mr. Chris Johnson, as CEO of Zone AOA.
– Mrs. Béatrice Guillaume-Grabisch was appointed member of the Executive Board
in charge of Group Human Resources and Business Services, succeeding
Mr. Chris Johnson.
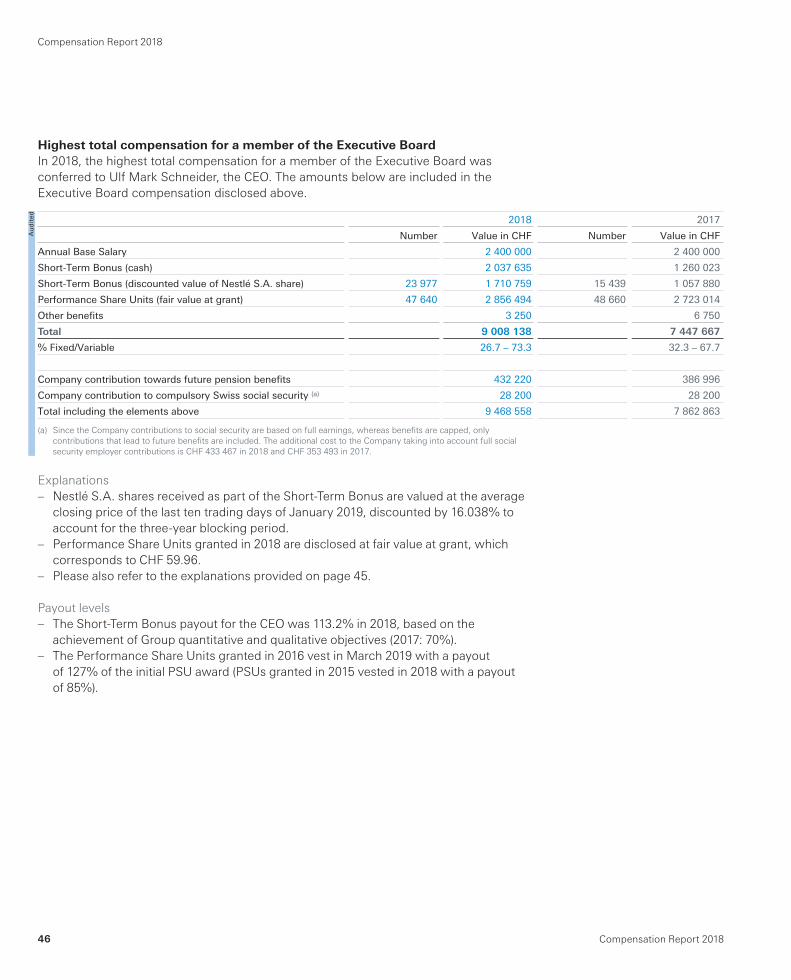
46 Compensation Report 2018
Compensation Report 2018
Highest total compensation for a member of the Executive Board
In 2018, the highest total compensation for a member of the Executive Board was
conferred to Ulf Mark Schneider, the CEO. The amounts below are included in the
Executive Board compensation disclosed above.
2018 2017
Number Value in CHF Number Value in CHF
Annual Base Salary 2 400 000 2 400 000
Short-Term Bonus (cash) 2 037 635 1 260 023
Short-Term Bonus (discounted value of Nestlé S.A. share) 23 977 1 710 759 15 439 1 057 880
Performance Share Units (fair value at grant) 47 640 2 856 494 48 660 2 723 014
Other benefi ts 3 250 6 750
Total 9 008 138 7 447 667
% Fixed/Variable 26.7 – 73.3 32.3 – 67.7
Company contribution towards future pension benefi ts 432 220 386 996
Company contribution to compulsory Swiss social security (a) 28 200 28 200
Total including the elements above 9 468 558 7 862 863
(a) Since the Company contributions to social security are based on full earnings, whereas benefi ts are capped, only
contributions that lead to future benefi ts are included. The additional cost to the Company taking into account full social
security employer contributions is CHF 433 467 in 2018 and CHF 353 493 in 2017.
Explanations
– Nestlé S.A. shares received as part of the Short-Term Bonus are valued at the average
closing price of the last ten trading days of January 2019, discounted by 16.038% to
account for the three-year blocking period.
– Performance Share Units granted in 2018 are disclosed at fair value at grant, which
corresponds to CHF 59.96.
– Please also refer to the explanations provided on page 45.
Payout levels
– The Short-Term Bonus payout for the CEO was 113.2% in 2018, based on the
achievement of Group quantitative and qualitative objectives (2017: 70%).
– The Performance Share Units granted in 2016 vest in March 2019 with a payout
of 127% of the initial PSU award (PSUs granted in 2015 vested in 2018 with a payout
of 85%).
Au
dit
ed
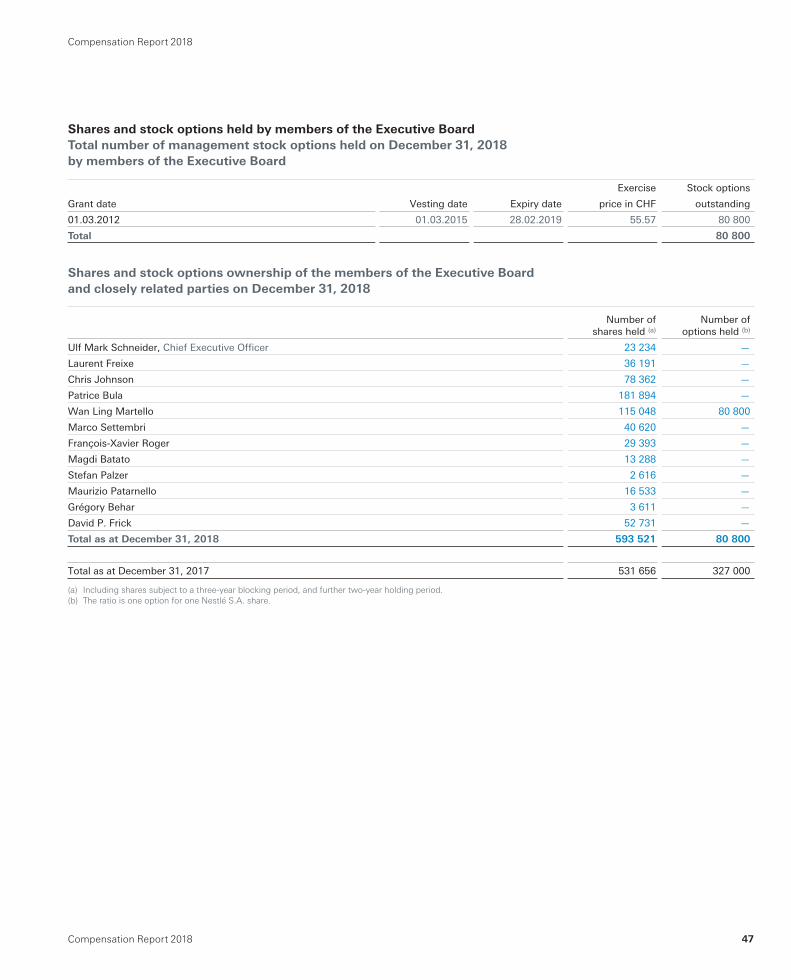
47Compensation Report 2018
Compensation Report 2018
Shares and stock options held by members of the Executive Board
Total number of management stock options held on December 31, 2018
by members of the Executive Board
Grant date Vesting date Expiry date
Exercise
price in CHF
Stock options
outstanding
01.03.2012 01.03.2015 28.02.2019 55.57 80 800
Total 80 800
Shares and stock options ownership of the members of the Executive Board
and closely related parties on December 31, 2018
Number of shares held (a)
Number ofoptions held (b)
Ulf Mark Schneider, Chief Executive Offi cer 23 234 —
Laurent Freixe 36 191 —
Chris Johnson 78 362 —
Patrice Bula 181 894 —
Wan Ling Martello 115 048 80 800
Marco Settembri 40 620 —
François-Xavier Roger 29 393 —
Magdi Batato 13 288 —
Stefan Palzer 2 616 —
Maurizio Patarnello 16 533 —
Grégory Behar 3 611 —
David P. Frick 52 731 —
Total as at December 31, 2018 593 521 80 800
Total as at December 31, 2017 531 656 327 000
(a) Including shares subject to a three-year blocking period, and further two-year holding period.
(b) The ratio is one option for one Nestlé S.A. share.
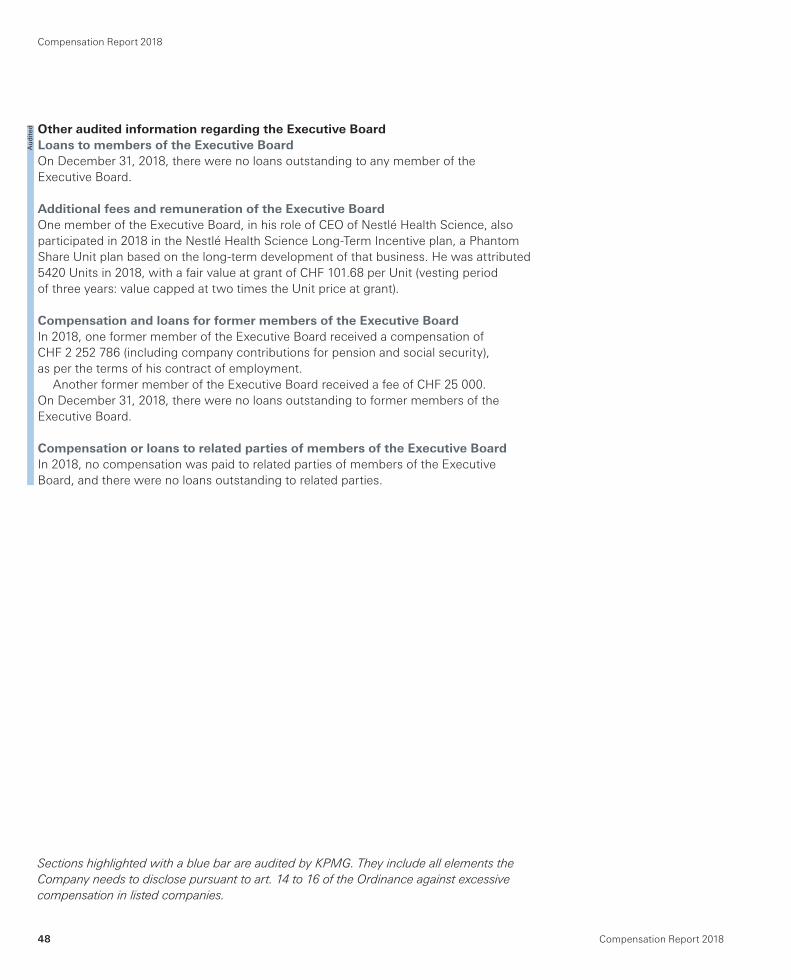
48 Compensation Report 2018
Compensation Report 2018
Other audited information regarding the Executive Board
Loans to members of the Executive Board
On December 31, 2018, there were no loans outstanding to any member of the
Executive Board.
Additional fees and remuneration of the Executive Board
One member of the Executive Board, in his role of CEO of Nestlé Health Science, also
participated in 2018 in the Nestlé Health Science Long-Term Incentive plan, a Phantom
Share Unit plan based on the long-term development of that business. He was attributed
5420 Units in 2018, with a fair value at grant of CHF 101.68 per Unit (vesting period
of three years: value capped at two times the Unit price at grant).
Compensation and loans for former members of the Executive Board
In 2018, one former member of the Executive Board received a compensation of
CHF 2 252 786 (including company contributions for pension and social security),
as per the terms of his contract of employment.
Another former member of the Executive Board received a fee of CHF 25 000.
On December 31, 2018, there were no loans outstanding to former members of the
Executive Board.
Compensation or loans to related parties of members of the Executive Board
In 2018, no compensation was paid to related parties of members of the Executive
Board, and there were no loans outstanding to related parties.
Au
dit
ed
Sections highlighted with a blue bar are audited by KPMG. They include all elements the
Company needs to disclose pursuant to art. 14 to 16 of the Ordinance against excessive
compensation in listed companies.
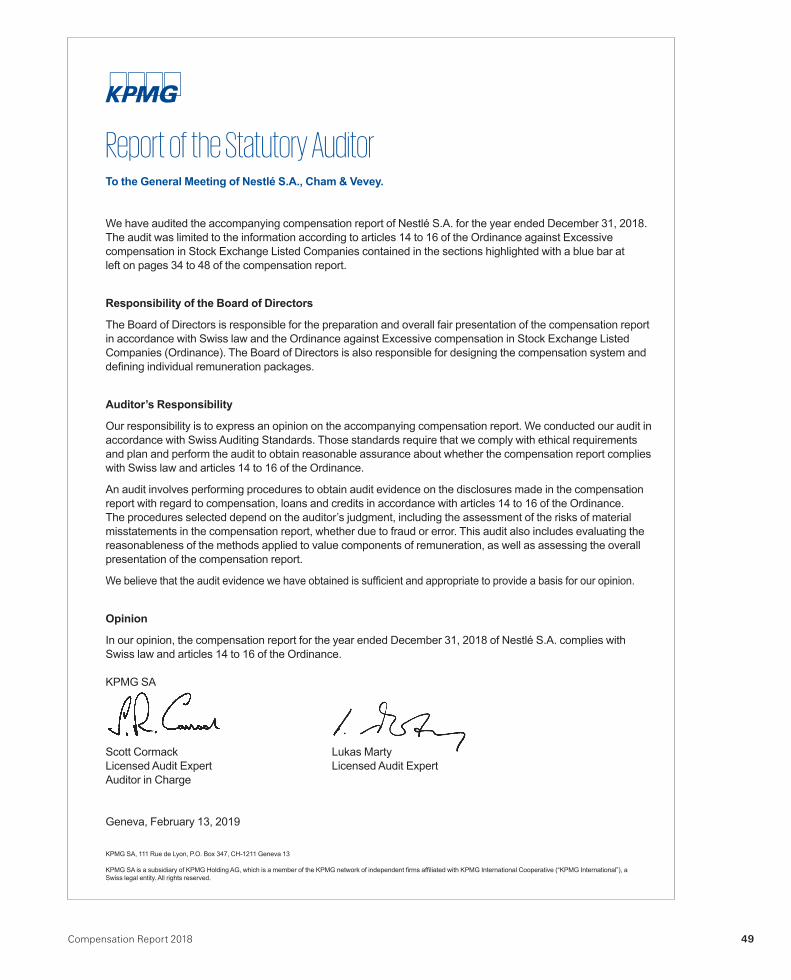
49Compensation Report 2018
Report of the Statutory AuditorTo the General Meeting of Nestlé S.A., Cham & Vevey.
We have audited the accompanying compensation report of Nestlé S.A. for the year ended December 31, 2018. The audit was limited to the information according to articles 14 to 16 of the Ordinance against Excessive compensation in Stock Exchange Listed Companies contained in the sections highlighted with a blue bar at left on pages 34 to 48 of the compensation report.
Responsibility of the Board of Directors
The Board of Directors is responsible for the preparation and overall fair presentation of the compensation report in accordance with Swiss law and the Ordinance against Excessive compensation in Stock Exchange Listed Companies (Ordinance). The Board of Directors is also responsible for designing the compensation system and defining individual remuneration packages.
Auditor’s Responsibility
Our responsibility is to express an opinion on the accompanying compensation report. We conducted our audit in accordance with Swiss Auditing Standards. Those standards require that we comply with ethical requirements and plan and perform the audit to obtain reasonable assurance about whether the compensation report complies with Swiss law and articles 14 to 16 of the Ordinance.
An audit involves performing procedures to obtain audit evidence on the disclosures made in the compensation report with regard to compensation, loans and credits in accordance with articles 14 to 16 of the Ordinance. The procedures selected depend on the auditor’s judgment, including the assessment of the risks of material misstatements in the compensation report, whether due to fraud or error. This audit also includes evaluating the reasonableness of the methods applied to value components of remuneration, as well as assessing the overall presentation of the compensation report.
We believe that the audit evidence we have obtained is sufficient and appropriate to provide a basis for our opinion.
Opinion
In our opinion, the compensation report for the year ended December 31, 2018 of Nestlé S.A. complies with Swiss law and articles 14 to 16 of the Ordinance.
KPMG SA
Scott Cormack Lukas MartyLicensed Audit Expert Licensed Audit ExpertAuditor in Charge
Geneva, February 13, 2019
KPMG SA, 111 Rue de Lyon, P.O. Box 347, CH-1211 Geneva 13
KPMG SA is a subsidiary of KPMG Holding AG, which is a member of the KPMG network of independent firms affiliated with KPMG International Cooperative (“KPMG International”), a Swiss legal entity. All rights reserved.

50 Compensation Report 2018
Corporate Governance Report 2018 51
Articles of Associationof Nestlé S.A.
Amended by theAnnual General Meetingof April 12, 2018
Corporate Governance Report 201852
Articles of Association of Nestlé S.A.Translation*
I. General
Article 1
Corporate name; Registered offi ces; Duration
1 Nestlé S.A. (Nestlé AG) (Nestlé Ltd.) (hereinafter “Nestlé”)
is a company limited by shares incorporated and organised
in accordance with the Swiss Code of Obligations.
2 The registered offi ces of Nestlé are in Cham and Vevey,
Switzerland.
3 The duration of Nestlé is unlimited.
Article 2
Purpose
1 The purpose of Nestlé is to participate in industrial, service,
commercial and fi nancial enterprises in Switzerland and
abroad, in particular in the food, nutrition, health, wellness
and related industries.
2 Nestlé may itself establish such undertakings or participate
in, fi nance and promote the development of undertakings
already in existence.
3 Nestlé may enter into any transaction which the business
purpose may entail. Nestlé shall, in pursuing its business
purpose, aim for long-term, sustainable value creation.
II. Share Capital
Article 3
Share capital
The share capital of Nestlé is CHF 306 300 000 (three
hundred and six million three hundred thousand Swiss
francs) divided into 3 063 000 000 fully paid up registered
shares with a nominal value of CHF 0.10 each.
Article 3bis
Conditional share capital
1 The share capital of Nestlé may be increased in an amount
not to exceed CHF 10 000 000 (ten million Swiss francs)
by issuing up to 100 000 000 registered shares with
a nominal value of CHF 0.10 each, which shall be fully
paid up, through the exercise of conversion rights and/or
option rights granted in connection with the issuance
by Nestlé or one of its subsidiaries of newly or already
issued convertible debentures, debentures with option
rights or other fi nancial market instruments.
2 The shareholders have no preferential rights to subscribe
for these new shares. The current owners of conversion
rights and/or option rights shall be entitled to subscribe
for the new shares.
3 The new shares shall be subject, as soon as they are
issued following the exercise of conversion and/or option
rights, to the restrictions set forth in art. 5.
4 The Board of Directors may limit or withdraw the right
of the shareholders to subscribe in priority to convertible
debentures, debentures with option rights or similar
fi nancial market instruments when they are issued, if:
a) an issue by fi rm underwriting by a consortium with
subsequent offering to the public without preferential
subscription rights seems to be the most appropriate
form of issue at the time, particularly in terms of the
conditions for issue; or
b) the fi nancial market instruments with conversion or
option rights are issued in connection with the fi nancing
or refi nancing of the acquisition of an enterprise or parts
of an enterprise or participations or new investments.
5 Any fi nancial market instruments with conversion or
option rights which the Board of Directors decides not
to offer directly or indirectly for prior subscription to the
shareholders shall be subject to the following conditions:
a) Conversion rights may be exercised only for up to 15 years,
and option rights only during 7 years from the date of issue
of the relevant fi nancial market instruments.
b) The new shares shall be issued according to the applicable
conversion or option conditions. The respective fi nancial
instruments must be issued at the relevant market
conditions.
c) The issue of new shares upon exercise of option or
conversion rights shall be made at conditions taking
into account the market price of the shares and/or
comparable instruments with a market price at the time
of issuance of the relevant convertible debenture,
debenture with option rights or similar fi nancial market
instrument.
Article 4
Share certifi cates; Intermediated securities
1 Nestlé may issue its registered shares in the form of
single certifi cates, global certifi cates or uncertifi cated
securities. Under the conditions set forth by statutory
law, Nestlé may convert its registered shares from one
form into another form at any time and without the
approval of the shareholders. Nestlé shall bear the cost
of any such conversion.
* This is an unoffi cial translation. In case of doubt or differences
of interpretation, the offi cial French and German versions of
the Articles of Association shall prevail over the English text.
Corporate Governance Report 2018 53
Articles of Association of Nestlé S.A.
2 If registered shares are issued in the form of single
certifi cates or global certifi cates, they shall be signed by
two members of the Board of Directors. Both signatures
may be affi xed in facsimile.
3 The shareholder has no right to demand a conversion of
the form of the registered shares. Each shareholder may,
however, at any time request a written confi rmation from
Nestlé of the registered shares held by such shareholder,
as refl ected in the share register.
4 Intermediated securities based on registered shares of
Nestlé cannot be transferred by way of assignment.
A security interest in any such intermediated securities
cannot be granted by way of assignment.
Article 5
Share register
1 Nestlé shall maintain a share register showing the name
and address of the holders or usufructuaries. Any change
of address must be reported to Nestlé.
2 Only persons entered in the share register as shareholders
with voting rights may exercise the voting rights or the
other rights related thereto.
3 After the acquisition of shares, upon request of the
shareholder to be recognised as such, any acquiring
party shall be considered as a shareholder without voting
rights, until it is recognised by Nestlé as a shareholder with
voting rights. If Nestlé does not refuse the request to
recognise the acquiring party within twenty days, the latter
shall be deemed to be a shareholder with voting rights.
4 An acquirer of shares shall be recorded in the share
register as a shareholder with voting rights provided
he expressly declares to have acquired the shares in
his own name and for his own account.
5 No person or entity shall be registered with voting rights
for more than 5% of the share capital as recorded in the
commercial register. This limitation on registration also
applies to persons who hold some or all of their shares
through nominees pursuant to this article. All of the
foregoing does not apply in the case of the acquisition
of an enterprise, or parts of an enterprise or participations
through exchange of shares or in the cases provided
in art. 685d par. 3 of the Swiss Code of Obligations.
6 The Board of Directors shall promulgate regulations
relating to the registration of fi duciaries or nominees
to ensure compliance with these Articles of Association.
7 Legal entities that are linked to one another through
capital, voting rights, management or in any other
manner, as well as all natural persons or legal entities
achieving an understanding or forming a syndicate or
otherwise acting in concert to circumvent the regulations
concerning the limitation on registration or the nominees,
shall be counted as one person or nominee within the
meaning of paragraphs 4 and 5 of this article.
8 After hearing the registered shareholder or nominee, the
Board of Directors may cancel, with retroactive effect
as of the date of registration, the registration of such
shareholder or nominee if the registration was effected
based on false information. The respective shareholder
or nominee shall be informed immediately of the
cancellation of the registration.
9 The Board of Directors shall specify the details and
promulgate the necessary regulations concerning the
application of this art. 5. Such regulations shall specify
the cases in which the Board or a corporate body
designated by the Board may allow exemptions from the
limitation on registration or the regulation concerning
nominees.
10 The limitation on registration provided for in this article
shall also apply to shares acquired or subscribed by the
exercise of subscription, option or conversion rights.
III. Organisation of Nestlé
A. General Meeting
Article 6
Powers of the General Meeting
1 The General Meeting of shareholders is the supreme
authority of Nestlé.
2 The following non-transferable powers shall be vested
in the General Meeting:
a) to adopt and amend the Articles of Association;
b) to elect and remove the members of the Board of
Directors, the Chairman of the Board of Directors and
the members of the Compensation Committee;
c) to elect and remove the Auditors;
d) to elect and remove the Independent Representative;
e) to approve the annual report and the consolidated
fi nancial statements;
f) to approve the annual fi nancial statements as well as
to resolve on the use of the balance sheet profi t, in
particular, the declaration of dividends;
g) to approve the compensation of the Board of Directors
and of the Executive Board pursuant to art. 21bis;
Corporate Governance Report 201854
Articles of Association of Nestlé S.A.
h) to grant discharge to the members of the Board of
Directors and the persons entrusted with management;
and
i) to take all decisions which by law or under these Articles
of Association are within the powers of the General
Meeting.
Article 7
Annual General Meeting
The Annual General Meeting shall be held each year within
six months of the close of the fi nancial year of Nestlé. The
meeting shall be convened by the Board of Directors.
Article 8
Extraordinary General Meeting
1 Extraordinary General Meetings shall be convened by the
Board of Directors or, if necessary, by the Auditors, as well
as in the other cases foreseen by law.
2 The Board of Directors shall, if so requested by a General
Meeting or at the request in writing, specifying the items
and proposals to appear on the agenda, of one or more
shareholders with voting rights whose combined holdings
represent at least one tenth of the share capital as recorded
in the commercial register, convene an Extraordinary
General Meeting. The Extraordinary General Meeting
shall be held as promptly as practicable following such
request.
Article 9
Notice of General Meetings; Agenda
1 Annual or Extraordinary General Meetings shall be
convened by notice in the “Swiss Offi cial Gazette of
Commerce” not less than twenty days before the date
fi xed for the meeting. Shareholders may in addition be
informed by ordinary mail.
2 The notice of a meeting shall state the items on the agenda
and the proposals of the Board of Directors and of the
shareholders who requested that a General Meeting
be convened (art. 8 par. 2) or that items be included
in the agenda (art. 9 par. 3).
3 One or more shareholders with voting rights whose
combined holdings represent at least 0.15% of the share
capital of Nestlé as recorded in the commercial register
may request that an item be included in the agenda of
a General Meeting. Such a request must be made in
writing to the Board of Directors at the latest 45 days
before the meeting and shall specify the agenda items
and the proposals made.
4 No resolution shall be passed at a General Meeting on
matters which do not appear on the agenda except for:
a) a resolution convening an Extraordinary General Meeting;
or
b) the setting up of a special audit.
Article 10
Presiding offi cer; Minutes
1 The Chairman or any member of the Board of Directors
shall preside at General Meetings and carry all procedural
powers.
2 Minutes of General Meetings shall be kept by the
Secretary of the Board of Directors.
Article 11
Voting rights; Representation of shareholders
1 Each share recorded in the share register as share with
voting rights confers one vote on its holder.
2 At General Meetings no person may exercise, directly
or indirectly, voting rights, with respect to own shares
or shares represented by proxy, in excess of 5% of the
share capital as recorded in the commercial register.
Legal entities that are linked to one another through
capital, voting rights, management or in any other
manner, as well as all natural persons or legal entities
achieving an understanding or forming a syndicate or
otherwise acting in concert to circumvent such a limit,
shall be counted as one shareholder.
3 The foregoing limit does not apply to shares received
and held by a shareholder pursuant to an acquisition of
an enterprise, or parts of an enterprise or participations
as referred in art. 5 par. 5.
4 In order to permit the exercise of voting rights in respect
of shares held by nominees, the Board of Directors may
by means of regulations or agreements with nominees
depart from the limit foreseen in this article. It may also
depart from such a limit within the framework of the
regulations referred to in art. 5 par. 6 and par. 9. In addition,
this limit shall not apply to the exercise of voting rights
by the Independent Representative.
5 Each shareholder recorded in the share register with
voting rights may be represented at the General Meeting
by the Independent Representative or a third party. The
Board of Directors shall determine the requirements
regarding participation and representation in the General
Meeting.
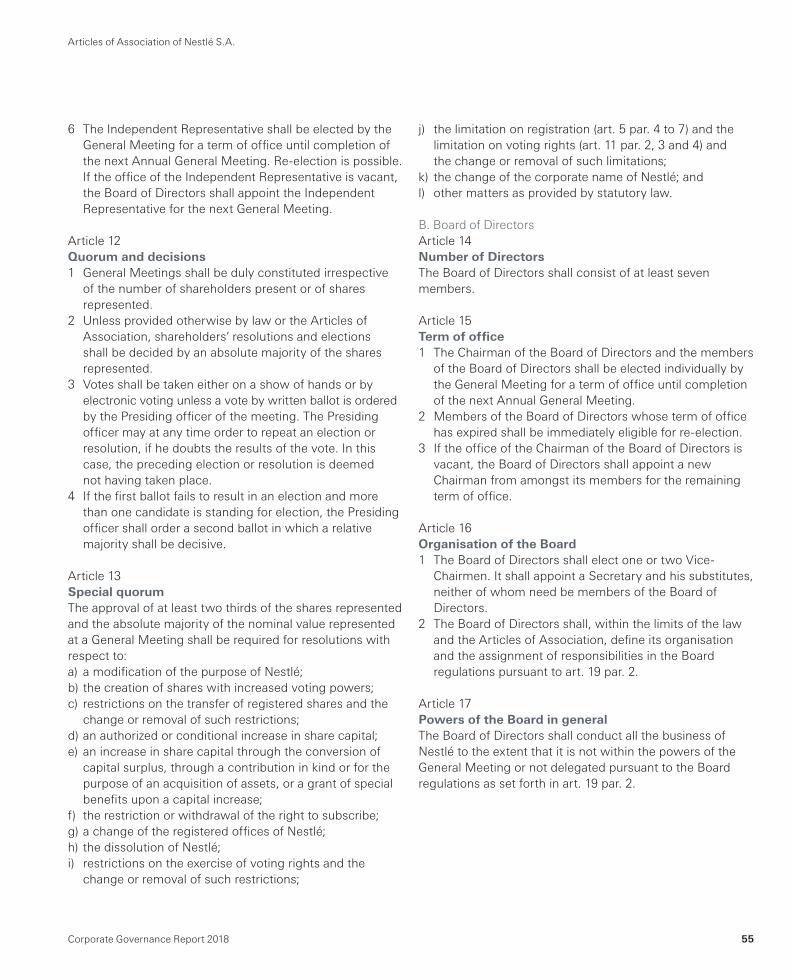
Corporate Governance Report 2018 55
Articles of Association of Nestlé S.A.
6 The Independent Representative shall be elected by the
General Meeting for a term of offi ce until completion of
the next Annual General Meeting. Re-election is possible.
If the offi ce of the Independent Representative is vacant,
the Board of Directors shall appoint the Independent
Representative for the next General Meeting.
Article 12
Quorum and decisions
1 General Meetings shall be duly constituted irrespective
of the number of shareholders present or of shares
represented.
2 Unless provided otherwise by law or the Articles of
Association, shareholders’ resolutions and elections
shall be decided by an absolute majority of the shares
represented.
3 Votes shall be taken either on a show of hands or by
electronic voting unless a vote by written ballot is ordered
by the Presiding offi cer of the meeting. The Presiding
offi cer may at any time order to repeat an election or
resolution, if he doubts the results of the vote. In this
case, the preceding election or resolution is deemed
not having taken place.
4 If the fi rst ballot fails to result in an election and more
than one candidate is standing for election, the Presiding
offi cer shall order a second ballot in which a relative
majority shall be decisive.
Article 13
Special quorum
The approval of at least two thirds of the shares represented
and the absolute majority of the nominal value represented
at a General Meeting shall be required for resolutions with
respect to:
a) a modifi cation of the purpose of Nestlé;
b) the creation of shares with increased voting powers;
c) restrictions on the transfer of registered shares and the
change or removal of such restrictions;
d) an authorized or conditional increase in share capital;
e) an increase in share capital through the conversion of
capital surplus, through a contribution in kind or for the
purpose of an acquisition of assets, or a grant of special
benefi ts upon a capital increase;
f) the restriction or withdrawal of the right to subscribe;
g) a change of the registered offi ces of Nestlé;
h) the dissolution of Nestlé;
i) restrictions on the exercise of voting rights and the
change or removal of such restrictions;
j) the limitation on registration (art. 5 par. 4 to 7) and the
limitation on voting rights (art. 11 par. 2, 3 and 4) and
the change or removal of such limitations;
k) the change of the corporate name of Nestlé; and
l) other matters as provided by statutory law.
B. Board of Directors
Article 14
Number of Directors
The Board of Directors shall consist of at least seven
members.
Article 15
Term of offi ce
1 The Chairman of the Board of Directors and the members
of the Board of Directors shall be elected individually by
the General Meeting for a term of offi ce until completion
of the next Annual General Meeting.
2 Members of the Board of Directors whose term of offi ce
has expired shall be immediately eligible for re-election.
3 If the offi ce of the Chairman of the Board of Directors is
vacant, the Board of Directors shall appoint a new
Chairman from amongst its members for the remaining
term of offi ce.
Article 16
Organisation of the Board
1 The Board of Directors shall elect one or two Vice-
Chairmen. It shall appoint a Secretary and his substitutes,
neither of whom need be members of the Board of
Directors.
2 The Board of Directors shall, within the limits of the law
and the Articles of Association, defi ne its organisation
and the assignment of responsibilities in the Board
regulations pursuant to art. 19 par. 2.
Article 17
Powers of the Board in general
The Board of Directors shall conduct all the business of
Nestlé to the extent that it is not within the powers of the
General Meeting or not delegated pursuant to the Board
regulations as set forth in art. 19 par. 2.
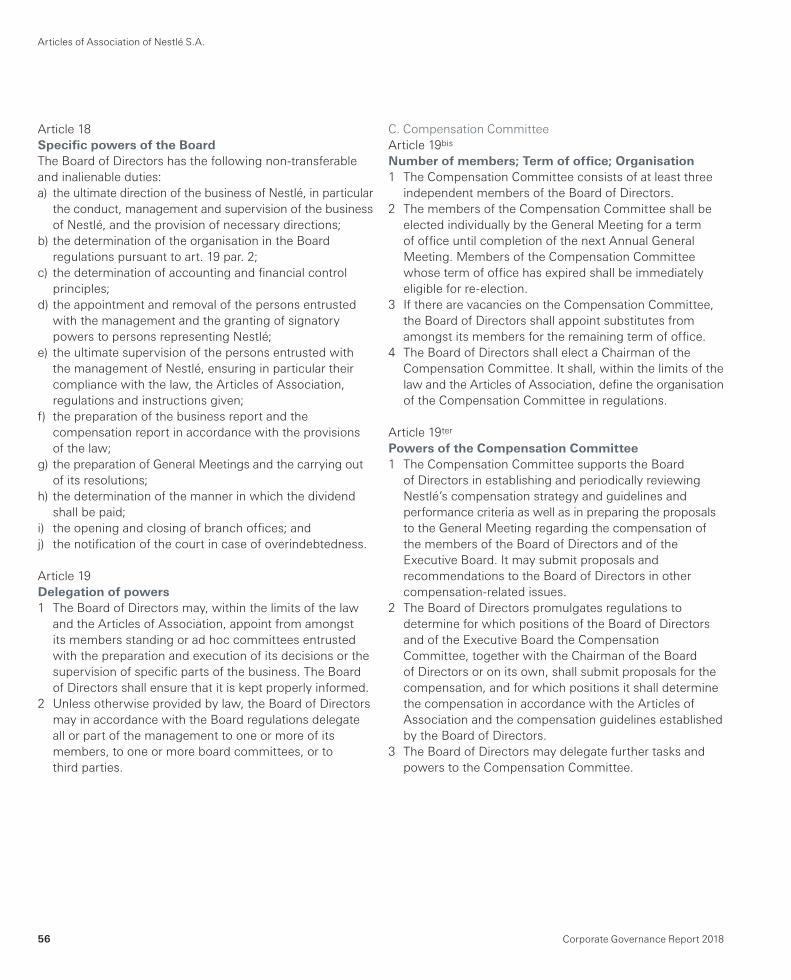
Corporate Governance Report 201856
Articles of Association of Nestlé S.A.
Article 18
Specifi c powers of the Board
The Board of Directors has the following non-transferable
and inalienable duties:
a) the ultimate direction of the business of Nestlé, in particular
the conduct, management and supervision of the business
of Nestlé, and the provision of necessary directions;
b) the determination of the organisation in the Board
regulations pursuant to art. 19 par. 2;
c) the determination of accounting and fi nancial control
principles;
d) the appointment and removal of the persons entrusted
with the management and the granting of signatory
powers to persons representing Nestlé;
e) the ultimate supervision of the persons entrusted with
the management of Nestlé, ensuring in particular their
compliance with the law, the Articles of Association,
regulations and instructions given;
f) the preparation of the business report and the
compensation report in accordance with the provisions
of the law;
g) the preparation of General Meetings and the carrying out
of its resolutions;
h) the determination of the manner in which the dividend
shall be paid;
i) the opening and closing of branch offi ces; and
j) the notifi cation of the court in case of overindebtedness.
Article 19
Delegation of powers
1 The Board of Directors may, within the limits of the law
and the Articles of Association, appoint from amongst
its members standing or ad hoc committees entrusted
with the preparation and execution of its decisions or the
supervision of specifi c parts of the business. The Board
of Directors shall ensure that it is kept properly informed.
2 Unless otherwise provided by law, the Board of Directors
may in accordance with the Board regulations delegate
all or part of the management to one or more of its
members, to one or more board committees, or to
third parties.
C. Compensation Committee
Article 19bis
Number of members; Term of offi ce; Organisation
1 The Compensation Committee consists of at least three
independent members of the Board of Directors.
2 The members of the Compensation Committee shall be
elected individually by the General Meeting for a term
of offi ce until completion of the next Annual General
Meeting. Members of the Compensation Committee
whose term of offi ce has expired shall be immediately
eligible for re-election.
3 If there are vacancies on the Compensation Committee,
the Board of Directors shall appoint substitutes from
amongst its members for the remaining term of offi ce.
4 The Board of Directors shall elect a Chairman of the
Compensation Committee. It shall, within the limits of the
law and the Articles of Association, defi ne the organisation
of the Compensation Committee in regulations.
Article 19ter
Powers of the Compensation Committee
1 The Compensation Committee supports the Board
of Directors in establishing and periodically reviewing
Nestlé’s compensation strategy and guidelines and
performance criteria as well as in preparing the proposals
to the General Meeting regarding the compensation of
the members of the Board of Directors and of the
Executive Board. It may submit proposals and
recommendations to the Board of Directors in other
compensation-related issues.
2 The Board of Directors promulgates regulations to
determine for which positions of the Board of Directors
and of the Executive Board the Compensation
Committee, together with the Chairman of the Board
of Directors or on its own, shall submit proposals for the
compensation, and for which positions it shall determine
the compensation in accordance with the Articles of
Association and the compensation guidelines established
by the Board of Directors.
3 The Board of Directors may delegate further tasks and
powers to the Compensation Committee.
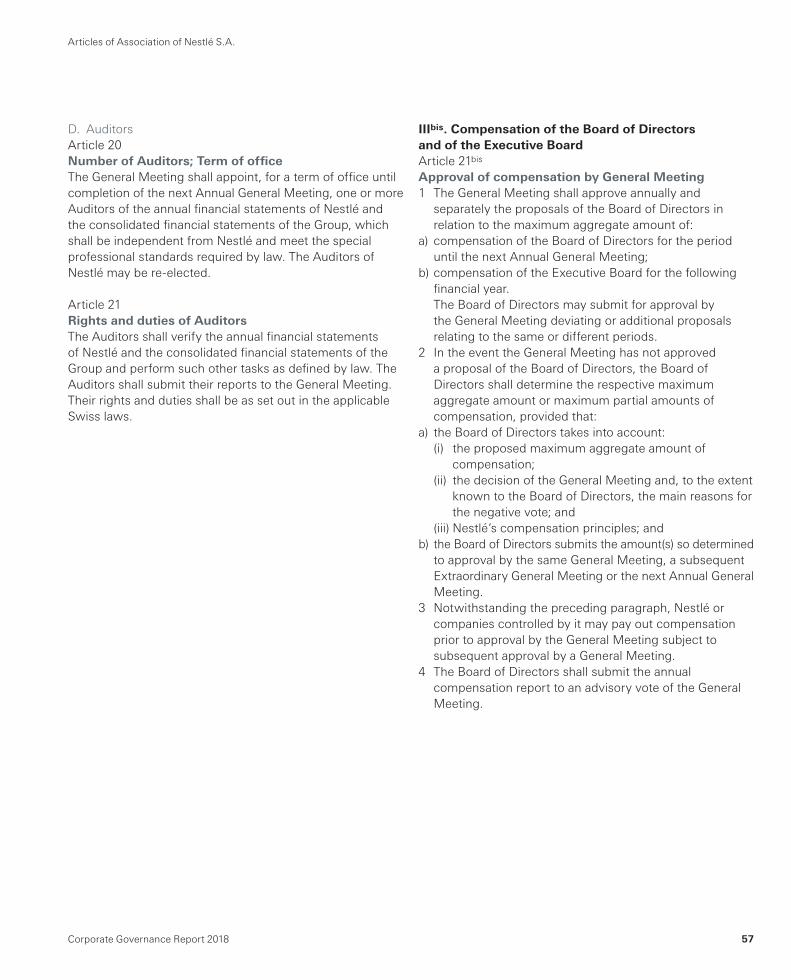
Corporate Governance Report 2018 57
Articles of Association of Nestlé S.A.
D. Auditors
Article 20
Number of Auditors; Term of offi ce
The General Meeting shall appoint, for a term of offi ce until
completion of the next Annual General Meeting, one or more
Auditors of the annual fi nancial statements of Nestlé and
the consolidated fi nancial statements of the Group, which
shall be independent from Nestlé and meet the special
professional standards required by law. The Auditors of
Nestlé may be re-elected.
Article 21
Rights and duties of Auditors
The Auditors shall verify the annual fi nancial statements
of Nestlé and the consolidated fi nancial statements of the
Group and perform such other tasks as defi ned by law. The
Auditors shall submit their reports to the General Meeting.
Their rights and duties shall be as set out in the applicable
Swiss laws.
IIIbis. Compensation of the Board of Directors
and of the Executive Board
Article 21bis
Approval of compensation by General Meeting
1 The General Meeting shall approve annually and
separately the proposals of the Board of Directors in
relation to the maximum aggregate amount of:
a) compensation of the Board of Directors for the period
until the next Annual General Meeting;
b) compensation of the Executive Board for the following
fi nancial year.
The Board of Directors may submit for approval by
the General Meeting deviating or additional proposals
relating to the same or different periods.
2 In the event the General Meeting has not approved
a proposal of the Board of Directors, the Board of
Directors shall determine the respective maximum
aggregate amount or maximum partial amounts of
compensation, provided that:
a) the Board of Directors takes into account:
(i) the proposed maximum aggregate amount of
compensation;
(ii) the decision of the General Meeting and, to the extent
known to the Board of Directors, the main reasons for
the negative vote; and
(iii) Nestlé’s compensation principles; and
b) the Board of Directors submits the amount(s) so determined
to approval by the same General Meeting, a subsequent
Extraordinary General Meeting or the next Annual General
Meeting.
3 Notwithstanding the preceding paragraph, Nestlé or
companies controlled by it may pay out compensation
prior to approval by the General Meeting subject to
subsequent approval by a General Meeting.
4 The Board of Directors shall submit the annual
compensation report to an advisory vote of the General
Meeting.
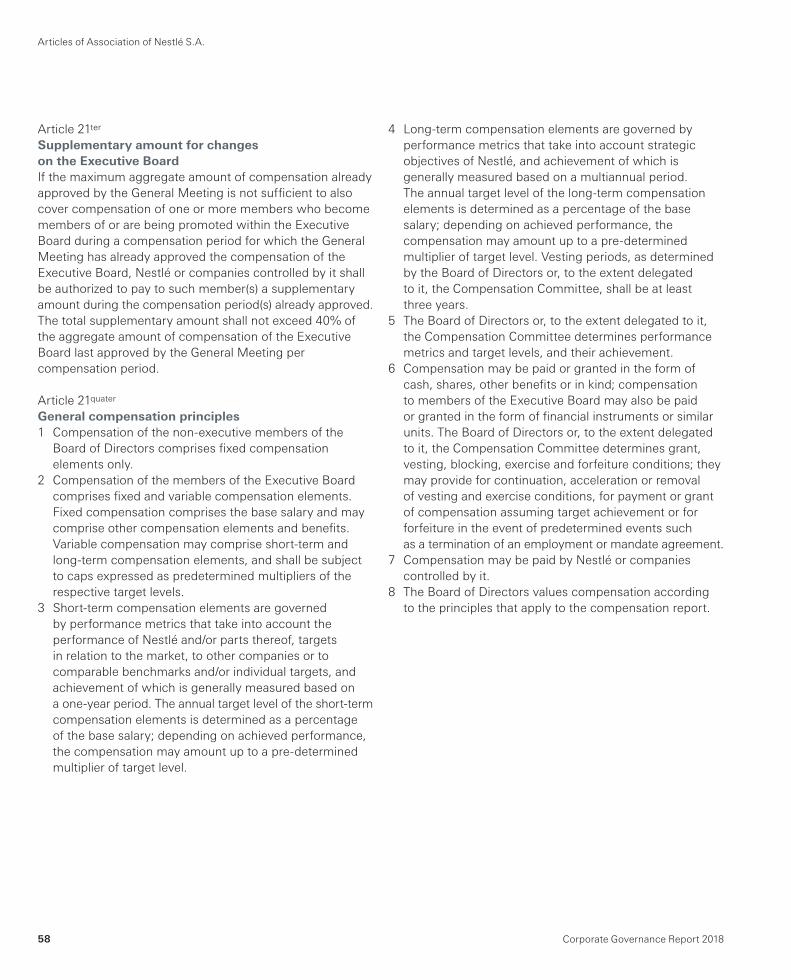
Corporate Governance Report 201858
Articles of Association of Nestlé S.A.
Article 21ter
Supplementary amount for changes
on the Executive Board
If the maximum aggregate amount of compensation already
approved by the General Meeting is not suffi cient to also
cover compensation of one or more members who become
members of or are being promoted within the Executive
Board during a compensation period for which the General
Meeting has already approved the compensation of the
Executive Board, Nestlé or companies controlled by it shall
be authorized to pay to such member(s) a supplementary
amount during the compensation period(s) already approved.
The total supplementary amount shall not exceed 40% of
the aggregate amount of compensation of the Executive
Board last approved by the General Meeting per
compensation period.
Article 21quater
General compensation principles
1 Compensation of the non-executive members of the
Board of Directors comprises fi xed compensation
elements only.
2 Compensation of the members of the Executive Board
comprises fi xed and variable compensation elements.
Fixed compensation comprises the base salary and may
comprise other compensation elements and benefi ts.
Variable compensation may comprise short-term and
long-term compensation elements, and shall be subject
to caps expressed as predetermined multipliers of the
respective target levels.
3 Short-term compensation elements are governed
by performance metrics that take into account the
performance of Nestlé and/or parts thereof, targets
in relation to the market, to other companies or to
comparable benchmarks and/or individual targets, and
achievement of which is generally measured based on
a one-year period. The annual target level of the short-term
compensation elements is determined as a percentage
of the base salary; depending on achieved performance,
the compensation may amount up to a pre-determined
multiplier of target level.
4 Long-term compensation elements are governed by
performance metrics that take into account strategic
objectives of Nestlé, and achievement of which is
generally measured based on a multiannual period.
The annual target level of the long-term compensation
elements is determined as a percentage of the base
salary; depending on achieved performance, the
compensation may amount up to a pre-determined
multiplier of target level. Vesting periods, as determined
by the Board of Directors or, to the extent delegated
to it, the Compensation Committee, shall be at least
three years.
5 The Board of Directors or, to the extent delegated to it,
the Compensation Committee determines performance
metrics and target levels, and their achievement.
6 Compensation may be paid or granted in the form of
cash, shares, other benefi ts or in kind; compensation
to members of the Executive Board may also be paid
or granted in the form of fi nancial instruments or similar
units. The Board of Directors or, to the extent delegated
to it, the Compensation Committee determines grant,
vesting, blocking, exercise and forfeiture conditions; they
may provide for continuation, acceleration or removal
of vesting and exercise conditions, for payment or grant
of compensation assuming target achievement or for
forfeiture in the event of predetermined events such
as a termination of an employment or mandate agreement.
7 Compensation may be paid by Nestlé or companies
controlled by it.
8 The Board of Directors values compensation according
to the principles that apply to the compensation report.
Corporate Governance Report 2018 59
Articles of Association of Nestlé S.A.
IIIter. Contracts with members of the Board
of Directors and of the Executive Board
Article 21quinquies
Basic principles
1 Nestlé or companies controlled by it may enter into
agreements with members of the Board of Directors
relating to their compensation for a fi xed term or for
an indefi nite term; term and notice period may not
exceed one year.
2 Nestlé or companies controlled by it may enter into
contracts of employment with members of the Executive
Board for a defi nite period of time not to exceed one year
or for an indefi nite period of time with a notice period not
to exceed 12 months.
3 Contracts of employment with members of the Executive
Board may contain a prohibition of competition for the
time after the end of employment for a duration of up
to 2 years. The annual consideration for such prohibition
shall not exceed 50% of the total annual compensation
last paid to such member of the Executive Board.
IIIquater. Mandates outside Nestlé; Loans
Article 21sexies
Mandates outside Nestlé
1 No member of the Board of Directors may hold more
than 4 additional mandates in listed companies and
5 additional mandates in non-listed companies.
2 No member of the Executive Board may hold more than
2 additional mandates in listed companies and 4 additional
mandates in non-listed companies. Each of these mandates
shall be subject to approval by the Board of Directors.
3 The following mandates are not subject to these
limitations:
a) mandates in companies which are controlled by Nestlé;
b) mandates which a member of the Board of Directors or
of the Executive Board holds at the request of Nestlé or
companies controlled by it. No Member of the Board of
Directors or of the Executive Board shall hold more than
10 such mandates; and
c) mandates in associations, charitable organizations,
foundations, trusts and employee welfare foundations.
No Member of the Board of Directors or of the Executive
Board shall hold more than 10 such mandates.
4 Mandates shall mean mandates in the supreme governing
body of a legal entity which is required to be registered in
the commercial register or a comparable foreign register.
Mandates in different legal entities which are under joint
control are deemed one mandate.
5 The Board of Directors shall promulgate regulations that,
taking into account the position of the respective member,
determine additional restrictions.
Article 21septies
Loans
Loans to a member of the Board of Directors or the
Executive Board may only be granted at market conditions
and may, at the time of grant, not exceed the respective
member’s most recent total annual compensation.
Corporate Governance Report 201860
Articles of Association of Nestlé S.A.
IV. Business report and appropriation
of profi t resulting from the balance sheet
Article 22
Financial year
The fi nancial year shall commence on 1 January and shall
end on 31 December.
Article 23
Business report
For every fi nancial year the Board of Directors shall prepare
a business report consisting of the annual fi nancial statements
of Nestlé, of the annual report and the consolidated fi nancial
statements.
Article 24
Appropriation of profi t resulting
from the balance sheet
The profi t shall be allocated by the General Meeting within
the limits set by applicable law. The Board of Directors shall
submit its proposals to the General Meeting.
V. Announcements, Communications
Article 25
Notices
All notices and communications to be made by Nestlé shall
be considered duly made if published in the “Swiss Offi cial
Gazette of Commerce”, unless the law provides otherwise.
Articles of Association amended by the Annual General
Meeting of April 12, 2018
Nestlé Annual Review 2018 42Financial Statements 2018 61
Financial Statements 2018

Financial Statements 201862
Consolidated Financial Statements of the Nestlé Group 2018 63
ConsolidatedFinancial Statementsof the Nestlé Group 2018
Consolidated Financial Statements of the Nestlé Group 201864
65
66
67
68
70
71
73
73
77
83
93
94
95
97
101
107
117
119
134
137
139
140
143
148
150
Principal exchange rates
Consolidated income statement for
the year ended December 31, 2018
Consolidated statement of
comprehensive income for the year
ended December 31, 2018
Consolidated balance sheet as at
December 31, 2018
Consolidated cash fl ow statement for
the year ended December 31, 2018
Consolidated statement
of changes in equity for the year ended
December 31, 2018
Notes
1. Accounting policies
2. Scope of consolidation, acquisitions
and disposals of businesses, assets
held for sale and acquisitions of
non-controlling interests
3. Analyses by segment
4. Net other trading and operating income/
(expenses)
5. Net fi nancial income/(expense)
6. Inventories
7. Trade and other receivables/payables
8. Property, plant and equipment
9. Goodwill and intangible assets
10. Employee benefi ts
11. Provisions and contingencies
12. Financial instruments
13. Taxes
14. Associates and joint ventures
15. Earnings per share
16. Cash fl ow statement
17. Equity
18. Transactions with related parties
19. Guarantees
20. Effects of hyperinfl ation
21. Events after the balance sheet date
22. Restatements of 2017 comparatives and
fi rst application of IFRS 9
Statutory Auditor’s Report –
Report on the Audit of the
Consolidated Financial Statements
Financial information – 5 year review
Companies of the Nestlé Group, joint
arrangements and associates
160
166
168
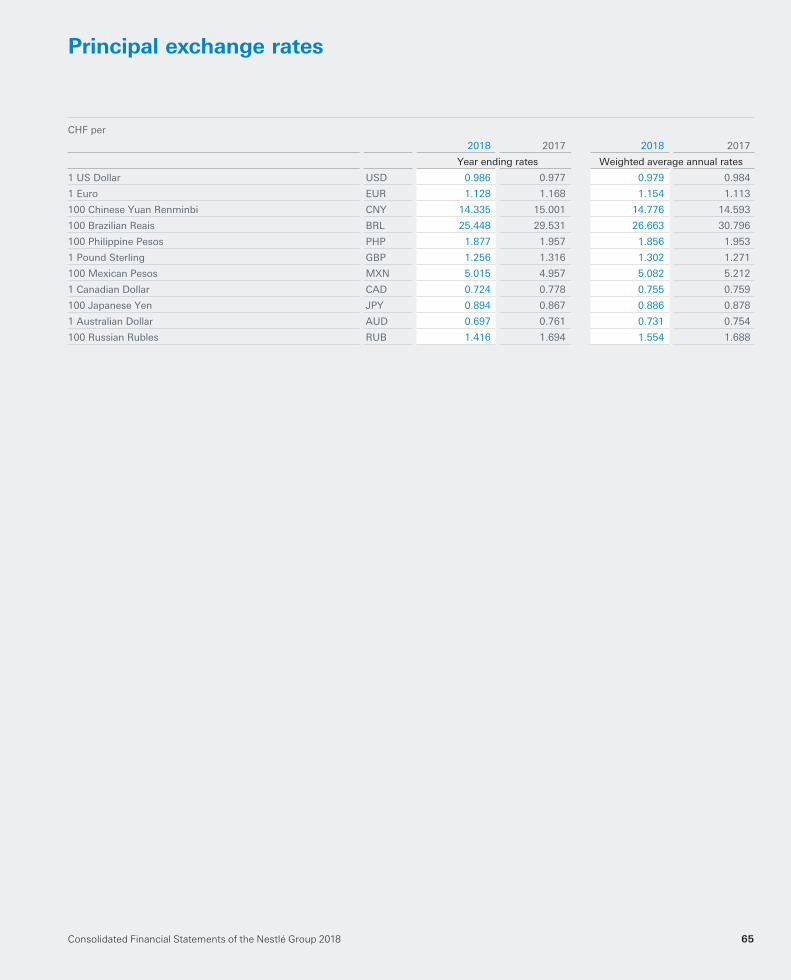
Consolidated Financial Statements of the Nestlé Group 2018 65
Principal exchange rates
CHF per
2018 2017 2018 2017
Year ending rates Weighted average annual rates
1 US Dollar USD 0.986 0.977 0.979 0.984
1 Euro EUR 1.128 1.168 1.154 1.113
100 Chinese Yuan Renminbi CNY 14.335 15.001 14.776 14.593
100 Brazilian Reais BRL 25.448 29.531 26.663 30.796
100 Philippine Pesos PHP 1.877 1.957 1.856 1.953
1 Pound Sterling GBP 1.256 1.316 1.302 1.271
100 Mexican Pesos MXN 5.015 4.957 5.082 5.212
1 Canadian Dollar CAD 0.724 0.778 0.755 0.759
100 Japanese Yen JPY 0.894 0.867 0.886 0.878
1 Australian Dollar AUD 0.697 0.761 0.731 0.754
100 Russian Rubles RUB 1.416 1.694 1.554 1.688
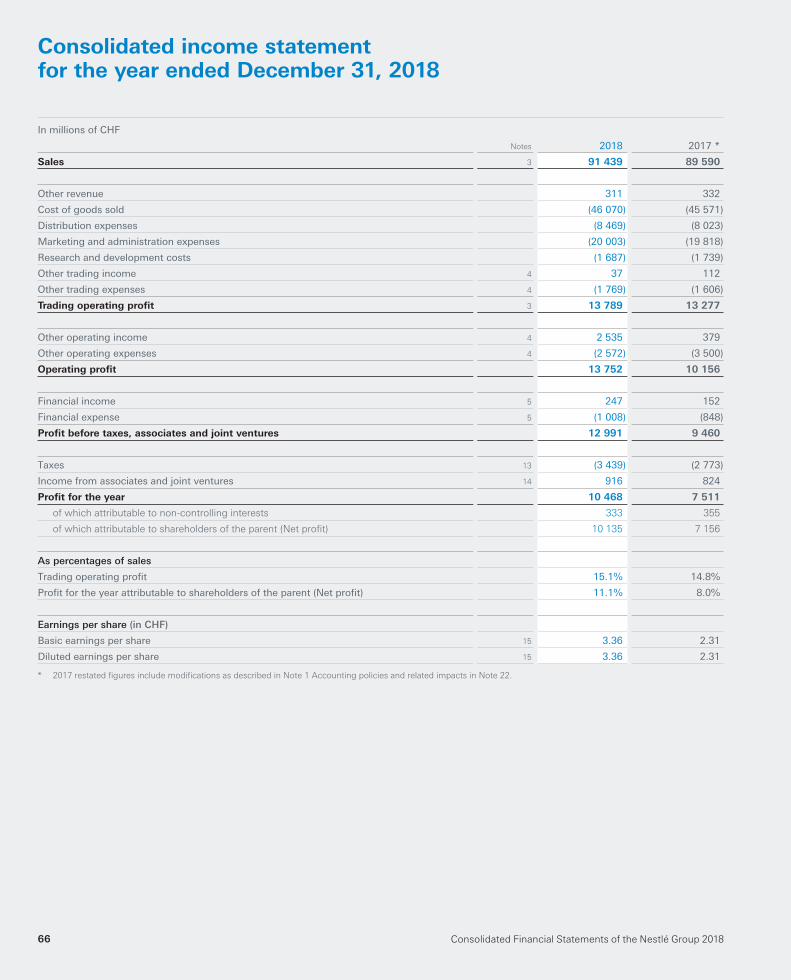
Consolidated Financial Statements of the Nestlé Group 201866
Consolidated income statementfor the year ended December 31, 2018
In millions of CHF
Notes 2018 2017 *
Sales 3 91 439 89 590
Other revenue 311 332
Cost of goods sold (46 070) (45 571)
Distribution expenses (8 469) (8 023)
Marketing and administration expenses (20 003) (19 818)
Research and development costs (1 687) (1 739)
Other trading income 4 37 112
Other trading expenses 4 (1 769) (1 606)
Trading operating profi t 3 13 789 13 277
Other operating income 4 2 535 379
Other operating expenses 4 (2 572) (3 500)
Operating profi t 13 752 10 156
Financial income 5 247 152
Financial expense 5 (1 008) (848)
Profi t before taxes, associates and joint ventures 12 991 9 460
Taxes 13 (3 439) (2 773)
Income from associates and joint ventures 14 916 824
Profi t for the year 10 468 7 511
of which attributable to non-controlling interests 333 355
of which attributable to shareholders of the parent (Net profi t) 10 135 7 156
As percentages of sales
Trading operating profi t 15.1% 14.8%
Profi t for the year attributable to shareholders of the parent (Net profi t) 11.1% 8.0%
Earnings per share (in CHF)
Basic earnings per share 15 3.36 2.31
Diluted earnings per share 15 3.36 2.31
* 2017 restated fi gures include modifi cations as described in Note 1 Accounting policies and related impacts in Note 22.
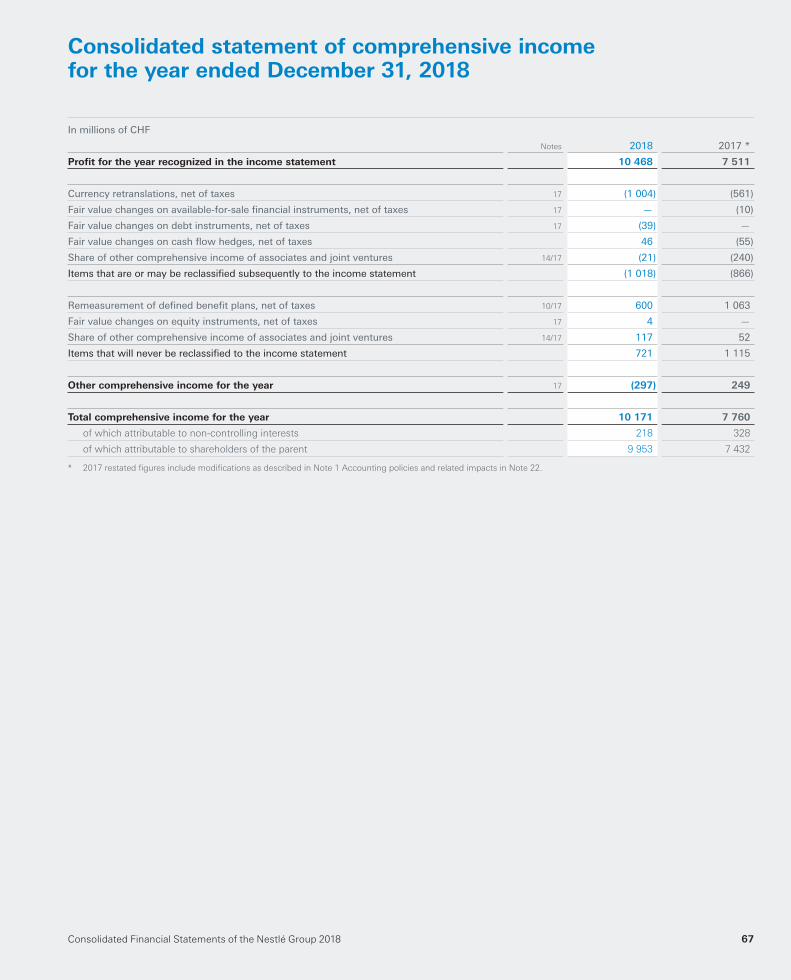
Consolidated Financial Statements of the Nestlé Group 2018 67
Consolidated statement of comprehensive incomefor the year ended December 31, 2018
In millions of CHF
Notes 2018 2017 *
Profi t for the year recognized in the income statement 10 468 7 511
Currency retranslations, net of taxes 17 (1 004) (561)
Fair value changes on available-for-sale fi nancial instruments, net of taxes 17 — (10)
Fair value changes on debt instruments, net of taxes 17 (39) —
Fair value changes on cash fl ow hedges, net of taxes 46 (55)
Share of other comprehensive income of associates and joint ventures 14/17 (21) (240)
Items that are or may be reclassifi ed subsequently to the income statement (1 018) (866)
Remeasurement of defi ned benefi t plans, net of taxes 10/17 600 1 063
Fair value changes on equity instruments, net of taxes 17 4 —
Share of other comprehensive income of associates and joint ventures 14/17 117 52
Items that will never be reclassifi ed to the income statement 721 1 115
Other comprehensive income for the year 17 (297) 249
Total comprehensive income for the year 10 171 7 760
of which attributable to non-controlling interests 218 328
of which attributable to shareholders of the parent 9 953 7 432
* 2017 restated fi gures include modifi cations as described in Note 1 Accounting policies and related impacts in Note 22.
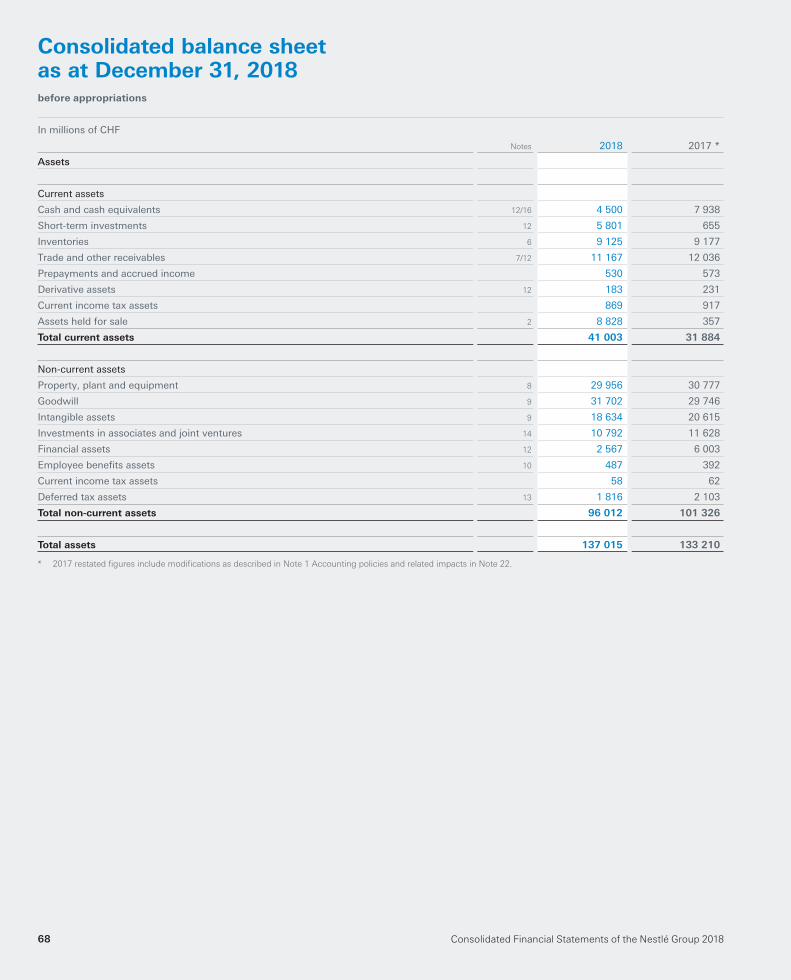
Consolidated Financial Statements of the Nestlé Group 201868
Consolidated balance sheet as at December 31, 2018before appropriations
In millions of CHF
Notes 2018 2017 *
Assets
Current assets
Cash and cash equivalents 12/16 4 500 7 938
Short-term investments 12 5 801 655
Inventories 6 9 125 9 177
Trade and other receivables 7/12 11 167 12 036
Prepayments and accrued income 530 573
Derivative assets 12 183 231
Current income tax assets 869 917
Assets held for sale 2 8 828 357
Total current assets 41 003 31 884
Non-current assets
Property, plant and equipment 8 29 956 30 777
Goodwill 9 31 702 29 746
Intangible assets 9 18 634 20 615
Investments in associates and joint ventures 14 10 792 11 628
Financial assets 12 2 567 6 003
Employee benefi ts assets 10 487 392
Current income tax assets 58 62
Deferred tax assets 13 1 816 2 103
Total non-current assets 96 012 101 326
Total assets 137 015 133 210
* 2017 restated fi gures include modifi cations as described in Note 1 Accounting policies and related impacts in Note 22.
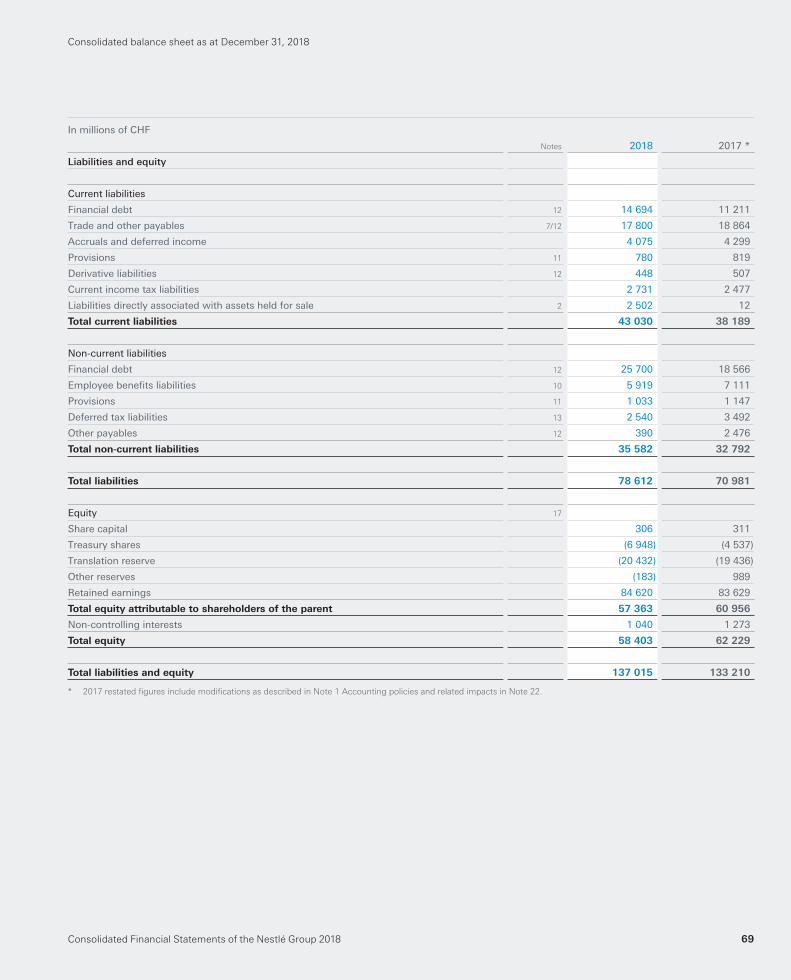
Consolidated Financial Statements of the Nestlé Group 2018 69
Consolidated balance sheet as at December 31, 2018
In millions of CHF
Notes 2018 2017 *
Liabilities and equity
Current liabilities
Financial debt 12 14 694 11 211
Trade and other payables 7/12 17 800 18 864
Accruals and deferred income 4 075 4 299
Provisions 11 780 819
Derivative liabilities 12 448 507
Current income tax liabilities 2 731 2 477
Liabilities directly associated with assets held for sale 2 2 502 12
Total current liabilities 43 030 38 189
Non-current liabilities
Financial debt 12 25 700 18 566
Employee benefi ts liabilities 10 5 919 7 111
Provisions 11 1 033 1 147
Deferred tax liabilities 13 2 540 3 492
Other payables 12 390 2 476
Total non-current liabilities 35 582 32 792
Total liabilities 78 612 70 981
Equity 17
Share capital 306 311
Treasury shares (6 948) (4 537)
Translation reserve (20 432) (19 436)
Other reserves (183) 989
Retained earnings 84 620 83 629
Total equity attributable to shareholders of the parent 57 363 60 956
Non-controlling interests 1 040 1 273
Total equity 58 403 62 229
Total liabilities and equity 137 015 133 210
* 2017 restated fi gures include modifi cations as described in Note 1 Accounting policies and related impacts in Note 22.
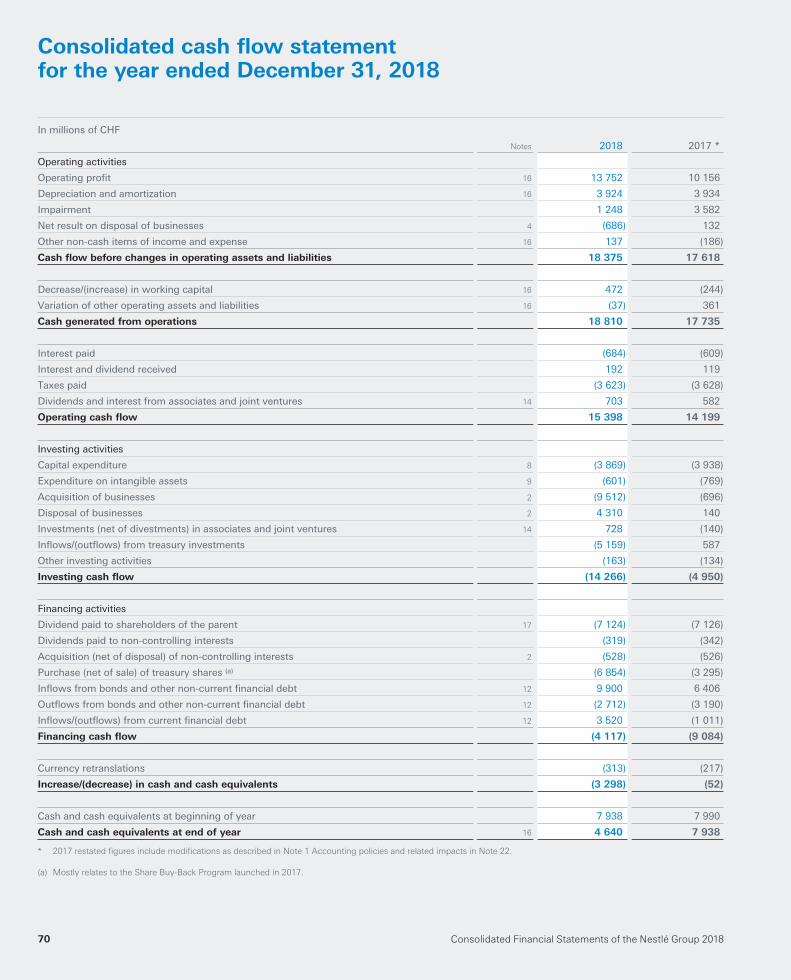
Consolidated Financial Statements of the Nestlé Group 201870
Consolidated cash fl ow statementfor the year ended December 31, 2018
In millions of CHF
Notes 2018 2017 *
Operating activities
Operating profi t 16 13 752 10 156
Depreciation and amortization 16 3 924 3 934
Impairment 1 248 3 582
Net result on disposal of businesses 4 (686) 132
Other non-cash items of income and expense 16 137 (186)
Cash fl ow before changes in operating assets and liabilities 18 375 17 618
Decrease/(increase) in working capital 16 472 (244)
Variation of other operating assets and liabilities 16 (37) 361
Cash generated from operations 18 810 17 735
Interest paid (684) (609)
Interest and dividend received 192 119
Taxes paid (3 623) (3 628)
Dividends and interest from associates and joint ventures 14 703 582
Operating cash fl ow 15 398 14 199
Investing activities
Capital expenditure 8 (3 869) (3 938)
Expenditure on intangible assets 9 (601) (769)
Acquisition of businesses 2 (9 512) (696)
Disposal of businesses 2 4 310 140
Investments (net of divestments) in associates and joint ventures 14 728 (140)
Infl ows/(outfl ows) from treasury investments (5 159) 587
Other investing activities (163) (134)
Investing cash fl ow (14 266) (4 950)
Financing activities
Dividend paid to shareholders of the parent 17 (7 124) (7 126)
Dividends paid to non-controlling interests (319) (342)
Acquisition (net of disposal) of non-controlling interests 2 (528) (526)
Purchase (net of sale) of treasury shares (a) (6 854) (3 295)
Infl ows from bonds and other non-current fi nancial debt 12 9 900 6 406
Outfl ows from bonds and other non-current fi nancial debt 12 (2 712) (3 190)
Infl ows/(outfl ows) from current fi nancial debt 12 3 520 (1 011)
Financing cash fl ow (4 117) (9 084)
Currency retranslations (313) (217)
Increase/(decrease) in cash and cash equivalents (3 298) (52)
Cash and cash equivalents at beginning of year 7 938 7 990
Cash and cash equivalents at end of year 16 4 640 7 938
* 2017 restated fi gures include modifi cations as described in Note 1 Accounting policies and related impacts in Note 22.
(a) Mostly relates to the Share Buy-Back Program launched in 2017.
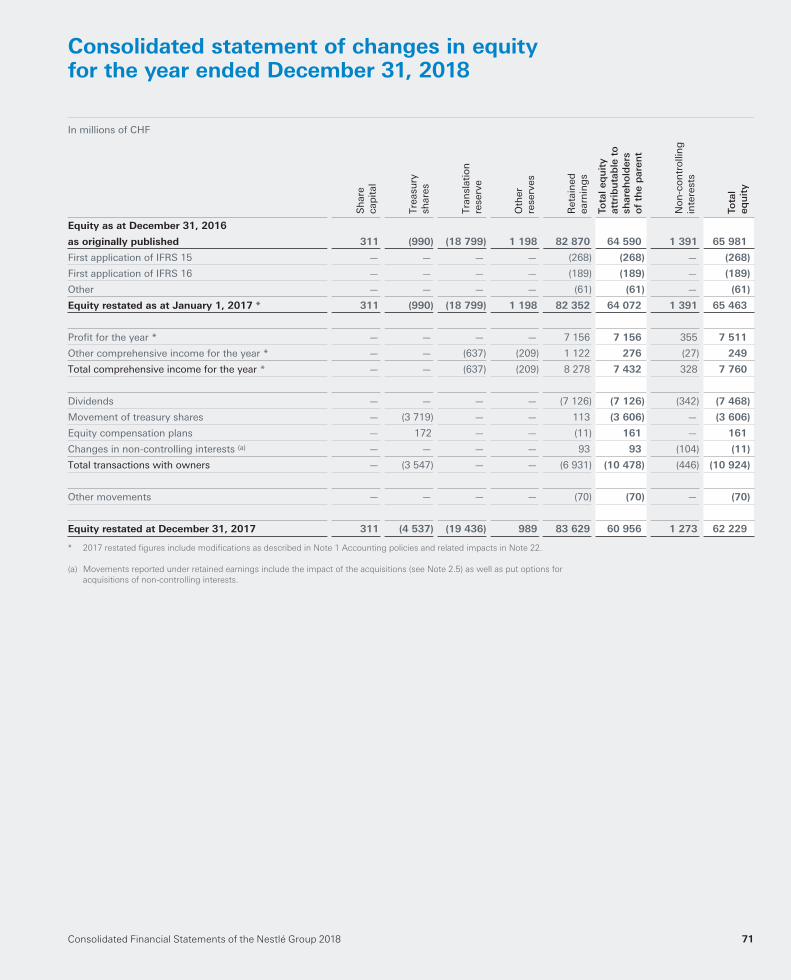
Consolidated Financial Statements of the Nestlé Group 2018 71
Consolidated statement of changes in equityfor the year ended December 31, 2018
In millions of CHF
Sh
are
cap
ital
Trea
sury
shar
es
Tran
slat
ion
re
serv
e
Oth
erre
serv
es
Ret
ain
edea
rnin
gs
Tota
l eq
uit
yat
trib
uta
ble
to
shar
eho
lder
s o
f th
e p
aren
t
No
n-c
on
tro
llin
g
inte
rest
s
Tota
l eq
uit
y
Equity as at December 31, 2016
as originally published 311 (990) (18 799) 1 198 82 870 64 590 1 391 65 981
First application of IFRS 15 — — — — (268) (268) — (268)
First application of IFRS 16 — — — — (189) (189) — (189)
Other — — — — (61) (61) — (61)
Equity restated as at January 1, 2017 * 311 (990) (18 799) 1 198 82 352 64 072 1 391 65 463
Profi t for the year * — — — — 7 156 7 156 355 7 511
Other comprehensive income for the year * — — (637) (209) 1 122 276 (27) 249
Total comprehensive income for the year * — — (637) (209) 8 278 7 432 328 7 760
Dividends — — — — (7 126) (7 126) (342) (7 468)
Movement of treasury shares — (3 719) — — 113 (3 606) — (3 606)
Equity compensation plans — 172 — — (11) 161 — 161
Changes in non-controlling interests (a) — — — — 93 93 (104) (11)
Total transactions with owners — (3 547) — — (6 931) (10 478) (446) (10 924)
Other movements — — — — (70) (70) — (70)
Equity restated at December 31, 2017 311 (4 537) (19 436) 989 83 629 60 956 1 273 62 229
* 2017 restated fi gures include modifi cations as described in Note 1 Accounting policies and related impacts in Note 22.
(a) Movements reported under retained earnings include the impact of the acquisitions (see Note 2.5) as well as put options for
acquisitions of non-controlling interests.
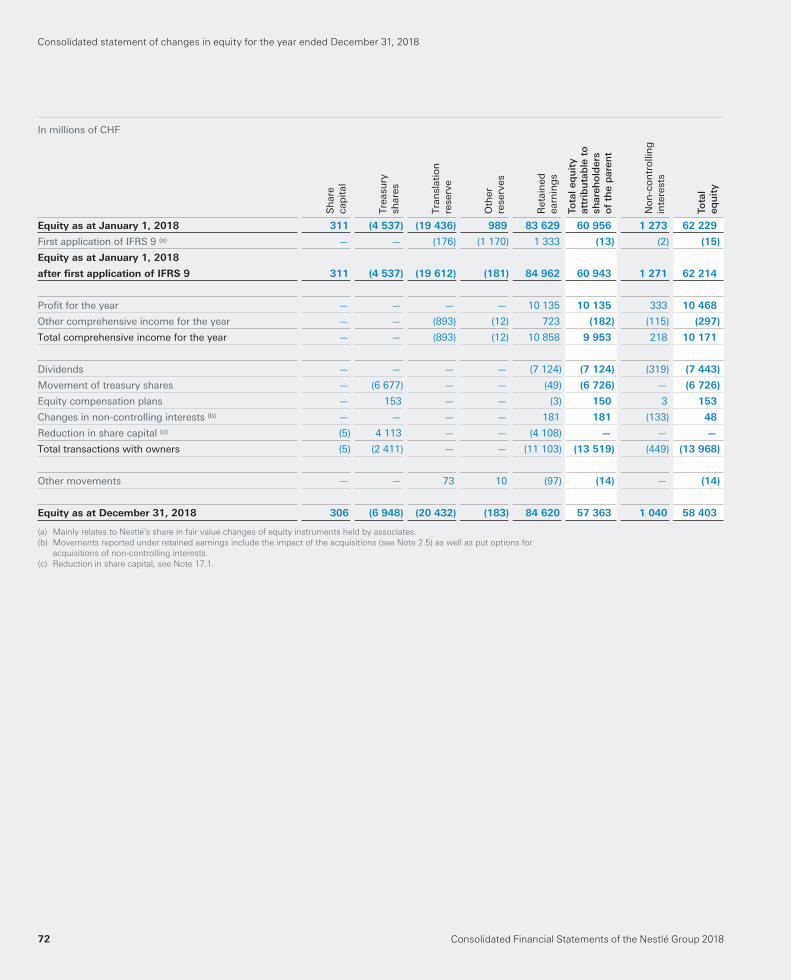
Consolidated Financial Statements of the Nestlé Group 201872
In millions of CHF
Sh
are
cap
ital
Trea
sury
shar
es
Tran
slat
ion
re
serv
e
Oth
erre
serv
es
Ret
ain
edea
rnin
gs
Tota
l eq
uit
yat
trib
uta
ble
to
shar
eho
lder
s o
f th
e p
aren
t
No
n-c
on
tro
llin
g
inte
rest
s
Tota
l eq
uit
y
Equity as at January 1, 2018 311 (4 537) (19 436) 989 83 629 60 956 1 273 62 229
First application of IFRS 9 (a) — — (176) (1 170) 1 333 (13) (2) (15)
Equity as at January 1, 2018
after fi rst application of IFRS 9 311 (4 537) (19 612) (181) 84 962 60 943 1 271 62 214
Profi t for the year — — — — 10 135 10 135 333 10 468
Other comprehensive income for the year — — (893) (12) 723 (182) (115) (297)
Total comprehensive income for the year — — (893) (12) 10 858 9 953 218 10 171
Dividends — — — — (7 124) (7 124) (319) (7 443)
Movement of treasury shares — (6 677) — — (49) (6 726) — (6 726)
Equity compensation plans — 153 — — (3) 150 3 153
Changes in non-controlling interests (b) — — — — 181 181 (133) 48
Reduction in share capital (c) (5) 4 113 — — (4 108) — — —
Total transactions with owners (5) (2 411) — — (11 103) (13 519) (449) (13 968)
Other movements — — 73 10 (97) (14) — (14)
Equity as at December 31, 2018 306 (6 948) (20 432) (183) 84 620 57 363 1 040 58 403
(a) Mainly relates to Nestlé’s share in fair value changes of equity instruments held by associates.
(b) Movements reported under retained earnings include the impact of the acquisitions (see Note 2.5) as well as put options for
acquisitions of non-controlling interests.
(c) Reduction in share capital, see Note 17.1.
Consolidated statement of changes in equity for the year ended December 31, 2018
Consolidated Financial Statements of the Nestlé Group 2018 73
Notes
1. Accounting policies
Accounting convention and accounting standards
The Consolidated Financial Statements comply with
International Financial Reporting Standards (IFRS) issued
by the International Accounting Standards Board (IASB)
and with Swiss law.
They have been prepared on a historical cost basis, unless
stated otherwise. All signifi cant consolidated companies,
joint arrangements and associates have a December 31
accounting year-end.
The Consolidated Financial Statements 2018 were approved
for issue by the Board of Directors on February 13, 2019,
and are subject to approval by the Annual General Meeting
on April 11, 2019.
Accounting policies
Accounting policies are included in the relevant notes to
the Consolidated Financial Statements and are presented
as text highlighted with a grey background. The accounting
policies below are applied throughout the fi nancial
statements.
Key accounting judgements, estimates
and assumptions
The preparation of the Consolidated Financial Statements
requires Group Management to exercise judgement and to
make estimates and assumptions that affect the application
of policies, reported amounts of revenues, expenses, assets
and liabilities and disclosures. These estimates and associated
assumptions are based on historical experience and various
other factors that are believed to be reasonable under the
circumstances. Actual results may differ from these estimates.
The estimates and underlying assumptions are reviewed
on an ongoing basis. Revisions to accounting estimates are
recognized in the period in which the estimate is revised if
the revision affects only that period, or in the period of the
revision and future periods if the revision affects both current
and future periods. Those areas affect mainly revenue
recognition (see Note 3), allowance for doubtful receivables
(see Note 7), leases (see Note 8), impairment tests of
goodwill and intangible assets with indefi nite useful life
(see Note 9), employee benefi ts (see Note 10), provisions
and contingencies (see Note 11) and taxes (see Note 13).
Foreign currencies
The functional currency of the Group’s entities is the currency
of their primary economic environment.
In individual companies, transactions in foreign currencies
are recorded at the rate of exchange at the date of the
transaction. Monetary assets and liabilities in foreign
currencies are translated at year-end rates. Any resulting
exchange differences are taken to the income statement,
except when deferred in Other comprehensive income as
qualifying cash fl ow hedges.
On consolidation, assets and liabilities of foreign operations
reported in their functional currencies are translated into
Swiss Francs, the Group’s presentation currency, at year-end
exchange rates. Income and expense are translated into Swiss
Francs at the annual weighted average rates of exchange or
at the rate on the date of the transaction for signifi cant items.
Differences arising from the retranslation of opening net
assets of foreign operations, together with differences arising
from the translation of the net results for the year of foreign
operations, are recognized in Other comprehensive income.
When there is a change of control in a foreign operation,
exchange differences that were recorded in equity are
recognized in the income statement as part of the gain
or loss on disposal.
Hyperinfl ationary economies
Several factors are considered when evaluating whether
an economy is hyperinfl ationary, including the cumulative
three-year infl ation, and the degree to which the population’s
behaviors and government policies are consistent with such
a condition.
The balance sheet and results of subsidiaries operating
in hyperinfl ationary economies are restated for the changes
in the general purchasing power of the local currency, using
offi cial indices at the balance sheet date, before translation
into Swiss Francs and, as a result, are stated in terms of the
measuring unit current at the balance sheet date. The
hyperinfl ationary economies in which the Group operates
are Venezuela and, as from 2018, Argentina (see Note 20).
Consolidated Financial Statements of the Nestlé Group 201874
1. Accounting policies
Other revenue
Other revenue are primarily sales-based royalties and
license fees from third parties which have been earned
during the period.
Expenses
Cost of goods sold is determined on the basis of the cost
of production or of purchase, adjusted for the variation of
inventories. All other expenses, including those in respect
of advertising and promotions, are recognized when the
Group receives the risks and rewards of ownership of the
goods or when it receives the services. Government grants
that are not related to assets are credited to the income
statement as a deduction of the related expense when they
are received, if there is reasonable assurance that the terms
of the grant will be met. Additional details of specifi c
expenses are provided in the respective notes.
Changes in presentation – income statement
The following main changes have been applied:
– the costs of returned or damaged products, and
maintenance and other costs of trade assets (such as
coffee machines, water coolers and freezers) previously
reported under Marketing and administration expenses
have been reclassified to Cost of goods sold; and
– some costs previously reported under Marketing and
administration expenses have been reclassified to
Research and development expenses and Distribution
expenses.
The above changes have been made to better align with the
function of the expenditure.
2017 comparatives have been restated (see Note 22).
Changes in presentation – cash fl ow statement
There were insignificant changes in presentation between
operating cash flow, cash flow from financing activities and
cash flow from investing activities regarding cash flows of
treasury investments and current financial debt.
2017 comparatives have been restated (see Note 22).
Changes in accounting policies
The following main changes have been applied:
– some costs that were previously included in the carrying
value of inventory are now expensed as incurred, following
a reevaluation of the relevance of including these costs
(the major part of which relates to allocated information
technology costs) in inventory. For a like-for-like comparison
of the performance 2017 and onwards, the value of
inventory on hand at January 1, 2017, has been restated;
and
– some taxes and levies on revenue or receipts, reported
previously as Taxes, are considered now respectively as
a reduction of Sales and as Marketing and administration
expenses, in order to better align with the function of the
expenditure.
2017 comparatives have been restated (see Note 22).
Consolidated Financial Statements of the Nestlé Group 2018 75
Changes in accounting standards
The Group has applied as from January 1, 2018, the
following new accounting standards.
IFRS 9 – Financial Instruments
The standard addresses the accounting principles for the
fi nancial reporting of fi nancial assets and fi nancial liabilities,
including classifi cation, measurement, impairment,
derecognition and hedge accounting.
The Group has performed a review of the business
model corresponding to the different portfolios of fi nancial
assets and of the characteristics of these fi nancial assets.
Consequently, investments in debt instruments whose
cash fl ows are solely payments of principal and interest
(“SPPI”) were designated either at amortized cost or at fair
value through Other comprehensive Income depending
on the objectives of the business model. The existing
investments in equity instruments at the date of the initial
application were generally designated at fair value through
Other comprehensive Income by election. This election
generated a reclassifi cation between equity components
of CHF 1.2 billion, with no net impact on the Group’s total
equity.
The impact of the new impairment model has been
reviewed. This analysis required the identifi cation of the
credit risk associated with the counterparties and
– considering that the majority of the Group’s fi nancial assets
are trade receivables – integrates statistical data refl ecting
the actual past experience of incurred loss due to default.
The amount of additional impairment recognized on
January 1, 2018, was CHF 15 million.
Furthermore, the Group has updated the defi nitions of
its hedging relationships in line with the risk management
activities and policies, with a specifi c attention to the
identifi cation of the components in the pricing of the
commodities.
This standard was mandatory for the accounting period
beginning on January 1, 2018, and was applied retrospectively
as at January 1, 2018, but with no restatement of comparative
information for prior years. Consequently, the Group
recognized any difference between the carrying amount
of financial instruments under IAS 39 and the carrying
amount under IFRS 9 in the opening retained earnings
(or other equity components) as at January 1, 2018.
Changes to hedge accounting policies have been applied
prospectively. All hedging relationships designated under
IAS 39 at December 31, 2017, met the criteria for hedge
accounting under IFRS 9 at January 1, 2018, and are therefore
regarded as continuing hedging relationships.
See Note 22 for the impact of IFRS 9. The changes
on the fair value hierarchy of fi nancial instruments as
at January 1, 2018, are presented in Note 12. The new
accounting policies are also set out in Note 12.
IFRS 15 – Revenue from Contracts with Customers
This standard combines, enhances and replaces specifi c
guidance on recognizing revenue with a single standard.
It defi nes a new fi ve-step model to recognize revenue
from customer contracts. The Group undertook a review of
the main types of commercial arrangements used with
customers under this model and has concluded that the
application of IFRS 15 had the main following effects:
i) as a consequence of the change in revenue recognition
from transfer of risks and rewards to transfer of control,
a small proportion of sales (less than 0.5% of annual
sales) is recognized on average 2 days later under the
new standard;
ii) payments to customers currently treated as distribution
costs have been reclassifi ed as deductions from sales
under the new standard;
iii) the timing of accruals for certain amounts payable to
customers was reviewed and as a result the current
liability for these amounts at the beginning of 2017
was increased.
This standard was mandatory for the accounting period
beginning on January 1, 2018, and has been applied with
retrospective impact, utilizing the practical expedient to
not restate contracts that begin and end within the same
annual accounting period.
The new accounting policies are set out in Note 3.
2017 comparatives have been restated (see Note 22).
IFRS 16 – Leases
This standard replaces IAS 17 and sets out the principles for
the recognition, measurement, presentation and disclosure
of leases.
The main effect on the Group is that IFRS 16 introduces
a single lessee accounting model and requires a lessee to
recognize assets and liabilities for almost all leases and
therefore resulted in an increase of Property, plant and
equipment and total Financial debt at January 1, 2017.
This standard is mandatory for the accounting period
beginning on January 1, 2019, but the Group early adopted
it on January 1, 2018, under the full retrospective approach,
utilizing the practical expedient to not reassess whether
a contract contains a lease.
The new accounting policies are set out in Note 8.2.
2017 comparatives have been restated (see Note 22).
1. Accounting policies
Consolidated Financial Statements of the Nestlé Group 201876
IFRIC 23 – Uncertainty over Income Tax Treatments
IFRIC 23 specifi es how to refl ect uncertainty in accounting
for income taxes. IFRIC 23 is mandatory for the accounting
period beginning on January 1, 2019, but the Group early
adopted it with effect from January 1, 2018. There was no
impact on the measurement of taxes as a consequence of
this adoption. The uncertain tax liabilities formerly included
under Provisions have been reclassifi ed to Current income
tax liabilities.
2017 comparatives have been restated (see Note 22).
In addition, a number of other existing standards have
been modifi ed on miscellaneous points with effect from
January 1, 2018. Such changes include Classifi cation and
Measurement of Share-based Payment Transactions
(Amendments to IFRS 2), Annual Improvements to IFRSs
2014–2016 Cycle (Amendments to IFRS 1 and IAS 28), and
IFRIC 22 Foreign Currency Transactions and Advance
Consideration.
None of these other amendments had a material effect
on the Group’s Financial Statements.
Changes in IFRS that may affect the Group
after December 31, 2018
There are no standards that are not yet effective and that
would be expected to have a material impact on the Group
in the current or future reporting periods.
1. Accounting policies
Consolidated Financial Statements of the Nestlé Group 2018 77
2. Scope of consolidation, acquisitions and disposals of businesses, assets held for sale and acquisitions of non-controlling interests
Scope of consolidation
The Consolidated Financial Statements comprise those of Nestlé S.A. and of its
subsidiaries (the Group).
Companies which the Group controls are fully consolidated from the date at which
the Group obtains control. The Group controls a company when it is exposed to, or has
rights to, variable returns from its involvement with the company and has the ability to
affect those returns through its power over the company. Though the Group generally
holds a majority of voting rights in the companies which are controlled, this applies
irrespective of the percentage of interest in the share capital if control is obtained
through agreements with other shareholders.
The list of the principal subsidiaries is provided in the section Companies of the Nestlé
Group, joint arrangements and associates.
Business combinations
Where not all of the equity of a subsidiary is acquired the non-controlling interests are
recognized at the non-controlling interest’s share of the acquiree’s net identifi able assets.
Upon obtaining control in a business combination achieved in stages, the Group
remeasures its previously held equity interest at fair value and recognizes a gain or
a loss to the income statement.
2.1 Modifi cation of the scope of consolidation
Acquisitions
In 2018 , the signifi cant acquisitions were:
– perpetual global license of Starbucks Consumer Packaged Goods and Foodservice
products (“Starbucks Alliance”), worldwide – roast and ground coffee, whole beans
as well as instant and portioned coffee (Powdered and Liquid Beverages) – end of
August.
– Atrium Innovations, mainly North America – nutritional health products (Nutrition
and Health Science) – 100%, March.
None of the other acquisitions of 2018 were signifi cant.
In 2017, among others, the acquisitions included:
– Blue Bottle Coffee, USA – high-end specialty coffee roaster and retailer (Powdered
and Liquid Beverages) – 68%, November.
None of the acquisitions of 2017 were signifi cant.
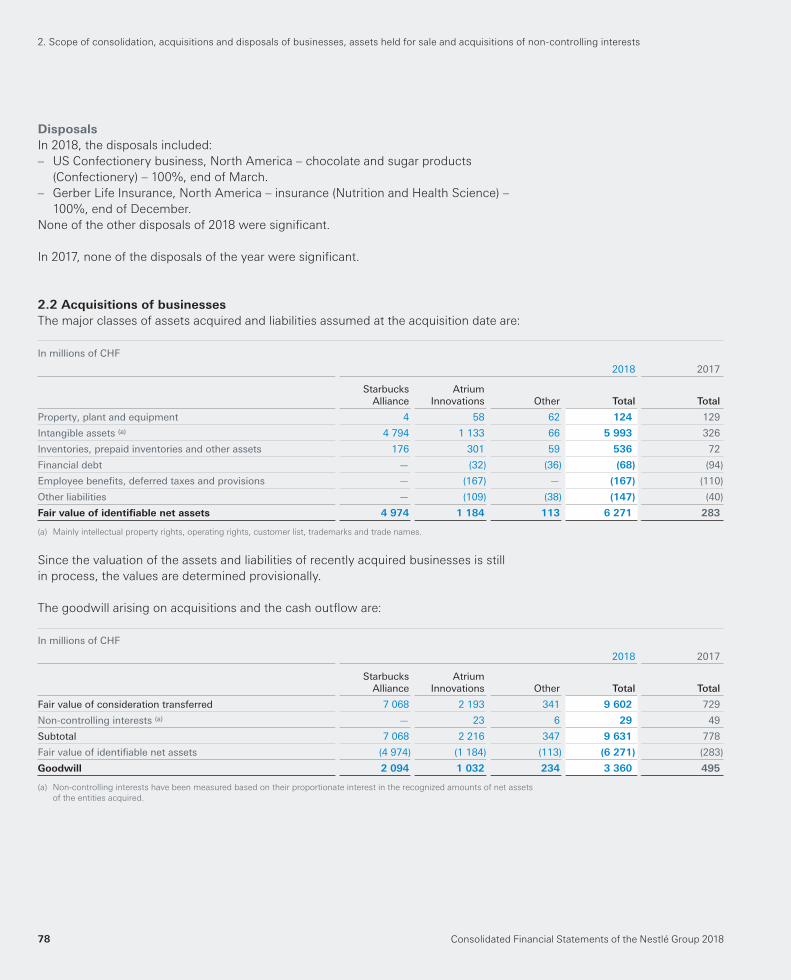
Consolidated Financial Statements of the Nestlé Group 201878
2. Scope of consolidation, acquisitions and disposals of businesses, assets held for sale and acquisitions of non-controlling interests
Disposals
In 2018 , the disposals included:
– US Confectionery business, North America – chocolate and sugar products
(Confectionery) – 100%, end of March.
– Gerber Life Insurance, North America – insurance (Nutrition and Health Science) –
100%, end of December.
None of the other disposals of 2018 were signifi cant.
In 2017 , none of the disposals of the year were significant.
2.2 Acquisitions of businesses
The major classes of assets acquired and liabilities assumed at the acquisition date are:
In millions of CHF
2018 2017
StarbucksAlliance
AtriumInnovations Other Total Total
Property, plant and equipment 4 58 62 124 129
Intangible assets (a) 4 794 1 133 66 5 993 326
Inventories, prepaid inventories and other assets 176 301 59 536 72
Financial debt — (32) (36) (68) (94)
Employee benefi ts, deferred taxes and provisions — (167) — (167) (110)
Other liabilities — (109) (38) (147) (40)
Fair value of identifi able net assets 4 974 1 184 113 6 271 283
(a) Mainly intellectual property rights, operating rights, customer list, trademarks and trade names.
Since the valuation of the assets and liabilities of recently acquired businesses is still
in process, the values are determined provisionally.
The goodwill arising on acquisitions and the cash outfl ow are:
In millions of CHF
2018 2017
StarbucksAlliance
AtriumInnovations Other Total Total
Fair value of consideration transferred 7 068 2 193 341 9 602 729
Non-controlling interests (a) — 23 6 29 49
Subtotal 7 068 2 216 347 9 631 778
Fair value of identifi able net assets (4 974) (1 184) (113) (6 271) (283)
Goodwill 2 094 1 032 234 3 360 495
(a) Non-controlling interests have been measured based on their proportionate interest in the recognized amounts of net assets
of the entities acquired.
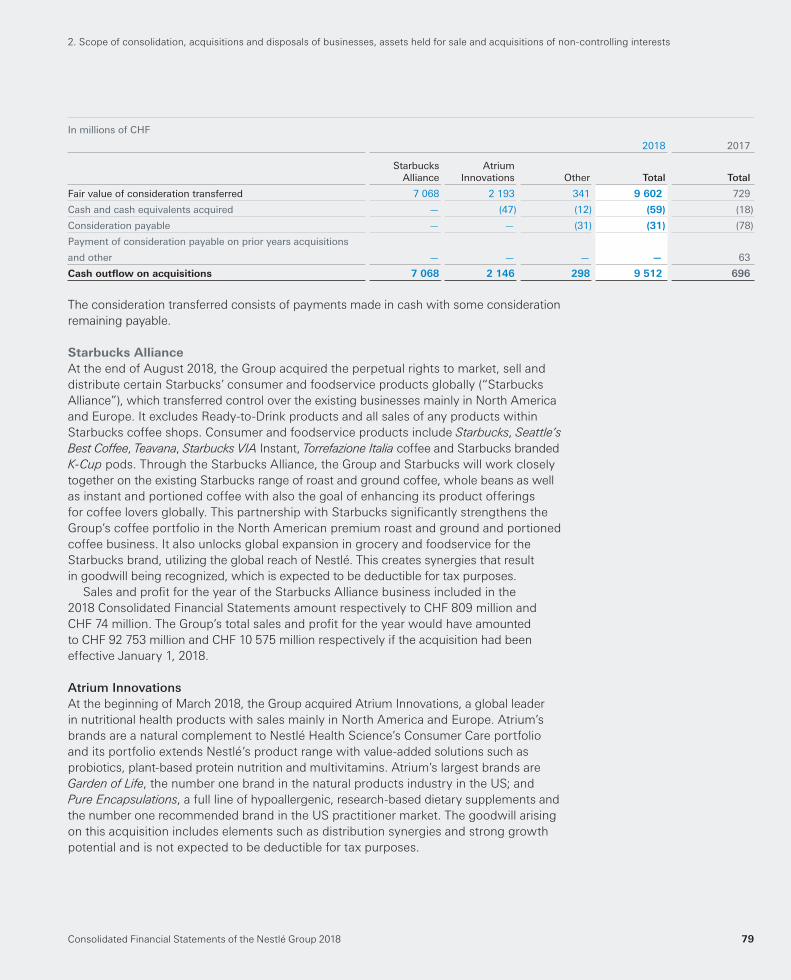
Consolidated Financial Statements of the Nestlé Group 2018 79
In millions of CHF
2018 2017
StarbucksAlliance
AtriumInnovations Other Total Total
Fair value of consideration transferred 7 068 2 193 341 9 602 729
Cash and cash equivalents acquired — (47) (12) (59) (18)
Consideration payable — — (31) (31) (78)
Payment of consideration payable on prior years acquisitions
and other — — — — 63
Cash outfl ow on acquisitions 7 068 2 146 298 9 512 696
The consideration transferred consists of payments made in cash with some consideration
remaining payable.
Starbucks Alliance
At the end of August 2018, the Group acquired the perpetual rights to market, sell and
distribute certain Starbucks’ consumer and foodservice products globally (“Starbucks
Alliance”), which transferred control over the existing businesses mainly in North America
and Europe. It excludes Ready-to-Drink products and all sales of any products within
Starbucks coffee shops. Consumer and foodservice products include Starbucks, Seattle’s
Best Coffee, Teavana, Starbucks VIA Instant, Torrefazione Italia coffee and Starbucks branded
K-Cup pods. Through the Starbucks Alliance, the Group and Starbucks will work closely
together on the existing Starbucks range of roast and ground coffee, whole beans as well
as instant and portioned coffee with also the goal of enhancing its product offerings
for coffee lovers globally. This partnership with Starbucks signifi cantly strengthens the
Group’s coffee portfolio in the North American premium roast and ground and portioned
coffee business. It also unlocks global expansion in grocery and foodservice for the
Starbucks brand, utilizing the global reach of Nestlé. This creates synergies that result
in goodwill being recognized, which is expected to be deductible for tax purposes.
Sales and profi t for the year of the Starbucks Alliance business included in the
2018 Consolidated Financial Statements amount respectively to CHF 809 million and
CHF 74 million. The Group’s total sales and profi t for the year would have amounted
to CHF 92 753 million and CHF 10 575 million respectively if the acquisition had been
effective January 1, 2018.
Atrium InnovationsAt the beginning of March 2018, the Group acquired Atrium Innovations, a global leader
in nutritional health products with sales mainly in North America and Europe. Atrium’s
brands are a natural complement to Nestlé Health Science’s Consumer Care portfolio
and its portfolio extends Nestlé’s product range with value-added solutions such as
probiotics, plant-based protein nutrition and multivitamins. Atrium’s largest brands are
Garden of Life, the number one brand in the natural products industry in the US; and
Pure Encapsulations, a full line of hypoallergenic, research-based dietary supplements and
the number one recommended brand in the US practitioner market. The goodwill arising
on this acquisition includes elements such as distribution synergies and strong growth
potential and is not expected to be deductible for tax purposes.
2. Scope of consolidation, acquisitions and disposals of businesses, assets held for sale and acquisitions of non-controlling interests
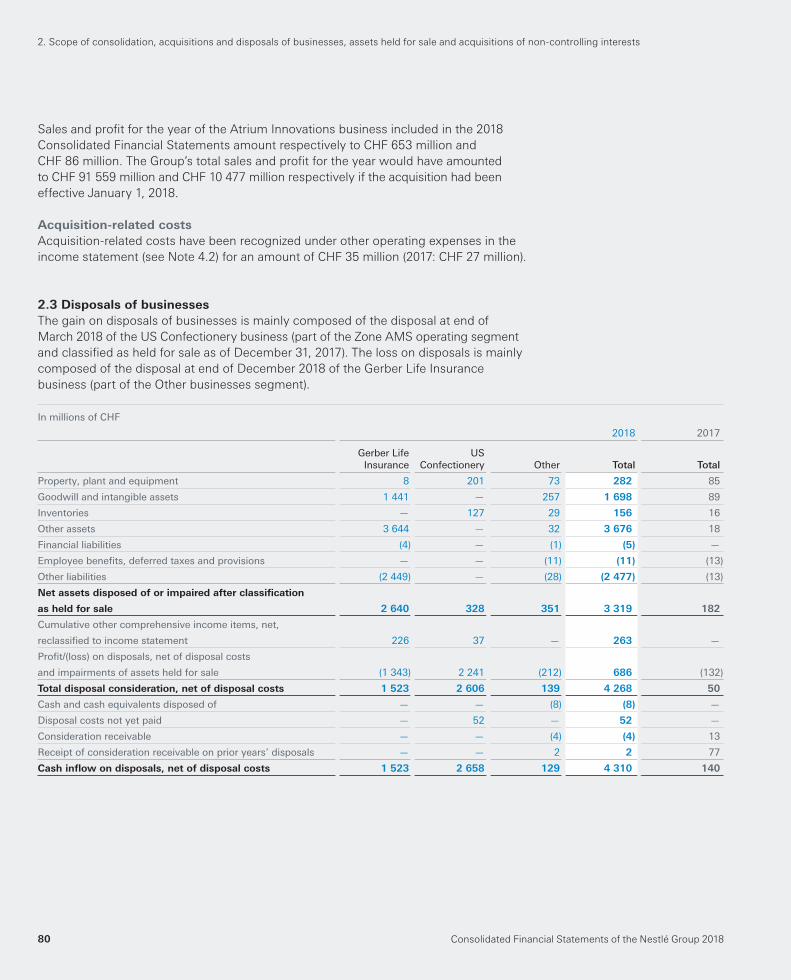
Consolidated Financial Statements of the Nestlé Group 201880
Sales and profi t for the year of the Atrium Innovations business included in the 2018
Consolidated Financial Statements amount respectively to CHF 653 million and
CHF 86 million. The Group’s total sales and profi t for the year would have amounted
to CHF 91 559 million and CHF 10 477 million respectively if the acquisition had been
effective January 1, 2018.
Acquisition-related costs
Acquisition-related costs have been recognized under other operating expenses in the
income statement (see Note 4.2) for an amount of CHF 35 million ( 2017 : CHF 27 million ).
2.3 Disposals of businesses
The gain on disposals of businesses is mainly composed of the disposal at end of
March 2018 of the US Confectionery business (part of the Zone AMS operating segment
and classifi ed as held for sale as of December 31, 2017). The loss on disposals is mainly
composed of the disposal at end of December 2018 of the Gerber Life Insurance
business (part of the Other businesses segment).
In millions of CHF
2018 2017
Gerber LifeInsurance
US Confectionery Other Total Total
Property, plant and equipment 8 201 73 282 85
Goodwill and intangible assets 1 441 — 257 1 698 89
Inventories — 127 29 156 16
Other assets 3 644 — 32 3 676 18
Financial liabilities (4) — (1) (5) —
Employee benefi ts, deferred taxes and provisions — — (11) (11) (13)
Other liabilities (2 449) — (28) (2 477) (13)
Net assets disposed of or impaired after classifi cation
as held for sale 2 640 328 351 3 319 182
Cumulative other comprehensive income items, net,
reclassifi ed to income statement 226 37 — 263 —
Profi t/(loss) on disposals, net of disposal costs
and impairments of assets held for sale (1 343) 2 241 (212) 686 (132)
Total disposal consideration, net of disposal costs 1 523 2 606 139 4 268 50
Cash and cash equivalents disposed of — — (8) (8) —
Disposal costs not yet paid — 52 — 52 —
Consideration receivable — — (4) (4) 13
Receipt of consideration receivable on prior years’ disposals — — 2 2 77
Cash infl ow on disposals, net of disposal costs 1 523 2 658 129 4 310 140
2. Scope of consolidation, acquisitions and disposals of businesses, assets held for sale and acquisitions of non-controlling interests
Consolidated Financial Statements of the Nestlé Group 2018 81
2.4 Assets held for sale
Assets held for sale and disposal groups
Non-current assets held for sale and disposal groups are presented separately in the
current section of the balance sheet when the following criteria are met: the Group is
committed to selling the asset or disposal group, an active plan of sale has commenced,
and in the judgement of Group Management it is highly probable that the sale will be
completed within 12 months. Immediately before the initial classifi cation of the assets
and disposal groups as held for sale, the carrying amounts of the assets (or all the assets
and liabilities in the disposal groups) are measured in accordance with the applicable
accounting policy. Assets held for sale and disposal groups are subsequently measured
at the lower of their carrying amount and fair value less cost to sell. Assets held for sale
are no longer amortized or depreciated.
As of December 31, 2018, assets held for sale and liabilities directly associated with assets
held for sale are mainly composed of the Nestlé Skin Health business, which is part of
the Other businesses segment. This business has been classifi ed as held for sale due
to future growth opportunities lying outside the Group’s strategic scope. The Group is
expecting to lose control of this business in the second half of 2019. The related cumulative
loss currently recognized in other comprehensive income has been estimated at about
CHF 90 million (mainly cumulative currency translation loss) and will be recognized in
the income statement at the date the control is lost.
As of December 31, 2017, assets held for sale were mainly composed of the US
Confectionery business.
2. Scope of consolidation, acquisitions and disposals of businesses, assets held for sale and acquisitions of non-controlling interests
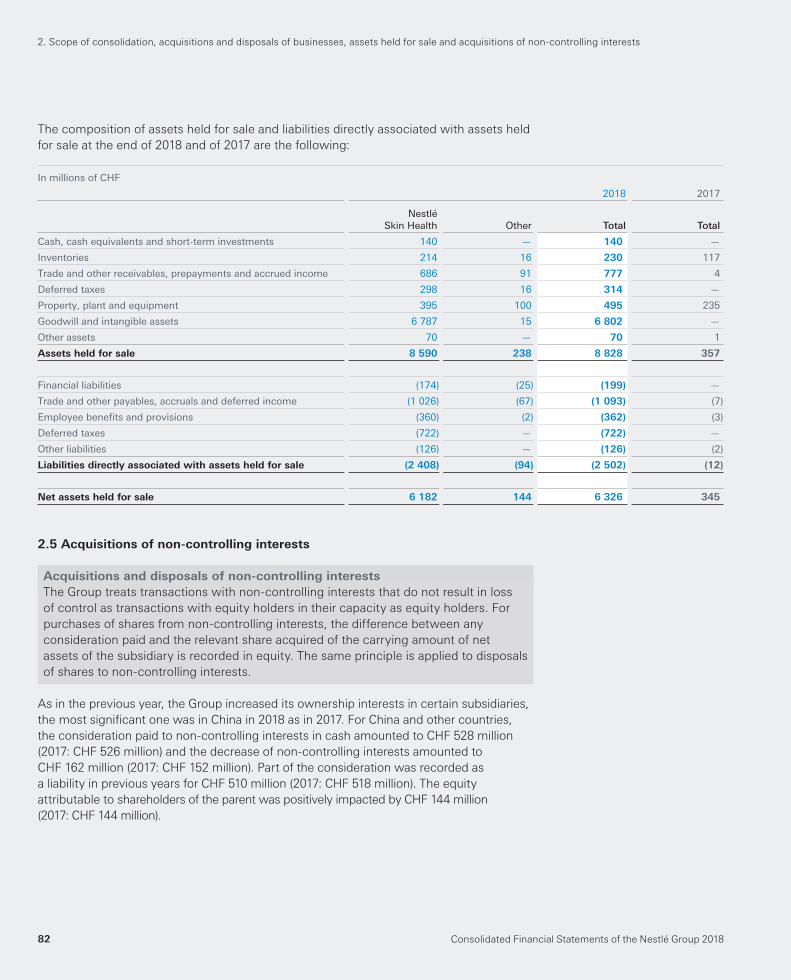
Consolidated Financial Statements of the Nestlé Group 201882
The composition of assets held for sale and liabilities directly associated with assets held
for sale at the end of 2018 and of 2017 are the following:
In millions of CHF
2018 2017
NestléSkin Health Other Total Total
Cash, cash equivalents and short-term investments 140 — 140 —
Inventories 214 16 230 117
Trade and other receivables, prepayments and accrued income 686 91 777 4
Deferred taxes 298 16 314 —
Property, plant and equipment 395 100 495 235
Goodwill and intangible assets 6 787 15 6 802 —
Other assets 70 — 70 1
Assets held for sale 8 590 238 8 828 357
Financial liabilities (174) (25) (199) —
Trade and other payables, accruals and deferred income (1 026) (67) (1 093) (7)
Employee benefi ts and provisions (360) (2) (362) (3)
Deferred taxes (722) — (722) —
Other liabilities (126) — (126) (2)
Liabilities directly associated with assets held for sale (2 408) (94) (2 502) (12)
Net assets held for sale 6 182 144 6 326 345
2.5 Acquisitions of non-controlling interests
Acquisitions and disposals of non-controlling interests
The Group treats transactions with non-controlling interests that do not result in loss
of control as transactions with equity holders in their capacity as equity holders. For
purchases of shares from non-controlling interests, the difference between any
consideration paid and the relevant share acquired of the carrying amount of net
assets of the subsidiary is recorded in equity. The same principle is applied to disposals
of shares to non-controlling interests.
As in the previous year, the Group increased its ownership interests in certain subsidiaries,
the most signifi cant one was in China in 2018 as in 2017. For China and other countries,
the consideration paid to non-controlling interests in cash amounted to CHF 528 million
(2017: CHF 526 million) and the decrease of non-controlling interests amounted to
CHF 162 million (2017: CHF 152 million). Part of the consideration was recorded as
a liability in previous years for CHF 510 million (2017: CHF 518 million). The equity
attributable to shareholders of the parent was positively impacted by CHF 144 million
(2017: CHF 144 million).
2. Scope of consolidation, acquisitions and disposals of businesses, assets held for sale and acquisitions of non-controlling interests
Consolidated Financial Statements of the Nestlé Group 2018 83
3. Analyses by segment
Nestlé is organized into three geographic zones and several globally managed businesses.
The Company manufactures and distributes food and beverage products in the following
categories: powdered and liquid beverages, water, milk products and ice cream, prepared
dishes and cooking aids, confectionery and petcare. Nestlé also manufactures and
distributes nutritional science products through its globally managed business Nestlé
Health Science, and science-based solutions that contribute to the health of skin, hair
and nails through Nestlé Skin Health. The Group has factories in 85 countries and sales
in 190 countries and employs around 308 000 people.
Segment reporting
Operating segments refl ect the Group’s management structure and the way fi nancial
information is regularly reviewed by the Group’s chief operating decision maker (CODM),
which is defi ned as the Executive Board.
The CODM considers the business from both a geographic and product perspective,
through three geographic Zones and several Globally Managed Businesses (GMB).
Zones and GMB that meet the quantitative threshold of 10% of total sales or trading
operating profi t for all operating segments, are presented on a stand-alone basis as
reportable segments. Even though it does not meet the reporting threshold, Nestlé
Waters is reported separately for consistency with long-standing practice of the Group.
Therefore, the Group’s reportable operating segments are:
– Zone Europe, Middle East and North Africa (EMENA);
– Zone Americas (AMS);
– Zone Asia, Oceania and sub-Saharan Africa (AOA);
– Nestlé Waters.
Other business activities and operating segments, including GMB that do not meet the
threshold, like Nespresso, Nestlé Health Science and Nestlé Skin Health, are combined
and presented in Other businesses. Following a change of business structure, effective
as from January 1, 2018, Nestlé Nutrition has been managed as a Regionally Managed
Business instead of a Globally Managed Business and consequently reported as part
of Zone EMENA, Zone AMS and Zone AOA while Gerber Life Insurance is reported under
Other businesses. In addition, the presentation of invested capital by operating segment
has been modifi ed with the goodwill related to the PetCare business reclassifi ed from
Unallocated items to the Zones following a modifi cation on how it is reported to the
Executive Board. 2017 comparatives have been adjusted.
As some operating segments represent geographic Zones, information by product
is also disclosed. The seven product groups that are disclosed represent the highest
categories of products that are followed internally.
Segment results (Trading operating profi t) represent the contribution of the different
segments to central overheads, unallocated research and development costs and the
trading operating profi t of the Group. Specifi c corporate expenses as well as specifi c
research and development costs are allocated to the corresponding segments. In addition
to the Trading operating profi t, Underlying Trading operating profi t is shown on a voluntary
basis because it is one of the key metrics used by Group Management to monitor the
Group.
Depreciation and amortization includes depreciation of property, plant and equipment
(including right of use assets under leases) and amortization of intangible assets.
Consolidated Financial Statements of the Nestlé Group 201884
3. Analyses by segment
No segment assets and liabilities are regularly provided to the CODM to assess segment
performance or to allocate resources and therefore segment assets and liabilities are not
disclosed. However the Group discloses the invested capital, goodwill and intangible
assets by segment and by product on a voluntary basis.
Invested capital comprises property, plant and equipment, trade receivables and
some other receivables, assets held for sale, inventories, prepayments and accrued
income as well as specifi c fi nancial assets associated to the segments, less trade
payables and some other payables, liabilities directly associated with assets held for
sale, non-current other payables as well as accruals and deferred income.
Goodwill and intangible assets are not included in invested capital since the amounts
recognized are not comparable between segments due to differences in the intensity
of acquisition activity and changes in accounting standards which were applicable at
various points in time when the Group undertook signifi cant acquisitions. Nevertheless,
an allocation of goodwill and intangible assets by segment and product and the related
impairment expenses are provided.
Inter-segment eliminations represent inter-company balances between the different
segments.
Invested capital and goodwill and intangible assets by segment represent the situation
at the end of the year, while the fi gures by product represent the annual average, as this
provides a better indication of the level of invested capital.
Capital additions represent the total cost incurred to acquire property, plant and
equipment (including right of use assets under leases), intangible assets and goodwill,
including those arising from business combinations. Since 2018 and the introduction
of IFRS 16, capital expenditure representing the investment in property, plant and
equipment only are not disclosed anymore.
Unallocated items represent items whose allocation to a segment or product would
be arbitrary. They mainly comprise:
– corporate expenses and related assets/liabilities;
– research and development costs and related assets/liabilities; and
– some goodwill and intangible assets.
Revenue
Sales represent amounts received and receivable from third parties for goods supplied
to the customers and for services rendered. Sales are recognized when control of the
goods has transferred to the customer, which is mainly upon arrival at the customer.
Revenue is measured as the amount of consideration which the Group expects to
receive, based on the list price applicable to a given distribution channel after deduction
of returns, sales taxes, pricing allowances, other trade discounts and couponing and
price promotions to consumers. The level of discounts, allowances and promotional
rebates is recognized as a deduction from revenue at the time that the related sales are
recognized or when the rebate is offered to the customer (or consumer if applicable).
They are estimated using judgements based on historical experience and the specific
terms of the agreements with the customers. Payments made to customers for
commercial services received are expensed. The Group has a range of credit terms
which are typically short term, in line with market practice and without any fi nancing
component.
Consolidated Financial Statements of the Nestlé Group 2018 85
The Group does not generally accept sales returns, except in limited cases mainly
in the Infant Nutrition business. Historical experience is used to estimate such returns
at the time of sale. No asset is recognized for products to be recoverable from these
returns, as they are not anticipated to be resold.
Trade assets (mainly coffee machines, water coolers and freezers) may be sold or
leased separately to customers.
Arrangements where the Group transfers substantially all the risks and rewards
incidental to ownership to the customer are treated as finance lease arrangements.
Operating lease revenue for trade asset rentals is recognized on a straight-line basis
over the lease term.
Sales are disaggregated by product group and geography in Notes 3.2 and 3.4.
Other revenue is primarily sales-based royalties and license fees from third parties
which have been earned during the period.
3. Analyses by segment
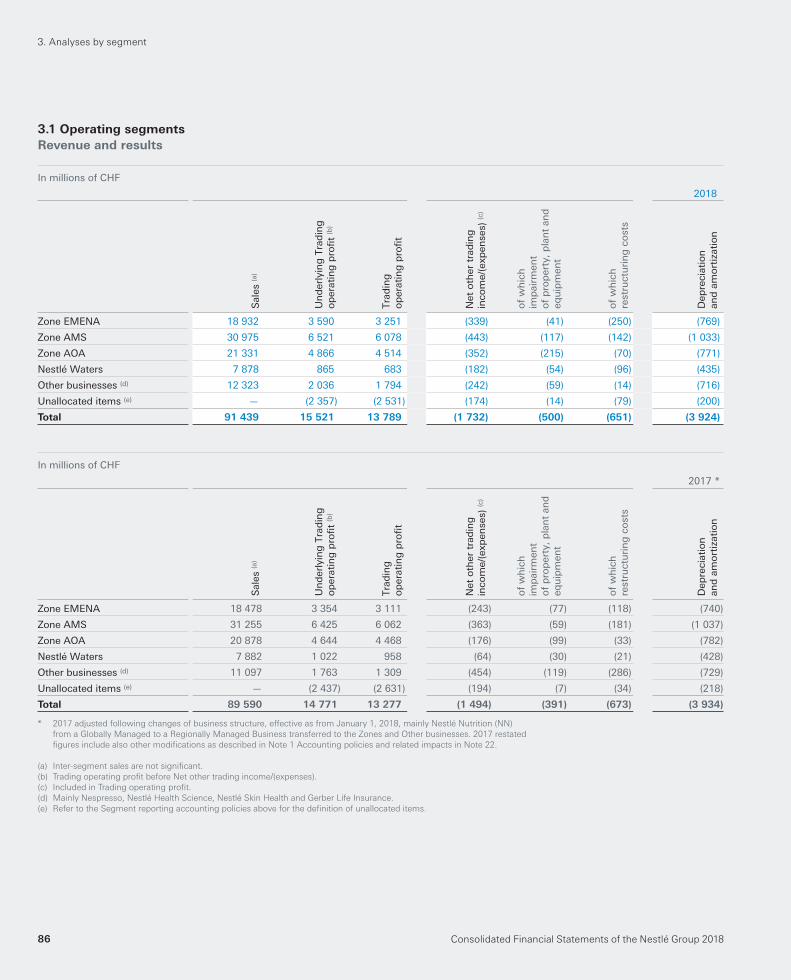
Consolidated Financial Statements of the Nestlé Group 201886
3. Analyses by segment
3.1 Operating segments
Revenue and results
In millions of CHF
2018
Sal
es (a
)
Un
der
lyin
g T
rad
ing
op
erat
ing
pro
fi t
(b)
Trad
ing
op
erat
ing
pro
fi t
Net
oth
er t
rad
ing
inco
me/
(exp
ense
s) (c
)
of
wh
ich
imp
airm
ent
of
pro
per
ty, p
lan
t an
d
equ
ipm
ent
of
wh
ich
rest
ruct
uri
ng
co
sts
Dep
reci
atio
n
and
am
ort
izat
ion
Zone EMENA 18 932 3 590 3 251 (339) (41) (250) (769)
Zone AMS 30 975 6 521 6 078 (443) (117) (142) (1 033)
Zone AOA 21 331 4 866 4 514 (352) (215) (70) (771)
Nestlé Waters 7 878 865 683 (182) (54) (96) (435)
Other businesses (d) 12 323 2 036 1 794 (242) (59) (14) (716)
Unallocated items (e) — (2 357) (2 531) (174) (14) (79) (200)
Total 91 439 15 521 13 789 (1 732) (500) (651) (3 924)
In millions of CHF
2017 *
Sal
es (a
)
Un
der
lyin
g T
rad
ing
op
erat
ing
pro
fi t
(b)
Trad
ing
op
erat
ing
pro
fi t
Net
oth
er t
rad
ing
inco
me/
(exp
ense
s) (c
)
of
wh
ich
imp
airm
ent
of
pro
per
ty, p
lan
t an
d
equ
ipm
ent
of
wh
ich
rest
ruct
uri
ng
co
sts
Dep
reci
atio
n
and
am
ort
izat
ion
Zone EMENA 18 478 3 354 3 111 (243) (77) (118) (740)
Zone AMS 31 255 6 425 6 062 (363) (59) (181) (1 037)
Zone AOA 20 878 4 644 4 468 (176) (99) (33) (782)
Nestlé Waters 7 882 1 022 958 (64) (30) (21) (428)
Other businesses (d) 11 097 1 763 1 309 (454) (119) (286) (729)
Unallocated items (e) — (2 437) (2 631) (194) (7) (34) (218)
Total 89 590 14 771 13 277 (1 494) (391) (673) (3 934)
* 2017 adjusted following changes of business structure, effective as from January 1, 2018, mainly Nestlé Nutrition (NN)
from a Globally Managed to a Regionally Managed Business transferred to the Zones and Other businesses. 2017 restated
fi gures include also other modifi cations as described in Note 1 Accounting policies and related impacts in Note 22.
(a) Inter-segment sales are not signifi cant.
(b) Trading operating profi t before Net other trading income/(expenses).
(c) Included in Trading operating profi t.
(d) Mainly Nespresso, Nestlé Health Science, Nestlé Skin Health and Gerber Life Insurance.
(e) Refer to the Segment reporting accounting policies above for the defi nition of unallocated items.
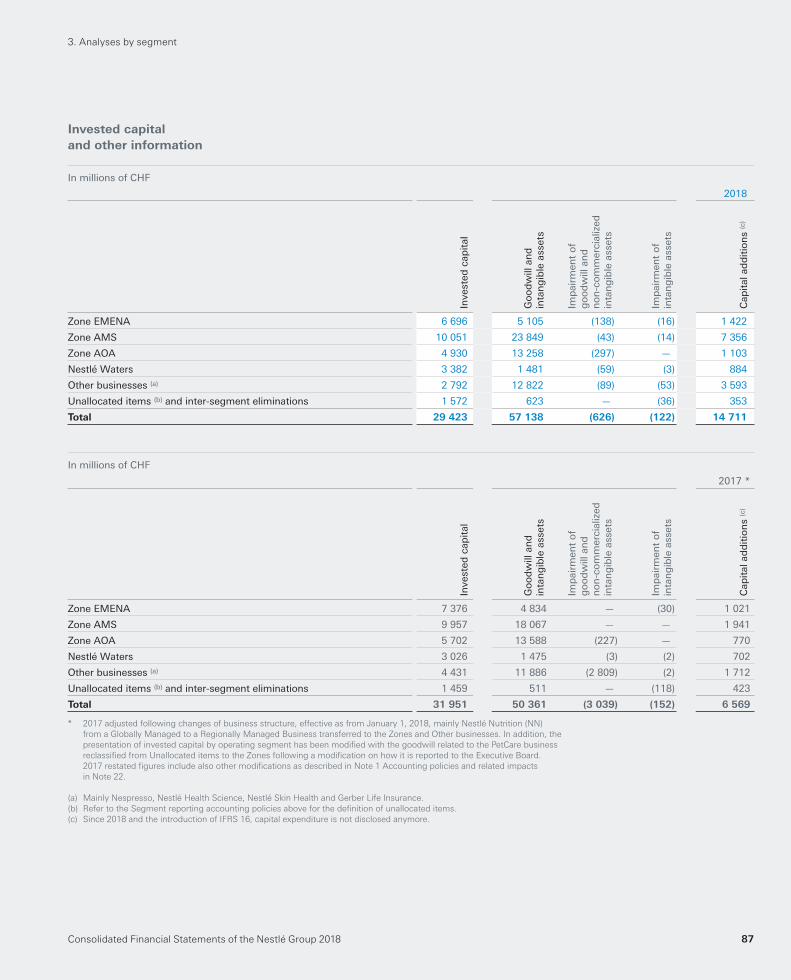
Consolidated Financial Statements of the Nestlé Group 2018 87
3. Analyses by segment
Invested capital
and other information
In millions of CHF
2018
Inve
sted
cap
ital
Go
od
will
an
din
tan
gib
le a
sset
s
Imp
airm
ent
of
go
od
will
an
d
no
n-c
om
mer
cial
ized
in
tan
gib
le a
sset
s
Imp
airm
ent
of
inta
ng
ible
ass
ets
Cap
ital
ad
dit
ion
s (c
)
Zone EMENA 6 696 5 105 (138) (16) 1 422
Zone AMS 10 051 23 849 (43) (14) 7 356
Zone AOA 4 930 13 258 (297) — 1 103
Nestlé Waters 3 382 1 481 (59) (3) 884
Other businesses (a) 2 792 12 822 (89) (53) 3 593
Unallocated items (b) and inter-segment eliminations 1 572 623 — (36) 353
Total 29 423 57 138 (626) (122) 14 711
In millions of CHF
2017 *
Inve
sted
cap
ital
Go
od
will
an
din
tan
gib
le a
sset
s
Imp
airm
ent
of
go
od
will
an
d
no
n-c
om
mer
cial
ized
in
tan
gib
le a
sset
s
Imp
airm
ent
of
inta
ng
ible
ass
ets
Cap
ital
ad
dit
ion
s (c
)
Zone EMENA 7 376 4 834 — (30) 1 021
Zone AMS 9 957 18 067 — — 1 941
Zone AOA 5 702 13 588 (227) — 770
Nestlé Waters 3 026 1 475 (3) (2) 702
Other businesses (a) 4 431 11 886 (2 809) (2) 1 712
Unallocated items (b) and inter-segment eliminations 1 459 511 — (118) 423
Total 31 951 50 361 (3 039) (152) 6 569
* 2017 adjusted following changes of business structure, effective as from January 1, 2018, mainly Nestlé Nutrition (NN)
from a Globally Managed to a Regionally Managed Business transferred to the Zones and Other businesses. In addition, the
presentation of invested capital by operating segment has been modifi ed with the goodwill related to the PetCare business
reclassifi ed from Unallocated items to the Zones following a modifi cation on how it is reported to the Executive Board.
2017 restated fi gures include also other modifi cations as described in Note 1 Accounting policies and related impacts
in Note 22.
(a) Mainly Nespresso, Nestlé Health Science, Nestlé Skin Health and Gerber Life Insurance.
(b) Refer to the Segment reporting accounting policies above for the defi nition of unallocated items.
(c) Since 2018 and the introduction of IFRS 16, capital expenditure is not disclosed anymore.
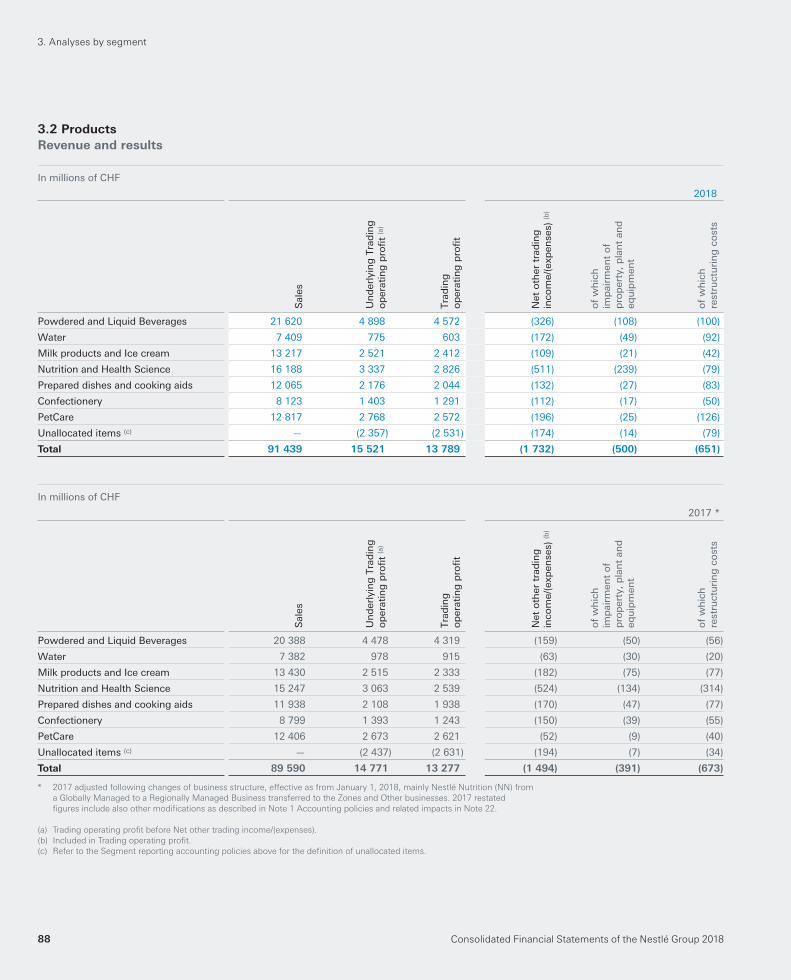
Consolidated Financial Statements of the Nestlé Group 201888
3. Analyses by segment
3.2 Products
Revenue and results
In millions of CHF
2018
Sal
es
Un
der
lyin
g T
rad
ing
op
erat
ing
pro
fi t
(a)
Trad
ing
op
erat
ing
pro
fi t
Net
oth
er t
rad
ing
inco
me/
(exp
ense
s) (b
)
of
wh
ich
imp
airm
ent
of
pro
per
ty, p
lan
t an
d
equ
ipm
ent
of
wh
ich
rest
ruct
uri
ng
co
sts
Powdered and Liquid Beverages 21 620 4 898 4 572 (326) (108) (100)
Water 7 409 775 603 (172) (49) (92)
Milk products and Ice cream 13 217 2 521 2 412 (109) (21) (42)
Nutrition and Health Science 16 188 3 337 2 826 (511) (239) (79)
Prepared dishes and cooking aids 12 065 2 176 2 044 (132) (27) (83)
Confectionery 8 123 1 403 1 291 (112) (17) (50)
PetCare 12 817 2 768 2 572 (196) (25) (126)
Unallocated items (c) — (2 357) (2 531) (174) (14) (79)
Total 91 439 15 521 13 789 (1 732) (500) (651)
In millions of CHF
2017 *
Sal
es
Un
der
lyin
g T
rad
ing
op
erat
ing
pro
fi t
(a)
Trad
ing
op
erat
ing
pro
fi t
Net
oth
er t
rad
ing
inco
me/
(exp
ense
s) (b
)
of
wh
ich
imp
airm
ent
of
pro
per
ty, p
lan
t an
d
equ
ipm
ent
of
wh
ich
rest
ruct
uri
ng
co
sts
Powdered and Liquid Beverages 20 388 4 478 4 319 (159) (50) (56)
Water 7 382 978 915 (63) (30) (20)
Milk products and Ice cream 13 430 2 515 2 333 (182) (75) (77)
Nutrition and Health Science 15 247 3 063 2 539 (524) (134) (314)
Prepared dishes and cooking aids 11 938 2 108 1 938 (170) (47) (77)
Confectionery 8 799 1 393 1 243 (150) (39) (55)
PetCare 12 406 2 673 2 621 (52) (9) (40)
Unallocated items (c) — (2 437) (2 631) (194) (7) (34)
Total 89 590 14 771 13 277 (1 494) (391) (673)
* 2017 adjusted following changes of business structure, effective as from January 1, 2018, mainly Nestlé Nutrition (NN) from
a Globally Managed to a Regionally Managed Business transferred to the Zones and Other businesses. 2017 restated
fi gures include also other modifi cations as described in Note 1 Accounting policies and related impacts in Note 22.
(a) Trading operating profi t before Net other trading income/(expenses).
(b) Included in Trading operating profi t.
(c) Refer to the Segment reporting accounting policies above for the defi nition of unallocated items.
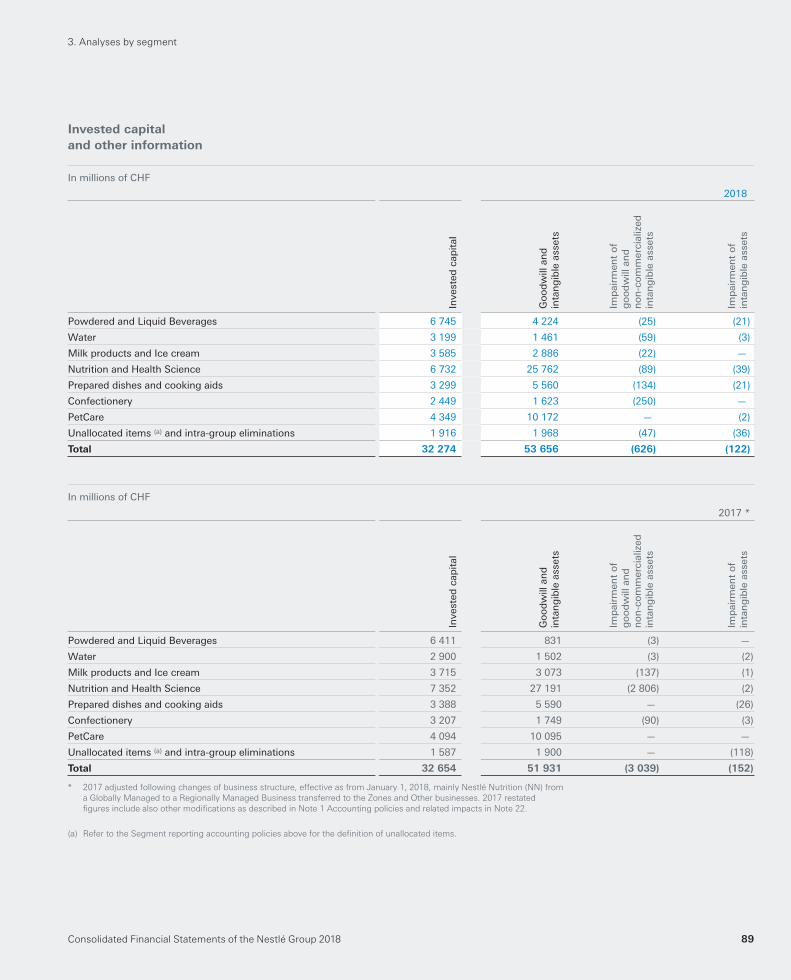
Consolidated Financial Statements of the Nestlé Group 2018 89
Invested capital
and other information
In millions of CHF
2018
Inve
sted
cap
ital
Go
od
will
an
din
tan
gib
le a
sset
s
Imp
airm
ent
of
go
od
will
an
d
no
n-c
om
mer
cial
ized
in
tan
gib
le a
sset
s
Imp
airm
ent
of
inta
ng
ible
ass
ets
Powdered and Liquid Beverages 6 745 4 224 (25) (21)
Water 3 199 1 461 (59) (3)
Milk products and Ice cream 3 585 2 886 (22) —
Nutrition and Health Science 6 732 25 762 (89) (39)
Prepared dishes and cooking aids 3 299 5 560 (134) (21)
Confectionery 2 449 1 623 (250) —
PetCare 4 349 10 172 — (2)
Unallocated items (a) and intra-group eliminations 1 916 1 968 (47) (36)
Total 32 274 53 656 (626) (122)
In millions of CHF
2017 *
Inve
sted
cap
ital
Go
od
will
an
din
tan
gib
le a
sset
s
Imp
airm
ent
of
go
od
will
an
d
no
n-c
om
mer
cial
ized
in
tan
gib
le a
sset
s
Imp
airm
ent
of
inta
ng
ible
ass
ets
Powdered and Liquid Beverages 6 411 831 (3) —
Water 2 900 1 502 (3) (2)
Milk products and Ice cream 3 715 3 073 (137) (1)
Nutrition and Health Science 7 352 27 191 (2 806) (2)
Prepared dishes and cooking aids 3 388 5 590 — (26)
Confectionery 3 207 1 749 (90) (3)
PetCare 4 094 10 095 — —
Unallocated items (a) and intra-group eliminations 1 587 1 900 — (118)
Total 32 654 51 931 (3 039) (152)
* 2017 adjusted following changes of business structure, effective as from January 1, 2018, mainly Nestlé Nutrition (NN) from
a Globally Managed to a Regionally Managed Business transferred to the Zones and Other businesses. 2017 restated
fi gures include also other modifi cations as described in Note 1 Accounting policies and related impacts in Note 22.
(a) Refer to the Segment reporting accounting policies above for the defi nition of unallocated items.
3. Analyses by segment
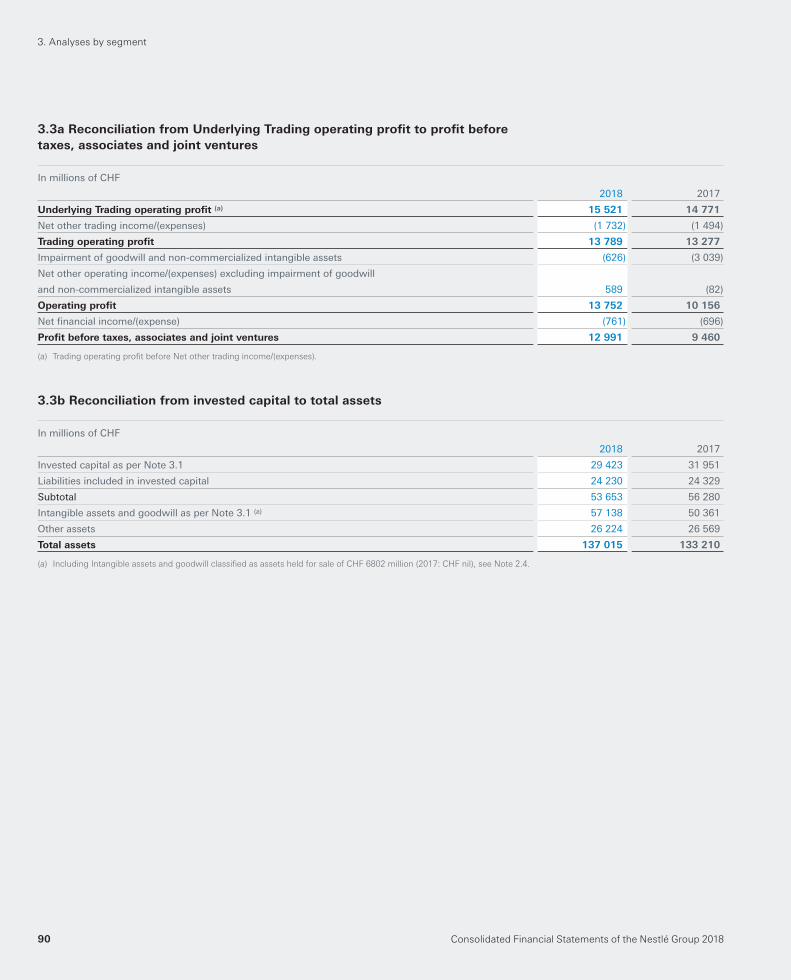
Consolidated Financial Statements of the Nestlé Group 201890
3.3a Reconciliation from Underlying Trading operating profi t to profi t before
taxes, associates and joint ventures
In millions of CHF
2018 2017
Underlying Trading operating profi t (a) 15 521 14 771
Net other trading income/(expenses) (1 732) (1 494)
Trading operating profi t 13 789 13 277
Impairment of goodwill and non-commercialized intangible assets (626) (3 039)
Net other operating income/(expenses) excluding impairment of goodwill
and non-commercialized intangible assets 589 (82)
Operating profi t 13 752 10 156
Net fi nancial income/(expense) (761) (696)
Profi t before taxes, associates and joint ventures 12 991 9 460
(a) Trading operating profi t before Net other trading income/(expenses).
3.3b Reconciliation from invested capital to total assets
In millions of CHF
2018 2017
Invested capital as per Note 3.1 29 423 31 951
Liabilities included in invested capital 24 230 24 329
Subtotal 53 653 56 280
Intangible assets and goodwill as per Note 3.1 (a) 57 138 50 361
Other assets 26 224 26 569
Total assets 137 015 133 210
(a) Including Intangible assets and goodwill classifi ed as assets held for sale of CHF 6802 million (2017: CHF nil), see Note 2.4.
3. Analyses by segment
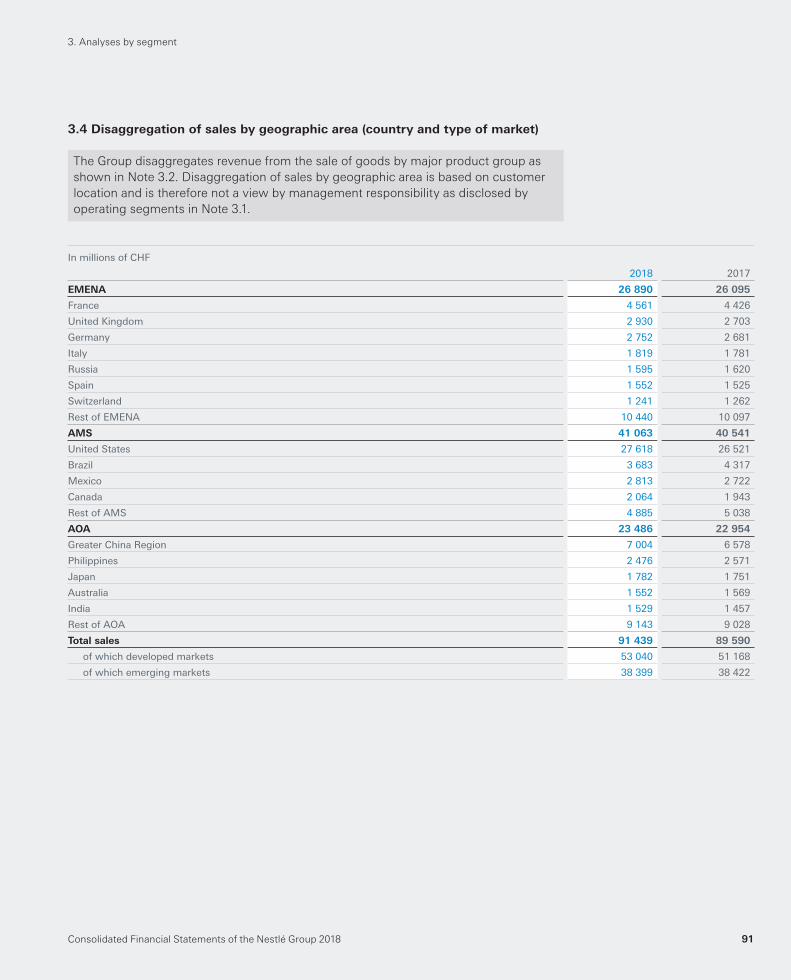
Consolidated Financial Statements of the Nestlé Group 2018 91
3.4 Disaggregation of sales by geographic area (country and type of market)
The Group disaggregates revenue from the sale of goods by major product group as
shown in Note 3.2. Disaggregation of sales by geographic area is based on customer
location and is therefore not a view by management responsibility as disclosed by
operating segments in Note 3.1.
In millions of CHF
2018 2017
EMENA 26 890 26 095
France 4 561 4 426
United Kingdom 2 930 2 703
Germany 2 752 2 681
Italy 1 819 1 781
Russia 1 595 1 620
Spain 1 552 1 525
Switzerland 1 241 1 262
Rest of EMENA 10 440 10 097
AMS 41 063 40 541
United States 27 618 26 521
Brazil 3 683 4 317
Mexico 2 813 2 722
Canada 2 064 1 943
Rest of AMS 4 885 5 038
AOA 23 486 22 954
Greater China Region 7 004 6 578
Philippines 2 476 2 571
Japan 1 782 1 751
Australia 1 552 1 569
India 1 529 1 457
Rest of AOA 9 143 9 028
Total sales 91 439 89 590
of which developed markets 53 040 51 168
of which emerging markets 38 399 38 422
3. Analyses by segment
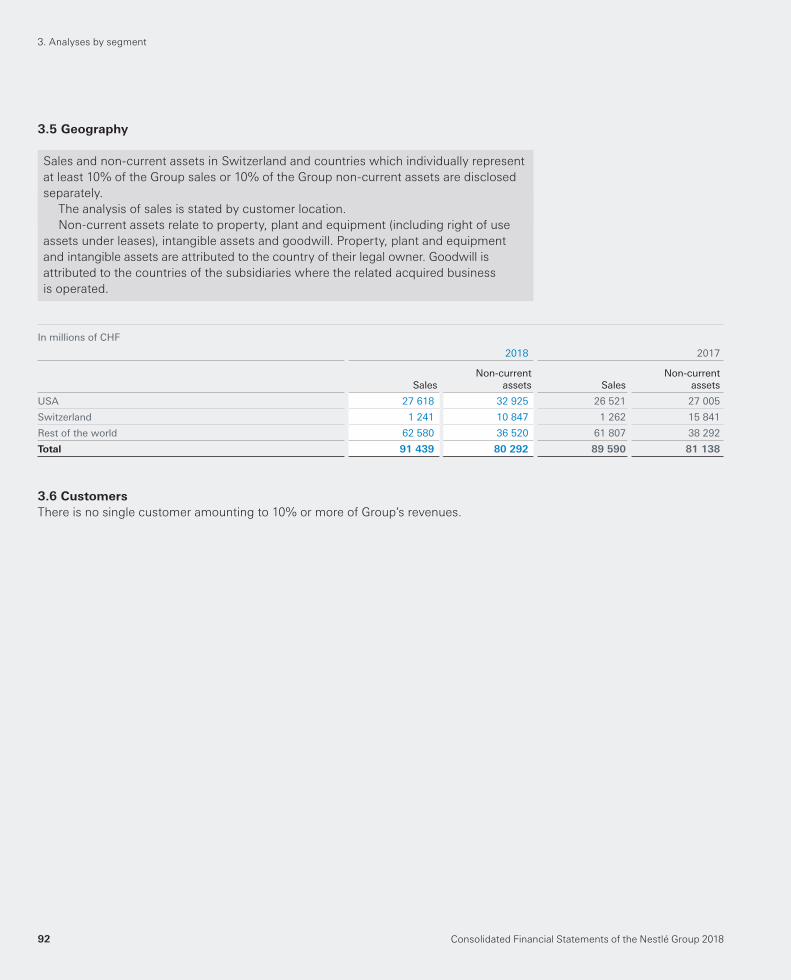
Consolidated Financial Statements of the Nestlé Group 201892
3.5 Geography
Sales and non-current assets in Switzerland and countries which individually represent
at least 10% of the Group sales or 10% of the Group non-current assets are disclosed
separately.
The analysis of sales is stated by customer location.
Non-current assets relate to property, plant and equipment (including right of use
assets under leases), intangible assets and goodwill. Property, plant and equipment
and intangible assets are attributed to the country of their legal owner. Goodwill is
attributed to the countries of the subsidiaries where the related acquired business
is operated.
In millions of CHF
2018 2017
SalesNon-current
assets SalesNon-current
assets
USA 27 618 32 925 26 521 27 005
Switzerland 1 241 10 847 1 262 15 841
Rest of the world 62 580 36 520 61 807 38 292
Total 91 439 80 292 89 590 81 138
3.6 Customers
There is no single customer amounting to 10% or more of Group’s revenues.
3. Analyses by segment
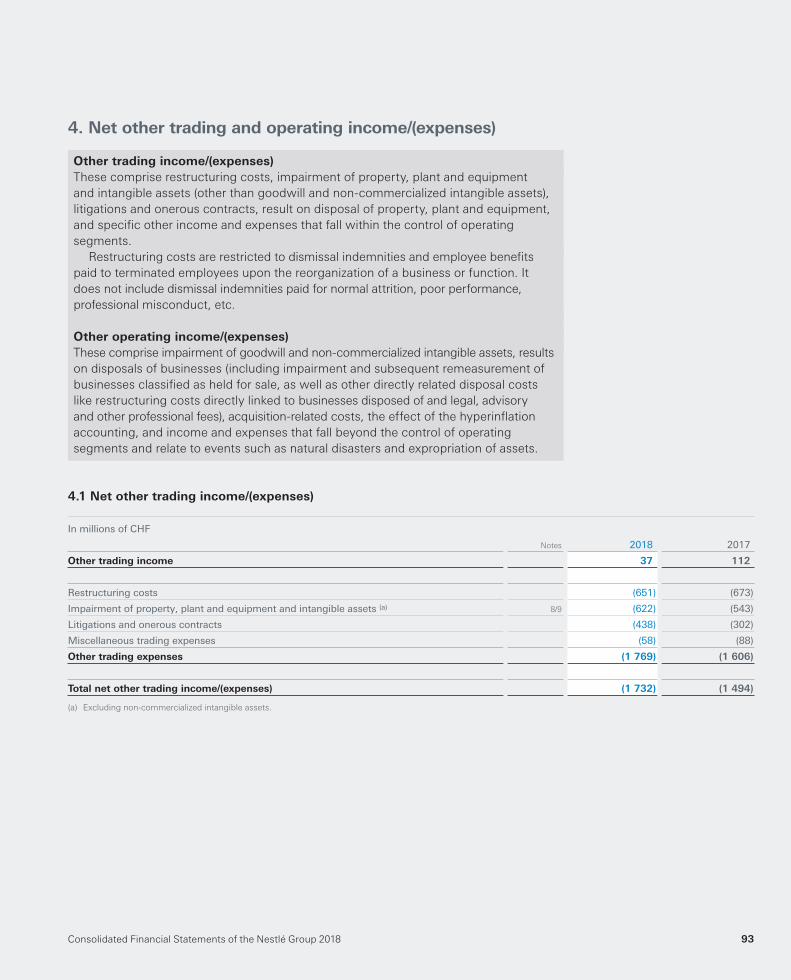
Consolidated Financial Statements of the Nestlé Group 2018 93
4. Net other trading and operating income/(expenses)
Other trading income/(expenses)
These comprise restructuring costs, impairment of property, plant and equipment
and intangible assets (other than goodwill and non-commercialized intangible assets),
litigations and onerous contracts, result on disposal of property, plant and equipment,
and specifi c other income and expenses that fall within the control of operating
segments.
Restructuring costs are restricted to dismissal indemnities and employee benefi ts
paid to terminated employees upon the reorganization of a business or function. It
does not include dismissal indemnities paid for normal attrition, poor performance,
professional misconduct, etc.
Other operating income/(expenses)
These comprise impairment of goodwill and non-commercialized intangible assets, results
on disposals of businesses (including impairment and subsequent remeasurement of
businesses classifi ed as held for sale, as well as other directly related disposal costs
like restructuring costs directly linked to businesses disposed of and legal, advisory
and other professional fees), acquisition-related costs, the effect of the hyperinfl ation
accounting, and income and expenses that fall beyond the control of operating
segments and relate to events such as natural disasters and expropriation of assets.
4.1 Net other trading income/(expenses)
In millions of CHF
Notes 2018 2017
Other trading income 37 112
Restructuring costs (651) (673)
Impairment of property, plant and equipment and intangible assets (a) 8/9 (622) (543)
Litigations and onerous contracts (438) (302)
Miscellaneous trading expenses (58) (88)
Other trading expenses (1 769) (1 606)
Total net other trading income/(expenses) (1 732) (1 494)
(a) Excluding non-commercialized intangible assets.
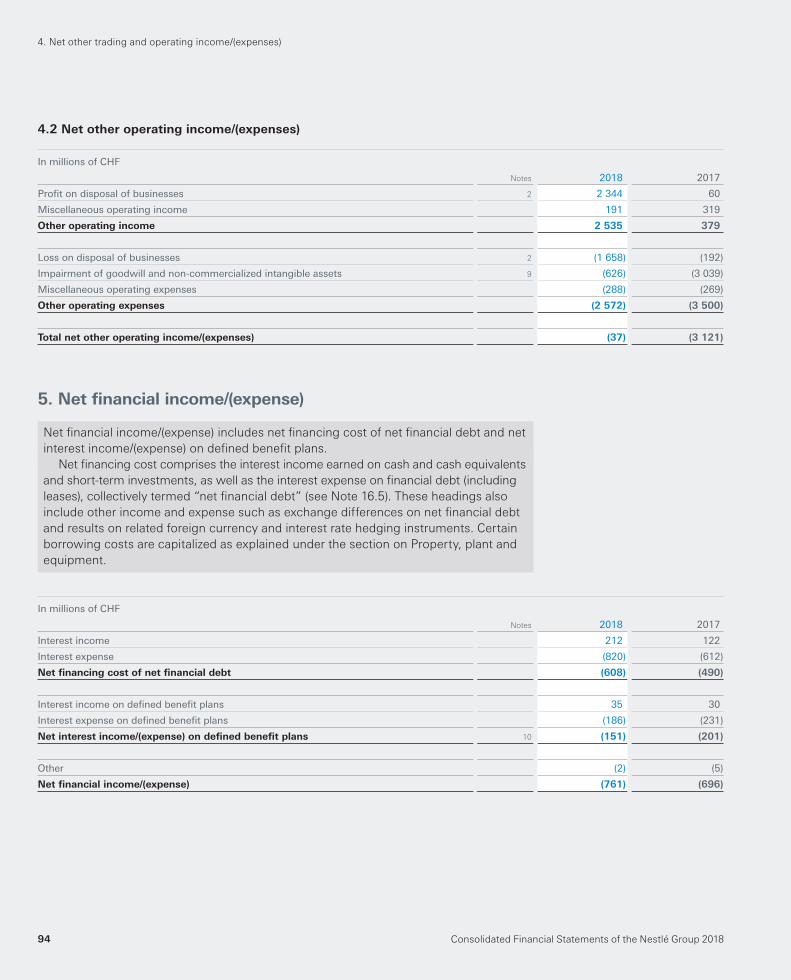
Consolidated Financial Statements of the Nestlé Group 201894
4.2 Net other operating income/(expenses)
In millions of CHF
Notes 2018 2017
Profi t on disposal of businesses 2 2 344 60
Miscellaneous operating income 191 319
Other operating income 2 535 379
Loss on disposal of businesses 2 (1 658) (192)
Impairment of goodwill and non-commercialized intangible assets 9 (626) (3 039)
Miscellaneous operating expenses (288) (269)
Other operating expenses (2 572) (3 500)
Total net other operating income/(expenses) (37) (3 121)
5. Net fi nancial income/(expense)
Net fi nancial income/(expense) includes net fi nancing cost of net fi nancial debt and net
interest income/(expense) on defi ned benefi t plans.
Net fi nancing cost comprises the interest income earned on cash and cash equivalents
and short-term investments, as well as the interest expense on fi nancial debt (including
leases), collectively termed “net fi nancial debt” (see Note 16.5). These headings also
include other income and expense such as exchange differences on net fi nancial debt
and results on related foreign currency and interest rate hedging instruments. Certain
borrowing costs are capitalized as explained under the section on Property, plant and
equipment.
In millions of CHF
Notes 2018 2017
Interest income 212 122
Interest expense (820) (612)
Net fi nancing cost of net fi nancial debt (608) (490)
Interest income on defi ned benefi t plans 35 30
Interest expense on defi ned benefi t plans (186) (231)
Net interest income/(expense) on defi ned benefi t plans 10 (151) (201)
Other (2) (5)
Net fi nancial income/(expense) (761) (696)
4. Net other trading and operating income/(expenses)
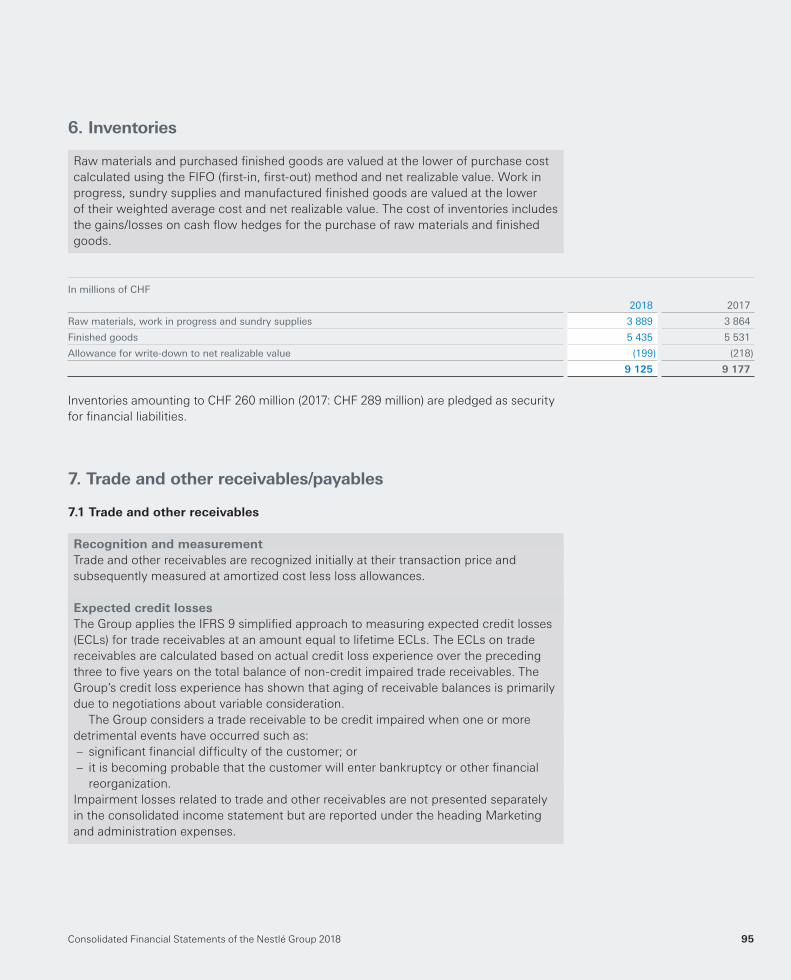
Consolidated Financial Statements of the Nestlé Group 2018 95
6. Inventories
Raw materials and purchased fi nished goods are valued at the lower of purchase cost
calculated using the FIFO (fi rst-in, fi rst-out) method and net realizable value. Work in
progress, sundry supplies and manufactured fi nished goods are valued at the lower
of their weighted average cost and net realizable value. The cost of inventories includes
the gains/losses on cash fl ow hedges for the purchase of raw materials and fi nished
goods.
In millions of CHF
2018 2017
Raw materials, work in progress and sundry supplies 3 889 3 864
Finished goods 5 435 5 531
Allowance for write-down to net realizable value (199) (218)
9 125 9 177
Inventories amounting to CHF 260 million ( 2017 : CHF 289 million ) are pledged as security
for fi nancial liabilities.
7. Trade and other receivables/payables
7.1 Trade and other receivables
Recognition and measurement
Trade and other receivables are recognized initially at their transaction price and
subsequently measured at amortized cost less loss allowances.
Expected credit losses
The Group applies the IFRS 9 simplifi ed approach to measuring expected credit losses
(ECLs) for trade receivables at an amount equal to lifetime ECLs. The ECLs on trade
receivables are calculated based on actual credit loss experience over the preceding
three to fi ve years on the total balance of non-credit impaired trade receivables. The
Group’s credit loss experience has shown that aging of receivable balances is primarily
due to negotiations about variable consideration.
The Group considers a trade receivable to be credit impaired when one or more
detrimental events have occurred such as:
– signifi cant fi nancial diffi culty of the customer; or
– it is becoming probable that the customer will enter bankruptcy or other fi nancial
reorganization.
Impairment losses related to trade and other receivables are not presented separately
in the consolidated income statement but are reported under the heading Marketing
and administration expenses.
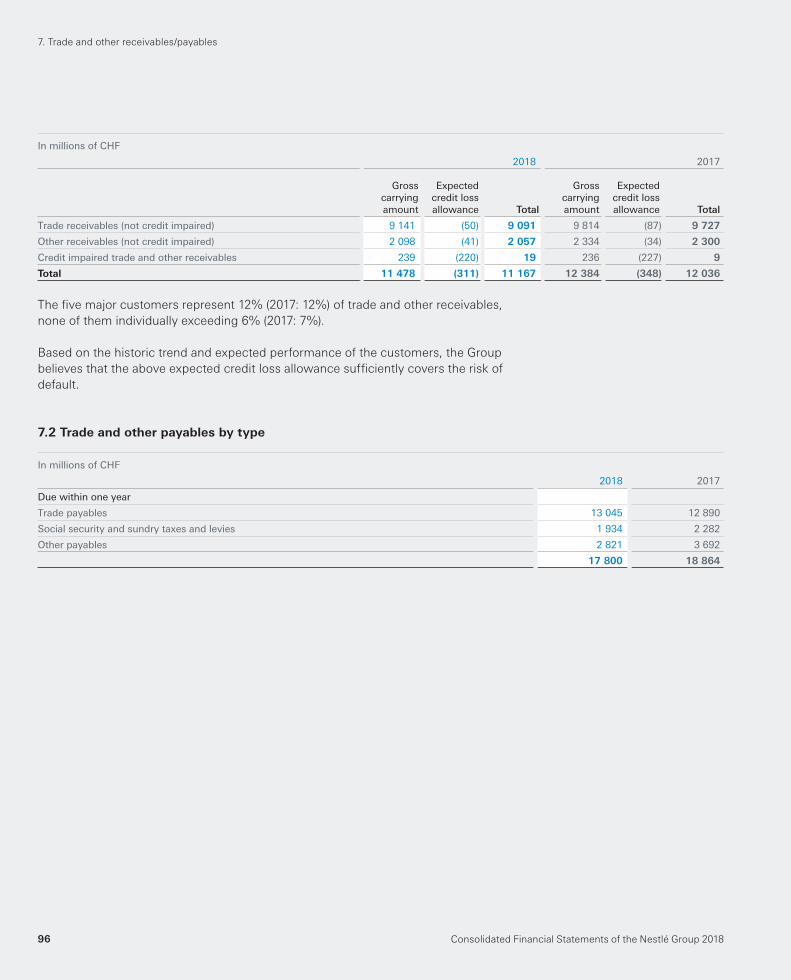
Consolidated Financial Statements of the Nestlé Group 201896
In millions of CHF
2018 2017
Grosscarryingamount
Expectedcredit lossallowance Total
Grosscarryingamount
Expectedcredit lossallowance Total
Trade receivables (not credit impaired) 9 141 (50) 9 091 9 814 (87) 9 727
Other receivables (not credit impaired) 2 098 (41) 2 057 2 334 (34) 2 300
Credit impaired trade and other receivables 239 (220) 19 236 (227) 9
Total 11 478 (311) 11 167 12 384 (348) 12 036
The fi ve major customers represent 12% ( 2017 : 12% ) of trade and other receivables,
none of them individually exceeding 6% ( 2017 : 7% ).
Based on the historic trend and expected performance of the customers, the Group
believes that the above expected credit loss allowance suffi ciently covers the risk of
default.
7.2 Trade and other payables by type
In millions of CHF
2018 2017
Due within one year
Trade payables 13 045 12 890
Social security and sundry taxes and levies 1 934 2 282
Other payables 2 821 3 692
17 800 18 864
7. Trade and other receivables/payables
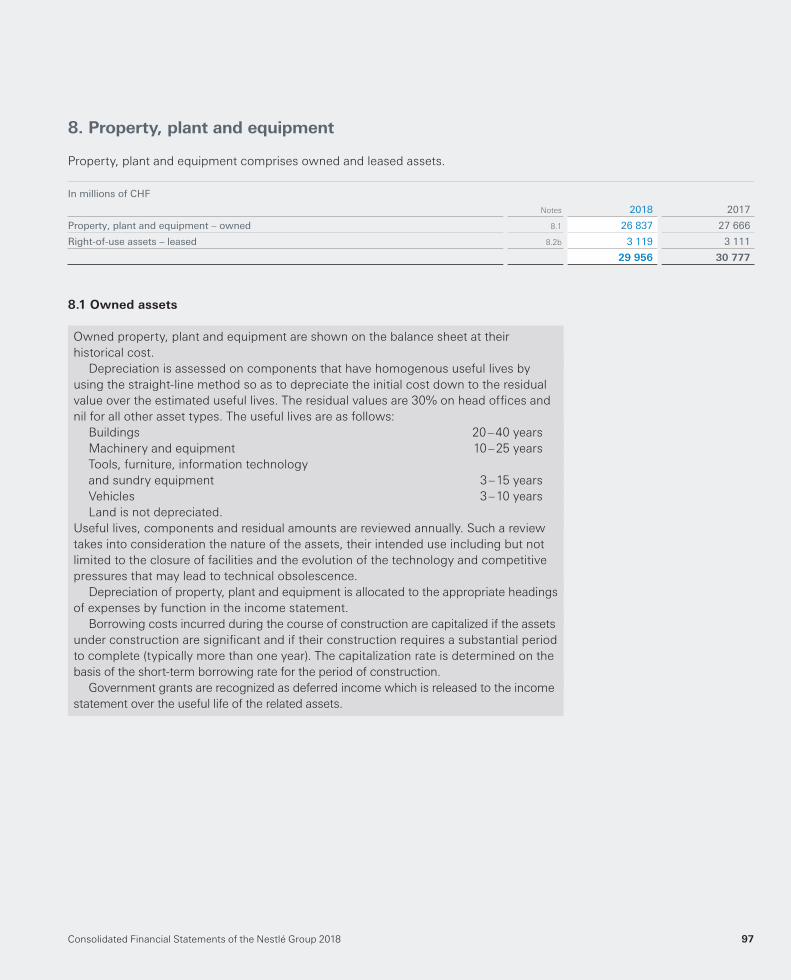
Consolidated Financial Statements of the Nestlé Group 2018 97
8. Property, plant and equipment
Property, plant and equipment comprises owned and leased assets.
In millions of CHF
Notes 2018 2017
Property, plant and equipment – owned 8.1 26 837 27 666
Right-of-use assets – leased 8.2b 3 119 3 111
29 956 30 777
8.1 Owned assets
Owned property, plant and equipment are shown on the balance sheet at their
historical cost.
Depreciation is assessed on components that have homogenous useful lives by
using the straight-line method so as to depreciate the initial cost down to the residual
value over the estimated useful lives. The residual values are 30% on head offi ces and
nil for all other asset types. The useful lives are as follows:
Buildings 20 – 40 years
Machinery and equipment 10 – 25 years
Tools, furniture, information technology
and sundry equipment 3 – 15 years
Vehicles 3 – 10 years
Land is not depreciated.
Useful lives, components and residual amounts are reviewed annually. Such a review
takes into consideration the nature of the assets, their intended use including but not
limited to the closure of facilities and the evolution of the technology and competitive
pressures that may lead to technical obsolescence.
Depreciation of property, plant and equipment is allocated to the appropriate headings
of expenses by function in the income statement.
Borrowing costs incurred during the course of construction are capitalized if the assets
under construction are signifi cant and if their construction requires a substantial period
to complete (typically more than one year). The capitalization rate is determined on the
basis of the short-term borrowing rate for the period of construction.
Government grants are recognized as deferred income which is released to the income
statement over the useful life of the related assets.
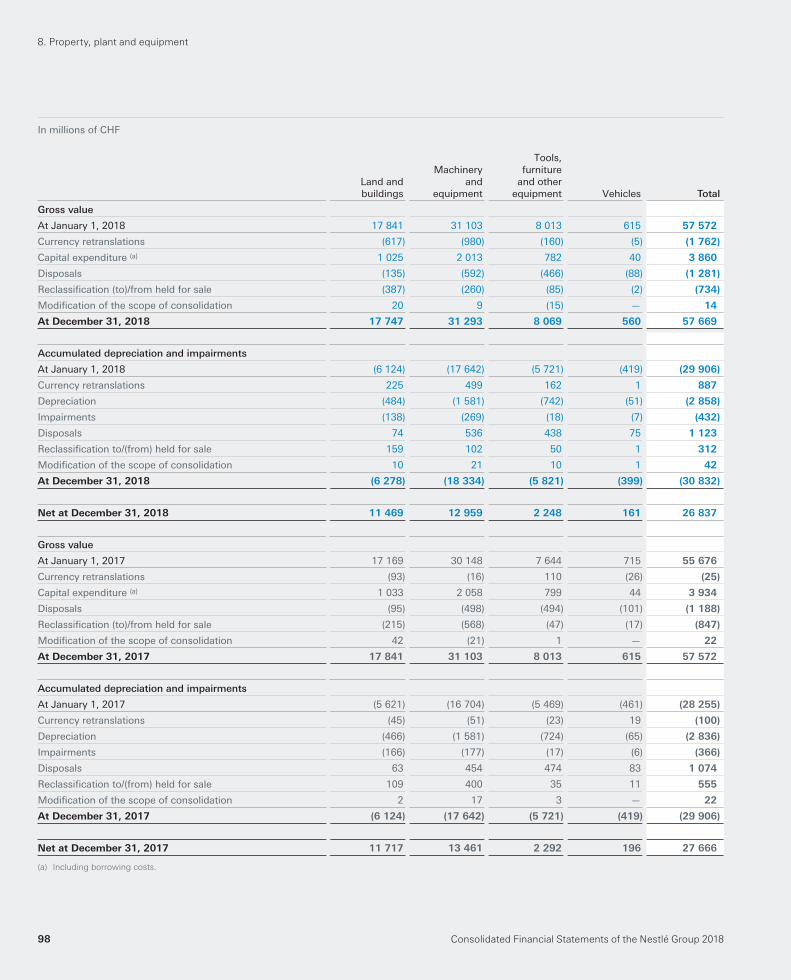
Consolidated Financial Statements of the Nestlé Group 201898
In millions of CHF
Land andbuildings
Machineryand
equipment
Tools,furniture
and otherequipment Vehicles Total
Gross value
At January 1, 2018 17 841 31 103 8 013 615 57 572
Currency retranslations (617) (980) (160) (5) (1 762)
Capital expenditure (a) 1 025 2 013 782 40 3 860
Disposals (135) (592) (466) (88) (1 281)
Reclassifi cation (to)/from held for sale (387) (260) (85) (2) (734)
Modifi cation of the scope of consolidation 20 9 (15) — 14
At December 31, 2018 17 747 31 293 8 069 560 57 669
Accumulated depreciation and impairments
At January 1, 2018 (6 124) (17 642) (5 721) (419) (29 906)
Currency retranslations 225 499 162 1 887
Depreciation (484) (1 581) (742) (51) (2 858)
Impairments (138) (269) (18) (7) (432)
Disposals 74 536 438 75 1 123
Reclassifi cation to/(from) held for sale 159 102 50 1 312
Modifi cation of the scope of consolidation 10 21 10 1 42
At December 31, 2018 (6 278) (18 334) (5 821) (399) (30 832)
Net at December 31, 2018 11 469 12 959 2 248 161 26 837
Gross value
At January 1, 2017 17 169 30 148 7 644 715 55 676
Currency retranslations (93) (16) 110 (26) (25)
Capital expenditure (a) 1 033 2 058 799 44 3 934
Disposals (95) (498) (494) (101) (1 188)
Reclassifi cation (to)/from held for sale (215) (568) (47) (17) (847)
Modifi cation of the scope of consolidation 42 (21) 1 — 22
At December 31, 2017 17 841 31 103 8 013 615 57 572
Accumulated depreciation and impairments
At January 1, 2017 (5 621) (16 704) (5 469) (461) (28 255)
Currency retranslations (45) (51) (23) 19 (100)
Depreciation (466) (1 581) (724) (65) (2 836)
Impairments (166) (177) (17) (6) (366)
Disposals 63 454 474 83 1 074
Reclassifi cation to/(from) held for sale 109 400 35 11 555
Modifi cation of the scope of consolidation 2 17 3 — 22
At December 31, 2017 (6 124) (17 642) (5 721) (419) (29 906)
Net at December 31, 2017 11 717 13 461 2 292 196 27 666
(a) Including borrowing costs.
8. Property, plant and equipment
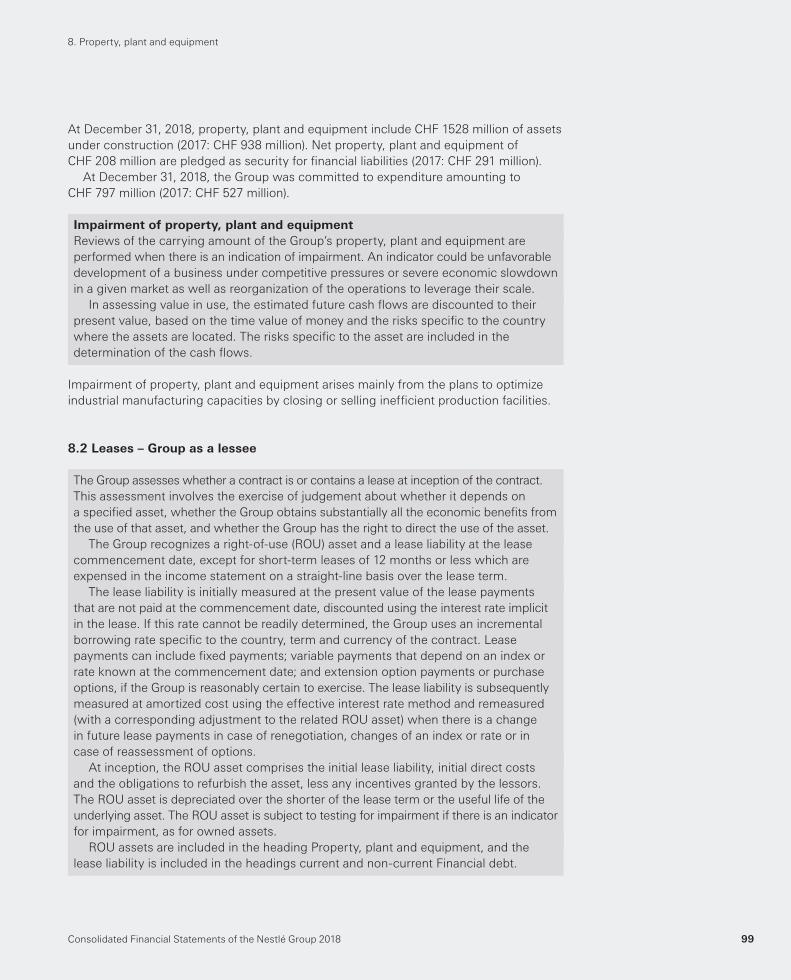
Consolidated Financial Statements of the Nestlé Group 2018 99
At December 31, 2018 , property, plant and equipment include CHF 1528 million of assets
under construction ( 2017 : CHF 938 million ). Net property, plant and equipment of
CHF 208 million are pledged as security for fi nancial liabilities ( 2017 : CHF 291 million ).
At December 31, 2018 , the Group was committed to expenditure amounting to
CHF 797 million ( 2017 : CHF 527 million ).
Impairment of property, plant and equipment
Reviews of the carrying amount of the Group’s property, plant and equipment are
performed when there is an indication of impairment. An indicator could be unfavorable
development of a business under competitive pressures or severe economic slowdown
in a given market as well as reorganization of the operations to leverage their scale.
In assessing value in use, the estimated future cash fl ows are discounted to their
present value, based on the time value of money and the risks specifi c to the country
where the assets are located. The risks specifi c to the asset are included in the
determination of the cash fl ows.
Impairment of property, plant and equipment arises mainly from the plans to optimize
industrial manufacturing capacities by closing or selling ineffi cient production facilities.
8.2 Leases – Group as a lessee
The Group assesses whether a contract is or contains a lease at inception of the contract.
This assessment involves the exercise of judgement about whether it depends on
a specifi ed asset, whether the Group obtains substantially all the economic benefi ts from
the use of that asset, and whether the Group has the right to direct the use of the asset.
The Group recognizes a right-of-use (ROU) asset and a lease liability at the lease
commencement date, except for short-term leases of 12 months or less which are
expensed in the income statement on a straight-line basis over the lease term.
The lease liability is initially measured at the present value of the lease payments
that are not paid at the commencement date, discounted using the interest rate implicit
in the lease. If this rate cannot be readily determined, the Group uses an incremental
borrowing rate specifi c to the country, term and currency of the contract. Lease
payments can include fi xed payments; variable payments that depend on an index or
rate known at the commencement date; and extension option payments or purchase
options, if the Group is reasonably certain to exercise. The lease liability is subsequently
measured at amortized cost using the effective interest rate method and remeasured
(with a corresponding adjustment to the related ROU asset) when there is a change
in future lease payments in case of renegotiation, changes of an index or rate or in
case of reassessment of options.
At inception, the ROU asset comprises the initial lease liability, initial direct costs
and the obligations to refurbish the asset, less any incentives granted by the lessors.
The ROU asset is depreciated over the shorter of the lease term or the useful life of the
underlying asset. The ROU asset is subject to testing for impairment if there is an indicator
for impairment, as for owned assets.
ROU assets are included in the heading Property, plant and equipment, and the
lease liability is included in the headings current and non-current Financial debt.
8. Property, plant and equipment
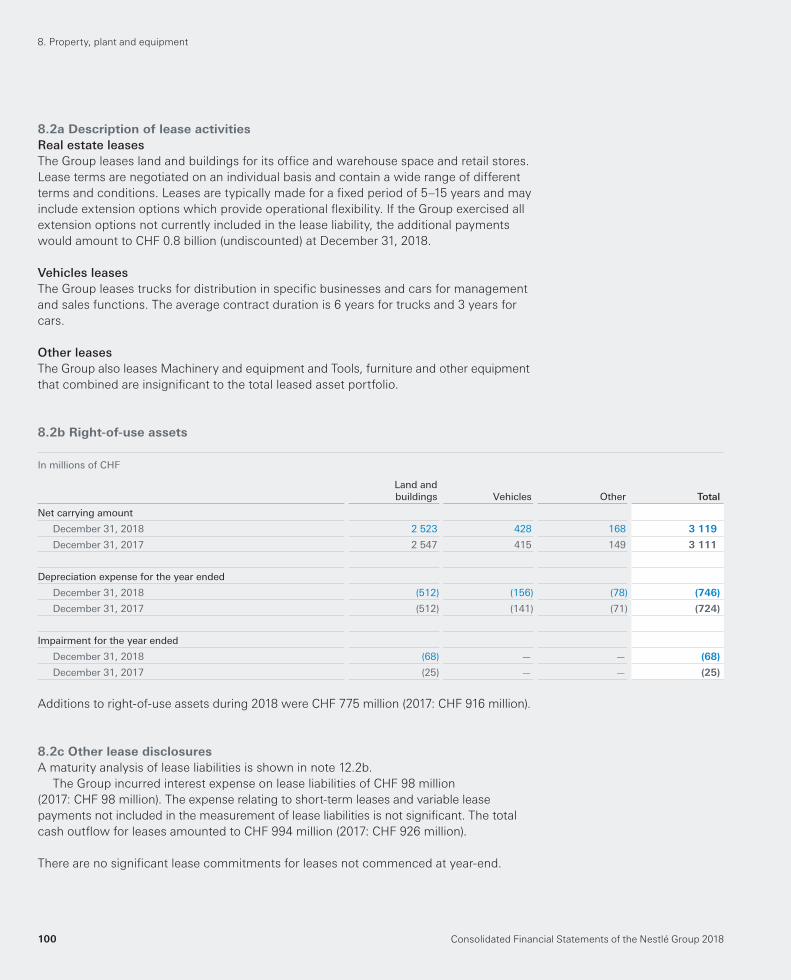
Consolidated Financial Statements of the Nestlé Group 2018100
8.2a Description of lease activities
Real estate leasesThe Group leases land and buildings for its offi ce and warehouse space and retail stores.
Lease terms are negotiated on an individual basis and contain a wide range of different
terms and conditions. Leases are typically made for a fi xed period of 5–15 years and may
include extension options which provide operational fl exibility. If the Group exercised all
extension options not currently included in the lease liability, the additional payments
would amount to CHF 0.8 billion (undiscounted) at December 31, 2018.
Vehicles leasesThe Group leases trucks for distribution in specifi c businesses and cars for management
and sales functions. The average contract duration is 6 years for trucks and 3 years for
cars.
Other leasesThe Group also leases Machinery and equipment and Tools, furniture and other equipment
that combined are insignifi cant to the total leased asset portfolio.
8.2b Right-of-use assets
In millions of CHF
Land and buildings Vehicles Other Total
Net carrying amount
December 31, 2018 2 523 428 168 3 119
December 31, 2017 2 547 415 149 3 111
Depreciation expense for the year ended
December 31, 2018 (512) (156) (78) (746)
December 31, 2017 (512) (141) (71) (724)
Impairment for the year ended
December 31, 2018 (68) — — (68)
December 31, 2017 (25) — — (25)
Additions to right-of-use assets during 2018 were CHF 775 million (2017: CHF 916 million ).
8.2c Other lease disclosures
A maturity analysis of lease liabilities is shown in note 12.2b.
The Group incurred interest expense on lease liabilities of CHF 98 million
(2017: CHF 98 million ). The expense relating to short-term leases and variable lease
payments not included in the measurement of lease liabilities is not signifi cant. The total
cash outfl ow for leases amounted to CHF 994 million (2017: CHF 926 million ).
There are no signifi cant lease commitments for leases not commenced at year-end.
8. Property, plant and equipment
Consolidated Financial Statements of the Nestlé Group 2018 101
9. Goodwill and intangible assets
Goodwill
Goodwill is initially recognized during a business combination (see Note 2). Subsequently
it is measured at cost less impairment.
Intangible assets
This heading includes intangible assets that are internally generated or acquired, either
separately or in a business combination, when they are identifi able and can be reliably
measured. Internally generated intangible assets (essentially management information
system software) are capitalized provided that there is an identifi able asset that will
be useful in generating future benefi ts in terms of savings, economies of scale, etc.
Payments made to third parties in order to in-license or acquire intellectual property
rights, compounds and products are capitalized as non-commercialized intangible
assets, as they are separately identifi able and are expected to generate future benefi ts.
Non-commercialized intangible assets are not amortized, but tested for impairment
(see Impairment of goodwill and intangible assets below). Any impairment charge is
recorded in the consolidated income statement under Other operating expenses. They
are reclassifi ed as commercialized intangible assets once development is complete,
usually when approval for sales has been granted by the relevant regulatory authority.
Indefi nite life intangible assets mainly comprise certain brands, trade marks,
operating rights and intellectual property rights which can be renewed without
signifi cant cost and are supported by ongoing marketing activities. They are not
amortized but tested for impairment annually or more frequently if an impairment
indicator is triggered. The assessment of the classifi cation of intangible assets as
indefi nite is reviewed annually.
Finite life intangible assets are amortized over the shorter of their contractual or useful
economic lives. They comprise mainly management information systems, patents and
rights to carry on an activity (e.g. exclusive rights to sell products or to perform a supply
activity). Finite life intangible assets are amortized on a straight-line basis assuming
a zero residual value: management information systems over a period ranging from
3 to 8 years; other fi nite intangible assets over the estimated useful life or the related
contractual period, generally 5 to 20 years or longer, depending on specifi c circumstances.
Useful lives and residual values are reviewed annually. Amortization of fi nite life intangible
assets starts when they are available for use and is allocated to the appropriate headings
of expenses by function in the income statement.
Research and development
Internal research costs are charged to the income statement in the year in which they
are incurred. Development costs are only recognized as assets on the balance sheet if
all the recognition criteria set by IAS 38 – Intangible Assets are met before the products
are launched on the market. Development costs are generally charged to the income
statement in the year in which they are incurred due to uncertainties inherent in the
development of new products because the expected future economic benefi ts cannot
be reliably determined. As long as the products have not reached the market place,
there is no reliable evidence that positive future cash fl ows would be obtained.
Capitalized development costs are subsequently accounted for as described in the
section Intangible assets above.
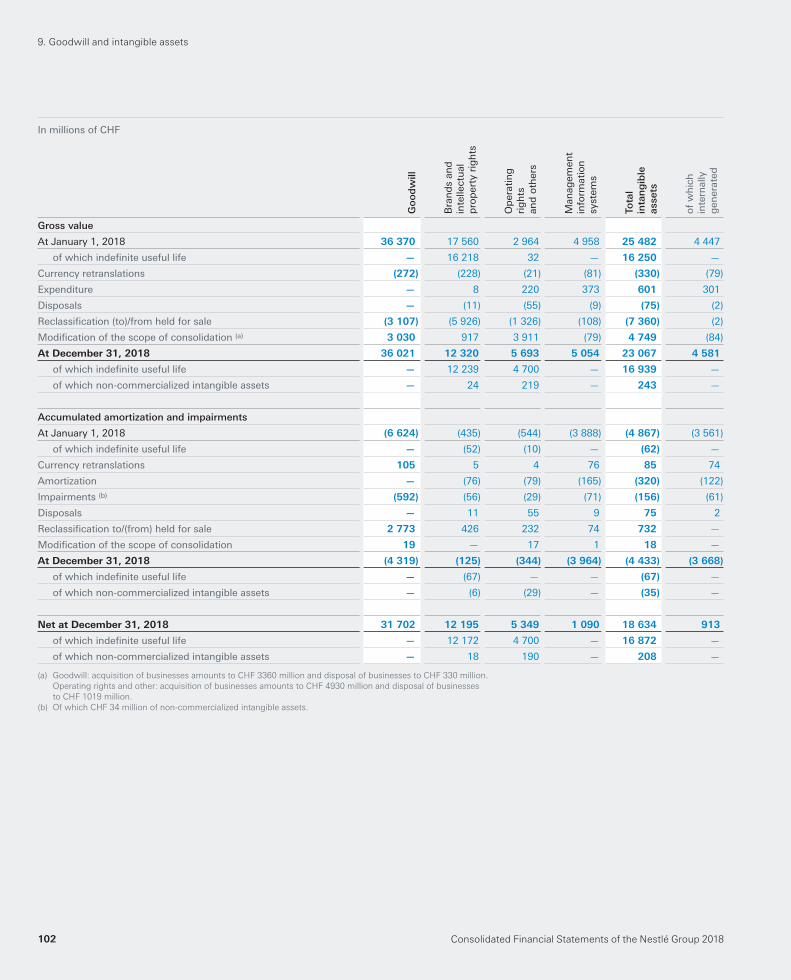
Consolidated Financial Statements of the Nestlé Group 2018102
In millions of CHF
Go
od
will
Bra
nd
s an
din
telle
ctu
alp
rop
erty
rig
hts
Op
erat
ing
rig
hts
and
oth
ers
Man
agem
ent
info
rmat
ion
syst
ems
Tota
lin
tan
gib
leas
sets
of
wh
ich
inte
rnal
lyg
ener
ated
Gross value
At January 1, 2018 36 370 17 560 2 964 4 958 25 482 4 447
of which indefi nite useful life — 16 218 32 — 16 250 —
Currency retranslations (272) (228) (21) (81) (330) (79)
Expenditure — 8 220 373 601 301
Disposals — (11) (55) (9) (75) (2)
Reclassifi cation (to)/from held for sale (3 107) (5 926) (1 326) (108) (7 360) (2)
Modifi cation of the scope of consolidation (a) 3 030 917 3 911 (79) 4 749 (84)
At December 31, 2018 36 021 12 320 5 693 5 054 23 067 4 581
of which indefi nite useful life — 12 239 4 700 — 16 939 —
of which non-commercialized intangible assets — 24 219 — 243 —
Accumulated amortization and impairments
At January 1, 2018 (6 624) (435) (544) (3 888) (4 867) (3 561)
of which indefi nite useful life — (52) (10) — (62) —
Currency retranslations 105 5 4 76 85 74
Amortization — (76) (79) (165) (320) (122)
Impairments (b) (592) (56) (29) (71) (156) (61)
Disposals — 11 55 9 75 2
Reclassifi cation to/(from) held for sale 2 773 426 232 74 732 —
Modifi cation of the scope of consolidation 19 — 17 1 18 —
At December 31, 2018 (4 319) (125) (344) (3 964) (4 433) (3 668)
of which indefi nite useful life — (67) — — (67) —
of which non-commercialized intangible assets — (6) (29) — (35) —
Net at December 31, 2018 31 702 12 195 5 349 1 090 18 634 913
of which indefi nite useful life — 12 172 4 700 — 16 872 —
of which non-commercialized intangible assets — 18 190 — 208 —
(a) Goodwill: acquisition of businesses amounts to CHF 3360 million and disposal of businesses to CHF 330 million.
Operating rights and other: acquisition of businesses amounts to CHF 4930 million and disposal of businesses
to CHF 1019 million.
(b) Of which CHF 34 million of non-commercialized intangible assets.
9. Goodwill and intangible assets
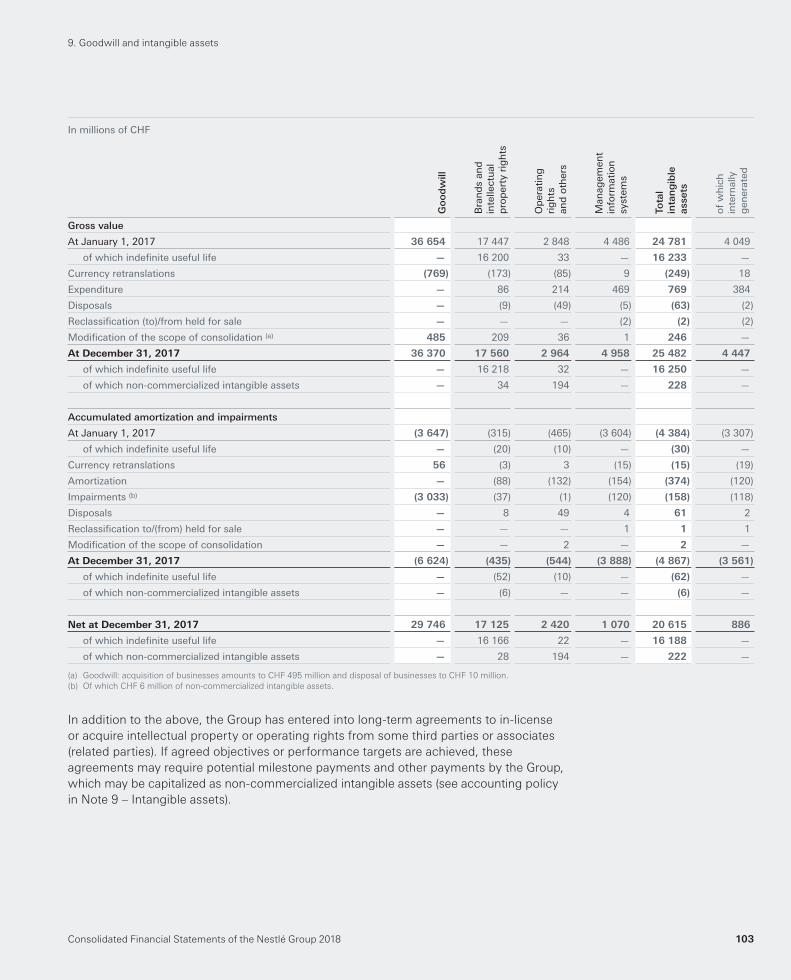
Consolidated Financial Statements of the Nestlé Group 2018 103
In millions of CHF
Go
od
will
Bra
nd
s an
din
telle
ctu
alp
rop
erty
rig
hts
Op
erat
ing
rig
hts
and
oth
ers
Man
agem
ent
info
rmat
ion
syst
ems
Tota
lin
tan
gib
leas
sets
of
wh
ich
inte
rnal
lyg
ener
ated
Gross value
At January 1, 2017 36 654 17 447 2 848 4 486 24 781 4 049
of which indefi nite useful life — 16 200 33 — 16 233 —
Currency retranslations (769) (173) (85) 9 (249) 18
Expenditure — 86 214 469 769 384
Disposals — (9) (49) (5) (63) (2)
Reclassifi cation (to)/from held for sale — — — (2) (2) (2)
Modifi cation of the scope of consolidation (a) 485 209 36 1 246 —
At December 31, 2017 36 370 17 560 2 964 4 958 25 482 4 447
of which indefi nite useful life — 16 218 32 — 16 250 —
of which non-commercialized intangible assets — 34 194 — 228 —
Accumulated amortization and impairments
At January 1, 2017 (3 647) (315) (465) (3 604) (4 384) (3 307)
of which indefi nite useful life — (20) (10) — (30) —
Currency retranslations 56 (3) 3 (15) (15) (19)
Amortization — (88) (132) (154) (374) (120)
Impairments (b) (3 033) (37) (1) (120) (158) (118)
Disposals — 8 49 4 61 2
Reclassifi cation to/(from) held for sale — — — 1 1 1
Modifi cation of the scope of consolidation — — 2 — 2 —
At December 31, 2017 (6 624) (435) (544) (3 888) (4 867) (3 561)
of which indefi nite useful life — (52) (10) — (62) —
of which non-commercialized intangible assets — (6) — — (6) —
Net at December 31, 2017 29 746 17 125 2 420 1 070 20 615 886
of which indefi nite useful life — 16 166 22 — 16 188 —
of which non-commercialized intangible assets — 28 194 — 222 —
(a) Goodwill: acquisition of businesses amounts to CHF 495 million and disposal of businesses to CHF 10 million.
(b) Of which CHF 6 million of non-commercialized intangible assets.
In addition to the above, the Group has entered into long-term agreements to in-license
or acquire intellectual property or operating rights from some third parties or associates
(related parties). If agreed objectives or performance targets are achieved, these
agreements may require potential milestone payments and other payments by the Group,
which may be capitalized as non-commercialized intangible assets (see accounting policy
in Note 9 – Intangible assets).
9. Goodwill and intangible assets
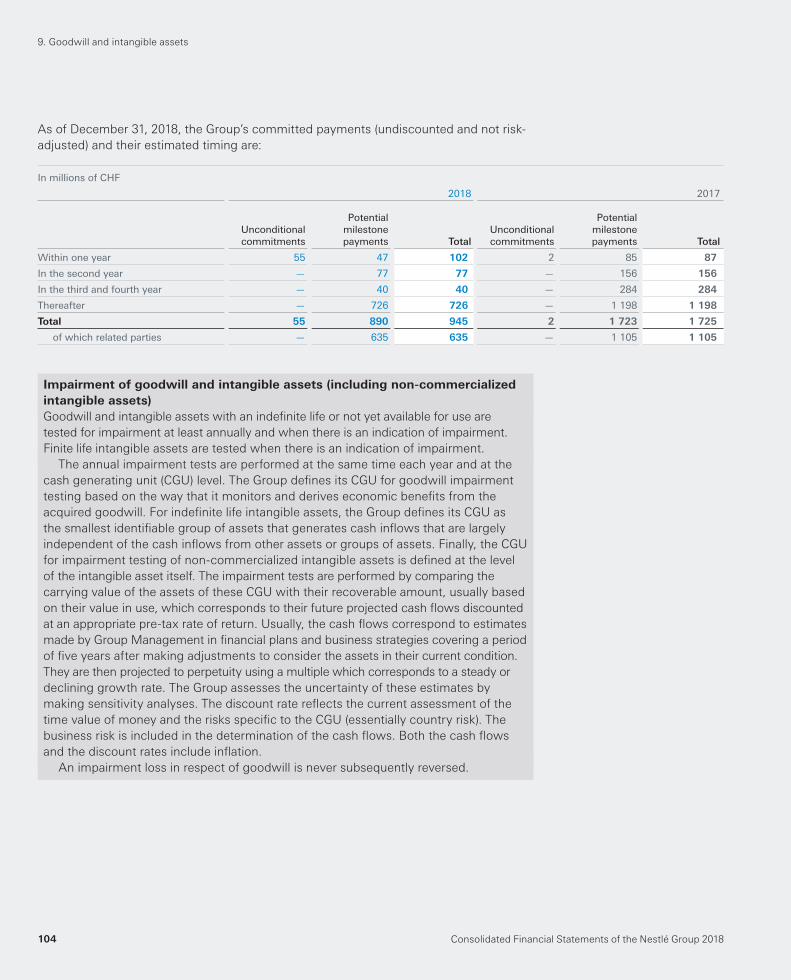
Consolidated Financial Statements of the Nestlé Group 2018104
As of December 31, 2018 , the Group’s committed payments (undiscounted and not risk-
adjusted) and their estimated timing are:
In millions of CHF
2018 2017
Unconditionalcommitments
Potentialmilestonepayments Total
Unconditionalcommitments
Potentialmilestonepayments Total
Within one year 55 47 102 2 85 87
In the second year — 77 77 — 156 156
In the third and fourth year — 40 40 — 284 284
Thereafter — 726 726 — 1 198 1 198
Total 55 890 945 2 1 723 1 725
of which related parties — 635 635 — 1 105 1 105
Impairment of goodwill and intangible assets (including non-commercialized
intangible assets)
Goodwill and intangible assets with an indefi nite life or not yet available for use are
tested for impairment at least annually and when there is an indication of impairment.
Finite life intangible assets are tested when there is an indication of impairment.
The annual impairment tests are performed at the same time each year and at the
cash generating unit (CGU) level. The Group defi nes its CGU for goodwill impairment
testing based on the way that it monitors and derives economic benefi ts from the
acquired goodwill. For indefi nite life intangible assets, the Group defi nes its CGU as
the smallest identifi able group of assets that generates cash infl ows that are largely
independent of the cash infl ows from other assets or groups of assets. Finally, the CGU
for impairment testing of non-commercialized intangible assets is defi ned at the level
of the intangible asset itself. The impairment tests are performed by comparing the
carrying value of the assets of these CGU with their recoverable amount, usually based
on their value in use, which corresponds to their future projected cash fl ows discounted
at an appropriate pre-tax rate of return. Usually, the cash fl ows correspond to estimates
made by Group Management in fi nancial plans and business strategies covering a period
of fi ve years after making adjustments to consider the assets in their current condition.
They are then projected to perpetuity using a multiple which corresponds to a steady or
declining growth rate. The Group assesses the uncertainty of these estimates by
making sensitivity analyses. The discount rate refl ects the current assessment of the
time value of money and the risks specifi c to the CGU (essentially country risk). The
business risk is included in the determination of the cash fl ows. Both the cash fl ows
and the discount rates include infl ation.
An impairment loss in respect of goodwill is never subsequently reversed.
9. Goodwill and intangible assets
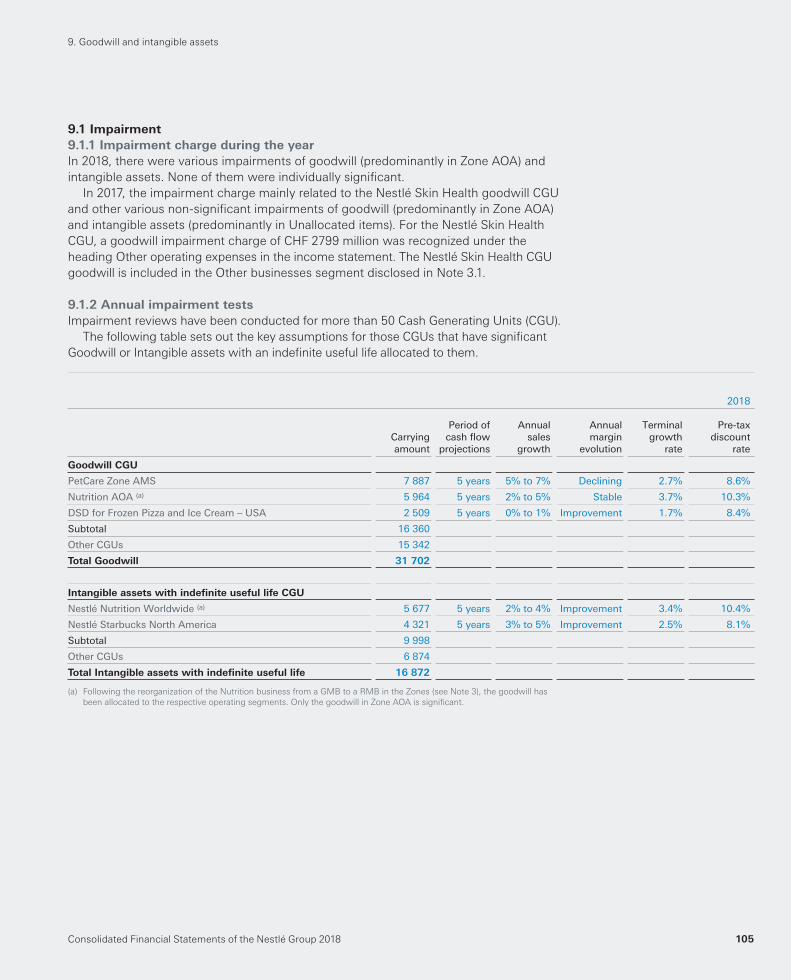
Consolidated Financial Statements of the Nestlé Group 2018 105
9.1 Impairment
9.1.1 Impairment charge during the year
In 2018, there were various impairments of goodwill (predominantly in Zone AOA) and
intangible assets. None of them were individually signifi cant.
In 2017, the impairment charge mainly related to the Nestlé Skin Health goodwill CGU
and other various non-signifi cant impairments of goodwill (predominantly in Zone AOA)
and intangible assets (predominantly in Unallocated items). For the Nestlé Skin Health
CGU, a goodwill impairment charge of CHF 2799 million was recognized under the
heading Other operating expenses in the income statement. The Nestlé Skin Health CGU
goodwill is included in the Other businesses segment disclosed in Note 3.1.
9.1.2 Annual impairment tests
Impairment reviews have been conducted for more than 50 Cash Generating Units (CGU).
The following table sets out the key assumptions for those CGUs that have signifi cant
Goodwill or Intangible assets with an indefi nite useful life allocated to them.
2018
Carryingamount
Period ofcash fl ow
projections
Annualsales
growth
Annualmargin
evolution
Terminalgrowth
rate
Pre-taxdiscount
rate
Goodwill CGU
PetCare Zone AMS 7 887 5 years 5% to 7% Declining 2.7% 8.6%
Nutrition AOA (a) 5 964 5 years 2% to 5% Stable 3.7% 10.3%
DSD for Frozen Pizza and Ice Cream – USA 2 509 5 years 0% to 1% Improvement 1.7% 8.4%
Subtotal 16 360
Other CGUs 15 342
Total Goodwill 31 702
Intangible assets with indefi nite useful life CGU
Nestlé Nutrition Worldwide (a) 5 677 5 years 2% to 4% Improvement 3.4% 10.4%
Nestlé Starbucks North America 4 321 5 years 3% to 5% Improvement 2.5% 8.1%
Subtotal 9 998
Other CGUs 6 874
Total Intangible assets with indefi nite useful life 16 872
(a) Following the reorganization of the Nutrition business from a GMB to a RMB in the Zones (see Note 3), the goodwill has
been allocated to the respective operating segments. Only the goodwill in Zone AOA is signifi cant.
9. Goodwill and intangible assets
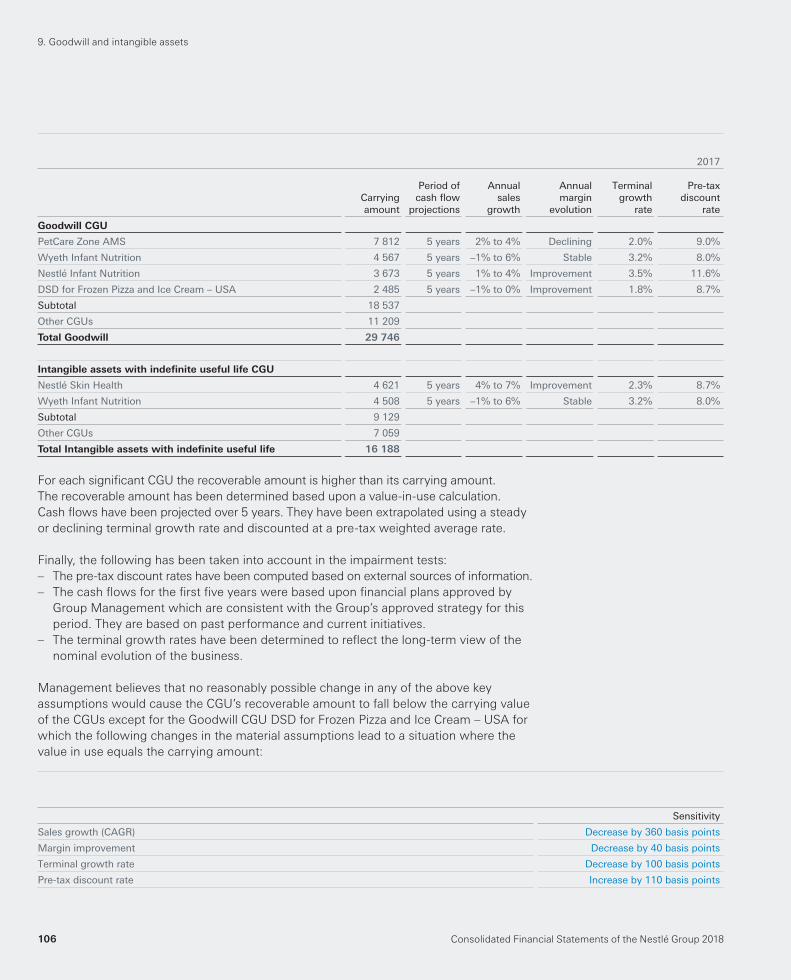
Consolidated Financial Statements of the Nestlé Group 2018106
2017
Carryingamount
Period ofcash fl ow
projections
Annualsales
growth
Annualmargin
evolution
Terminalgrowth
rate
Pre-taxdiscount
rate
Goodwill CGU
PetCare Zone AMS 7 812 5 years 2% to 4% Declining 2.0% 9.0%
Wyeth Infant Nutrition 4 567 5 years –1% to 6% Stable 3.2% 8.0%
Nestlé Infant Nutrition 3 673 5 years 1% to 4% Improvement 3.5% 11.6%
DSD for Frozen Pizza and Ice Cream – USA 2 485 5 years –1% to 0% Improvement 1.8% 8.7%
Subtotal 18 537
Other CGUs 11 209
Total Goodwill 29 746
Intangible assets with indefi nite useful life CGU
Nestlé Skin Health 4 621 5 years 4% to 7% Improvement 2.3% 8.7%
Wyeth Infant Nutrition 4 508 5 years –1% to 6% Stable 3.2% 8.0%
Subtotal 9 129
Other CGUs 7 059
Total Intangible assets with indefi nite useful life 16 188
For each signifi cant CGU the recoverable amount is higher than its carrying amount.
The recoverable amount has been determined based upon a value-in-use calculation.
Cash fl ows have been projected over 5 years. They have been extrapolated using a steady
or declining terminal growth rate and discounted at a pre-tax weighted average rate.
Finally, the following has been taken into account in the impairment tests:
– The pre-tax discount rates have been computed based on external sources of information.
– The cash fl ows for the fi rst fi ve years were based upon fi nancial plans approved by
Group Management which are consistent with the Group’s approved strategy for this
period. They are based on past performance and current initiatives.
– The terminal growth rates have been determined to refl ect the long-term view of the
nominal evolution of the business.
Management believes that no reasonably possible change in any of the above key
assumptions would cause the CGU’s recoverable amount to fall below the carrying value
of the CGUs except for the Goodwill CGU DSD for Frozen Pizza and Ice Cream – USA for
which the following changes in the material assumptions lead to a situation where the
value in use equals the carrying amount:
Sensitivity
Sales growth (CAGR) Decrease by 360 basis points
Margin improvement Decrease by 40 basis points
Terminal growth rate Decrease by 100 basis points
Pre-tax discount rate Increase by 110 basis points
9. Goodwill and intangible assets

Consolidated Financial Statements of the Nestlé Group 2018 107
10. Employee benefi ts
10.1 Employee remuneration
The Group’s salaries of CHF 12 196 million ( 2017 : CHF 12 350 million ) and welfare expenses
of CHF 4234 million ( 2017 : CHF 4221 million ) represent a total of CHF 16 430 million
( 2017 : CHF 16 571 million ). In addition, certain Group employees are eligible to long-term
incentives in the form of equity compensation plans, for which the cost amounts to
CHF 227 million ( 2017 : CHF 247 million ). Employee remuneration is allocated to the
appropriate headings of expenses by function.
10.2 Post-employment benefi ts
The liabilities of the Group arising from defi ned benefi t obligations, and the related
current service cost, are determined using the projected unit credit method. Actuarial
advice is provided both by external consultants and by actuaries employed by the Group.
The actuarial assumptions used to calculate the defi ned benefi t obligations vary according
to the economic conditions of the country in which the plan is located. Such plans are
either externally funded (in the form of independently administered funds) or unfunded.
The defi cit or excess of the fair value of plan assets over the present value of the defi ned
benefi t obligation is recognized as a liability or an asset on the balance sheet.
Pension cost charged to the income statement consists of service cost (current
and past service cost, gains and losses arising from curtailment and settlement) and
administration costs (other than costs of managing plan assets), which are allocated
to the appropriate heading by function, and net interest expense or income, which is
presented as part of net fi nancial income/(expense). The actual return less interest income
on plan assets, changes in actuarial assumptions, and differences between actuarial
assumptions and what has actually occurred are reported in other comprehensive income.
Some benefi ts are also provided by defi ned contribution plans. Contributions to such
plans are charged to the income statement as incurred.
Certain disclosures are presented by geographic area. The three regions disclosed are
Europe, Middle East and North Africa (EMENA), Americas (AMS) and Asia, Oceania
and sub-Saharan Africa (AOA). Each region includes the corresponding Zones as well
as the portion of the GMB activity in that region.
Pensions and retirement benefi ts
Apart from legally required social security arrangements, the majority of Group employees
are eligible for benefi ts through pension plans in case of retirement, death in service,
disability and in case of resignation. Those plans are either defi ned contribution plans
or defi ned benefi t plans based on pensionable remuneration and length of service. All
pension plans comply with local tax and legal restrictions in their respective country,
including funding obligations.
The Group manages its pension plans by geographic area and the major plans, classifi ed
as defi ned benefi t plans under IAS 19, are located in EMENA (Switzerland, United Kingdom
and Germany) and in AMS (USA). In accordance with applicable legal frameworks, these
plans have Boards of Trustees or General Assemblies which are generally independent
from the Group and are responsible for the management and governance of the plans.
Consolidated Financial Statements of the Nestlé Group 2018108
In Switzerland, Nestlé’s pension plan is a cash balance plan where contributions are
expressed as a percentage of the pensionable salary. The pension plan guarantees the
amount accrued on the members’ savings accounts, as well as a minimum interest on those
savings accounts. At retirement date, the savings accounts are converted into pensions.
However, members may opt to receive a part of the pension as a lump sum. Increases
of pensions in payment are granted on a discretionary basis by the Board of Trustees,
subject to the fi nancial situation of the plan. To be noted that there is also a defi ned benefi t
plan that has been closed to new entrants in 2013 and whose members below age 55 as of
that date were transferred to the cash balance plan. This heritage plan is a hybrid between
a cash balance plan and a plan based on a fi nal pensionable salary. Finally, the Group has
committed to make additional contributions up to a maximum of CHF 440 million, of which
CHF 115 million had been contributed as at December 31, 2018, in order to mitigate the
impact of changes in mortality and decrease in conversion rates applicable since
July 1, 2018.
In the United Kingdom, Nestlé’s pension plan is a hybrid arrangement combining
a defi ned benefi t career average section plus a defi ned contribution section. The defi ned
benefi t section was closed to new entrants during 2016. In the defi ned benefi t section,
from August 2017 onwards, members accrue a pension defi ned on their capped salary
each year, plus defi ned contribution provision above the capped salary. Accrued pensions
are automatically revalued according to infl ation, subject to caps. Similarly, pensions
in payment are increased annually in line with infl ation, subject to caps as applicable.
At retirement, there is a lump sum option. Finally, the funding of the shortfall of the
Nestlé UK Pension Fund is defi ned on the basis of a triennial independent actuarial
valuation in accordance with local regulations. As a result, an amount of GBP 86 million
has been paid by Nestlé UK Ltd during the year in accordance with the agreed schedule
of contributions. The undiscounted future payments after December 31, 2018, related
to the shortfall amount to GBP 407 million (GBP 172 million between 2019 to 2020,
GBP 86 million in 2021 and GBP 149 million in 2022).
Nestlé’s pension plan in Germany is a cash balance plan, where members benefi t
from a guarantee on their savings accounts. Contributions to the plan are expressed
as a percentage of the pensionable salary. Increases to pensions in payment are granted
in accor dance with legal requirements. There is also a heritage plan, based on fi nal
pensionable salary, which has been closed to new entrants in 2006.
In the USA, Nestlé’s primary pension plan is non-contributory for the employees. The plan
is a pension equity design, under which members earn pension credits each year based on
a schedule related to the sum of their age and service with Nestlé. A member’s benefi t is the
sum of the annual pension credits earned multiplied by an average earning payable as a lump
sum. However, in lieu of the lump sum, members have the option of converting the benefi t
to a monthly pension annuity. The plan does not provide for automatic pension increases.
This plan was closed to new entrants at the end of 2015. In 2018, Nestlé elected to
contribute in advance the anticipated contributions of the years 2019–2021 in addition
to 2018 for a total amount of USD 233 million to its US based defi ned benefi t plans.
Post-employment medical benefi ts and other employee benefi ts
Subsidiaries, principally in AMS, maintain medical benefi t plans, classifi ed as defi ned
benefi t plans under IAS 19, which cover eligible retired employees. The obligations for
other employee benefi ts consist mainly of end of service indemnities, which do not have
the character of pensions.
10. Employee benefi ts
Consolidated Financial Statements of the Nestlé Group 2018 109
Risks related to defi ned benefi t plans
The main risks to which the Group is exposed in relation to operating defi ned benefi t
plans are:
– mortality risk: the assumptions adopted by the Group make allowance for future
improvements in life expectancy. However, if life expectancy improves at a faster rate
than assumed, this would result in greater payments from the plans and consequently
increases in the plans’ liabilities. In order to minimize this risk, mortality assumptions
are reviewed on a regular basis.
– market and liquidity risks: these are the risks that the investments do not meet the
expected returns over the medium to long-term. This also encompasses the mismatch
between assets and liabilities. In order to minimize the risks, the structure of the portfolios
is reviewed and asset-liability matching analyses are performed on a regular basis.
As certain of the Group’s pension arrangements permit benefi ts to be adjusted in the case
that downside risks emerge, therefore the Group does not always have full exposure to
the risks described above.
Plan amendments and restructuring events
Plans within the Group are regularly reviewed as to whether they are aligned with market
practice in the local context. Should a review indicate that a plan needs to be changed,
prior agreement with the local Board of Trustees or the General Assembly, the regulator
and, if applicable, the members, is sought before implementing plan changes.
During the year, there were individually non-signifi cant plan amendments and restructuring
activities leading to curtailments and settlements. The related past service costs (income)
of CHF 78 million have been recognized in the income statement primarily under
Marketing and administration costs.
Asset-liability management and funding arrangement
Plan trustees or General Assemblies are responsible for determining the mix of asset
classes and target allocations of the Nestlé’s plans with the support of investment advisors.
Periodic reviews of the asset mix are made by mandating external consultants to perform
asset liability matching analyses. Such analyses aim at comparing dynamically the fair value
of assets and the liabilities in order to determine the most adequate strategic asset allocation.
The overall investment policy and strategy for the Group’s funded defi ned benefi t plans
is guided by the objective of achieving an investment return which, together with the
contri butions paid, is suffi cient to maintain reasonable control over the various funding
risks of the plans. As those risks evolve with the development of capital markets and
asset management activities, the Group addresses the assessment and control process
of the major investment pension risks. In order to protect the Group’s defi ned benefi t plans
funding ratio and to mitigate the fi nancial risks, protective measures on the investment
strategies are in force. To the extent possible, the risks are shared equally amongst the
different stakeholders.
10. Employee benefi ts
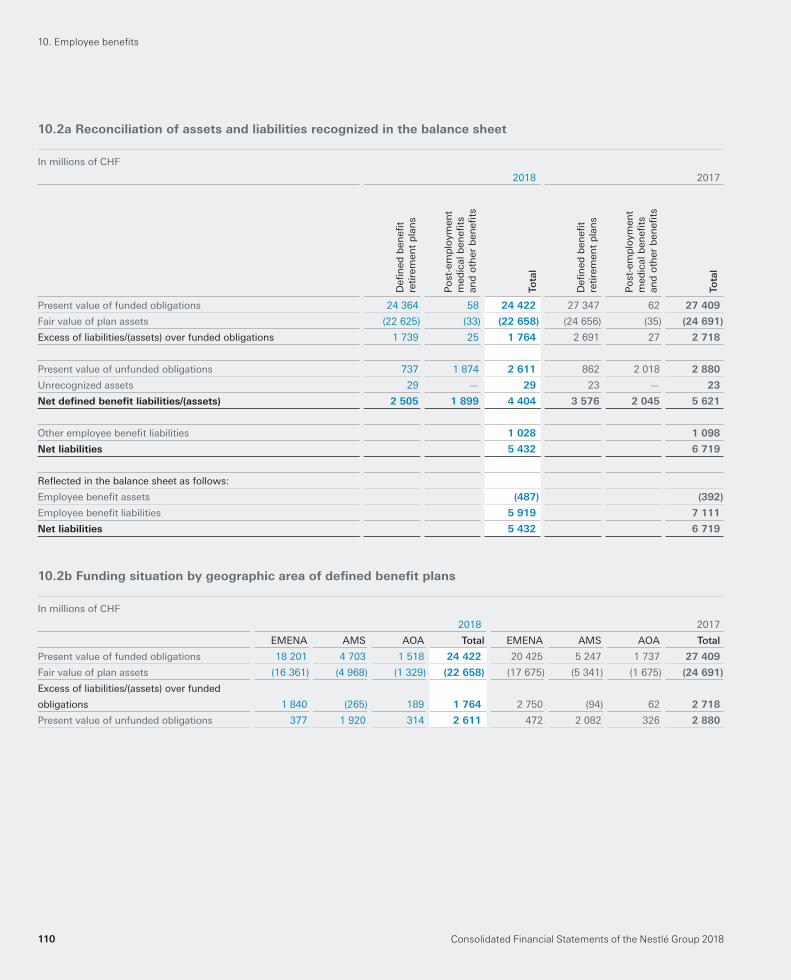
Consolidated Financial Statements of the Nestlé Group 2018110
10.2a Reconciliation of assets and liabilities recognized in the balance sheet
In millions of CHF
2018 2017
Defi
ned
ben
efi t
reti
rem
ent
pla
ns
Po
st-e
mp
loym
ent
med
ical
ben
efi t
s an
d o
ther
ben
efi t
s
Tota
l
Defi
ned
ben
efi t
reti
rem
ent
pla
ns
Po
st-e
mp
loym
ent
med
ical
ben
efi t
s an
d o
ther
ben
efi t
s
Tota
l
Present value of funded obligations 24 364 58 24 422 27 347 62 27 409
Fair value of plan assets (22 625) (33) (22 658) (24 656) (35) (24 691)
Excess of liabilities/(assets) over funded obligations 1 739 25 1 764 2 691 27 2 718
Present value of unfunded obligations 737 1 874 2 611 862 2 018 2 880
Unrecognized assets 29 — 29 23 — 23
Net defi ned benefi t liabilities/(assets) 2 505 1 899 4 404 3 576 2 045 5 621
Other employee benefi t liabilities 1 028 1 098
Net liabilities 5 432 6 719
Refl ected in the balance sheet as follows:
Employee benefi t assets (487) (392)
Employee benefi t liabilities 5 919 7 111
Net liabilities 5 432 6 719
10.2b Funding situation by geographic area of defi ned benefi t plans
In millions of CHF
2018 2017
EMENA AMS AOA Total EMENA AMS AOA Total
Present value of funded obligations 18 201 4 703 1 518 24 422 20 425 5 247 1 737 27 409
Fair value of plan assets (16 361) (4 968) (1 329) (22 658) (17 675) (5 341) (1 675) (24 691)
Excess of liabilities/(assets) over funded
obligations 1 840 (265) 189 1 764 2 750 (94) 62 2 718
Present value of unfunded obligations 377 1 920 314 2 611 472 2 082 326 2 880
10. Employee benefi ts
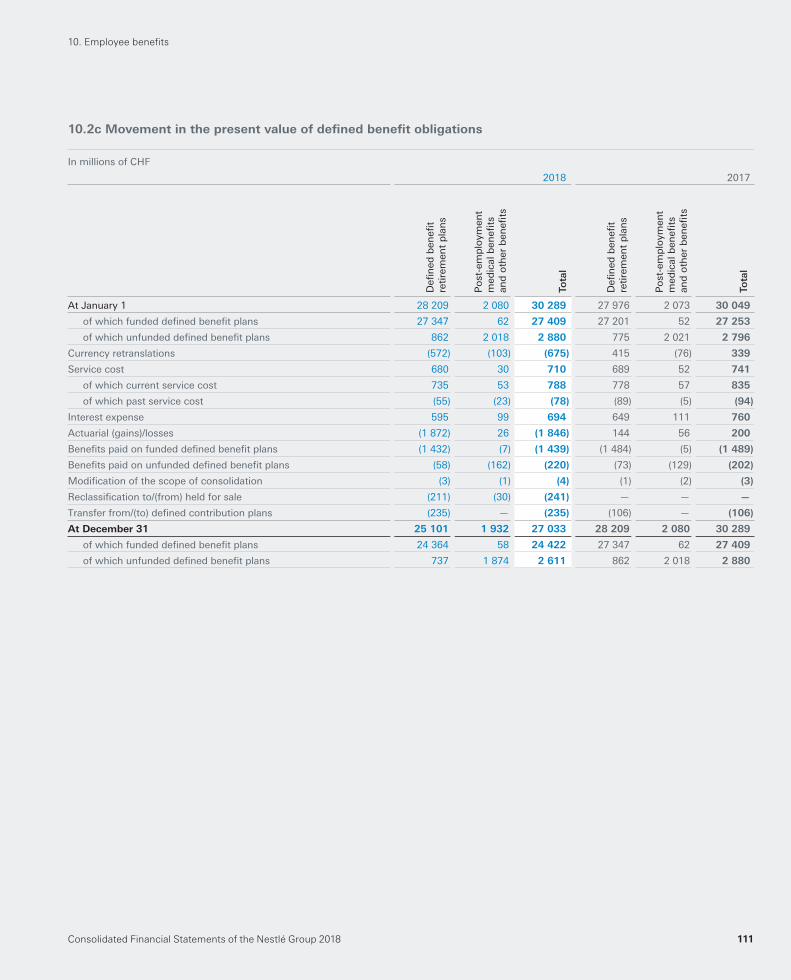
Consolidated Financial Statements of the Nestlé Group 2018 111
10.2c Movement in the present value of defi ned benefi t obligations
In millions of CHF
2018 2017
Defi
ned
ben
efi t
reti
rem
ent
pla
ns
Po
st-e
mp
loym
ent
med
ical
ben
efi t
s an
d o
ther
ben
efi t
s
Tota
l
Defi
ned
ben
efi t
reti
rem
ent
pla
ns
Po
st-e
mp
loym
ent
med
ical
ben
efi t
s an
d o
ther
ben
efi t
s
Tota
l
At January 1 28 209 2 080 30 289 27 976 2 073 30 049
of which funded defi ned benefi t plans 27 347 62 27 409 27 201 52 27 253
of which unfunded defi ned benefi t plans 862 2 018 2 880 775 2 021 2 796
Currency retranslations (572) (103) (675) 415 (76) 339
Service cost 680 30 710 689 52 741
of which current service cost 735 53 788 778 57 835
of which past service cost (55) (23) (78) (89) (5) (94)
Interest expense 595 99 694 649 111 760
Actuarial (gains)/losses (1 872) 26 (1 846) 144 56 200
Benefi ts paid on funded defi ned benefi t plans (1 432) (7) (1 439) (1 484) (5) (1 489)
Benefi ts paid on unfunded defi ned benefi t plans (58) (162) (220) (73) (129) (202)
Modifi cation of the scope of consolidation (3) (1) (4) (1) (2) (3)
Reclassifi cation to/(from) held for sale (211) (30) (241) — — —
Transfer from/(to) defi ned contribution plans (235) — (235) (106) — (106)
At December 31 25 101 1 932 27 033 28 209 2 080 30 289
of which funded defi ned benefi t plans 24 364 58 24 422 27 347 62 27 409
of which unfunded defi ned benefi t plans 737 1 874 2 611 862 2 018 2 880
10. Employee benefi ts
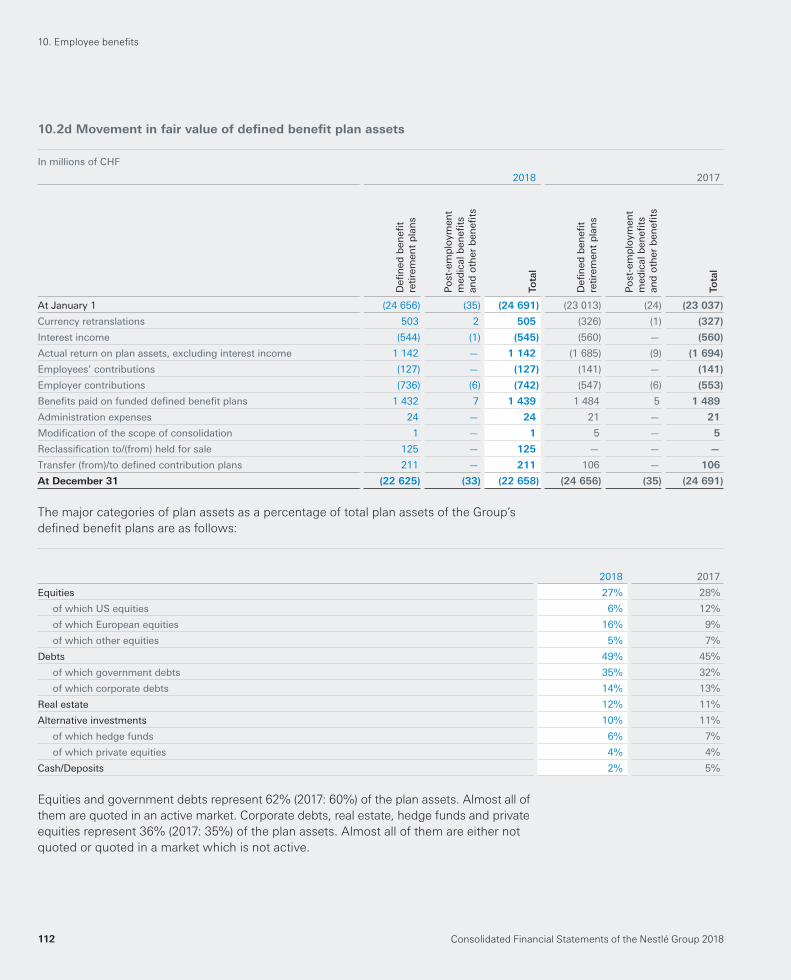
Consolidated Financial Statements of the Nestlé Group 2018112
10.2d Movement in fair value of defi ned benefi t plan assets
In millions of CHF
2018 2017
Defi
ned
ben
efi t
reti
rem
ent
pla
ns
Po
st-e
mp
loym
ent
med
ical
ben
efi t
s an
d o
ther
ben
efi t
s
Tota
l
Defi
ned
ben
efi t
reti
rem
ent
pla
ns
Po
st-e
mp
loym
ent
med
ical
ben
efi t
s an
d o
ther
ben
efi t
s
Tota
l
At January 1 (24 656) (35) (24 691) (23 013) (24) (23 037)
Currency retranslations 503 2 505 (326) (1) (327)
Interest income (544) (1) (545) (560) — (560)
Actual return on plan assets, excluding interest income 1 142 — 1 142 (1 685) (9) (1 694)
Employees’ contributions (127) — (127) (141) — (141)
Employer contributions (736) (6) (742) (547) (6) (553)
Benefi ts paid on funded defi ned benefi t plans 1 432 7 1 439 1 484 5 1 489
Administration expenses 24 — 24 21 — 21
Modifi cation of the scope of consolidation 1 — 1 5 — 5
Reclassifi cation to/(from) held for sale 125 — 125 — — —
Transfer (from)/to defi ned contribution plans 211 — 211 106 — 106
At December 31 (22 625) (33) (22 658) (24 656) (35) (24 691)
The major categories of plan assets as a percentage of total plan assets of the Group’s
defi ned benefi t plans are as follows:
2018 2017
Equities 27% 28%
of which US equities 6% 12%
of which European equities 16% 9%
of which other equities 5% 7%
Debts 49% 45%
of which government debts 35% 32%
of which corporate debts 14% 13%
Real estate 12% 11%
Alternative investments 10% 11%
of which hedge funds 6% 7%
of which private equities 4% 4%
Cash/Deposits 2% 5%
Equities and government debts represent 62% ( 2017 : 60% ) of the plan assets. Almost all of
them are quoted in an active market. Corporate debts, real estate, hedge funds and private
equities represent 36% ( 2017 : 35% ) of the plan assets. Almost all of them are either not
quoted or quoted in a market which is not active.
10. Employee benefi ts
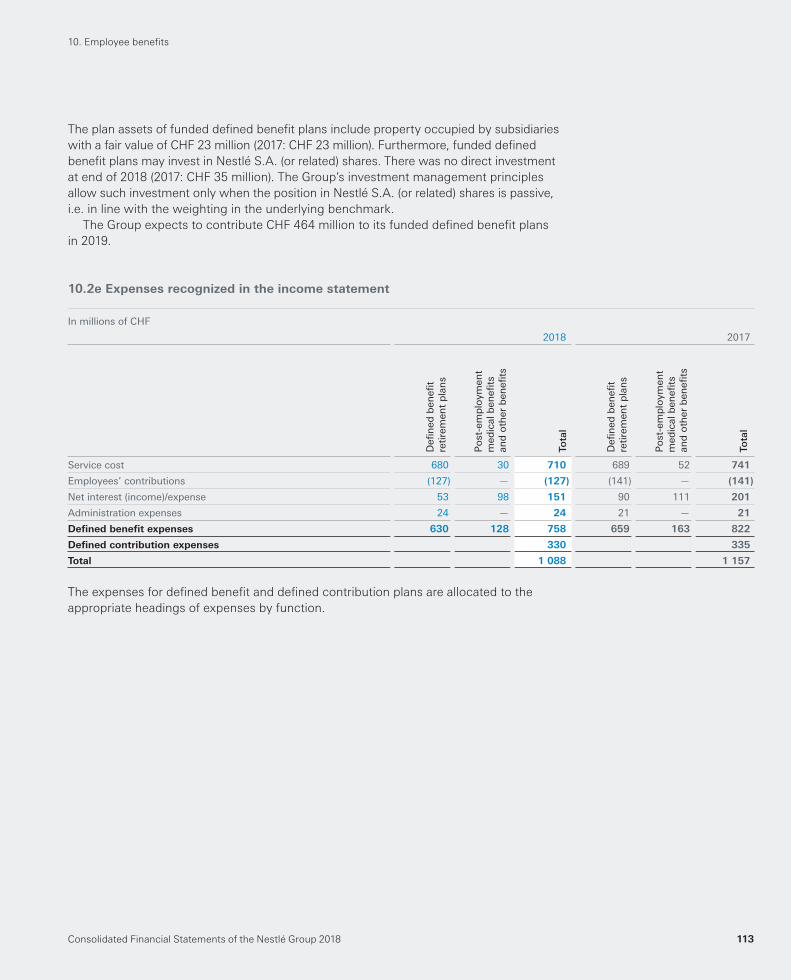
Consolidated Financial Statements of the Nestlé Group 2018 113
The plan assets of funded defi ned benefi t plans include property occupied by subsidiaries
with a fair value of CHF 23 million ( 2017 : CHF 23 million ). Furthermore, funded defi ned
benefi t plans may invest in Nestlé S.A. (or related) shares. There was no direct investment
at end of 2018 ( 2017 : CHF 35 million ). The Group’s investment management principles
allow such investment only when the position in Nestlé S.A. (or related) shares is passive,
i.e. in line with the weighting in the underlying benchmark.
The Group expects to contribute CHF 464 million to its funded defi ned benefi t plans
in 2019 .
10.2e Expenses recognized in the income statement
In millions of CHF
2018 2017
Defi
ned
ben
efi t
reti
rem
ent
pla
ns
Po
st-e
mp
loym
ent
med
ical
ben
efi t
s an
d o
ther
ben
efi t
s
Tota
l
Defi
ned
ben
efi t
reti
rem
ent
pla
ns
Po
st-e
mp
loym
ent
med
ical
ben
efi t
s an
d o
ther
ben
efi t
s
Tota
l
Service cost 680 30 710 689 52 741
Employees’ contributions (127) — (127) (141) — (141)
Net interest (income)/expense 53 98 151 90 111 201
Administration expenses 24 — 24 21 — 21
Defi ned benefi t expenses 630 128 758 659 163 822
Defi ned contribution expenses 330 335
Total 1 088 1 157
The expenses for defi ned benefi t and defi ned contribution plans are allocated to the
appropriate headings of expenses by function.
10. Employee benefi ts
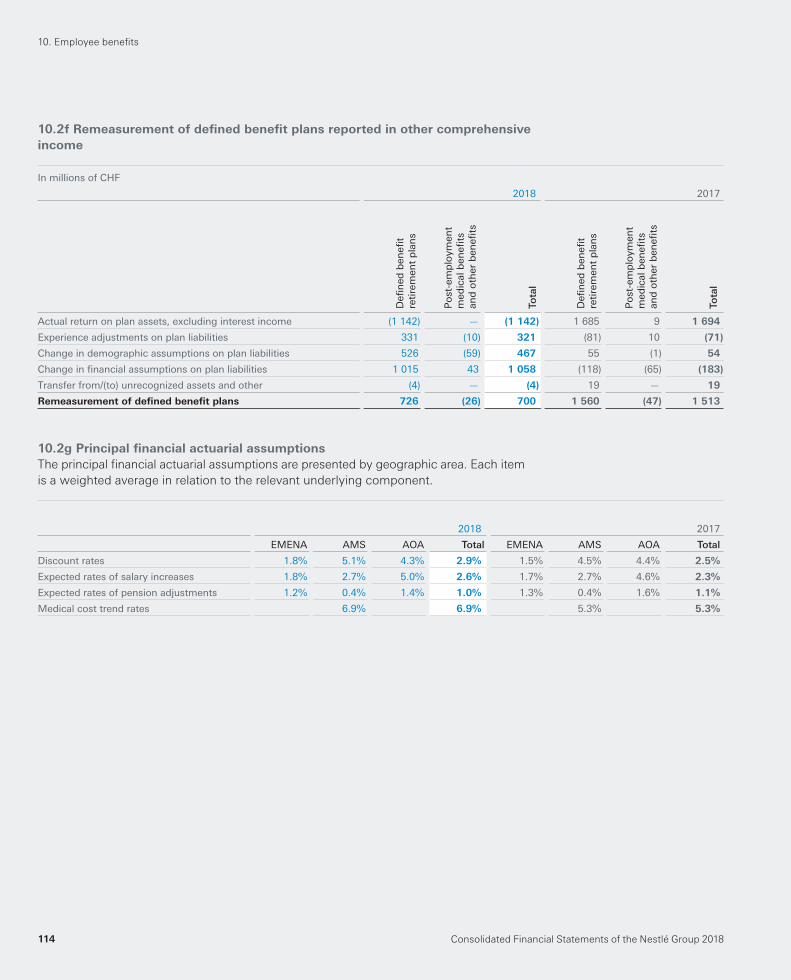
Consolidated Financial Statements of the Nestlé Group 2018114
10.2f Remeasurement of defi ned benefi t plans reported in other comprehensive
income
In millions of CHF
2018 2017
Defi
ned
ben
efi t
reti
rem
ent
pla
ns
Po
st-e
mp
loym
ent
med
ical
ben
efi t
s an
d o
ther
ben
efi t
s
Tota
l
Defi
ned
ben
efi t
reti
rem
ent
pla
ns
Po
st-e
mp
loym
ent
med
ical
ben
efi t
s an
d o
ther
ben
efi t
s
Tota
l
Actual return on plan assets, excluding interest income (1 142) — (1 142) 1 685 9 1 694
Experience adjustments on plan liabilities 331 (10) 321 (81) 10 (71)
Change in demographic assumptions on plan liabilities 526 (59) 467 55 (1) 54
Change in fi nancial assumptions on plan liabilities 1 015 43 1 058 (118) (65) (183)
Transfer from/(to) unrecognized assets and other (4) — (4) 19 — 19
Remeasurement of defi ned benefi t plans 726 (26) 700 1 560 (47) 1 513
10.2g Principal fi nancial actuarial assumptions
The principal fi nancial actuarial assumptions are presented by geographic area. Each item
is a weighted average in relation to the relevant underlying component.
2018 2017
EMENA AMS AOA Total EMENA AMS AOA Total
Discount rates 1.8% 5.1% 4.3% 2.9% 1.5% 4.5% 4.4% 2.5%
Expected rates of salary increases 1.8% 2.7% 5.0% 2.6% 1.7% 2.7% 4.6% 2.3%
Expected rates of pension adjustments 1.2% 0.4% 1.4% 1.0% 1.3% 0.4% 1.6% 1.1%
Medical cost trend rates 6.9% 6.9% 5.3% 5.3%
10. Employee benefi ts
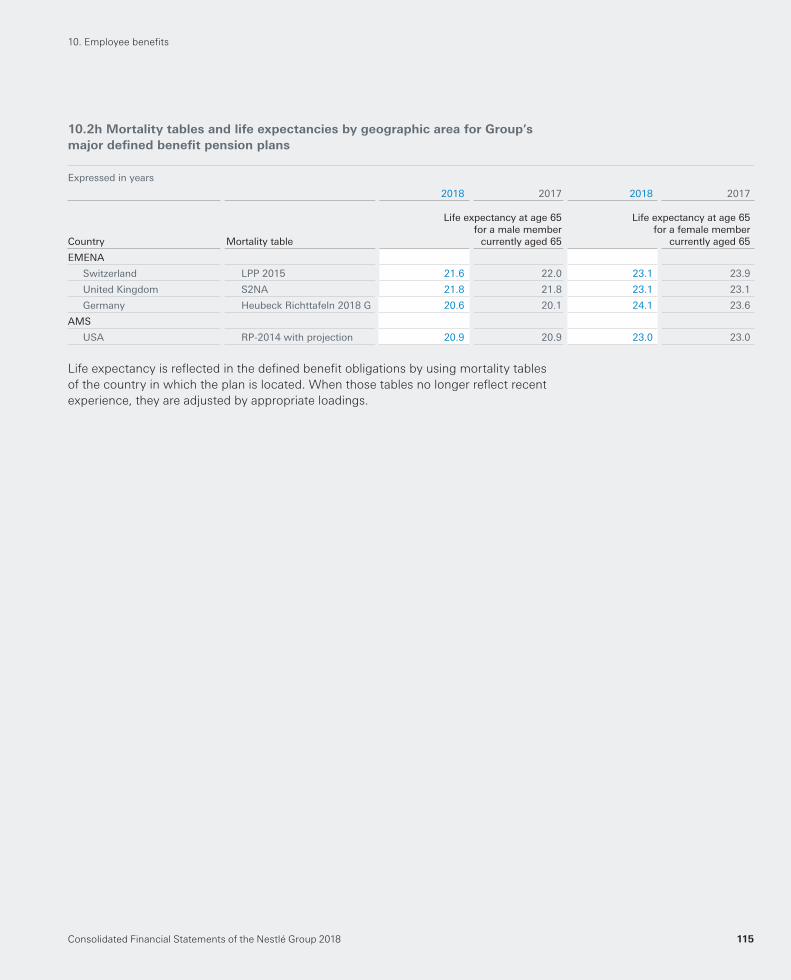
Consolidated Financial Statements of the Nestlé Group 2018 115
10.2h Mortality tables and life expectancies by geographic area for Group’s
major defi ned benefi t pension plans
Expressed in years
2018 2017 2018 2017
Country Mortality table
Life expectancy at age 65 for a male member
currently aged 65
Life expectancy at age 65 for a female member
currently aged 65
EMENA
Switzerland LPP 2015 21.6 22.0 23.1 23.9
United Kingdom S2NA 21.8 21.8 23.1 23.1
Germany Heubeck Richttafeln 2018 G 20.6 20.1 24.1 23.6
AMS
USA RP-2014 with projection 20.9 20.9 23.0 23.0
Life expectancy is refl ected in the defi ned benefi t obligations by using mortality tables
of the country in which the plan is located. When those tables no longer refl ect recent
experience, they are adjusted by appropriate loadings.
10. Employee benefi ts
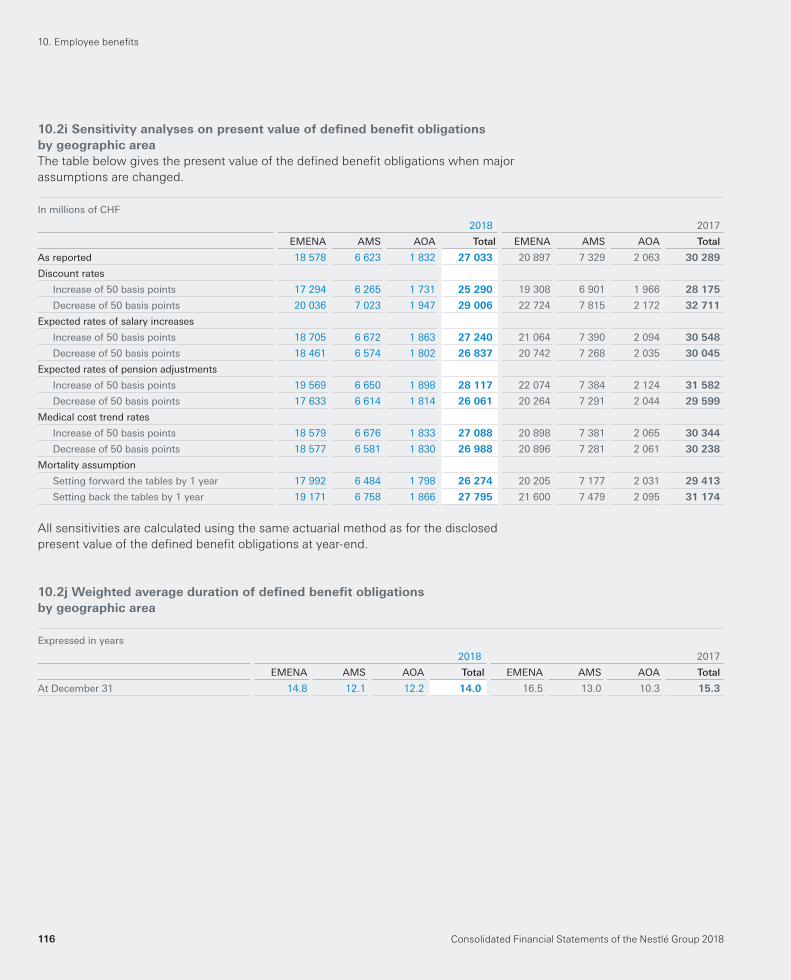
Consolidated Financial Statements of the Nestlé Group 2018116
10.2i Sensitivity analyses on present value of defi ned benefi t obligations
by geographic area
The table below gives the present value of the defi ned benefi t obligations when major
assumptions are changed.
In millions of CHF
2018 2017
EMENA AMS AOA Total EMENA AMS AOA Total
As reported 18 578 6 623 1 832 27 033 20 897 7 329 2 063 30 289
Discount rates
Increase of 50 basis points 17 294 6 265 1 731 25 290 19 308 6 901 1 966 28 175
Decrease of 50 basis points 20 036 7 023 1 947 29 006 22 724 7 815 2 172 32 711
Expected rates of salary increases
Increase of 50 basis points 18 705 6 672 1 863 27 240 21 064 7 390 2 094 30 548
Decrease of 50 basis points 18 461 6 574 1 802 26 837 20 742 7 268 2 035 30 045
Expected rates of pension adjustments
Increase of 50 basis points 19 569 6 650 1 898 28 117 22 074 7 384 2 124 31 582
Decrease of 50 basis points 17 633 6 614 1 814 26 061 20 264 7 291 2 044 29 599
Medical cost trend rates
Increase of 50 basis points 18 579 6 676 1 833 27 088 20 898 7 381 2 065 30 344
Decrease of 50 basis points 18 577 6 581 1 830 26 988 20 896 7 281 2 061 30 238
Mortality assumption
Setting forward the tables by 1 year 17 992 6 484 1 798 26 274 20 205 7 177 2 031 29 413
Setting back the tables by 1 year 19 171 6 758 1 866 27 795 21 600 7 479 2 095 31 174
All sensitivities are calculated using the same actuarial method as for the disclosed
present value of the defi ned benefi t obligations at year-end.
10.2j Weighted average duration of defi ned benefi t obligations
by geographic area
Expressed in years
2018 2017
EMENA AMS AOA Total EMENA AMS AOA Total
At December 31 14.8 12.1 12.2 14.0 16.5 13.0 10.3 15.3
10. Employee benefi ts
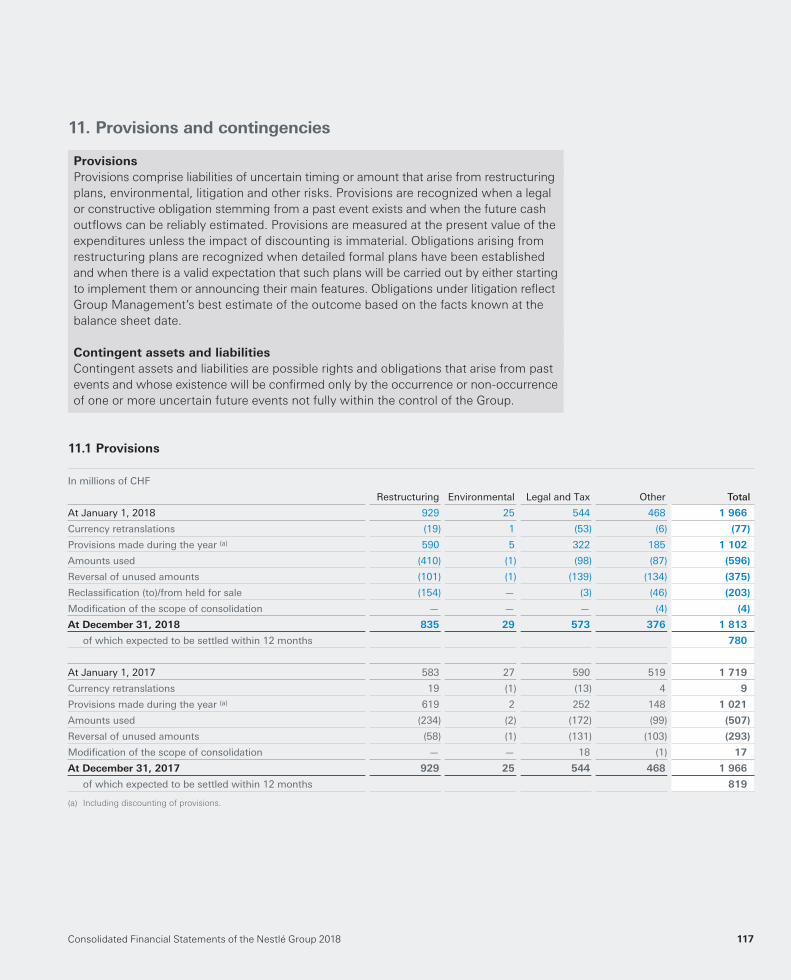
Consolidated Financial Statements of the Nestlé Group 2018 117
11. Provisions and contingencies
Provisions
Provisions comprise liabilities of uncertain timing or amount that arise from restructuring
plans, environmental, litigation and other risks. Provisions are recognized when a legal
or constructive obligation stemming from a past event exists and when the future cash
outfl ows can be reliably estimated. Provisions are measured at the present value of the
expenditures unless the impact of discounting is immaterial. Obligations arising from
restructuring plans are recognized when detailed formal plans have been established
and when there is a valid expectation that such plans will be carried out by either starting
to implement them or announcing their main features. Obligations under litigation refl ect
Group Management’s best estimate of the outcome based on the facts known at the
balance sheet date.
Contingent assets and liabilities
Contingent assets and liabilities are possible rights and obligations that arise from past
events and whose existence will be confi rmed only by the occurrence or non-occurrence
of one or more uncertain future events not fully within the control of the Group.
11.1 Provisions
In millions of CHF
Restructuring Environmental Legal and Tax Other Total
At January 1, 2018 929 25 544 468 1 966
Currency retranslations (19) 1 (53) (6) (77)
Provisions made during the year (a) 590 5 322 185 1 102
Amounts used (410) (1) (98) (87) (596)
Reversal of unused amounts (101) (1) (139) (134) (375)
Reclassifi cation (to)/from held for sale (154) — (3) (46) (203)
Modifi cation of the scope of consolidation — — — (4) (4)
At December 31, 2018 835 29 573 376 1 813
of which expected to be settled within 12 months 780
At January 1, 2017 583 27 590 519 1 719
Currency retranslations 19 (1) (13) 4 9
Provisions made during the year (a) 619 2 252 148 1 021
Amounts used (234) (2) (172) (99) (507)
Reversal of unused amounts (58) (1) (131) (103) (293)
Modifi cation of the scope of consolidation — — 18 (1) 17
At December 31, 2017 929 25 544 468 1 966
of which expected to be settled within 12 months 819
(a) Including discounting of provisions.
Consolidated Financial Statements of the Nestlé Group 2018118
Restructuring
Restructuring provisions arise from a number of projects across the Group. These include
plans to optimize production, sales and administration structures, mainly in the geographies
EMENA and AMS. Restructuring provisions are expected to result in future cash outfl ows
when implementing the plans (usually over the following two to three years).
Legal and tax
Legal provisions have been set up to cover legal and administrative proceedings that arise
in the ordinary course of the business. Tax provisions include disputes and uncertainties on
non-income taxes (mainly VAT and sales taxes). It covers numerous separate cases whose
detailed disclosure could be detrimental to the Group interests. The Group does not
believe that any of these cases will have a material adverse impact on its fi nancial position.
The timing of outfl ows is uncertain as it depends upon the outcome of the cases. Group
Management does not believe it is possible to make assumptions on the evolution of the
cases beyond the balance sheet date.
Other
Other provisions are mainly constituted by onerous contracts and various damage claims
having occurred during the year but not covered by insurance companies. Onerous
contracts result from termination of contracts or supply agreements above market prices
in which the unavoidable costs of meeting the obligations under the contracts exceed the
economic benefi ts expected to be received or for which no benefi ts are expected to be
received.
11.2 Contingencies
The Group is exposed to contingent liabilities amounting to a maximum potential
payment of CHF 1860 million ( 2017 : CHF 2024 million ) representing potential litigations
of CHF 1788 million ( 2017 : CHF 1979 million ) and other items of CHF 71 million
( 2017 : CHF 45 million ). Potential litigations relate mainly to labor, civil and tax litigations
in Latin America.
Contingent assets for litigation claims in favor of the Group amount to a maximum
potential recoverable amount of CHF 453 million ( 2017 : CHF 461 million ), mainly in
Latin America.
11. Provisions and contingencies
Consolidated Financial Statements of the Nestlé Group 2018 119
12. Financial instruments
Financial assets – Classes and categories
The classifi cation of fi nancial assets is generally based on the business model in which
a fi nancial asset is managed and its contractual cash fl ow characteristics. The Group
classifi es fi nancial assets in the following categories:
– measured at amortized cost;
– measured at fair value through Other comprehensive income (abbreviated as FVOCI);
and
– measured at fair value through the income statement (abbreviated as FVTPL,
fair value through profi t or loss).
For an equity investment that is not held for trading, the Group may irrevocably elect
to classify it as measured at FVOCI. This election is made at initial recognition on
an investment by investment basis.
Financial assets – Recognition and derecognition
The settlement date is used for initial recognition and derecognition of fi nancial assets
as these transactions are generally under contracts whose terms require delivery
within the time frame established by regulation or convention in the market place
(regular-way purchase or sale). Financial assets are derecognized when substantially
all the Group’s rights to cash fl ows from the fi nancial assets have expired or have been
transferred and the Group has transferred substantially all the risks and rewards of
ownership.
Financial assets – Measurement
Financial assets are initially recognized at fair value plus directly attributable transaction
costs. However when a fi nancial asset measured at FVTPL is recognized, the
transaction costs are expensed immediately. Subsequent remeasurement of fi nancial
assets is determined by their categorization, which is revisited at each reporting date.
Bonds are held in a separate portfolio governed and executed as a prudently managed
broad base of quality securities. The two principal objectives of the portfolio are to
maximize investment income and provide fi nancial stability, subject to a limited risk
tolerance, and to obtain relatively favorable risk adjusted investment returns to achieve
long-term growth of surplus. The Group considers that these securities are held within
a business model whose objective is achieved both by collecting contractual cash fl ows
and by selling securities. The contractual terms of these fi nancial assets give rise on
specifi ed dates to cash fl ows that are solely payments of principal and interest on the
principal amount outstanding. These assets have therefore been classifi ed as fi nancial
assets at FVOCI.
Equity securities represent investments that the Group intends to hold for the long
term for strategic purposes. The Group generally designates these investments at the
date of initial recognition as measured at FVOCI. The accumulated fair value reserve
related to these investments is never reclassifi ed to profi t or loss.
Consolidated Financial Statements of the Nestlé Group 2018120
12. Financial instruments
Commercial paper and time deposits are held by the Group’s treasury unit in a separate
portfolio in order to provide interest income and mitigate the credit risk exposure of the
Group. The Group considers that these investments are held within a business model
whose objective is achieved by collecting contractual cash fl ows. The contractual
terms of these fi nancial assets give rise on specifi ed dates to cash fl ows that are solely
payments of principal and interest on the principal amount outstanding. These assets
have therefore been classifi ed as measured at amortized cost.
Debt funds and equity funds are managed in a separate portfolio dedicated to
self-insurance activities. The shares of funds owned by the Group are puttable shares
which do not qualify for equity instruments as per IAS 32. As a consequence, these
investment funds are classifi ed as at FVTPL.
Financial assets – Impairment
The Group assesses whether its fi nancial assets carried at amortized cost and FVOCI
are impaired on the basis of expected credit losses (ECL). This analysis requires the
identifi cation of signifi cant increases in the credit risk of the counterparties. Considering
that the majority of the Group’s fi nancial assets are trade receivables, the analysis also
integrates statistical data refl ecting the past experience of losses incurred due to default.
See note 7.1 for impairments related to trade receivables.
The Group measures loss allowances for investments in debt securities and time
deposits that are determined to have low credit risk at the reporting date at an amount
equal to 12 month expected credit losses.
The Group considers a debt security to have low credit risk when its credit rating is
“investment grade”, i.e. equivalent to BBB- or higher per Standard & Poor’s rating scale.
To assess whether there is a signifi cant increase in credit risk since initial recognition,
the Group considers available reasonable and supportive information such as changes
in the credit rating of the counterparty. If there is a signifi cant increase in credit risk the
loss allowance is measured at an amount equal to lifetime expected losses.
ECLs are a probability-weighted estimate of credit losses. Credit losses are measured
as the present value of all cash shortfalls due to a credit default event of the counterparty
(i.e. the difference between the cash fl ows due to the entity in accordance with the
contract and the cash fl ows that the Group expects to receive).
Loss allowances for fi nancial assets measured at amortized cost are deducted from
the gross carrying amount of the assets. For debt securities at FVOCI, the loss
allowance is recognized in OCI, instead of reducing the carrying amount of the asset.
Impairment losses on other fi nancial assets related to treasury activities are
presented under Financial expense.
The model and some of the assumptions used in calculating these ECLs are key
sources of estimation uncertainty.
Consolidated Financial Statements of the Nestlé Group 2018 121
Financial liabilities at amortized cost
Financial liabilities are initially recognized at fair value, net of transaction costs incurred.
Subsequent to initial measurement, fi nancial liabilities are recognized at amortized
cost. The difference between the initial carrying amount of the fi nancial liabilities and
their redemption value is recognized in the income statement over the contractual
terms using the effective interest rate method. This category includes the following
classes of fi nancial liabilities: trade and other payables; commercial paper; bonds; lease
liabilities and other fi nancial liabilities.
Financial liabilities at amortized cost are classifi ed as current or non-current depending
whether these are due within 12 months after the balance sheet date or beyond.
Financial liabilities are derecognized (in full or partly) when either the Group is
discharged from its obligation, they expire, are cancelled or replaced by a new liability
with substantially modifi ed terms.
12. Financial instruments
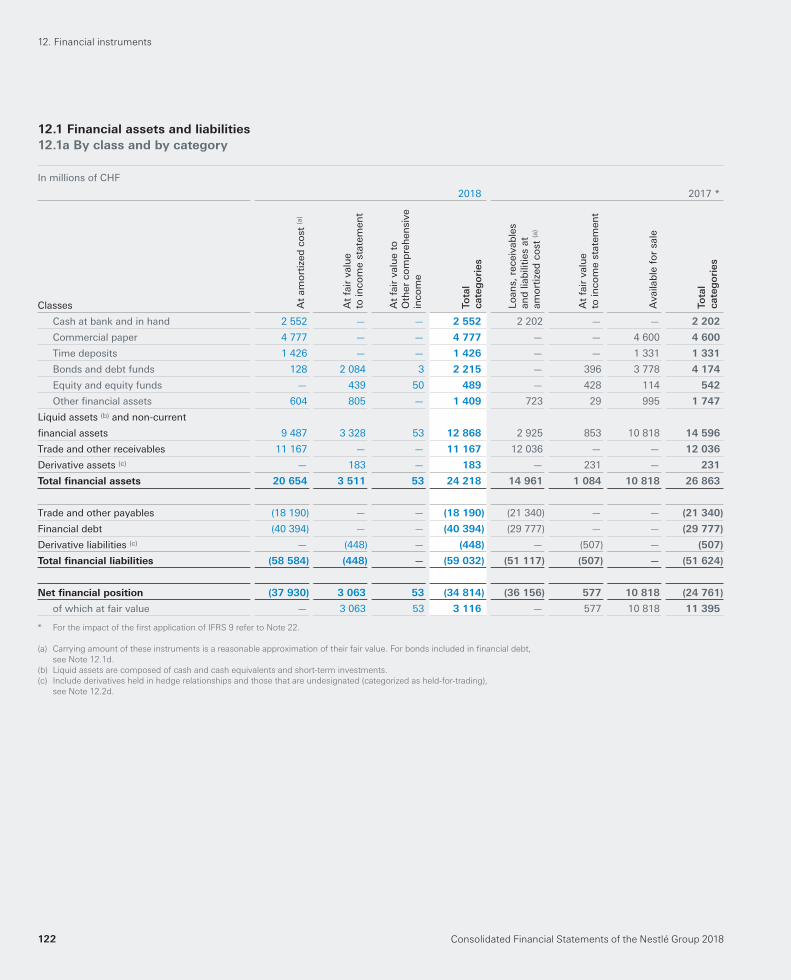
Consolidated Financial Statements of the Nestlé Group 2018122
12. Financial instruments
12.1 Financial assets and liabilities
12.1a By class and by category
In millions of CHF
2018 2017 *
Classes At
amo
rtiz
ed c
ost
(a)
At
fair
val
ue
to in
com
e st
atem
ent
At
fair
val
ue
to
Oth
er c
om
pre
hen
sive
inco
me
Tota
lca
teg
ori
es
Loan
s, r
ecei
vab
les
and
liab
iliti
es a
tam
ort
ized
co
st (a
)
At
fair
val
ue
to in
com
e st
atem
ent
Ava
ilab
le f
or
sale
Tota
lca
teg
ori
es
Cash at bank and in hand 2 552 — — 2 552 2 202 — — 2 202
Commercial paper 4 777 — — 4 777 — — 4 600 4 600
Time deposits 1 426 — — 1 426 — — 1 331 1 331
Bonds and debt funds 128 2 084 3 2 215 — 396 3 778 4 174
Equity and equity funds — 439 50 489 — 428 114 542
Other fi nancial assets 604 805 — 1 409 723 29 995 1 747
Liquid assets (b) and non-current
fi nancial assets 9 487 3 328 53 12 868 2 925 853 10 818 14 596
Trade and other receivables 11 167 — — 11 167 12 036 — — 12 036
Derivative assets (c) — 183 — 183 — 231 — 231
Total fi nancial assets 20 654 3 511 53 24 218 14 961 1 084 10 818 26 863
Trade and other payables (18 190) — — (18 190) (21 340) — — (21 340)
Financial debt (40 394) — — (40 394) (29 777) — — (29 777)
Derivative liabilities (c) — (448) — (448) — (507) — (507)
Total fi nancial liabilities (58 584) (448) — (59 032) (51 117) (507) — (51 624)
Net fi nancial position (37 930) 3 063 53 (34 814) (36 156) 577 10 818 (24 761)
of which at fair value — 3 063 53 3 116 — 577 10 818 11 395
* For the impact of the fi rst application of IFRS 9 refer to Note 22.
(a) Carrying amount of these instruments is a reasonable approximation of their fair value. For bonds included in fi nancial debt,
see Note 12.1d.
(b) Liquid assets are composed of cash and cash equivalents and short-term investments.
(c) Include derivatives held in hedge relationships and those that are undesignated (categorized as held-for-trading),
see Note 12.2d.
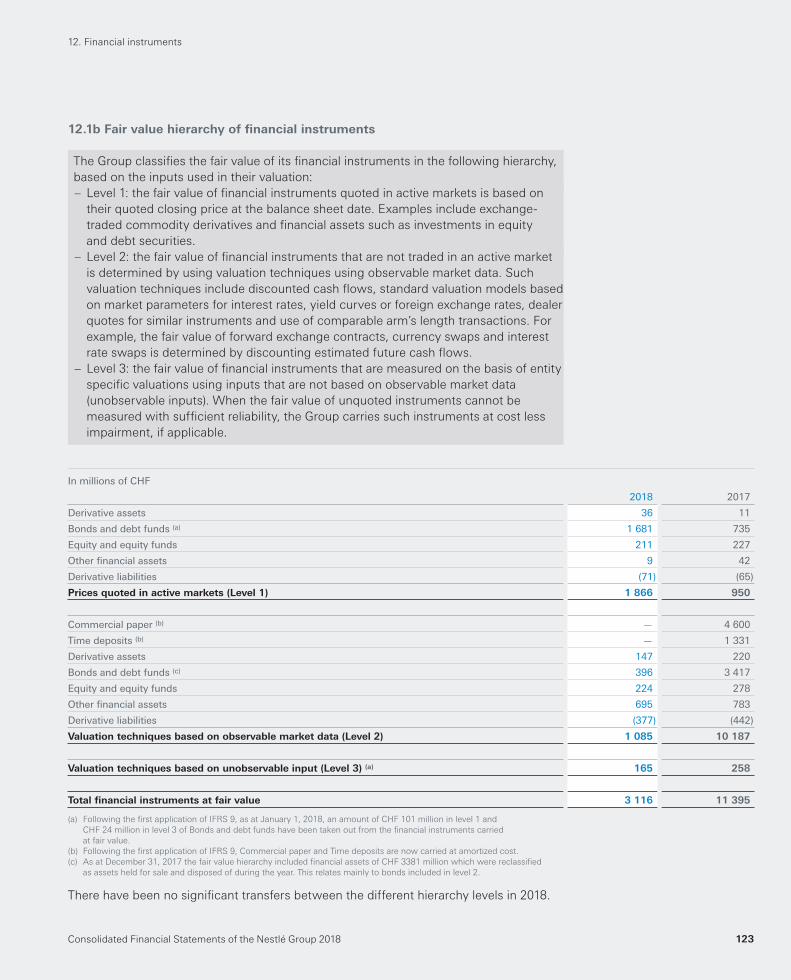
Consolidated Financial Statements of the Nestlé Group 2018 123
12. Financial instruments
12.1b Fair value hierarchy of fi nancial instruments
The Group classifi es the fair value of its fi nancial instruments in the following hierarchy,
based on the inputs used in their valuation:
– Level 1: the fair value of fi nancial instruments quoted in active markets is based on
their quoted closing price at the balance sheet date. Examples include exchange-
traded commodity derivatives and fi nancial assets such as investments in equity
and debt securities.
– Level 2: the fair value of fi nancial instruments that are not traded in an active market
is determined by using valuation techniques using observable market data. Such
valuation techniques include discounted cash fl ows, standard valuation models based
on market parameters for interest rates, yield curves or foreign exchange rates, dealer
quotes for similar instruments and use of comparable arm’s length transactions. For
example, the fair value of forward exchange contracts, currency swaps and interest
rate swaps is determined by discounting estimated future cash fl ows.
– Level 3: the fair value of fi nancial instruments that are measured on the basis of entity
specifi c valuations using inputs that are not based on observable market data
(unobservable inputs). When the fair value of unquoted instruments cannot be
measured with suffi cient reliability, the Group carries such instruments at cost less
impairment, if applicable.
In millions of CHF
2018 2017
Derivative assets 36 11
Bonds and debt funds (a) 1 681 735
Equity and equity funds 211 227
Other fi nancial assets 9 42
Derivative liabilities (71) (65)
Prices quoted in active markets (Level 1) 1 866 950
Commercial paper (b) — 4 600
Time deposits (b) — 1 331
Derivative assets 147 220
Bonds and debt funds (c) 396 3 417
Equity and equity funds 224 278
Other fi nancial assets 695 783
Derivative liabilities (377) (442)
Valuation techniques based on observable market data (Level 2) 1 085 10 187
Valuation techniques based on unobservable input (Level 3) (a) 165 258
Total fi nancial instruments at fair value 3 116 11 395
(a) Following the fi rst application of IFRS 9, as at January 1, 2018, an amount of CHF 101 million in level 1 and
CHF 24 million in level 3 of Bonds and debt funds have been taken out from the fi nancial instruments carried
at fair value.
(b) Following the fi rst application of IFRS 9, Commercial paper and Time deposits are now carried at amortized cost.
(c) As at December 31, 2017 the fair value hierarchy included fi nancial assets of CHF 3381 million which were reclassifi ed
as assets held for sale and disposed of during the year. This relates mainly to bonds included in level 2.
There have been no signifi cant transfers between the different hierarchy levels in 2018 .
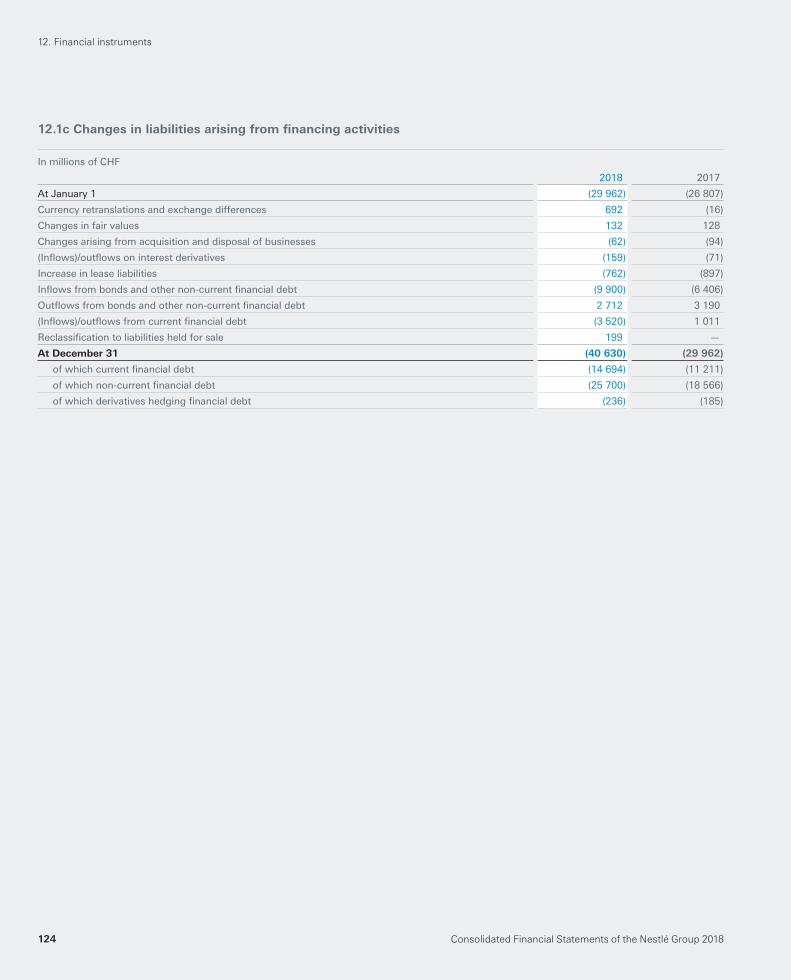
Consolidated Financial Statements of the Nestlé Group 2018124
12. Financial instruments
12.1c Changes in liabilities arising from fi nancing activities
In millions of CHF
2018 2017
At January 1 (29 962) (26 807)
Currency retranslations and exchange differences 692 (16)
Changes in fair values 132 128
Changes arising from acquisition and disposal of businesses (62) (94)
(Infl ows)/outfl ows on interest derivatives (159) (71)
Increase in lease liabilities (762) (897)
Infl ows from bonds and other non-current fi nancial debt (9 900) (6 406)
Outfl ows from bonds and other non-current fi nancial debt 2 712 3 190
(Infl ows)/outfl ows from current fi nancial debt (3 520) 1 011
Reclassifi cation to liabilities held for sale 199 —
At December 31 (40 630) (29 962)
of which current fi nancial debt (14 694) (11 211)
of which non-current fi nancial debt (25 700) (18 566)
of which derivatives hedging fi nancial debt (236) (185)
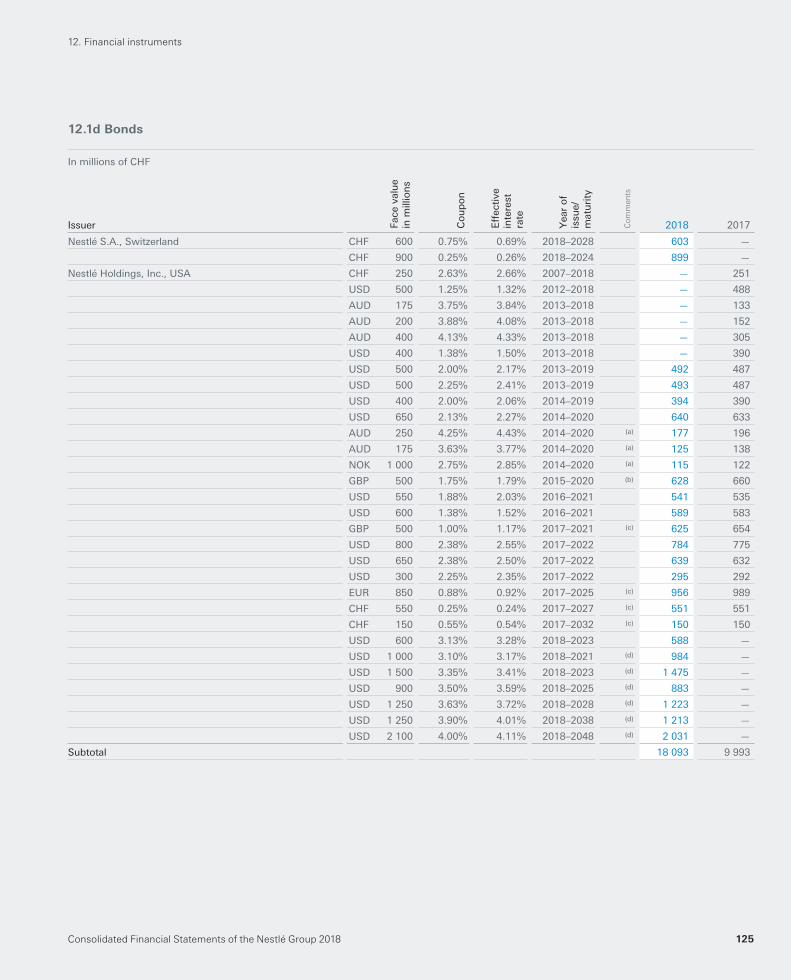
Consolidated Financial Statements of the Nestlé Group 2018 125
12. Financial instruments
12.1d Bonds
In millions of CHF
Issuer Face
val
ue
in m
illio
ns
Co
up
on
Eff
ecti
vein
tere
stra
te
Yea
r o
fis
sue/
mat
uri
ty
Co
mm
en
ts
2018 2017
Nestlé S.A., Switzerland CHF 600 0.75% 0.69% 2018–2028 603 —
CHF 900 0.25% 0.26% 2018–2024 899 —
Nestlé Holdings, Inc., USA CHF 250 2.63% 2.66% 2007–2018 — 251
USD 500 1.25% 1.32% 2012–2018 — 488
AUD 175 3.75% 3.84% 2013–2018 — 133
AUD 200 3.88% 4.08% 2013–2018 — 152
AUD 400 4.13% 4.33% 2013–2018 — 305
USD 400 1.38% 1.50% 2013–2018 — 390
USD 500 2.00% 2.17% 2013–2019 492 487
USD 500 2.25% 2.41% 2013–2019 493 487
USD 400 2.00% 2.06% 2014–2019 394 390
USD 650 2.13% 2.27% 2014–2020 640 633
AUD 250 4.25% 4.43% 2014–2020 (a) 177 196
AUD 175 3.63% 3.77% 2014–2020 (a) 125 138
NOK 1 000 2.75% 2.85% 2014–2020 (a) 115 122
GBP 500 1.75% 1.79% 2015–2020 (b) 628 660
USD 550 1.88% 2.03% 2016–2021 541 535
USD 600 1.38% 1.52% 2016–2021 589 583
GBP 500 1.00% 1.17% 2017–2021 (c) 625 654
USD 800 2.38% 2.55% 2017–2022 784 775
USD 650 2.38% 2.50% 2017–2022 639 632
USD 300 2.25% 2.35% 2017–2022 295 292
EUR 850 0.88% 0.92% 2017–2025 (c) 956 989
CHF 550 0.25% 0.24% 2017–2027 (c) 551 551
CHF 150 0.55% 0.54% 2017–2032 (c) 150 150
USD 600 3.13% 3.28% 2018–2023 588 —
USD 1 000 3.10% 3.17% 2018–2021 (d) 984 —
USD 1 500 3.35% 3.41% 2018–2023 (d) 1 475 —
USD 900 3.50% 3.59% 2018–2025 (d) 883 —
USD 1 250 3.63% 3.72% 2018–2028 (d) 1 223 —
USD 1 250 3.90% 4.01% 2018–2038 (d) 1 213 —
USD 2 100 4.00% 4.11% 2018–2048 (d) 2 031 —
Subtotal 18 093 9 993
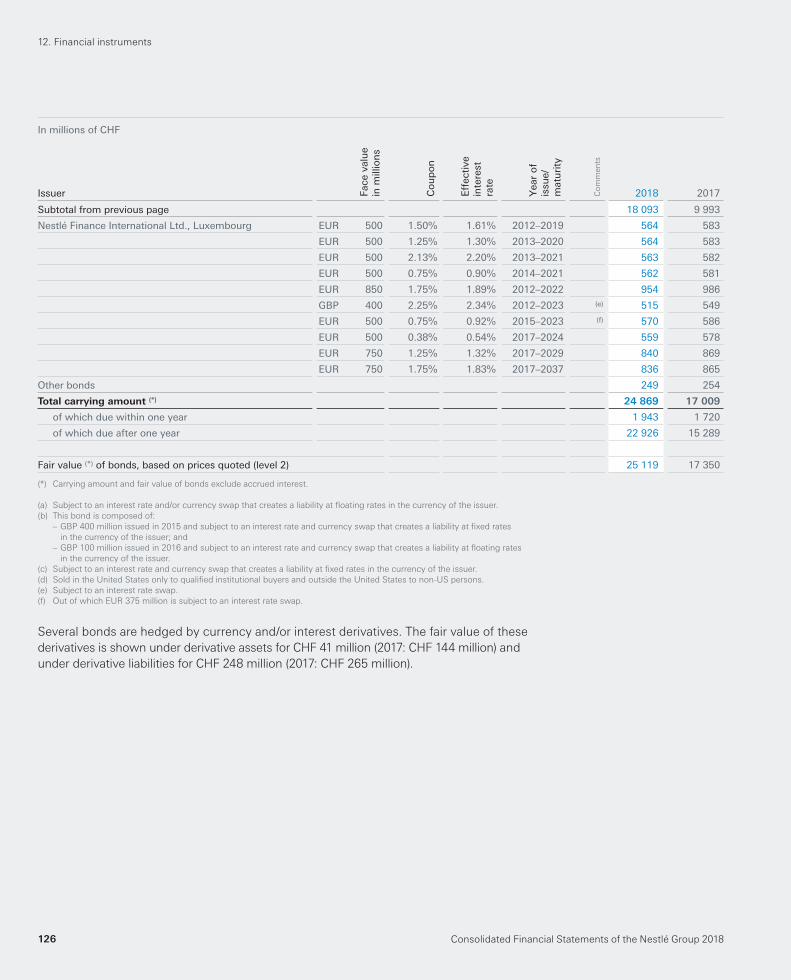
Consolidated Financial Statements of the Nestlé Group 2018126
12. Financial instruments
In millions of CHF
Issuer Face
val
ue
in m
illio
ns
Co
up
on
Eff
ecti
vein
tere
stra
te
Yea
r o
fis
sue/
mat
uri
ty
Co
mm
en
ts
2018 2017
Subtotal from previous page 18 093 9 993
Nestlé Finance International Ltd., Luxembourg EUR 500 1.50% 1.61% 2012–2019 564 583
EUR 500 1.25% 1.30% 2013–2020 564 583
EUR 500 2.13% 2.20% 2013–2021 563 582
EUR 500 0.75% 0.90% 2014–2021 562 581
EUR 850 1.75% 1.89% 2012–2022 954 986
GBP 400 2.25% 2.34% 2012–2023 (e) 515 549
EUR 500 0.75% 0.92% 2015–2023 (f) 570 586
EUR 500 0.38% 0.54% 2017–2024 559 578
EUR 750 1.25% 1.32% 2017–2029 840 869
EUR 750 1.75% 1.83% 2017–2037 836 865
Other bonds 249 254
Total carrying amount (*) 24 869 17 009
of which due within one year 1 943 1 720
of which due after one year 22 926 15 289
Fair value (*) of bonds, based on prices quoted (level 2) 25 119 17 350
(*) Carrying amount and fair value of bonds exclude accrued interest.
(a) Subject to an interest rate and/or currency swap that creates a liability at fl oating rates in the currency of the issuer.
(b) This bond is composed of:
– GBP 400 million issued in 2015 and subject to an interest rate and currency swap that creates a liability at fi xed rates
in the currency of the issuer; and
– GBP 100 million issued in 2016 and subject to an interest rate and currency swap that creates a liability at fl oating rates
in the currency of the issuer.
(c) Subject to an interest rate and currency swap that creates a liability at fi xed rates in the currency of the issuer.
(d) Sold in the United States only to qualifi ed institutional buyers and outside the United States to non-US persons.
(e) Subject to an interest rate swap.
(f) Out of which EUR 375 million is subject to an interest rate swap.
Several bonds are hedged by currency and/or interest derivatives. The fair value of these
derivatives is shown under derivative assets for CHF 41 million ( 2017 : CHF 144 million ) and
under derivative liabilities for CHF 248 million ( 2017 : CHF 265 million ).
Consolidated Financial Statements of the Nestlé Group 2018 127
12. Financial instruments
12.2 Financial risks
In the course of its business, the Group is exposed to a number of fi nancial risks: credit
risk, liquidity risk, market risk (including foreign currency risk and interest rate risk,
commodity price risk and equity price risk). This note presents the Group’s objectives,
policies and processes for managing its fi nancial risk and capital.
Financial risk management is an integral part of the way the Group is managed. The
Board of Directors determines the fi nancial control principles as well as the principles
of fi nancial planning. The Chief Executive Offi cer organizes, manages and monitors all
fi nancial risks, including asset and liability matters.
The Asset and Liability Management Committee (ALMC), chaired by the Chief Financial
Offi cer, is the governing body for the establishment and subsequent execution of the
Nestlé Group’s Financial Asset and Liability Management Policy. It ensures implementation
of strategies and achievement of objectives of the Group’s fi nancial asset and liabilities
management, which are executed by the Center Treasury, the Regional Treasury Centers
and, in specifi c local circumstances, by the subsidiaries. Approved treasury management
guidelines defi ne and classify risks as well as determine, by category of transaction, specifi c
approval, execution and monitoring procedures. The activities of the Centre Treasury and
of the Regional Treasury Centers are monitored by an independent Middle Offi ce, which
verifi es the compliance of the strategies and/or operations with the approved guidelines
and decisions taken by the ALMC.
12.2a Credit risk
Credit risk managementCredit risk refers to the risk that a counterparty will default on its contractual obligations
resulting in fi nancial loss to the Group. Credit risk arises on fi nancial assets (liquid, non-
current and derivative) and on trade and other receivables.
The Group aims to minimize the credit risk of liquid assets, non-current fi nancial assets
and derivative assets through the application of risk manage ment policies. Credit limits
are set based on each counterparty’s size and risk of default. The methodology used to set
the credit limit considers the counterparty’s balance sheet, credit ratings, risk ratios and
default probabilities. Counterparties are monitored regularly, taking into consideration
the evolution of the above parameters, as well as their share prices and credit default
swaps. As a result of this review, changes on credit limits and risk allocation are carried
out. The Group avoids the concentration of credit risk on its liquid assets by spreading
them over several institutions and sectors.
Trade receivables are subject to credit limits, control and approval procedures in all
the subsidiaries. Due to its large geographic base and number of customers, the Group
is not exposed to material concentrations of credit risk on its trade receivables (see
Note 7.1). Nevertheless, commercial counterparties are constantly monitored following
the similar methodology used for fi nancial counterparties.
The maximum exposure to credit risk resulting from fi nancial activities, without
considering netting agreements and without taking into account any collateral held or
other credit enhancements, is equal to the carrying amount of the Group’s fi nancial assets.
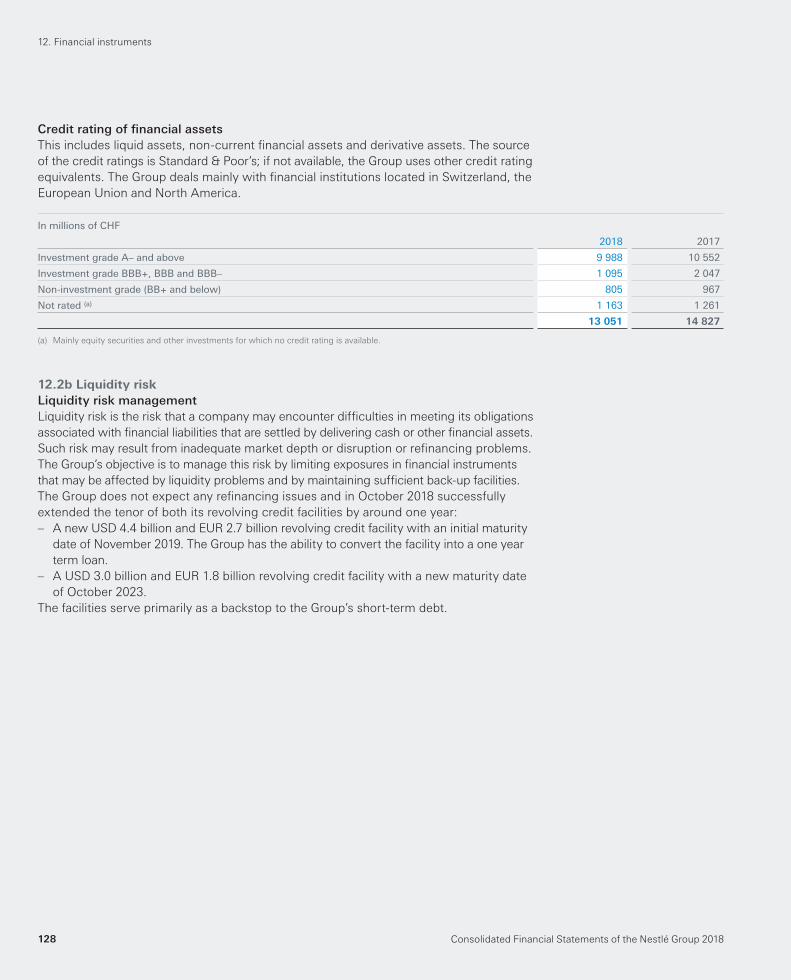
Consolidated Financial Statements of the Nestlé Group 2018128
12. Financial instruments
Credit rating of fi nancial assetsThis includes liquid assets, non-current fi nancial assets and derivative assets. The source
of the credit ratings is Standard & Poor’s; if not available, the Group uses other credit rating
equivalents. The Group deals mainly with fi nancial institutions located in Switzerland, the
European Union and North America.
In millions of CHF
2018 2017
Investment grade A– and above 9 988 10 552
Investment grade BBB+, BBB and BBB– 1 095 2 047
Non-investment grade (BB+ and below) 805 967
Not rated (a) 1 163 1 261
13 051 14 827
(a) Mainly equity securities and other investments for which no credit rating is available.
12.2b Liquidity risk
Liquidity risk managementLiquidity risk is the risk that a company may encounter diffi culties in meeting its obligations
associated with fi nancial liabilities that are settled by delivering cash or other fi nancial assets.
Such risk may result from inadequate market depth or disruption or refi nancing problems.
The Group’s objective is to manage this risk by limiting exposures in fi nancial instruments
that may be affected by liquidity problems and by maintaining suffi cient back-up facilities.
The Group does not expect any refi nancing issues and in October 2018 successfully
extended the tenor of both its revolving credit facilities by around one year:
– A new USD 4.4 billion and EUR 2.7 billion revolving credit facility with an initial maturity
date of November 2019. The Group has the ability to convert the facility into a one year
term loan.
– A USD 3.0 billion and EUR 1.8 billion revolving credit facility with a new maturity date
of October 2023.
The facilities serve primarily as a backstop to the Group’s short-term debt.
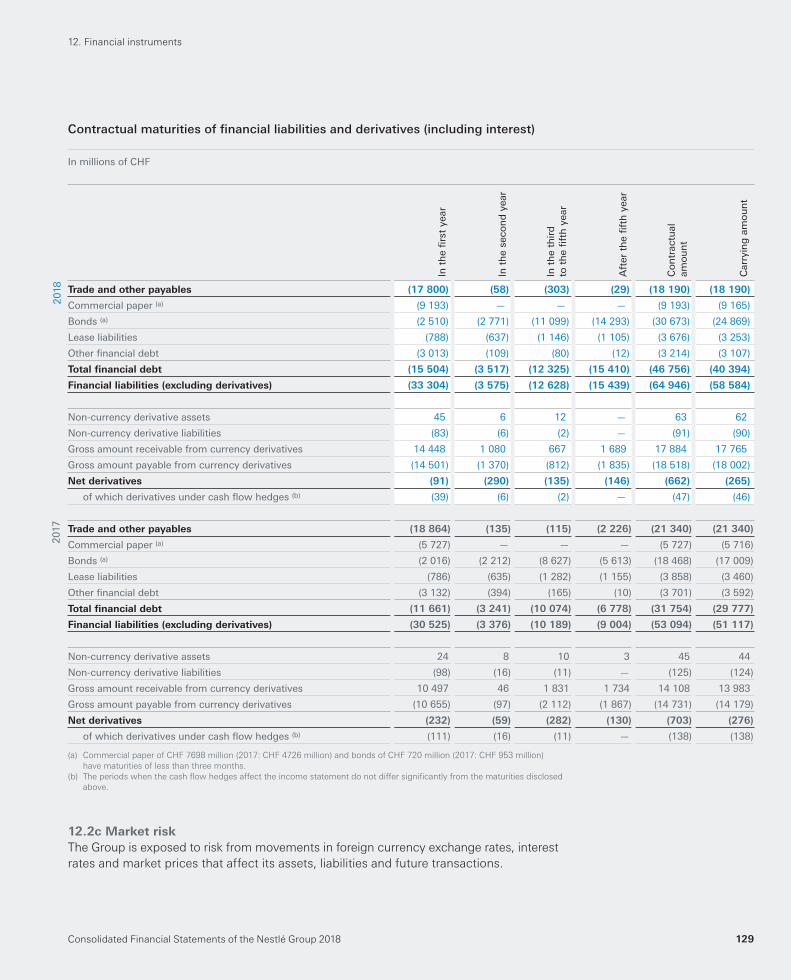
Consolidated Financial Statements of the Nestlé Group 2018 129
Contractual maturities of fi nancial liabilities and derivatives (including interest)
In millions of CHF
In t
he
fi rs
t ye
ar
In t
he
seco
nd
yea
r
In t
he
thir
dto
th
e fi
fth
yea
r
Aft
er t
he
fi ft
h y
ear
Co
ntr
actu
al
amo
un
t
Car
ryin
g a
mo
un
t
Trade and other payables (17 800) (58) (303) (29) (18 190) (18 190)
Commercial paper (a) (9 193) — — — (9 193) (9 165)
Bonds (a) (2 510) (2 771) (11 099) (14 293) (30 673) (24 869)
Lease liabilities (788) (637) (1 146) (1 105) (3 676) (3 253)
Other fi nancial debt (3 013) (109) (80) (12) (3 214) (3 107)
Total fi nancial debt (15 504) (3 517) (12 325) (15 410) (46 756) (40 394)
Financial liabilities (excluding derivatives) (33 304) (3 575) (12 628) (15 439) (64 946) (58 584)
Non-currency derivative assets 45 6 12 — 63 62
Non-currency derivative liabilities (83) (6) (2) — (91) (90)
Gross amount receivable from currency derivatives 14 448 1 080 667 1 689 17 884 17 765
Gross amount payable from currency derivatives (14 501) (1 370) (812) (1 835) (18 518) (18 002)
Net derivatives (91) (290) (135) (146) (662) (265)
of which derivatives under cash fl ow hedges (b) (39) (6) (2) — (47) (46)
Trade and other payables (18 864) (135) (115) (2 226) (21 340) (21 340)
Commercial paper (a) (5 727) — — — (5 727) (5 716)
Bonds (a) (2 016) (2 212) (8 627) (5 613) (18 468) (17 009)
Lease liabilities (786) (635) (1 282) (1 155) (3 858) (3 460)
Other fi nancial debt (3 132) (394) (165) (10) (3 701) (3 592)
Total fi nancial debt (11 661) (3 241) (10 074) (6 778) (31 754) (29 777)
Financial liabilities (excluding derivatives) (30 525) (3 376) (10 189) (9 004) (53 094) (51 117)
Non-currency derivative assets 24 8 10 3 45 44
Non-currency derivative liabilities (98) (16) (11) — (125) (124)
Gross amount receivable from currency derivatives 10 497 46 1 831 1 734 14 108 13 983
Gross amount payable from currency derivatives (10 655) (97) (2 112) (1 867) (14 731) (14 179)
Net derivatives (232) (59) (282) (130) (703) (276)
of which derivatives under cash fl ow hedges (b) (111) (16) (11) — (138) (138)
(a) Commercial paper of CHF 7698 million (2017: CHF 4726 million) and bonds of CHF 720 million (2017: CHF 953 million)
have maturities of less than three months.
(b) The periods when the cash fl ow hedges affect the income statement do not differ signifi cantly from the maturities disclosed
above.
12.2c Market risk
The Group is exposed to risk from movements in foreign currency exchange rates, interest
rates and market prices that affect its assets, liabilities and future transactions.
12. Financial instruments
201
82
017
Consolidated Financial Statements of the Nestlé Group 2018130
Foreign currency riskThe Group is exposed to foreign currency risk from transactions and translation.
Transactional exposures arise from transactions in foreign currency. They are managed
within a prudent and systematic hedging policy in accordance with the Group’s specifi c
business needs through the use of currency forwards, futures, swaps and options.
Exchange differences recorded in the income statement represented a loss
of CHF 54 million in 2018 ( 2017 : loss of CHF 94 million ). They are allocated to the
appropriate headings of expenses by function.
Translation exposure arises from the consolidation of the fi nancial statements of foreign
operations in Swiss Francs, which is, in principle, not hedged.
Value at Risk (VaR) based on historic data for a 250-day period and a confi dence level
of 95% results in a potential one-day loss for currency risk of less than CHF 10 million
in 2018 and 2017.
The Group cannot predict the future movements in exchange rates, therefore the above
VaR number neither represents actual losses nor considers the effects of favorable
movements in underlying variables. Accordingly, the VaR number may only be considered
indicative of future movements to the extent the historic market patterns repeat in the
future.
Interest rate riskThe Group is exposed primarily to fl uctuation in USD and EUR interest rates. Interest rate
risk on fi nancial debt is managed based on duration and interest management targets set
by the ALMC through the use of fi xed rate debt and interest rate swaps.
Taking into account the impact of interest derivatives, the proportion of fi nancial debt
subject to fi xed interest rates for a period longer than one year represents 62% ( 2017 : 62% ).
Based on the structure of net debt at year end, an increase of interest rates of 100 basis
points would cause an additional expense in Net fi nancing cost of net debt of CHF 42 million
( 2017 : CHF 29 million ).
Price riskCommodity price riskCommodity price risk arises from transactions on the world commodity markets for
securing the supplies of green coffee, cocoa beans and other commodities necessary
for the manu facture of some of the Group’s products.
The Group’s objective is to minimize the impact of commodity price fl uctuations and
this exposure is hedged in accordance with the Nestlé Group policy on commodity price
risk management. The Global Procurement Organization is responsible for managing
commodity price risk based on internal directives and centrally determined limits,
generally using exchange-traded commodity derivatives. The commodity price risk
exposure of future purchases is managed using a combination of derivatives (mainly
futures and options) and executory contracts. This activity is monitored by an independent
Middle Offi ce. Given the short product business cycle of the Group, the majority of the
anticipated future raw material transactions outstanding at the balance sheet date are
expected to occur in the next year.
Equity price riskThe Group is exposed to equity price risk on investments. To manage the price risk
arising from these investments, the Group diversifi es its portfolios in accordance with
the Guidelines set by the Board of Directors.
12. Financial instruments
Consolidated Financial Statements of the Nestlé Group 2018 131
12.2d Derivative assets and liabilities and hedge accounting
Derivative fi nancial instrumentsThe Group’s derivatives mainly consist of currency forwards, options and swaps;
commodity futures and options; interest rate forwards, futures, options and swaps.
Derivatives are mainly used to manage exposures to foreign exchange, interest rate
and commodity price risk as described in section 12.2c Market risk.
Derivatives are initially recognized at fair value. They are subsequently remeasured
at fair value on a regular basis and at each reporting date as a minimum, with all their
gains and losses, realized and unrealized, recognized in the income statement unless
they are in a qualifying hedging relationship.
Hedge accountingThe Group designates and documents the use of certain derivatives and other fi nancial
assets or fi nancial liabilities as hedging instruments against changes in fair values of
recognized assets and liabilities (fair value hedges) and highly probable forecast
transactions (cash fl ow hedges). The effectiveness of such hedges is assessed at
inception and verifi ed at regular intervals and at least on a quarterly basis to ensure
that an economic relationship exists between the hedged item and hedging instrument.
The Group excludes from the designation of the hedging relationship the hedging
cost element. Subsequently, this cost element impacts the income statement at the
same time as the underlying hedged item.
For the designation of hedging relationships on commodities, the Group applies
the component hedging model when the hedged item is separately identifi able and
measurable in the contract to purchase the materials.
Fair value hedgesThe Group uses fair value hedges to mitigate foreign currency and interest rate risks
of its recognized assets and liabilities, being mostly fi nancial debt.
Changes in fair values of hedging instruments designated as fair value hedges and
the adjustments for the risks being hedged in the carrying amounts of the underlying
transactions are recognized in the income statement.
Cash fl ow hedgesThe Group uses cash fl ow hedges to mitigate a particular risk associated with
a recognized asset or liability or highly probable forecast transactions, such as
anticipated future export sales, purchases of equipment, and goods, as well as the
variability of expected interest payments and receipts.
The effective part of the changes in fair value of hedging instruments is recognized
in other comprehensive income, while any ineffective part is recognized immediately
in the income statement. Ineffectiveness for hedges of foreign currency and commodity
price risk may result from changes in the timing of the forecast transactions than was
originally foreseen. When the hedged item results in the recognition of a non-fi nancial
asset or liability, including acquired businesses, the gains or losses previously recognized
in other comprehensive income are included in the measurement of the cost of the
asset or of the liability. Otherwise the gains or losses previously recognized in other
comprehensive income are recognized in the income statement at the same time
as the hedged transaction.
12. Financial instruments
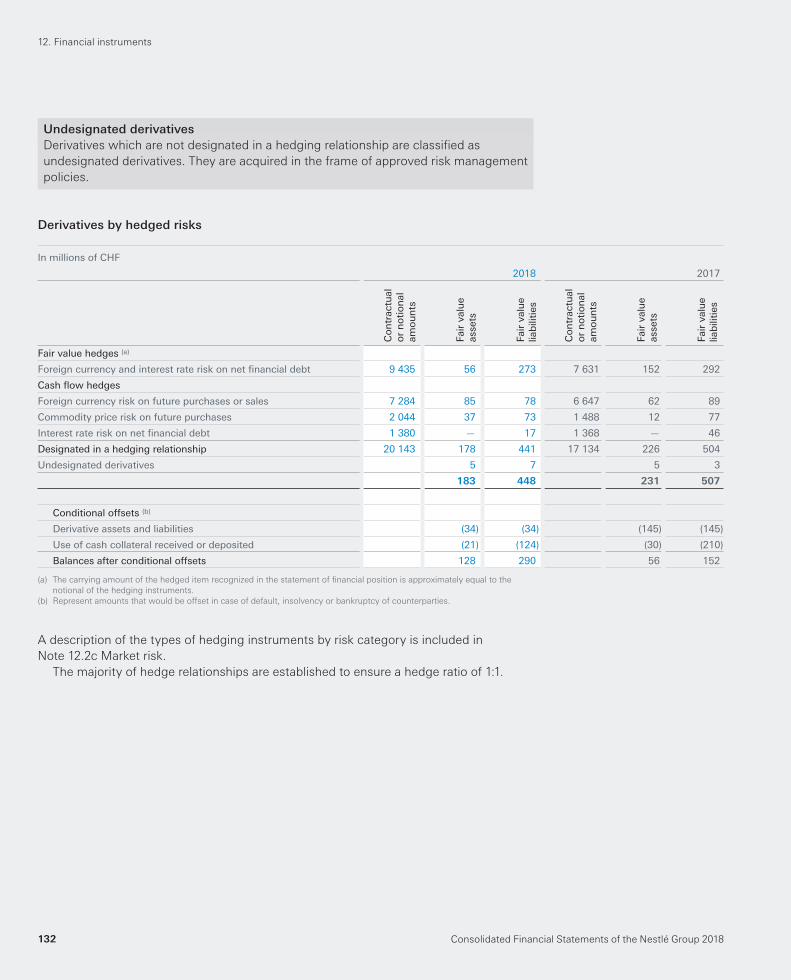
Consolidated Financial Statements of the Nestlé Group 2018132
Undesignated derivativesDerivatives which are not designated in a hedging relationship are classifi ed as
undesignated derivatives. They are acquired in the frame of approved risk management
policies.
Derivatives by hedged risks
In millions of CHF
2018 2017
Co
ntr
actu
alo
r n
oti
on
alam
ou
nts
Fair
val
ue
asse
ts
Fair
val
ue
liab
iliti
es
Co
ntr
actu
alo
r n
oti
on
alam
ou
nts
Fair
val
ue
asse
ts
Fair
val
ue
liab
iliti
es
Fair value hedges (a)
Foreign currency and interest rate risk on net fi nancial debt 9 435 56 273 7 631 152 292
Cash fl ow hedges
Foreign currency risk on future purchases or sales 7 284 85 78 6 647 62 89
Commodity price risk on future purchases 2 044 37 73 1 488 12 77
Interest rate risk on net fi nancial debt 1 380 — 17 1 368 — 46
Designated in a hedging relationship 20 143 178 441 17 134 226 504
Undesignated derivatives 5 7 5 3
183 448 231 507
Conditional offsets (b)
Derivative assets and liabilities (34) (34) (145) (145)
Use of cash collateral received or deposited (21) (124) (30) (210)
Balances after conditional offsets 128 290 56 152
(a) The carrying amount of the hedged item recognized in the statement of fi nancial position is approximately equal to the
notional of the hedging instruments.
(b) Represent amounts that would be offset in case of default, insolvency or bankruptcy of counterparties.
A description of the types of hedging instruments by risk category is included in
Note 12.2c Market risk.
The majority of hedge relationships are established to ensure a hedge ratio of 1:1.
12. Financial instruments
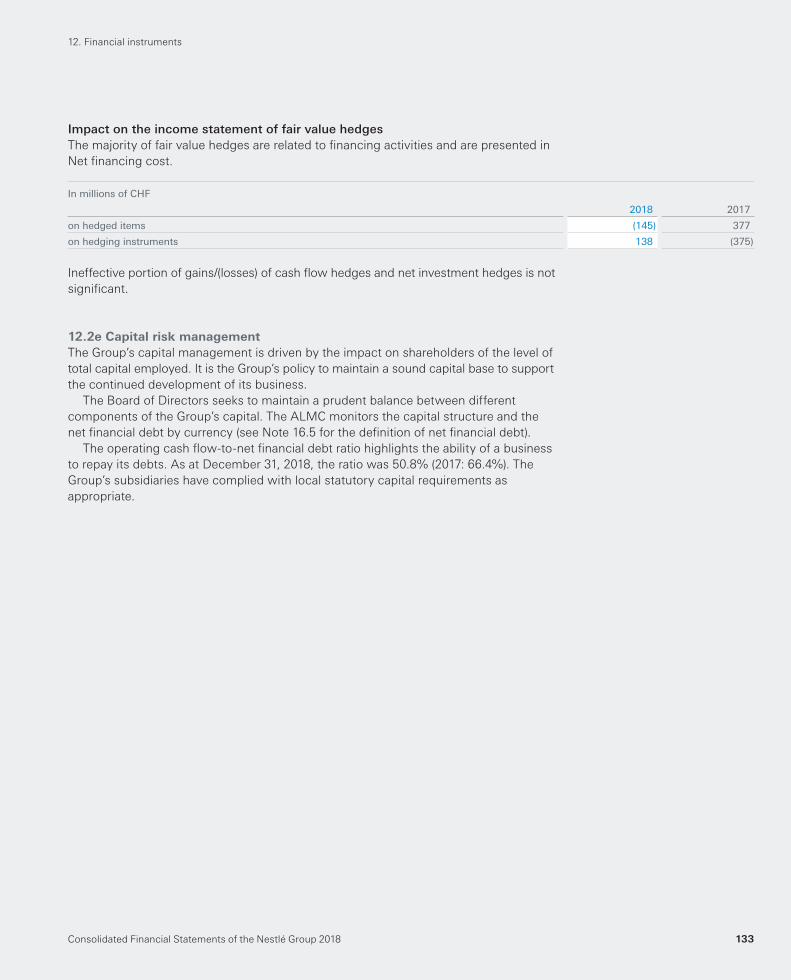
Consolidated Financial Statements of the Nestlé Group 2018 133
Impact on the income statement of fair value hedgesThe majority of fair value hedges are related to fi nancing activities and are presented in
Net fi nancing cost.
In millions of CHF
2018 2017
on hedged items (145) 377
on hedging instruments 138 (375)
Ineffective portion of gains/(losses) of cash fl ow hedges and net investment hedges is not
signifi cant.
12.2e Capital risk management
The Group’s capital management is driven by the impact on shareholders of the level of
total capital employed. It is the Group’s policy to maintain a sound capital base to support
the continued development of its business.
The Board of Directors seeks to maintain a prudent balance between different
components of the Group’s capital. The ALMC monitors the capital structure and the
net fi nancial debt by currency (see Note 16.5 for the defi nition of net fi nancial debt).
The operating cash fl ow-to-net fi nancial debt ratio highlights the ability of a business
to repay its debts. As at December 31, 2018 , the ratio was 50.8% ( 2017 : 66.4% ). The
Group’s subsidiaries have complied with local statutory capital requirements as
appropriate.
12. Financial instruments
Consolidated Financial Statements of the Nestlé Group 2018134
13. Taxes
The Group is subject to taxes in different countries all over the world. Taxes and fi scal
risks recognized in the Consolidated Financial Statements refl ect Group Management’s
best estimate of the outcome based on the facts known at the balance sheet date in
each individual country. These facts may include but are not limited to change in tax
laws and interpretation thereof in the various jurisdictions where the Group operates.
They may have an impact on the income tax as well as the resulting assets and
liabilities. Any differences between tax estimates and fi nal tax assessments are
charged to the income statement in the period in which they are incurred, unless
anticipated.
Taxes include current and deferred taxes on profi t as well as actual or potential
withholding taxes on current and expected transfers of income from subsidiaries and
tax adjustments relating to prior years. Income tax is recognized in the income
statement, except to the extent that it relates to items directly taken to equity or other
comprehensive income, in which case it is recognized against equity or other
comprehensive income.
Deferred taxes are based on the temporary differences that arise when taxation
authorities recognize and measure assets and liabilities with rules that differ from the
principles of the Consolidated Financial Statements. They also arise on temporary
differences stemming from tax losses carried forward.
Deferred taxes are calculated under the liability method at the rates of tax expected
to prevail when the temporary differences reverse subject to such rates being
substantially enacted at the balance sheet date. Any changes of the tax rates are
recognized in the income statement unless related to items directly recognized against
equity or other comprehensive income. Deferred tax liabilities are recognized on all
taxable temporary differences excluding non-deductible goodwill. Deferred tax assets
are recognized on all deductible temporary differences provided that it is probable that
future taxable income will be available.
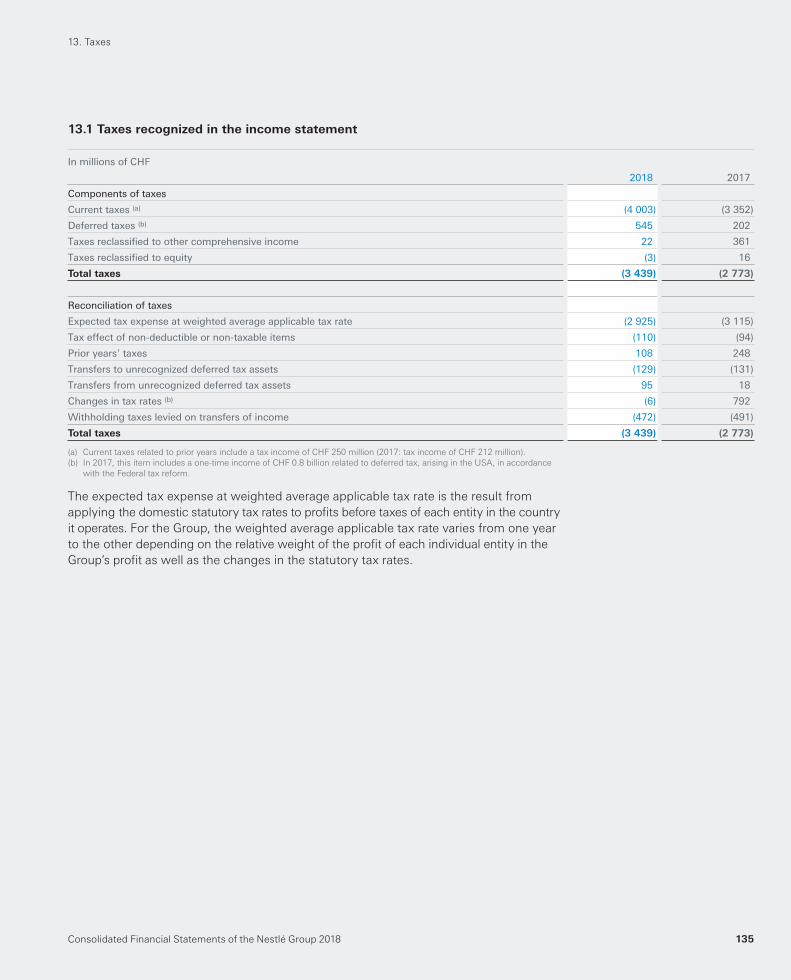
Consolidated Financial Statements of the Nestlé Group 2018 135
13. Taxes
13.1 Taxes recognized in the income statement
In millions of CHF
2018 2017
Components of taxes
Current taxes (a) (4 003) (3 352)
Deferred taxes (b) 545 202
Taxes reclassifi ed to other comprehensive income 22 361
Taxes reclassifi ed to equity (3) 16
Total taxes (3 439) (2 773)
Reconciliation of taxes
Expected tax expense at weighted average applicable tax rate (2 925) (3 115)
Tax effect of non-deductible or non-taxable items (110) (94)
Prior years’ taxes 108 248
Transfers to unrecognized deferred tax assets (129) (131)
Transfers from unrecognized deferred tax assets 95 18
Changes in tax rates (b) (6) 792
Withholding taxes levied on transfers of income (472) (491)
Total taxes (3 439) (2 773)
(a) Current taxes related to prior years include a tax income of CHF 250 million (2017: tax income of CHF 212 million).
(b) In 2017, this item includes a one-time income of CHF 0.8 billion related to deferred tax, arising in the USA, in accordance
with the Federal tax reform.
The expected tax expense at weighted average applicable tax rate is the result from
applying the domestic statutory tax rates to profi ts before taxes of each entity in the country
it operates. For the Group, the weighted average applicable tax rate varies from one year
to the other depending on the relative weight of the profi t of each individual entity in the
Group’s profi t as well as the changes in the statutory tax rates.
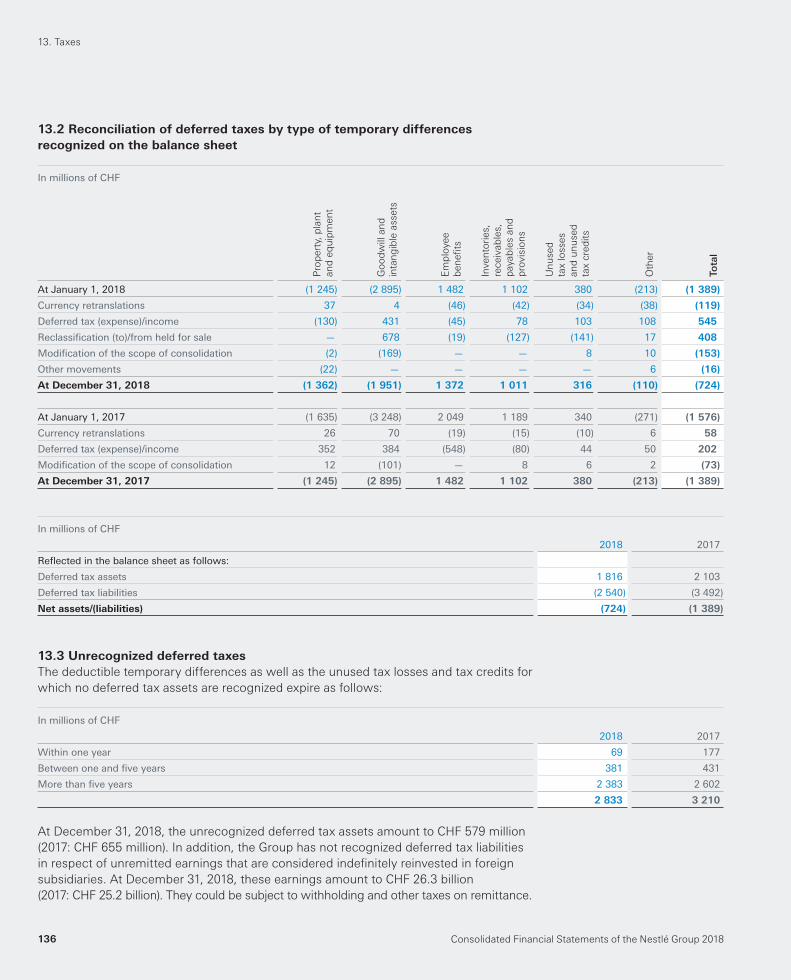
Consolidated Financial Statements of the Nestlé Group 2018136
13.2 Reconciliation of deferred taxes by type of temporary differences
recognized on the balance sheet
In millions of CHF
Pro
pert
y, p
lan
t
an
d e
qu
ipm
en
t
Go
od
will an
d
inta
ng
ible
assets
Em
plo
yee
ben
efi ts
Inven
tori
es,
receiv
ab
les,
payab
les a
nd
pro
vis
ion
s
Un
used
tax lo
sses
an
d u
nu
sed
tax c
red
its
Oth
er
Tota
l
At January 1, 2018 (1 245) (2 895) 1 482 1 102 380 (213) (1 389)
Currency retranslations 37 4 (46) (42) (34) (38) (119)
Deferred tax (expense)/income (130) 431 (45) 78 103 108 545
Reclassifi cation (to)/from held for sale — 678 (19) (127) (141) 17 408
Modifi cation of the scope of consolidation (2) (169) — — 8 10 (153)
Other movements (22) — — — — 6 (16)
At December 31, 2018 (1 362) (1 951) 1 372 1 011 316 (110) (724)
At January 1, 2017 (1 635) (3 248) 2 049 1 189 340 (271) (1 576)
Currency retranslations 26 70 (19) (15) (10) 6 58
Deferred tax (expense)/income 352 384 (548) (80) 44 50 202
Modifi cation of the scope of consolidation 12 (101) — 8 6 2 (73)
At December 31, 2017 (1 245) (2 895) 1 482 1 102 380 (213) (1 389)
In millions of CHF
2018 2017
Refl ected in the balance sheet as follows:
Deferred tax assets 1 816 2 103
Deferred tax liabilities (2 540) (3 492)
Net assets/(liabilities) (724) (1 389)
13.3 Unrecognized deferred taxes
The deductible temporary differences as well as the unused tax losses and tax credits for
which no deferred tax assets are recognized expire as follows:
In millions of CHF
2018 2017
Within one year 69 177
Between one and fi ve years 381 431
More than fi ve years 2 383 2 602
2 833 3 210
At December 31, 2018 , the unrecognized deferred tax assets amount to CHF 579 million
( 2017 : CHF 655 million ). In addition, the Group has not recognized deferred tax liabilities
in respect of unremitted earnings that are considered indefi nitely reinvested in foreign
subsidiaries. At December 31, 2018 , these earnings amount to CHF 26.3 billion
( 2017 : CHF 25.2 billion ). They could be subject to withholding and other taxes on remittance.
13. Taxes
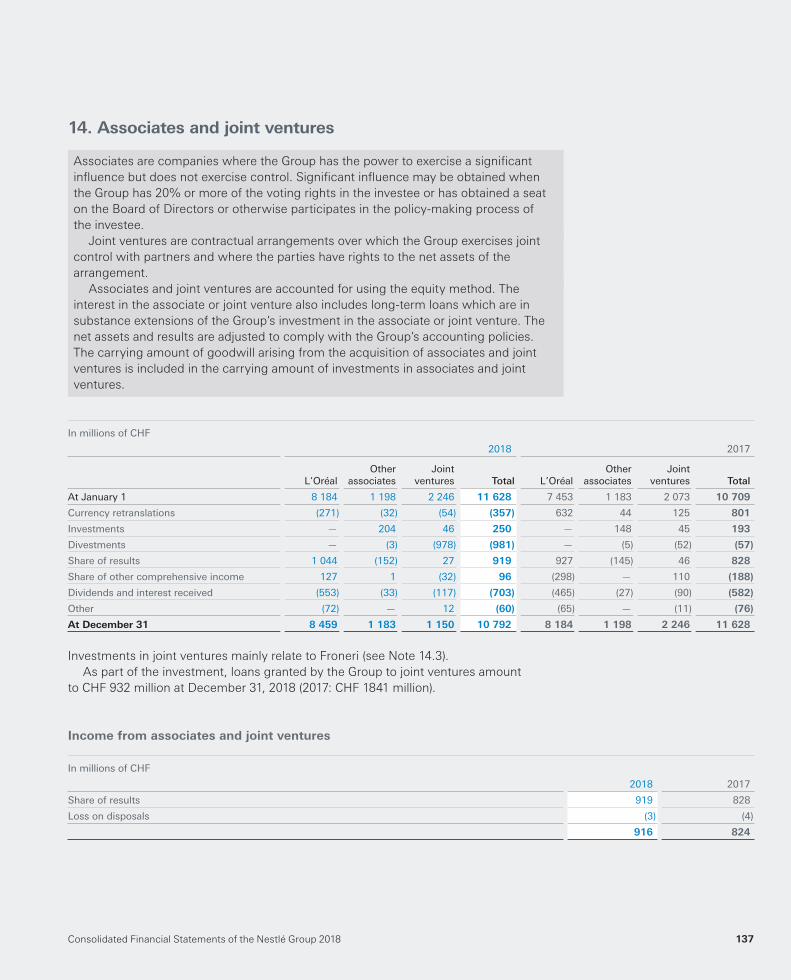
Consolidated Financial Statements of the Nestlé Group 2018 137
14. Associates and joint ventures
Associates are companies where the Group has the power to exercise a signifi cant
infl uence but does not exercise control. Signifi cant infl uence may be obtained when
the Group has 20% or more of the voting rights in the investee or has obtained a seat
on the Board of Directors or otherwise participates in the policy-making process of
the investee.
Joint ventures are contractual arrangements over which the Group exercises joint
control with partners and where the parties have rights to the net assets of the
arrangement.
Associates and joint ventures are accounted for using the equity method. The
interest in the associate or joint venture also includes long-term loans which are in
substance extensions of the Group’s investment in the associate or joint venture. The
net assets and results are adjusted to comply with the Group’s accounting policies.
The carrying amount of goodwill arising from the acquisition of associates and joint
ventures is included in the carrying amount of investments in associates and joint
ventures.
In millions of CHF
2018 2017
L’OréalOther
associatesJoint
ventures Total L’OréalOther
associatesJoint
ventures Total
At January 1 8 184 1 198 2 246 11 628 7 453 1 183 2 073 10 709
Currency retranslations (271) (32) (54) (357) 632 44 125 801
Investments — 204 46 250 — 148 45 193
Divestments — (3) (978) (981) — (5) (52) (57)
Share of results 1 044 (152) 27 919 927 (145) 46 828
Share of other comprehensive income 127 1 (32) 96 (298) — 110 (188)
Dividends and interest received (553) (33) (117) (703) (465) (27) (90) (582)
Other (72) — 12 (60) (65) — (11) (76)
At December 31 8 459 1 183 1 150 10 792 8 184 1 198 2 246 11 628
Investments in joint ventures mainly relate to Froneri (see Note 14.3).
As part of the investment, loans granted by the Group to joint ventures amount
to CHF 932 million at December 31, 2018 ( 2017 : CHF 1841 million ).
Income from associates and joint ventures
In millions of CHF
2018 2017
Share of results 919 828
Loss on disposals (3) (4)
916 824
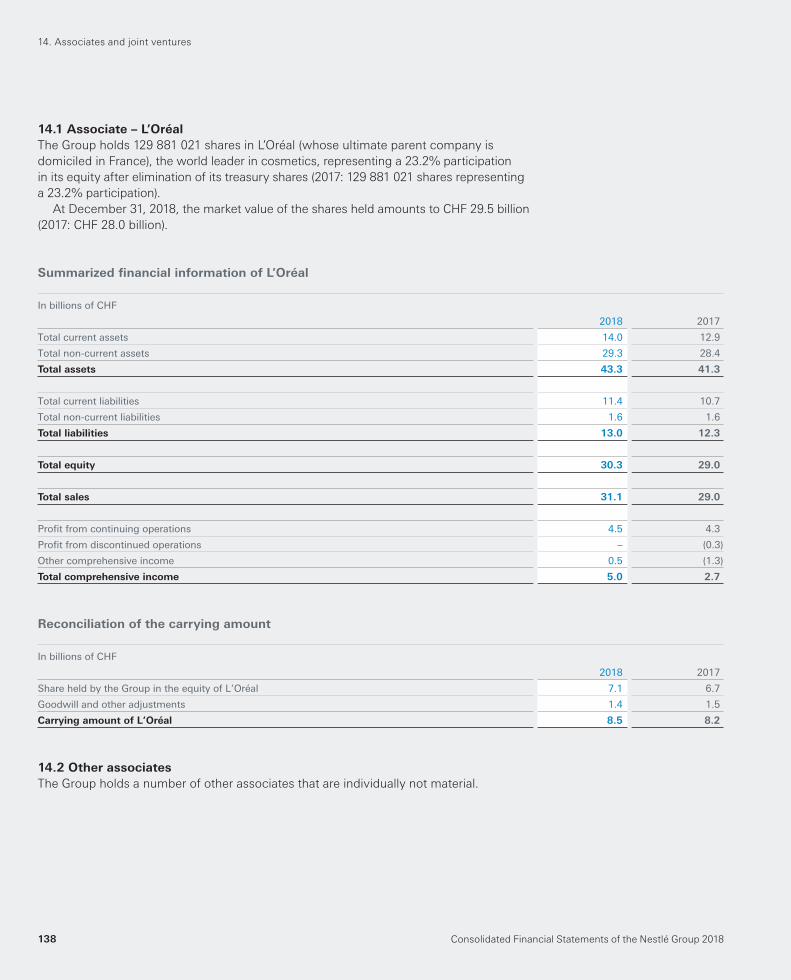
Consolidated Financial Statements of the Nestlé Group 2018138
14.1 Associate – L’Oréal
The Group holds 129 881 021 shares in L’Oréal (whose ultimate parent company is
domiciled in France), the world leader in cosmetics, representing a 23.2% participation
in its equity after elimination of its treasury shares ( 2017 : 129 881 021 shares representing
a 23.2% participation).
At December 31, 2018 , the market value of the shares held amounts to CHF 29.5 billion
( 2017 : CHF 28.0 billion ).
Summarized fi nancial information of L’Oréal
In billions of CHF
2018 2017
Total current assets 14.0 12.9
Total non-current assets 29.3 28.4
Total assets 43.3 41.3
Total current liabilities 11.4 10.7
Total non-current liabilities 1.6 1.6
Total liabilities 13.0 12.3
Total equity 30.3 29.0
Total sales 31.1 29.0
Profi t from continuing operations 4.5 4.3
Profi t from discontinued operations – (0.3)
Other comprehensive income 0.5 (1.3)
Total comprehensive income 5.0 2.7
Reconciliation of the carrying amount
In billions of CHF
2018 2017
Share held by the Group in the equity of L’Oréal 7.1 6.7
Goodwill and other adjustments 1.4 1.5
Carrying amount of L’Oréal 8.5 8.2
14.2 Other associates
The Group holds a number of other associates that are individually not material.
14. Associates and joint ventures
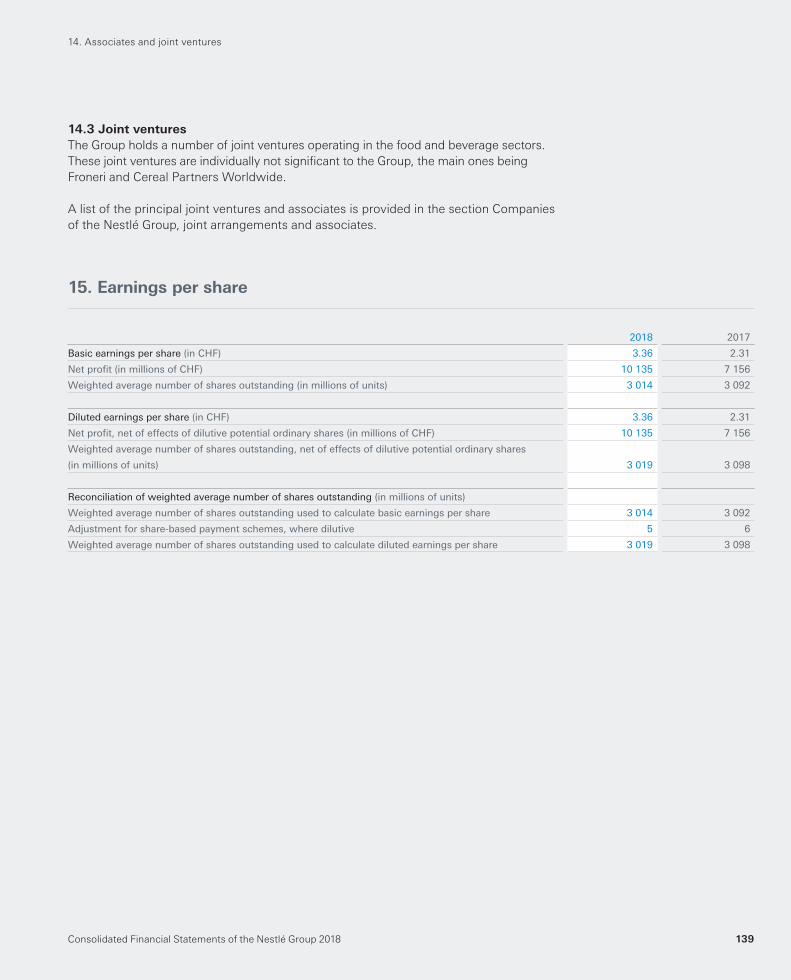
Consolidated Financial Statements of the Nestlé Group 2018 139
14.3 Joint ventures
The Group holds a number of joint ventures operating in the food and beverage sectors.
These joint ventures are individually not signifi cant to the Group, the main ones being
Froneri and Cereal Partners Worldwide.
A list of the principal joint ventures and associates is provided in the section Companies
of the Nestlé Group, joint arrangements and associates.
15. Earnings per share
2018 2017
Basic earnings per share (in CHF) 3.36 2.31
Net profi t (in millions of CHF) 10 135 7 156
Weighted average number of shares outstanding (in millions of units) 3 014 3 092
Diluted earnings per share (in CHF) 3.36 2.31
Net profi t, net of effects of dilutive potential ordinary shares (in millions of CHF) 10 135 7 156
Weighted average number of shares outstanding, net of effects of dilutive potential ordinary shares
(in millions of units) 3 019 3 098
Reconciliation of weighted average number of shares outstanding (in millions of units)
Weighted average number of shares outstanding used to calculate basic earnings per share 3 014 3 092
Adjustment for share-based payment schemes, where dilutive 5 6
Weighted average number of shares outstanding used to calculate diluted earnings per share 3 019 3 098
14. Associates and joint ventures
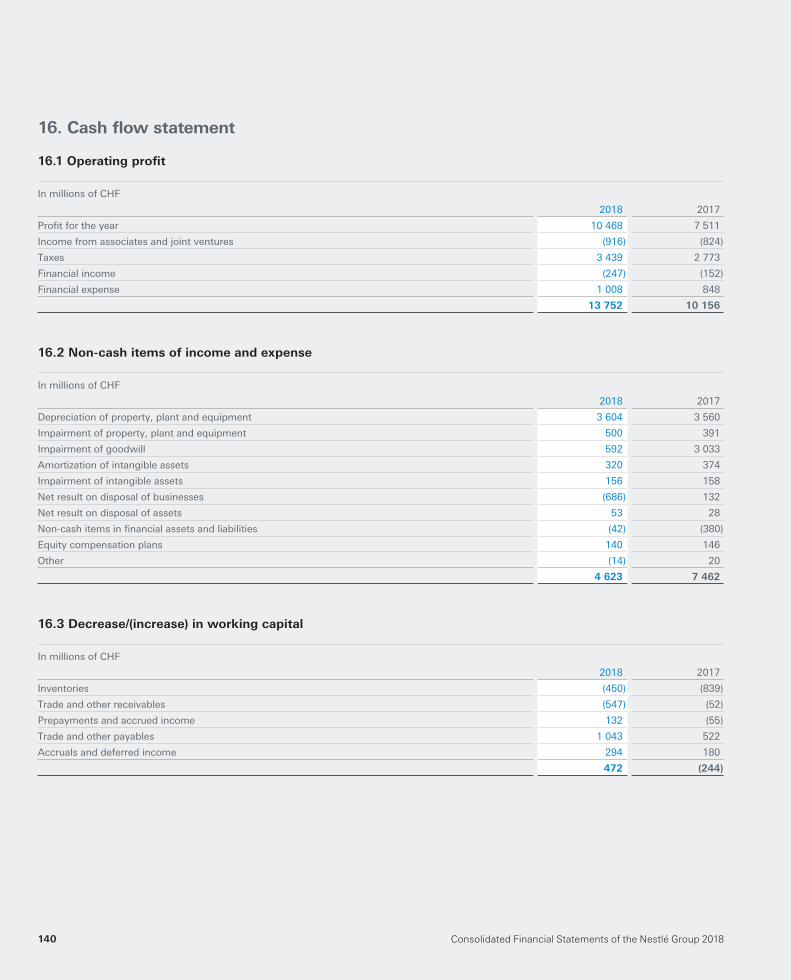
Consolidated Financial Statements of the Nestlé Group 2018140
16. Cash fl ow statement
16.1 Operating profi t
In millions of CHF
2018 2017
Profi t for the year 10 468 7 511
Income from associates and joint ventures (916) (824)
Taxes 3 439 2 773
Financial income (247) (152)
Financial expense 1 008 848
13 752 10 156
16.2 Non-cash items of income and expense
In millions of CHF
2018 2017
Depreciation of property, plant and equipment 3 604 3 560
Impairment of property, plant and equipment 500 391
Impairment of goodwill 592 3 033
Amortization of intangible assets 320 374
Impairment of intangible assets 156 158
Net result on disposal of businesses (686) 132
Net result on disposal of assets 53 28
Non-cash items in fi nancial assets and liabilities (42) (380)
Equity compensation plans 140 146
Other (14) 20
4 623 7 462
16.3 Decrease/(increase) in working capital
In millions of CHF
2018 2017
Inventories (450) (839)
Trade and other receivables (547) (52)
Prepayments and accrued income 132 (55)
Trade and other payables 1 043 522
Accruals and deferred income 294 180
472 (244)
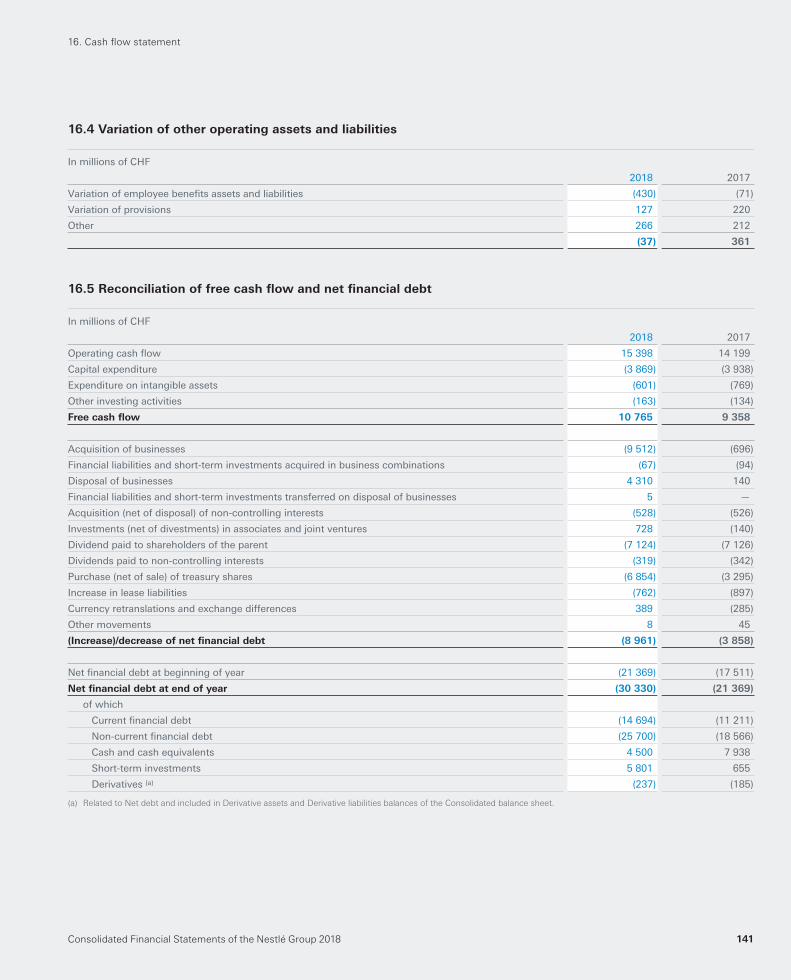
Consolidated Financial Statements of the Nestlé Group 2018 141
16.4 Variation of other operating assets and liabilities
In millions of CHF
2018 2017
Variation of employee benefi ts assets and liabilities (430) (71)
Variation of provisions 127 220
Other 266 212
(37) 361
16.5 Reconciliation of free cash fl ow and net fi nancial debt
In millions of CHF
2018 2017
Operating cash fl ow 15 398 14 199
Capital expenditure (3 869) (3 938)
Expenditure on intangible assets (601) (769)
Other investing activities (163) (134)
Free cash fl ow 10 765 9 358
Acquisition of businesses (9 512) (696)
Financial liabilities and short-term investments acquired in business combinations (67) (94)
Disposal of businesses 4 310 140
Financial liabilities and short-term investments transferred on disposal of businesses 5 —
Acquisition (net of disposal) of non-controlling interests (528) (526)
Investments (net of divestments) in associates and joint ventures 728 (140)
Dividend paid to shareholders of the parent (7 124) (7 126)
Dividends paid to non-controlling interests (319) (342)
Purchase (net of sale) of treasury shares (6 854) (3 295)
Increase in lease liabilities (762) (897)
Currency retranslations and exchange differences 389 (285)
Other movements 8 45
(Increase)/decrease of net fi nancial debt (8 961) (3 858)
Net fi nancial debt at beginning of year (21 369) (17 511)
Net fi nancial debt at end of year (30 330) (21 369)
of which
Current fi nancial debt (14 694) (11 211)
Non-current fi nancial debt (25 700) (18 566)
Cash and cash equivalents 4 500 7 938
Short-term investments 5 801 655
Derivatives (a) (237) (185)
(a) Related to Net debt and included in Derivative assets and Derivative liabilities balances of the Consolidated balance sheet.
16. Cash fl ow statement
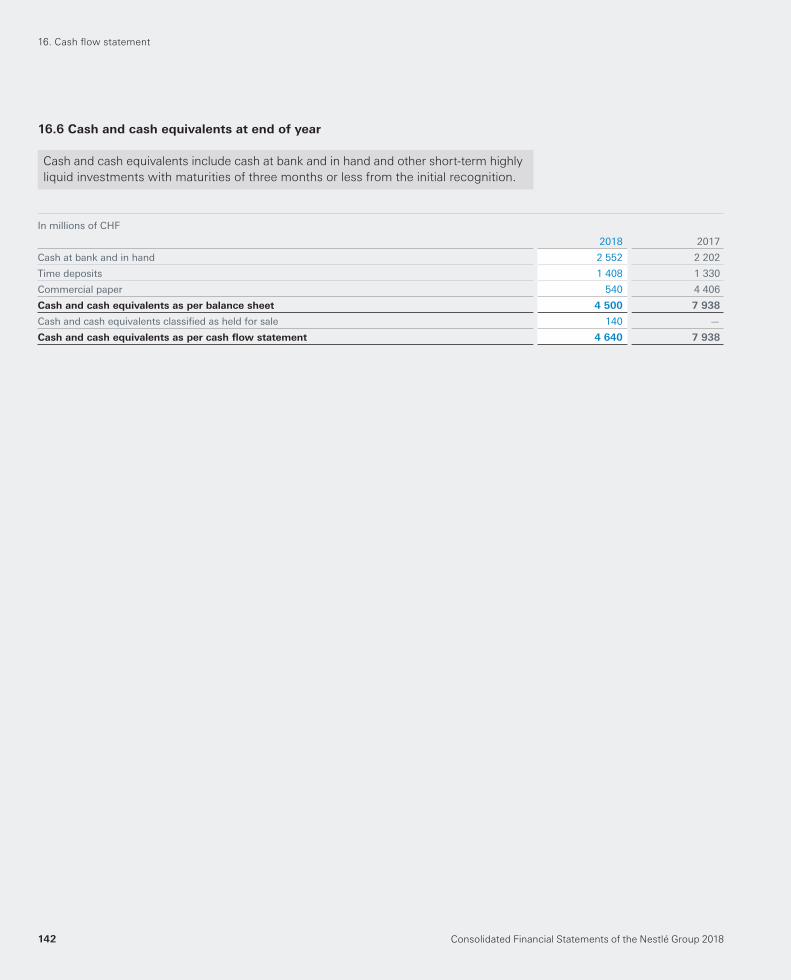
Consolidated Financial Statements of the Nestlé Group 2018142
16.6 Cash and cash equivalents at end of year
Cash and cash equivalents include cash at bank and in hand and other short-term highly
liquid investments with maturities of three months or less from the initial recognition.
In millions of CHF
2018 2017
Cash at bank and in hand 2 552 2 202
Time deposits 1 408 1 330
Commercial paper 540 4 406
Cash and cash equivalents as per balance sheet 4 500 7 938
Cash and cash equivalents classifi ed as held for sale 140 —
Cash and cash equivalents as per cash fl ow statement 4 640 7 938
16. Cash fl ow statement
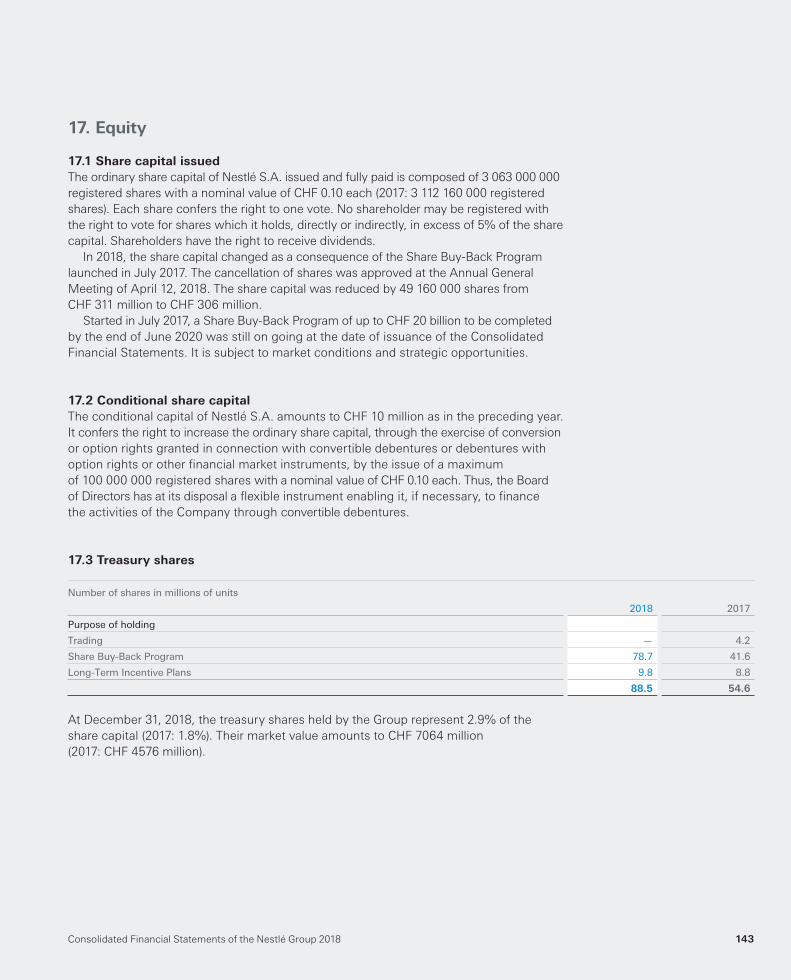
Consolidated Financial Statements of the Nestlé Group 2018 143
17. Equity
17.1 Share capital issued
The ordinary share capital of Nestlé S.A. issued and fully paid is composed of 3 063 000 000
registered shares with a nominal value of CHF 0.10 each ( 2017 : 3 112 160 000 registered
shares). Each share confers the right to one vote. No shareholder may be registered with
the right to vote for shares which it holds, directly or indirectly, in excess of 5% of the share
capital. Shareholders have the right to receive dividends.
In 2018 , the share capital changed as a consequence of the Share Buy-Back Program
launched in July 2017. The cancellation of shares was approved at the Annual General
Meeting of April 12, 2018. The share capital was reduced by 49 160 000 shares from
CHF 311 million to CHF 306 million .
Started in July 2017, a Share Buy-Back Program of up to CHF 20 billion to be completed
by the end of June 2020 was still on going at the date of issuance of the Consolidated
Financial Statements. It is subject to market conditions and strategic opportunities.
17.2 Conditional share capital
The conditional capital of Nestlé S.A. amounts to CHF 10 million as in the preceding year.
It confers the right to increase the ordinary share capital, through the exercise of conversion
or option rights granted in connection with convertible debentures or debentures with
option rights or other fi nancial market instruments, by the issue of a maximum
of 100 000 000 registered shares with a nominal value of CHF 0.10 each. Thus, the Board
of Directors has at its disposal a fl exible instrument enabling it, if necessary, to fi nance
the activities of the Company through convertible debentures.
17.3 Treasury shares
Number of shares in millions of units
2018 2017
Purpose of holding
Trading — 4.2
Share Buy-Back Program 78.7 41.6
Long-Term Incentive Plans 9.8 8.8
88.5 54.6
At December 31, 2018 , the treasury shares held by the Group represent 2.9% of the
share capital ( 2017 : 1.8% ). Their market value amounts to CHF 7064 million
( 2017 : CHF 4576 million ).
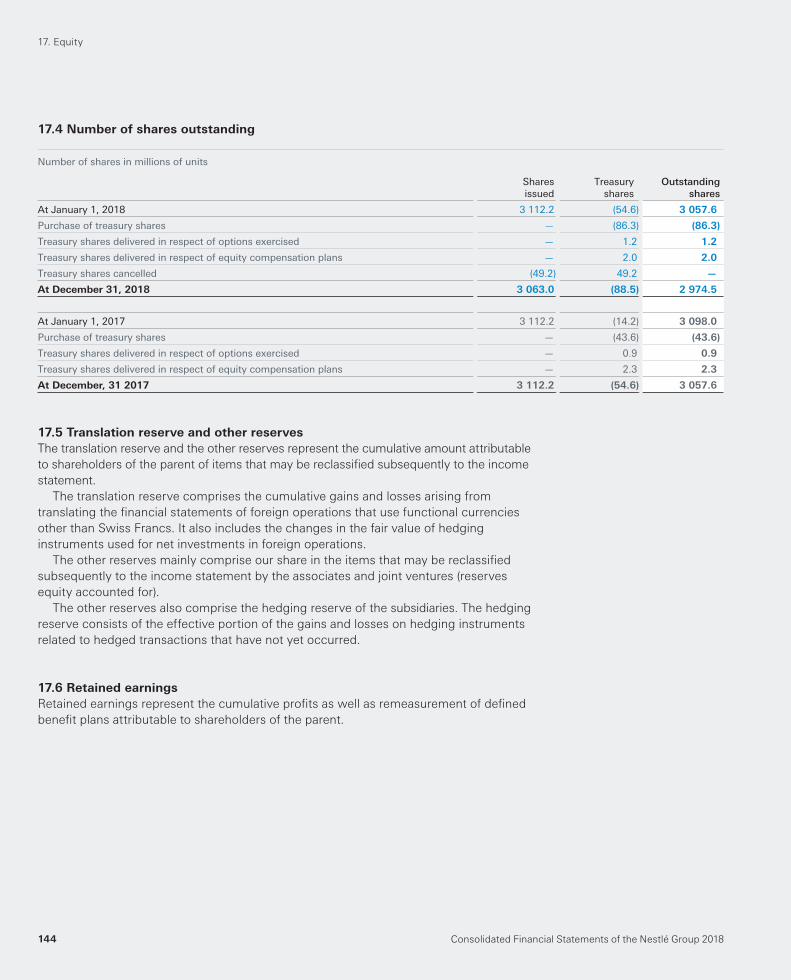
Consolidated Financial Statements of the Nestlé Group 2018144
17.4 Number of shares outstanding
Number of shares in millions of units
Sharesissued
Treasuryshares
Outstandingshares
At January 1, 2018 3 112.2 (54.6) 3 057.6
Purchase of treasury shares — (86.3) (86.3)
Treasury shares delivered in respect of options exercised — 1.2 1.2
Treasury shares delivered in respect of equity compensation plans — 2.0 2.0
Treasury shares cancelled (49.2) 49.2 —
At December 31, 2018 3 063.0 (88.5) 2 974.5
At January 1, 2017 3 112.2 (14.2) 3 098.0
Purchase of treasury shares — (43.6) (43.6)
Treasury shares delivered in respect of options exercised — 0.9 0.9
Treasury shares delivered in respect of equity compensation plans — 2.3 2.3
At December, 31 2017 3 112.2 (54.6) 3 057.6
17.5 Translation reserve and other reserves
The translation reserve and the other reserves represent the cumulative amount attributable
to shareholders of the parent of items that may be reclassifi ed subsequently to the income
statement.
The translation reserve comprises the cumulative gains and losses arising from
translating the fi nancial statements of foreign operations that use functional currencies
other than Swiss Francs. It also includes the changes in the fair value of hedging
instruments used for net investments in foreign operations.
The other reserves mainly comprise our share in the items that may be reclassifi ed
subsequently to the income statement by the associates and joint ventures (reserves
equity accounted for).
The other reserves also comprise the hedging reserve of the subsidiaries. The hedging
reserve consists of the effective portion of the gains and losses on hedging instruments
related to hedged transactions that have not yet occurred.
17.6 Retained earnings
Retained earnings represent the cumulative profi ts as well as remeasurement of defi ned
benefi t plans attributable to shareholders of the parent.
17. Equity
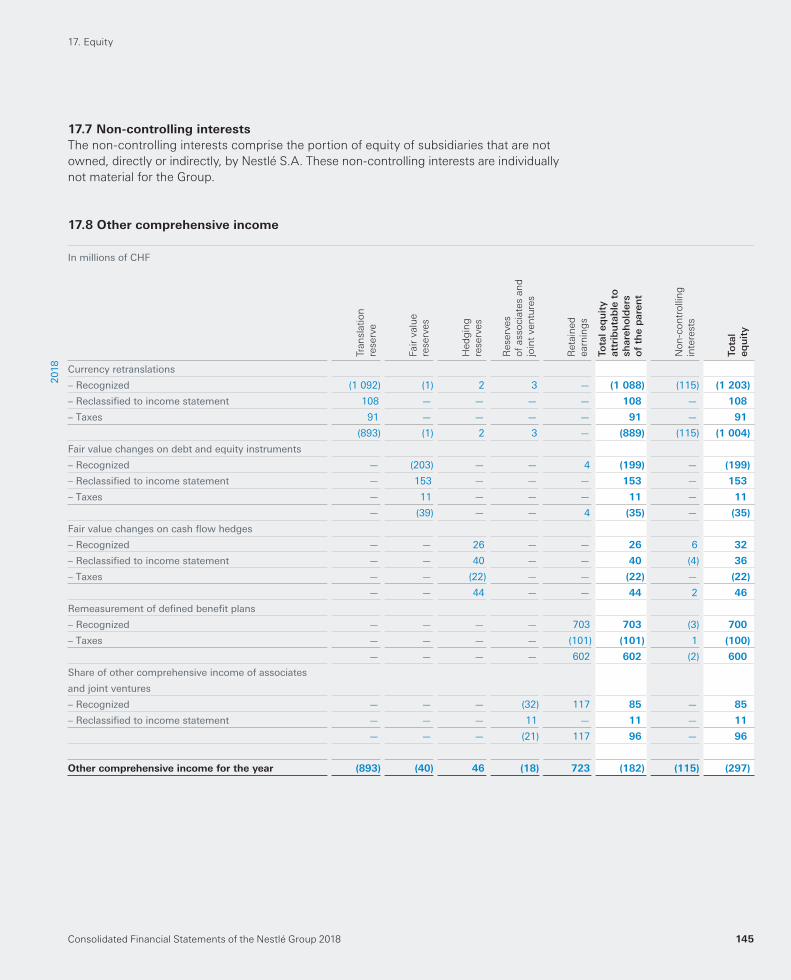
Consolidated Financial Statements of the Nestlé Group 2018 145
17.7 Non-controlling interests
The non-controlling interests comprise the portion of equity of subsidiaries that are not
owned, directly or indirectly, by Nestlé S.A. These non-controlling interests are individually
not material for the Group.
17.8 Other comprehensive income
In millions of CHF
Tran
sla
tio
n
reserv
e
Fair
valu
e
reserv
es
Hed
gin
g
reserv
es
Reserv
es
of
asso
cia
tes a
nd
join
t ven
ture
s
Reta
ined
earn
ing
s
Tota
l eq
uit
yat
trib
uta
ble
to
shar
eho
lder
s o
f th
e p
aren
t
No
n-c
on
tro
llin
g
inte
rests
Tota
l eq
uit
y
Currency retranslations
– Recognized (1 092) (1) 2 3 — (1 088) (115) (1 203)
– Reclassifi ed to income statement 108 — — — — 108 — 108
– Taxes 91 — — — — 91 — 91
(893) (1) 2 3 — (889) (115) (1 004)
Fair value changes on debt and equity instruments
– Recognized — (203) — — 4 (199) — (199)
– Reclassifi ed to income statement — 153 — — — 153 — 153
– Taxes — 11 — — — 11 — 11
— (39) — — 4 (35) — (35)
Fair value changes on cash fl ow hedges
– Recognized — — 26 — — 26 6 32
– Reclassifi ed to income statement — — 40 — — 40 (4) 36
– Taxes — — (22) — — (22) — (22)
— — 44 — — 44 2 46
Remeasurement of defi ned benefi t plans
– Recognized — — — — 703 703 (3) 700
– Taxes — — — — (101) (101) 1 (100)
— — — — 602 602 (2) 600
Share of other comprehensive income of associates
and joint ventures
– Recognized — — — (32) 117 85 — 85
– Reclassifi ed to income statement — — — 11 — 11 — 11
— — — (21) 117 96 — 96
Other comprehensive income for the year (893) (40) 46 (18) 723 (182) (115) (297)
17. Equity
201
8
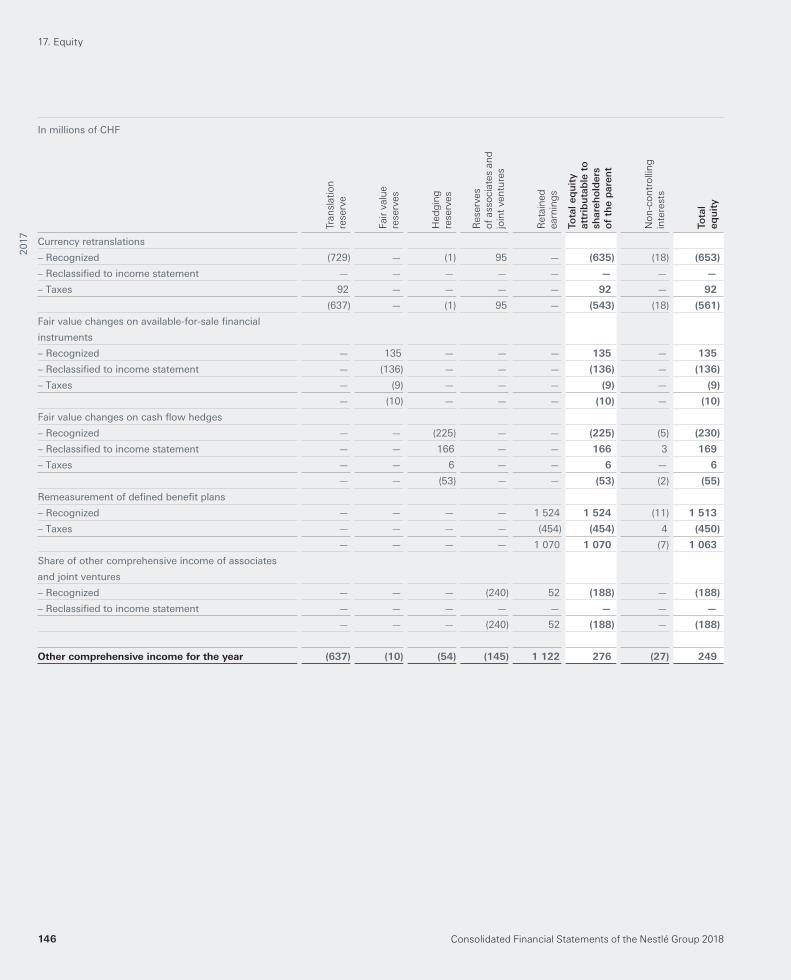
Consolidated Financial Statements of the Nestlé Group 2018146
In millions of CHF
Tran
sla
tio
n
reserv
e
Fair
valu
e
reserv
es
Hed
gin
g
reserv
es
Reserv
es
of
asso
cia
tes a
nd
join
t ven
ture
s
Reta
ined
earn
ing
s
Tota
l eq
uit
yat
trib
uta
ble
to
shar
eho
lder
s o
f th
e p
aren
t
No
n-c
on
tro
llin
g
inte
rests
Tota
l eq
uit
y
Currency retranslations
– Recognized (729) — (1) 95 — (635) (18) (653)
– Reclassifi ed to income statement — — — — — — — —
– Taxes 92 — — — — 92 — 92
(637) — (1) 95 — (543) (18) (561)
Fair value changes on available-for-sale fi nancial
instruments
– Recognized — 135 — — — 135 — 135
– Reclassifi ed to income statement — (136) — — — (136) — (136)
– Taxes — (9) — — — (9) — (9)
— (10) — — — (10) — (10)
Fair value changes on cash fl ow hedges
– Recognized — — (225) — — (225) (5) (230)
– Reclassifi ed to income statement — — 166 — — 166 3 169
– Taxes — — 6 — — 6 — 6
— — (53) — — (53) (2) (55)
Remeasurement of defi ned benefi t plans
– Recognized — — — — 1 524 1 524 (11) 1 513
– Taxes — — — — (454) (454) 4 (450)
— — — — 1 070 1 070 (7) 1 063
Share of other comprehensive income of associates
and joint ventures
– Recognized — — — (240) 52 (188) — (188)
– Reclassifi ed to income statement — — — — — — — —
— — — (240) 52 (188) — (188)
Other comprehensive income for the year (637) (10) (54) (145) 1 122 276 (27) 249
17. Equity
201
7
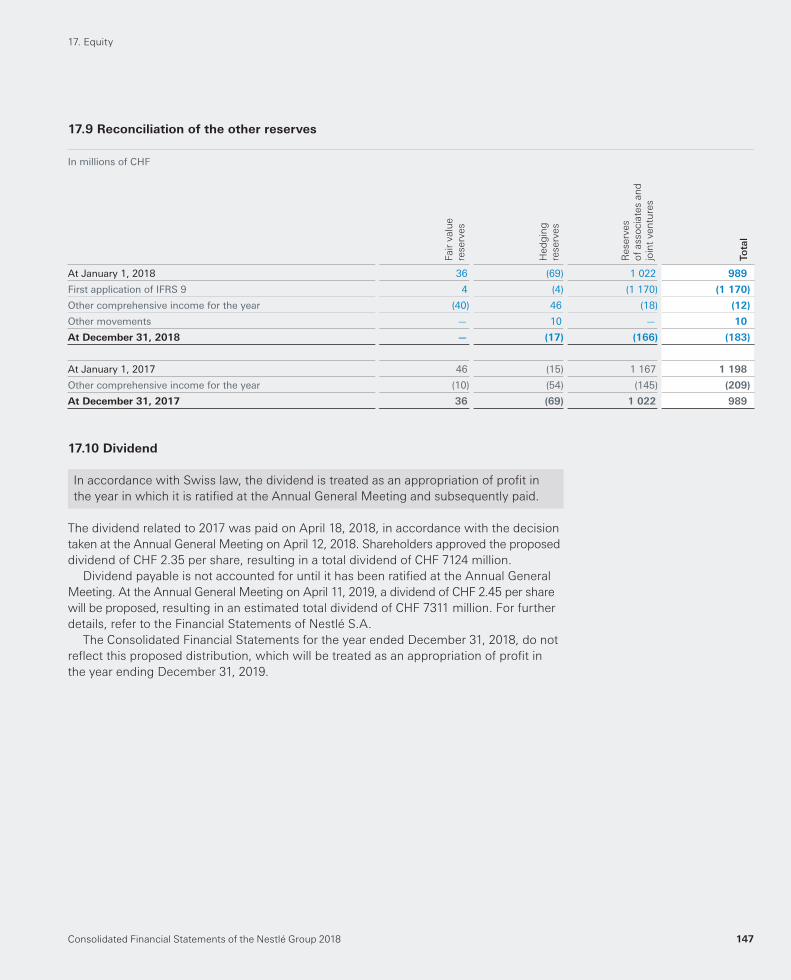
Consolidated Financial Statements of the Nestlé Group 2018 147
17.9 Reconciliation of the other reserves
In millions of CHF
Fair
valu
e
reserv
es
Hed
gin
g
reserv
es
Reserv
es
of
asso
cia
tes a
nd
join
t ven
ture
s
Tota
l
At January 1, 2018 36 (69) 1 022 989
First application of IFRS 9 4 (4) (1 170) (1 170)
Other comprehensive income for the year (40) 46 (18) (12)
Other movements — 10 — 10
At December 31, 2018 — (17) (166) (183)
At January 1, 2017 46 (15) 1 167 1 198
Other comprehensive income for the year (10) (54) (145) (209)
At December 31, 2017 36 (69) 1 022 989
17.10 Dividend
In accordance with Swiss law, the dividend is treated as an appropriation of profi t in
the year in which it is ratifi ed at the Annual General Meeting and subsequently paid.
The dividend related to 2017 was paid on April 18, 2018, in accordance with the decision
taken at the Annual General Meeting on April 12, 2018. Shareholders approved the proposed
dividend of CHF 2.35 per share, resulting in a total dividend of CHF 7124 million .
Dividend payable is not accounted for until it has been ratifi ed at the Annual General
Meeting. At the Annual General Meeting on April 11, 2019, a dividend of CHF 2.45 per share
will be proposed, resulting in an estimated total dividend of CHF 7311 million . For further
details, refer to the Financial Statements of Nestlé S.A.
The Consolidated Financial Statements for the year ended December 31, 2018 , do not
refl ect this proposed distribution, which will be treated as an appropriation of profi t in
the year ending December 31, 2019 .
17. Equity
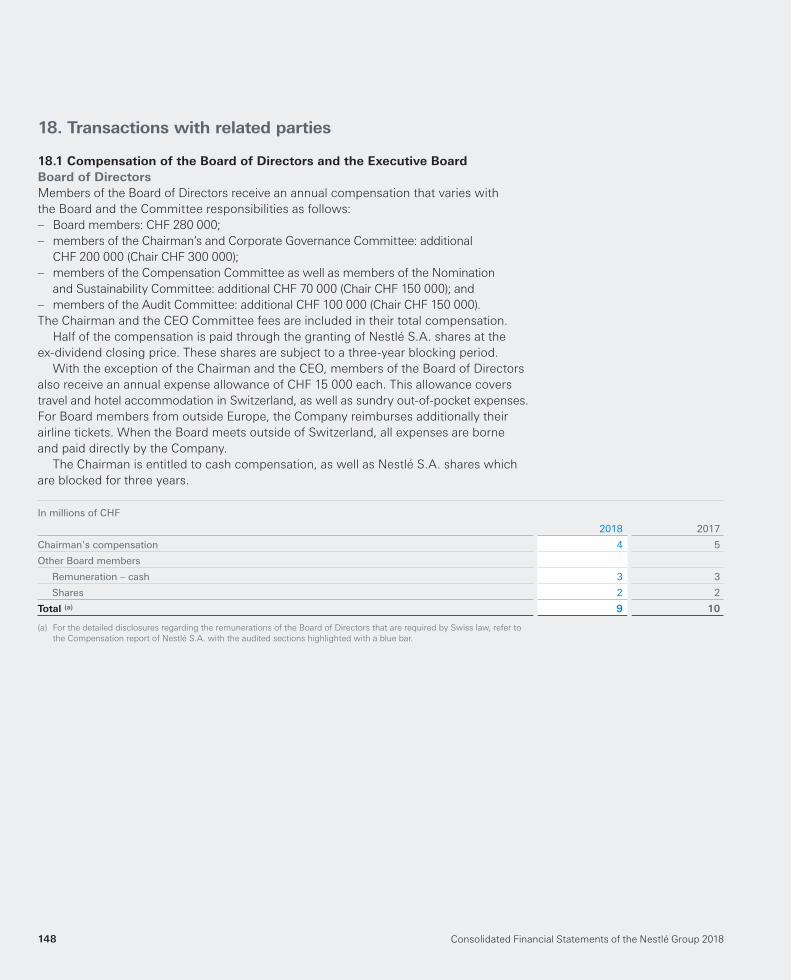
Consolidated Financial Statements of the Nestlé Group 2018148
18. Transactions with related parties
18.1 Compensation of the Board of Directors and the Executive Board
Board of Directors
Members of the Board of Directors receive an annual compensation that varies with
the Board and the Committee responsibilities as follows:
– Board members: CHF 280 000;
– members of the Chairman’s and Corporate Governance Committee: additional
CHF 200 000 (Chair CHF 300 000);
– members of the Compensation Committee as well as members of the Nomination
and Sustainability Committee: additional CHF 70 000 (Chair CHF 150 000); and
– members of the Audit Committee: additional CHF 100 000 (Chair CHF 150 000).
The Chairman and the CEO Committee fees are included in their total compensation.
Half of the compensation is paid through the granting of Nestlé S.A. shares at the
ex-dividend closing price. These shares are subject to a three-year blocking period.
With the exception of the Chairman and the CEO, members of the Board of Directors
also receive an annual expense allowance of CHF 15 000 each. This allowance covers
travel and hotel accommodation in Switzerland, as well as sundry out-of-pocket expenses.
For Board members from outside Europe, the Company reimburses additionally their
airline tickets. When the Board meets outside of Switzerland, all expenses are borne
and paid directly by the Company.
The Chairman is entitled to cash compensation, as well as Nestlé S.A. shares which
are blocked for three years.
In millions of CHF
2018 2017
Chairman's compensation 4 5
Other Board members
Remuneration – cash 3 3
Shares 2 2
Total (a) 9 10
(a) For the detailed disclosures regarding the remunerations of the Board of Directors that are required by Swiss law, refer to
the Compensation report of Nestlé S.A. with the audited sections highlighted with a blue bar.
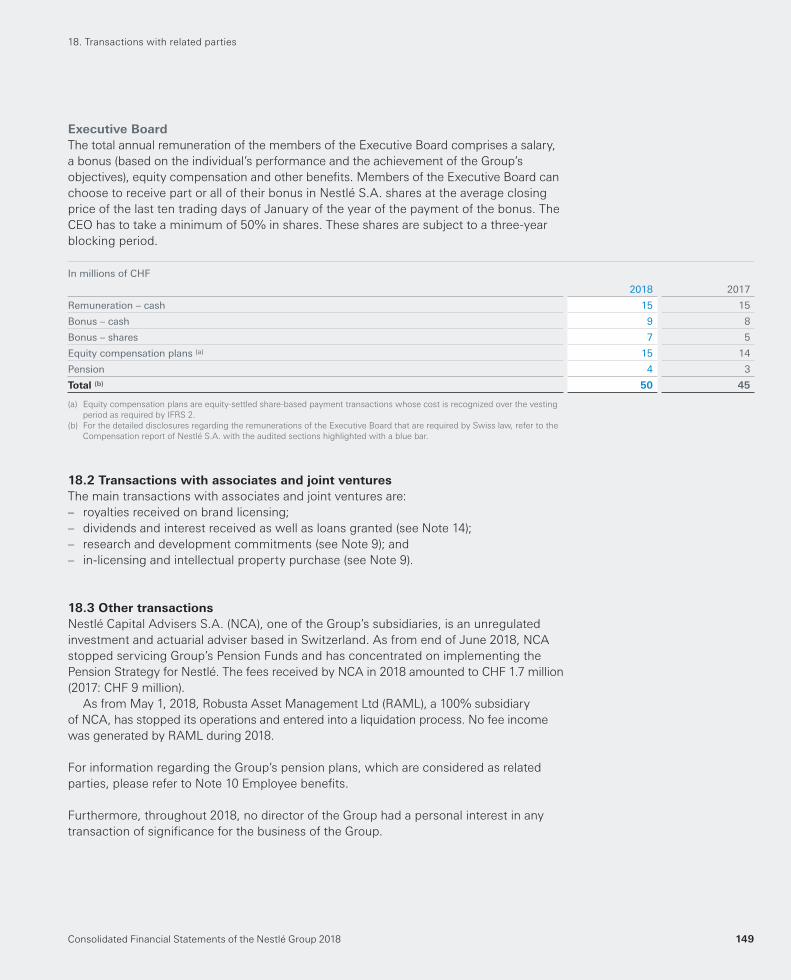
Consolidated Financial Statements of the Nestlé Group 2018 149
Executive Board
The total annual remuneration of the members of the Executive Board comprises a salary,
a bonus (based on the individual’s performance and the achievement of the Group’s
objectives), equity compensation and other benefi ts. Members of the Executive Board can
choose to receive part or all of their bonus in Nestlé S.A. shares at the average closing
price of the last ten trading days of January of the year of the payment of the bonus. The
CEO has to take a minimum of 50% in shares. These shares are subject to a three-year
blocking period.
In millions of CHF
2018 2017
Remuneration – cash 15 15
Bonus – cash 9 8
Bonus – shares 7 5
Equity compensation plans (a) 15 14
Pension 4 3
Total (b) 50 45
(a) Equity compensation plans are equity-settled share-based payment transactions whose cost is recognized over the vesting
period as required by IFRS 2.
(b) For the detailed disclosures regarding the remunerations of the Executive Board that are required by Swiss law, refer to the
Compensation report of Nestlé S.A. with the audited sections highlighted with a blue bar.
18.2 Transactions with associates and joint ventures
The main transactions with associates and joint ventures are:
– royalties received on brand licensing;
– dividends and interest received as well as loans granted (see Note 14);
– research and development commitments (see Note 9); and
– in-licensing and intellectual property purchase (see Note 9).
18.3 Other transactions
Nestlé Capital Advisers S.A. (NCA), one of the Group’s subsidiaries, is an unregulated
investment and actuarial adviser based in Switzerland. As from end of June 2018, NCA
stopped servicing Group’s Pension Funds and has concentrated on implementing the
Pension Strategy for Nestlé. The fees received by NCA in 2018 amounted to CHF 1.7 million
( 2017 : CHF 9 million ).
As from May 1, 2018, Robusta Asset Management Ltd (RAML), a 100% subsidiary
of NCA, has stopped its operations and entered into a liquidation process. No fee income
was generated by RAML during 2018.
For information regarding the Group’s pension plans, which are considered as related
parties, please refer to Note 10 Employee benefi ts.
Furthermore, throughout 2018, no director of the Group had a personal interest in any
transaction of signifi cance for the business of the Group.
18. Transactions with related parties
Consolidated Financial Statements of the Nestlé Group 2018150
19. Guarantees
At December 31, 2018 and December 31, 2017 , the Group has no signifi cant guarantees
given to third parties.
20. Effects of hyperinfl ation
The Group considers that Argentina became a hyperinfl ationary economy on July 1, 2018,
when the cumulative three-year increase in the Consumer Price Index exceeded 100%.
Consequentially, the Group has applied for the fi rst time IAS 29 Financial Reporting in
Hyperinfl ationary Economies to its subsidiaries in Argentina as from January 1, 2018.
This resulted in a reduction of the 12-month sales by CHF 46 million, and a loss of
CHF 12 million due to the loss in purchasing power of the net monetary position which
was recognized in Other operating expenses. An initial impact of CHF 73 million due to
the restatement of the non-monetary assets and liabilities with the price index at the
beginning of the period was recorded in equity.
Venezuela continues to be considered a hyperinfl ationary economy. The impact of the
adjustment on the 2018 Group Consolidated Financial Statements was not signifi cant.
21. Events after the balance sheet date
The values of assets and liabilities at the balance sheet date are adjusted if there is
evidence that subsequent adjusting events warrant a modifi cation of these values.
These adjustments are made up to the date of approval of the Consolidated Financial
Statements by the Board of Directors.
At February 13, 2019, the date of approval for issue of the Consolidated Financial
Statements by the Board of Directors, the Group has no subsequent events which either
warrant a modification of the value of its assets and liabilities or any additional disclosure.
22. Restatements of 2017 comparatives and fi rst application
of IFRS 9
As described in Note 1 Accounting policies, comparative fi gures have been restated
following the application of IFRS 15, IFRS 16, IFRIC 23 as well as some other changes in
presentation and in accounting policies. Impacts on the income statement, statement of
comprehensive income, cash fl ow statement and balance sheet are presented thereafter.
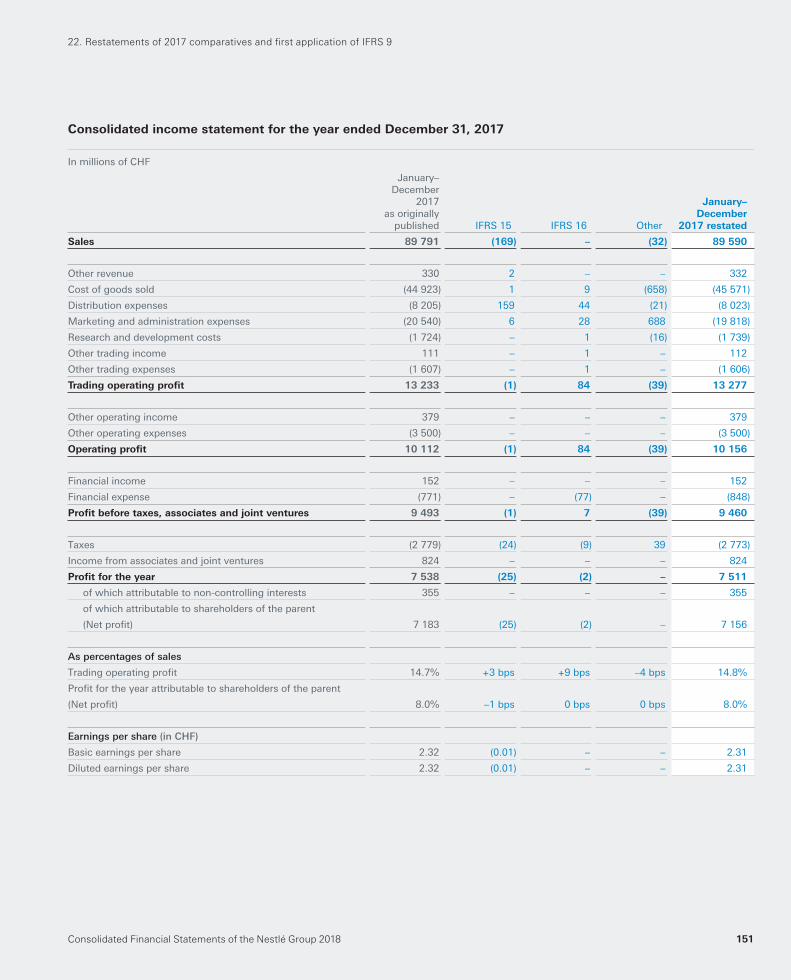
Consolidated Financial Statements of the Nestlé Group 2018 151
Consolidated income statement for the year ended December 31, 2017
In millions of CHF
January–December
2017 as originally
published IFRS 15 IFRS 16 Other
January–
December
2017 restated
Sales 89 791 (169) – (32) 89 590
Other revenue 330 2 – – 332
Cost of goods sold (44 923) 1 9 (658) (45 571)
Distribution expenses (8 205) 159 44 (21) (8 023)
Marketing and administration expenses (20 540) 6 28 688 (19 818)
Research and development costs (1 724) – 1 (16) (1 739)
Other trading income 111 – 1 – 112
Other trading expenses (1 607) – 1 – (1 606)
Trading operating profi t 13 233 (1) 84 (39) 13 277
Other operating income 379 – – – 379
Other operating expenses (3 500) – – – (3 500)
Operating profi t 10 112 (1) 84 (39) 10 156
Financial income 152 – – – 152
Financial expense (771) – (77) – (848)
Profi t before taxes, associates and joint ventures 9 493 (1) 7 (39) 9 460
Taxes (2 779) (24) (9) 39 (2 773)
Income from associates and joint ventures 824 – – – 824
Profi t for the year 7 538 (25) (2) – 7 511
of which attributable to non-controlling interests 355 – – – 355
of which attributable to shareholders of the parent
(Net profi t) 7 183 (25) (2) – 7 156
As percentages of sales
Trading operating profi t 14.7% +3 bps +9 bps –4 bps 14.8%
Profi t for the year attributable to shareholders of the parent
(Net profi t) 8.0% –1 bps 0 bps 0 bps 8.0%
Earnings per share (in CHF)
Basic earnings per share 2.32 (0.01) – – 2.31
Diluted earnings per share 2.32 (0.01) – – 2.31
22. Restatements of 2017 comparatives and fi rst application of IFRS 9
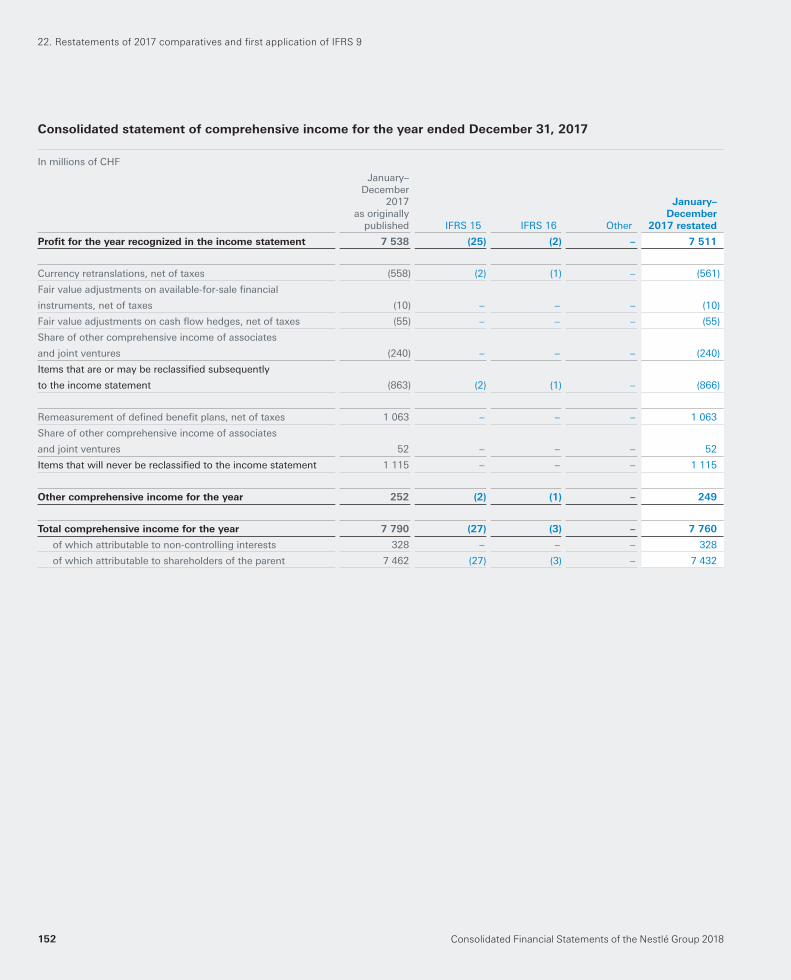
Consolidated Financial Statements of the Nestlé Group 2018152
Consolidated statement of comprehensive income for the year ended December 31, 2017
In millions of CHF
January–December
2017 as originally
published IFRS 15 IFRS 16 Other
January–
December
2017 restated
Profi t for the year recognized in the income statement 7 538 (25) (2) – 7 511
Currency retranslations, net of taxes (558) (2) (1) – (561)
Fair value adjustments on available-for-sale fi nancial
instruments, net of taxes (10) – – – (10)
Fair value adjustments on cash fl ow hedges, net of taxes (55) – – – (55)
Share of other comprehensive income of associates
and joint ventures (240) – – – (240)
Items that are or may be reclassifi ed subsequently
to the income statement (863) (2) (1) – (866)
Remeasurement of defi ned benefi t plans, net of taxes 1 063 – – – 1 063
Share of other comprehensive income of associates
and joint ventures 52 – – – 52
Items that will never be reclassifi ed to the income statement 1 115 – – – 1 115
Other comprehensive income for the year 252 (2) (1) – 249
Total comprehensive income for the year 7 790 (27) (3) – 7 760
of which attributable to non-controlling interests 328 – – – 328
of which attributable to shareholders of the parent 7 462 (27) (3) – 7 432
22. Restatements of 2017 comparatives and fi rst application of IFRS 9
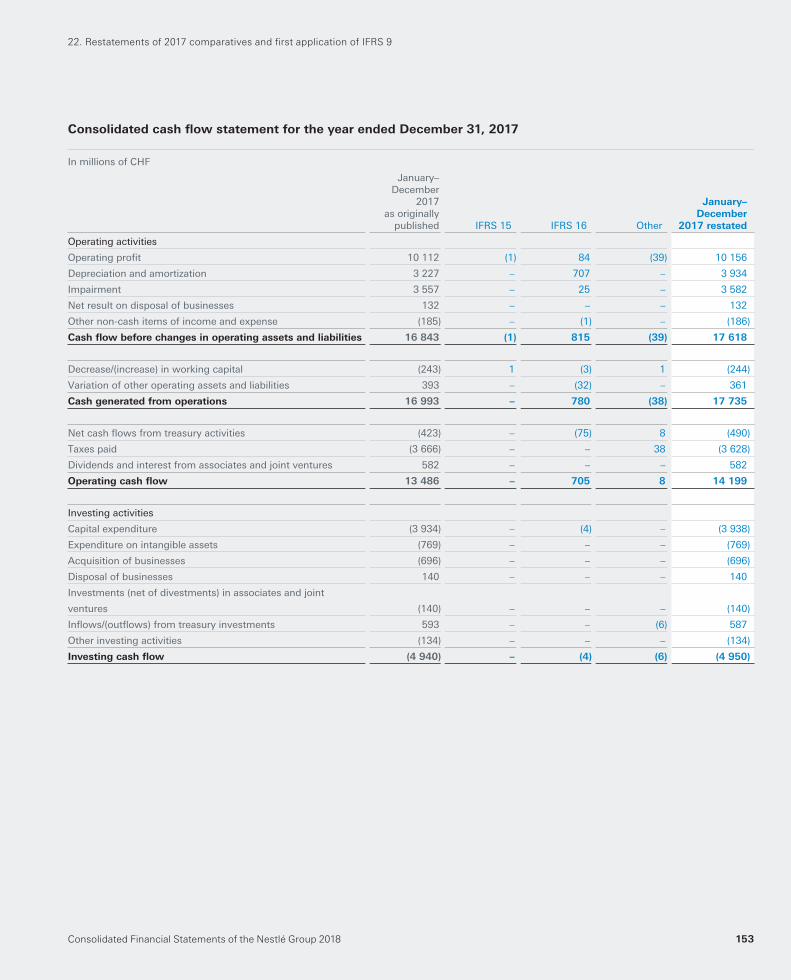
Consolidated Financial Statements of the Nestlé Group 2018 153
Consolidated cash fl ow statement for the year ended December 31, 2017
In millions of CHF
January–December
2017 as originally
published IFRS 15 IFRS 16 Other
January–
December
2017 restated
Operating activities
Operating profi t 10 112 (1) 84 (39) 10 156
Depreciation and amortization 3 227 – 707 – 3 934
Impairment 3 557 – 25 – 3 582
Net result on disposal of businesses 132 – – – 132
Other non-cash items of income and expense (185) – (1) – (186)
Cash fl ow before changes in operating assets and liabilities 16 843 (1) 815 (39) 17 618
Decrease/(increase) in working capital (243) 1 (3) 1 (244)
Variation of other operating assets and liabilities 393 – (32) – 361
Cash generated from operations 16 993 – 780 (38) 17 735
Net cash fl ows from treasury activities (423) – (75) 8 (490)
Taxes paid (3 666) – – 38 (3 628)
Dividends and interest from associates and joint ventures 582 – – – 582
Operating cash fl ow 13 486 – 705 8 14 199
Investing activities
Capital expenditure (3 934) – (4) – (3 938)
Expenditure on intangible assets (769) – – – (769)
Acquisition of businesses (696) – – – (696)
Disposal of businesses 140 – – – 140
Investments (net of divestments) in associates and joint
ventures (140) – – – (140)
Infl ows/(outfl ows) from treasury investments 593 – – (6) 587
Other investing activities (134) – – – (134)
Investing cash fl ow (4 940) – (4) (6) (4 950)
22. Restatements of 2017 comparatives and fi rst application of IFRS 9
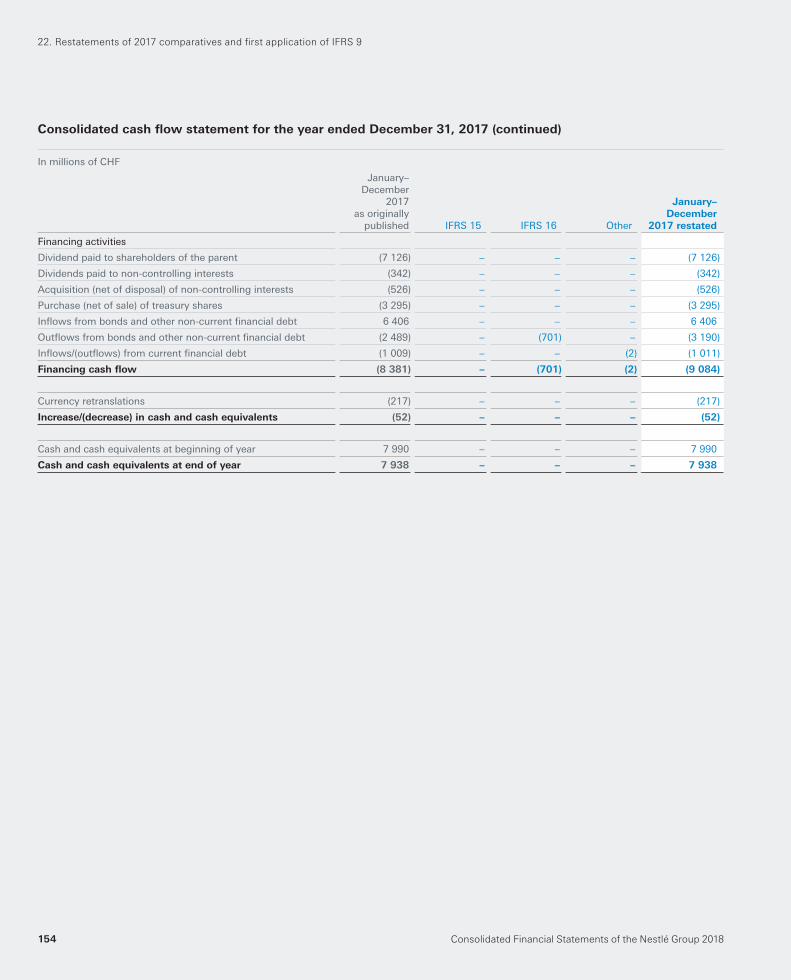
Consolidated Financial Statements of the Nestlé Group 2018154
22. Restatements of 2017 comparatives and fi rst application of IFRS 9
Consolidated cash fl ow statement for the year ended December 31, 2017 (continued)
In millions of CHF
January–December
2017 as originally
published IFRS 15 IFRS 16 Other
January–
December
2017 restated
Financing activities
Dividend paid to shareholders of the parent (7 126) – – – (7 126)
Dividends paid to non-controlling interests (342) – – – (342)
Acquisition (net of disposal) of non-controlling interests (526) – – – (526)
Purchase (net of sale) of treasury shares (3 295) – – – (3 295)
Infl ows from bonds and other non-current fi nancial debt 6 406 – – – 6 406
Outfl ows from bonds and other non-current fi nancial debt (2 489) – (701) – (3 190)
Infl ows/(outfl ows) from current fi nancial debt (1 009) – – (2) (1 011)
Financing cash fl ow (8 381) – (701) (2) (9 084)
Currency retranslations (217) – – – (217)
Increase/(decrease) in cash and cash equivalents (52) – – – (52)
Cash and cash equivalents at beginning of year 7 990 – – – 7 990
Cash and cash equivalents at end of year 7 938 – – – 7 938
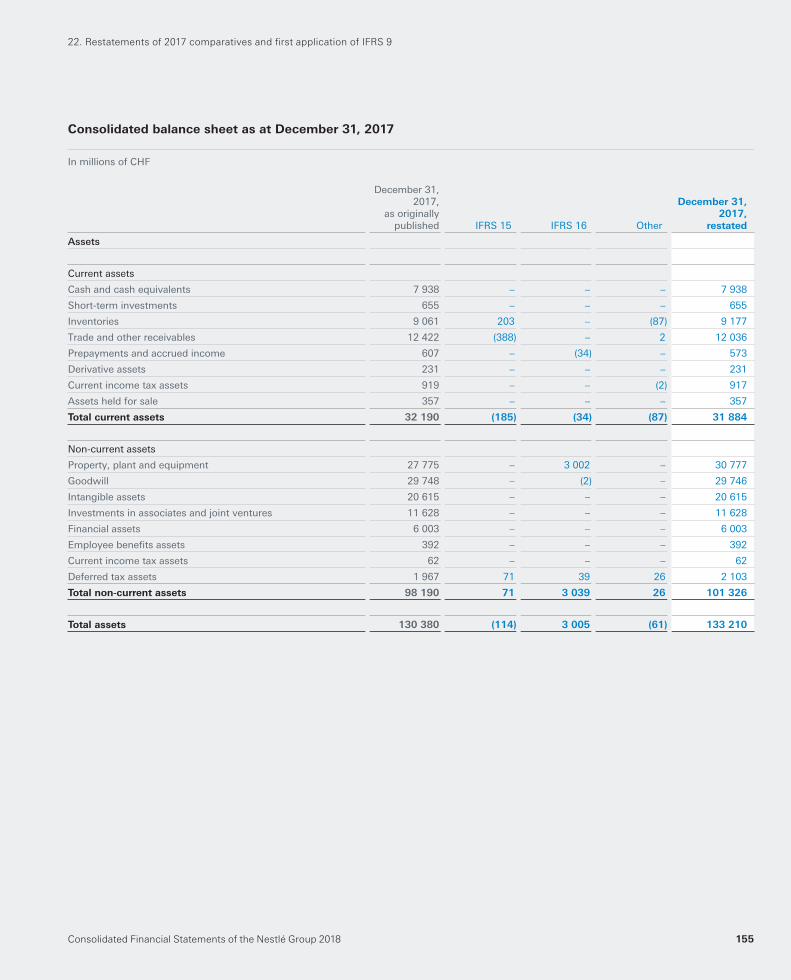
Consolidated Financial Statements of the Nestlé Group 2018 155
Consolidated balance sheet as at December 31, 2017
In millions of CHF
December 31,2017,
as originallypublished IFRS 15 IFRS 16 Other
December 31,
2017,
restated
Assets
Current assets
Cash and cash equivalents 7 938 – – – 7 938
Short-term investments 655 – – – 655
Inventories 9 061 203 – (87) 9 177
Trade and other receivables 12 422 (388) – 2 12 036
Prepayments and accrued income 607 – (34) – 573
Derivative assets 231 – – – 231
Current income tax assets 919 – – (2) 917
Assets held for sale 357 – – – 357
Total current assets 32 190 (185) (34) (87) 31 884
Non-current assets
Property, plant and equipment 27 775 – 3 002 – 30 777
Goodwill 29 748 – (2) – 29 746
Intangible assets 20 615 – – – 20 615
Investments in associates and joint ventures 11 628 – – – 11 628
Financial assets 6 003 – – – 6 003
Employee benefi ts assets 392 – – – 392
Current income tax assets 62 – – – 62
Deferred tax assets 1 967 71 39 26 2 103
Total non-current assets 98 190 71 3 039 26 101 326
Total assets 130 380 (114) 3 005 (61) 133 210
22. Restatements of 2017 comparatives and fi rst application of IFRS 9
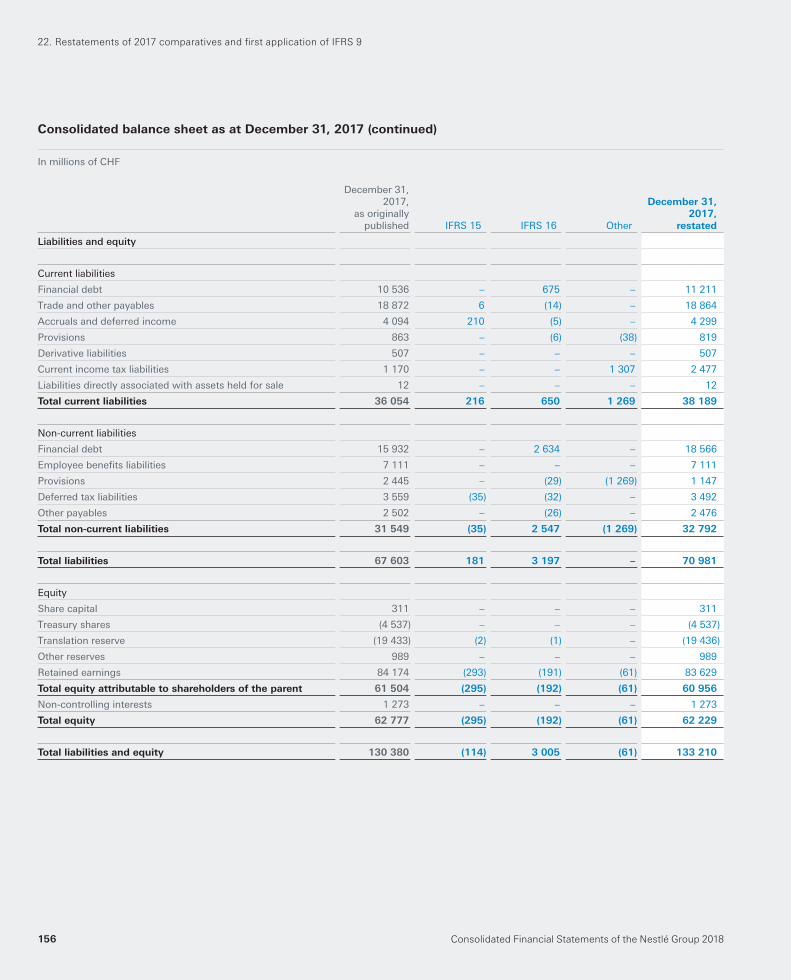
Consolidated Financial Statements of the Nestlé Group 2018156
Consolidated balance sheet as at December 31, 2017 (continued)
In millions of CHF
December 31,2017,
as originallypublished IFRS 15 IFRS 16 Other
December 31,
2017,
restated
Liabilities and equity
Current liabilities
Financial debt 10 536 – 675 – 11 211
Trade and other payables 18 872 6 (14) – 18 864
Accruals and deferred income 4 094 210 (5) – 4 299
Provisions 863 – (6) (38) 819
Derivative liabilities 507 – – – 507
Current income tax liabilities 1 170 – – 1 307 2 477
Liabilities directly associated with assets held for sale 12 – – – 12
Total current liabilities 36 054 216 650 1 269 38 189
Non-current liabilities
Financial debt 15 932 – 2 634 – 18 566
Employee benefi ts liabilities 7 111 – – – 7 111
Provisions 2 445 – (29) (1 269) 1 147
Deferred tax liabilities 3 559 (35) (32) – 3 492
Other payables 2 502 – (26) – 2 476
Total non-current liabilities 31 549 (35) 2 547 (1 269) 32 792
Total liabilities 67 603 181 3 197 – 70 981
Equity
Share capital 311 – – – 311
Treasury shares (4 537) – – – (4 537)
Translation reserve (19 433) (2) (1) – (19 436)
Other reserves 989 – – – 989
Retained earnings 84 174 (293) (191) (61) 83 629
Total equity attributable to shareholders of the parent 61 504 (295) (192) (61) 60 956
Non-controlling interests 1 273 – – – 1 273
Total equity 62 777 (295) (192) (61) 62 229
Total liabilities and equity 130 380 (114) 3 005 (61) 133 210
22. Restatements of 2017 comparatives and fi rst application of IFRS 9
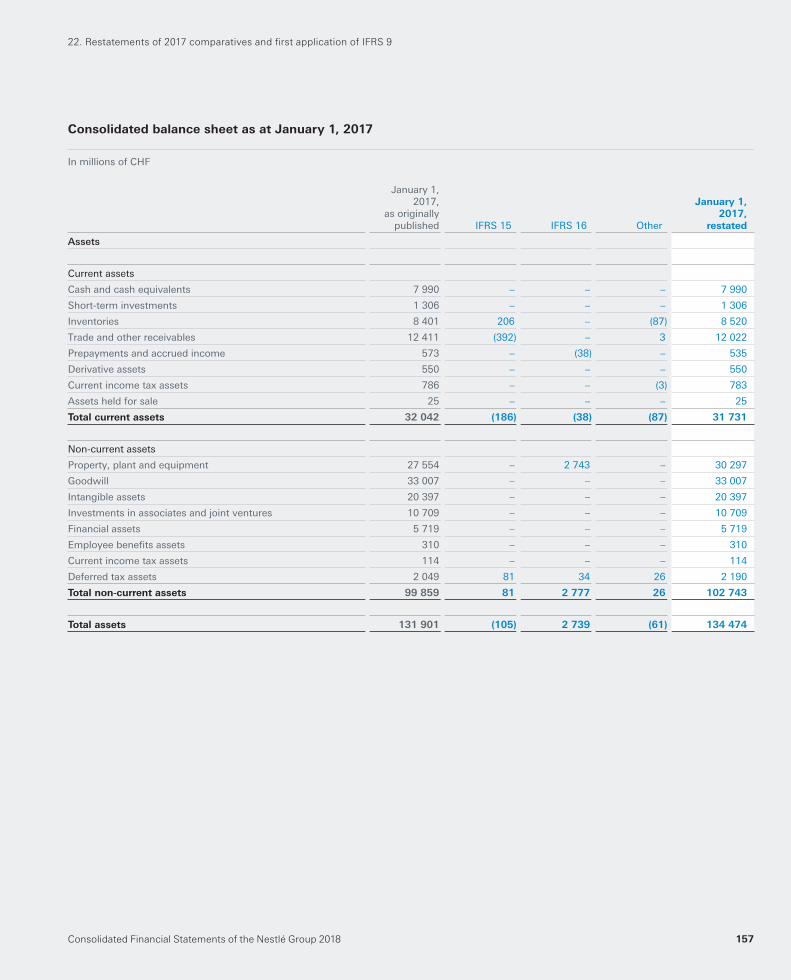
Consolidated Financial Statements of the Nestlé Group 2018 157
Consolidated balance sheet as at January 1, 2017
In millions of CHF
January 1,2017,
as originallypublished IFRS 15 IFRS 16 Other
January 1,
2017,
restated
Assets
Current assets
Cash and cash equivalents 7 990 – – – 7 990
Short-term investments 1 306 – – – 1 306
Inventories 8 401 206 – (87) 8 520
Trade and other receivables 12 411 (392) – 3 12 022
Prepayments and accrued income 573 – (38) – 535
Derivative assets 550 – – – 550
Current income tax assets 786 – – (3) 783
Assets held for sale 25 – – – 25
Total current assets 32 042 (186) (38) (87) 31 731
Non-current assets
Property, plant and equipment 27 554 – 2 743 – 30 297
Goodwill 33 007 – – – 33 007
Intangible assets 20 397 – – – 20 397
Investments in associates and joint ventures 10 709 – – – 10 709
Financial assets 5 719 – – – 5 719
Employee benefi ts assets 310 – – – 310
Current income tax assets 114 – – – 114
Deferred tax assets 2 049 81 34 26 2 190
Total non-current assets 99 859 81 2 777 26 102 743
Total assets 131 901 (105) 2 739 (61) 134 474
22. Restatements of 2017 comparatives and fi rst application of IFRS 9
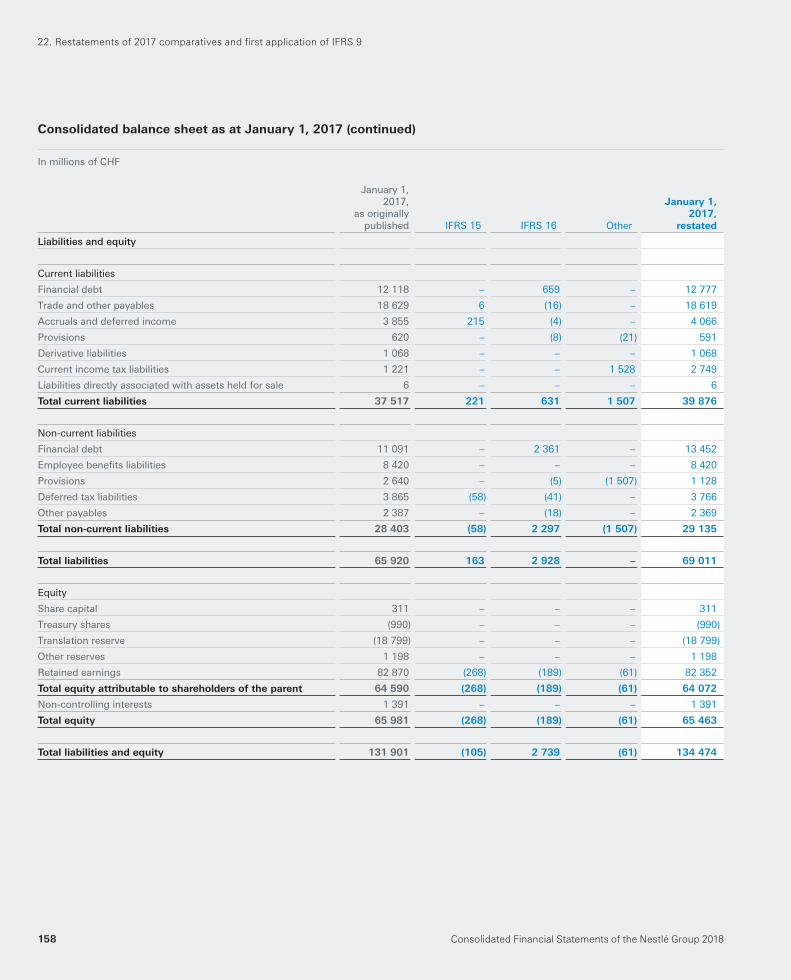
Consolidated Financial Statements of the Nestlé Group 2018158
Consolidated balance sheet as at January 1, 2017 (continued)
In millions of CHF
January 1,2017,
as originallypublished IFRS 15 IFRS 16 Other
January 1,
2017,
restated
Liabilities and equity
Current liabilities
Financial debt 12 118 – 659 – 12 777
Trade and other payables 18 629 6 (16) – 18 619
Accruals and deferred income 3 855 215 (4) – 4 066
Provisions 620 – (8) (21) 591
Derivative liabilities 1 068 – – – 1 068
Current income tax liabilities 1 221 – – 1 528 2 749
Liabilities directly associated with assets held for sale 6 – – – 6
Total current liabilities 37 517 221 631 1 507 39 876
Non-current liabilities
Financial debt 11 091 – 2 361 – 13 452
Employee benefi ts liabilities 8 420 – – – 8 420
Provisions 2 640 – (5) (1 507) 1 128
Deferred tax liabilities 3 865 (58) (41) – 3 766
Other payables 2 387 – (18) – 2 369
Total non-current liabilities 28 403 (58) 2 297 (1 507) 29 135
Total liabilities 65 920 163 2 928 – 69 011
Equity
Share capital 311 – – – 311
Treasury shares (990) – – – (990)
Translation reserve (18 799) – – – (18 799)
Other reserves 1 198 – – – 1 198
Retained earnings 82 870 (268) (189) (61) 82 352
Total equity attributable to shareholders of the parent 64 590 (268) (189) (61) 64 072
Non-controlling interests 1 391 – – – 1 391
Total equity 65 981 (268) (189) (61) 65 463
Total liabilities and equity 131 901 (105) 2 739 (61) 134 474
22. Restatements of 2017 comparatives and fi rst application of IFRS 9
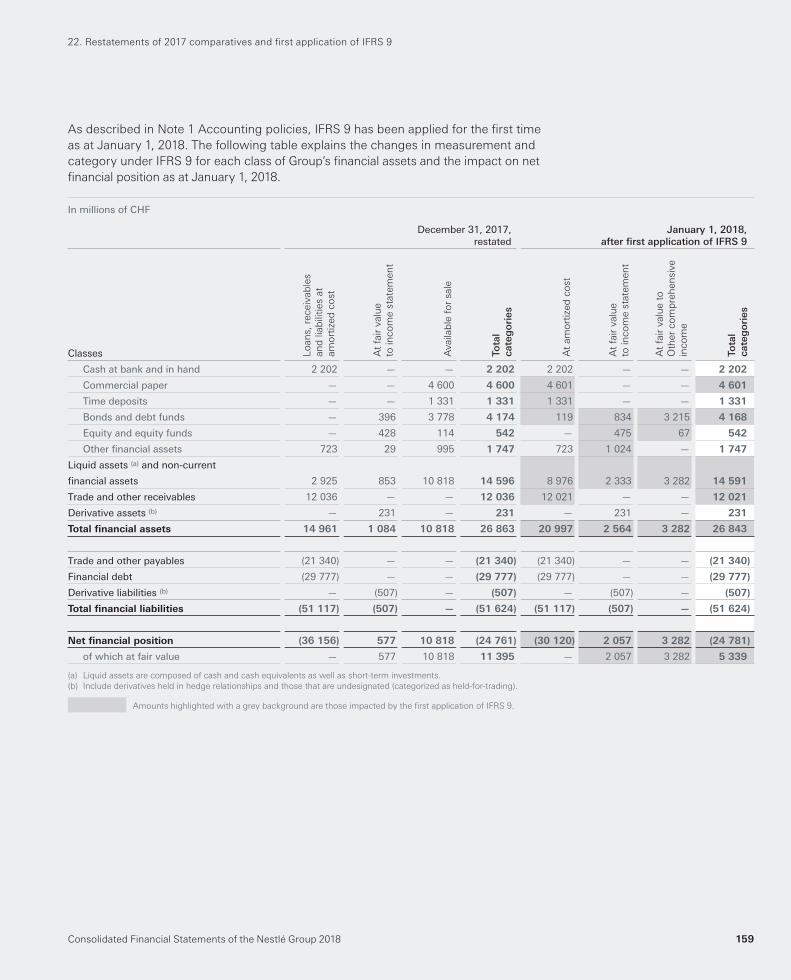
Consolidated Financial Statements of the Nestlé Group 2018 159
As described in Note 1 Accounting policies, IFRS 9 has been applied for the fi rst time
as at January 1, 2018. The following table explains the changes in measurement and
category under IFRS 9 for each class of Group’s fi nancial assets and the impact on net
fi nancial position as at January 1, 2018.
In millions of CHF
December 31, 2017,restated
January 1, 2018,after fi rst application of IFRS 9
Classes Lo
an
s,
receiv
ab
les
an
d lia
bilitie
s a
t
am
ort
ized
co
st
At
fair
valu
e
to in
co
me s
tate
men
t
Availab
le f
or
sale
Tota
lca
teg
ori
es
At
am
ort
ized
co
st
At
fair
valu
e
to in
co
me s
tate
men
t
At
fair
valu
e t
o
Oth
er
co
mp
reh
en
siv
e
inco
me
Tota
lca
teg
ori
es
Cash at bank and in hand 2 202 — — 2 202 2 202 — — 2 202
Commercial paper — — 4 600 4 600 4 601 — — 4 601
Time deposits — — 1 331 1 331 1 331 — — 1 331
Bonds and debt funds — 396 3 778 4 174 119 834 3 215 4 168
Equity and equity funds — 428 114 542 — 475 67 542
Other fi nancial assets 723 29 995 1 747 723 1 024 — 1 747
Liquid assets (a) and non-current
fi nancial assets 2 925 853 10 818 14 596 8 976 2 333 3 282 14 591
Trade and other receivables 12 036 — — 12 036 12 021 — — 12 021
Derivative assets (b) — 231 — 231 — 231 — 231
Total fi nancial assets 14 961 1 084 10 818 26 863 20 997 2 564 3 282 26 843
Trade and other payables (21 340) — — (21 340) (21 340) — — (21 340)
Financial debt (29 777) — — (29 777) (29 777) — — (29 777)
Derivative liabilities (b) — (507) — (507) — (507) — (507)
Total fi nancial liabilities (51 117) (507) — (51 624) (51 117) (507) — (51 624)
Net fi nancial position (36 156) 577 10 818 (24 761) (30 120) 2 057 3 282 (24 781)
of which at fair value — 577 10 818 11 395 — 2 057 3 282 5 339
(a) Liquid assets are composed of cash and cash equivalents as well as short-term investments.
(b) Include derivatives held in hedge relationships and those that are undesignated (categorized as held-for-trading).
Amounts highlighted with a grey background are those impacted by the fi rst application of IFRS 9.
22. Restatements of 2017 comparatives and fi rst application of IFRS 9
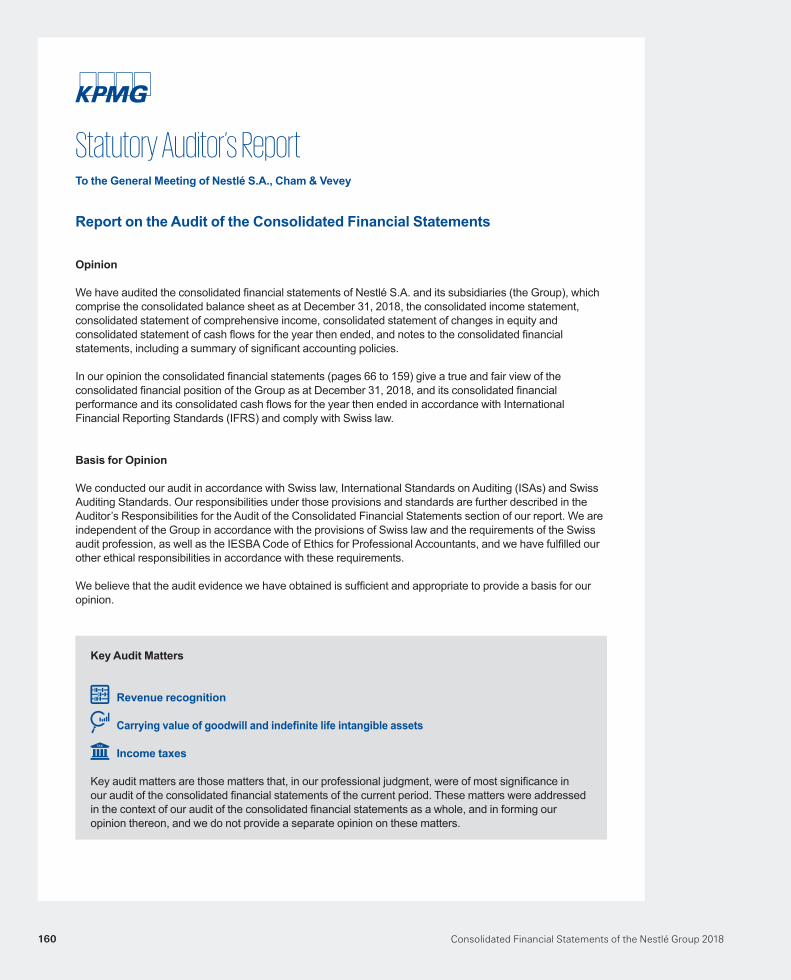
Consolidated Financial Statements of the Nestlé Group 2018160
Statutory Auditor’s ReportTo the General Meeting of Nestlé S.A., Cham & Vevey
Report on the Audit of the Consolidated Financial Statements
Opinion
We have audited the consolidated financial statements of Nestlé S.A. and its subsidiaries (the Group), which comprise the consolidated balance sheet as at December 31, 2018, the consolidated income statement, consolidated statement of comprehensive income, consolidated statement of changes in equity and consolidated statement of cash flows for the year then ended, and notes to the consolidated financial statements, including a summary of significant accounting policies.
In our opinion the consolidated financial statements (pages 66 to 159) give a true and fair view of the consolidated financial position of the Group as at December 31, 2018, and its consolidated financial performance and its consolidated cash flows for the year then ended in accordance with International Financial Reporting Standards (IFRS) and comply with Swiss law.
Basis for Opinion
We conducted our audit in accordance with Swiss law, International Standards on Auditing (ISAs) and Swiss Auditing Standards. Our responsibilities under those provisions and standards are further described in the Auditor’s Responsibilities for the Audit of the Consolidated Financial Statements section of our report. We are independent of the Group in accordance with the provisions of Swiss law and the requirements of the Swiss audit profession, as well as the IESBA Code of Ethics for Professional Accountants, and we have fulfilled our other ethical responsibilities in accordance with these requirements.
We believe that the audit evidence we have obtained is sufficient and appropriate to provide a basis for our opinion.
Key Audit Matters
Revenue recognition
Carrying value of goodwill and indefinite life intangible assets
Income taxes
Key audit matters are those matters that, in our professional judgment, were of most significance in our audit of the consolidated financial statements of the current period. These matters were addressed in the context of our audit of the consolidated financial statements as a whole, and in forming our opinion thereon, and we do not provide a separate opinion on these matters.
Consolidated Financial Statements of the Nestlé Group 2018 161
Key Audit Matter
Revenue from the sale of goods is recognized at the moment when control has been transferred to the buyer; and is measured net of pricing allowances, other trade discounts, and price promotions to customers (collectively ‘trade spend’).
The judgments required by management to estimate trade spend accruals are complex due to the diverse range of contractual agreements and commercial terms across the Group’s markets.
There is a risk that revenue may be overstated because of fraud, resulting from the pressure local management may feel to achieve performance targets. Revenue is also an important element of how the Group measures its performance, upon which management are incentivized.
The Group focuses on revenue as a key performance measure, which could create an incentive for revenue to be recognized before control has been transferred.
Key Audit Matter
The Group has goodwill of CHF 31,702 million and indefinite life intangible assets of CHF 16,872 million as at December 31, 2018, which are required to be tested for impairment at least on an annual basis. The recoverability of these assets is dependent on achieving sufficient level of future net cash flows.
Management apply judgment in allocating these assets to individual cash generating units (‘CGUs’) as well as in assessing the future performance and prospects of each CGU and determining the appropriate discount rates.
Our response
We considered the appropriateness of the Group’s revenue recognition accounting policies, including the recognition and classification criteria for trade spend.
Due to the high reliance of revenue recognition on IT, we evaluated the integrity of the general IT control environment and tested the operating effectiveness of key IT application controls. We performed detailed testing over the completeness and accuracy of the underlying customer master data, by assessing mandatory fields and critical segregation of duties.
Additionally we identified transactions that deviated from the standard process for further investigation and validated the existence and accuracy of this population. We also tested the operating effectiveness of controls over the calculation and monitoring of trade spend.
Furthermore, we performed a monthly trend analysis of revenue by market by considering both internal and external benchmarks, overlaying our understanding of each market, to compare the reported results with our expectation.
We also considered the accuracy of the Group’s description of the accounting policy related to revenue, and whether revenue is adequately disclosed throughout the consolidated financial statements.
Our response
We evaluated the accuracy of impairment tests applied to significant amounts of goodwill and indefinite life intangible assets, the appropriateness of the assumptions used, and the methodology used by management to prepare its cash flow forecasts. We also tested the design, implementation and operating effectiveness of controls over the preparation of impairment tests.
For a sample of CGUs, identified based on quantitative and qualitative factors, we assessed the historical accuracy of the plans and forecasts by comparing the forecasts used in the prior year model to the actual performance in the current year. We
Carrying value of goodwill and indefinite life intangible assets
For further information on revenue recognition refer to the following:– Note 1, “Accounting policies”– Note 3, “Analyses by segment”
Revenue recognition
Consolidated Financial Statements of the Nestlé Group 2018162
Key Audit Matter
The Group operates across multiple tax jurisdictions around the world, and is thus regularly subject to tax challenges and audits by local tax authorities on various matters including intragroup financing, pricing and royalty arrangements, different business models and other transaction-related matters.
Where the amount of tax liabilities or assets is uncertain, the Group recognizes management’s best estimate of the most likely outcome based on the facts known in the relevant jurisdiction.
Our response
We evaluated management’s judgment of tax risks, estimates of tax exposures and contingencies by involving our local country tax specialists and testing the design, implementation and operating effectiveness of related controls. Third party opinions, past and current experience with the tax authorities in the respective jurisdiction and our tax specialists‘ own expertise were used to assess the appropriateness of management’s best estimate of the most likely outcome of each uncertain tax position.
Our audit approach included additional reviews performed at Group level to consider the Group’s uncertain tax positions viewed from a worldwide perspective - in particular for transfer prices, intragroup financing and payments in relation to centralized business models where multiple jurisdictions and tax authorities are involved. We drew on our own tax expertise and knowledge gained with other similar groups to conclude on management’s best estimate of the outcome on the Group’s worldwide uncertain tax positions as they relate to more than one jurisdiction.
Income taxes
compared these against the latest plans and forecasts approved by management.
We then challenged the robustness of the key assumptions used to determine the recoverable amount, including identification of the CGU, forecast cash flows, long term growth rates and the discount rate based on our understanding of the commercial prospects of the related assets. In addition, we identified and analysed changes in assumptions from prior periods, made an assessment of the appropriateness of assumptions, and performed a comparison of assumptions with publicly available data.
For further information on the carrying value of goodwill and indefinite life intangible assets refer to the following:– Note 1, “Accounting policies”– Note 9, “Goodwill and intangible assets”
For further information on income taxes refer to the following:– Note 1, “Accounting policies”– Note 13, “Taxes”
Consolidated Financial Statements of the Nestlé Group 2018 163
Other Information in the Annual Report
The Board of Directors is responsible for the other information in the annual report. The other information comprises all information included in the annual report, but does not include the consolidated financial statements, the stand-alone financial statements of the Company, the compensation report and our auditor’s reports thereon.
Our opinion on the consolidated financial statements does not cover the other information in the annual report and we do not express any form of assurance conclusion thereon.
In connection with our audit of the consolidated financial statements, our responsibility is to read the other information in the annual report and, in doing so, consider whether the other information is materially inconsistent with the consolidated financial statements or our knowledge obtained in the audit, or otherwise appears to be materially misstated. If, based on the work we have performed, we conclude that there is a material misstatement of this other information, we are required to report that fact. We have nothing to report in this regard.
Responsibility of the Board of Directors for the Consolidated Financial Statements
The Board of Directors is responsible for the preparation of the consolidated financial statements that give a true and fair view in accordance with IFRS and the provisions of Swiss law, and for such internal control as the Board of Directors determines is necessary to enable the preparation of consolidated financial statements that are free from material misstatement, whether due to fraud or error.
In preparing the consolidated financial statements, the Board of Directors is responsible for assessing the Group’s ability to continue as a going concern, disclosing, as applicable, matters related to going concern and using the going concern basis of accounting unless the Board of Directors either intends to liquidate the Group or to cease operations, or has no realistic alternative but to do so.
Auditor’s Responsibilities for the Audit of the Consolidated Financial Statements
Our objectives are to obtain reasonable assurance about whether the consolidated financial statements as a whole are free from material misstatement, whether due to fraud or error, and to issue an auditor’s report that includes our opinion. Reasonable assurance is a high level of assurance, but is not a guarantee that an audit conducted in accordance with Swiss law, ISAs and Swiss Auditing Standards will always detect a material misstatement when it exists. Misstatements can arise from fraud or error and are considered material if, individually or in the aggregate, they could reasonably be expected to influence the economic decisions of users taken on the basis of these consolidated financial statements.
As part of an audit in accordance with Swiss law, ISAs and Swiss Auditing Standards, we exercise professional judgment and maintain professional scepticism throughout the audit. We also:
— Identify and assess the risks of material misstatement of the consolidated financial statements, whether due to fraud or error, design and perform audit procedures responsive to those risks, and obtain audit evidence that is sufficient and appropriate to provide a basis for our opinion. The risk of not detecting a material misstatement resulting from fraud is higher than for one resulting from error, as fraud may involve collusion, forgery, intentional omissions, misrepresentations, or the override of internal control.
— Obtain an understanding of internal control relevant to the audit in order to design audit procedures that are appropriate in the circumstances, but not for the purpose of expressing an opinion on the effectiveness of the Group’s internal control.
— Evaluate the appropriateness of accounting policies used and the reasonableness of accounting estimates and related disclosures made.
— Conclude on the appropriateness of the Board of Directors’ use of the going concern basis of accounting and, based on the audit evidence obtained, whether a material uncertainty exists related to events or conditions that may cast significant doubt on the Group’s ability to continue as a going concern. If we conclude that a material uncertainty exists, we are required to draw attention in our auditor’s report to the
Consolidated Financial Statements of the Nestlé Group 2018164
related disclosures in the consolidated financial statements or, if such disclosures are inadequate, to modify our opinion. Our conclusions are based on the audit evidence obtained up to the date of our auditor’s report. However, future events or conditions may cause the Group to cease to continue as a going concern.
— Evaluate the overall presentation, structure and content of the consolidated financial statements, including the disclosures, and whether the consolidated financial statements represent the underlying transactions and events in a manner that achieves fair presentation.
— Obtain sufficient appropriate audit evidence regarding the financial information of the entities or business activities within the Group to express an opinion on the consolidated financial statements. We are responsible for the direction, supervision and performance of the Group audit. We remain solely responsible for our audit opinion.
We communicate with the Board of Directors or its relevant committee regarding, among other matters, the planned scope and timing of the audit and significant audit findings, including any significant deficiencies in internal control that we identify during our audit.
We also provide the Board of Directors or its relevant committee with a statement that we have complied with relevant ethical requirements regarding independence, and to communicate with them all relationships and other matters that may reasonably be thought to bear on our independence, and where applicable, related safeguards.
From the matters communicated with the Board of Directors or its relevant committee, we determine those matters that were of most significance in the audit of the consolidated financial statements of the current period and are therefore the key audit matters. We describe these matters in our auditor’s report, unless law or regulation precludes public disclosure about the matter or when, in extremely rare circumstances, we determine that a matter should not be communicated in our report because the adverse consequences of doing so would reasonably be expected to outweigh the public interest benefits of such communication.
Report on Other Legal and Regulatory Requirements
In accordance with article 728a para. 1 item 3 CO and the Swiss Auditing Standard 890, we confirm that an internal control system exists, which has been designed for the preparation of consolidated financial statements according to the instructions of the Board of Directors.
We recommend that the consolidated financial statements submitted to you be approved.
KPMG SA
Scott Cormack Lukas MartyLicensed Audit Expert Licensed Audit ExpertAuditor in Charge
Geneva, February 13, 2019
KPMG SA, 111 Rue de Lyon, P.O. Box 347, CH-1211 Geneva 13
KPMG SA is a subsidiary of KPMG Holding AG, which is a member of the KPMG network of independent firms affiliated with KPMG International Cooperative (“KPMG International”), a Swiss legal entity. All rights reserved.
Consolidated Financial Statements of the Nestlé Group 2018 165
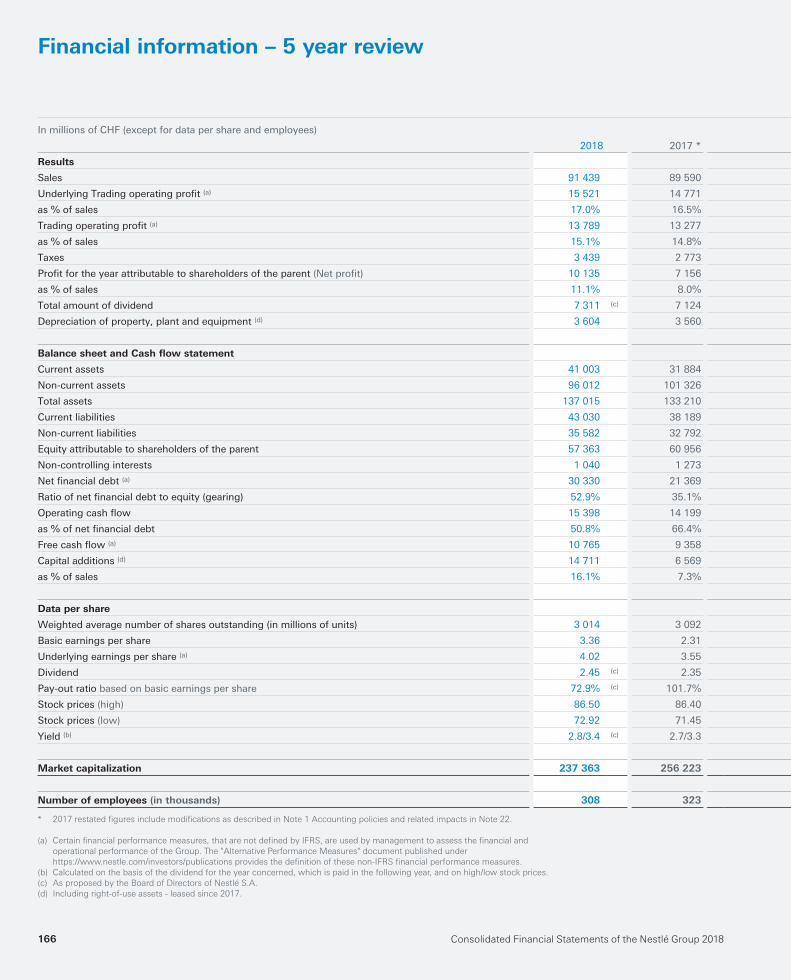
Consolidated Financial Statements of the Nestlé Group 2018166
Financial information – 5 year review
In millions of CHF (except for data per share and employees)
2018 2017 * 2016 2015 2014
Results Results
Sales 91 439 89 590 89 469 88 785 91 612 Sales
Underlying Trading operating profit (a) 15 521 14 771 14 307 14 032 14 816 Underlying Trading operating profit (a)
as % of sales 17.0% 16.5% 16.0% 15.8% 16.2% as % of sales
Trading operating profit (a) 13 789 13 277 13 693 13 382 14 019 Trading operating profit (a)
as % of sales 15.1% 14.8% 15.3% 15.1% 15.3% as % of sales
Taxes 3 439 2 773 4 413 3 305 3 367 Taxes
Profit for the year attributable to shareholders of the parent (Net profit) 10 135 7 156 8 531 9 066 14 456 Profit for the year attributable to shareholders of the parent (Net profit)
as % of sales 11.1% 8.0% 9.5% 10.2% 15.8% as % of sales
Total amount of dividend 7 311 (c) 7 124 7 126 6 937 6 950 Total amount of dividend
Depreciation of property, plant and equipment (d) 3 604 3 560 2 795 2 861 2 782 Depreciation of property, plant and equipment (d)
Balance sheet and Cash flow statement Balance sheet and Cash flow statement
Current assets 41 003 31 884 32 042 29 434 33 961 Current assets
Non-current assets 96 012 101 326 99 859 94 558 99 489 Non-current assets
Total assets 137 015 133 210 131 901 123 992 133 450 Total assets
Current liabilities 43 030 38 189 37 517 33 321 32 895 Current liabilities
Non-current liabilities 35 582 32 792 28 403 26 685 28 671 Non-current liabilities
Equity attributable to shareholders of the parent 57 363 60 956 64 590 62 338 70 130 Equity attributable to shareholders of the parent
Non-controlling interests 1 040 1 273 1 391 1 648 1 754 Non-controlling interests
Net financial debt (a) 30 330 21 369 13 913 15 425 12 325 Net financial debt (a)
Ratio of net financial debt to equity (gearing) 52.9% 35.1% 21.5% 24.7% 17.6% Ratio of net financial debt to equity (gearing)
Operating cash flow 15 398 14 199 15 582 14 302 14 700 Operating cash flow
as % of net financial debt 50.8% 66.4% 112.0% 92.7% 119.3% as % of net financial debt
Free cash flow (a) 10 765 9 358 10 108 9 945 14 137 Free cash flow (a)
Capital additions (d) 14 711 6 569 5 462 4 883 14 263 Capital additions (d)
as % of sales 16.1% 7.3% 6.1% 5.5% 15.6% as % of sales
Data per share Data per share
Weighted average number of shares outstanding (in millions of units) 3 014 3 092 3 091 3 129 3 188 Weighted average number of shares outstanding (in millions of units)
Basic earnings per share 3.36 2.31 2.76 2.90 4.54 Basic earnings per share
Underlying earnings per share (a) 4.02 3.55 3.40 3.31 3.44 Underlying earnings per share (a)
Dividend 2.45 (c) 2.35 2.30 2.25 2.20 Dividend
Pay-out ratio based on basic earnings per share 72.9% (c) 101.7% 83.3% 77.6% 48.5% Pay-out ratio based on basic earnings per share
Stock prices (high) 86.50 86.40 80.05 77.00 73.30 Stock prices (high)
Stock prices (low) 72.92 71.45 67.00 64.55 63.85 Stock prices (low)
Yield (b) 2.8/3.4 (c) 2.7/3.3 2.9/3.4 2.9/3.5 3.0/3.4 Yield (b)
Market capitalization 237 363 256 223 226 310 229 947 231 136 Market capitalization
Number of employees (in thousands) 308 323 328 335 339 Number of employees (in thousands)
* 2017restatedfiguresincludemodificationsasdescribedinNote1AccountingpoliciesandrelatedimpactsinNote22.
(a) Certainfinancialperformancemeasures,thatarenotdefinedbyIFRS,areusedbymanagementtoassessthefinancialand
operationalperformanceoftheGroup.The"AlternativePerformanceMeasures"documentpublishedunder
https://www.nestle.com/investors/publicationsprovidesthedefinitionofthesenon-IFRSfinancialperformancemeasures.
(b) Calculatedonthebasisofthedividendfortheyearconcerned,whichispaidinthefollowingyear,andonhigh/lowstockprices.
(c) AsproposedbytheBoardofDirectorsofNestléS.A.
(d) Includingright-of-useassets-leasedsince2017.
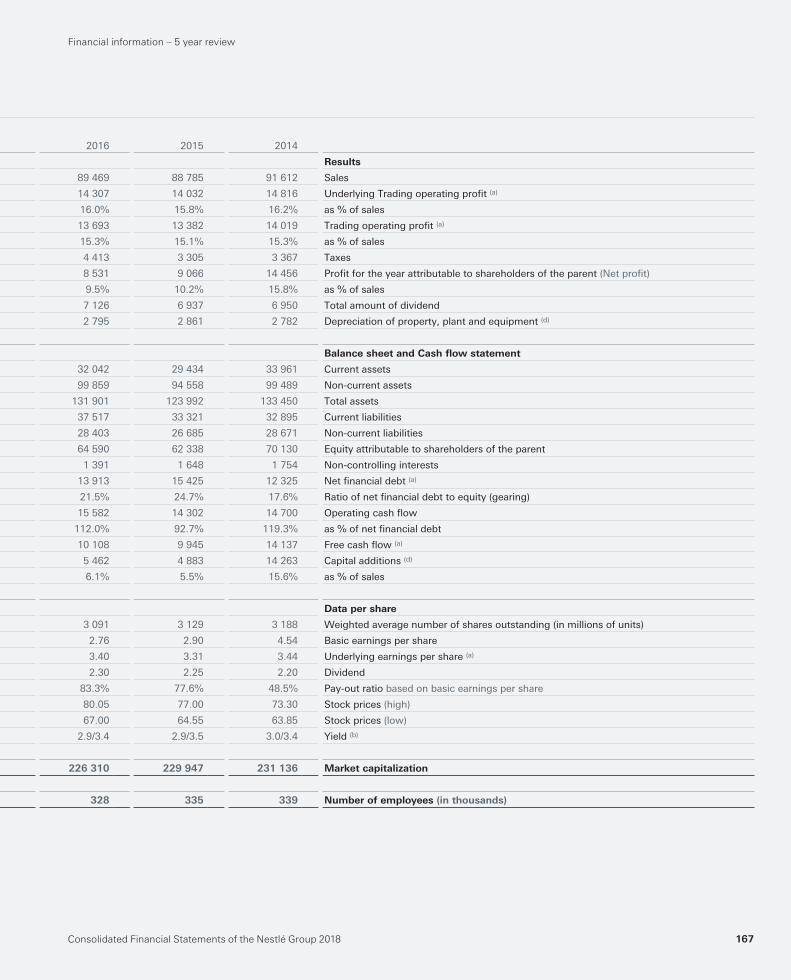
Consolidated Financial Statements of the Nestlé Group 2018 167
Financial information – 5 year review
In millions of CHF (except for data per share and employees)
2018 2017 * 2016 2015 2014
Results Results
Sales 91 439 89 590 89 469 88 785 91 612 Sales
Underlying Trading operating profit (a) 15 521 14 771 14 307 14 032 14 816 Underlying Trading operating profit (a)
as % of sales 17.0% 16.5% 16.0% 15.8% 16.2% as % of sales
Trading operating profit (a) 13 789 13 277 13 693 13 382 14 019 Trading operating profit (a)
as % of sales 15.1% 14.8% 15.3% 15.1% 15.3% as % of sales
Taxes 3 439 2 773 4 413 3 305 3 367 Taxes
Profit for the year attributable to shareholders of the parent (Net profit) 10 135 7 156 8 531 9 066 14 456 Profit for the year attributable to shareholders of the parent (Net profit)
as % of sales 11.1% 8.0% 9.5% 10.2% 15.8% as % of sales
Total amount of dividend 7 311 (c) 7 124 7 126 6 937 6 950 Total amount of dividend
Depreciation of property, plant and equipment (d) 3 604 3 560 2 795 2 861 2 782 Depreciation of property, plant and equipment (d)
Balance sheet and Cash flow statement Balance sheet and Cash flow statement
Current assets 41 003 31 884 32 042 29 434 33 961 Current assets
Non-current assets 96 012 101 326 99 859 94 558 99 489 Non-current assets
Total assets 137 015 133 210 131 901 123 992 133 450 Total assets
Current liabilities 43 030 38 189 37 517 33 321 32 895 Current liabilities
Non-current liabilities 35 582 32 792 28 403 26 685 28 671 Non-current liabilities
Equity attributable to shareholders of the parent 57 363 60 956 64 590 62 338 70 130 Equity attributable to shareholders of the parent
Non-controlling interests 1 040 1 273 1 391 1 648 1 754 Non-controlling interests
Net financial debt (a) 30 330 21 369 13 913 15 425 12 325 Net financial debt (a)
Ratio of net financial debt to equity (gearing) 52.9% 35.1% 21.5% 24.7% 17.6% Ratio of net financial debt to equity (gearing)
Operating cash flow 15 398 14 199 15 582 14 302 14 700 Operating cash flow
as % of net financial debt 50.8% 66.4% 112.0% 92.7% 119.3% as % of net financial debt
Free cash flow (a) 10 765 9 358 10 108 9 945 14 137 Free cash flow (a)
Capital additions (d) 14 711 6 569 5 462 4 883 14 263 Capital additions (d)
as % of sales 16.1% 7.3% 6.1% 5.5% 15.6% as % of sales
Data per share Data per share
Weighted average number of shares outstanding (in millions of units) 3 014 3 092 3 091 3 129 3 188 Weighted average number of shares outstanding (in millions of units)
Basic earnings per share 3.36 2.31 2.76 2.90 4.54 Basic earnings per share
Underlying earnings per share (a) 4.02 3.55 3.40 3.31 3.44 Underlying earnings per share (a)
Dividend 2.45 (c) 2.35 2.30 2.25 2.20 Dividend
Pay-out ratio based on basic earnings per share 72.9% (c) 101.7% 83.3% 77.6% 48.5% Pay-out ratio based on basic earnings per share
Stock prices (high) 86.50 86.40 80.05 77.00 73.30 Stock prices (high)
Stock prices (low) 72.92 71.45 67.00 64.55 63.85 Stock prices (low)
Yield (b) 2.8/3.4 (c) 2.7/3.3 2.9/3.4 2.9/3.5 3.0/3.4 Yield (b)
Market capitalization 237 363 256 223 226 310 229 947 231 136 Market capitalization
Number of employees (in thousands) 308 323 328 335 339 Number of employees (in thousands)
* 2017restatedfiguresincludemodificationsasdescribedinNote1AccountingpoliciesandrelatedimpactsinNote22.
(a) Certainfinancialperformancemeasures,thatarenotdefinedbyIFRS,areusedbymanagementtoassessthefinancialand
operationalperformanceoftheGroup.The"AlternativePerformanceMeasures"documentpublishedunder
https://www.nestle.com/investors/publicationsprovidesthedefinitionofthesenon-IFRSfinancialperformancemeasures.
(b) Calculatedonthebasisofthedividendfortheyearconcerned,whichispaidinthefollowingyear,andonhigh/lowstockprices.
(c) AsproposedbytheBoardofDirectorsofNestléS.A.
(d) Includingright-of-useassets-leasedsince2017.
Financialinformation–5yearreview
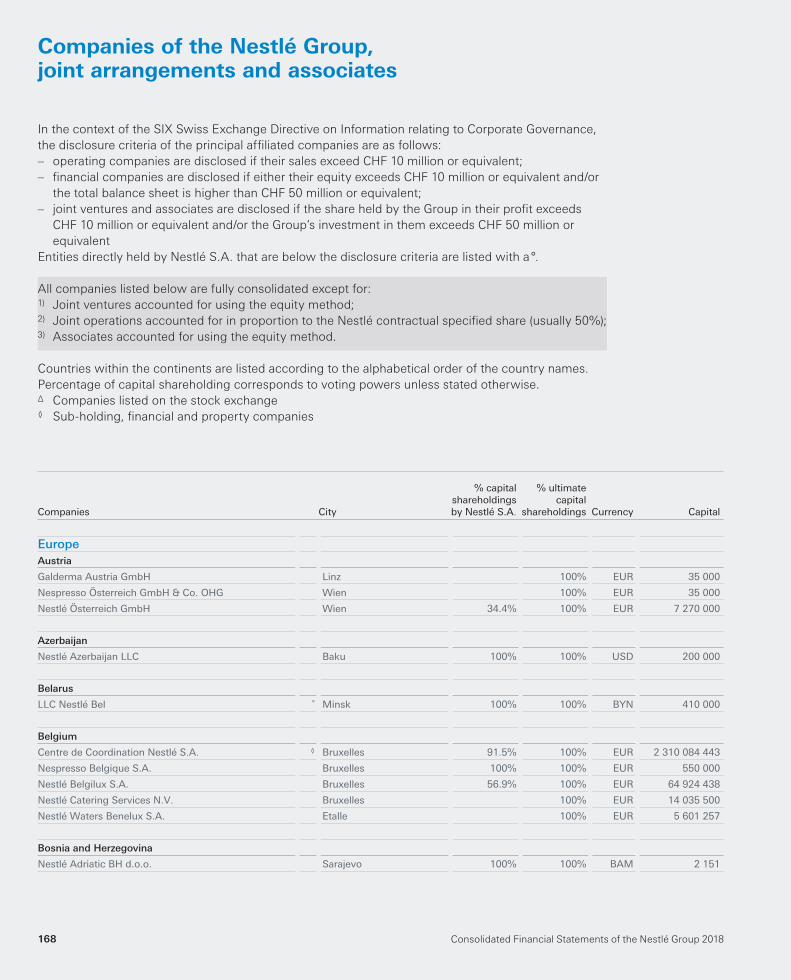
Companies of the Nestlé Group, joint arrangements and associates
In the context of the SIX Swiss Exchange Directive on Information relating to Corporate Governance,
the disclosure criteria of the principal affi liated companies are as follows:
– operating companies are disclosed if their sales exceed CHF 10 million or equivalent;
– fi nancial companies are disclosed if either their equity exceeds CHF 10 million or equivalent and/or
the total balance sheet is higher than CHF 50 million or equivalent;
– joint ventures and associates are disclosed if the share held by the Group in their profi t exceeds
CHF 10 million or equivalent and/or the Group’s investment in them exceeds CHF 50 million or
equivalent
Entities directly held by Nestlé S.A. that are below the disclosure criteria are listed with a °.
EuropeAustria
Galderma Austria GmbH Linz 100% EUR 35 000
Nespresso Österreich GmbH & Co. OHG Wien 100% EUR 35 000
Nestlé Österreich GmbH Wien 34.4% 100% EUR 7 270 000
Azerbaijan
Nestlé Azerbaijan LLC Baku 100% 100% USD 200 000
Belarus
LLC Nestlé Bel ° Minsk 100% 100% BYN 410 000
Belgium
Centre de Coordination Nestlé S.A. ◊ Bruxelles 91.5% 100% EUR 2 310 084 443
Nespresso Belgique S.A. Bruxelles 100% 100% EUR 550 000
Nestlé Belgilux S.A. Bruxelles 56.9% 100% EUR 64 924 438
Nestlé Catering Services N.V. Bruxelles 100% EUR 14 035 500
Nestlé Waters Benelux S.A. Etalle 100% EUR 5 601 257
Bosnia and Herzegovina
Nestlé Adriatic BH d.o.o. Sarajevo 100% 100% BAM 2 151
All companies listed below are fully consolidated except for:1) Joint ventures accounted for using the equity method;2) Joint operations accounted for in proportion to the Nestlé contractual specifi ed share (usually 50%);3) Associates accounted for using the equity method.
Countries within the continents are listed according to the alphabetical order of the country names.
Percentage of capital shareholding corresponds to voting powers unless stated otherwise.Δ Companies listed on the stock exchange◊ Sub-holding, fi nancial and property companies
Consolidated Financial Statements of the Nestlé Group 2018168
Companies City
% capitalshareholdingsby Nestlé S.A.
% ultimate capital
shareholdings Currency Capital
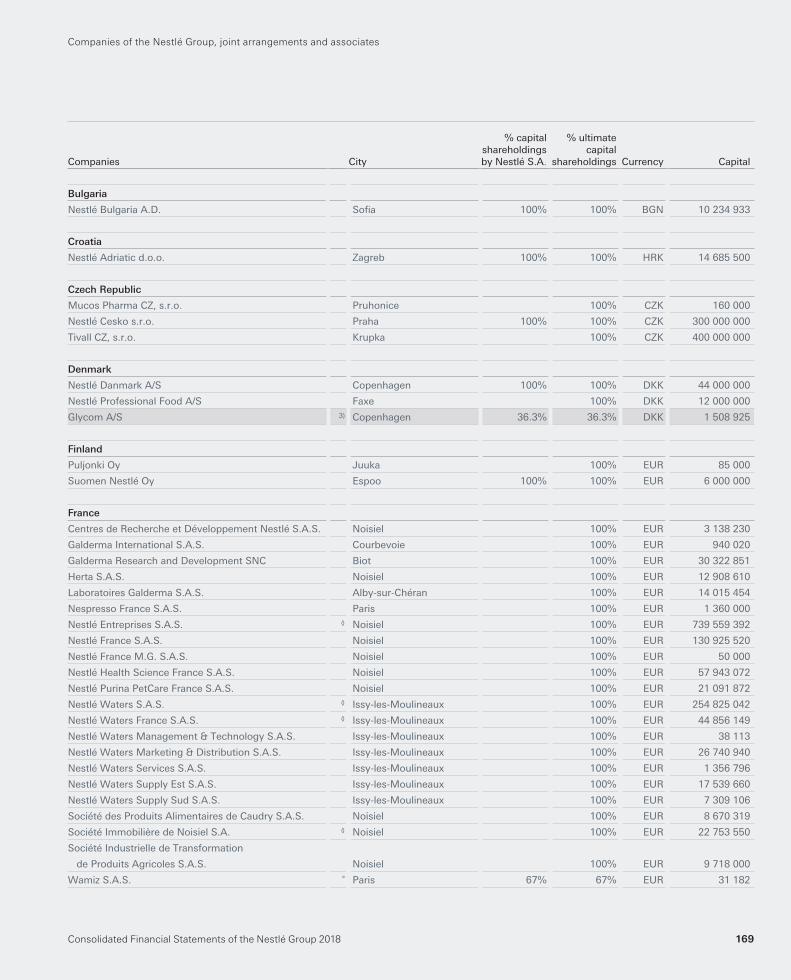
Bulgaria
Nestlé Bulgaria A.D. Sofi a 100% 100% BGN 10 234 933
Croatia
Nestlé Adriatic d.o.o. Zagreb 100% 100% HRK 14 685 500
Czech Republic
Mucos Pharma CZ, s.r.o. Pruhonice 100% CZK 160 000
Nestlé Cesko s.r.o. Praha 100% 100% CZK 300 000 000
Tivall CZ, s.r.o. Krupka 100% CZK 400 000 000
Denmark
Nestlé Danmark A/S Copenhagen 100% 100% DKK 44 000 000
Nestlé Professional Food A/S Faxe 100% DKK 12 000 000
Glycom A/S 3) Copenhagen 36.3% 36.3% DKK 1 508 925
Finland
Puljonki Oy Juuka 100% EUR 85 000
Suomen Nestlé Oy Espoo 100% 100% EUR 6 000 000
France
Centres de Recherche et Développement Nestlé S.A.S. Noisiel 100% EUR 3 138 230
Galderma International S.A.S. Courbevoie 100% EUR 940 020
Galderma Research and Development SNC Biot 100% EUR 30 322 851
Herta S.A.S. Noisiel 100% EUR 12 908 610
Laboratoires Galderma S.A.S. Alby-sur-Chéran 100% EUR 14 015 454
Nespresso France S.A.S. Paris 100% EUR 1 360 000
Nestlé Entreprises S.A.S. ◊ Noisiel 100% EUR 739 559 392
Nestlé France S.A.S. Noisiel 100% EUR 130 925 520
Nestlé France M.G. S.A.S. Noisiel 100% EUR 50 000
Nestlé Health Science France S.A.S. Noisiel 100% EUR 57 943 072
Nestlé Purina PetCare France S.A.S. Noisiel 100% EUR 21 091 872
Nestlé Waters S.A.S. ◊ Issy-les-Moulineaux 100% EUR 254 825 042
Nestlé Waters France S.A.S. ◊ Issy-les-Moulineaux 100% EUR 44 856 149
Nestlé Waters Management & Technology S.A.S. Issy-les-Moulineaux 100% EUR 38 113
Nestlé Waters Marketing & Distribution S.A.S. Issy-les-Moulineaux 100% EUR 26 740 940
Nestlé Waters Services S.A.S. Issy-les-Moulineaux 100% EUR 1 356 796
Nestlé Waters Supply Est S.A.S. Issy-les-Moulineaux 100% EUR 17 539 660
Nestlé Waters Supply Sud S.A.S. Issy-les-Moulineaux 100% EUR 7 309 106
Société des Produits Alimentaires de Caudry S.A.S. Noisiel 100% EUR 8 670 319
Société Immobilière de Noisiel S.A. ◊ Noisiel 100% EUR 22 753 550
Société Industrielle de Transformation
de Produits Agricoles S.A.S. Noisiel 100% EUR 9 718 000
Wamiz S.A.S. ° Paris 67% 67% EUR 31 182
Companies of the Nestlé Group, joint arrangements and associates
Consolidated Financial Statements of the Nestlé Group 2018 169
Companies City
% capitalshareholdingsby Nestlé S.A.
% ultimate capital
shareholdings Currency Capital
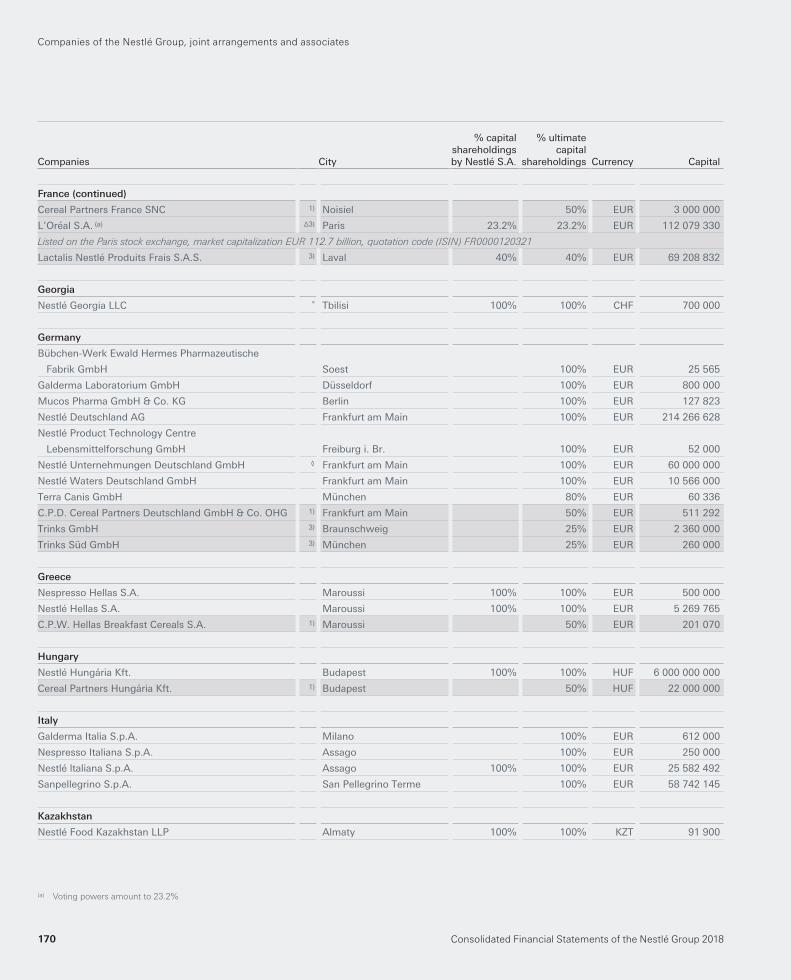
France (continued)
Cereal Partners France SNC 1) Noisiel 50% EUR 3 000 000
L’Oréal S.A. (a) Δ3) Paris 23.2% 23.2% EUR 112 079 330
Listed on the Paris stock exchange, market capitalization EUR 112.7 billion, quotation code (ISIN) FR0000120321
Lactalis Nestlé Produits Frais S.A.S. 3) Laval 40% 40% EUR 69 208 832
Georgia
Nestlé Georgia LLC ° Tbilisi 100% 100% CHF 700 000
Germany
Bübchen-Werk Ewald Hermes Pharmazeutische
Fabrik GmbH Soest 100% EUR 25 565
Galderma Laboratorium GmbH Düsseldorf 100% EUR 800 000
Mucos Pharma GmbH & Co. KG Berlin 100% EUR 127 823
Nestlé Deutschland AG Frankfurt am Main 100% EUR 214 266 628
Nestlé Product Technology Centre
Lebensmittelforschung GmbH Freiburg i. Br. 100% EUR 52 000
Nestlé Unternehmungen Deutschland GmbH ◊ Frankfurt am Main 100% EUR 60 000 000
Nestlé Waters Deutschland GmbH Frankfurt am Main 100% EUR 10 566 000
Terra Canis GmbH München 80% EUR 60 336
C.P.D. Cereal Partners Deutschland GmbH & Co. OHG 1) Frankfurt am Main 50% EUR 511 292
Trinks GmbH 3) Braunschweig 25% EUR 2 360 000
Trinks Süd GmbH 3) München 25% EUR 260 000
Greece
Nespresso Hellas S.A. Maroussi 100% 100% EUR 500 000
Nestlé Hellas S.A. Maroussi 100% 100% EUR 5 269 765
C.P.W. Hellas Breakfast Cereals S.A. 1) Maroussi 50% EUR 201 070
Hungary
Nestlé Hungária Kft. Budapest 100% 100% HUF 6 000 000 000
Cereal Partners Hungária Kft. 1) Budapest 50% HUF 22 000 000
Italy
Galderma Italia S.p.A. Milano 100% EUR 612 000
Nespresso Italiana S.p.A. Assago 100% EUR 250 000
Nestlé ltaliana S.p.A. Assago 100% 100% EUR 25 582 492
Sanpellegrino S.p.A. San Pellegrino Terme 100% EUR 58 742 145
Kazakhstan
Nestlé Food Kazakhstan LLP Almaty 100% 100% KZT 91 900
(a) Voting powers amount to 23.2%
Companies of the Nestlé Group, joint arrangements and associates
Companies City
% capitalshareholdingsby Nestlé S.A.
% ultimate capital
shareholdings Currency Capital
Consolidated Financial Statements of the Nestlé Group 2018170
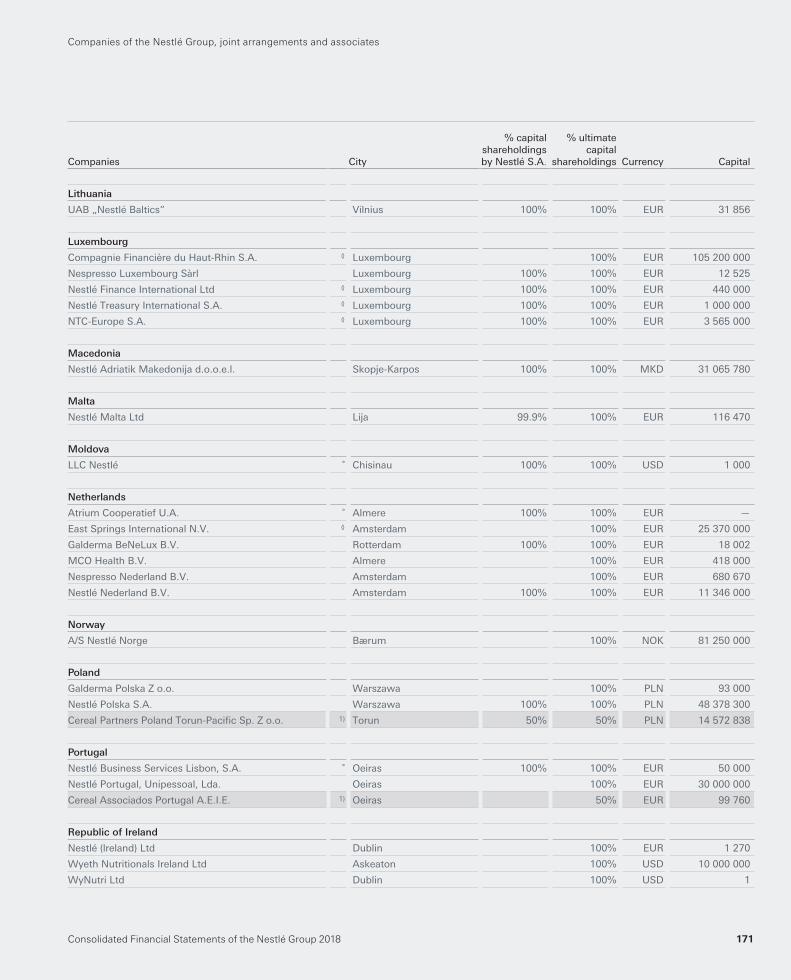
Lithuania
UAB „Nestlé Baltics” Vilnius 100% 100% EUR 31 856
Luxembourg
Compagnie Financière du Haut-Rhin S.A. ◊ Luxembourg 100% EUR 105 200 000
Nespresso Luxembourg Sàrl Luxembourg 100% 100% EUR 12 525
Nestlé Finance International Ltd ◊ Luxembourg 100% 100% EUR 440 000
Nestlé Treasury International S.A. ◊ Luxembourg 100% 100% EUR 1 000 000
NTC-Europe S.A. ◊ Luxembourg 100% 100% EUR 3 565 000
Macedonia
Nestlé Adriatik Makedonija d.o.o.e.l. Skopje-Karpos 100% 100% MKD 31 065 780
Malta
Nestlé Malta Ltd Lija 99.9% 100% EUR 116 470
Moldova
LLC Nestlé ° Chisinau 100% 100% USD 1 000
Netherlands
Atrium Cooperatief U.A. ° Almere 100% 100% EUR —
East Springs International N.V. ◊ Amsterdam 100% EUR 25 370 000
Galderma BeNeLux B.V. Rotterdam 100% 100% EUR 18 002
MCO Health B.V. Almere 100% EUR 418 000
Nespresso Nederland B.V. Amsterdam 100% EUR 680 670
Nestlé Nederland B.V. Amsterdam 100% 100% EUR 11 346 000
Norway
A/S Nestlé Norge Bærum 100% NOK 81 250 000
Poland
Galderma Polska Z o.o. Warszawa 100% PLN 93 000
Nestlé Polska S.A. Warszawa 100% 100% PLN 48 378 300
Cereal Partners Poland Torun-Pacifi c Sp. Z o.o. 1) Torun 50% 50% PLN 14 572 838
Portugal
Nestlé Business Services Lisbon, S.A. ° Oeiras 100% 100% EUR 50 000
Nestlé Portugal, Unipessoal, Lda. Oeiras 100% EUR 30 000 000
Cereal Associados Portugal A.E.I.E. 1) Oeiras 50% EUR 99 760
Republic of Ireland
Nestlé (lreland) Ltd Dublin 100% EUR 1 270
Wyeth Nutritionals Ireland Ltd Askeaton 100% USD 10 000 000
WyNutri Ltd Dublin 100% USD 1
Companies of the Nestlé Group, joint arrangements and associates
Consolidated Financial Statements of the Nestlé Group 2018 171
Companies City
% capitalshareholdingsby Nestlé S.A.
% ultimate capital
shareholdings Currency Capital
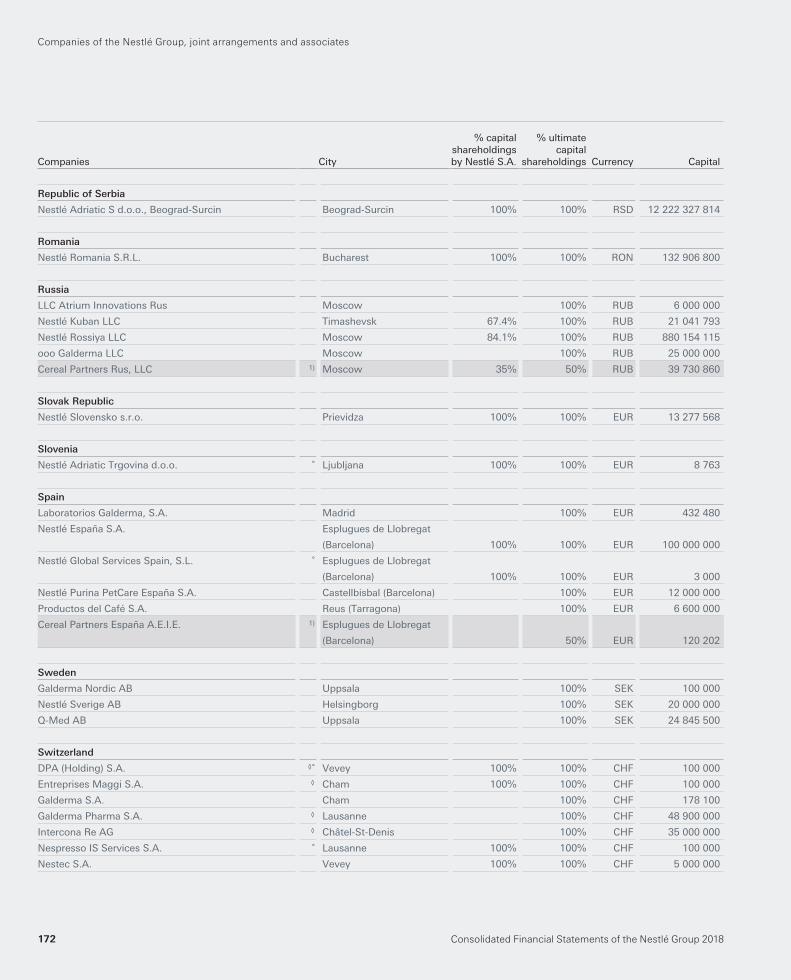
Republic of Serbia
Nestlé Adriatic S d.o.o., Beograd-Surcin Beograd-Surcin 100% 100% RSD 12 222 327 814
Romania
Nestlé Romania S.R.L. Bucharest 100% 100% RON 132 906 800
Russia
LLC Atrium Innovations Rus Moscow 100% RUB 6 000 000
Nestlé Kuban LLC Timashevsk 67.4% 100% RUB 21 041 793
Nestlé Rossiya LLC Moscow 84.1% 100% RUB 880 154 115
ooo Galderma LLC Moscow 100% RUB 25 000 000
Cereal Partners Rus, LLC 1) Moscow 35% 50% RUB 39 730 860
Slovak Republic
Nestlé Slovensko s.r.o. Prievidza 100% 100% EUR 13 277 568
Slovenia
Nestlé Adriatic Trgovina d.o.o. ° Ljubljana 100% 100% EUR 8 763
Spain
Laboratorios Galderma, S.A. Madrid 100% EUR 432 480
Nestlé España S.A. Esplugues de Llobregat
(Barcelona) 100% 100% EUR 100 000 000
Nestlé Global Services Spain, S.L. ° Esplugues de Llobregat
(Barcelona) 100% 100% EUR 3 000
Nestlé Purina PetCare España S.A. Castellbisbal (Barcelona) 100% EUR 12 000 000
Productos del Café S.A. Reus (Tarragona) 100% EUR 6 600 000
Cereal Partners España A.E.I.E. 1) Esplugues de Llobregat
(Barcelona) 50% EUR 120 202
Sweden
Galderma Nordic AB Uppsala 100% SEK 100 000
Nestlé Sverige AB Helsingborg 100% SEK 20 000 000
Q-Med AB Uppsala 100% SEK 24 845 500
Switzerland
DPA (Holding) S.A. ◊° Vevey 100% 100% CHF 100 000
Entreprises Maggi S.A. ◊ Cham 100% 100% CHF 100 000
Galderma S.A. Cham 100% CHF 178 100
Galderma Pharma S.A. ◊ Lausanne 100% CHF 48 900 000
Intercona Re AG ◊ Châtel-St-Denis 100% CHF 35 000 000
Nespresso IS Services S.A. ° Lausanne 100% 100% CHF 100 000
Nestec S.A. Vevey 100% 100% CHF 5 000 000
Companies of the Nestlé Group, joint arrangements and associates
Companies City
% capitalshareholdingsby Nestlé S.A.
% ultimate capital
shareholdings Currency Capital
Consolidated Financial Statements of the Nestlé Group 2018172
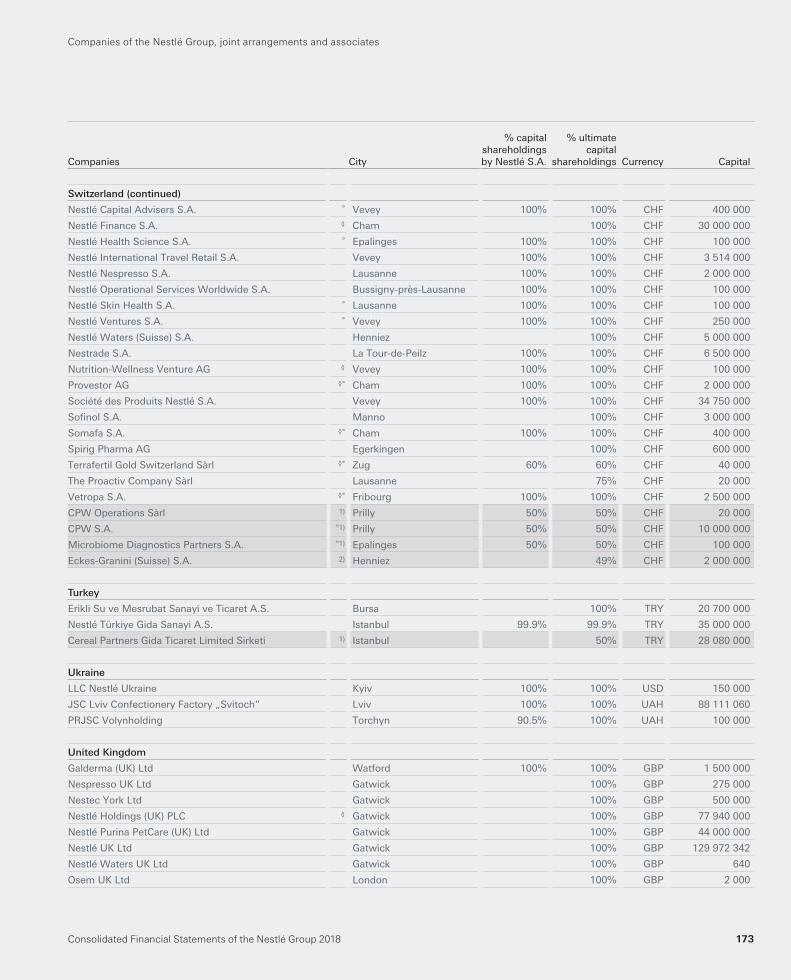
Switzerland (continued)
Nestlé Capital Advisers S.A. ° Vevey 100% 100% CHF 400 000
Nestlé Finance S.A. ◊ Cham 100% CHF 30 000 000
Nestlé Health Science S.A. ° Epalinges 100% 100% CHF 100 000
Nestlé International Travel Retail S.A. Vevey 100% 100% CHF 3 514 000
Nestlé Nespresso S.A. Lausanne 100% 100% CHF 2 000 000
Nestlé Operational Services Worldwide S.A. Bussigny-près-Lausanne 100% 100% CHF 100 000
Nestlé Skin Health S.A. ° Lausanne 100% 100% CHF 100 000
Nestlé Ventures S.A. ° Vevey 100% 100% CHF 250 000
Nestlé Waters (Suisse) S.A. Henniez 100% CHF 5 000 000
Nestrade S.A. La Tour-de-Peilz 100% 100% CHF 6 500 000
Nutrition-Wellness Venture AG ◊ Vevey 100% 100% CHF 100 000
Provestor AG ◊° Cham 100% 100% CHF 2 000 000
Société des Produits Nestlé S.A. Vevey 100% 100% CHF 34 750 000
Sofi nol S.A. Manno 100% CHF 3 000 000
Somafa S.A. ◊° Cham 100% 100% CHF 400 000
Spirig Pharma AG Egerkingen 100% CHF 600 000
Terrafertil Gold Switzerland Sàrl ◊° Zug 60% 60% CHF 40 000
The Proactiv Company Sàrl Lausanne 75% CHF 20 000
Vetropa S.A. ◊° Fribourg 100% 100% CHF 2 500 000
CPW Operations Sàrl 1) Prilly 50% 50% CHF 20 000
CPW S.A. °1) Prilly 50% 50% CHF 10 000 000
Microbiome Diagnostics Partners S.A. °1) Epalinges 50% 50% CHF 100 000
Eckes-Granini (Suisse) S.A. 2) Henniez 49% CHF 2 000 000
Turkey
Erikli Su ve Mesrubat Sanayi ve Ticaret A.S. Bursa 100% TRY 20 700 000
Nestlé Türkiye Gida Sanayi A.S. Istanbul 99.9% 99.9% TRY 35 000 000
Cereal Partners Gida Ticaret Limited Sirketi 1) Istanbul 50% TRY 28 080 000
Ukraine
LLC Nestlé Ukraine Kyiv 100% 100% USD 150 000
JSC Lviv Confectionery Factory „Svitoch” Lviv 100% 100% UAH 88 111 060
PRJSC Volynholding Torchyn 90.5% 100% UAH 100 000
United Kingdom
Galderma (UK) Ltd Watford 100% 100% GBP 1 500 000
Nespresso UK Ltd Gatwick 100% GBP 275 000
Nestec York Ltd Gatwick 100% GBP 500 000
Nestlé Holdings (UK) PLC ◊ Gatwick 100% GBP 77 940 000
Nestlé Purina PetCare (UK) Ltd Gatwick 100% GBP 44 000 000
Nestlé UK Ltd Gatwick 100% GBP 129 972 342
Nestlé Waters UK Ltd Gatwick 100% GBP 640
Osem UK Ltd London 100% GBP 2 000
Companies of the Nestlé Group, joint arrangements and associates
Consolidated Financial Statements of the Nestlé Group 2018 173
Companies City
% capitalshareholdingsby Nestlé S.A.
% ultimate capital
shareholdings Currency Capital
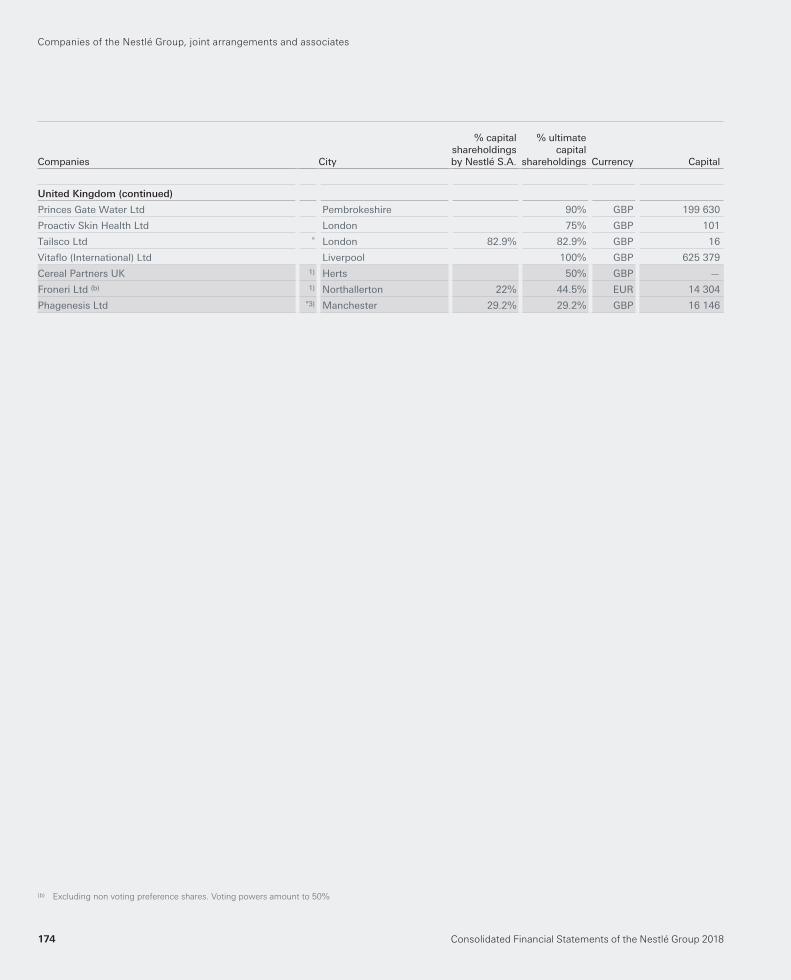
United Kingdom (continued)
Princes Gate Water Ltd Pembrokeshire 90% GBP 199 630
Proactiv Skin Health Ltd London 75% GBP 101
Tailsco Ltd ° London 82.9% 82.9% GBP 16
Vitafl o (International) Ltd Liverpool 100% GBP 625 379
Cereal Partners UK 1) Herts 50% GBP —
Froneri Ltd (b) 1) Northallerton 22% 44.5% EUR 14 304
Phagenesis Ltd °3) Manchester 29.2% 29.2% GBP 16 146
(b) Excluding non voting preference shares. Voting powers amount to 50%
Companies of the Nestlé Group, joint arrangements and associates
Companies City
% capitalshareholdingsby Nestlé S.A.
% ultimate capital
shareholdings Currency Capital
Consolidated Financial Statements of the Nestlé Group 2018174
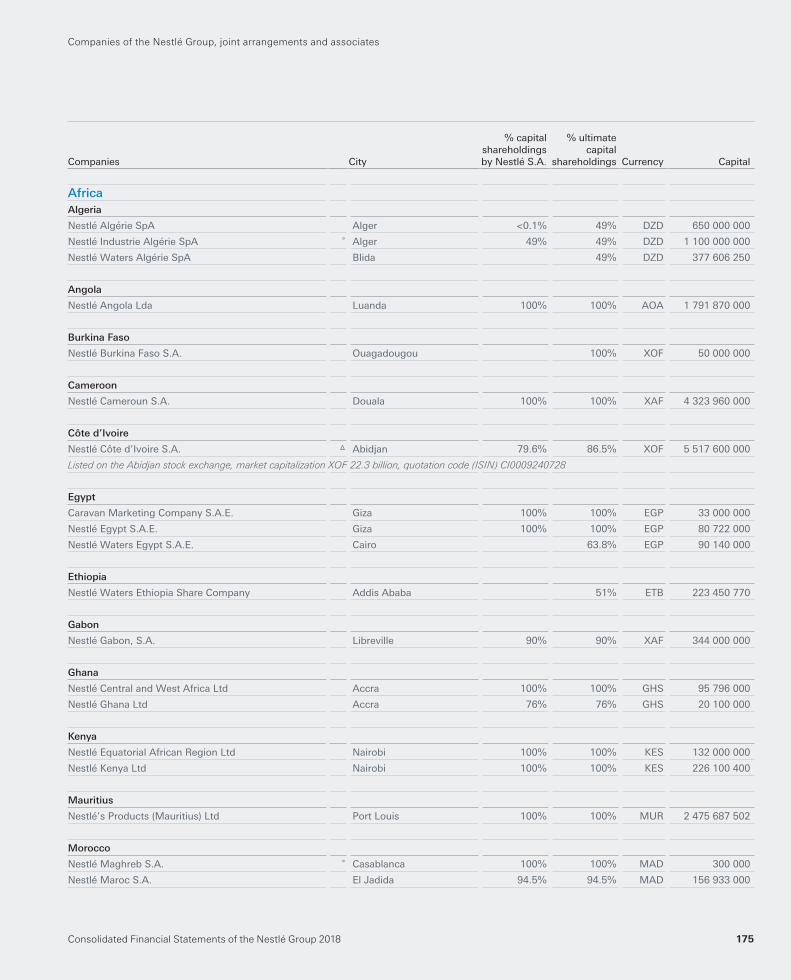
AfricaAlgeria
Nestlé Algérie SpA Alger <0.1% 49% DZD 650 000 000
Nestlé Industrie Algérie SpA ° Alger 49% 49% DZD 1 100 000 000
Nestlé Waters Algérie SpA Blida 49% DZD 377 606 250
Angola
Nestlé Angola Lda Luanda 100% 100% AOA 1 791 870 000
Burkina Faso
Nestlé Burkina Faso S.A. Ouagadougou 100% XOF 50 000 000
Cameroon
Nestlé Cameroun S.A. Douala 100% 100% XAF 4 323 960 000
Côte d’Ivoire
Nestlé Côte d’Ivoire S.A. Δ Abidjan 79.6% 86.5% XOF 5 517 600 000
Listed on the Abidjan stock exchange, market capitalization XOF 22.3 billion, quotation code (ISIN) CI0009240728
Egypt
Caravan Marketing Company S.A.E. Giza 100% 100% EGP 33 000 000
Nestlé Egypt S.A.E. Giza 100% 100% EGP 80 722 000
Nestlé Waters Egypt S.A.E. Cairo 63.8% EGP 90 140 000
Ethiopia
Nestlé Waters Ethiopia Share Company Addis Ababa 51% ETB 223 450 770
Gabon
Nestlé Gabon, S.A. Libreville 90% 90% XAF 344 000 000
Ghana
Nestlé Central and West Africa Ltd Accra 100% 100% GHS 95 796 000
Nestlé Ghana Ltd Accra 76% 76% GHS 20 100 000
Kenya
Nestlé Equatorial African Region Ltd Nairobi 100% 100% KES 132 000 000
Nestlé Kenya Ltd Nairobi 100% 100% KES 226 100 400
Mauritius
Nestlé’s Products (Mauritius) Ltd Port Louis 100% 100% MUR 2 475 687 502
Morocco
Nestlé Maghreb S.A. ° Casablanca 100% 100% MAD 300 000
Nestlé Maroc S.A. El Jadida 94.5% 94.5% MAD 156 933 000
Companies of the Nestlé Group, joint arrangements and associates
Consolidated Financial Statements of the Nestlé Group 2018 175
Companies City
% capitalshareholdingsby Nestlé S.A.
% ultimate capital
shareholdings Currency Capital
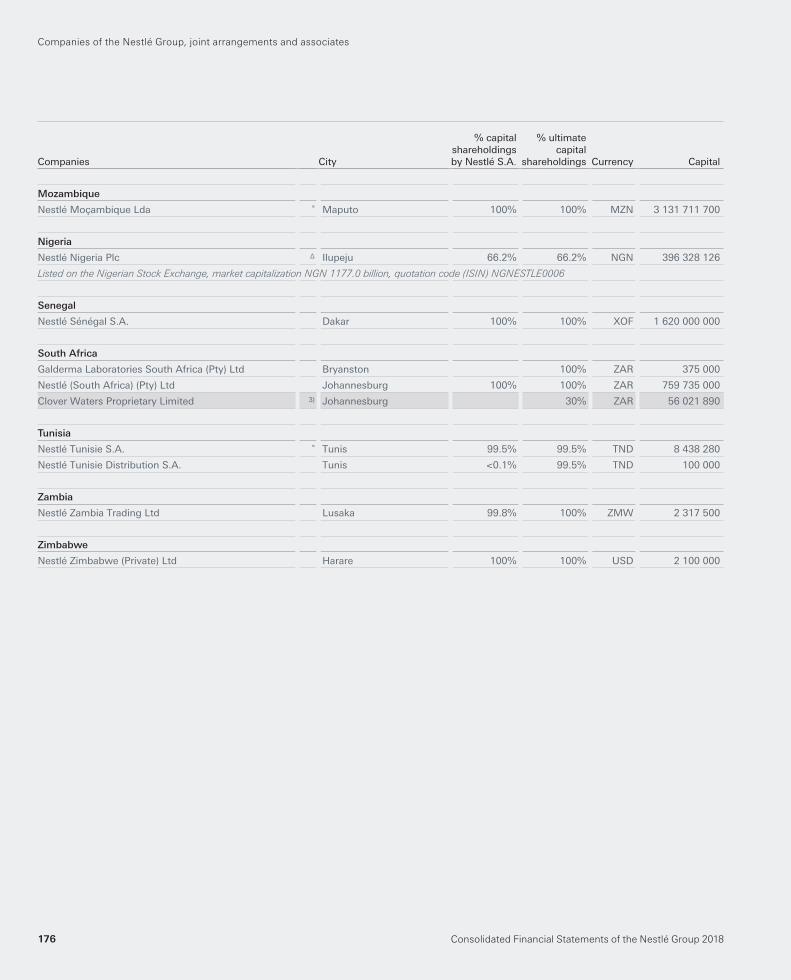
Mozambique
Nestlé Moçambique Lda ° Maputo 100% 100% MZN 3 131 711 700
Nigeria
Nestlé Nigeria Plc Δ Ilupeju 66.2% 66.2% NGN 396 328 126
Listed on the Nigerian Stock Exchange, market capitalization NGN 1177.0 billion, quotation code (ISIN) NGNESTLE0006
Senegal
Nestlé Sénégal S.A. Dakar 100% 100% XOF 1 620 000 000
South Africa
Galderma Laboratories South Africa (Pty) Ltd Bryanston 100% ZAR 375 000
Nestlé (South Africa) (Pty) Ltd Johannesburg 100% 100% ZAR 759 735 000
Clover Waters Proprietary Limited 3) Johannesburg 30% ZAR 56 021 890
Tunisia
Nestlé Tunisie S.A. ° Tunis 99.5% 99.5% TND 8 438 280
Nestlé Tunisie Distribution S.A. Tunis <0.1% 99.5% TND 100 000
Zambia
Nestlé Zambia Trading Ltd Lusaka 99.8% 100% ZMW 2 317 500
Zimbabwe
Nestlé Zimbabwe (Private) Ltd Harare 100% 100% USD 2 100 000
Companies of the Nestlé Group, joint arrangements and associates
Companies City
% capitalshareholdingsby Nestlé S.A.
% ultimate capital
shareholdings Currency Capital
Consolidated Financial Statements of the Nestlé Group 2018176
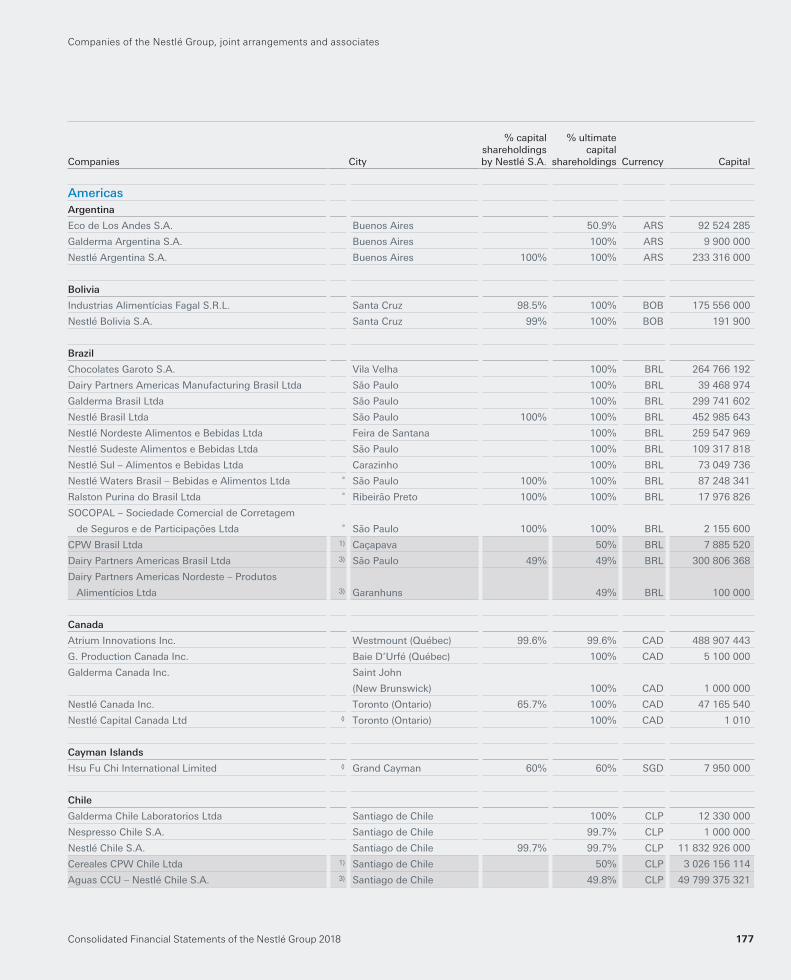
AmericasArgentina
Eco de Los Andes S.A. Buenos Aires 50.9% ARS 92 524 285
Galderma Argentina S.A. Buenos Aires 100% ARS 9 900 000
Nestlé Argentina S.A. Buenos Aires 100% 100% ARS 233 316 000
Bolivia
Industrias Alimentícias Fagal S.R.L. Santa Cruz 98.5% 100% BOB 175 556 000
Nestlé Bolivia S.A. Santa Cruz 99% 100% BOB 191 900
Brazil
Chocolates Garoto S.A. Vila Velha 100% BRL 264 766 192
Dairy Partners Americas Manufacturing Brasil Ltda São Paulo 100% BRL 39 468 974
Galderma Brasil Ltda São Paulo 100% BRL 299 741 602
Nestlé Brasil Ltda São Paulo 100% 100% BRL 452 985 643
Nestlé Nordeste Alimentos e Bebidas Ltda Feira de Santana 100% BRL 259 547 969
Nestlé Sudeste Alimentos e Bebidas Ltda São Paulo 100% BRL 109 317 818
Nestlé Sul – Alimentos e Bebidas Ltda Carazinho 100% BRL 73 049 736
Nestlé Waters Brasil – Bebidas e Alimentos Ltda ° São Paulo 100% 100% BRL 87 248 341
Ralston Purina do Brasil Ltda ° Ribeirão Preto 100% 100% BRL 17 976 826
SOCOPAL – Sociedade Comercial de Corretagem
de Seguros e de Participações Ltda ° São Paulo 100% 100% BRL 2 155 600
CPW Brasil Ltda 1) Caçapava 50% BRL 7 885 520
Dairy Partners Americas Brasil Ltda 3) São Paulo 49% 49% BRL 300 806 368
Dairy Partners Americas Nordeste – Produtos
Alimentícios Ltda 3) Garanhuns 49% BRL 100 000
Canada
Atrium Innovations Inc. Westmount (Québec) 99.6% 99.6% CAD 488 907 443
G. Production Canada Inc. Baie D’Urfé (Québec) 100% CAD 5 100 000
Galderma Canada Inc.
Saint John
(New Brunswick) 100% CAD 1 000 000
Nestlé Canada Inc. Toronto (Ontario) 65.7% 100% CAD 47 165 540
Nestlé Capital Canada Ltd ◊ Toronto (Ontario) 100% CAD 1 010
Cayman Islands
Hsu Fu Chi International Limited ◊ Grand Cayman 60% 60% SGD 7 950 000
Chile
Galderma Chile Laboratorios Ltda Santiago de Chile 100% CLP 12 330 000
Nespresso Chile S.A. Santiago de Chile 99.7% CLP 1 000 000
Nestlé Chile S.A. Santiago de Chile 99.7% 99.7% CLP 11 832 926 000
Cereales CPW Chile Ltda 1) Santiago de Chile 50% CLP 3 026 156 114
Aguas CCU – Nestlé Chile S.A. 3) Santiago de Chile 49.8% CLP 49 799 375 321
Companies of the Nestlé Group, joint arrangements and associates
Consolidated Financial Statements of the Nestlé Group 2018 177
Companies City
% capitalshareholdingsby Nestlé S.A.
% ultimate capital
shareholdings Currency Capital
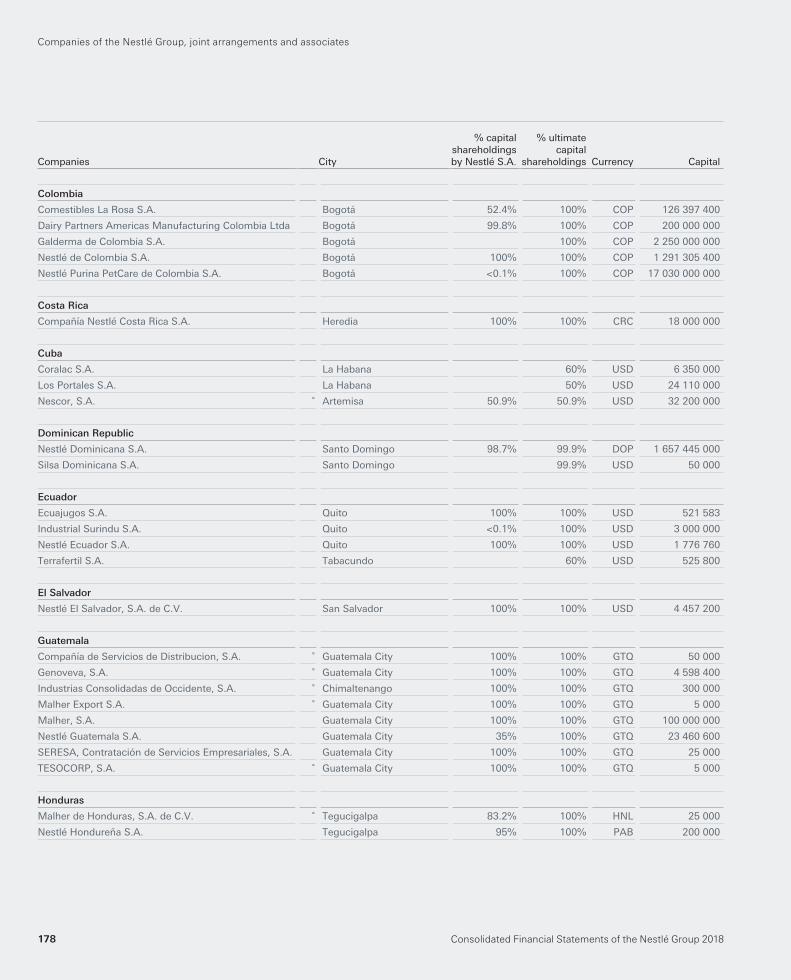
Colombia
Comestibles La Rosa S.A. Bogotá 52.4% 100% COP 126 397 400
Dairy Partners Americas Manufacturing Colombia Ltda Bogotá 99.8% 100% COP 200 000 000
Galderma de Colombia S.A. Bogotá 100% COP 2 250 000 000
Nestlé de Colombia S.A. Bogotá 100% 100% COP 1 291 305 400
Nestlé Purina PetCare de Colombia S.A. Bogotá <0.1% 100% COP 17 030 000 000
Costa Rica
Compañía Nestlé Costa Rica S.A. Heredia 100% 100% CRC 18 000 000
Cuba
Coralac S.A. La Habana 60% USD 6 350 000
Los Portales S.A. La Habana 50% USD 24 110 000
Nescor, S.A. ° Artemisa 50.9% 50.9% USD 32 200 000
Dominican Republic
Nestlé Dominicana S.A. Santo Domingo 98.7% 99.9% DOP 1 657 445 000
Silsa Dominicana S.A. Santo Domingo 99.9% USD 50 000
Ecuador
Ecuajugos S.A. Quito 100% 100% USD 521 583
Industrial Surindu S.A. Quito <0.1% 100% USD 3 000 000
Nestlé Ecuador S.A. Quito 100% 100% USD 1 776 760
Terrafertil S.A. Tabacundo 60% USD 525 800
El Salvador
Nestlé El Salvador, S.A. de C.V. San Salvador 100% 100% USD 4 457 200
Guatemala
Compañía de Servicios de Distribucion, S.A. ° Guatemala City 100% 100% GTQ 50 000
Genoveva, S.A. ° Guatemala City 100% 100% GTQ 4 598 400
Industrias Consolidadas de Occidente, S.A. ° Chimaltenango 100% 100% GTQ 300 000
Malher Export S.A. ° Guatemala City 100% 100% GTQ 5 000
Malher, S.A. Guatemala City 100% 100% GTQ 100 000 000
Nestlé Guatemala S.A. Guatemala City 35% 100% GTQ 23 460 600
SERESA, Contratación de Servicios Empresariales, S.A. Guatemala City 100% 100% GTQ 25 000
TESOCORP, S.A. ° Guatemala City 100% 100% GTQ 5 000
Honduras
Malher de Honduras, S.A. de C.V. ° Tegucigalpa 83.2% 100% HNL 25 000
Nestlé Hondureña S.A. Tegucigalpa 95% 100% PAB 200 000
Companies of the Nestlé Group, joint arrangements and associates
Companies City
% capitalshareholdingsby Nestlé S.A.
% ultimate capital
shareholdings Currency Capital
Consolidated Financial Statements of the Nestlé Group 2018178
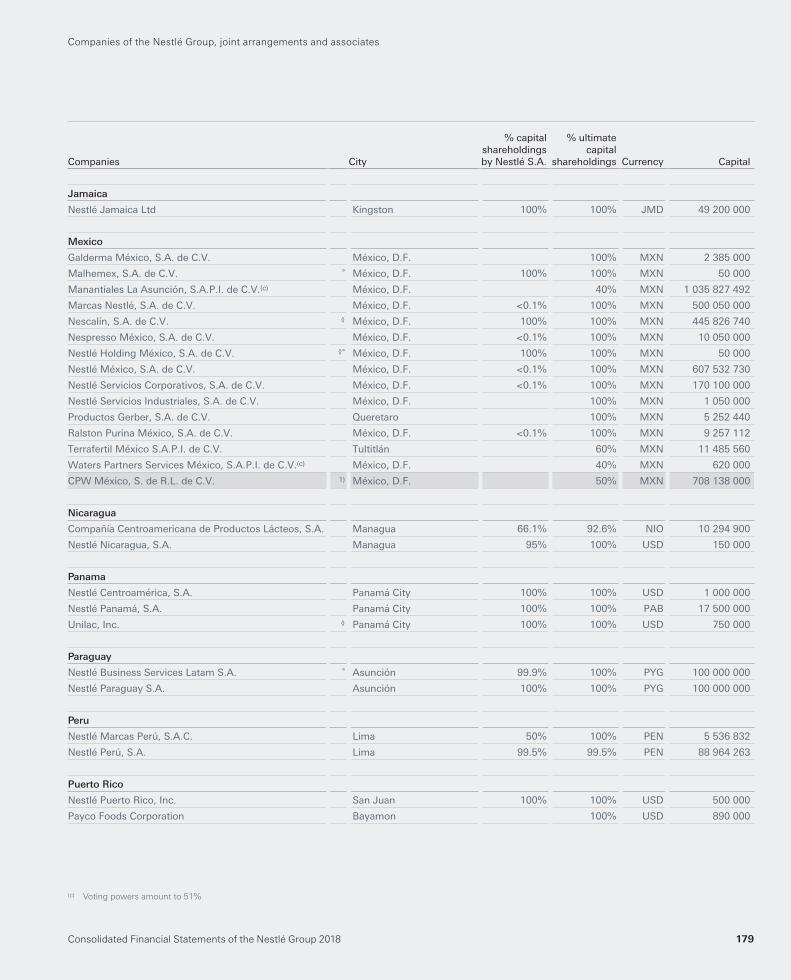
Jamaica
Nestlé Jamaica Ltd Kingston 100% 100% JMD 49 200 000
Mexico
Galderma México, S.A. de C.V. México, D.F. 100% MXN 2 385 000
Malhemex, S.A. de C.V. ° México, D.F. 100% 100% MXN 50 000
Manantiales La Asunción, S.A.P.I. de C.V.(c) México, D.F. 40% MXN 1 035 827 492
Marcas Nestlé, S.A. de C.V. México, D.F. <0.1% 100% MXN 500 050 000
Nescalín, S.A. de C.V. ◊ México, D.F. 100% 100% MXN 445 826 740
Nespresso México, S.A. de C.V. México, D.F. <0.1% 100% MXN 10 050 000
Nestlé Holding México, S.A. de C.V. ◊° México, D.F. 100% 100% MXN 50 000
Nestlé México, S.A. de C.V. México, D.F. <0.1% 100% MXN 607 532 730
Nestlé Servicios Corporativos, S.A. de C.V. México, D.F. <0.1% 100% MXN 170 100 000
Nestlé Servicios Industriales, S.A. de C.V. México, D.F. 100% MXN 1 050 000
Productos Gerber, S.A. de C.V. Queretaro 100% MXN 5 252 440
Ralston Purina México, S.A. de C.V. México, D.F. <0.1% 100% MXN 9 257 112
Terrafertil México S.A.P.I. de C.V. Tultitlán 60% MXN 11 485 560
Waters Partners Services México, S.A.P.I. de C.V.(c) México, D.F. 40% MXN 620 000
CPW México, S. de R.L. de C.V. 1) México, D.F. 50% MXN 708 138 000
Nicaragua
Compañía Centroamericana de Productos Lácteos, S.A. Managua 66.1% 92.6% NIO 10 294 900
Nestlé Nicaragua, S.A. Managua 95% 100% USD 150 000
Panama
Nestlé Centroamérica, S.A. Panamá City 100% 100% USD 1 000 000
Nestlé Panamá, S.A. Panamá City 100% 100% PAB 17 500 000
Unilac, Inc. ◊ Panamá City 100% 100% USD 750 000
Paraguay
Nestlé Business Services Latam S.A. ° Asunción 99.9% 100% PYG 100 000 000
Nestlé Paraguay S.A. Asunción 100% 100% PYG 100 000 000
Peru
Nestlé Marcas Perú, S.A.C. Lima 50% 100% PEN 5 536 832
Nestlé Perú, S.A. Lima 99.5% 99.5% PEN 88 964 263
Puerto Rico
Nestlé Puerto Rico, Inc. San Juan 100% 100% USD 500 000
Payco Foods Corporation Bayamon 100% USD 890 000
(c) Voting powers amount to 51%
Companies of the Nestlé Group, joint arrangements and associates
Consolidated Financial Statements of the Nestlé Group 2018 179
Companies City
% capitalshareholdingsby Nestlé S.A.
% ultimate capital
shareholdings Currency Capital
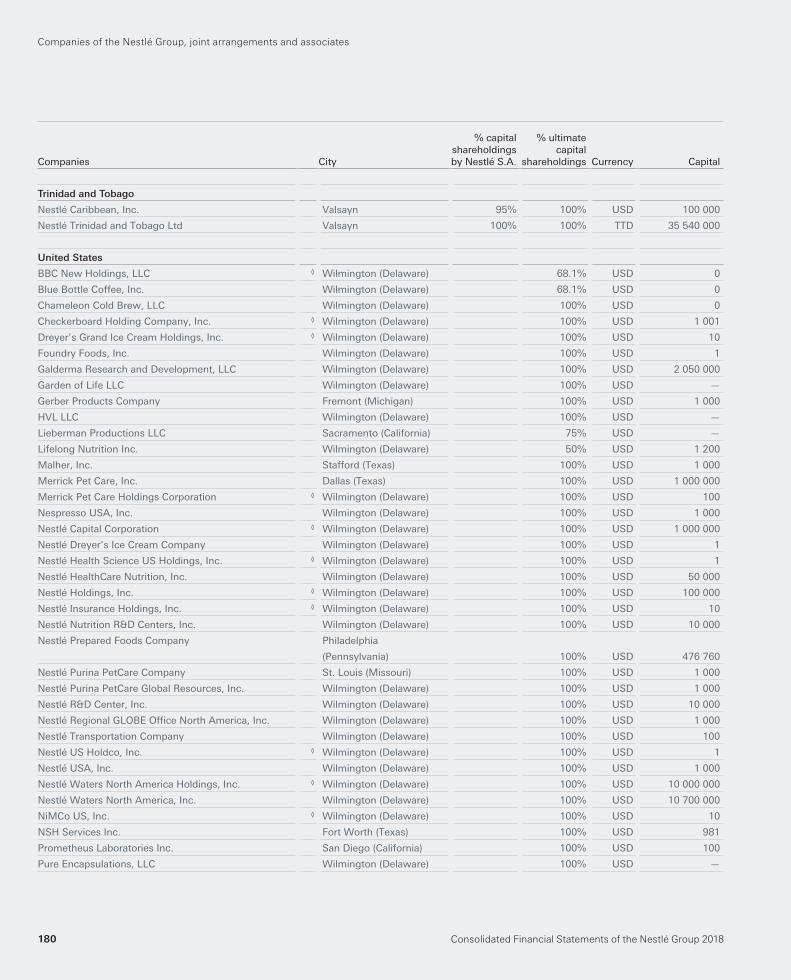
Trinidad and Tobago
Nestlé Caribbean, Inc. Valsayn 95% 100% USD 100 000
Nestlé Trinidad and Tobago Ltd Valsayn 100% 100% TTD 35 540 000
United States
BBC New Holdings, LLC ◊ Wilmington (Delaware) 68.1% USD 0
Blue Bottle Coffee, Inc. Wilmington (Delaware) 68.1% USD 0
Chameleon Cold Brew, LLC Wilmington (Delaware) 100% USD 0
Checkerboard Holding Company, Inc. ◊ Wilmington (Delaware) 100% USD 1 001
Dreyer’s Grand Ice Cream Holdings, Inc. ◊ Wilmington (Delaware) 100% USD 10
Foundry Foods, Inc. Wilmington (Delaware) 100% USD 1
Galderma Research and Development, LLC Wilmington (Delaware) 100% USD 2 050 000
Garden of Life LLC Wilmington (Delaware) 100% USD —
Gerber Products Company Fremont (Michigan) 100% USD 1 000
HVL LLC Wilmington (Delaware) 100% USD —
Lieberman Productions LLC Sacramento (California) 75% USD —
Lifelong Nutrition Inc. Wilmington (Delaware) 50% USD 1 200
Malher, Inc. Stafford (Texas) 100% USD 1 000
Merrick Pet Care, Inc. Dallas (Texas) 100% USD 1 000 000
Merrick Pet Care Holdings Corporation ◊ Wilmington (Delaware) 100% USD 100
Nespresso USA, Inc. Wilmington (Delaware) 100% USD 1 000
Nestlé Capital Corporation ◊ Wilmington (Delaware) 100% USD 1 000 000
Nestlé Dreyer’s Ice Cream Company Wilmington (Delaware) 100% USD 1
Nestlé Health Science US Holdings, Inc. ◊ Wilmington (Delaware) 100% USD 1
Nestlé HealthCare Nutrition, Inc. Wilmington (Delaware) 100% USD 50 000
Nestlé Holdings, Inc. ◊ Wilmington (Delaware) 100% USD 100 000
Nestlé Insurance Holdings, Inc. ◊ Wilmington (Delaware) 100% USD 10
Nestlé Nutrition R&D Centers, Inc. Wilmington (Delaware) 100% USD 10 000
Nestlé Prepared Foods Company Philadelphia
(Pennsylvania) 100% USD 476 760
Nestlé Purina PetCare Company St. Louis (Missouri) 100% USD 1 000
Nestlé Purina PetCare Global Resources, Inc. Wilmington (Delaware) 100% USD 1 000
Nestlé R&D Center, Inc. Wilmington (Delaware) 100% USD 10 000
Nestlé Regional GLOBE Offi ce North America, Inc. Wilmington (Delaware) 100% USD 1 000
Nestlé Transportation Company Wilmington (Delaware) 100% USD 100
Nestlé US Holdco, Inc. ◊ Wilmington (Delaware) 100% USD 1
Nestlé USA, Inc. Wilmington (Delaware) 100% USD 1 000
Nestlé Waters North America Holdings, Inc. ◊ Wilmington (Delaware) 100% USD 10 000 000
Nestlé Waters North America, Inc. Wilmington (Delaware) 100% USD 10 700 000
NiMCo US, Inc. ◊ Wilmington (Delaware) 100% USD 10
NSH Services Inc. Fort Worth (Texas) 100% USD 981
Prometheus Laboratories Inc. San Diego (California) 100% USD 100
Pure Encapsulations, LLC Wilmington (Delaware) 100% USD —
Companies of the Nestlé Group, joint arrangements and associates
Companies City
% capitalshareholdingsby Nestlé S.A.
% ultimate capital
shareholdings Currency Capital
Consolidated Financial Statements of the Nestlé Group 2018180
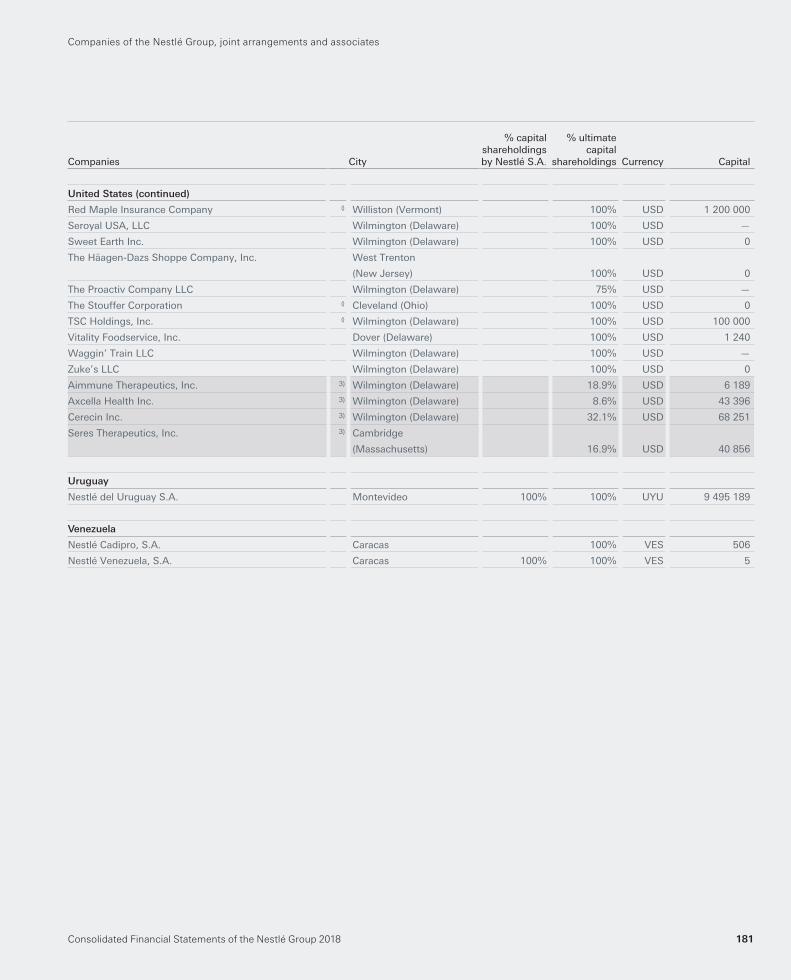
United States (continued)
Red Maple Insurance Company ◊ Williston (Vermont) 100% USD 1 200 000
Seroyal USA, LLC Wilmington (Delaware) 100% USD —
Sweet Earth Inc. Wilmington (Delaware) 100% USD 0
The Häagen-Dazs Shoppe Company, Inc. West Trenton
(New Jersey) 100% USD 0
The Proactiv Company LLC Wilmington (Delaware) 75% USD —
The Stouffer Corporation ◊ Cleveland (Ohio) 100% USD 0
TSC Holdings, Inc. ◊ Wilmington (Delaware) 100% USD 100 000
Vitality Foodservice, Inc. Dover (Delaware) 100% USD 1 240
Waggin’ Train LLC Wilmington (Delaware) 100% USD —
Zuke’s LLC Wilmington (Delaware) 100% USD 0
Aimmune Therapeutics, Inc. 3) Wilmington (Delaware) 18.9% USD 6 189
Axcella Health Inc. 3) Wilmington (Delaware) 8.6% USD 43 396
Cerecin Inc. 3) Wilmington (Delaware) 32.1% USD 68 251
Seres Therapeutics, Inc. 3) Cambridge
(Massachusetts) 16.9% USD 40 856
Uruguay
Nestlé del Uruguay S.A. Montevideo 100% 100% UYU 9 495 189
Venezuela
Nestlé Cadipro, S.A. Caracas 100% VES 506
Nestlé Venezuela, S.A. Caracas 100% 100% VES 5
Companies of the Nestlé Group, joint arrangements and associates
Consolidated Financial Statements of the Nestlé Group 2018 181
Companies City
% capitalshareholdingsby Nestlé S.A.
% ultimate capital
shareholdings Currency Capital
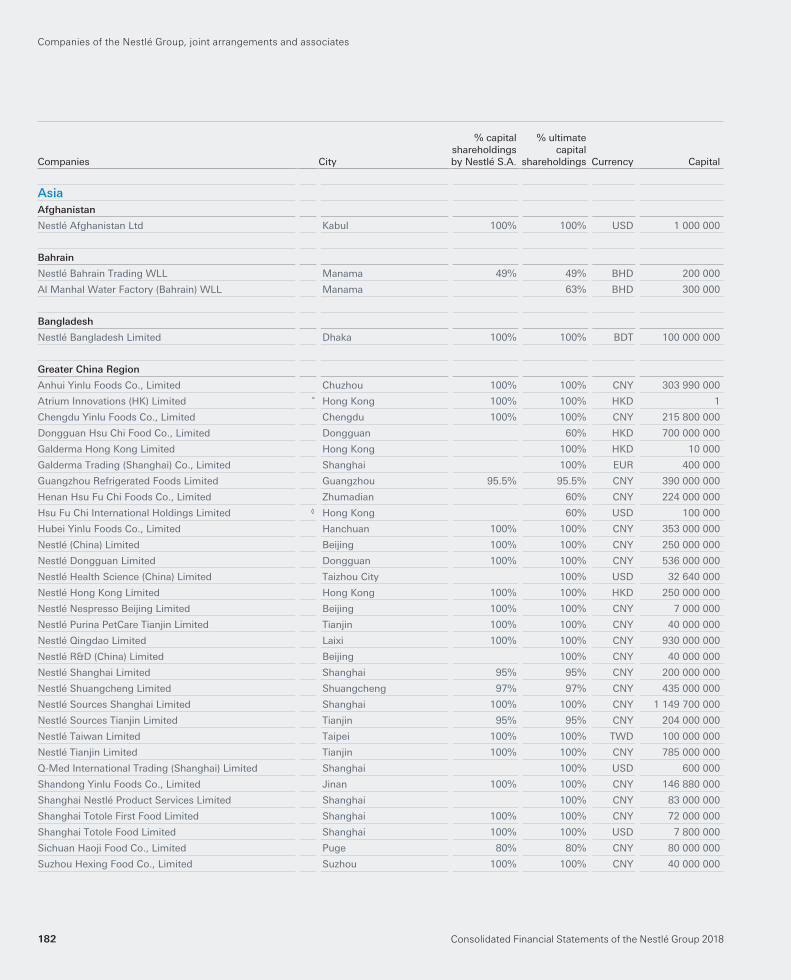
AsiaAfghanistan
Nestlé Afghanistan Ltd Kabul 100% 100% USD 1 000 000
Bahrain
Nestlé Bahrain Trading WLL Manama 49% 49% BHD 200 000
Al Manhal Water Factory (Bahrain) WLL Manama 63% BHD 300 000
Bangladesh
Nestlé Bangladesh Limited Dhaka 100% 100% BDT 100 000 000
Greater China Region
Anhui Yinlu Foods Co., Limited Chuzhou 100% 100% CNY 303 990 000
Atrium Innovations (HK) Limited ° Hong Kong 100% 100% HKD 1
Chengdu Yinlu Foods Co., Limited Chengdu 100% 100% CNY 215 800 000
Dongguan Hsu Chi Food Co., Limited Dongguan 60% HKD 700 000 000
Galderma Hong Kong Limited Hong Kong 100% HKD 10 000
Galderma Trading (Shanghai) Co., Limited Shanghai 100% EUR 400 000
Guangzhou Refrigerated Foods Limited Guangzhou 95.5% 95.5% CNY 390 000 000
Henan Hsu Fu Chi Foods Co., Limited Zhumadian 60% CNY 224 000 000
Hsu Fu Chi International Holdings Limited ◊ Hong Kong 60% USD 100 000
Hubei Yinlu Foods Co., Limited Hanchuan 100% 100% CNY 353 000 000
Nestlé (China) Limited Beijing 100% 100% CNY 250 000 000
Nestlé Dongguan Limited Dongguan 100% 100% CNY 536 000 000
Nestlé Health Science (China) Limited Taizhou City 100% USD 32 640 000
Nestlé Hong Kong Limited Hong Kong 100% 100% HKD 250 000 000
Nestlé Nespresso Beijing Limited Beijing 100% 100% CNY 7 000 000
Nestlé Purina PetCare Tianjin Limited Tianjin 100% 100% CNY 40 000 000
Nestlé Qingdao Limited Laixi 100% 100% CNY 930 000 000
Nestlé R&D (China) Limited Beijing 100% CNY 40 000 000
Nestlé Shanghai Limited Shanghai 95% 95% CNY 200 000 000
Nestlé Shuangcheng Limited Shuangcheng 97% 97% CNY 435 000 000
Nestlé Sources Shanghai Limited Shanghai 100% 100% CNY 1 149 700 000
Nestlé Sources Tianjin Limited Tianjin 95% 95% CNY 204 000 000
Nestlé Taiwan Limited Taipei 100% 100% TWD 100 000 000
Nestlé Tianjin Limited Tianjin 100% 100% CNY 785 000 000
Q-Med International Trading (Shanghai) Limited Shanghai 100% USD 600 000
Shandong Yinlu Foods Co., Limited Jinan 100% 100% CNY 146 880 000
Shanghai Nestlé Product Services Limited Shanghai 100% CNY 83 000 000
Shanghai Totole First Food Limited Shanghai 100% 100% CNY 72 000 000
Shanghai Totole Food Limited Shanghai 100% 100% USD 7 800 000
Sichuan Haoji Food Co., Limited Puge 80% 80% CNY 80 000 000
Suzhou Hexing Food Co., Limited Suzhou 100% 100% CNY 40 000 000
Companies of the Nestlé Group, joint arrangements and associates
Companies City
% capitalshareholdingsby Nestlé S.A.
% ultimate capital
shareholdings Currency Capital
Consolidated Financial Statements of the Nestlé Group 2018182
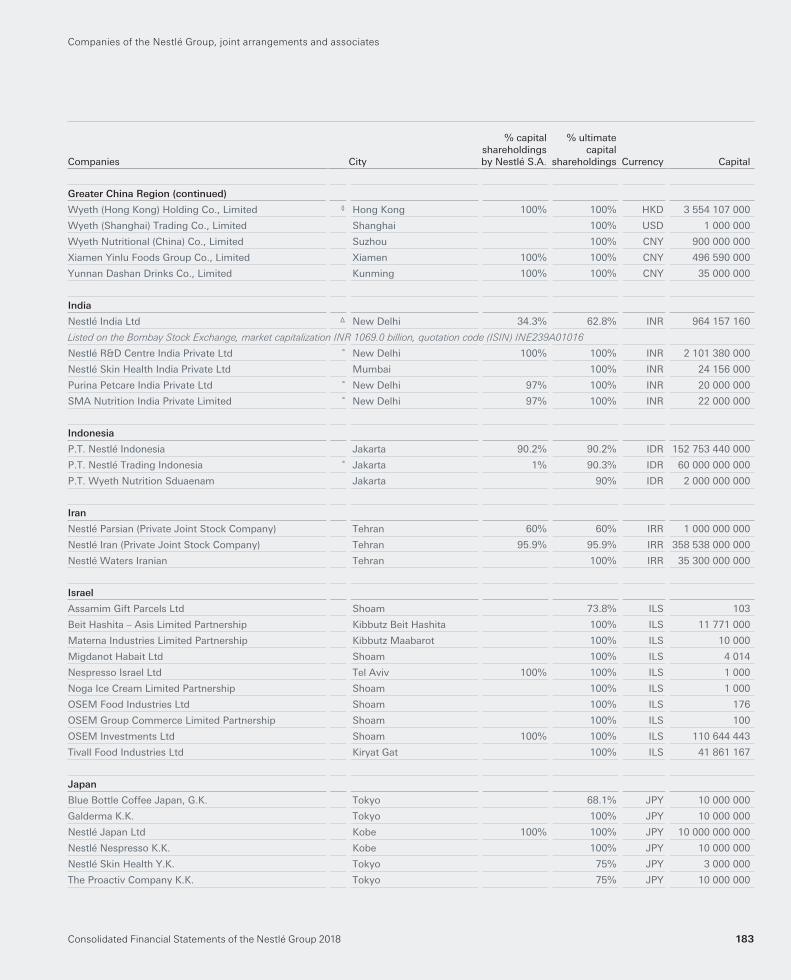
Greater China Region (continued)
Wyeth (Hong Kong) Holding Co., Limited ◊ Hong Kong 100% 100% HKD 3 554 107 000
Wyeth (Shanghai) Trading Co., Limited Shanghai 100% USD 1 000 000
Wyeth Nutritional (China) Co., Limited Suzhou 100% CNY 900 000 000
Xiamen Yinlu Foods Group Co., Limited Xiamen 100% 100% CNY 496 590 000
Yunnan Dashan Drinks Co., Limited Kunming 100% 100% CNY 35 000 000
India
Nestlé India Ltd Δ New Delhi 34.3% 62.8% INR 964 157 160
Listed on the Bombay Stock Exchange, market capitalization INR 1069.0 billion, quotation code (ISIN) INE239A01016
Nestlé R&D Centre India Private Ltd ° New Delhi 100% 100% INR 2 101 380 000
Nestlé Skin Health India Private Ltd Mumbai 100% INR 24 156 000
Purina Petcare India Private Ltd ° New Delhi 97% 100% INR 20 000 000
SMA Nutrition India Private Limited ° New Delhi 97% 100% INR 22 000 000
Indonesia
P.T. Nestlé Indonesia Jakarta 90.2% 90.2% IDR 152 753 440 000
P.T. Nestlé Trading Indonesia ° Jakarta 1% 90.3% IDR 60 000 000 000
P.T. Wyeth Nutrition Sduaenam Jakarta 90% IDR 2 000 000 000
Iran
Nestlé Parsian (Private Joint Stock Company) Tehran 60% 60% IRR 1 000 000 000
Nestlé Iran (Private Joint Stock Company) Tehran 95.9% 95.9% IRR 358 538 000 000
Nestlé Waters Iranian Tehran 100% IRR 35 300 000 000
Israel
Assamim Gift Parcels Ltd Shoam 73.8% ILS 103
Beit Hashita – Asis Limited Partnership Kibbutz Beit Hashita 100% ILS 11 771 000
Materna Industries Limited Partnership Kibbutz Maabarot 100% ILS 10 000
Migdanot Habait Ltd Shoam 100% ILS 4 014
Nespresso Israel Ltd Tel Aviv 100% 100% ILS 1 000
Noga Ice Cream Limited Partnership Shoam 100% ILS 1 000
OSEM Food Industries Ltd Shoam 100% ILS 176
OSEM Group Commerce Limited Partnership Shoam 100% ILS 100
OSEM Investments Ltd Shoam 100% 100% ILS 110 644 443
Tivall Food Industries Ltd Kiryat Gat 100% ILS 41 861 167
Japan
Blue Bottle Coffee Japan, G.K. Tokyo 68.1% JPY 10 000 000
Galderma K.K. Tokyo 100% JPY 10 000 000
Nestlé Japan Ltd Kobe 100% 100% JPY 10 000 000 000
Nestlé Nespresso K.K. Kobe 100% JPY 10 000 000
Nestlé Skin Health Y.K. Tokyo 75% JPY 3 000 000
The Proactiv Company K.K. Tokyo 75% JPY 10 000 000
Companies of the Nestlé Group, joint arrangements and associates
Consolidated Financial Statements of the Nestlé Group 2018 183
Companies City
% capitalshareholdingsby Nestlé S.A.
% ultimate capital
shareholdings Currency Capital
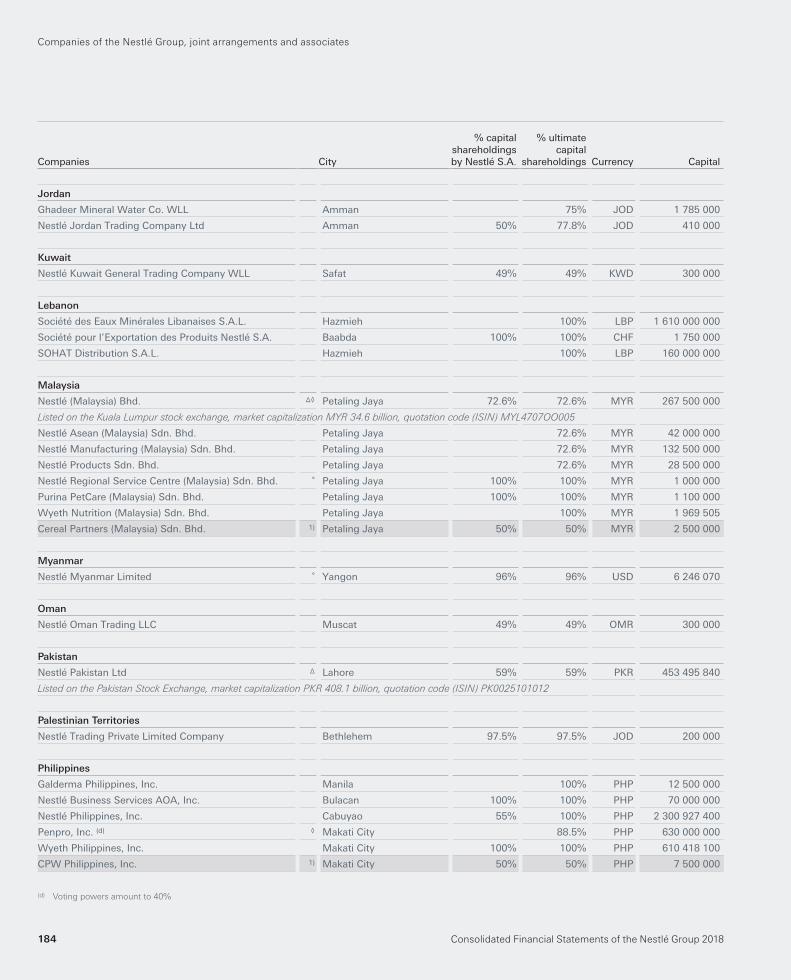
Jordan
Ghadeer Mineral Water Co. WLL Amman 75% JOD 1 785 000
Nestlé Jordan Trading Company Ltd Amman 50% 77.8% JOD 410 000
Kuwait
Nestlé Kuwait General Trading Company WLL Safat 49% 49% KWD 300 000
Lebanon
Société des Eaux Minérales Libanaises S.A.L. Hazmieh 100% LBP 1 610 000 000
Société pour l’Exportation des Produits Nestlé S.A. Baabda 100% 100% CHF 1 750 000
SOHAT Distribution S.A.L. Hazmieh 100% LBP 160 000 000
Malaysia
Nestlé (Malaysia) Bhd. Δ◊ Petaling Jaya 72.6% 72.6% MYR 267 500 000
Listed on the Kuala Lumpur stock exchange, market capitalization MYR 34.6 billion, quotation code (ISIN) MYL4707OO005
Nestlé Asean (Malaysia) Sdn. Bhd. Petaling Jaya 72.6% MYR 42 000 000
Nestlé Manufacturing (Malaysia) Sdn. Bhd. Petaling Jaya 72.6% MYR 132 500 000
Nestlé Products Sdn. Bhd. Petaling Jaya 72.6% MYR 28 500 000
Nestlé Regional Service Centre (Malaysia) Sdn. Bhd. ° Petaling Jaya 100% 100% MYR 1 000 000
Purina PetCare (Malaysia) Sdn. Bhd. Petaling Jaya 100% 100% MYR 1 100 000
Wyeth Nutrition (Malaysia) Sdn. Bhd. Petaling Jaya 100% MYR 1 969 505
Cereal Partners (Malaysia) Sdn. Bhd. 1) Petaling Jaya 50% 50% MYR 2 500 000
Myanmar
Nestlé Myanmar Limited ° Yangon 96% 96% USD 6 246 070
Oman
Nestlé Oman Trading LLC Muscat 49% 49% OMR 300 000
Pakistan
Nestlé Pakistan Ltd Δ Lahore 59% 59% PKR 453 495 840
Listed on the Pakistan Stock Exchange, market capitalization PKR 408.1 billion, quotation code (ISIN) PK0025101012
Palestinian Territories
Nestlé Trading Private Limited Company Bethlehem 97.5% 97.5% JOD 200 000
Philippines
Galderma Philippines, Inc. Manila 100% PHP 12 500 000
Nestlé Business Services AOA, Inc. Bulacan 100% 100% PHP 70 000 000
Nestlé Philippines, Inc. Cabuyao 55% 100% PHP 2 300 927 400
Penpro, Inc. (d) ◊ Makati City 88.5% PHP 630 000 000
Wyeth Philippines, Inc. Makati City 100% 100% PHP 610 418 100
CPW Philippines, Inc. 1) Makati City 50% 50% PHP 7 500 000
(d) Voting powers amount to 40%
Companies of the Nestlé Group, joint arrangements and associates
Companies City
% capitalshareholdingsby Nestlé S.A.
% ultimate capital
shareholdings Currency Capital
Consolidated Financial Statements of the Nestlé Group 2018184
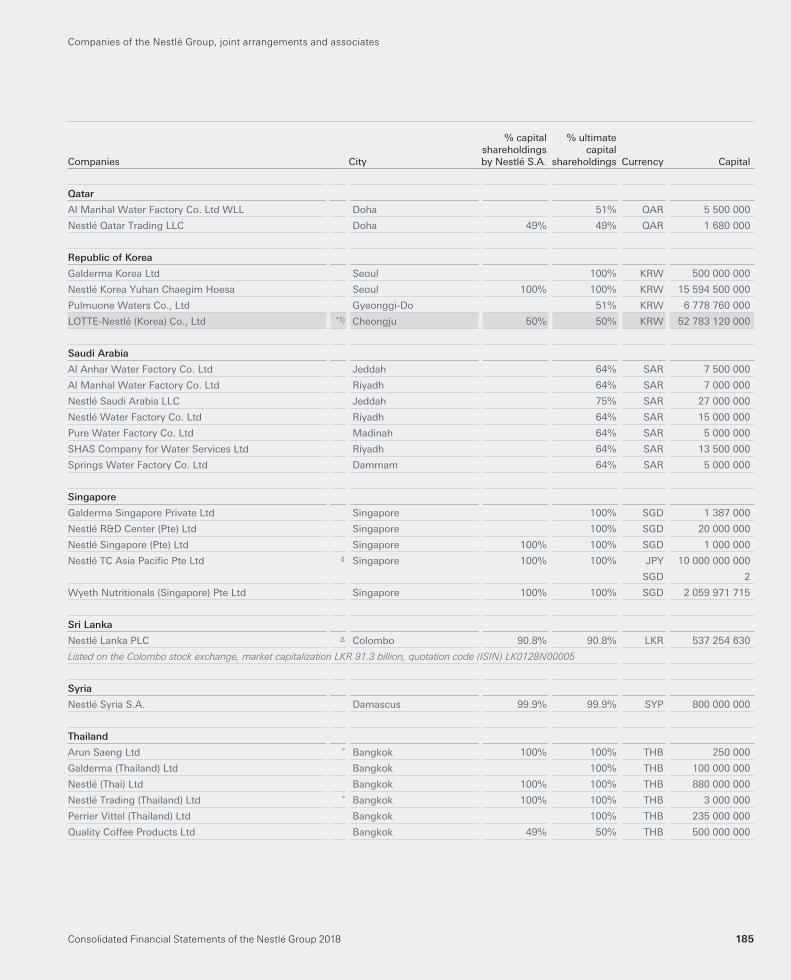
Qatar
Al Manhal Water Factory Co. Ltd WLL Doha 51% QAR 5 500 000
Nestlé Qatar Trading LLC Doha 49% 49% QAR 1 680 000
Republic of Korea
Galderma Korea Ltd Seoul 100% KRW 500 000 000
Nestlé Korea Yuhan Chaegim Hoesa Seoul 100% 100% KRW 15 594 500 000
Pulmuone Waters Co., Ltd Gyeonggi-Do 51% KRW 6 778 760 000
LOTTE-Nestlé (Korea) Co., Ltd °1) Cheongju 50% 50% KRW 52 783 120 000
Saudi Arabia
Al Anhar Water Factory Co. Ltd Jeddah 64% SAR 7 500 000
Al Manhal Water Factory Co. Ltd Riyadh 64% SAR 7 000 000
Nestlé Saudi Arabia LLC Jeddah 75% SAR 27 000 000
Nestlé Water Factory Co. Ltd Riyadh 64% SAR 15 000 000
Pure Water Factory Co. Ltd Madinah 64% SAR 5 000 000
SHAS Company for Water Services Ltd Riyadh 64% SAR 13 500 000
Springs Water Factory Co. Ltd Dammam 64% SAR 5 000 000
Singapore
Galderma Singapore Private Ltd Singapore 100% SGD 1 387 000
Nestlé R&D Center (Pte) Ltd Singapore 100% SGD 20 000 000
Nestlé Singapore (Pte) Ltd Singapore 100% 100% SGD 1 000 000
Nestlé TC Asia Pacifi c Pte Ltd ◊ Singapore 100% 100% JPY
SGD
10 000 000 000
2
Wyeth Nutritionals (Singapore) Pte Ltd Singapore 100% 100% SGD 2 059 971 715
Sri Lanka
Nestlé Lanka PLC Δ Colombo 90.8% 90.8% LKR 537 254 630
Listed on the Colombo stock exchange, market capitalization LKR 91.3 billion, quotation code (ISIN) LK0128N00005
Syria
Nestlé Syria S.A. Damascus 99.9% 99.9% SYP 800 000 000
Thailand
Arun Saeng Ltd ° Bangkok 100% 100% THB 250 000
Galderma (Thailand) Ltd Bangkok 100% THB 100 000 000
Nestlé (Thai) Ltd Bangkok 100% 100% THB 880 000 000
Nestlé Trading (Thailand) Ltd ° Bangkok 100% 100% THB 3 000 000
Perrier Vittel (Thailand) Ltd Bangkok 100% THB 235 000 000
Quality Coffee Products Ltd Bangkok 49% 50% THB 500 000 000
Companies of the Nestlé Group, joint arrangements and associates
Consolidated Financial Statements of the Nestlé Group 2018 185
Companies City
% capitalshareholdingsby Nestlé S.A.
% ultimate capital
shareholdings Currency Capital
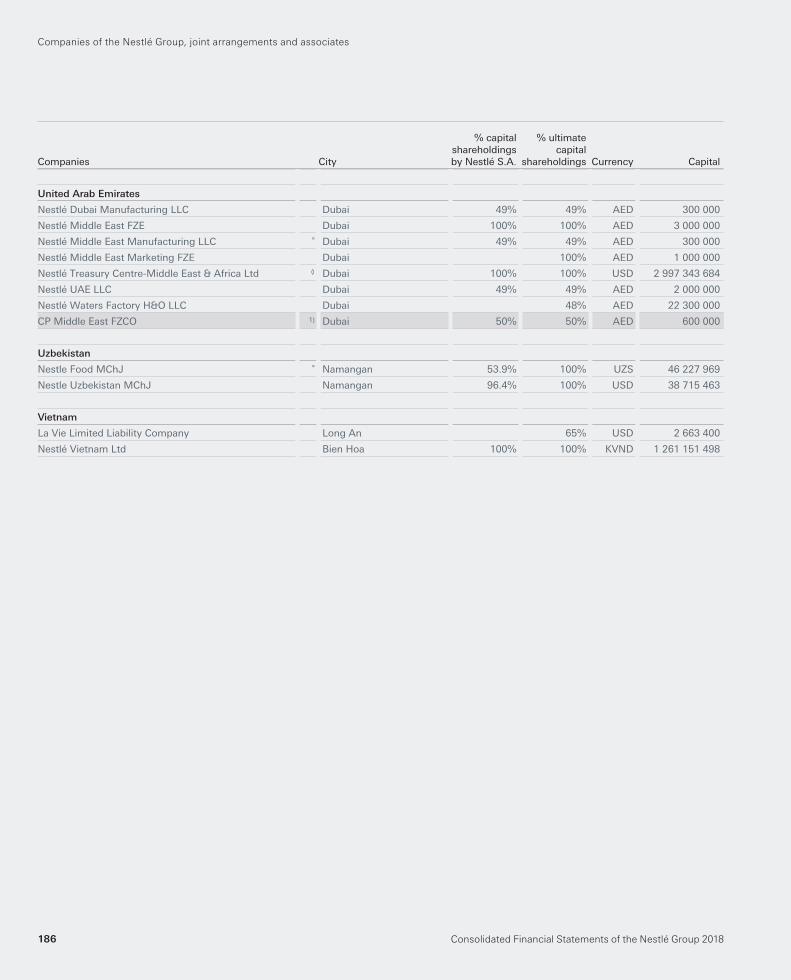
United Arab Emirates
Nestlé Dubai Manufacturing LLC Dubai 49% 49% AED 300 000
Nestlé Middle East FZE Dubai 100% 100% AED 3 000 000
Nestlé Middle East Manufacturing LLC ° Dubai 49% 49% AED 300 000
Nestlé Middle East Marketing FZE Dubai 100% AED 1 000 000
Nestlé Treasury Centre-Middle East & Africa Ltd ◊ Dubai 100% 100% USD 2 997 343 684
Nestlé UAE LLC Dubai 49% 49% AED 2 000 000
Nestlé Waters Factory H&O LLC Dubai 48% AED 22 300 000
CP Middle East FZCO 1) Dubai 50% 50% AED 600 000
Uzbekistan
Nestle Food MChJ ° Namangan 53.9% 100% UZS 46 227 969
Nestle Uzbekistan MChJ Namangan 96.4% 100% USD 38 715 463
Vietnam
La Vie Limited Liability Company Long An 65% USD 2 663 400
Nestlé Vietnam Ltd Bien Hoa 100% 100% KVND 1 261 151 498
Companies of the Nestlé Group, joint arrangements and associates
Companies City
% capitalshareholdingsby Nestlé S.A.
% ultimate capital
shareholdings Currency Capital
Consolidated Financial Statements of the Nestlé Group 2018186
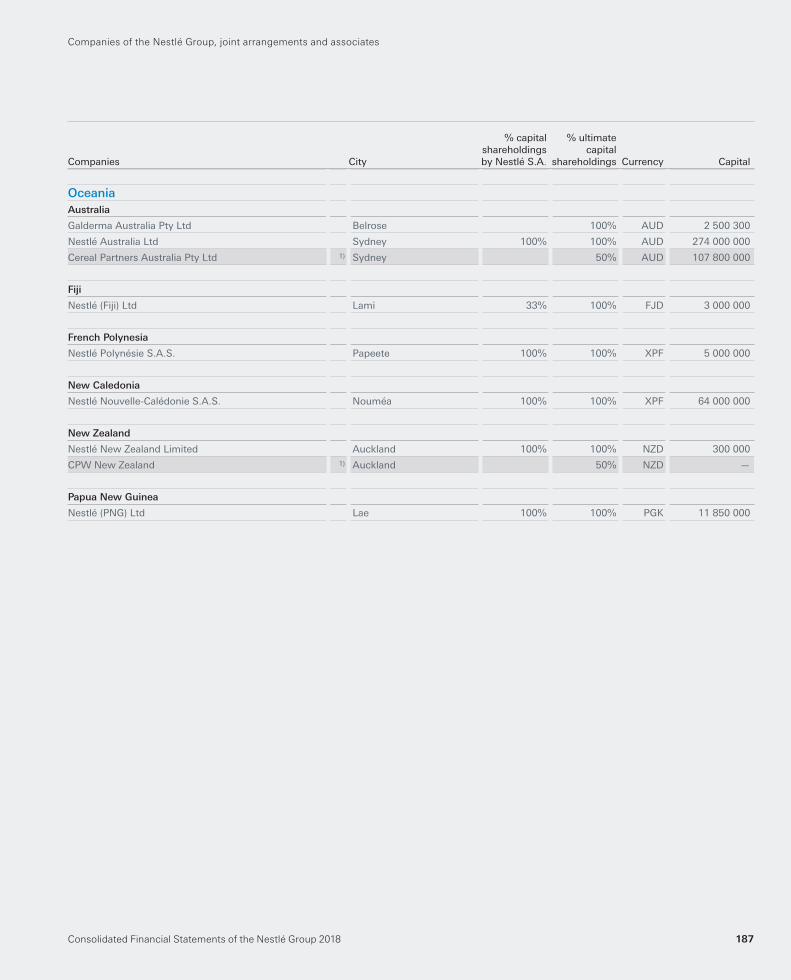
OceaniaAustralia
Galderma Australia Pty Ltd Belrose 100% AUD 2 500 300
Nestlé Australia Ltd Sydney 100% 100% AUD 274 000 000
Cereal Partners Australia Pty Ltd 1) Sydney 50% AUD 107 800 000
Fiji
Nestlé (Fiji) Ltd Lami 33% 100% FJD 3 000 000
French Polynesia
Nestlé Polynésie S.A.S. Papeete 100% 100% XPF 5 000 000
New Caledonia
Nestlé Nouvelle-Calédonie S.A.S. Nouméa 100% 100% XPF 64 000 000
New Zealand
Nestlé New Zealand Limited Auckland 100% 100% NZD 300 000
CPW New Zealand 1) Auckland 50% NZD —
Papua New Guinea
Nestlé (PNG) Ltd Lae 100% 100% PGK 11 850 000
Companies of the Nestlé Group, joint arrangements and associates
Consolidated Financial Statements of the Nestlé Group 2018 187
Companies City
% capitalshareholdingsby Nestlé S.A.
% ultimate capital
shareholdings Currency Capital
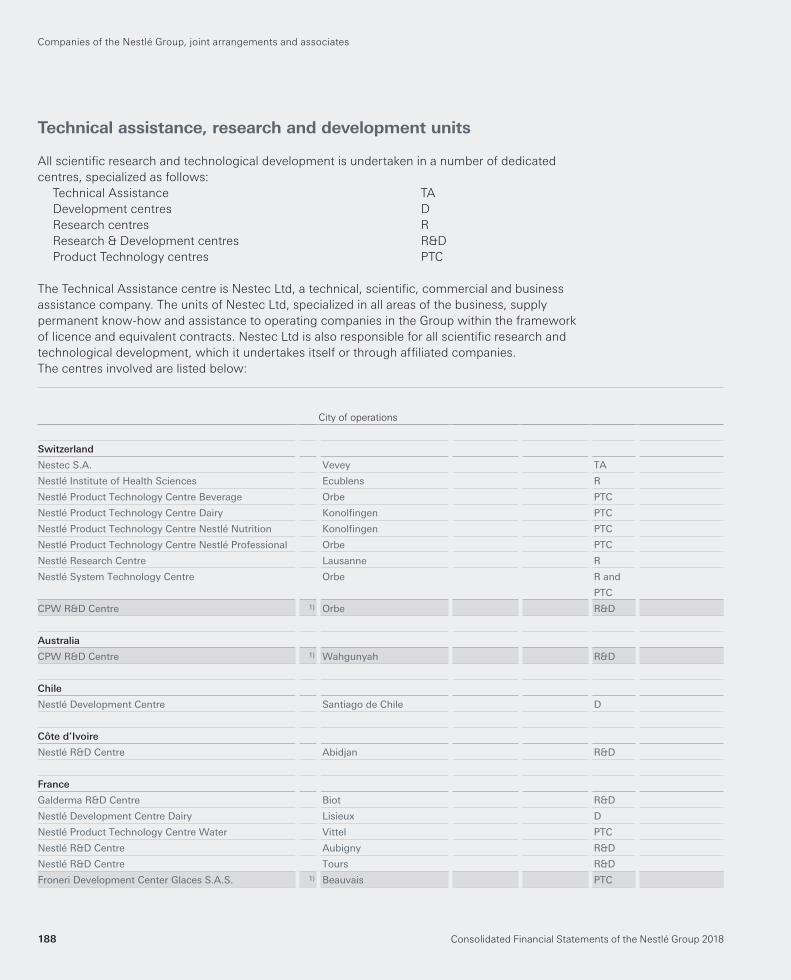
Switzerland
Nestec S.A. Vevey TA
Nestlé Institute of Health Sciences Ecublens R
Nestlé Product Technology Centre Beverage Orbe PTC
Nestlé Product Technology Centre Dairy Konolfi ngen PTC
Nestlé Product Technology Centre Nestlé Nutrition Konolfi ngen PTC
Nestlé Product Technology Centre Nestlé Professional Orbe PTC
Nestlé Research Centre Lausanne R
Nestlé System Technology Centre Orbe R and
PTC
CPW R&D Centre 1) Orbe R&D
Australia
CPW R&D Centre 1) Wahgunyah R&D
Chile
Nestlé Development Centre Santiago de Chile D
Côte d’Ivoire
Nestlé R&D Centre Abidjan R&D
France
Galderma R&D Centre Biot R&D
Nestlé Development Centre Dairy Lisieux D
Nestlé Product Technology Centre Water Vittel PTC
Nestlé R&D Centre Aubigny R&D
Nestlé R&D Centre Tours R&D
Froneri Development Center Glaces S.A.S. 1) Beauvais PTC
Technical assistance, research and development units
All scientifi c research and technological development is undertaken in a number of dedicated
centres, specialized as follows:
Technical Assistance TA
Development centres D
Research centres R
Research & Development centres R&D
Product Technology centres PTC
The Technical Assistance centre is Nestec Ltd, a technical, scientifi c, commercial and business
assistance company. The units of Nestec Ltd, specialized in all areas of the business, supply
permanent know-how and assistance to operating companies in the Group within the framework
of licence and equivalent contracts. Nestec Ltd is also responsible for all scientifi c research and
technological development, which it undertakes itself or through affi liated companies.
The centres involved are listed below:
Companies of the Nestlé Group, joint arrangements and associates
Consolidated Financial Statements of the Nestlé Group 2018188
City of operations
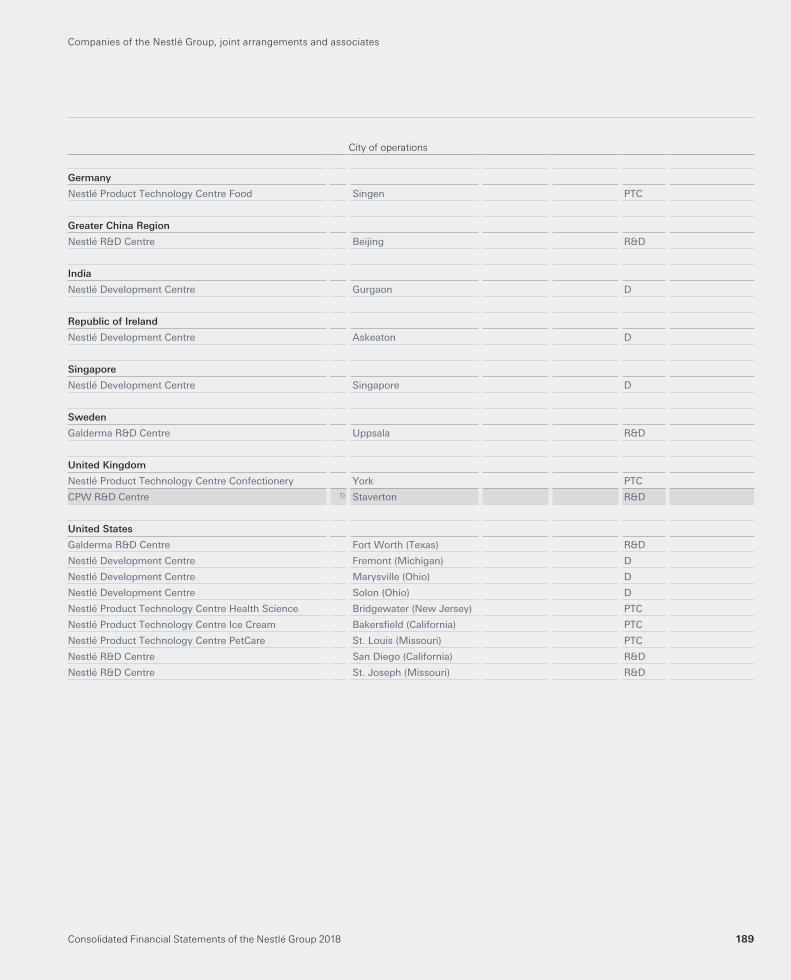
Germany
Nestlé Product Technology Centre Food Singen PTC
Greater China Region
Nestlé R&D Centre Beijing R&D
India
Nestlé Development Centre Gurgaon D
Republic of Ireland
Nestlé Development Centre Askeaton D
Singapore
Nestlé Development Centre Singapore D
Sweden
Galderma R&D Centre Uppsala R&D
United Kingdom
Nestlé Product Technology Centre Confectionery York PTC
CPW R&D Centre 1) Staverton R&D
United States
Galderma R&D Centre Fort Worth (Texas) R&D
Nestlé Development Centre Fremont (Michigan) D
Nestlé Development Centre Marysville (Ohio) D
Nestlé Development Centre Solon (Ohio) D
Nestlé Product Technology Centre Health Science Bridgewater (New Jersey) PTC
Nestlé Product Technology Centre Ice Cream Bakersfi eld (California) PTC
Nestlé Product Technology Centre PetCare St. Louis (Missouri) PTC
Nestlé R&D Centre San Diego (California) R&D
Nestlé R&D Centre St. Joseph (Missouri) R&D
Companies of the Nestlé Group, joint arrangements and associates
Consolidated Financial Statements of the Nestlé Group 2018 189
City of operations
Consolidated Financial Statements of the Nestlé Group 2018190
152nd Financial Statementsof Nestlé S.A.
152nd Financial Statements of Nestlé S.A. 191
152nd Financial Statements of Nestlé S.A.192
Income statement for the year ended
December 31, 2018
Balance sheet as at December 31, 2018
Notes to the annual accounts
1. Accounting policies
2. Income from Group companies
3. Profi t on disposal of assets
4. Financial income
5. Expenses recharged from
Group companies
6. Write-downs and amortization
7. Financial expenses
8. Taxes
9. Cash and cash equivalents
10. Other current receivables
11. Financial assets
12. Shareholdings
13. Intangible assets
14. Interest-bearing liabilities
15. Other current liabilities
16. Provisions
17. Share capital
18. Changes in equity
19. Treasury shares
20. Contingencies
21. Performance Share Units and
shares for members of the Board
and employees granted during the year
22. Full-time equivalents
23. Events after the balance sheet date
24. Shares and stock options
Proposed appropriation of profi t
Statutory Auditor’s Report –
Report on the Audit of the
Financial Statements
193
194
195
195
196
197
198
199
200
201
202
204
206
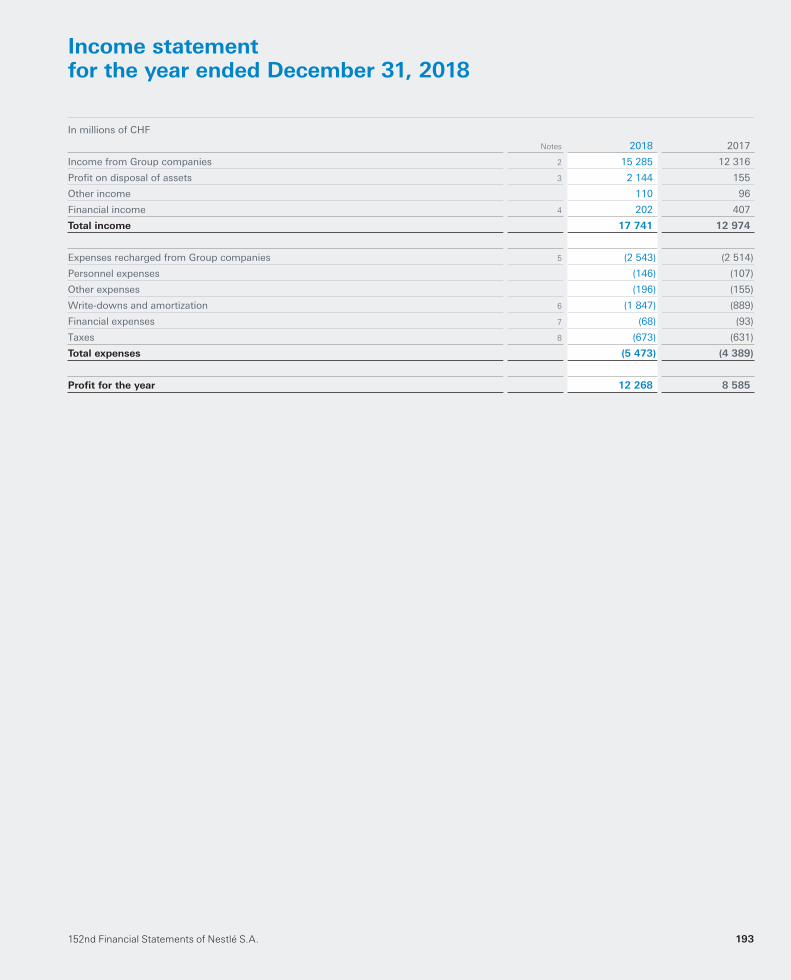
152nd Financial Statements of Nestlé S.A. 193
Income statementfor the year ended December 31, 2018
In millions of CHF
Notes 2018 2017
Income from Group companies 2 15 285 12 316
Profi t on disposal of assets 3 2 144 155
Other income 110 96
Financial income 4 202 407
Total income 17 741 12 974
Expenses recharged from Group companies 5 (2 543) (2 514)
Personnel expenses (146) (107)
Other expenses (196) (155)
Write-downs and amortization 6 (1 847) (889)
Financial expenses 7 (68) (93)
Taxes 8 (673) (631)
Total expenses (5 473) (4 389)
Profi t for the year 12 268 8 585
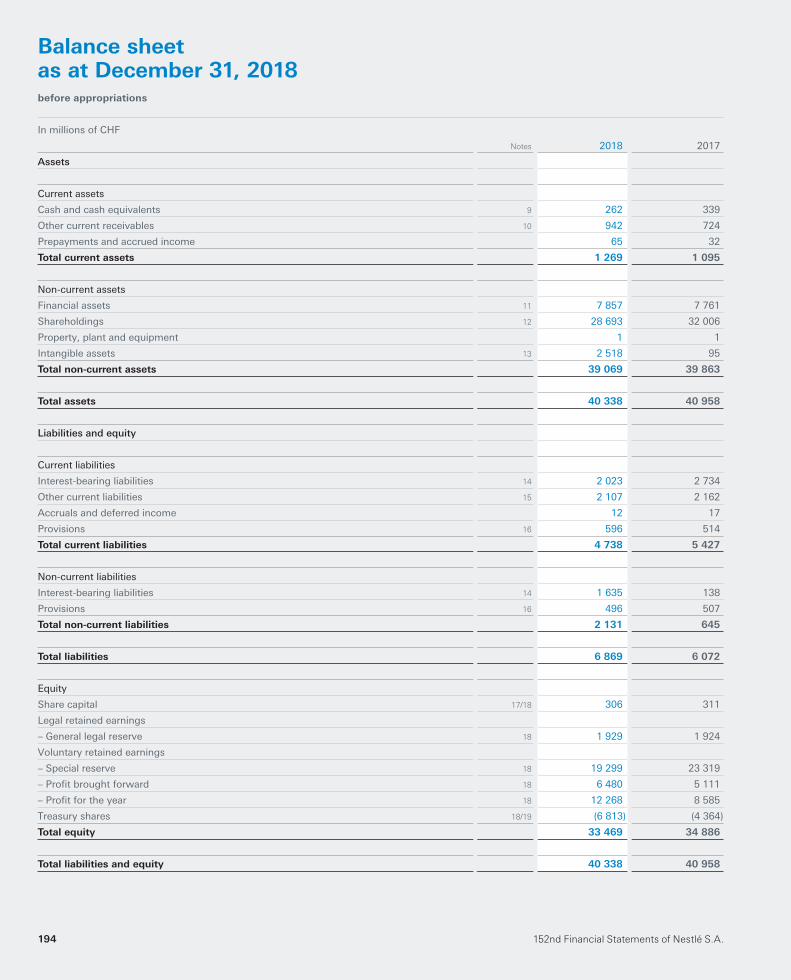
152nd Financial Statements of Nestlé S.A.194
Balance sheet as at December 31, 2018before appropriations
In millions of CHF
Notes 2018 2017
Assets
Current assets
Cash and cash equivalents 9 262 339
Other current receivables 10 942 724
Prepayments and accrued income 65 32
Total current assets 1 269 1 095
Non-current assets
Financial assets 11 7 857 7 761
Shareholdings 12 28 693 32 006
Property, plant and equipment 1 1
Intangible assets 13 2 518 95
Total non-current assets 39 069 39 863
Total assets 40 338 40 958
Liabilities and equity
Current liabilities
Interest-bearing liabilities 14 2 023 2 734
Other current liabilities 15 2 107 2 162
Accruals and deferred income 12 17
Provisions 16 596 514
Total current liabilities 4 738 5 427
Non-current liabilities
Interest-bearing liabilities 14 1 635 138
Provisions 16 496 507
Total non-current liabilities 2 131 645
Total liabilities 6 869 6 072
Equity
Share capital 17/18 306 311
Legal retained earnings
– General legal reserve 18 1 929 1 924
Voluntary retained earnings
– Special reserve 18 19 299 23 319
– Profi t brought forward 18 6 480 5 111
– Profi t for the year 18 12 268 8 585
Treasury shares 18/19 (6 813) (4 364)
Total equity 33 469 34 886
Total liabilities and equity 40 338 40 958
152nd Financial Statements of Nestlé S.A. 195
Notes to the annual accounts
1. Accounting policies
General
Nestlé S.A. (the Company) is the ultimate holding company
of the Nestlé Group, domiciled in Cham and Vevey which
comprises subsidiaries, associated companies and joint
ventures throughout the world.
The accounts are prepared in accordance with
accounting principles required by Swiss law (32nd title of
the Swiss Code of Obligations). They are prepared under the
historical cost convention and on an accrual basis. Where
not prescribed by law, the signifi cant accounting and
valuation principles applied are described below.
Foreign currency translation
Transactions in foreign currencies are recorded at the rate of
exchange at the date of the transaction or, if hedged
forward, at the rate of exchange under the related forward
contract. Non-monetary assets and liabilities are carried at
historical rates. Monetary assets and liabilities in foreign
currencies are translated at year-end rates. Any resulting
exchange differences are included in the respective income
statement captions depending upon the nature of the
underlying transactions. The aggregate unrealized exchange
difference is calculated by reference to original transaction
date exchange rates and includes hedging transactions.
Where this gives rise to a net loss, it is charged to the
income statement whilst a net gain is deferred.
Hedging
The Company uses forward foreign exchange contracts,
options, fi nancial futures and currency swaps to hedge
foreign currency fl ows and positions. Unrealized foreign
exchange differences on hedging instruments are matched
and accounted for with those on the underlying asset or
liability. Long-term loans, in foreign currencies, used to
fi nance investments in shareholdings are generally not
hedged.
The Company also uses interest rate swaps to manage
interest rate risk. The swaps are accounted for at fair value
at each balance sheet date and changes in the market price
are recorded in the income statement.
The positive fair values of forward exchange contracts
and interest rate swaps are included in prepayments and
accrued income. The negative fair values of forward
exchange contracts and interest rate swaps are included in
accruals and deferred income.
Income statement
In accordance with Swiss law dividends are treated as an
appropriation of profi t in the year in which they are ratifi ed
at the Annual General Meeting rather than as an
appropriation of profi t in the year to which they relate.
Taxes
This caption includes taxes on profi t, capital and
withholding taxes on transfers from Group companies.
Shareholdings and fi nancial assets
The carrying value of shareholdings and loans comprises
the cost of investment, excluding the incidental costs of
acquisition, less any write-downs.
Shareholdings located in countries where the political,
economic or monetary situation might be considered to
carry a greater than normal level of risk are carried at
a nominal value of one franc.
Shareholdings and loans are written down on
a conservative basis, taking into account the profi tability of
the company concerned.
Property, plant and equipment
The Company owns land and buildings which have been
depreciated in the past. Offi ce furniture and equipment are
fully depreciated on acquisition.
Intangible assets
Trademarks and other industrial property rights are written
off on acquisition or exceptionally over a longer period, not
exceeding their useful lives.
Provisions
Provisions include present obligations as well as
contingencies. A provision for uninsured risks is constituted
to cover general risks not insured with third parties, such as
consequential loss. Provisions for Swiss taxes are made on
the basis of the Company’s taxable capital, reserves and
profi t for the year. A general provision is maintained to cover
possible foreign tax liabilities.
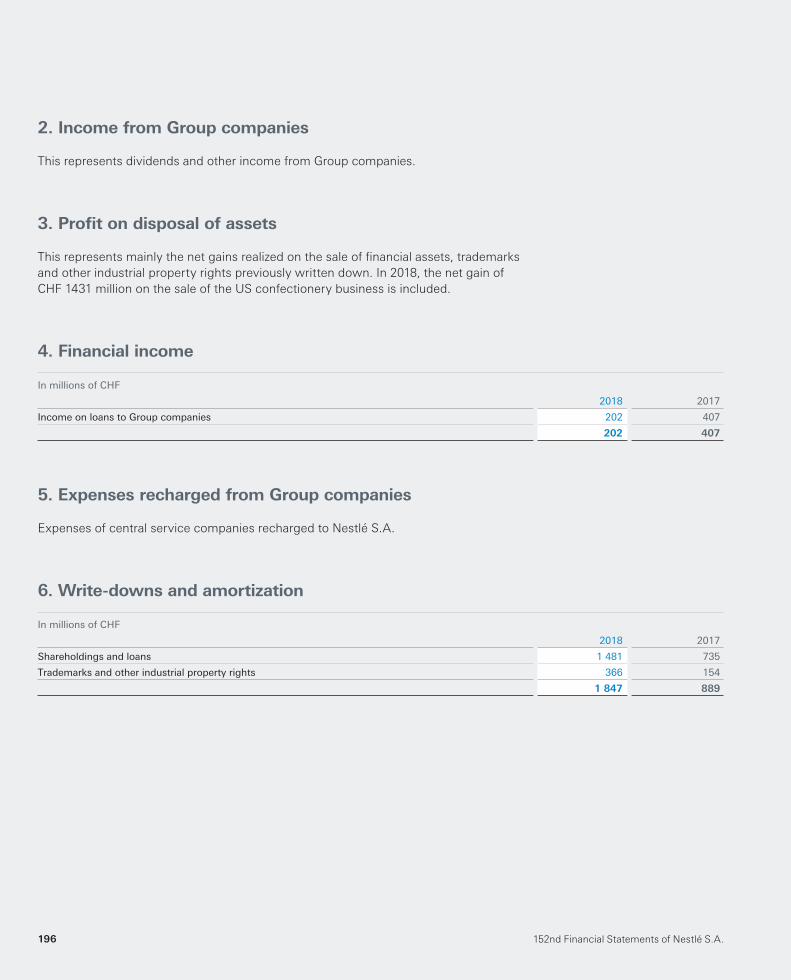
152nd Financial Statements of Nestlé S.A.196
2. Income from Group companies
This represents dividends and other income from Group companies.
3. Profi t on disposal of assets
This represents mainly the net gains realized on the sale of fi nancial assets, trademarks
and other industrial property rights previously written down. In 2018, the net gain of
CHF 1431 million on the sale of the US confectionery business is included.
4. Financial income
In millions of CHF
2018 2017
Income on loans to Group companies 202 407
202 407
5. Expenses recharged from Group companies
Expenses of central service companies recharged to Nestlé S.A.
6. Write-downs and amortization
In millions of CHF
2018 2017
Shareholdings and loans 1 481 735
Trademarks and other industrial property rights 366 154
1 847 889
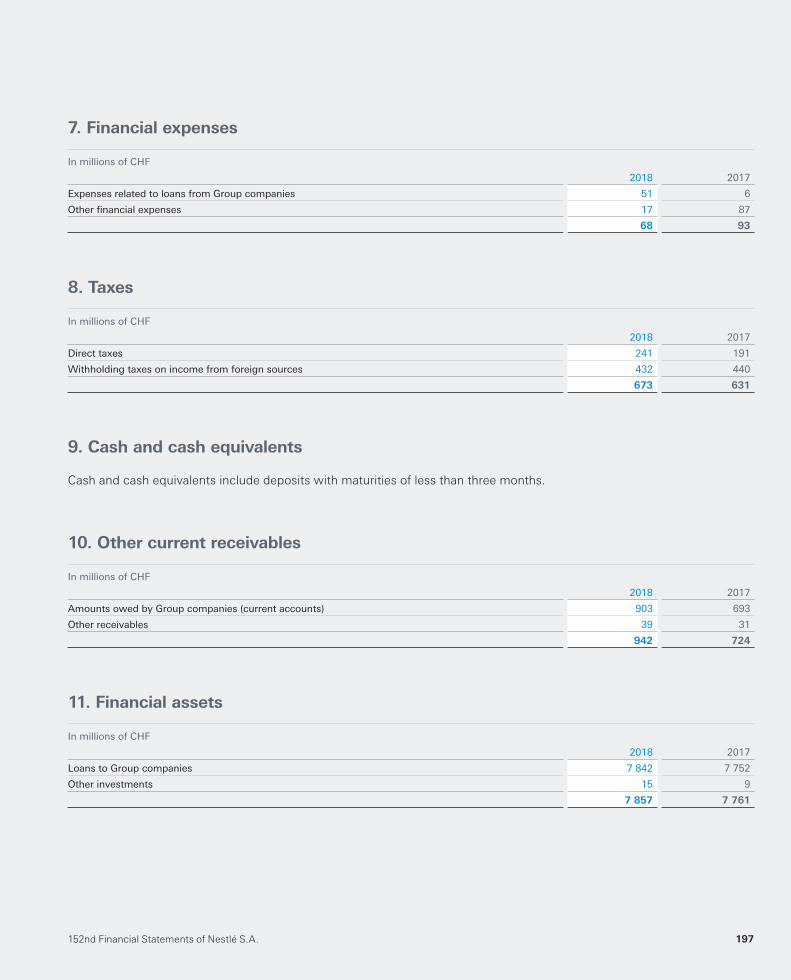
152nd Financial Statements of Nestlé S.A. 197
7. Financial expenses
In millions of CHF
2018 2017
Expenses related to loans from Group companies 51 6
Other fi nancial expenses 17 87
68 93
8. Taxes
In millions of CHF
2018 2017
Direct taxes 241 191
Withholding taxes on income from foreign sources 432 440
673 631
9. Cash and cash equivalents
Cash and cash equivalents include deposits with maturities of less than three months.
10. Other current receivables
In millions of CHF
2018 2017
Amounts owed by Group companies (current accounts) 903 693
Other receivables 39 31
942 724
11. Financial assets
In millions of CHF
2018 2017
Loans to Group companies 7 842 7 752
Other investments 15 9
7 857 7 761
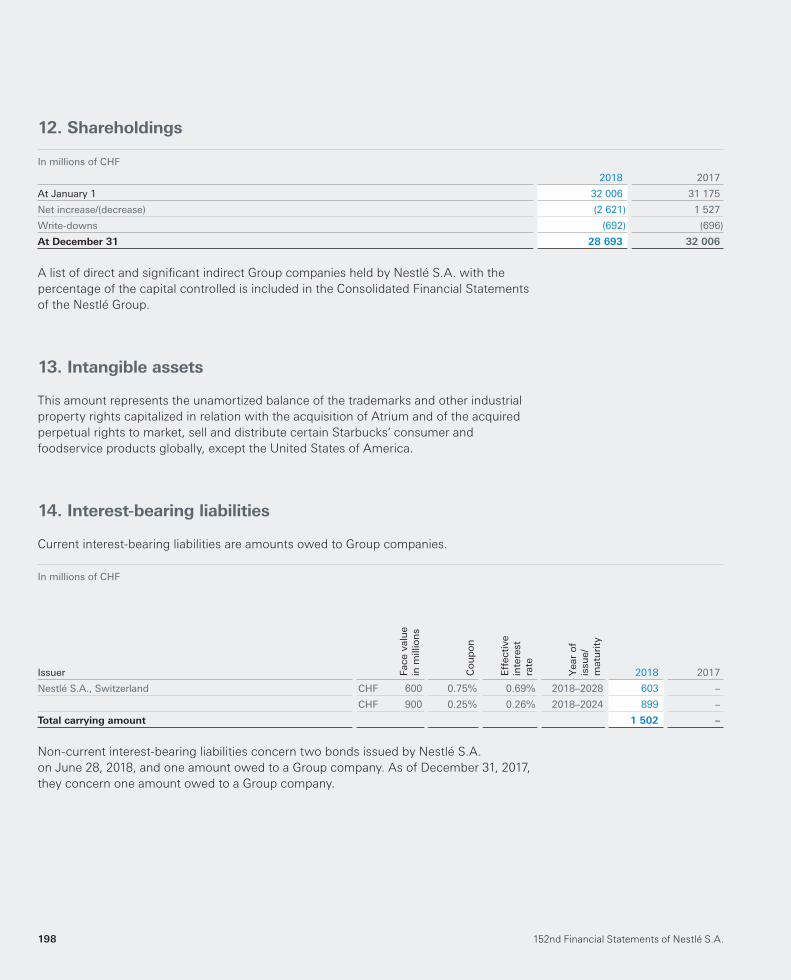
152nd Financial Statements of Nestlé S.A.198
12. Shareholdings
In millions of CHF
2018 2017
At January 1 32 006 31 175
Net increase/(decrease) (2 621) 1 527
Write-downs (692) (696)
At December 31 28 693 32 006
A list of direct and signifi cant indirect Group companies held by Nestlé S.A. with the
percentage of the capital controlled is included in the Consolidated Financial Statements
of the Nestlé Group.
13. Intangible assets
This amount represents the unamortized balance of the trademarks and other industrial
property rights capitalized in relation with the acquisition of Atrium and of the acquired
perpetual rights to market, sell and distribute certain Starbucks’ consumer and
foodservice products globally, except the United States of America.
14. Interest-bearing liabilities
Current interest-bearing liabilities are amounts owed to Group companies.
In millions of CHF
Issuer Face
val
ue
in m
illio
ns
Co
up
on
Eff
ecti
vein
tere
stra
te
Yea
r o
fis
sue/
mat
uri
ty
2018 2017
Nestlé S.A., Switzerland CHF 600 0.75% 0.69% 2018–2028 603 –
CHF 900 0.25% 0.26% 2018–2024 899 –
Total carrying amount 1 502 –
Non-current interest-bearing liabilities concern two bonds issued by Nestlé S.A.
on June 28, 2018, and one amount owed to a Group company. As of December 31, 2017,
they concern one amount owed to a Group company.
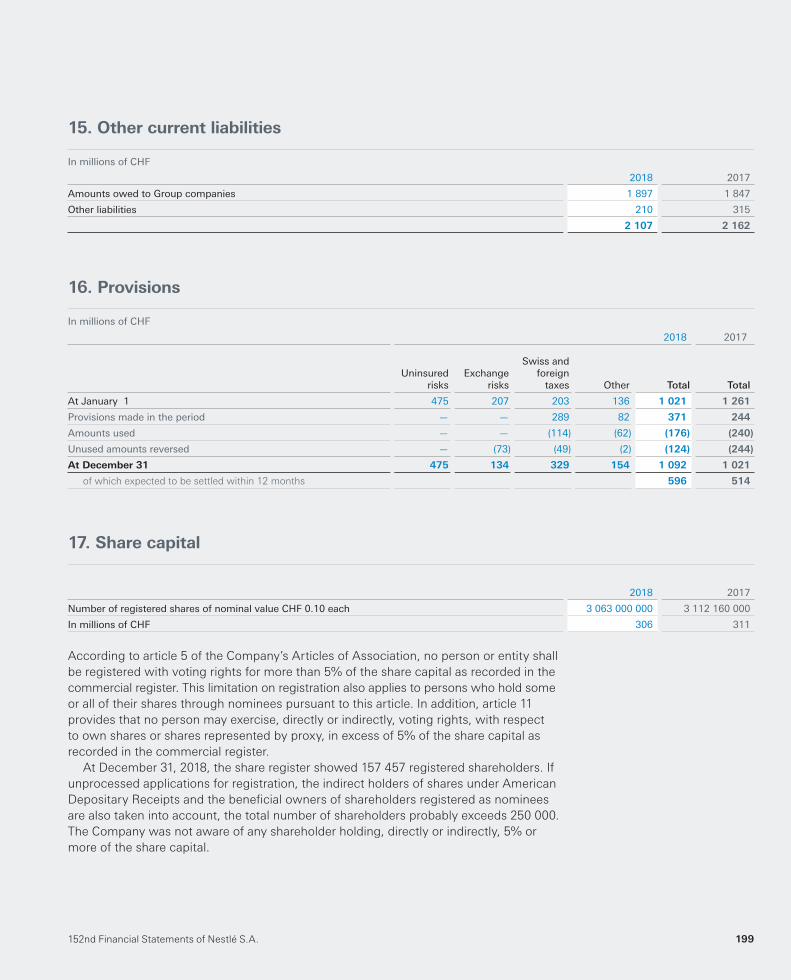
152nd Financial Statements of Nestlé S.A. 199
15. Other current liabilities
In millions of CHF
2018 2017
Amounts owed to Group companies 1 897 1 847
Other liabilities 210 315
2 107 2 162
16. Provisions
In millions of CHF
2018 2017
Uninsured risks
Exchangerisks
Swiss andforeign
taxes Other Total Total
At January 1 475 207 203 136 1 021 1 261
Provisions made in the period — — 289 82 371 244
Amounts used — — (114) (62) (176) (240)
Unused amounts reversed — (73) (49) (2) (124) (244)
At December 31 475 134 329 154 1 092 1 021
of which expected to be settled within 12 months 596 514
17. Share capital
2018 2017
Number of registered shares of nominal value CHF 0.10 each 3 063 000 000 3 112 160 000
In millions of CHF 306 311
According to article 5 of the Company’s Articles of Association, no person or entity shall
be registered with voting rights for more than 5% of the share capital as recorded in the
commercial register. This limitation on registration also applies to persons who hold some
or all of their shares through nominees pursuant to this article. In addition, article 11
provides that no person may exercise, directly or indirectly, voting rights, with respect
to own shares or shares represented by proxy, in excess of 5% of the share capital as
recorded in the commercial register.
At December 31, 2018, the share register showed 157 457 registered shareholders. If
unprocessed applications for registration, the indirect holders of shares under American
Depositary Receipts and the benefi cial owners of shareholders registered as nominees
are also taken into account, the total number of shareholders probably exceeds 250 000.
The Company was not aware of any shareholder holding, directly or indirectly, 5% or
more of the share capital.
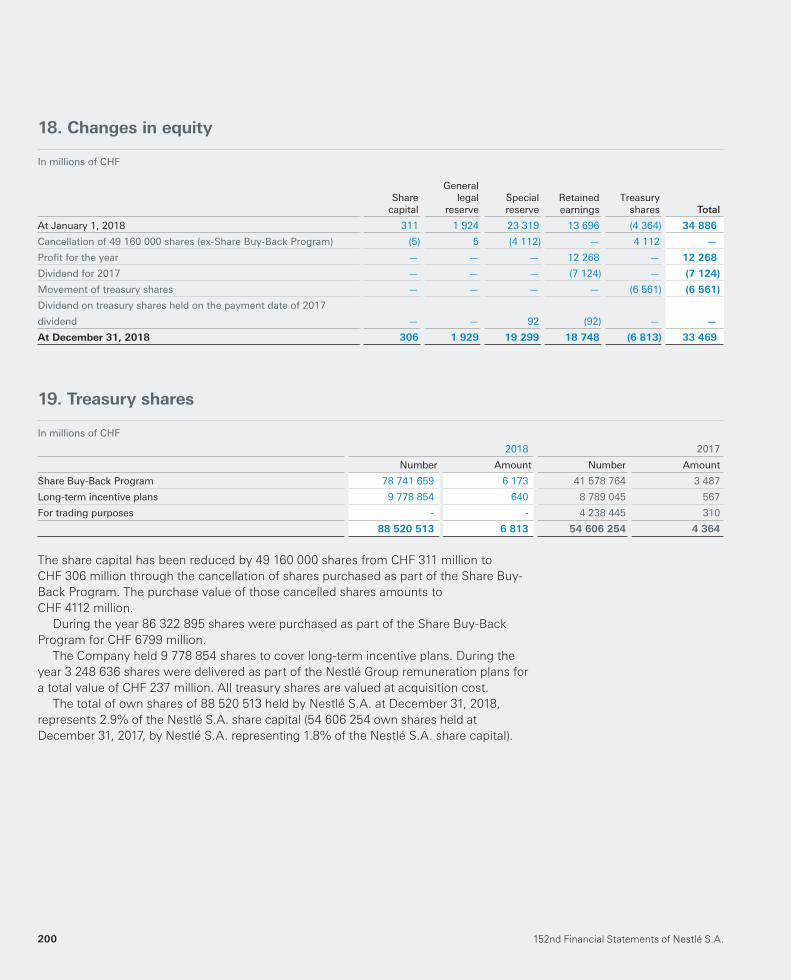
152nd Financial Statements of Nestlé S.A.200
18. Changes in equity
In millions of CHF
Sharecapital
Generallegal
reserve Specialreserve
Retainedearnings
Treasuryshares Total
At January 1, 2018 311 1 924 23 319 13 696 (4 364) 34 886
Cancellation of 49 160 000 shares (ex-Share Buy-Back Program) (5) 5 (4 112) — 4 112 —
Profi t for the year — — — 12 268 — 12 268
Dividend for 2017 — — — (7 124) — (7 124)
Movement of treasury shares — — — — (6 561) (6 561)
Dividend on treasury shares held on the payment date of 2017
dividend — — 92 (92) — —
At December 31, 2018 306 1 929 19 299 18 748 (6 813) 33 469
19. Treasury shares
In millions of CHF
2018 2017
Number Amount Number Amount
Share Buy-Back Program 78 741 659 6 173 41 578 764 3 487
Long-term incentive plans 9 778 854 640 8 789 045 567
For trading purposes - - 4 238 445 310
88 520 513 6 813 54 606 254 4 364
The share capital has been reduced by 49 160 000 shares from CHF 311 million to
CHF 306 million through the cancellation of shares purchased as part of the Share Buy-
Back Program. The purchase value of those cancelled shares amounts to
CHF 4112 million.
During the year 86 322 895 shares were purchased as part of the Share Buy-Back
Program for CHF 6799 million.
The Company held 9 778 854 shares to cover long-term incentive plans. During the
year 3 248 636 shares were delivered as part of the Nestlé Group remuneration plans for
a total value of CHF 237 million. All treasury shares are valued at acquisition cost.
The total of own shares of 88 520 513 held by Nestlé S.A. at December 31, 2018,
represents 2.9% of the Nestlé S.A. share capital (54 606 254 own shares held at
December 31, 2017, by Nestlé S.A. representing 1.8% of the Nestlé S.A. share capital).
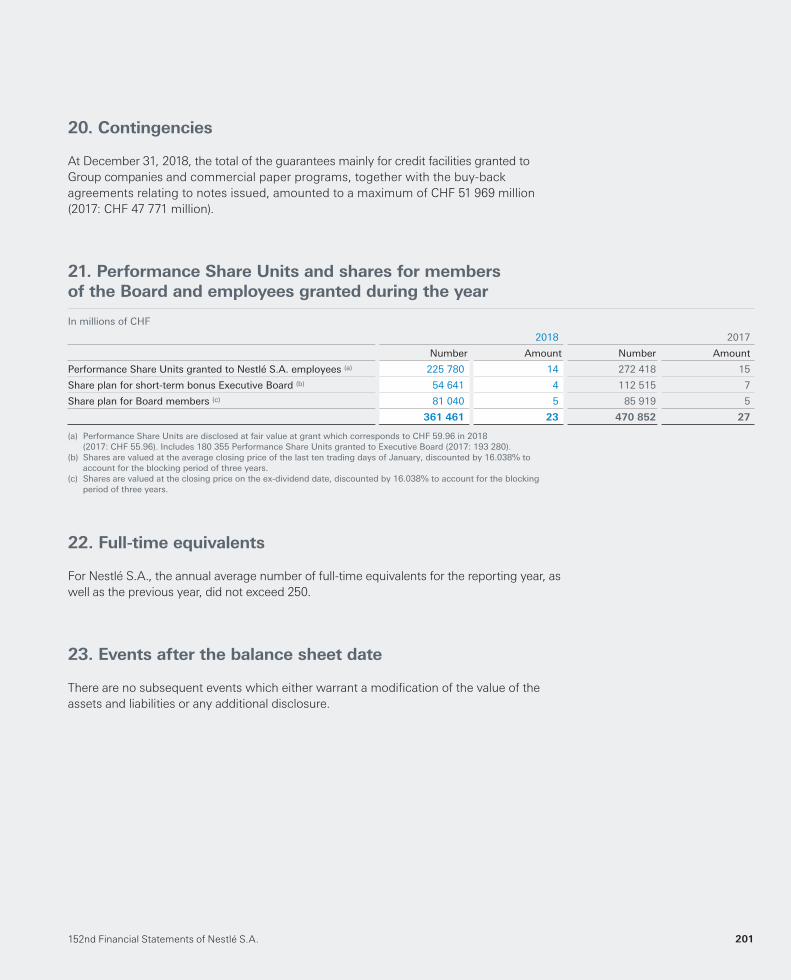
152nd Financial Statements of Nestlé S.A. 201
20. Contingencies
At December 31, 2018, the total of the guarantees mainly for credit facilities granted to
Group companies and commercial paper programs, together with the buy-back
agreements relating to notes issued, amounted to a maximum of CHF 51 969 million
(2017: CHF 47 771 million).
21. Performance Share Units and shares for members
of the Board and employees granted during the year
In millions of CHF
2018 2017
Number Amount Number Amount
Performance Share Units granted to Nestlé S.A. employees (a) 225 780 14 272 418 15
Share plan for short-term bonus Executive Board (b) 54 641 4 112 515 7
Share plan for Board members (c) 81 040 5 85 919 5
361 461 23 470 852 27
(a) Performance Share Units are disclosed at fair value at grant which corresponds to CHF 59.96 in 2018 (2017: CHF 55.96). Includes 180 355 Performance Share Units granted to Executive Board (2017: 193 280).
(b) Shares are valued at the average closing price of the last ten trading days of January, discounted by 16.038% to account for the blocking period of three years.
(c) Shares are valued at the closing price on the ex-dividend date, discounted by 16.038% to account for the blocking period of three years.
22. Full-time equivalents
For Nestlé S.A., the annual average number of full-time equivalents for the reporting year, as
well as the previous year, did not exceed 250.
23. Events after the balance sheet date
There are no subsequent events which either warrant a modifi cation of the value of the
assets and liabilities or any additional disclosure.
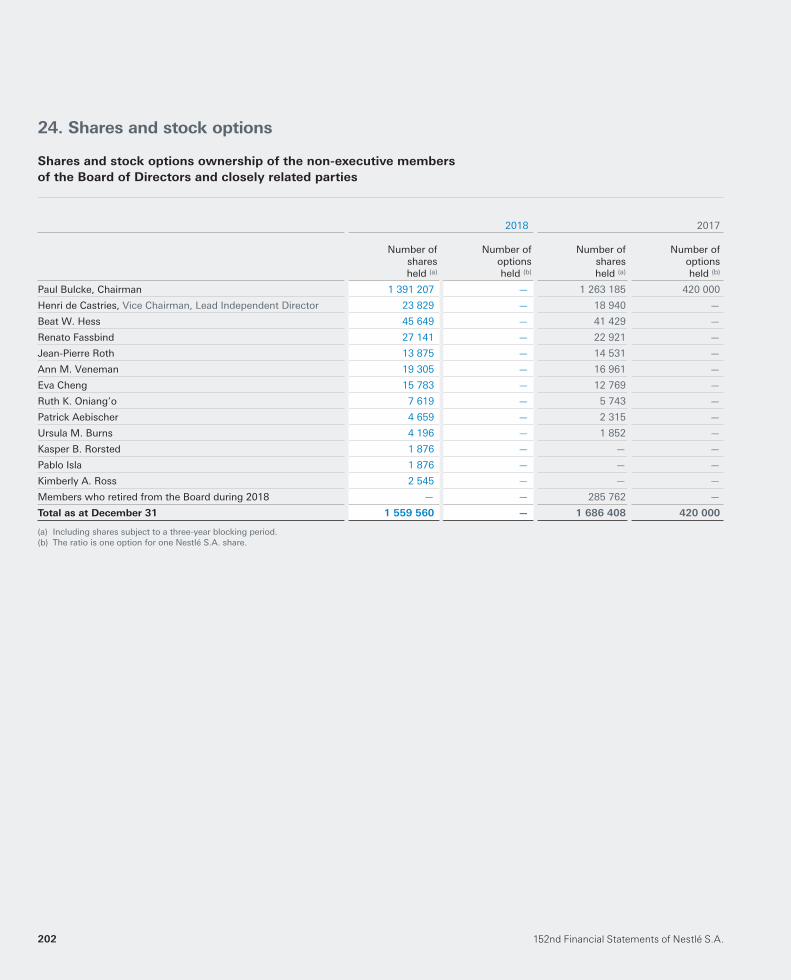
152nd Financial Statements of Nestlé S.A.202
24. Shares and stock options
Shares and stock options ownership of the non-executive members
of the Board of Directors and closely related parties
2018 2017
Number of shares
held (a)
Number ofoptions held (b)
Number of shares held (a)
Number ofoptions held (b)
Paul Bulcke, Chairman 1 391 207 — 1 263 185 420 000
Henri de Castries, Vice Chairman, Lead Independent Director 23 829 — 18 940 —
Beat W. Hess 45 649 — 41 429 —
Renato Fassbind 27 141 — 22 921 —
Jean-Pierre Roth 13 875 — 14 531 —
Ann M. Veneman 19 305 — 16 961 —
Eva Cheng 15 783 — 12 769 —
Ruth K. Oniang’o 7 619 — 5 743 —
Patrick Aebischer 4 659 — 2 315 —
Ursula M. Burns 4 196 — 1 852 —
Kasper B. Rorsted 1 876 — — —
Pablo Isla 1 876 — — —
Kimberly A. Ross 2 545 — — —
Members who retired from the Board during 2018 — — 285 762 —
Total as at December 31 1 559 560 — 1 686 408 420 000
(a) Including shares subject to a three-year blocking period.(b) The ratio is one option for one Nestlé S.A. share.
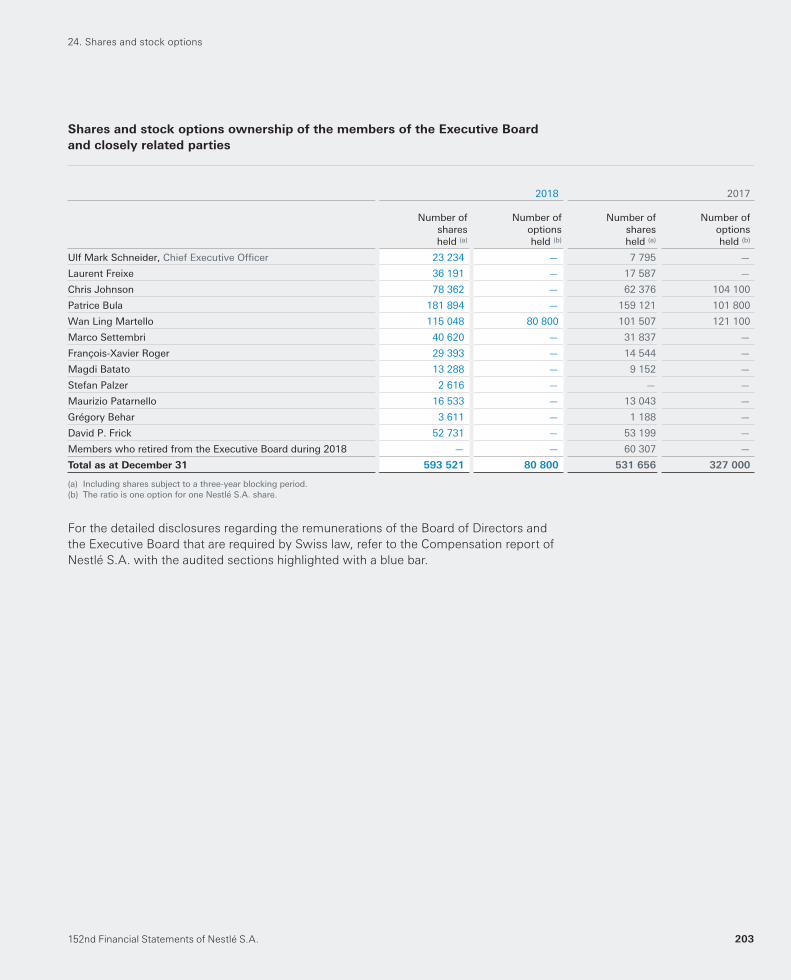
152nd Financial Statements of Nestlé S.A. 203
Shares and stock options ownership of the members of the Executive Board
and closely related parties
2018 2017
Number ofsharesheld (a)
Number ofoptions held (b)
Number ofsharesheld (a)
Number ofoptions held (b)
Ulf Mark Schneider, Chief Executive Offi cer 23 234 — 7 795 —
Laurent Freixe 36 191 — 17 587 —
Chris Johnson 78 362 — 62 376 104 100
Patrice Bula 181 894 — 159 121 101 800
Wan Ling Martello 115 048 80 800 101 507 121 100
Marco Settembri 40 620 — 31 837 —
François-Xavier Roger 29 393 — 14 544 —
Magdi Batato 13 288 — 9 152 —
Stefan Palzer 2 616 — — —
Maurizio Patarnello 16 533 — 13 043 —
Grégory Behar 3 611 — 1 188 —
David P. Frick 52 731 — 53 199 —
Members who retired from the Executive Board during 2018 — — 60 307 —
Total as at December 31 593 521 80 800 531 656 327 000
(a) Including shares subject to a three-year blocking period.(b) The ratio is one option for one Nestlé S.A. share.
For the detailed disclosures regarding the remunerations of the Board of Directors and
the Executive Board that are required by Swiss law, refer to the Compensation report of
Nestlé S.A. with the audited sections highlighted with a blue bar.
24. Shares and stock options
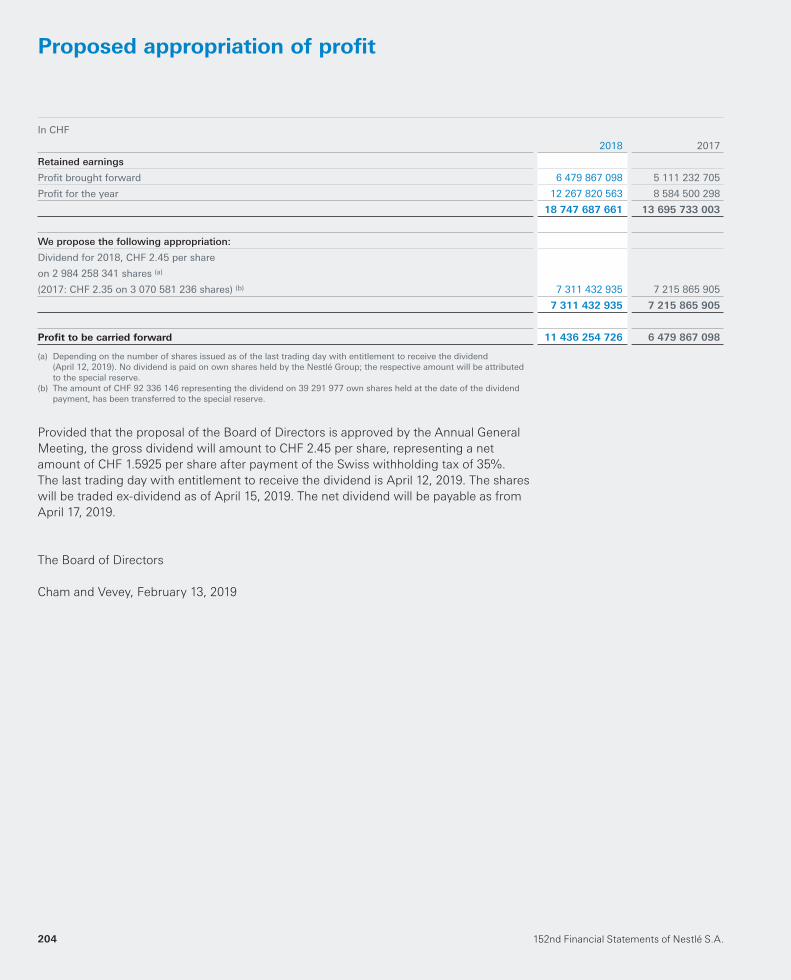
152nd Financial Statements of Nestlé S.A.204
Proposed appropriation of profi t
In CHF
2018 2017
Retained earnings
Profi t brought forward 6 479 867 098 5 111 232 705
Profi t for the year 12 267 820 563 8 584 500 298
18 747 687 661 13 695 733 003
We propose the following appropriation:
Dividend for 2018, CHF 2.45 per share
on 2 984 258 341 shares (a)
(2017: CHF 2.35 on 3 070 581 236 shares) (b) 7 311 432 935 7 215 865 905
7 311 432 935 7 215 865 905
Profi t to be carried forward 11 436 254 726 6 479 867 098
(a) Depending on the number of shares issued as of the last trading day with entitlement to receive the dividend (April 12, 2019). No dividend is paid on own shares held by the Nestlé Group; the respective amount will be attributed to the special reserve.
(b) The amount of CHF 92 336 146 representing the dividend on 39 291 977 own shares held at the date of the dividend payment, has been transferred to the special reserve.
Provided that the proposal of the Board of Directors is approved by the Annual General
Meeting, the gross dividend will amount to CHF 2.45 per share, representing a net
amount of CHF 1.5925 per share after payment of the Swiss withholding tax of 35%.
The last trading day with entitlement to receive the dividend is April 12, 2019. The shares
will be traded ex-dividend as of April 15, 2019. The net dividend will be payable as from
April 17, 2019.
The Board of Directors
Cham and Vevey, February 13, 2019

152nd Financial Statements of Nestlé S.A. 205
152nd Financial Statements of Nestlé S.A.206
Statutory Auditor’s ReportTo the General Meeting of Nestlé S.A., Cham & Vevey
Report on the Audit of the Financial Statements
Opinion
We have audited the financial statements of Nestlé S.A., which comprise the balance sheet as at December 31, 2018, and the income statement for the year then ended, and notes to the financial statements, including a summary of significant accounting policies.
In our opinion the financial statements (pages 193 to 203) for the year ended December 31, 2018, comply with Swiss law and the Company’s Articles of Association.
Basis for Opinion
We conducted our audit in accordance with Swiss law and Swiss Auditing Standards. Our responsibilities under those provisions and standards are further described in the Auditor’s Responsibilities for the Audit of the Financial Statements section of our report. We are independent of the entity in accordance with the provisions of Swiss law and the requirements of the Swiss audit profession and we have fulfilled our other ethical responsibilities in accordance with these requirements.
We believe that the audit evidence we have obtained is sufficient and appropriate to provide a basis for our opinion.
Report on Key Audit Matters based on the circular 1/2015 of the Federal Audit Oversight Authority
Key audit matters are those matters that, in our professional judgment, were of most significance in our audit of the financial statements of the current period. We have determined that there are no key audit matters to communicate in our report.
Responsibility of the Board of Directors for the Financial Statements
The Board of Directors is responsible for the preparation of the financial statements in accordance with the provisions of Swiss law and the Company’s Articles of Association, and for such internal control as the Board of Directors determines is necessary to enable the preparation of financial statements that are free from material misstatement, whether due to fraud or error.
In preparing the financial statements, the Board of Directors is responsible for assessing the entity’s ability to continue as a going concern, disclosing, as applicable, matters related to going concern and using the going concern basis of accounting unless the Board of Directors either intends to liquidate the entity or to cease operations, or has no realistic alternative but to do so.
Auditor’s Responsibilities for the Audit of the Financial Statements
Our objectives are to obtain reasonable assurance about whether the financial statements as a whole are free from material misstatement, whether due to fraud or error, and to issue an auditor’s report that includes our opinion. Reasonable assurance is a high level of assurance, but is not a guarantee that an audit conducted in accordance with Swiss law and Swiss Auditing Standards will always detect a material misstatement when it exists. Misstatements can arise from fraud or error and are considered material if, individually or in the aggregate, they could reasonably be expected to influence the economic decisions of users taken on the basis of these financial statements.
152nd Financial Statements of Nestlé S.A. 207
As part of an audit in accordance with Swiss law and Swiss Auditing Standards, we exercise professional judgment and maintain professional skepticism throughout the audit. We also:
— Identify and assess the risks of material misstatement of the financial statements, whether due to fraud or error, design and perform audit procedures responsive to those risks, and obtain audit evidence that is sufficient and appropriate to provide a basis for our opinion. The risk of not detecting a material misstatement resulting from fraud is higher than for one resulting from error, as fraud may involve collusion, forgery, intentional omissions, misrepresentations, or the override of internal control.
— Obtain an understanding of internal control relevant to the audit in order to design audit procedures that are appropriate in the circumstances, but not for the purpose of expressing an opinion on the effectiveness of internal control.
— Evaluate the appropriateness of accounting policies used and the reasonableness of accounting estimates and related disclosures made.
— Conclude on the appropriateness of the Board of Directors’ use of the going concern basis of accounting and, based on the audit evidence obtained, whether a material uncertainty exists related to events or conditions that may cast significant doubt on the entity’s ability to continue as a going concern. If we conclude that a material uncertainty exists, we are required to draw attention in our auditor’s report to the related disclosures in the financial statements or, if such disclosures are inadequate, to modify our opinion. Our conclusions are based on the audit evidence obtained up to the date of our auditor’s report. However, future events or conditions may cause the entity to cease to continue as a going concern.
We communicate with the Board of Directors or its relevant committee regarding, among other matters, the planned scope and timing of the audit and significant audit findings, including any significant deficiencies in internal control that we identify during our audit.
We also provide the Board of Directors or its relevant committee with a statement that we have complied with relevant ethical requirements regarding independence, and to communicate with them all relationships and other matters that may reasonably be thought to bear on our independence, and where applicable, related safeguards.
From the matters communicated with the Board of Directors or its relevant committee, we determine those matters that were of most significance in the audit of the financial statements of the current period and are therefore the key audit matters. We describe these matters in our auditor’s report, unless law or regulation precludes public disclosure about the matter or when, in extremely rare circumstances, we determine that a matter should not be communicated in our report because the adverse consequences of doing so would reasonably be expected to outweigh the public interest benefits of such communication.
Report on Other Legal and Regulatory Requirements
In accordance with article 728a para. 1 item 3 CO and the Swiss Auditing Standard 890, we confirm that an internal control system exists, which has been designed for the preparation of financial statements according to the instructions of the Board of Directors.
We further confirm that the proposed appropriation of available earnings complies with Swiss law and the Company’s Articles of Association. We recommend that the financial statements submitted to you be approved.
KPMG SA
Scott Cormack Lukas MartyLicensed Audit Expert Licensed Audit ExpertAuditor in Charge
Geneva, February 13, 2019
KPMG SA, 111 Rue de Lyon, P.O. Box 347, CH-1211 Geneva 13
KPMG SA is a subsidiary of KPMG Holding AG, which is a member of the KPMG network of independent firms affiliated with KPMG International Cooperative (“KPMG International”), a Swiss legal entity. All rights reserved.
152nd Financial Statements of Nestlé S.A.208
Notes