Embed Size (px)
Citation preview

Good jobs for non-graduates

nef is an independent think-and-do tank that inspires and demonstrates real economic well-being.We aim to improve quality of life by promoting innovative solutions that challenge mainstream thinking on economic, environmental and social issues. We work in partnership and put people and the planet first.
nef (the new economics foundation) is a registered charity founded in 1986 by the leaders of The Other Economic Summit (TOES), which forced issues such as international debt onto the agenda of the G8 summit meetings. It has taken a lead in helping establish new coalitions and organisations such as the Jubilee 2000 debt campaign; the Ethical Trading Initiative; the UK Social Investment Forum; and new ways to measure social and economic well-being.
Good jobs for non-graduates 1
Contents
Executive Summary 2
1. Introduction 4
2. Where are the good jobs for non-graduates? 7
2.1 Key sectors employing non-graduates 7
2.2. Qualification profiles in super-sectors 8
2.3 Pay in the super-sectors 10
2.4 Summary 12
3. Where are the good sectors for non-graduates? 13
3.1 Growth prospects for super-sectors 13
3.2 International competition 13
3.3 Regional density 14
3.4 Gender-balance 14
3.5 Summary 14
4. Conclusions and Recommendations 15
Recommendations 16
Appendix A 19
Appendix B 20
Methodology 20
Appendix C 23
Endnotes 24

Good jobs for non-graduates 2
Executive Summary
When it comes to jobs, quality matters as well as quantity. And a growing number of non-graduates are working in low-paid, dead-end jobs. By adopting a sector-specific approach we highlight where the good jobs for non-graduates can be found and how we can encourage more to be created.
Non-graduates make up more than one half of the workforce and are more than twice as likely to be unemployed as graduates. However, the problem is not only the quantity, but also the quality of jobs available to them.
In the past three decades the UK has witnessed a growth in the proportion of precarious low-paid jobs on the one hand and high-paid graduate jobs on the other. The result has been growing in-work poverty and economic inequality.
The traditional policy response to this ‘hour-glass’ labour market has been to try and up-skill the population, pushing as many people as possible into the top half of the glass. This is valuable but it is not enough.
To reshape the debate our research takes a fresh look at the data. We analyse the jobs available to non-graduates by sector to find out where the good jobs for non-graduates can be found now and where they may come from in future.
Key Findings
The majority of the non-graduate workforce is employed in ten ‘super sectors’ of which retail is by far the biggest employer.
Wages for those with the same level of qualification vary hugely by sector. The least well paid make around £18,000 a year in transport manufacturing as opposed to under £10,000 in hospitality.
The variations in sector pay levels are not explained by the variations in qualification profiles. Middle-level qualified workers in social care tend to be worse paid than low qualified workers in transport manufacturing.
Around half of the super-sectors are forecast to grow. Unfortunately, these are the ones that pay the lowest wages.
Sectors that offer a high proportion of good jobs are forecast to decline, affecting areas of the UK with higher unemployment the most.
The best paid sectors are male-dominated, suggesting women are less likely to get a good job without a degree.

Good jobs for non-graduates 3
Conclusions
1. As things stand, the number of good jobs for non-graduates is set to fall. If policymakers do not act soon we will face a labour market that is even more hollowed out with an ever tighter squeeze in middle level jobs.
2. Up-skilling non-graduates is not enough on its own. The sector you work in as well as your skill level has a huge influence in determining your pay and progression.
3. Low pay is more prevalent in non-traded sectors. The lowest paid sectors are not for the most part competing internationally. So whilst British factory workers may be competing on wages with their Chinese counterparts, British gym instructors are not.
4. Based on existing patterns, manufacturing super sectors offer the best chance of tackling regional imbalances in unemployment. Manufacturing provides good jobs in areas where employment is lowest.
Recommendations
We need a jobs strategy that renovates the bad and promotes the good jobs in the economy. We argue for a sector-specific approach, developed in collaboration with businesses, employees, trade unions and educational institutions.
In social care, an expanding low wage sector, government is the major employer and purchaser; it therefore has the power to gradually raise wages, in ways that incentivise higher quality care.
In retail, a large low wage sector which is also not part of international supply chains, government should strengthen incentives and pressures for higher wages. This has to be done slowly but steadily to avoid unemployment and other negative side effects. Measures include uprating the minimum wage, adjusting fiscal incentives and taking steps to strengthen collective bargaining.
In construction, a high wage sector where demand is highly sensitive to policy, government should use the planning system, the capital gains tax regime and creative public investment to stimulate construction of much needed social housing and the greening of existing stock.
In manufacturing, a high wage but declining sector, government should stimulate demand by helping regions develop a clear sense of their actual and potential competitive advantages that can generate good jobs, given developments in the global economy.
Good jobs for non-graduates 4
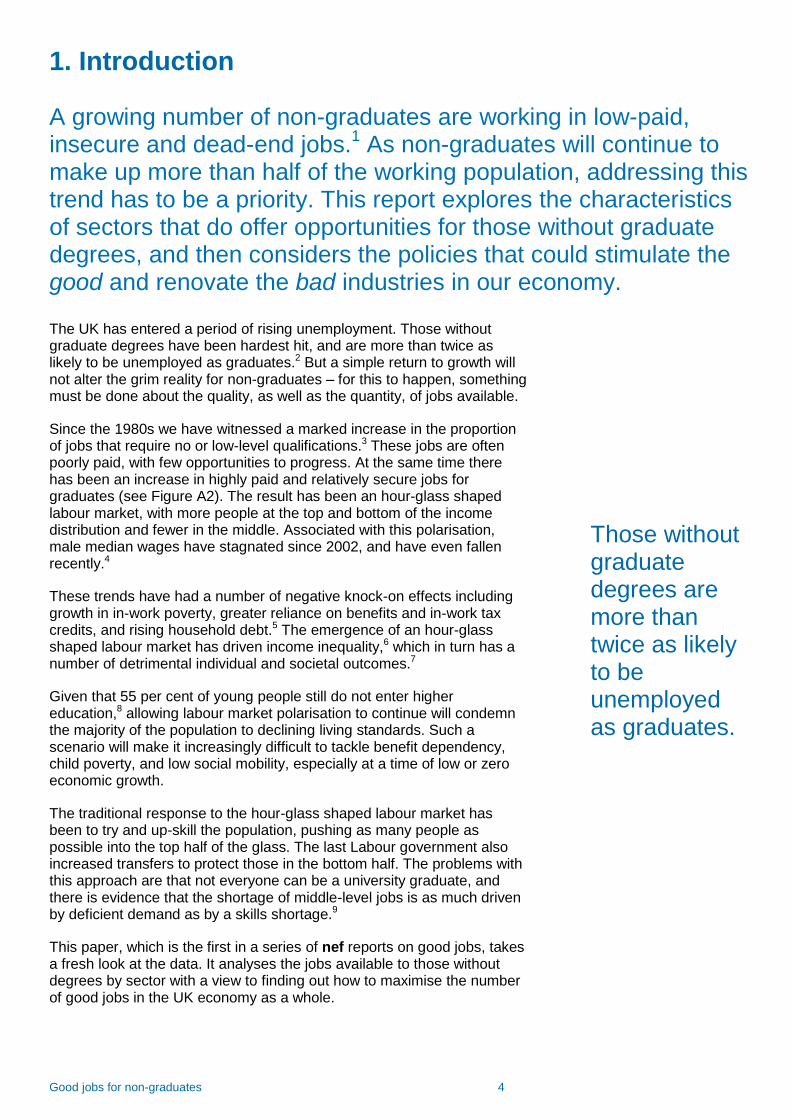
1. Introduction
A growing number of non-graduates are working in low-paid, insecure and dead-end jobs.
1 As non-graduates will continue to
make up more than half of the working population, addressing this trend has to be a priority. This report explores the characteristics of sectors that do offer opportunities for those without graduate degrees, and then considers the policies that could stimulate the good and renovate the bad industries in our economy. The UK has entered a period of rising unemployment. Those without graduate degrees have been hardest hit, and are more than twice as likely to be unemployed as graduates.2 But a simple return to growth will not alter the grim reality for non-graduates – for this to happen, something must be done about the quality, as well as the quantity, of jobs available.
Since the 1980s we have witnessed a marked increase in the proportion of jobs that require no or low-level qualifications.3 These jobs are often poorly paid, with few opportunities to progress. At the same time there has been an increase in highly paid and relatively secure jobs for graduates (see Figure A2). The result has been an hour-glass shaped labour market, with more people at the top and bottom of the income distribution and fewer in the middle. Associated with this polarisation, male median wages have stagnated since 2002, and have even fallen recently.4
These trends have had a number of negative knock-on effects including growth in in-work poverty, greater reliance on benefits and in-work tax credits, and rising household debt.5 The emergence of an hour-glass shaped labour market has driven income inequality,6 which in turn has a number of detrimental individual and societal outcomes.7
Given that 55 per cent of young people still do not enter higher education,8 allowing labour market polarisation to continue will condemn the majority of the population to declining living standards. Such a scenario will make it increasingly difficult to tackle benefit dependency, child poverty, and low social mobility, especially at a time of low or zero economic growth.
The traditional response to the hour-glass shaped labour market has been to try and up-skill the population, pushing as many people as possible into the top half of the glass. The last Labour government also increased transfers to protect those in the bottom half. The problems with this approach are that not everyone can be a university graduate, and there is evidence that the shortage of middle-level jobs is as much driven by deficient demand as by a skills shortage.9
This paper, which is the first in a series of nef reports on good jobs, takes a fresh look at the data. It analyses the jobs available to those without degrees by sector with a view to finding out how to maximise the number of good jobs in the UK economy as a whole.
Those without graduate degrees are more than twice as likely to be unemployed as graduates.
Good jobs for non-graduates 5
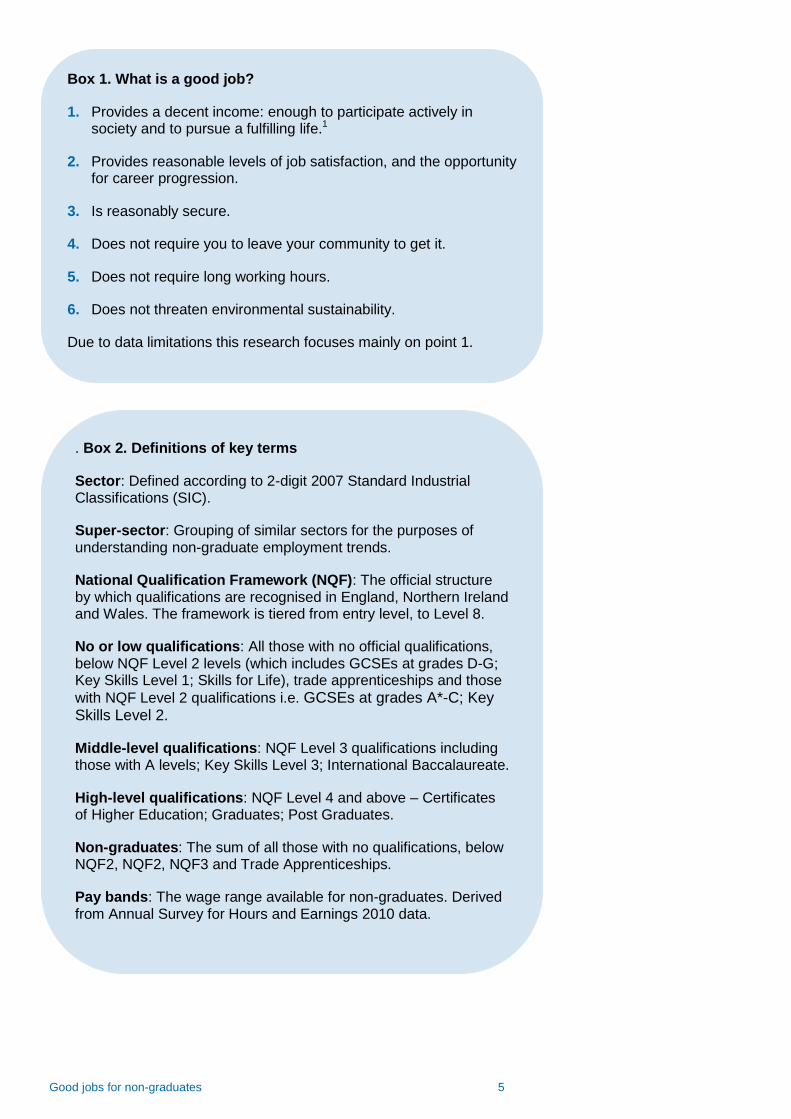
Box 1. What is a good job?
1. Provides a decent income: enough to participate actively in society and to pursue a fulfilling life.1
2. Provides reasonable levels of job satisfaction, and the opportunity for career progression.
3. Is reasonably secure.
4. Does not require you to leave your community to get it.
5. Does not require long working hours.
6. Does not threaten environmental sustainability.
Due to data limitations this research focuses mainly on point 1.
. Box 2. Definitions of key terms
Sector: Defined according to 2-digit 2007 Standard Industrial Classifications (SIC).
Super-sector: Grouping of similar sectors for the purposes of understanding non-graduate employment trends.
National Qualification Framework (NQF): The official structure by which qualifications are recognised in England, Northern Ireland and Wales. The framework is tiered from entry level, to Level 8.
No or low qualifications: All those with no official qualifications, below NQF Level 2 levels (which includes GCSEs at grades D-G; Key Skills Level 1; Skills for Life), trade apprenticeships and those
with NQF Level 2 qualifications i.e. GCSEs at grades A*-C; Key Skills Level 2.
Middle-level qualifications: NQF Level 3 qualifications including those with A levels; Key Skills Level 3; International Baccalaureate.
High-level qualifications: NQF Level 4 and above – Certificates of Higher Education; Graduates; Post Graduates.
Non-graduates: The sum of all those with no qualifications, below NQF2, NQF2, NQF3 and Trade Apprenticeships.
Pay bands: The wage range available for non-graduates. Derived from Annual Survey for Hours and Earnings 2010 data.
Good jobs for non-graduates 6
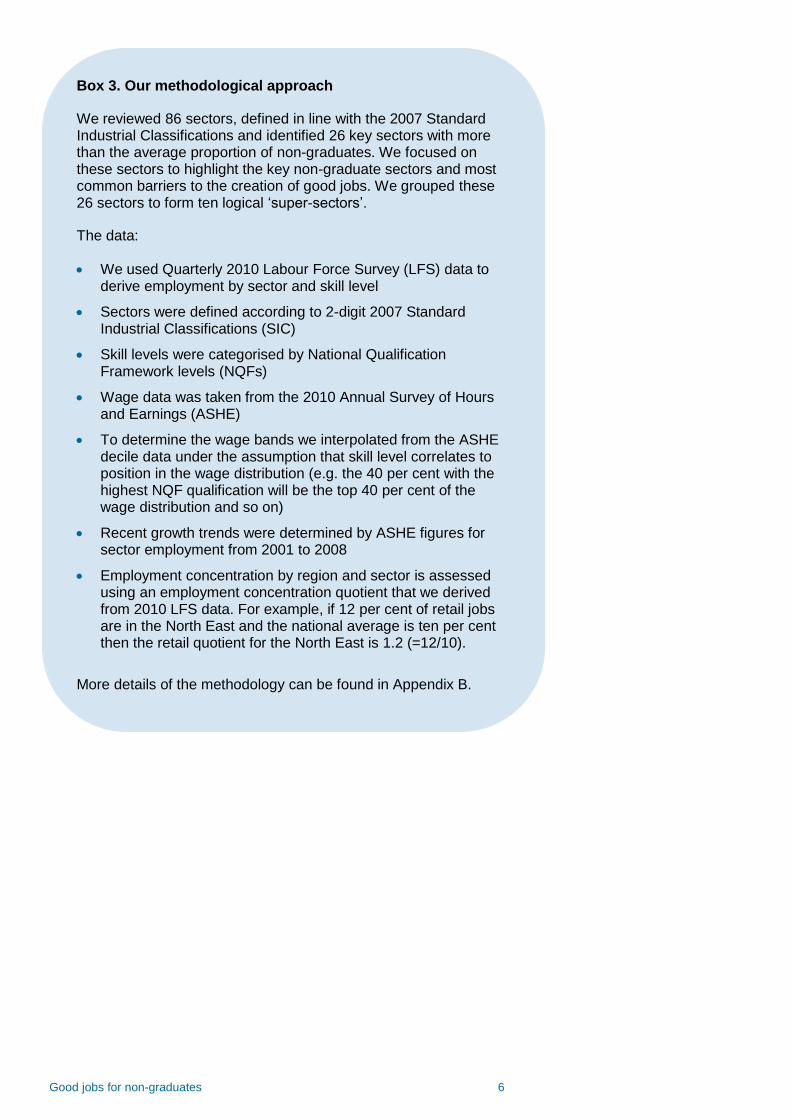
Box 3. Our methodological approach
We reviewed 86 sectors, defined in line with the 2007 Standard Industrial Classifications and identified 26 key sectors with more than the average proportion of non-graduates. We focused on these sectors to highlight the key non-graduate sectors and most common barriers to the creation of good jobs. We grouped these 26 sectors to form ten logical ‘super-sectors’.
The data:
We used Quarterly 2010 Labour Force Survey (LFS) data to derive employment by sector and skill level
Sectors were defined according to 2-digit 2007 Standard Industrial Classifications (SIC)
Skill levels were categorised by National Qualification Framework levels (NQFs)
Wage data was taken from the 2010 Annual Survey of Hours and Earnings (ASHE)
To determine the wage bands we interpolated from the ASHE decile data under the assumption that skill level correlates to position in the wage distribution (e.g. the 40 per cent with the highest NQF qualification will be the top 40 per cent of the wage distribution and so on)
Recent growth trends were determined by ASHE figures for sector employment from 2001 to 2008
Employment concentration by region and sector is assessed using an employment concentration quotient that we derived from 2010 LFS data. For example, if 12 per cent of retail jobs are in the North East and the national average is ten per cent then the retail quotient for the North East is 1.2 (=12/10).
More details of the methodology can be found in Appendix B.
Good jobs for non-graduates 7
2. Where are the good jobs for non-graduates?
“Some of the most prestigious companies in England – large and small, public and private – employ apprentices and benefit from doing so. More than 30 per cent of Rolls-Royce apprentices have progressed to senior management roles within the company…I'm calling on more businesses to follow this lead.”
Vince Cable, February 201110
In this chapter we review where the good jobs for non-graduates exist. To do so, instead of focusing on general skill levels and wage outcomes11 we have examined qualifications and wage level variations within and between different sectors to identify:
where non-graduates are employed
what the qualification profiles are of each sector
how well each sector is paid.
2.1 Key sectors employing non-graduates
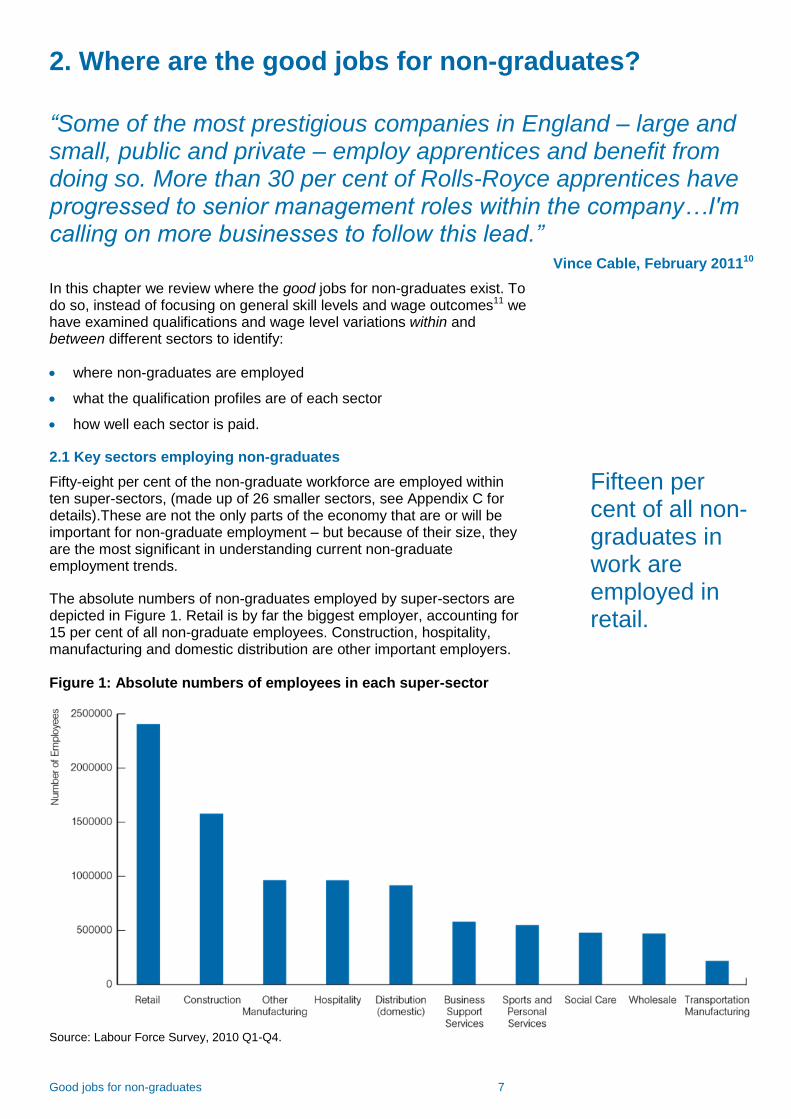
Fifty-eight per cent of the non-graduate workforce are employed within ten super-sectors, (made up of 26 smaller sectors, see Appendix C for details).These are not the only parts of the economy that are or will be important for non-graduate employment – but because of their size, they are the most significant in understanding current non-graduate employment trends.
The absolute numbers of non-graduates employed by super-sectors are depicted in Figure 1. Retail is by far the biggest employer, accounting for 15 per cent of all non-graduate employees. Construction, hospitality, manufacturing and domestic distribution are other important employers. Figure 1: Absolute numbers of employees in each super-sector
Source: Labour Force Survey, 2010 Q1-Q4.
Fifteen per cent of all non-graduates in work are employed in retail.
Good jobs for non-graduates 8
2.2. Qualification profiles in super-sectors
By comparing qualification profiles within and between sectors, we can begin to analyse which sectors are the biggest providers of jobs requiring qualifications and what opportunities there are for progression into these roles.
There is a caveat. Qualifications are not the same as skills. As a result, some sectors may offer more skilled jobs than qualification statistics suggest because informal skills (not associated with qualifications) are relatively important. This type of sector would appear relatively well paid given the qualification profile of its employees. On the other hand, it is possible to have a job you are over-qualified for. Some sectors may offer fewer skilled jobs than qualification statistics suggest because a relatively high proportion of the workforce is operating below its qualification level. This type of sector would appear relatively badly paid given the qualification profile of its employees. Box 4 examines these effects in more detail and finds little mismatch between qualifications and skills levels in most sectors.
The caveat calls into question a reliance on increasing formal qualifications alone to increase the number of good jobs – an issue explored in Box 4.
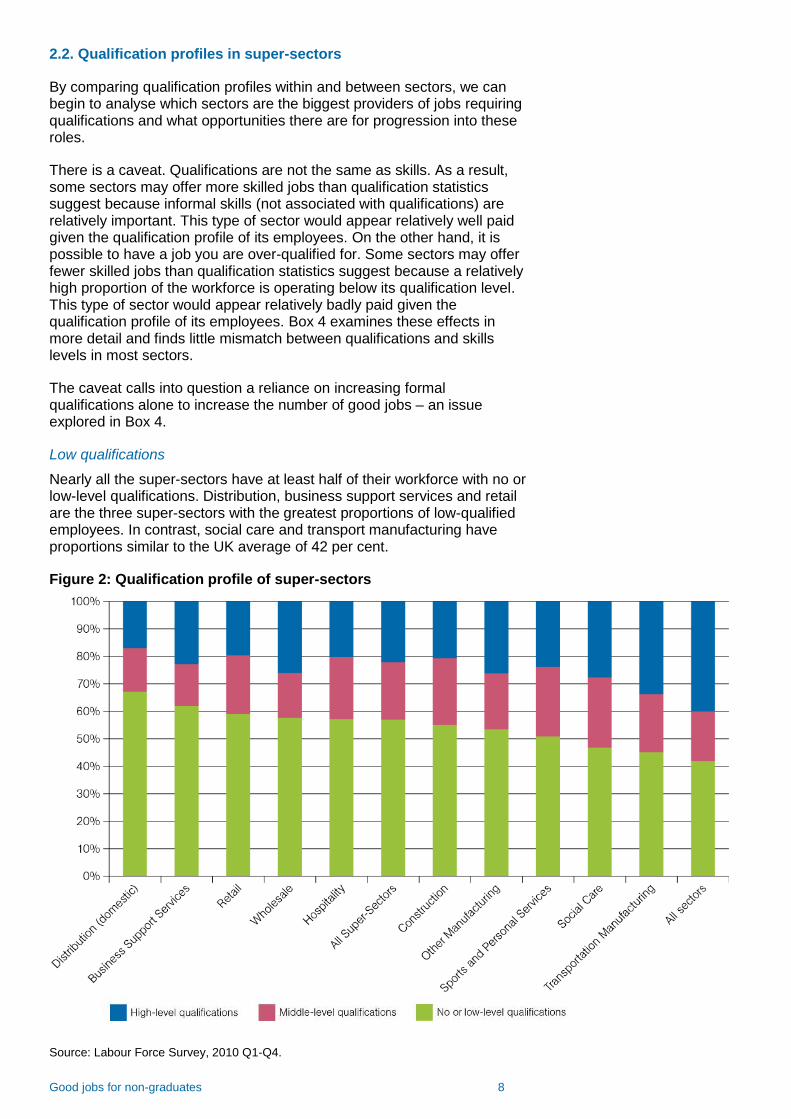
Low qualifications
Nearly all the super-sectors have at least half of their workforce with no or low-level qualifications. Distribution, business support services and retail are the three super-sectors with the greatest proportions of low-qualified employees. In contrast, social care and transport manufacturing have proportions similar to the UK average of 42 per cent.
Figure 2: Qualification profile of super-sectors
Source: Labour Force Survey, 2010 Q1-Q4.
Good jobs for non-graduates 9
Box 4. Qualifications and occupations
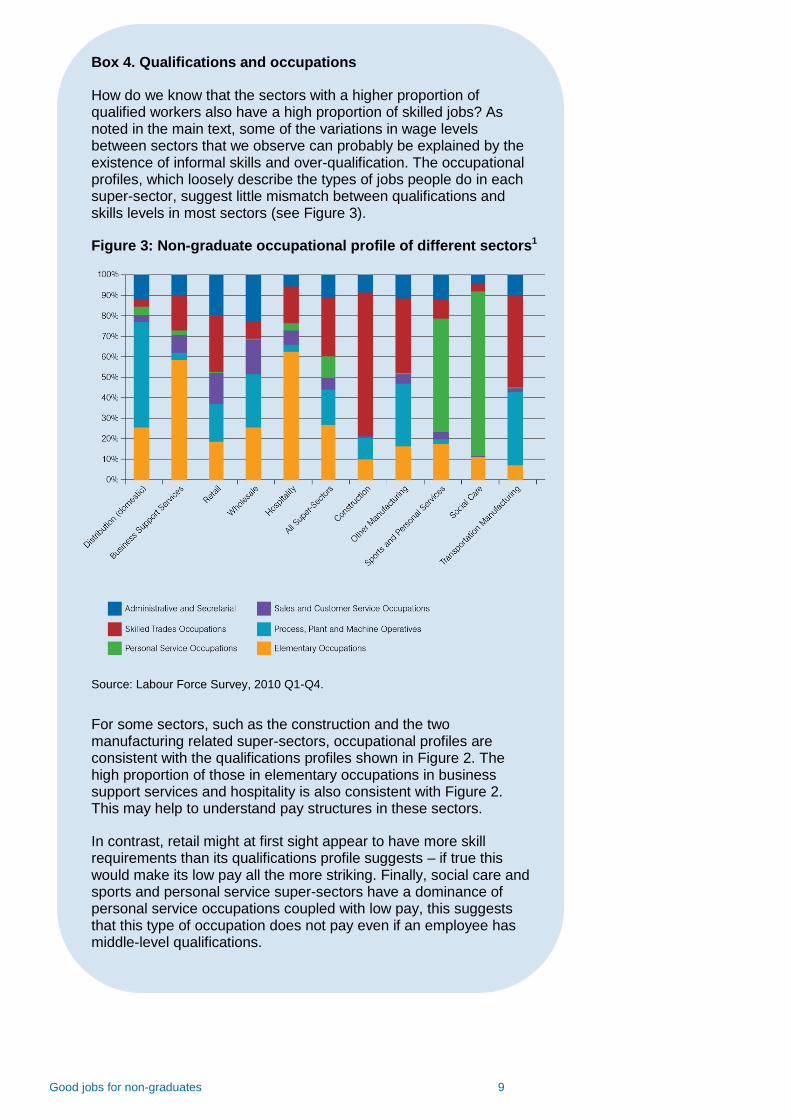
How do we know that the sectors with a higher proportion of qualified workers also have a high proportion of skilled jobs? As noted in the main text, some of the variations in wage levels between sectors that we observe can probably be explained by the existence of informal skills and over-qualification. The occupational profiles, which loosely describe the types of jobs people do in each super-sector, suggest little mismatch between qualifications and skills levels in most sectors (see Figure 3).
Figure 3: Non-graduate occupational profile of different sectors1
Source: Labour Force Survey, 2010 Q1-Q4.
For some sectors, such as the construction and the two manufacturing related super-sectors, occupational profiles are consistent with the qualifications profiles shown in Figure 2. The high proportion of those in elementary occupations in business support services and hospitality is also consistent with Figure 2. This may help to understand pay structures in these sectors.
In contrast, retail might at first sight appear to have more skill requirements than its qualifications profile suggests – if true this would make its low pay all the more striking. Finally, social care and sports and personal service super-sectors have a dominance of personal service occupations coupled with low pay, this suggests that this type of occupation does not pay even if an employee has middle-level qualifications.
Good jobs for non-graduates 10
Middle-level qualifications
In the economy as a whole, 18 per cent of employees have middle-level qualifications. In social care it is 26 per cent, in sports and personal services 25 per cent, in construction 24 per cent and in hospitality 23 per cent. Other super-sectors with more than average middle-level qualifications are retail and the two manufacturing sectors. Wholesale, distribution and business support services, have less than the national average with 16 per cent, 16 per cent and 15 per cent respectively.
Ladders of opportunities
Another way of ranking the super-sectors is by the ratio of low to medium qualified employees. For example, a ratio of 1:1 would indicate that for every employee with a low-level qualification there is one with a middle-level qualification. We can provisionally infer that the lower this ratio, the better the prospects for individuals to progress from no or low skill positions to medium skill positions over the course of their careers.
The average ratio across all sectors of the economy is 2.3:1, that is for every 2.3 low skill jobs there is only one job for those with middle-level qualifications. This makes sense given our hour-glass shaped labour market. Some super-sectors such as social care have a lower ratio of around 1.8:1, suggesting reasonable prospects for progression. Business support services, by contrast, has a ratio of over 4:1 – this sector includes sub-contractors with unskilled labour, where the employees enjoy very poor progression prospects.
2.3 Pay in the super-sectors
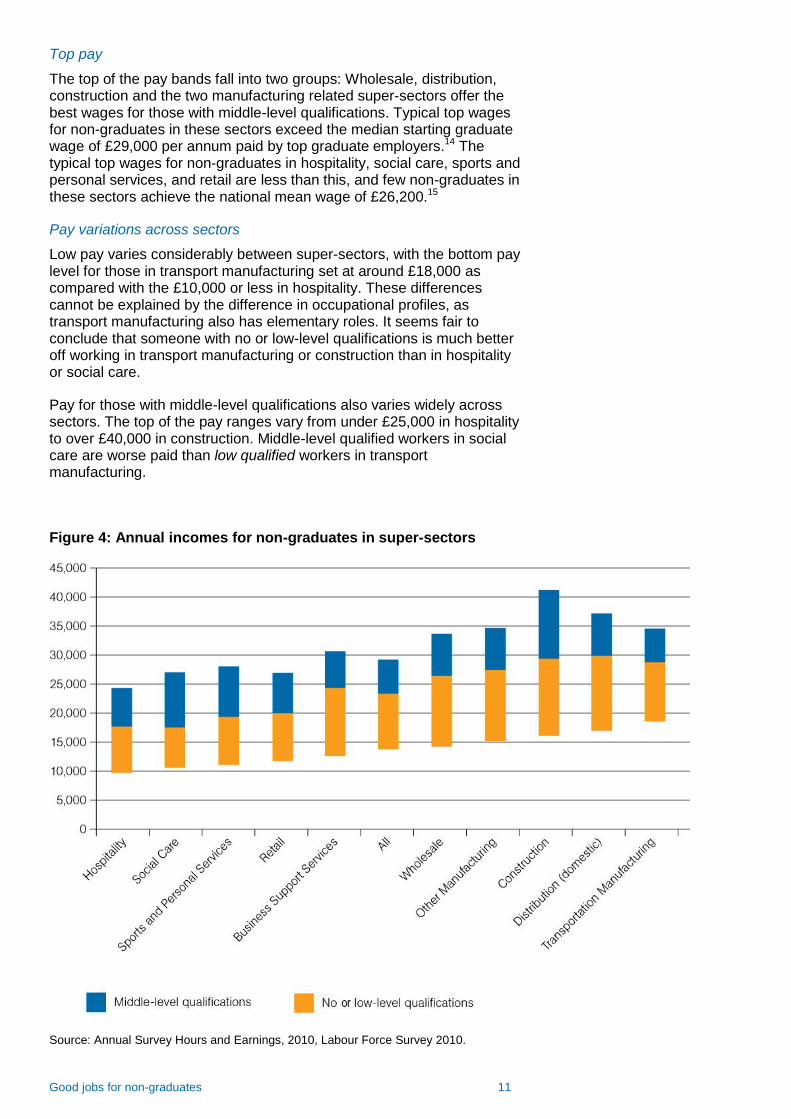
Figure 4 ranks the super-sectors according to average pay in the bottom decile. The top of the bar, coloured in blue, is our estimate of typical pay band for a middle-level qualified employee. The bottom of the bar, coloured in orange, is our estimate of the typical pay band for those with no or low-level qualifications (see Appendix B for our methodology).
Low pay
The lowest paid jobs are in hospitality, with bottom decile pay of less than £10,000 a year, which is approximately the national minimum wage. Only five of the ten super-sectors pay their lowest paid workers the non-London Living Wage of £7.20 per hour, or £13,230 annually.12 The prevalence of low wages is directly linked to in-work poverty, and the resulting pressure for tax credits to make up the shortfall in wage packets.13
Pay ranges
The length of the bar in Figure 4 illustrates how wage ranges vary between super-sectors. Several sectors, such as hospitality, social care and retail, have relatively short wage bands for non-graduates. This suggests that even with greater qualifications, skills or experience, pay does not significantly increase.
Construction, the two manufacturing super-sectors, distribution and wholesale have much wider wage bands for non-graduates. This is perhaps unsurprising given that there are significant numbers of skilled trade positions within these sectors (see Figure 3).
Middle-level qualified social care workers are worse paid than low qualified workers in transport manufacturing.
Only five of the ten super-sectors pay their lowest paid workers the non-London Living Wage of £7.30 per hour.
Good jobs for non-graduates 11
Top pay
The top of the pay bands fall into two groups: Wholesale, distribution, construction and the two manufacturing related super-sectors offer the best wages for those with middle-level qualifications. Typical top wages for non-graduates in these sectors exceed the median starting graduate wage of £29,000 per annum paid by top graduate employers.14 The typical top wages for non-graduates in hospitality, social care, sports and personal services, and retail are less than this, and few non-graduates in these sectors achieve the national mean wage of £26,200.15
Pay variations across sectors
Low pay varies considerably between super-sectors, with the bottom pay level for those in transport manufacturing set at around £18,000 as compared with the £10,000 or less in hospitality. These differences cannot be explained by the difference in occupational profiles, as transport manufacturing also has elementary roles. It seems fair to conclude that someone with no or low-level qualifications is much better off working in transport manufacturing or construction than in hospitality or social care.
Pay for those with middle-level qualifications also varies widely across sectors. The top of the pay ranges vary from under £25,000 in hospitality to over £40,000 in construction. Middle-level qualified workers in social care are worse paid than low qualified workers in transport manufacturing.
Figure 4: Annual incomes for non-graduates in super-sectors
Source: Annual Survey Hours and Earnings, 2010, Labour Force Survey 2010.
Good jobs for non-graduates 12
2.4 Summary
The majority of the non-graduate workforce is employed in ten super sectors of which retail and construction are the biggest employers
There are sharp variations across the sectors we examined in the proportion of employees with middle-level qualifications – from as high as 26 per cent in social care to as low as 15 per cent in business services.
Wages for those with the same level of qualification vary hugely by sector. The least well paid in transport manufacturing make around £18,000 as opposed to under £10,000 in hospitality. The top of the pay bands we examined, typically earned by middle-level qualified employees, range from under £25,000 in hospitality to over £40,000 in construction.
The variations in sector pay levels do not correspond to the variations in qualification profiles. Social care has the highest proportion of middle-level qualified employees but one of the lowest and narrowest pay ranges. Distribution and wholesale have a very low proportion of middle-level qualified employees but relatively high and broad pay ranges. Middle-level qualified workers in social care tend to be worse paid than low qualified workers in transport manufacturing.
Good jobs for non-graduates 13
3. Where are the good sectors for non-graduates?
Around half of the super-sectors are forecast to grow. Unfortunately, these are the ones that pay the lowest wages. Sectors that offer a high proportion of good jobs are forecast to decline, affecting areas of the UK with higher unemployment the most. The best paid sectors are male-dominated, suggesting women are less likely to get a good job without a degree.
In this section we analyse our super sectors in more detail to consider their
growth prospects
vulnerability to international competition
regional density
gender balance.
Taken together with the findings of the previous section, this will reveal the extent to which super-sectors are able to provide good jobs for non-graduates and why.
3.1 Growth prospects for super-sectors
Around half of the sectors analysed here are forecast to grow.16 Unfortunately, as Table 1 makes clear, these tend to be the ones that pay the lowest wages.
Manufacturing employment is forecast to decline – partly because of efficiency gains through automation. Thus, while output is expected to grow, less manpower will be required. A report commissioned by the UK Council for Employment and Skills (UKCES) predicts “continuing sharp declines in employment” for skilled and semi-skilled manufacturing workers. This is likely to take the middle out of the occupational and skills profiles of even relatively good sectors such as transport manufacturing.
The scope for increasing productivity through automation is less in services than in manufacturing. So it is not surprising that the same report forecasts employment growth in social care, hospitality, retail and sport and personal services.17 The forecasted growth in social care is partly accounted for by our ageing population.18
3.2 International competition
One common explanation for low wages and declining industries is the rise of out-sourcing jobs abroad.19 We captured the importance of this factor by looking at the susceptibility of each super-sector to international competition (see Appendix B for methodology).
The sectors highlighted here are a mix of those that do and those that do not compete internationally. It is immediately obvious that non-traded sectors, such as social care and retail, are also those where wages are lowest. That is, the worst paid jobs are not in sectors predominantly competing internationally or even in sectors forming a significant part of international supply chains.
The worst paid jobs are in sectors that do not compete internationally.
Good jobs for non-graduates 13
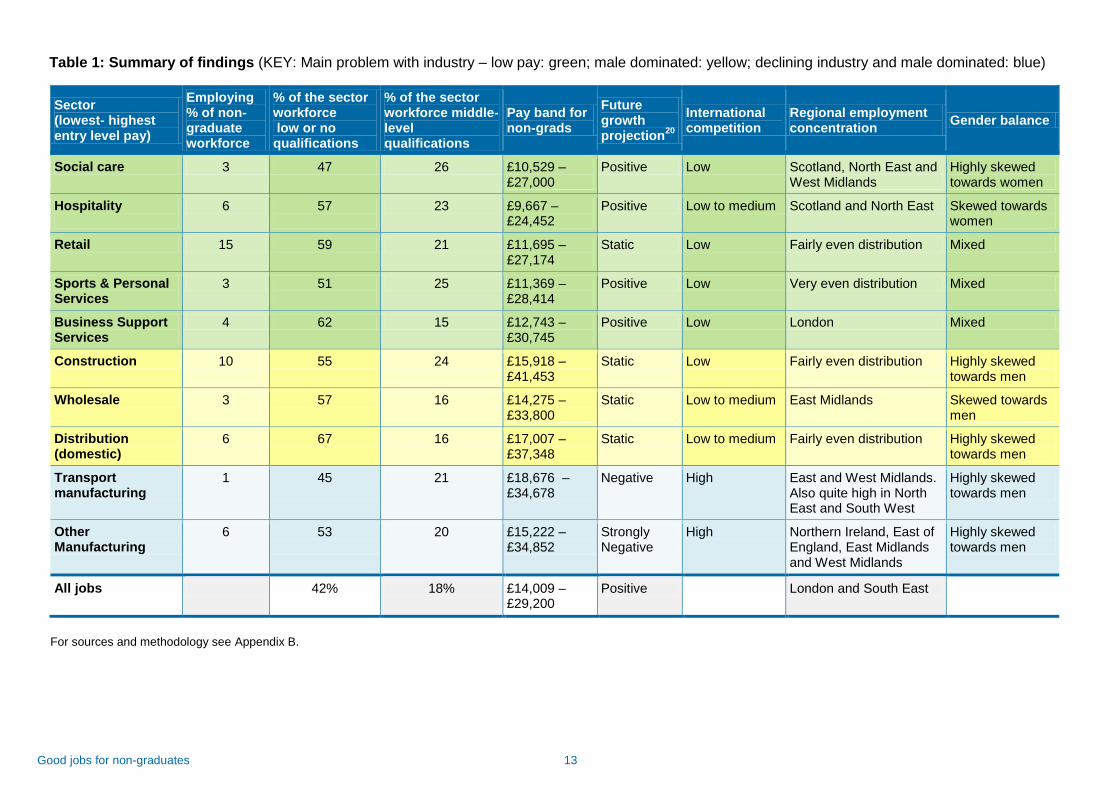
Table 1: Summary of findings (KEY: Main problem with industry – low pay: green; male dominated: yellow; declining industry and male dominated: blue)
For sources and methodology see Appendix B.
Sector (lowest- highest entry level pay)
Employing % of non-graduate workforce
% of the sector workforce low or no qualifications
% of the sector workforce middle-level qualifications
Pay band for non-grads
Future growth projection
20
International competition
Regional employment concentration
Gender balance
Social care 3 47 26 £10,529 –£27,000
Positive Low Scotland, North East and West Midlands
Highly skewed towards women
Hospitality
6 57
23 £9,667 –£24,452
Positive Low to medium Scotland and North East Skewed towards women
Retail 15 59 21 £11,695 –£27,174
Static Low Fairly even distribution Mixed
Sports & Personal Services
3 51
25 £11,369 –£28,414
Positive Low Very even distribution Mixed
Business Support Services
4 62 15 £12,743 –£30,745
Positive Low London Mixed
Construction 10 55 24 £15,918 –£41,453
Static Low Fairly even distribution Highly skewed towards men
Wholesale 3 57 16 £14,275 –£33,800
Static Low to medium East Midlands Skewed towards men
Distribution (domestic)
6 67 16 £17,007 – £37,348
Static Low to medium Fairly even distribution Highly skewed towards men
Transport manufacturing
1
45
21 £18,676 –£34,678
Negative High East and West Midlands. Also quite high in North East and South West
Highly skewed towards men
Other Manufacturing
6 53
20 £15,222 – £34,852
Strongly Negative
High Northern Ireland, East of England, East Midlands and West Midlands
Highly skewed towards men
All jobs 42% 18% £14,009 –£29,200
Positive London and South East
Good jobs for non-graduates 14
3.3 Regional density
Most non-graduate sectors are not concentrated in London, apart from business support services. Retail, construction, distribution and sports and personal services are evenly distributed across the UK. This is related to the disproportionate number graduate jobs in London and the South East.21
The two manufacturing related super-sectors are concentrated in regions associated with low employment levels. For example, the Nissan car plant is located in the North East – the region with the lowest levels of employment among all regions. The East and West Midlands are also centres of manufacturing and also have employment levels significantly lower than the UK average of 70.3 per cent.22 The East Midlands also has a high concentration of wholesaling. These are also the regions with relatively low levels of graduates,23 which is why these sectors are so vital to the regional economies.
3.4 Gender-balance
Broadly, the best paid sectors are dominated by male workers, whereas the lowest paid tend to be highly reliant on a female workforce. Evidence already suggests that women have been hardest hit by the recession,24 and will be worst affected by public sector job cuts.25 Evidence here extends this analysis to highlight the paucity of good jobs for female non-graduates compared to their male counterparts. (Although it is also worth noting that the sharpest declines are forecast in sectors that are most male-dominated).
3.5 Summary
Growth projections for the super-sectors show that well-paid sectors are forecast to decline and the lowest paid sectors are forecast to grow.
The worst paid jobs are not in sectors that are competing internationally.
Manufacturing and wholesale provide jobs in areas of higher unemployment.
Many more men than women are employed in the sectors that provide the best wages.
The two manufacturing super-sectors are concentrated in regions with low employment levels.
Good jobs for non-graduates 15
4. Conclusions and Recommendations
“We have to help business create tomorrow’s jobs.” 26
George Osborne, 2011
Everyone agrees we need a jobs strategy to tackle unemployment and drive economic recovery. Most also agree that this strategy should tackle the polarised labour market that developed in the last decade of growth.27
This paper has shown that non-graduates, who are the majority of the workforce and an even larger majority of those out of work, must be at the heart of any jobs strategy. It has also highlighted that there is unlikely to be a one size fits all approach to job creation. Sectors matter – each has different strengths and faces different challenges over the coming years.
The task for policymakers is to maximise the number of good jobs available in the labour market for those who do not attend university to prevent further increases in low-paid, dead-end jobs.
Much more research needs to be undertaken to devise sector-specific strategies for job creation, but our analysis of the data leads to the following conclusions:
As things stand, the number of good jobs for non-graduates is set to fall
The ‘hour glass economy’ is getting get worse. Sectors offering well-paid jobs with chances for progression like manufacturing, are forecast to decline and those with high numbers of low-skilled, poorly remunerated occupations like retail are projected to grow.
The urgency of the situation we face could not be clearer. If policy-makers do not act soon to renovate the bad jobs and promote the good jobs in our economy, we will face a labour market that is even more hollowed out with an ever tighter squeeze on middle level jobs.
Up-skilling non-graduates is not enough on its own
Our research shows the sector you work in has a huge influence in determining your pay and progression. It is not, as some would predict, just about your level of training. Those with middle-level qualifications in manufacturing earn much more than those with a similar level of qualification in social care. And the least qualified non-graduates in transport manufacturing often earn more than the most qualified workers in hospitality.
This calls into question any exclusive emphasis on ‘up-skilling’ non-graduates as a route to increasing the number of good jobs. Of course a well-qualified workforce is important, but a blanket target for skill levels or apprenticeships28 that does not take into account the occupational profiles of different sectors of the economy will not deliver more middle-level jobs or higher pay in all industries, and may set
If policy-makers do not act soon we face an even more hollowed out jobs market with an ever-tighter squeezed middle.

Good jobs for non-graduates 16
trainees on a journey that will end in disappointment. Supply-side fixes will not suffice unless there are significant changes in demands for skills.
Low pay is more prevalent in non-traded sectors
The sectors with the strongest growth projections are also those with the lowest pay. In areas like social care low pay does not even correlate with low qualifications. Given retail, social care and hospitality jobs account for almost a quarter of the non-graduate labour market, concerted action to ensure they deliver more good jobs is a clear area of priority. The good news is that the lowest paid sectors, are not for the most part competing internationally or part of international supply chains. In other words, whilst British factory workers may be competing with their Chinese counterparts, British gym instructors are not. The fact poorly remunerated sectors are non-tradable offers some protection and means we can and should take action to tackle low pay. Based on existing patterns, manufacturing super sectors are best placed to tackle regional imbalances in unemployment
Both of our manufacturing super-sectors provide classic good jobs for non-graduate employees – roles that are well paid and offer the chance for significant progression in both skills and earnings. Manufacturing jobs in the UK are also well distributed across the country, employing people in areas where jobs are most needed.
These factors make the decline in manufacturing undesirable because of the rebalancing role it plays. This does not apply to gender balance however, where both sectors remain biased towards men.
Recommendations
This report has made the case for a sector-specific approach to jobs strategy. For strategies to prove effective they will need to be developed in collaboration with businesses, employees, trade unions and educational institutions. Based on current analysis we have outlined starting points for some key sectors.
Social Care
Profile: Growing sector with a good proportion of well qualified employees but low pay. Female dominated workforce.
Policy priority: Gradually improve wages and conditions in ways that incentivise higher quality of care.
As the government is a key employer and purchaser in this sector it can directly influence wages. Furthermore, because demand is relatively inelastic the decision to raise wages is primarily political. A Social Care White paper responding to the Dilnot Commission29 on care funding is expected this summer. We believe there is a strong case to use this opportunity to examine the social care sector and wages within it. The aim must be to make the most of its relatively well qualified workforce to deliver more good jobs.
Good jobs for non-graduates 17
Retail
Profile: Large employer of non-graduate labour which performs badly on pay and progression.
Policy priority: Increase pressure and incentives for higher wages for those without degrees.
Fifteen per cent of non-graduates in employment work in retail. Many retail jobs are good jobs, but high proportions remain lowly paid, with few prospects for progression. The Deputy Prime Minister recently called for “more of a John Lewis economy”30 to tackle pay inequality through employee ownership. There are also a number of other successful retailers that deliver good retail jobs from Lush, the first major retailer to pay staff the London living wage31, to B&Q, who put particular effort into improving the skills and training available to staff.32
Incentivising and creating pressures for retailers to provide good jobs could be done through a variety of mechanisms from up-rating the minimum wage, to changes to the tax system or measures to encourage more collective bargaining. Further research is needed on the impacts on employment and the cost of living, and on how fiscal incentives can be used to mitigate them.33 A similar approach can be used for the hospitality sector.
Construction
Profile: Good pay and progression, a balanced regional distribution but skewed towards male workers and forecast to have static growth up to 2020.
Policy priority: Stimulate demand in the sector by greening homes and public properties, and building much-needed social housing.
Construction is the second biggest employer of non-graduates after retail, providing well-paid jobs across the country with good progression. It is not currently forecast to grow, but we believe a there is a rationale for stimulating the sector to boost the number of good jobs in the economy.
There are four million people on the social housing waiting list and over 200,000 new households formed every year. We also need to lower emissions from the existing stock of public and private buildings.34 A mixture of changes to the planning and capital gains tax regimes and creative use of public investment could release this pent up demand35 and tackle the housing crisis without major increases in public subsidy.36 However, this would not be a silver bullet – most of the demand for new buildings would be in parts of the country where unemployment is relatively low, and the sector predominately provides jobs that are taken up by men.
Manufacturing
Profile: Decent pay and progression, spatial concentration in regions of most need but bad gender balance and forecast to decline.
Policy priority: Develop regional industrial strategies that identify and strengthen existing and potential regional or sub-regional competitive advantages.

Good jobs for non-graduates 18
Manufacturing sectors provide good jobs and employment in areas of the UK that need it most. Despite the pressures the industry is under, it is worth investigating the potential for building on existing British success stories, such as those in transport manufacturing37and for creating new ones. This means identifying those of a region’s actual and potential competitive advantages that are sustainable in the face of global developments. If there is a case for promoting manufacturing then regional stakeholders will need to create the connections and skill bases needed to realise this potential.
Manufacturing may not always be the answer, but it is a useful starting place for developing a jobs strategy that tackles the north south divide and provides good jobs for non-graduates.
The situation is pressing but not entirely bleak. The UK has a number of sectors that provide great employment for those without degrees, and many strong industries forecast to flourish and grow. The challenge for us now is to ensure that those without degrees have access to quality jobs that reward their skills and talents.
Good jobs for non-graduates 19
Appendix A
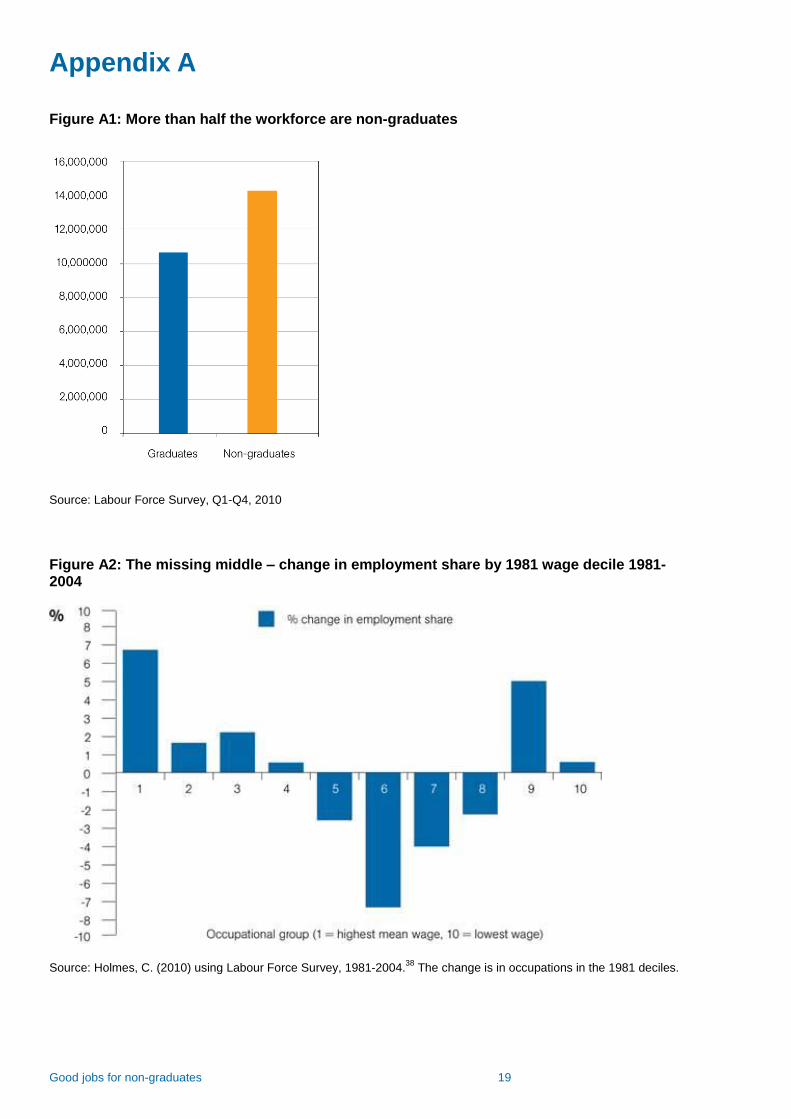
Figure A1: More than half the workforce are non-graduates
Source: Labour Force Survey, Q1-Q4, 2010
Figure A2: The missing middle – change in employment share by 1981 wage decile 1981-2004
Source: Holmes, C. (2010) using Labour Force Survey, 1981-2004.38
The change is in occupations in the 1981 deciles.
Good jobs for non-graduates 20
Appendix B
Methodology
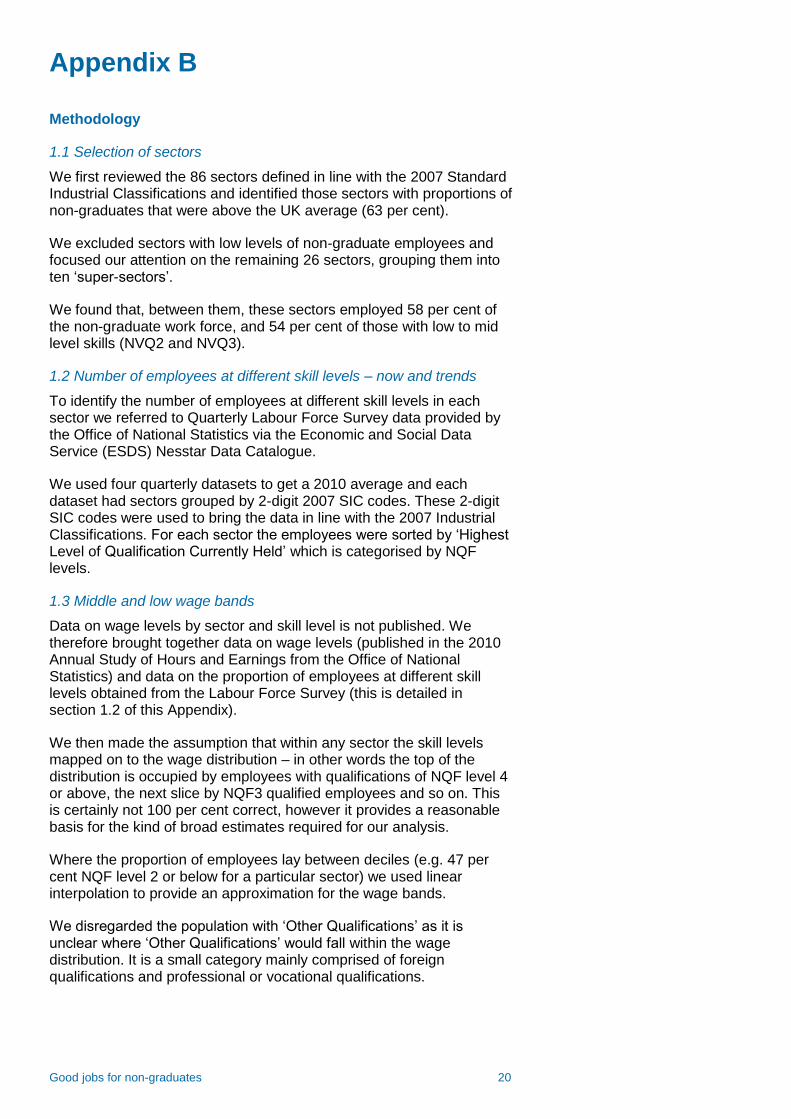
1.1 Selection of sectors
We first reviewed the 86 sectors defined in line with the 2007 Standard Industrial Classifications and identified those sectors with proportions of non-graduates that were above the UK average (63 per cent).
We excluded sectors with low levels of non-graduate employees and focused our attention on the remaining 26 sectors, grouping them into ten ‘super-sectors’.
We found that, between them, these sectors employed 58 per cent of the non-graduate work force, and 54 per cent of those with low to mid level skills (NVQ2 and NVQ3).
1.2 Number of employees at different skill levels – now and trends
To identify the number of employees at different skill levels in each sector we referred to Quarterly Labour Force Survey data provided by the Office of National Statistics via the Economic and Social Data Service (ESDS) Nesstar Data Catalogue.
We used four quarterly datasets to get a 2010 average and each dataset had sectors grouped by 2-digit 2007 SIC codes. These 2-digit SIC codes were used to bring the data in line with the 2007 Industrial Classifications. For each sector the employees were sorted by ‘Highest Level of Qualification Currently Held’ which is categorised by NQF levels.
1.3 Middle and low wage bands
Data on wage levels by sector and skill level is not published. We therefore brought together data on wage levels (published in the 2010 Annual Study of Hours and Earnings from the Office of National Statistics) and data on the proportion of employees at different skill levels obtained from the Labour Force Survey (this is detailed in section 1.2 of this Appendix).
We then made the assumption that within any sector the skill levels mapped on to the wage distribution – in other words the top of the distribution is occupied by employees with qualifications of NQF level 4 or above, the next slice by NQF3 qualified employees and so on. This is certainly not 100 per cent correct, however it provides a reasonable basis for the kind of broad estimates required for our analysis.
Where the proportion of employees lay between deciles (e.g. 47 per cent NQF level 2 or below for a particular sector) we used linear interpolation to provide an approximation for the wage bands.
We disregarded the population with ‘Other Qualifications’ as it is unclear where ‘Other Qualifications’ would fall within the wage distribution. It is a small category mainly comprised of foreign qualifications and professional or vocational qualifications.
Good jobs for non-graduates 21
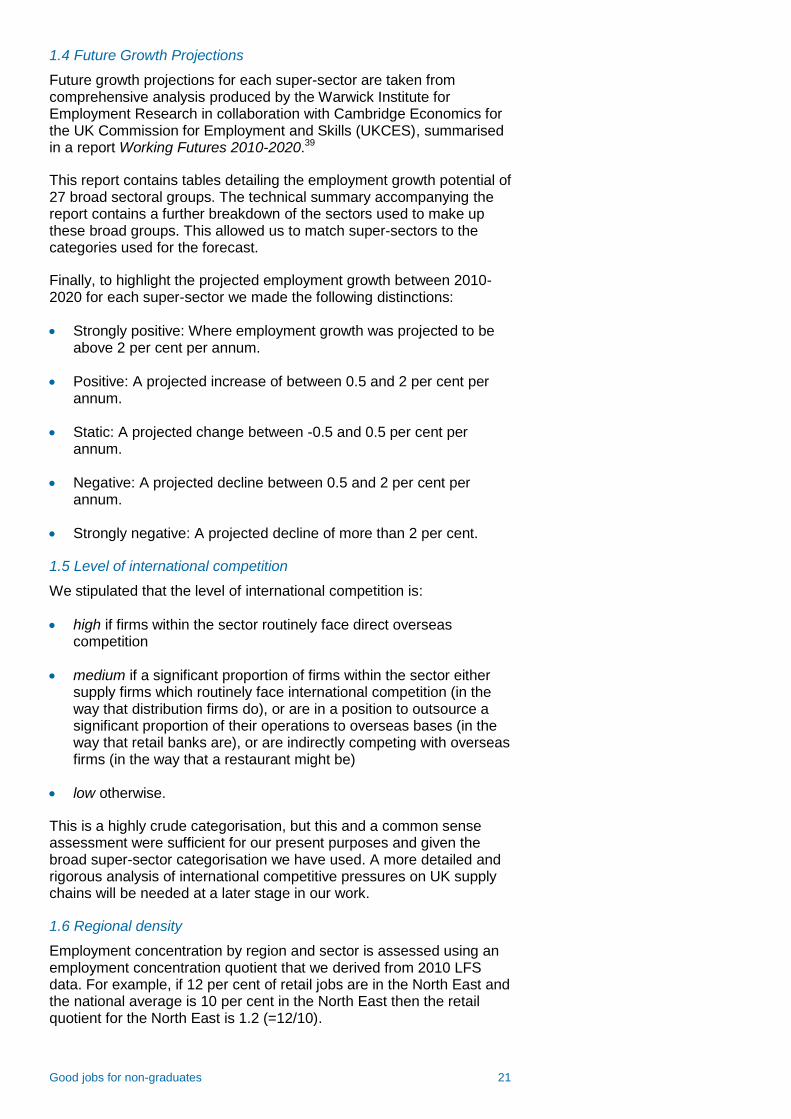
1.4 Future Growth Projections
Future growth projections for each super-sector are taken from comprehensive analysis produced by the Warwick Institute for Employment Research in collaboration with Cambridge Economics for the UK Commission for Employment and Skills (UKCES), summarised in a report Working Futures 2010-2020.39
This report contains tables detailing the employment growth potential of 27 broad sectoral groups. The technical summary accompanying the report contains a further breakdown of the sectors used to make up these broad groups. This allowed us to match super-sectors to the categories used for the forecast.
Finally, to highlight the projected employment growth between 2010-2020 for each super-sector we made the following distinctions:
Strongly positive: Where employment growth was projected to be above 2 per cent per annum.
Positive: A projected increase of between 0.5 and 2 per cent per annum.
Static: A projected change between -0.5 and 0.5 per cent per annum.
Negative: A projected decline between 0.5 and 2 per cent per annum.
Strongly negative: A projected decline of more than 2 per cent.
1.5 Level of international competition
We stipulated that the level of international competition is:
high if firms within the sector routinely face direct overseas competition
medium if a significant proportion of firms within the sector either supply firms which routinely face international competition (in the way that distribution firms do), or are in a position to outsource a significant proportion of their operations to overseas bases (in the way that retail banks are), or are indirectly competing with overseas firms (in the way that a restaurant might be)
low otherwise.
This is a highly crude categorisation, but this and a common sense assessment were sufficient for our present purposes and given the broad super-sector categorisation we have used. A more detailed and rigorous analysis of international competitive pressures on UK supply chains will be needed at a later stage in our work.
1.6 Regional density
Employment concentration by region and sector is assessed using an employment concentration quotient that we derived from 2010 LFS data. For example, if 12 per cent of retail jobs are in the North East and the national average is 10 per cent in the North East then the retail quotient for the North East is 1.2 (=12/10).

Good jobs for non-graduates 22
1.7 Gender balance
To gain approximations of the gender balance within super-sectors we again referred to the Labour Force Survey data provided by the Office of National Statistics via the Economic and Social Data Service (ESDS) Nesstar Data Catalogue. Re-computing gender statistics by super-sector required aligning sector codes, and then performing a simple computation of number of men/women over the total workforce in the sector.
Gender biases were classified according to the following scale:
Highly skewed: more than 80 per cent of the workforce male or female.
Skewed: Between 60-80 per cent of the workforce male or female.
Mixed: Between 40-60 per cent of the workforce male or female.
We used Sector Skills Council Assessments to cross-check our findings.
Good jobs for non-graduates 23
Appendix C
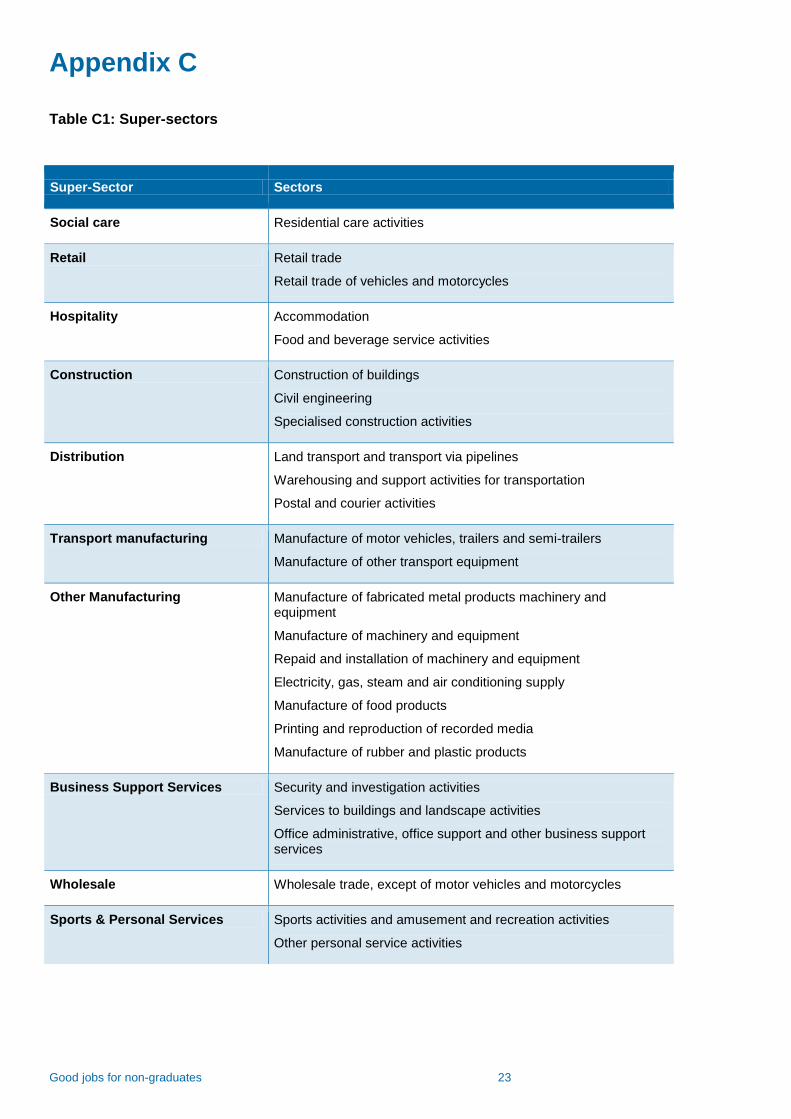
Table C1: Super-sectors
Super-Sector Sectors
Social care Residential care activities
Retail Retail trade
Retail trade of vehicles and motorcycles
Hospitality Accommodation
Food and beverage service activities
Construction Construction of buildings
Civil engineering
Specialised construction activities
Distribution Land transport and transport via pipelines
Warehousing and support activities for transportation
Postal and courier activities
Transport manufacturing Manufacture of motor vehicles, trailers and semi-trailers
Manufacture of other transport equipment
Other Manufacturing Manufacture of fabricated metal products machinery and equipment
Manufacture of machinery and equipment
Repaid and installation of machinery and equipment
Electricity, gas, steam and air conditioning supply
Manufacture of food products
Printing and reproduction of recorded media
Manufacture of rubber and plastic products
Business Support Services Security and investigation activities
Services to buildings and landscape activities
Office administrative, office support and other business support services
Wholesale Wholesale trade, except of motor vehicles and motorcycles
Sports & Personal Services Sports activities and amusement and recreation activities
Other personal service activities
Good jobs for non-graduates 24
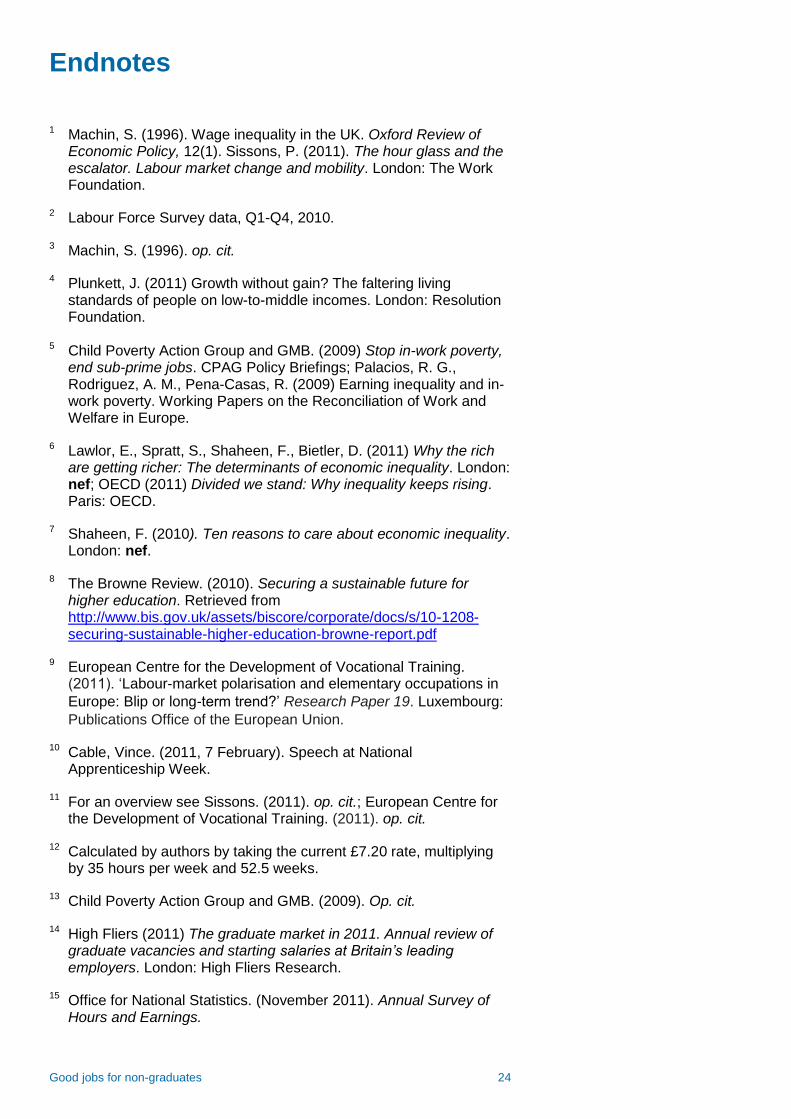
Endnotes
1 Machin, S. (1996). Wage inequality in the UK. Oxford Review of
Economic Policy, 12(1). Sissons, P. (2011). The hour glass and the escalator. Labour market change and mobility. London: The Work Foundation.
2 Labour Force Survey data, Q1-Q4, 2010.
3 Machin, S. (1996). op. cit.
4 Plunkett, J. (2011) Growth without gain? The faltering living standards of people on low-to-middle incomes. London: Resolution Foundation.
5 Child Poverty Action Group and GMB. (2009) Stop in-work poverty,
end sub-prime jobs. CPAG Policy Briefings; Palacios, R. G., Rodriguez, A. M., Pena-Casas, R. (2009) Earning inequality and in-work poverty. Working Papers on the Reconciliation of Work and Welfare in Europe.
6 Lawlor, E., Spratt, S., Shaheen, F., Bietler, D. (2011) Why the rich are getting richer: The determinants of economic inequality. London: nef; OECD (2011) Divided we stand: Why inequality keeps rising. Paris: OECD.
7 Shaheen, F. (2010). Ten reasons to care about economic inequality. London: nef.
8 The Browne Review. (2010). Securing a sustainable future for higher education. Retrieved from http://www.bis.gov.uk/assets/biscore/corporate/docs/s/10-1208-securing-sustainable-higher-education-browne-report.pdf
9 European Centre for the Development of Vocational Training. (2011). ‘Labour-market polarisation and elementary occupations in
Europe: Blip or long-term trend?’ Research Paper 19. Luxembourg:Publications Office of the European Union.
10 Cable, Vince. (2011, 7 February). Speech at National Apprenticeship Week.
11 For an overview see Sissons. (2011). op. cit.; European Centre for the Development of Vocational Training. (2011). op. cit.
12 Calculated by authors by taking the current £7.20 rate, multiplying by 35 hours per week and 52.5 weeks.
13 Child Poverty Action Group and GMB. (2009). Op. cit.
14 High Fliers (2011) The graduate market in 2011. Annual review of graduate vacancies and starting salaries at Britain’s leading employers. London: High Fliers Research.
15 Office for National Statistics. (November 2011). Annual Survey of Hours and Earnings.
Good jobs for non-graduates 25
16 Wilson, R. A. and Homenidou, K. (2011). Working Futures 2010-
2020: Main Report. London: UKCES.
17 Ibid.
18 See discussion in OECD. (2007). Globalisation, wages and Jobs. Policy Brief, June 2007. Retrieved from: http://www.oecd.org/dataoecd/27/1/38796126.pdf
19 These drivers of change in the labour market are considered in more detail in a recent nef publication, Why the rich are getting richer: The determinants of economic inequality. op. cit.
20 Wilson, R. A. and Homenidou, K. (2011). Op. cit.
21 Centre for Cities. (2010). Cities Outlook 2010. London: Centre for Cities.
22 Office for National Statistics. (2012). Labour Market Release 15 February 2012, Table 18: Unemployment by region. Retrieved from: http://www.ons.gov.uk/ons/dcp171778_254579.pdfl
23 Oguz, S. and Knight, J. (2011). ‘Regional economic indicators with a focus on the relationship between skills and productivity.’ Economic & Labour Market Review, ONS February 2011.
24 IPPR press release, 17 August 2011, Women hit hardest in unemployment stats.
25 UNISON. (2010). ‘Women and public spending cuts.’ Factsheet 21. Retrieved from: http://www.unison.org.uk/acrobat/19576.pdf
26 Osborne, G. (2011, 3 Oct). Conservative Party conference speech. 27 See the International Monetary Fund and International Labour
Organisation discussions: http://www.ilo.org/washington/areas/multilateral-initiatives/ilo-and-imf-collaboration/lang--en/index.htm
28 Department for Business. (2011). Building Engagement, Building Futures: Our Strategy to Maximise the Participation of 16-24 Year Olds in Education, Training and Work. Retrieved from: http://www.bis.gov.uk/assets/biscore/further-education-skills/docs/b/11-1452-building-engagement-building-futures-maximise-participation-16-24
29 Commission on Funding of Care and Support. (2011). Fairer care funding. Retrieved from http://www.dilnotcommission.dh.gov.uk/our-report/
30 Nick Clegg, 16 January 2012, Speech at Mansion House: http://www.dpm.cabinetoffice.gov.uk/news/deputy-prime-minister-s-speech-mansion-house
31 The Evening Standard, 20 April 2011, Lush founder becomes first
store boss to pledge living wage of £7.85. Retrieved from: http://www.thisislondon.co.uk/standard/article-23943080-lush-founder-becomes-first-store-boss-to-pledge-living-wage-of-pound-785.do
Good jobs for non-graduates 26
32 Qualifications and Curriculum Development Agency. (2010). The
Qualifications and Credit System in Action: Employer and learning provider case studies. Retrieved from: http://www.cyq.org.uk/files/qcf/qcf-in-action-case-studies.pdf
33 nef is currently planning research in this area.
34 The Green New Deal Group. (2010). The cuts won’t work. London: nef.
35 Helm, D., Wardlaw J and Caldecott B (2009) Delivering a 21st Century Infrastructure for Britain (London: Policy Exchange)
Holmes I and Mabey N (2010) Accelerating the Transition to a Low
Carbon Economy: The case for a Green Infrastructure Bank (E3G)
36 Seaford C. (2010) One Million Homes. London: nef
37 The Guardian. (2012, 16 January). Model industry: carmakers suggest UK route to economic recovery. Retrieved from: http://www.guardian.co.uk/business/2012/jan/16/car-industry-uk-economic-recovery
38 Holmes, C. (2010). Can the UK avoid a two-track economy. Presentation made to the Scope Public Policy Forum November 2010.
39 Wilson, R. A. and Homenidou, K. (2011). Op. cit.
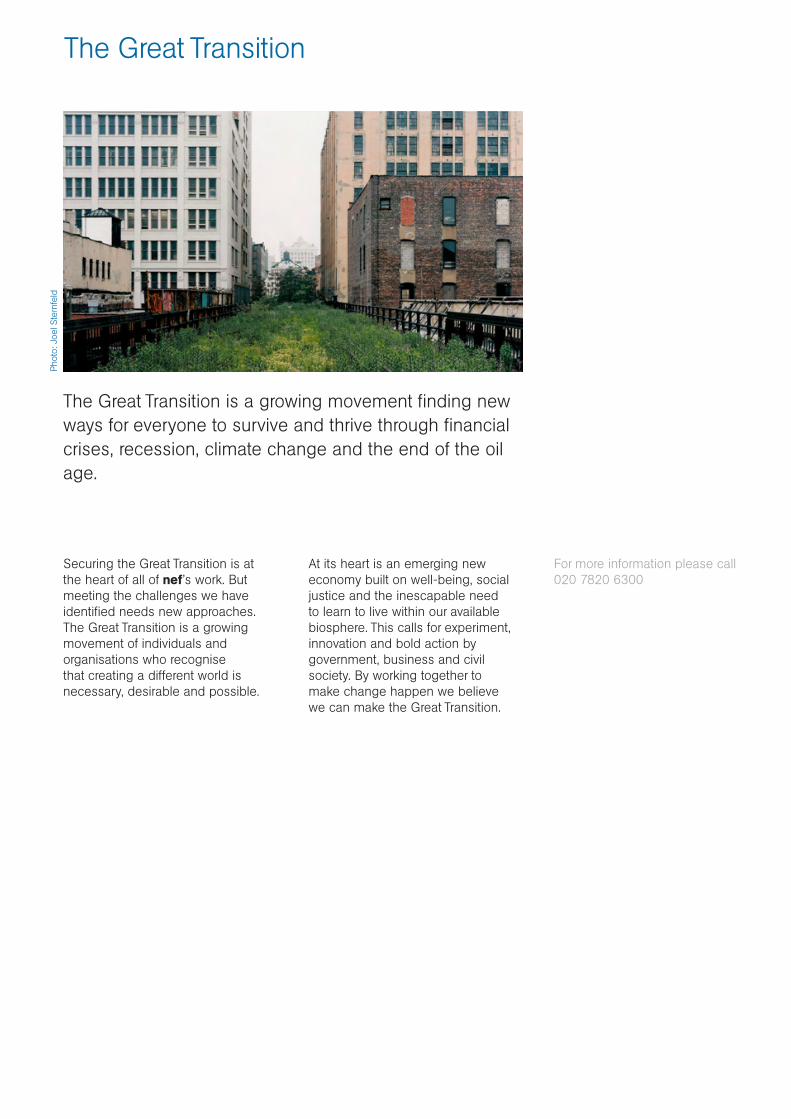
The Great Transition is a growing movement finding new ways for everyone to survive and thrive through financial crises, recession, climate change and the end of the oil age.
The Great Transition
Securing the Great Transition is at the heart of all of nef’s work. But meeting the challenges we have identified needs new approaches. The Great Transition is a growing movement of individuals and organisations who recognise that creating a different world is necessary, desirable and possible.
At its heart is an emerging new economy built on well-being, social justice and the inescapable need to learn to live within our available biosphere. This calls for experiment, innovation and bold action by government, business and civil society. By working together to make change happen we believe we can make the Great Transition.
For more information please call 020 7820 6300
Phot
o: J
oel S
tern
feld

Written and researched by: Faiza Shaheen, Charles Seaford and Jack Chapman Image by Wayne National Forest, via Flickr new economics foundation
3 Jonathan Street
London SE11 5NH
United Kingdom
Telephone: +44 (0)20 7822 6300
Facsimile: +44 (0)2078206301
E-mail: [email protected]
www.neweconomics.org
This work is licensed under the Creative Commons Attribution-NonCommercial-NoDerivs 3.0 Unported License. To view a copy of this license, visit http://creativecommons.org/licenses/by-nc-nd/3.0/ and www.neweconomics.org /xxxxx.
Registered charity number 1055254
© February 2012 nef (the new economics foundation)
ISBN: 978 1 908506 13 9
This work is licensed under the Creative Commons Attribution-NonCommercial-NoDerivs 3.0 Unported License. To view a copy of this license, visit http://creativecommons.org/licenses/by-nc-nd/3.0/ and www.neweconomics.org