Embed Size (px)
Citation preview

Government of the District of Columbia
Natwar M. Gandhi Chief Financial Officer
Tax Rates and Tax Burdens In The District of Columbia -
A Nationwide Comparison
2004
Issued August 2005

i
Tax Rates And Tax Burdens In The District of Columbia:
A Nationwide Comparison
Table Of Contents Listing of Major Tables ....................................................................................................... iii Executive Summary ...............................................................................................................v Acknowledgment ................................................................................................................. vii Part I: Tax Burdens In Washington, D.C., Compared With
Those In The Largest City In Each State, 2004
Overview................................................................................... 1
Chapter I How Tax Burdens are Computed for the Largest City in Each State................................................... 2
Individual Income Tax.................................................... 3
Real Property Tax ........................................................... 4
Sales and Use Tax........................................................... 6
Automobile Taxes ........................................................... 6
Chapter II Overall Tax Burdens for the
Largest City in Each State......................................................... 7
Progressivity ................................................................... 7
Chapter III Comparing Specific Tax Burdens for a Hypothetical Family of Four in the Largest City in Each State........................................................ 15
Individual Income Tax................................................... 15
Real Property Tax .......................................................... 17
Sales and Use Tax.......................................................... 22
Automobile Taxes .......................................................... 24
ii
Tax Rates And Tax Burdens In The District of Columbia: A Nationwide Comparison
Table Of Contents
Chapter IV How Do Tax Burdens in Washington, D.C., Compare With Those in the Largest City in Each State?...................................................... 27
Individual Income Tax................................................... 27
Real Property Tax .......................................................... 28
Sales Tax........................................................................ 29
Automobile Taxes .......................................................... 29
Summary ........................................................................ 29
Chapter V Why Do Tax Burdens Differ from
One City to Another? ............................................................... 31 Part II: A Comparison of Selected Tax Rates In The District of Columbia
With Those In The 50 States As of January 1, 2005
Overview............................................................................................................... 35
Office Locations And Telephone Numbers .......................................................... 55

iii
Listing of Major Tables
Part I: Tax Burdens In Washington, D.C., Compared With Those In The Largest City In Each State, 2004
Table 1 Estimated Burden of Major Taxes for a Hypothetical Family of Four, 2004 ............................................................................................. 8
Table 2 Index of Progressivity for the Tax System of the Largest City in Each State............................................................................... 14
Table 3 Income Tax Burden as Percent of Income in the Largest Cities by Type of Income Tax for a Family of Four, 2004 ............................................. 18
Table 4 Residential Property Tax Rates in the Largest City in Each State, 2004 ....................................................................................... 19
Table 5 Factors Used in Housing Value Assumptions, 2004 ............................................ 20
Table 6 Cities Which Allow Exemptions or Reduced Rates in the Calculation of Real Estate Taxes for Homeowners, 2004 .................................... 21
Table 7 State and Local General Sales Tax Rates in Each of the 51 Cities as of December 31, 2004............................................................. 23
Table 8 Gasoline Tax Rates in the 51 Cities as of December 31, 2004............................. 25
Table 9 Summary of Types of Automobile Registration Taxes, 2004 .............................. 26
Table 10 Automobile Tax Assumptions, 2004 .................................................................... 26
Table 11 Tax Burdens in Washington, D.C. Compared with the Average for the Largest City in Each State by Income Class, 2004 ................................... 30
Table 12 The Largest City in Each State ............................................................................ 33
iv
Listing of Major Tables
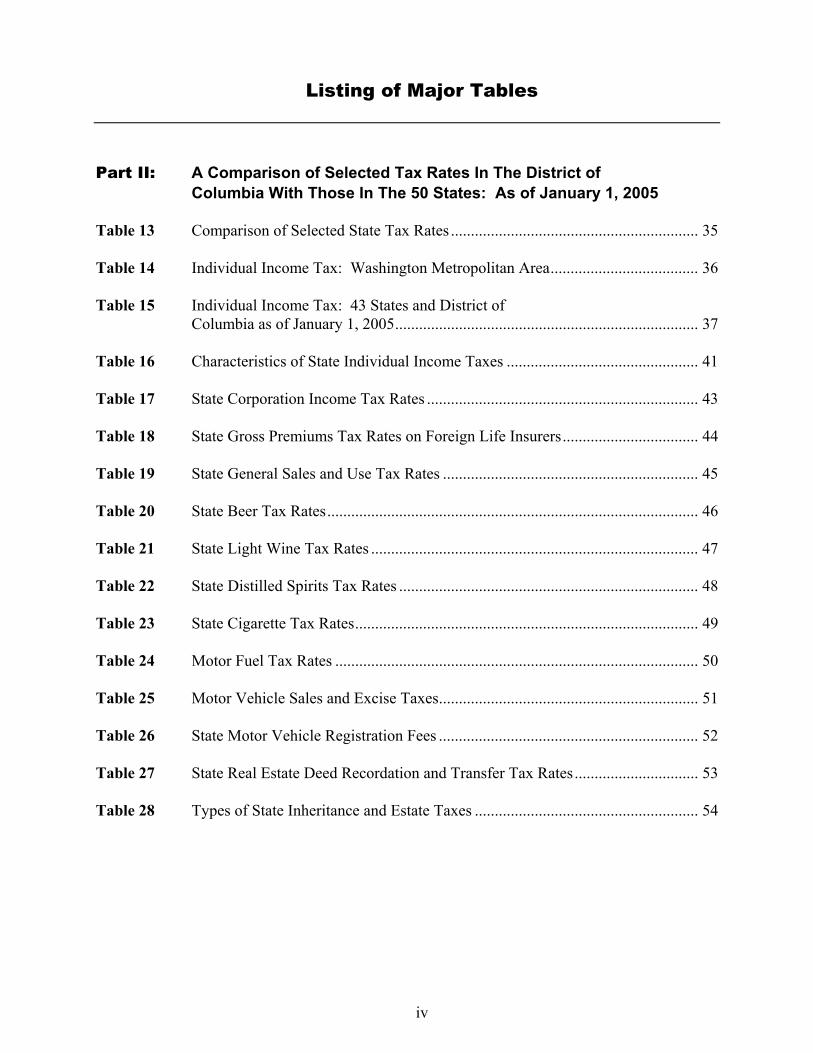
Part II: A Comparison of Selected Tax Rates In The District of Columbia With Those In The 50 States: As of January 1, 2005 Table 13 Comparison of Selected State Tax Rates .............................................................. 35 Table 14 Individual Income Tax: Washington Metropolitan Area..................................... 36 Table 15 Individual Income Tax: 43 States and District of Columbia as of January 1, 2005............................................................................ 37 Table 16 Characteristics of State Individual Income Taxes ................................................ 41 Table 17 State Corporation Income Tax Rates .................................................................... 43 Table 18 State Gross Premiums Tax Rates on Foreign Life Insurers.................................. 44 Table 19 State General Sales and Use Tax Rates ................................................................ 45 Table 20 State Beer Tax Rates............................................................................................. 46 Table 21 State Light Wine Tax Rates .................................................................................. 47 Table 22 State Distilled Spirits Tax Rates ........................................................................... 48 Table 23 State Cigarette Tax Rates...................................................................................... 49 Table 24 Motor Fuel Tax Rates ........................................................................................... 50 Table 25 Motor Vehicle Sales and Excise Taxes................................................................. 51 Table 26 State Motor Vehicle Registration Fees ................................................................. 52 Table 27 State Real Estate Deed Recordation and Transfer Tax Rates............................... 53 Table 28 Types of State Inheritance and Estate Taxes ........................................................ 54

v
EXECUTIVE SUMMARY
State and local tax systems in the United States are widely diverse. The 50 states and the
District of Columbia employ a broad range of taxes and fees to fund state and local government operations. The combination of taxes and fees utilized by a particular jurisdiction is dependent upon many factors, including revenue needs, the tax base of the local government, the fiscal relationship between the state and local governments, and the level of local government services demanded by residents.
The District's tax structure includes taxes typically imposed by local governments, such as
real and personal property taxes, deed taxes, and others. At the same time, the District's tax structure also includes taxes usually associated with the state level of government, such as the individual and corporate income taxes, sales and use taxes, excise taxes and motor vehicle-related taxes. Sixty-two percent of the District's locally generated revenues come from taxes usually administered by a state.
Although the District has both these state and local fiscal features, the actual tax structure is
not complemented by the typical state or local economic base. There are many examples, such as:
• Manufacturing, an important industry in the economic and tax bases of many
major cities, is largely lacking in the District. • Unlike every state in the nation that has an income tax, Washington, D.C.,
does not have the authority to tax nonresident income earned within its borders. Nonresidents earn about 2/3 of all income in the District of Columbia.
• About 36 percent of all property value in the District is exempt from property taxation due to the federal and diplomatic presence (23 percent) as well as other tax-exempt properties (13 percent).
• An estimated 6 percent of sales are not subject to sales and use tax in the District due to military and diplomatic exemptions.
• The District has a relatively high percentage of low-income taxpayers, which further limits the District's revenue-raising capacity.
Despite these limitations in the tax base, the District of Columbia funds most of the
functions usually provided by state and local levels of government. The non-municipal functions include responsibility for welfare programs, physical and mental health care and maintenance of the public education system -- including a "state" university.
To provide an adequate level of funding for these state and local responsibilities given the
limited tax base, the District's tax rates often are higher than those in the states. Data from the U.S. Bureau of the Census indicate that in 2000, the District's overall per capita tax collections were higher than those of 50 states. For some tax types, however, the District's taxes are lower than most states.
vi
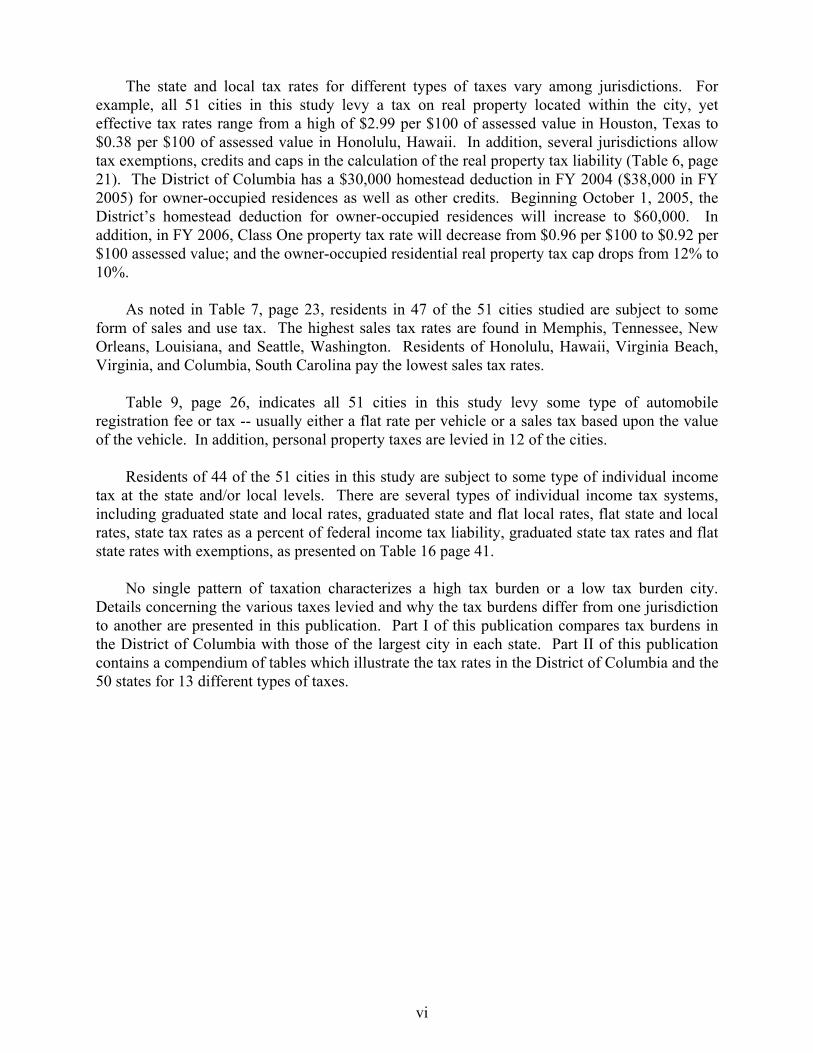
The state and local tax rates for different types of taxes vary among jurisdictions. For example, all 51 cities in this study levy a tax on real property located within the city, yet effective tax rates range from a high of $2.99 per $100 of assessed value in Houston, Texas to $0.38 per $100 of assessed value in Honolulu, Hawaii. In addition, several jurisdictions allow tax exemptions, credits and caps in the calculation of the real property tax liability (Table 6, page 21). The District of Columbia has a $30,000 homestead deduction in FY 2004 ($38,000 in FY 2005) for owner-occupied residences as well as other credits. Beginning October 1, 2005, the District’s homestead deduction for owner-occupied residences will increase to $60,000. In addition, in FY 2006, Class One property tax rate will decrease from $0.96 per $100 to $0.92 per $100 assessed value; and the owner-occupied residential real property tax cap drops from 12% to 10%.
As noted in Table 7, page 23, residents in 47 of the 51 cities studied are subject to some
form of sales and use tax. The highest sales tax rates are found in Memphis, Tennessee, New Orleans, Louisiana, and Seattle, Washington. Residents of Honolulu, Hawaii, Virginia Beach, Virginia, and Columbia, South Carolina pay the lowest sales tax rates.
Table 9, page 26, indicates all 51 cities in this study levy some type of automobile
registration fee or tax -- usually either a flat rate per vehicle or a sales tax based upon the value of the vehicle. In addition, personal property taxes are levied in 12 of the cities.
Residents of 44 of the 51 cities in this study are subject to some type of individual income
tax at the state and/or local levels. There are several types of individual income tax systems, including graduated state and local rates, graduated state and flat local rates, flat state and local rates, state tax rates as a percent of federal income tax liability, graduated state tax rates and flat state rates with exemptions, as presented on Table 16 page 41.
No single pattern of taxation characterizes a high tax burden or a low tax burden city.
Details concerning the various taxes levied and why the tax burdens differ from one jurisdiction to another are presented in this publication. Part I of this publication compares tax burdens in the District of Columbia with those of the largest city in each state. Part II of this publication contains a compendium of tables which illustrate the tax rates in the District of Columbia and the 50 states for 13 different types of taxes.
vii
ACKNOWLEDGMENT
Each year the Government of the District of Columbia, Office of the Chief Financial
Officer, Office of Research and Analysis publishes several reports, which provide information to the citizens and taxpayers of the District of Columbia. The reports contain information about the rates and burdens of major taxes in the District of Columbia compared with states and other large cities in the United States.
This publication contains two reports: (I) Tax burdens in Washington, D.C., Compared with
Those in the Largest City in Each State, 2004 and (II) A Comparison of Selected Tax Rates in the District of Columbia with Those in the 50 States: A Compendium of Tables. This information is requested annually by committees of the U.S. Congress and the District of Columbia Council and is provided pursuant to Public Law 93-407.
Questions and comments concerning these publications should be addressed to: Edward W.
Wyatt, Tax Research Specialist, Revenue Estimation and Tax Research Administration, Office of Research and Analysis, 441 4th Street, NW, Suite 410 South, Washington, D.C. 20001, telephone (202) 727-7775.
Our appreciation is extended to the many state and local officials who reviewed draft
reports. Their cooperation in providing information and their helpful suggestions make this publication possible.
Julia Friedman, Ph. D. Deputy Chief Financial Officer Office of the Chief Financial Officer Office of Revenue Analysis August 2005
Part I
Tax Burdens In Washington, D.C., Compared With Those In
The Largest City In Each State
2004

Tax Rates and Tax Burdens in the District of Columbia: A Nationwide Comparison
Page 1
OVERVIEW
State and local tax systems in the United States are diverse. The 50 states and the District of
Columbia employ a broad range of taxes and fees to fund state and local government operations. The combination of taxes and fees utilized by a particular jurisdiction is dependent upon many factors, including revenue needs, the tax base of the local government, the fiscal relationships between state and local government, constitutional and legal limitations on the powers of taxation, taxpayer demand for government services, and other factors.
"Tax burden" is defined in this study as a measure of the tax paid by a taxpayer under a
specified set of conditions. This study defines a specified set of conditions and computes corresponding tax burdens in 51 different jurisdictions. In evaluating or interpreting these comparisons, consideration should be given to circumstances specific to each jurisdiction, which may affect tax burdens. Such circumstances can include greater local demand for services, greater local costs of producing services, and the use of revenue sources other than taxes to finance certain services.
This study compares tax burdens in 51 different locations for a hypothetical family of
four. The major state and local tax burdens for the family in the District of Columbia are compared with those in the largest city in each state. It must be emphasized that these burden comparisons reflect the assumptions used in their computation. For this reason it is important to study the methodology used in the report before drawing conclusions about the relative levels of taxation in each of the cities.
This is an ongoing study, published annually and readers are advised not to compare the
hypothetical tax burdens across years; any number of small changes in state and/or local tax policy or in the assumptions of the study can result in misleading information under such comparisons. The purpose of the study remains to compare tax burdens on a hypothetical household in different jurisdictions in a specific year, and not over time.

Chapter I: How Tax Burdens Are Computed For The Largest City In Each State
Tax Rates and Tax Burdens in the District of Columbia: A Nationwide Comparison
Page 2
CHAPTER I
How Tax Burdens Are Computed For The Largest City In Each State
The majority of taxpayers in the United States are aware that the amount of state and local
tax liability of an individual taxpayer varies from one jurisdiction to another. The extent of these differences in state and local tax burdens across the country, however, may not be fully recognized.
States and local jurisdictions differ in many aspects of their taxing systems. The
relationship of state taxes to federal tax law is one of several factors causing differences in tax burdens from one state to another. Other differences reflect decisions by state and local governments on what should and should not be subject to tax. For example, several states do not levy an individual income tax, although for many others it represents a major source of state funding. Tax burdens also differ because some states can shift a larger portion of governmental costs to business and may be able to "export" some of their tax burden. This has been true for example, for energy producing states and states specializing in tourism.
This report compares the state and local tax burdens of hypothetical households in
Washington, D.C., with the burden for the largest city in each of the 50 states for 2004. The four major taxes used in the comparison are the individual income tax, real property tax on residential property, general sales and use tax, and automobile taxes, including gasoline tax, registration fees, excise tax and personal property tax. This study does not incorporate the effects of differing local tax burdens on the federal individual income tax burden. Income and property taxes are deductible in computing federal income taxes and the effect of federal deductibility is to reduce the overall difference in tax burdens between jurisdictions.
All tax burdens reflect state and local tax rates. Tax burdens are compared for a hypothetical
family that consists of two wage-earning spouses and two school-age children. The gross family income levels used are $25,000, $50,000, $75,000, $100,000 and $150,000. The wage and salary split is assumed to be 70-30 between the two spouses. All other income is assumed to be split evenly. The family at each income level is assumed to own a single family home and to reside within the confines of the city. All wage and salary income is further assumed to have been earned in the city. The particular assumptions used in the calculation of each major tax type are indicated on the following pages.
Chapter I: How Tax Burdens Are Computed For The Largest City In Each State
Tax Rates and Tax Burdens in the District of Columbia: A Nationwide Comparison
Page 3
Individual Income Tax
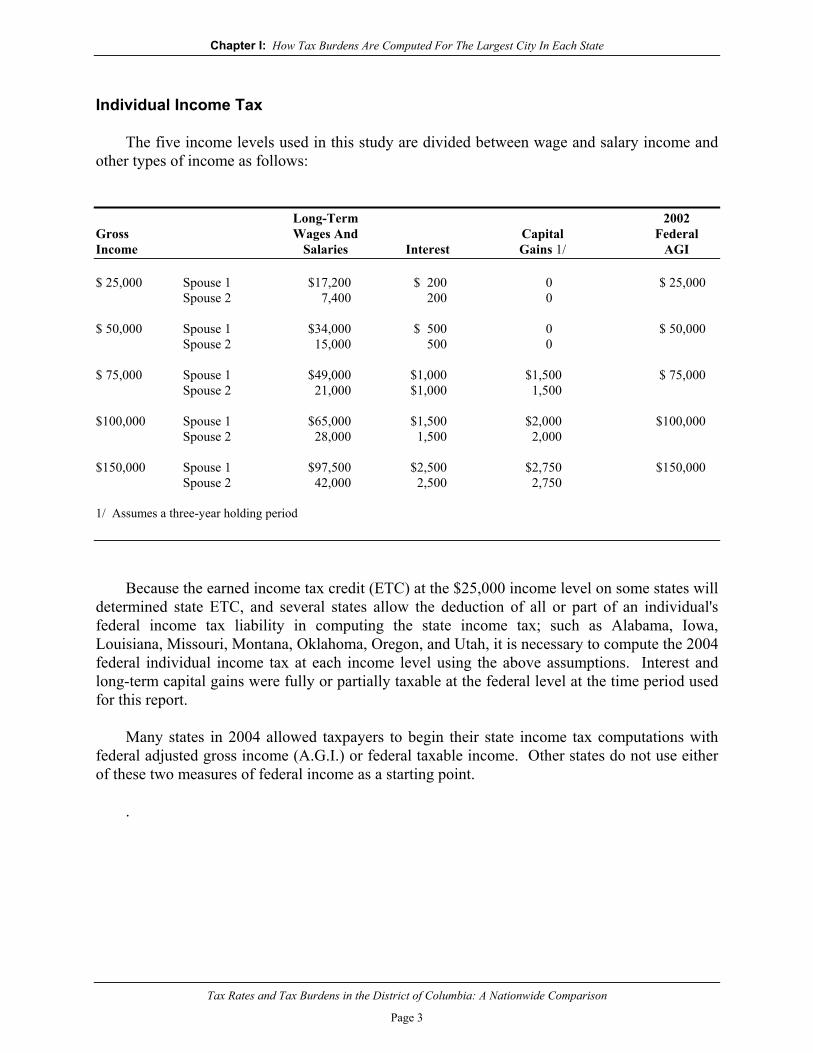
The five income levels used in this study are divided between wage and salary income and
other types of income as follows: Long-Term 2002 Gross Wages And Capital Federal Income Salaries Interest Gains 1/ AGI $ 25,000 Spouse 1 $17,200 $ 200 0 $ 25,000 Spouse 2 7,400 200 0 $ 50,000 Spouse 1 $34,000 $ 500 0 $ 50,000 Spouse 2 15,000 500 0 $ 75,000 Spouse 1 $49,000 $1,000 $1,500 $ 75,000 Spouse 2 21,000 $1,000 1,500 $100,000 Spouse 1 $65,000 $1,500 $2,000 $100,000 Spouse 2 28,000 1,500 2,000 $150,000 Spouse 1 $97,500 $2,500 $2,750 $150,000 Spouse 2 42,000 2,500 2,750 1/ Assumes a three-year holding period
Because the earned income tax credit (ETC) at the $25,000 income level on some states will determined state ETC, and several states allow the deduction of all or part of an individual's federal income tax liability in computing the state income tax; such as Alabama, Iowa, Louisiana, Missouri, Montana, Oklahoma, Oregon, and Utah, it is necessary to compute the 2004 federal individual income tax at each income level using the above assumptions. Interest and long-term capital gains were fully or partially taxable at the federal level at the time period used for this report.
Many states in 2004 allowed taxpayers to begin their state income tax computations with
federal adjusted gross income (A.G.I.) or federal taxable income. Other states do not use either of these two measures of federal income as a starting point.
.
Chapter I: How Tax Burdens Are Computed For The Largest City In Each State
Tax Rates and Tax Burdens in the District of Columbia: A Nationwide Comparison
Page 4
Total itemized deductions, which were also used in the federal tax computation, were assumed to be equal to the following: Gross Income Level Deduction $ 25,000 $ 50,000 $ 75,000 $100,000 $150,000 Medical (Gross) 1,310 2,361 3,279 4,590 6,557 Nondeductible Medical -1,875 -3,750 -5,625 -7,500 -11,200 Net Medical Deduction 1/ 0 0 0 0 0 Deductible Taxes 2/ 2/ 2/ 2/ 2/ Mortgage Interest 2,623 5,377 7,344 9,180 14,164 Contribution Deduction 918 1,967 2,885 3,934 6,033 Gross Miscellaneous 656 1,049 1,574 1,967 2,623 Nondeductible 3/ -500 -1,000 -1,500 -2,000 -3,000 Net Miscellaneous Deduction 156 49 74 0 0 Total Deductions-without taxes 3,697 7,393 10,303 13,114 20,197
1/ Nondeductible medical equals 7.5 percent of federal A.G.I. All or part of medical deductions may be allowed in some states.
2/ The tax deduction varies from city to city and is based on real and personal property taxes computed in 2004 study and individual income taxes computed in 2003 study.
3/ Nondeductible miscellaneous equals 2 percent of A.G.I.
The itemized deductions shown above are used in the calculation of the 2004 tax burdens. The 2004 deductible real and personal property taxes computed in the current years 51-city burden study is used for the 2004 property tax deduction. For the 2004 state and local individual income tax deduction, 2003 data were used as a proxy. These figures were used in computing the 2004 federal income tax burden. States that allow state and local income tax deductions are Georgia, Hawaii, New Mexico, Oklahoma, Rhode Island, and Vermont.. Alabama allows social sercurity tax and medicare tax deductions on their state tax.. Iowa and New Jersey allows all medical expenses paid as an itemized state deduction. For those states not allowing their own state income tax as a deduction, it is not included in itemized deductions.
Real Property Tax
Real property tax burdens in the 51 cities are a function of residential real estate values, the ratio of assessed value to market value and the tax rate. Some jurisdictions allow certain deductions from the value of residential property before the tax is calculated while others allow credits against the calculated real estate tax. These deductions and/or credits are normally limited to owner-occupied properties.
The property tax rates for each of the 51 cities, presented in Table 4, page 19, indicate a

Chapter I: How Tax Burdens Are Computed For The Largest City In Each State
Tax Rates and Tax Burdens in the District of Columbia: A Nationwide Comparison
Page 5
wide range in these rates. This information is based upon data received from various state research agencies and/or local assessors. In addition to tax rate differences presented in Table 5 (page 20), data indicate that the assumed market value of a residence for purposes of this study varies widely from one city to another at all income levels. For example, the assumed value of a residence at the $75,000 income level ranges from a high of $515,041 in Honolulu, Hawaii to a low of $120,160 in Wichita, Kansas. The housing values for each income level for each city in Table 5 are derived using the following methodology:
1) The 2000 median single family housing value for each city obtained from the 2000
Census of Housing is compared to the city median family income for homeowners from the 2000 Census of Population. The resulting ratio of median housing value to median family income is the housing/income ratio shown in Table 5. For Washington, D.C., for example, the ratio is 3.40.
2) The housing values for the two middle income levels, $50,000 and $75,000, are
derived by multiplying the housing/income ratio shown in Table 5 by the income level. Thus, for Washington, D.C., the housing values at the $50,000 and $75,000 incomes are computed as follows:
$50,000 x 3.40 = $169,825 $75,000 x 3.40 = $254,737
The housing values in Table 5 on page 20 are calculated on the basis of an unrounded housing to income ratio, which makes the result slightly different from that shown in the examples.
3) For the lowest income level, $25,000, the cost of housing is assumed to be a greater
proportion of income than the housing/income ratio derived above. For this income level, the housing/income ratio is increased by 5 percent, based on data from the United States Census Bureau. For Washington, D.C., the appropriate calculation at the $25,000 level using the rounded ratio is:
$25,000 x 3.40 x 1.05 = $89,158
4) For the $100,000 income level, housing costs as a percentage of income are
assumed to be less than the derived ratio. The housing to income ratio is reduced by 5 percent. The appropriate calculation for Washington, D.C. is:
$100,000 x 3.40 x .95 = $322,667
5) For the highest income level, housing costs as a percentage of income are also
assumed to be less than the derived ratio. The housing to income ratio is reduced by 10 percent at the highest income level, again based on data from the United States Census Bureau. The appropriate calculation for Washington, D.C. is:
$150,000 x 3.40 x .90 = $458,527

Chapter I: How Tax Burdens Are Computed For The Largest City In Each State
Tax Rates and Tax Burdens in the District of Columbia: A Nationwide Comparison
Page 6
The above methodology is an attempt to reflect the different values of housing in
different parts of the country and at different income levels. Census data from 2000 are used because they are the only data comparable for all the jurisdictions in this study. It is important to note that these are hypothetical values based on income level and do not represent average values for a particular jurisdiction.
In computing property tax burdens, it is also necessary to consider the various
exemptions, limitations and credits noted in Table 6 (page 21). The variety of real property tax exemptions, most of which apply only to residential real property, is very broad. Table 6 does not include the many senior citizen exemptions and credits available in a large number of states, nor can it adjust for “caps” on the growth in tax liability over time. Table 4 (page 19), which compares residential real estate tax rates for each city, does not reflect the various exemptions and credits noted in Table 6. The many senior citizen exemptions and credits available are also not reflected in Table 4, because seniors are not included in the hypothetical households of this study. However, the property tax burdens computed and shown in Table 1 of this study reflect the applicable provisions.
Sales and Use Tax
The sales tax burdens included in this study are based on information from the 2003 Bureau of Labor Statistics consumer expenditure survey (CES) and from information provided by the states in a sales tax survey. For the $50,000 and $100,000 income levels, the expenditures for each are derived by using the following methodology of dividing the amount purchased by the average income and multiplying that percentage by the $50,000 and $75,000. The same methodology is used for the other income levels; except the $25,000 is increased by 5 percent, and the $100,000 and $150,000 income levels are decreased by 5 percent and 10 percent, respectively. The state and local general sales tax rates in each city are reported in Table 7, page 23.
Automobile Taxes
Automobile taxes included in this study are gasoline taxes, motor vehicle registration fees, excise taxes, and personal property taxes levied on automobiles. Table 10 (page 26) summarizes automobile ownership assumptions for each income level, including types of vehicles, weight, value and annual gasoline consumption.

Chapter II: Overall Tax Burdens For The Largest City In Each State
Tax Rates and Tax Burdens in the District of Columbia: A Nationwide Comparison
Page 7
CHAPTER II
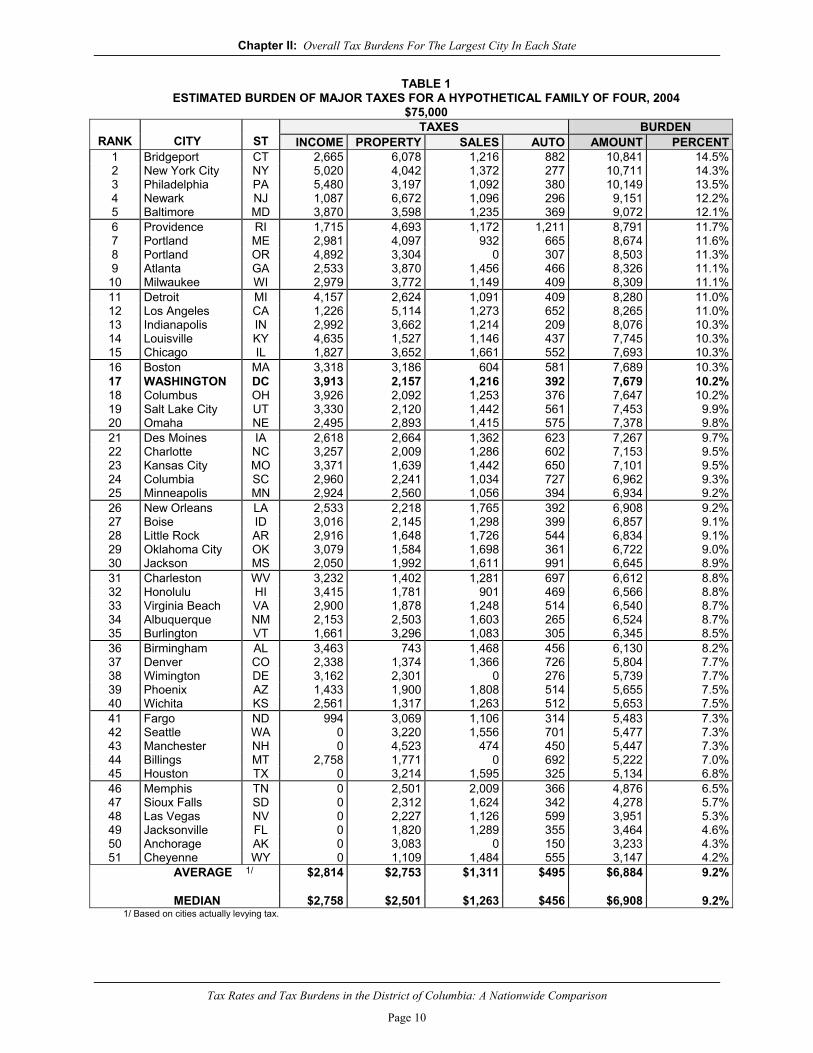
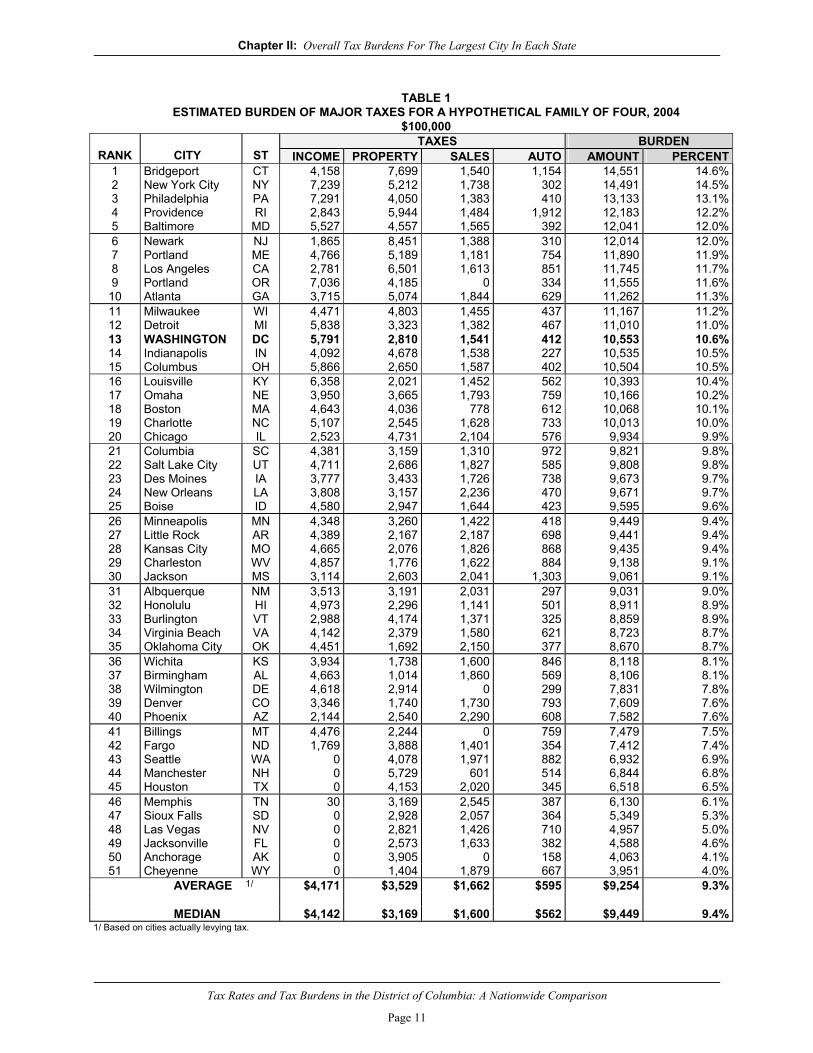
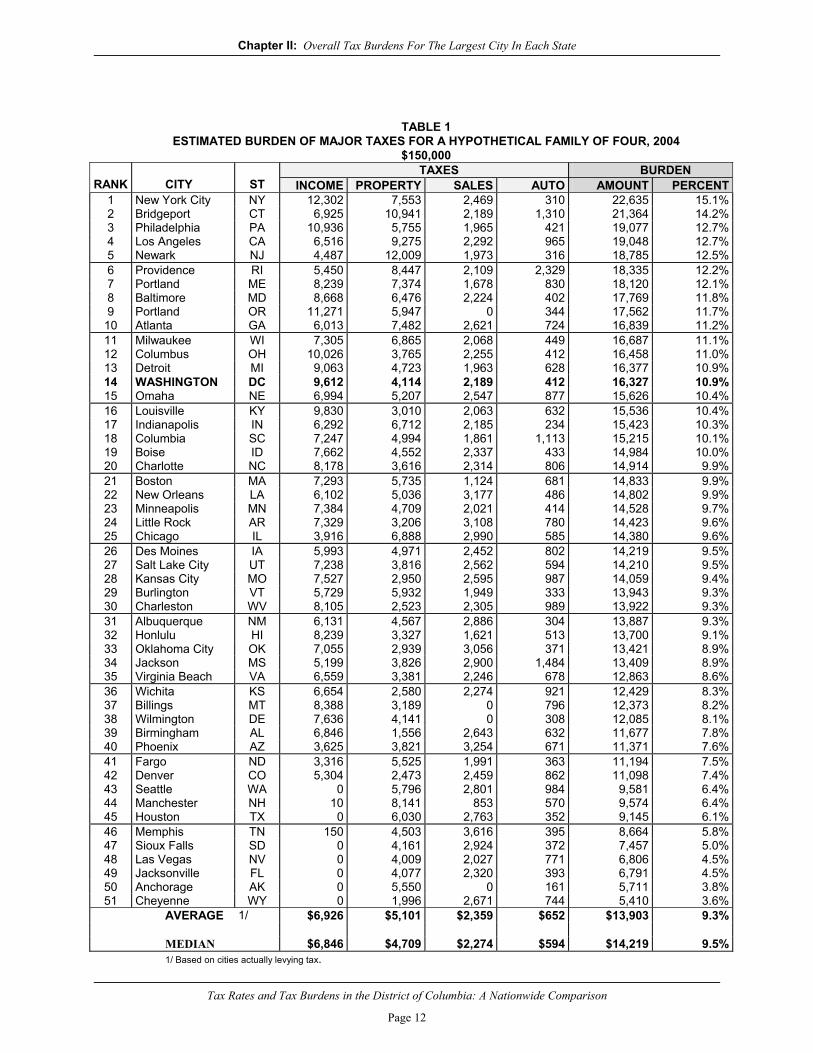
Overall Tax Burdens For The Largest City In Each State
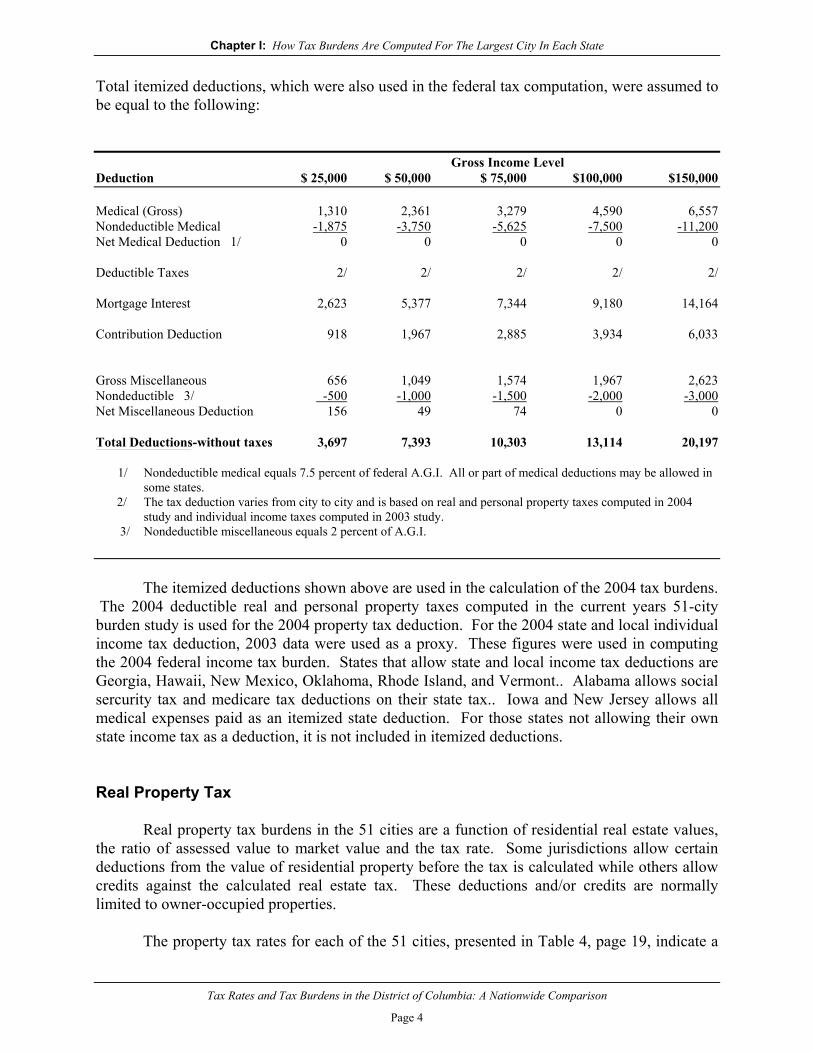
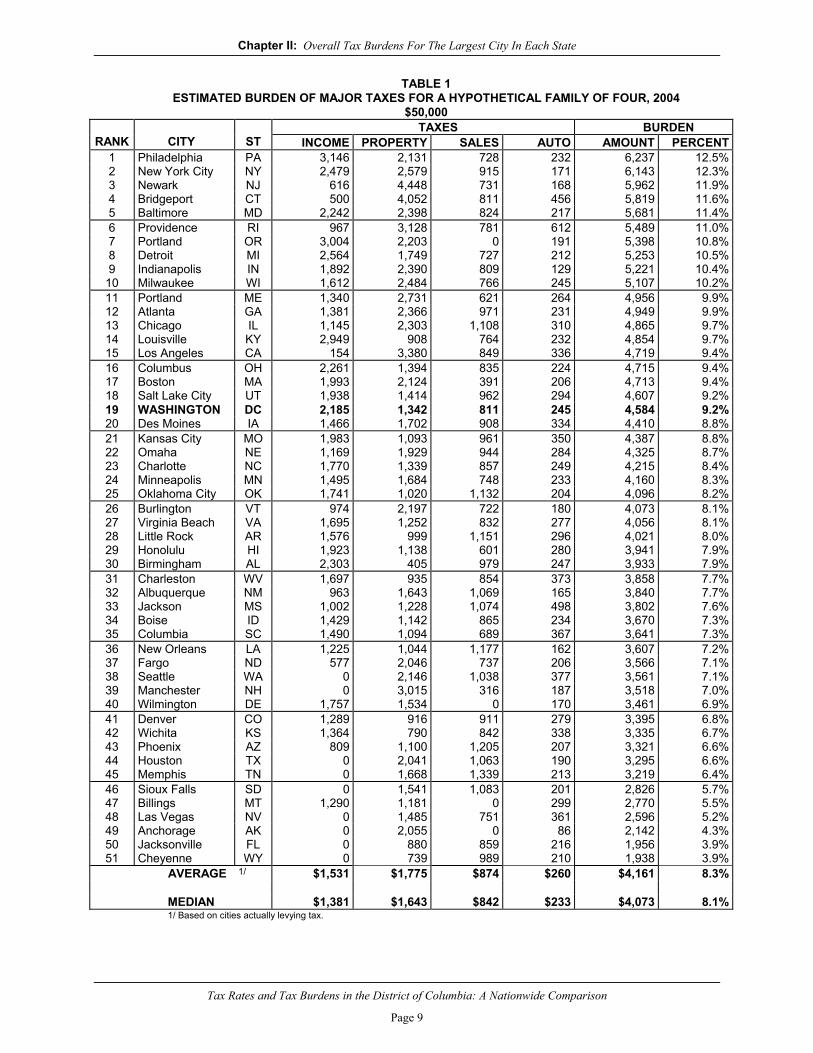
The major state and local tax burdens by tax type for the five different income levels used in this study are presented in Table 1 (pages 8-12). As reflected by data in Table 1, tax burdens across the 51 cities vary widely at all income levels. At the $25,000 income level, the $3,109 burden for Newark, New Jersey is almost five times greater than the $676 burden for Jacksonville, Florida. Similarly, at the $150,000 income level, the New York City, New York burden of $22,635 is more than four times the Cheyenne, Wyoming, burden of $5,410. The differences in the composition of state and local tax structures cause a wide variation in tax burdens at all income levels.
The highest combined overall tax burden occurs in New York City, New York; followed
by Bridgeport, Connecticut; Philadelphia, Pennsylvania; and Newark, New Jersey.
The lowest combined tax burdens for the 51 cities occur in Cheyenne, Wyoming followed by Anchorage, Alaska; Jacksonville, Florida; and Las Vegas, Nevada.
No single pattern characterizes a city with either a high or a low tax burden. Generally,
however, high tax burden cities have a graduated individual income tax rate and/or high real estate tax rates, moderate to high housing values and cities located in the northeast. Low tax burden cities generally have a low individual income tax (if they have one at all) and average or below average real property tax rates. The regional pattern cannot be overlooked, as the four highest tax cities are located in the Northeast and the four lowest tax cities are located in the South and West.
Progressivity
As indicated on Table 1 (pages 8 through 12), the average 51-city total tax burden is 7.1 percent at the $25,000 income level, 8.3 percent at the $50,000 income level, 9.2 percent at the $75,000 income level, and 9.3 percent at the $100,000 and $150,000 income levels. The median burden is 7.2 percent at the $25,000 income level, 8.1 percent at the $50,000 income level, 9.2 percent at the $72,000 income level, 9.4 percent at the $100,000 income level, and 9.5 percent at the $150,000.

Chapter II: Overall Tax Burdens For The Largest City In Each State
Tax Rates and Tax Burdens in the District of Columbia: A Nationwide Comparison
Page 8
TABLE 1
ESTIMATED BURDEN OF MAJOR TAXES FOR A HYPOTHETICAL FAMILY OF FOUR, 2004 $25,000
TAXES BURDEN RANK
CITY
ST INCOME PROPERTY SALES AUTO AMOUNT PERCENT
1 Newark NJ 218 2,335 384 172 3,109 12.4%2 Bridgeport CT 0 2,127 426 321 2,874 11.5%3 Philadelphia PA 1,116 1,119 382 241 2,858 11.4%4 Detroit MI 947 918 382 193 2,440 9.8%5 Los Angeles CA 0 1,733 446 237 2,416 9.7%6 Indianapolis IN 660 1,183 425 135 2,403 9.6%7 Providence RI 0 1,642 410 241 2,294 9.2%8 Portland OR 925 1,156 0 199 2,280 9.1%9 Chicago IL 349 1,022 581 317 2,269 9.1%10 Columbus OH 778 732 439 232 2,180 8.7%11 Louisville KY 1,218 321 401 175 2,115 8.5%12 Portland ME 1 1,434 329 219 1,983 7.9%13 Atlanta GA 379 936 510 144 1,969 7.9%14 Seattle WA 0 1,127 545 296 1,968 7.9%15 Omaha NE 158 1,013 495 258 1,924 7.7%16 Baltimore MD 0 1,259 432 224 1,916 7.7%17 Milwaukee WI 0 1,260 402 253 1,915 7.7%18 Manchester NH 0 1,583 166 165 1,914 7.7%19 Virginia Beach VA 580 657 437 231 1,905 7.6%20 Birmingham AL 1,057 83 514 198 1,851 7.4%21 Boston MA 336 1,115 195 197 1,843 7.4%22 New York City NY 0 1,189 480 171 1,840 7.4%23 Charleston WV 582 491 448 289 1,810 7.2%24 Des Moines IA 263 788 466 285 1,803 7.2%25 Oklahoma City OK 527 484 594 196 1,801 7.2%26 Memphis TN 0 876 703 219 1,798 7.2%27 Kansas City MO 464 574 505 240 1,782 7.1%28 Salt Lake City UT 212 742 505 302 1,760 7.0%29 Fargo ND 61 1,074 387 212 1,735 6.9%30 Honolulu HI 598 526 315 289 1,728 6.9%31 Burlington VT 0 1,153 379 186 1,719 6.9%32 Little Rock AR 476 382 604 222 1,684 6.7%33 Houston TX 0 927 558 196 1,681 6.7%34 Charlotte NC 313 703 450 191 1,657 6.6%35 WASHINGTON DC 388 568 426 251 1,633 6.5%36 Albuquerque NM 43 827 561 158 1,589 6.4%37 Sioux Falls SD 0 809 568 208 1,586 6.3%38 Jackson MS 162 502 564 333 1,562 6.2%39 Las Vegas NV 0 779 394 323 1,497 6.0%40 Minneapolis MN 0 851 393 202 1,446 5.8%41 Wilmington DE 449 805 0 177 1,431 5.7%42 Phoenix AZ 72 486 633 157 1,348 5.4%43 Denver CO 132 481 478 208 1,299 5.2%44 Billings MT 336 620 0 279 1,235 4.9%45 Boise ID 0 527 454 241 1,222 4.9%46 Anchorage AK 0 1,079 0 89 1,168 4.7%47 Wichita KS 21 290 442 322 1,075 4.3%48 New Orleans LA 285 0 618 168 1,070 4.3%49 Cheyenne WY 0 388 519 144 1,051 4.2%50 Columbia SC 24 421 362 240 1,046 4.2%51 Jacksonville FL 0 0 451 225 676 2.7%
AVERAGE 1/ $321 $865 $459 $223 $1,787 7.1%
MEDIAN $158 $809 $442 $219 $1,798 7.2%1/ Based on cities actually levying tax.
Chapter II: Overall Tax Burdens For The Largest City In Each State
Tax Rates and Tax Burdens in the District of Columbia: A Nationwide Comparison
Page 9
TABLE 1 ESTIMATED BURDEN OF MAJOR TAXES FOR A HYPOTHETICAL FAMILY OF FOUR, 2004
$50,000 TAXES BURDEN
RANK
CITY
ST INCOME PROPERTY SALES AUTO AMOUNT PERCENT1 Philadelphia PA 3,146 2,131 728 232 6,237 12.5%2 New York City NY 2,479 2,579 915 171 6,143 12.3%3 Newark NJ 616 4,448 731 168 5,962 11.9%4 Bridgeport CT 500 4,052 811 456 5,819 11.6%5 Baltimore MD 2,242 2,398 824 217 5,681 11.4%6 Providence RI 967 3,128 781 612 5,489 11.0%7 Portland OR 3,004 2,203 0 191 5,398 10.8%8 Detroit MI 2,564 1,749 727 212 5,253 10.5%9 Indianapolis IN 1,892 2,390 809 129 5,221 10.4%
10 Milwaukee WI 1,612 2,484 766 245 5,107 10.2%11 Portland ME 1,340 2,731 621 264 4,956 9.9%12 Atlanta GA 1,381 2,366 971 231 4,949 9.9%13 Chicago IL 1,145 2,303 1,108 310 4,865 9.7%14 Louisville KY 2,949 908 764 232 4,854 9.7%15 Los Angeles CA 154 3,380 849 336 4,719 9.4%16 Columbus OH 2,261 1,394 835 224 4,715 9.4%17 Boston MA 1,993 2,124 391 206 4,713 9.4%18 Salt Lake City UT 1,938 1,414 962 294 4,607 9.2%19 WASHINGTON DC 2,185 1,342 811 245 4,584 9.2%20 Des Moines IA 1,466 1,702 908 334 4,410 8.8%21 Kansas City MO 1,983 1,093 961 350 4,387 8.8%22 Omaha NE 1,169 1,929 944 284 4,325 8.7%23 Charlotte NC 1,770 1,339 857 249 4,215 8.4%24 Minneapolis MN 1,495 1,684 748 233 4,160 8.3%25 Oklahoma City OK 1,741 1,020 1,132 204 4,096 8.2%26 Burlington VT 974 2,197 722 180 4,073 8.1%27 Virginia Beach VA 1,695 1,252 832 277 4,056 8.1%28 Little Rock AR 1,576 999 1,151 296 4,021 8.0%29 Honolulu HI 1,923 1,138 601 280 3,941 7.9%30 Birmingham AL 2,303 405 979 247 3,933 7.9%31 Charleston WV 1,697 935 854 373 3,858 7.7%32 Albuquerque NM 963 1,643 1,069 165 3,840 7.7%33 Jackson MS 1,002 1,228 1,074 498 3,802 7.6%34 Boise ID 1,429 1,142 865 234 3,670 7.3%35 Columbia SC 1,490 1,094 689 367 3,641 7.3%36 New Orleans LA 1,225 1,044 1,177 162 3,607 7.2%37 Fargo ND 577 2,046 737 206 3,566 7.1%38 Seattle WA 0 2,146 1,038 377 3,561 7.1%39 Manchester NH 0 3,015 316 187 3,518 7.0%40 Wilmington DE 1,757 1,534 0 170 3,461 6.9%41 Denver CO 1,289 916 911 279 3,395 6.8%42 Wichita KS 1,364 790 842 338 3,335 6.7%43 Phoenix AZ 809 1,100 1,205 207 3,321 6.6%44 Houston TX 0 2,041 1,063 190 3,295 6.6%45 Memphis TN 0 1,668 1,339 213 3,219 6.4%46 Sioux Falls SD 0 1,541 1,083 201 2,826 5.7%47 Billings MT 1,290 1,181 0 299 2,770 5.5%48 Las Vegas NV 0 1,485 751 361 2,596 5.2%49 Anchorage AK 0 2,055 0 86 2,142 4.3%50 Jacksonville FL 0 880 859 216 1,956 3.9%51 Cheyenne WY 0 739 989 210 1,938 3.9%
AVERAGE 1/ $1,531 $1,775 $874 $260 $4,161 8.3% MEDIAN $1,381 $1,643 $842 $233 $4,073 8.1%
1/ Based on cities actually levying tax.
Chapter II: Overall Tax Burdens For The Largest City In Each State
Tax Rates and Tax Burdens in the District of Columbia: A Nationwide Comparison
Page 10
TABLE 1 ESTIMATED BURDEN OF MAJOR TAXES FOR A HYPOTHETICAL FAMILY OF FOUR, 2004
$75,000 TAXES BURDEN
RANK
CITY
ST INCOME PROPERTY SALES AUTO AMOUNT PERCENT1 Bridgeport CT 2,665 6,078 1,216 882 10,841 14.5%2 New York City NY 5,020 4,042 1,372 277 10,711 14.3%3 Philadelphia PA 5,480 3,197 1,092 380 10,149 13.5%4 Newark NJ 1,087 6,672 1,096 296 9,151 12.2%5 Baltimore MD 3,870 3,598 1,235 369 9,072 12.1%6 Providence RI 1,715 4,693 1,172 1,211 8,791 11.7%7 Portland ME 2,981 4,097 932 665 8,674 11.6%8 Portland OR 4,892 3,304 0 307 8,503 11.3%9 Atlanta GA 2,533 3,870 1,456 466 8,326 11.1%10 Milwaukee WI 2,979 3,772 1,149 409 8,309 11.1%11 Detroit MI 4,157 2,624 1,091 409 8,280 11.0%12 Los Angeles CA 1,226 5,114 1,273 652 8,265 11.0%13 Indianapolis IN 2,992 3,662 1,214 209 8,076 10.3%14 Louisville KY 4,635 1,527 1,146 437 7,745 10.3%15 Chicago IL 1,827 3,652 1,661 552 7,693 10.3%16 Boston MA 3,318 3,186 604 581 7,689 10.3%17 WASHINGTON DC 3,913 2,157 1,216 392 7,679 10.2%18 Columbus OH 3,926 2,092 1,253 376 7,647 10.2%19 Salt Lake City UT 3,330 2,120 1,442 561 7,453 9.9%20 Omaha NE 2,495 2,893 1,415 575 7,378 9.8%21 Des Moines IA 2,618 2,664 1,362 623 7,267 9.7%22 Charlotte NC 3,257 2,009 1,286 602 7,153 9.5%23 Kansas City MO 3,371 1,639 1,442 650 7,101 9.5%24 Columbia SC 2,960 2,241 1,034 727 6,962 9.3%25 Minneapolis MN 2,924 2,560 1,056 394 6,934 9.2%26 New Orleans LA 2,533 2,218 1,765 392 6,908 9.2%27 Boise ID 3,016 2,145 1,298 399 6,857 9.1%28 Little Rock AR 2,916 1,648 1,726 544 6,834 9.1%29 Oklahoma City OK 3,079 1,584 1,698 361 6,722 9.0%30 Jackson MS 2,050 1,992 1,611 991 6,645 8.9%31 Charleston WV 3,232 1,402 1,281 697 6,612 8.8%32 Honolulu HI 3,415 1,781 901 469 6,566 8.8%33 Virginia Beach VA 2,900 1,878 1,248 514 6,540 8.7%34 Albuquerque NM 2,153 2,503 1,603 265 6,524 8.7%35 Burlington VT 1,661 3,296 1,083 305 6,345 8.5%36 Birmingham AL 3,463 743 1,468 456 6,130 8.2%37 Denver CO 2,338 1,374 1,366 726 5,804 7.7%38 Wimington DE 3,162 2,301 0 276 5,739 7.7%39 Phoenix AZ 1,433 1,900 1,808 514 5,655 7.5%40 Wichita KS 2,561 1,317 1,263 512 5,653 7.5%41 Fargo ND 994 3,069 1,106 314 5,483 7.3%42 Seattle WA 0 3,220 1,556 701 5,477 7.3%43 Manchester NH 0 4,523 474 450 5,447 7.3%44 Billings MT 2,758 1,771 0 692 5,222 7.0%45 Houston TX 0 3,214 1,595 325 5,134 6.8%46 Memphis TN 0 2,501 2,009 366 4,876 6.5%47 Sioux Falls SD 0 2,312 1,624 342 4,278 5.7%48 Las Vegas NV 0 2,227 1,126 599 3,951 5.3%49 Jacksonville FL 0 1,820 1,289 355 3,464 4.6%50 Anchorage AK 0 3,083 0 150 3,233 4.3%51 Cheyenne WY 0 1,109 1,484 555 3,147 4.2%
AVERAGE 1/ $2,814 $2,753 $1,311 $495 $6,884 9.2% MEDIAN $2,758 $2,501 $1,263 $456 $6,908 9.2%1/ Based on cities actually levying tax.
Chapter II: Overall Tax Burdens For The Largest City In Each State
Tax Rates and Tax Burdens in the District of Columbia: A Nationwide Comparison
Page 11
TABLE 1
ESTIMATED BURDEN OF MAJOR TAXES FOR A HYPOTHETICAL FAMILY OF FOUR, 2004 $100,000
TAXES BURDEN RANK
CITY
ST INCOME PROPERTY SALES AUTO AMOUNT PERCENT
1 Bridgeport CT 4,158 7,699 1,540 1,154 14,551 14.6%2 New York City NY 7,239 5,212 1,738 302 14,491 14.5%3 Philadelphia PA 7,291 4,050 1,383 410 13,133 13.1%4 Providence RI 2,843 5,944 1,484 1,912 12,183 12.2%5 Baltimore MD 5,527 4,557 1,565 392 12,041 12.0%6 Newark NJ 1,865 8,451 1,388 310 12,014 12.0%7 Portland ME 4,766 5,189 1,181 754 11,890 11.9%8 Los Angeles CA 2,781 6,501 1,613 851 11,745 11.7%9 Portland OR 7,036 4,185 0 334 11,555 11.6%10 Atlanta GA 3,715 5,074 1,844 629 11,262 11.3%11 Milwaukee WI 4,471 4,803 1,455 437 11,167 11.2%12 Detroit MI 5,838 3,323 1,382 467 11,010 11.0%13 WASHINGTON DC 5,791 2,810 1,541 412 10,553 10.6%14 Indianapolis IN 4,092 4,678 1,538 227 10,535 10.5%15 Columbus OH 5,866 2,650 1,587 402 10,504 10.5%16 Louisville KY 6,358 2,021 1,452 562 10,393 10.4%17 Omaha NE 3,950 3,665 1,793 759 10,166 10.2%18 Boston MA 4,643 4,036 778 612 10,068 10.1%19 Charlotte NC 5,107 2,545 1,628 733 10,013 10.0%20 Chicago IL 2,523 4,731 2,104 576 9,934 9.9%21 Columbia SC 4,381 3,159 1,310 972 9,821 9.8%22 Salt Lake City UT 4,711 2,686 1,827 585 9,808 9.8%23 Des Moines IA 3,777 3,433 1,726 738 9,673 9.7%24 New Orleans LA 3,808 3,157 2,236 470 9,671 9.7%25 Boise ID 4,580 2,947 1,644 423 9,595 9.6%26 Minneapolis MN 4,348 3,260 1,422 418 9,449 9.4%27 Little Rock AR 4,389 2,167 2,187 698 9,441 9.4%28 Kansas City MO 4,665 2,076 1,826 868 9,435 9.4%29 Charleston WV 4,857 1,776 1,622 884 9,138 9.1%30 Jackson MS 3,114 2,603 2,041 1,303 9,061 9.1%31 Albquerque NM 3,513 3,191 2,031 297 9,031 9.0%32 Honolulu HI 4,973 2,296 1,141 501 8,911 8.9%33 Burlington VT 2,988 4,174 1,371 325 8,859 8.9%34 Virginia Beach VA 4,142 2,379 1,580 621 8,723 8.7%35 Oklahoma City OK 4,451 1,692 2,150 377 8,670 8.7%36 Wichita KS 3,934 1,738 1,600 846 8,118 8.1%37 Birmingham AL 4,663 1,014 1,860 569 8,106 8.1%38 Wilmington DE 4,618 2,914 0 299 7,831 7.8%39 Denver CO 3,346 1,740 1,730 793 7,609 7.6%40 Phoenix AZ 2,144 2,540 2,290 608 7,582 7.6%41 Billings MT 4,476 2,244 0 759 7,479 7.5%42 Fargo ND 1,769 3,888 1,401 354 7,412 7.4%43 Seattle WA 0 4,078 1,971 882 6,932 6.9%44 Manchester NH 0 5,729 601 514 6,844 6.8%45 Houston TX 0 4,153 2,020 345 6,518 6.5%46 Memphis TN 30 3,169 2,545 387 6,130 6.1%47 Sioux Falls SD 0 2,928 2,057 364 5,349 5.3%48 Las Vegas NV 0 2,821 1,426 710 4,957 5.0%49 Jacksonville FL 0 2,573 1,633 382 4,588 4.6%50 Anchorage AK 0 3,905 0 158 4,063 4.1%51 Cheyenne WY 0 1,404 1,879 667 3,951 4.0%
AVERAGE 1/ $4,171 $3,529 $1,662 $595 $9,254 9.3% MEDIAN $4,142 $3,169 $1,600 $562 $9,449 9.4%
1/ Based on cities actually levying tax.
Chapter II: Overall Tax Burdens For The Largest City In Each State
Tax Rates and Tax Burdens in the District of Columbia: A Nationwide Comparison
Page 12
TABLE 1
ESTIMATED BURDEN OF MAJOR TAXES FOR A HYPOTHETICAL FAMILY OF FOUR, 2004 $150,000
TAXES BURDEN RANK
CITY
ST INCOME PROPERTY SALES AUTO AMOUNT PERCENT
1 New York City NY 12,302 7,553 2,469 310 22,635 15.1%2 Bridgeport CT 6,925 10,941 2,189 1,310 21,364 14.2%3 Philadelphia PA 10,936 5,755 1,965 421 19,077 12.7%4 Los Angeles CA 6,516 9,275 2,292 965 19,048 12.7%5 Newark NJ 4,487 12,009 1,973 316 18,785 12.5%6 Providence RI 5,450 8,447 2,109 2,329 18,335 12.2%7 Portland ME 8,239 7,374 1,678 830 18,120 12.1%8 Baltimore MD 8,668 6,476 2,224 402 17,769 11.8%9 Portland OR 11,271 5,947 0 344 17,562 11.7%
10 Atlanta GA 6,013 7,482 2,621 724 16,839 11.2%11 Milwaukee WI 7,305 6,865 2,068 449 16,687 11.1%12 Columbus OH 10,026 3,765 2,255 412 16,458 11.0%13 Detroit MI 9,063 4,723 1,963 628 16,377 10.9%14 WASHINGTON DC 9,612 4,114 2,189 412 16,327 10.9%15 Omaha NE 6,994 5,207 2,547 877 15,626 10.4%16 Louisville KY 9,830 3,010 2,063 632 15,536 10.4%17 Indianapolis IN 6,292 6,712 2,185 234 15,423 10.3%18 Columbia SC 7,247 4,994 1,861 1,113 15,215 10.1%19 Boise ID 7,662 4,552 2,337 433 14,984 10.0%20 Charlotte NC 8,178 3,616 2,314 806 14,914 9.9%21 Boston MA 7,293 5,735 1,124 681 14,833 9.9%22 New Orleans LA 6,102 5,036 3,177 486 14,802 9.9%23 Minneapolis MN 7,384 4,709 2,021 414 14,528 9.7%24 Little Rock AR 7,329 3,206 3,108 780 14,423 9.6%25 Chicago IL 3,916 6,888 2,990 585 14,380 9.6%26 Des Moines IA 5,993 4,971 2,452 802 14,219 9.5%27 Salt Lake City UT 7,238 3,816 2,562 594 14,210 9.5%28 Kansas City MO 7,527 2,950 2,595 987 14,059 9.4%29 Burlington VT 5,729 5,932 1,949 333 13,943 9.3%30 Charleston WV 8,105 2,523 2,305 989 13,922 9.3%31 Albuquerque NM 6,131 4,567 2,886 304 13,887 9.3%32 Honlulu HI 8,239 3,327 1,621 513 13,700 9.1%33 Oklahoma City OK 7,055 2,939 3,056 371 13,421 8.9%34 Jackson MS 5,199 3,826 2,900 1,484 13,409 8.9%35 Virginia Beach VA 6,559 3,381 2,246 678 12,863 8.6%36 Wichita KS 6,654 2,580 2,274 921 12,429 8.3%37 Billings MT 8,388 3,189 0 796 12,373 8.2%38 Wilmington DE 7,636 4,141 0 308 12,085 8.1%39 Birmingham AL 6,846 1,556 2,643 632 11,677 7.8%40 Phoenix AZ 3,625 3,821 3,254 671 11,371 7.6%41 Fargo ND 3,316 5,525 1,991 363 11,194 7.5%42 Denver CO 5,304 2,473 2,459 862 11,098 7.4%43 Seattle WA 0 5,796 2,801 984 9,581 6.4%44 Manchester NH 10 8,141 853 570 9,574 6.4%45 Houston TX 0 6,030 2,763 352 9,145 6.1%46 Memphis TN 150 4,503 3,616 395 8,664 5.8%47 Sioux Falls SD 0 4,161 2,924 372 7,457 5.0%48 Las Vegas NV 0 4,009 2,027 771 6,806 4.5%49 Jacksonville FL 0 4,077 2,320 393 6,791 4.5%50 Anchorage AK 0 5,550 0 161 5,711 3.8%51 Cheyenne WY 0 1,996 2,671 744 5,410 3.6%
AVERAGE 1/ $6,926 $5,101 $2,359 $652 $13,903 9.3% MEDIAN $6,846 $4,709 $2,274 $594 $14,219 9.5% 1/ Based on cities actually levying tax.

Chapter II: Overall Tax Burdens For The Largest City In Each State
Tax Rates and Tax Burdens in the District of Columbia: A Nationwide Comparison
Page 13
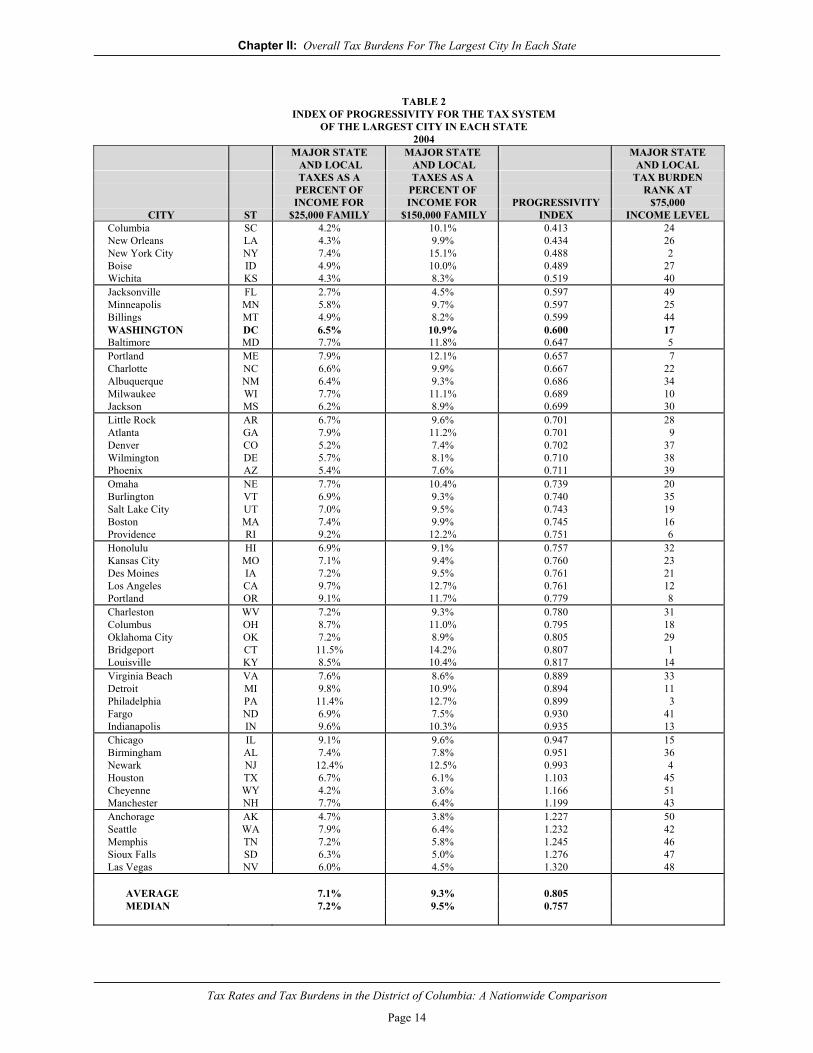
The average tax burden for the 51 cities is progressive since the percentage tax burden at
$150,000 income (9.3 percent of income) is greater than the percentage tax burden at $25,000 (7.1 percent). Any tax system in which the percentage of tax paid rises with the income level is said to be progressive. A tax system in which the percentage paid in taxes decreases as income rises is regressive.
Table 2 (page 14) indicates the relative progressivity or regressivity for the tax systems of
each of the 51 cities. The progressivity index is measured by dividing the percentage tax burden at the $25,000 income level by the percentage tax burden at the $150,000 income level. Index coefficients of less than 1.000 indicates a progressive tax system, while an index greater than 1.000 indicates a regressive tax system. A proportional tax system is indicated by a coefficient of 1.000. The average index of .805 indicates that, overall, the average state and local tax system of the 51 cities is slightly progressive. The most progressive tax systems are found in Columbia, South Carolina; New Orleans, Louisiana; and New York City, New York. A graduated individual income tax and some type of low-income exemption or credit on the real property tax characterize the tax system in each of these cities.
The three cities with the least progressive state and local tax systems are Las Vegas,
Nevada; Sioux Falls, South Dakota; and Memphis, Tennessee. Residents of Las Vegas and Sioux Falls do not pay a state individual income tax ; and residents of Memphis only pay income tax on interest and dividend income. In Sioux Falls and Memphis, the sales and use tax burden is substantially above the 51-city average.
Several factors contribute to the progressivity of a tax system. A graduated individual
income tax rate system, as well as exemptions and credits to lessen the regressivity of the property tax, will increase the progressivity of a tax system. Progressivity can be lessened by reliance on regressive taxes such as the sales tax and certain automobile taxes. The assumptions used in the calculation of housing values for the property tax (Chapter I) presuppose a certain regressivity in the property tax because the higher income family is assumed to spend a lower portion of income on housing than the lower income family. Similarly, the assumptions with regard to the composition of income at the five income levels also affect the progressivity of the individual income tax. The upper and lower income levels chosen for comparison also affect progressivity as measured in this study.
Chapter II: Overall Tax Burdens For The Largest City In Each State
Tax Rates and Tax Burdens in the District of Columbia: A Nationwide Comparison
Page 14
TABLE 2
INDEX OF PROGRESSIVITY FOR THE TAX SYSTEM OF THE LARGEST CITY IN EACH STATE
2004 MAJOR STATE
AND LOCAL MAJOR STATE AND LOCAL
MAJOR STATE AND LOCAL
TAXES AS A TAXES AS A TAX BURDEN PERCENT OF
INCOME FOR PERCENT OF INCOME FOR
PROGRESSIVITY
RANK AT $75,000
CITY ST $25,000 FAMILY $150,000 FAMILY INDEX INCOME LEVEL Columbia SC 4.2% 10.1% 0.413 24 New Orleans LA 4.3% 9.9% 0.434 26 New York City NY 7.4% 15.1% 0.488 2 Boise ID 4.9% 10.0% 0.489 27 Wichita KS 4.3% 8.3% 0.519 40 Jacksonville FL 2.7% 4.5% 0.597 49 Minneapolis MN 5.8% 9.7% 0.597 25 Billings MT 4.9% 8.2% 0.599 44 WASHINGTON DC 6.5% 10.9% 0.600 17 Baltimore MD 7.7% 11.8% 0.647 5 Portland ME 7.9% 12.1% 0.657 7 Charlotte NC 6.6% 9.9% 0.667 22 Albuquerque NM 6.4% 9.3% 0.686 34 Milwaukee WI 7.7% 11.1% 0.689 10 Jackson MS 6.2% 8.9% 0.699 30 Little Rock AR 6.7% 9.6% 0.701 28 Atlanta GA 7.9% 11.2% 0.701 9 Denver CO 5.2% 7.4% 0.702 37 Wilmington DE 5.7% 8.1% 0.710 38 Phoenix AZ 5.4% 7.6% 0.711 39 Omaha NE 7.7% 10.4% 0.739 20 Burlington VT 6.9% 9.3% 0.740 35 Salt Lake City UT 7.0% 9.5% 0.743 19 Boston MA 7.4% 9.9% 0.745 16 Providence RI 9.2% 12.2% 0.751 6 Honolulu HI 6.9% 9.1% 0.757 32 Kansas City MO 7.1% 9.4% 0.760 23 Des Moines IA 7.2% 9.5% 0.761 21 Los Angeles CA 9.7% 12.7% 0.761 12 Portland OR 9.1% 11.7% 0.779 8 Charleston WV 7.2% 9.3% 0.780 31 Columbus OH 8.7% 11.0% 0.795 18 Oklahoma City OK 7.2% 8.9% 0.805 29 Bridgeport CT 11.5% 14.2% 0.807 1 Louisville KY 8.5% 10.4% 0.817 14 Virginia Beach VA 7.6% 8.6% 0.889 33 Detroit MI 9.8% 10.9% 0.894 11 Philadelphia PA 11.4% 12.7% 0.899 3 Fargo ND 6.9% 7.5% 0.930 41 Indianapolis IN 9.6% 10.3% 0.935 13 Chicago IL 9.1% 9.6% 0.947 15 Birmingham AL 7.4% 7.8% 0.951 36 Newark NJ 12.4% 12.5% 0.993 4 Houston TX 6.7% 6.1% 1.103 45 Cheyenne WY 4.2% 3.6% 1.166 51 Manchester NH 7.7% 6.4% 1.199 43 Anchorage AK 4.7% 3.8% 1.227 50 Seattle WA 7.9% 6.4% 1.232 42 Memphis TN 7.2% 5.8% 1.245 46 Sioux Falls SD 6.3% 5.0% 1.276 47 Las Vegas NV 6.0% 4.5% 1.320 48
AVERAGE 7.1% 9.3% 0.805 MEDIAN 7.2% 9.5% 0.757

Chapter III: Comparing Specific Tax Burdens For A Hypothetical Family Of Four In The Largest City In Each State
Tax Rates and Tax Burdens in the District of Columbia: A Nationwide Comparison
Page 15
CHAPTER III
Comparing Specific Tax Burdens For A Hypothetical Family Of
Four In The Largest City In Each State
Individual Income Tax
Residents of 44 of the 51 cities in the study are subject to some type of individual income
tax at the state and/or local levels. Individual income tax burdens vary widely due to factors such as differences in tax base, tax rates, exemptions, deductions and treatment of federal taxes. These variations are reflected in the individual income tax burdens shown in Table 3 (page 18).
The percentage of income paid in individual income taxes by residents of the largest city
in states having an income tax at the income level of $25,000 ranges from a low of zero percent in twelve of the cities in the study to a high of 4.9 percent in Louisville, Kentucky. At the $150,000 income level, the burden ranges from zero percent of income in Manchester, New Hampshire to 8.2 percent in New York City, New York. It should be noted that the Tennessee and New Hampshire income taxes are applicable only to interest and dividend income and the exemptions are high enough to eliminate individual income taxes at most income levels used in the study. New York City has broad-based income taxes at both the state and local levels, each of which has graduated rates.
The average individual income tax rate for the 44 cities levying the tax ranges from 1.3
percent at $25,000 income to 4.6 percent at $150,000 income. Overall, the individual income tax is quite progressive.
As Table 3 indicates, there are several types of individual income tax systems including
graduated state and local rates, graduated state and flat local rates, flat state and local rates, graduated state tax rates and flat state rates with exemptions. The most common system is the graduated state tax rate, which applies to taxpayers in 28 of the cities. Taxpayers of five cities are subject to a flat state tax rate with exemptions.
Three of the larger cities in the study, Indianapolis, Indiana; Detroit, Michigan; and
Philadelphia, Pennsylvania are subject to flat state and local tax rates. Six other cities levy local income taxes with flat rates to complement graduated rate income tax systems. New York City residents are subject to separate state and local income taxes, both of which are characterized by graduated rate schedules.

Chapter III: Comparing Specific Tax Burdens For A Hypothetical Family Of Four In The Largest City In Each State
Tax Rates and Tax Burdens in the District of Columbia: A Nationwide Comparison
Page 16
Several of the state individual income tax systems are indexed. Indexing takes several
forms and is used to keep individuals from being taxed at higher rates if their income rises less than the rate of inflation. Thus, only the "real" income gain above the inflation rate is subject to higher tax rates. The table below summarizes the various indexing methods used by states:
States That Index Some Part of Their Individual Income Tax State Indexed Portion Status Arkansas Tax brackets Active
California Tax brackets, exemptions Active (credit), standard deduction
Idaho Tax brackets Active Iowa Tax brackets, standard Active deduction
Maine Tax brackets Active standard deduction
Michigan Personal exemptions Active Minnesota Tax brackets, exemptions Active
and standard deduction Montana Tax brackets, exemptions, Active
standard deduction North Dakota Tax brackets, exemptions, Active standard deduction Ohio Standard deduction Active
Oregon Tax brackets, exemptions Active
Standard deduction
South Carolina Tax brackets Active Utah Standard deduction, Active
personal exemption
Wisconsin Tax Brackets, Standard Deduction Active
Chapter III: Comparing Specific Tax Burdens For A Hypothetical Family Of Four In The Largest City In Each State
Tax Rates and Tax Burdens in the District of Columbia: A Nationwide Comparison
Page 17
States that tax a percentage of federal net taxable income or a percentage of the federal
liability implicitly accept the federal indexing of tax brackets, exemptions and the standard deduction.
Table 1 indicates that the hypothetical families pay more in individual income taxes than
any other tax at the three top income levels. At $25,000, the individual income tax is the third, and at $50,000, the second most burdensome tax.
Real Property Tax
All 51 cities in the study levy a property tax on residential property located within the
city. The real property tax is a function of housing values, real estate tax rates, assessment levels, homeowner exemptions and credits. Nominal rates used in table 4 (page 19), represent the "announced" rates levied by the jurisdiction, while effective rates consider the various assessment levels in the cities. As the data indicate, effective rates range from a high of $2.99 per $100 of assessed value in Houston, Texas to 38 cents per $100 of assessed value in Honolulu, Hawaii. Assessment levels vary dramatically from 4.0 percent of assessed value in Columbia, South Carolina to 100.0 percent of assessed value in ten cities. Local assessors and state tax officials provided the assessment level and nominal rate used in the cities.
The assumed housing values in the 51 cities at each of the five income levels are
presented in Table 5, page 20. Housing values at the same income level vary a great deal. In addition, several jurisdictions allow tax exemptions and credits in the calculations of the property tax. These exemptions and credits are noted in Table 6 (page 21). The data in Table 5 are based on the 2000 U.S. Census of Population.
The hypothetical family pays more in real property taxes than any other tax in the study
at the income levels $25,000 and $50,000. It is the second highest tax paid at the $75,000, $100,000 and $150,000 income levels. In Table 1, Newark, New Jersey; Bridgeport, Connecticut; and Los Angeles, California have the highest property tax burdens. This is due primarily to the high real estate tax rates in each of these cities.
Birmingham, Alabama; Cheyenne, Wyoming; and Wichita, Kansas have the lowest real
estate tax burden at all income levels. This very low real estate tax burden results from a combination of a low effective real estate tax rate, below average housing values or an exemption program.

Chapter III: Comparing Specific Tax Burdens For A Hypothetical Family Of Four In The Largest City In Each State
Tax Rates and Tax Burdens in the District of Columbia: A Nationwide Comparison
Page 18
TABLE 3 INCOME TAX BURDEN AS PERCENT OF INCOME IN THE LARGEST CITIES BY
TYPE OF INCOME TAX FOR A FAMILY OF FOUR 2004
INCOME LEVELS: CITIES WITH: ST $25,000 $50,000 $75,000 $100,000 $150,000
GRADUATED STATE AND LOCAL TAX RATES
New York City NY 0.0% 5.0% 6.7% 7.2% 8.2%GRADUATED STATE AND FLAT LOCAL RATES
Birmingham AL 4.2% 4.6% 4.6% 4.7% 4.6% Wilmington DE 1.8% 3.5% 4.2% 4.6% 5.1% Louisville KY 4.9% 5.9% 6.2% 6.4% 6.6% Baltimore MD 0.0% 4.5% 5.2% 5.5% 5.8% Kansas City MO 1.9% 4.0% 4.5% 4.7% 5.0% Columbus OH 3.1% 4.5% 5.2% 5.9% 6.7% Portland OR 3.7% 6.0% 6.5% 7.0% 7.5%
FLAT STATE AND LOCAL TAX RATES Indianapolis IN 2.6% 3.8% 4.0% 4.1% 4.2% Detroit MI 3.8% 5.1% 5.5% 5.8% 6.0% Philadelphia PA 4.5% 6.3% 7.3% 7.3% 7.3%
GRADUATED STATE TAX Phoenix AZ 0.3% 1.6% 1.9% 2.1% 2.4% Little Rock AR 1.9% 3.2% 3.9% 4.4% 4.9% Los Angeles CA 0.0% 0.3% 1.6% 2.8% 4.3% Bridgeport CT 0.0% 1.0% 3.6% 4.2% 4.6% WASHINGTON DC 1.6% 4.4% 5.2% 5.8% 6.4% Atlanta GA 1.5% 2.8% 3.4% 3.7% 4.0% Honolulu HI 2.4% 3.8% 4.6% 5.0% 5.5% Boise ID 0.0% 2.9% 4.0% 4.6% 5.1% Des Moines IA 1.1% 2.9% 3.5% 3.8% 4.0% Wichita KS 0.1% 2.7% 3.4% 3.9% 4.4% New Orleans LA 1.1% 2.5% 3.4% 3.8% 4.1% Portland ME 0.0% 2.7% 4.0% 4.8% 5.5% Minneapolis MN 0.0% 3.0% 3.9% 4.3% 4.9% Jackson MS 0.6% 2.0% 2.7% 3.1% 3.5% Billings MT 1.3% 2.6% 3.7% 4.5% 5.6% Omaha NE 0.6% 2.3% 3.3% 4.0% 4.7% Newark NJ 0.9% 1.2% 1.4% 1.9% 3.0% Albuquerque NM 0.2% 1.9% 2.9% 3.5% 4.1% Charlotte NC 1.3% 3.5% 4.3% 5.1% 5.5% Fargo ND 0.2% 1.2% 1.3% 1.8% 2.2% Oklahoma City OK 2.1% 3.5% 4.1% 4.5% 4.7% Providence RI 0.0% 1.9% 2.3% 2.8% 3.6% Columbia SC 0.1% 3.0% 3.9% 4.4% 4.8% Salt Lake City UT 0.8% 3.9% 4.4% 4.7% 4.8% Virginia Beach VA 2.3% 3.4% 3.9% 4.1% 4.4% Burlington VT 0.0% 1.9% 2.2% 3.0% 3.8% Charleston WV 2.3% 3.4% 4.3% 4.9% 5.4% Milwaukee WI 0.0% 3.2% 4.0% 4.5% 4.9%
FLAT STATE TAX RATE WITH EXEMPTIONS Denver CO 0.5% 2.6% 3.1% 3.3% 3.5% Chicago IL 1.4% 2.3% 2.4% 2.5% 2.6% Boston MA 1.3% 4.0% 4.4% 4.6% 4.9% Manchester NH 0.0% 0.0% 0.0% 0.0% 0.0% Memphis TN 0.0% 0.0% 0.0% 0.0% 0.1%
No income tax: Anchorage, AK; Jacksonville, FL; Las Vegas, NV; Sioux Falls, SD: Houston, TX: Seattle, WA; Cheyenne, WY
AVERAGE 1/ 1.3% 3.1% 3.8% 4.2% 4.6%
1/ Based on cities actually levying tax.

Chapter III: Comparing Specific Tax Burdens For A Hypothetical Family Of Four In The Largest City In Each State
Tax Rates and Tax Burdens in the District of Columbia: A Nationwide Comparison
Page 19
TABLE 4 RESIDENTIAL PROPERTY TAX RATES IN THE LARGEST CITY IN EACH STATE
2004 NOMINAL EFFECTIVE
RATE ASSESSMENT RATE RANK CITY ST PER $100 LEVEL PER $100
1. Houston TX 2.99 100.0% 2.99 2. Providence RI 2.97 100.0% 2.97 3. Indianapolis IN 2.78 100.0% 2.78 4. Bridgeport CT 3.90 70.0% 2.73 5. Philadelphia PA 8.26 32.0% 2.64 6. Manchester NH 2.64 100.0% 2.64 7. Milwaukee WI 2.63 96.8% 2.54 8. Baltimore MD 2.46 100.0% 2.46 9. Newark NJ 2.43 94.7% 2.30 10. Des Moines IA 4.56 48.5% 2.21 11. Portland ME 2.68 82.0% 2.20 12. Omaha, NE 2.21 94.0% 2.08 13. Jacksonville FL 2.02 98.0% 1.98 14. Fargo ND 48.41 3.9% 1.89 15. Detroit MI 6.71 27.8% 1.86 16. Columbia SC 46.10 4.0% 1.84 17. Chicago IL 7.88 22.1% 1.74 18. New Orleans LA 17.40 10.0% 1.74 19. Memphis TN 7.27 23.8% 1.73 20. Boise ID 1.78 97.3% 1.73 21. Atlanta GA 4.29 40.0% 1.72 22. Jackson MS 17.09 10.0% 1.71 23. Anchorate AK 1.63 100.0% 1.63 24. Sioux Falls SD 1.84 85.0% 1.56 25. Billings MT 1.94 80.0% 1.55 26. Burlington VT 2.28 67.6% 1.54 27. Salt Lake City UT 1.53 99.0% 1.51 28. Columbus OH 4.91 30.3% 1.49 29. Portland OR 2.23 64.2% 1.43 30. Wilmington DE 2.71 51.2% 1.39 31. Little Rock AR 6.90 20.0% 1.38 32. Phoenix AZ 13.21 10.0% 1.32 33. Wichita KS 11.43 11.5% 1.31 34. Minneapolis MN 1.48 88.6% 1.31 35. Albuquerque NM 3.80 33.3% 1.27 36. Los Angeles CA 1.25 100.0% 1.25 37. Boston MA 1.23 100.0% 1.23 38. Oklahoma City OK 10.91 11.0% 1.20 39. Kansas City MO 6.30 19.0% 1.20 40. New York City NY 14.46 8.0% 1.16 41. Charlotte NC 1.18 95.8% 1.13 42. Louisville KY 1.23 90.0% 1.10 43. Las Vegas NV 3.12 35.0% 1.09 44. Virginia Beach VA 1.22 88.7% 1.08 45. Seattle WA 1.09 94.1% 1.03 46. WASHINGTON DC 0.96 100.0% 0.96 47. Charleston, WV 1.47 60.0% 0.88 48. Birmingham AL 6.95 10.0% 0.70 49. Cheyenne WY 7.11 9.5% 0.68 50. Denver CO 6.69 8.0% 0.53 51. Honolulu HI 0.38 100.0% 0.38
UNWEIGHTED AVERAGE $6.29 59.3% $1.62 MEDIAN $1.54
NOTE: All rates and percentages in this table are rounded.

Chapter III: Comparing Specific Tax Burdens For A Hypothetical Family Of Four In The Largest City In Each State
Tax Rates and Tax Burdens in the District of Columbia: A Nationwide Comparison
Page 20
TABLE 5
FACTORS USED IN HOUSING VALUE ASSUMPTIONS 2004
MEDIAN HOUSING VALUE ASSUMPTIONS AT INDICATED INCOME LEVELS:
CITY
ST
SINGLE FAMILY
HOUSING VALUE 1/
MEDIAN FAMILY
INCOME 2/
HOUSING
TO INCOME RATIO 3/ $25,000 $50,000
$75,000 $100,000 $150,000Honolulu, HI $386,700 $56,311 6.87 $180,265 $343,361 $515.041 $652,386 $927,075Los Angeles, CA 221,600 39,942 5.55 145,636 277,402 416,103 527,064 748,986New York City, NY 211,900 41,887 5.06 132,795 252,942 379,414 480,591 682,945Boston, MA 190,600 44,151 4.32 113,321 215,850 323,775 410,115 582,795Seattle, WA 259,600 62,195 4.17 109,567 208,698 313,048 396,527 563,486Newark, NJ 119,000 30,781 3.87 101,483 193,301 289,952 367,272 521,913Atlanta, GA 130,600 37,231 3.51 92,081 175,391 263,087 333,244 473,557Denver, CO 165,800 48,195 3.44 90,305 172,010 258,014 326,818 464,426WASHINGTON, DC 157,200 46,283 3.40 89,158 169,825 254,737 322,667 458,527Salt Lake City, UT 153,300 45,140 3.40 89,148 169,805 254,708 322,630 458,474Providence, RI 101,500 32,058 3.17 83,111 158,307 237,460 300,783 427,428Chicago, IL 132,400 42,724 3.10 81,348 154,948 232,422 294,401 418,360Portland, OR 154,900 50,271 3.08 80,884 154,065 231,097 292,723 415,975Bridgeport CT 117,500 39,571 2.97 77,945 148,467 222,701 282,088 400,862Burlington, VT 131,200 46,012 2.85 74,850 142,572 213,857 270,886 384,943Albuquerque, NM 127,600 46,979 2.72 71,298 135,805 203,708 258,030 366,674Las Vegas, NV 137,300 50,465 2.72 71,418 136,035 204,052 258,466 367,294New Orleans, LA 87,300 32,338 2.70 70,865 134,981 202,471 256,463 364,447Anchorage, AK 160,700 63,682 2.52 66,241 126,174 189,261 239,730 340,669Portland, ME 121,200 48,763 2.49 65,244 124,275 186,412 236,122 335,541Columbia, SC 98,500 39,589 2.49 65,312 124,403 186,605 236,366 335,889Phoenix, AZ 112,600 46,467 2.42 63,610 121,161 181,742 230,206 327,135Charlotte, NC 134,300 56,517 2.38 62,377 118,814 178,221 225,746 320,797Minneapolis, MN 113,500 48,602 2.34 61,301 116,765 175,147 221,853 315,265Boise City, ID 120,700 52,014 2.32 60,914 116,026 174,040 220,450 313,271Virginia Beach, VA 123,200 53,242 2.31 60,742 115,698 173,547 219,826 312,385Manchester, NH 114,300 50,039 2.28 59,961 114,211 171,316 217,001 308,369Louisville, KY 82,300 36,696 2.24 58,872 112,138 168,206 213,061 302,771Billings, MT 99,900 45,032 2.22 58,234 110,921 166,382 210,750 299,487Wilmington, DE 89,100 40,241 2.21 58,122 110,708 166,062 210,345 298,912Cheyenne, WY 102,400 46,771 2.19 57,472 109,470 164,204 207,992 295,568Columbus, OH 101,400 47,391 2.14 56,166 106,982 160,474 203,266 288,852Milwaukee, WI 80,400 37,879 2.12 55,717 106,127 159,191 201,642 286,544Charleston, WV 101,400 47,975 2.11 55,482 105,680 158,520 200,792 285,336Indianapolis, IN 98,500 48,979 2.01 52,790 100,553 150,830 191,051 271,494Sioux Falls, SD 101,700 51,516 1.97 51,821 98,707 148,061 187,544 266,509Houston, TX 79,300 40,443 1.96 51,471 98,039 147,059 186,275 264,706Birmingham, AL 62,100 31,851 1.95 51,180 97,485 146,228 185,222 263,210Baltimore, MD 69,100 35,438 1.95 51,184 97,494 146,241 185,239 263,234Fargo, ND 98,700 50,486 1.95 51,319 97,750 146,625 185,725 263,925Memphis, TN 72,800 37,767 1.93 50,600 96,380 144,571 183,123 260,227Little Rock, AR 89,300 47,446 1.88 49,406 94,107 141,160 178,803 254,089Detroit, MI 63,600 33,853 1.88 49,316 93,936 140,903 178,478 253,626Oklahoma City, OK 80,300 42,689 1.88 49,377 94,052 141,078 178,699 253,941Jacksonville, FL 87,800 47,243 1.86 48,785 92,924 139,386 176,555 250,894Omaha, NE 94,200 50,821 1.85 48,656 92,678 139,017 176,089 250,231Kansas City, MO 84,000 46,012 1.83 47,922 91,281 136,921 173,433 246,457Jackson, MS 64,400 36,003 1.79 46,954 89,437 134,155 169,930 241,480Des Moines, IA 81,100 46,590 1.74 45,694 87,036 130,554 165,368 234,997Philadelphia, PA 59,700 37,036 1.61 42,314 80,597 120,896 153,135 217,613Wichita, KS 78,900 49,247 1.60 42,056 80,106 120,160 152,202 216,287 AVERAGE $119,753 $44,840 2.65 $69,649 $132,664 $198,997 $252,062 $358,194MEDIAN $101,700 $46,283 2.31 $60,742 $115,698 $173,547 $219,826 $312,385 1/ General Housing Characteristics, U.S. Summary, Bureau of the Census. 2/ U.S. Census Bureau, Census 2000, Table DP-3, Profile of Selected Economic Characteristics: 2000. 3/ Figures are rounded

Chapter III: Comparing Specific Tax Burdens For A Hypothetical Family Of Four In The Largest City In Each State
Tax Rates and Tax Burdens in the District of Columbia: A Nationwide Comparison
Page 21
TABLE 6
CITIES WHICH ALLOW EXEMPTIONS OR REDUCED RATES IN THE CALCULATION OF REAL ESTATE TAXES FOR HOMEOWNERS
2004
CITY
STATE EXEMPTION OR TAX
REDUCTION AMOUNT BASIS OF TAX REDUCTION
OR EXEMPTION Birmingham,
AL $4,000 Assessed Value-Homestead
Little Rock, 1/ AR $300 Credit against Homestead for homeowners Tax Credit
Phoenix, AZ 35% Exemption on School Tax Rates up to $500
Assessed Value
Los Angeles, CA $7,000 Exemption
Assessed Value WASHINGTON, DC $30,000 Exemption
Assessed Value-Homestead
Jacksonville, FL $25,000 Exemption
Assessed Value 2/
Atlanta, GA $15,000 Exemption
Assessed Value
Honolulu, HI $40,000 Exemption (below age 55)
Assessed Value
Boise City, ID 50% up to $50,000 Exemption
Assessed Value-Improvements Chicago, IL $5,000 Exemption
Equalized Assessed Value
Indianapolis, IN 15% Credit and $6,000 Exemption
Assessed Value-Homestead
Wichita, KS
$20,000 School Levy Exemption Assessed Value
Louisville, KY
$26,800 Homestead Exemption Assessed Value
Des Moines, IA $4,850 Exemption Credit on 1st $4,800 Taxable value
Assessed Value-Homestead
New Orleans, LA $7,500 Exemption Assessed Value
Boston, MA 20% Residential Exemption
Assessed Value
Detroit, MI Homestead property exempt from Basic local school operating mileage
Taxable Value Jackson, MS $300 Exemption
Assessed Value
Billings, MT 31.4% Homestead exemption
Market Value Albuquerque, NM $2,000 Household Head
Exemption, $2,000 Veteran exemption Taxable Value
New York City, NY $30,000
Full Value-Residential School Property Taxes Columbus, OH 12.5% Tax Rollback
Assessed Value
Oklahoma City, OK $1,000 Exemption
Assessed Value-Homestead
Providence, RI 33.35%
Assessed Value
Columbia, SC 30.0% School district credit
Property tax relief fund
Houston, TX 20% Exemption on Value Plus $15,000 Exemption 20% Exemption
Assessed Value -School District Only -City and County Tax Only
Salt Lake City, UT 45% Residential Taxable Value Exemption
Milwaukee, WI School Levy Credit: $0.118 per $100 Market Value Lottery Credit: School Tax on 1st $9,600 Market Value
Tax Credit Equalized Assessed Value
1/ Annual assessment increases limited to 5% for homesteads. 2/ Just value increases limited too lesser of change in CPI or 3%.

Chapter III: Comparing Specific Tax Burdens For A Hypothetical Family Of Four In The Largest City In Each State
Tax Rates and Tax Burdens in the District of Columbia: A Nationwide Comparison
Page 22
Given the assumptions used in this study, the real property tax burden is slightly
regressive with an average percentage burden of 3.5 percent at $25,000 income and 3.4 percent at $150,000 income. Because of high exemptions or credits, the property tax in some cities is actually progressive despite the regressivity assumed in deriving housing values (see Chapter I). For example, in Washington, D.C., the percentage property tax burden is 2.3 percent at $25,000 and 2.7 percent at the $150,000 income level.
As mentioned earlier, housing value assumptions combined with flat rates make the
property tax regressive overall, while flat amount exemptions and credits can, and in some cities do, alleviate the regressivity of the property tax.
Sales and Use Tax
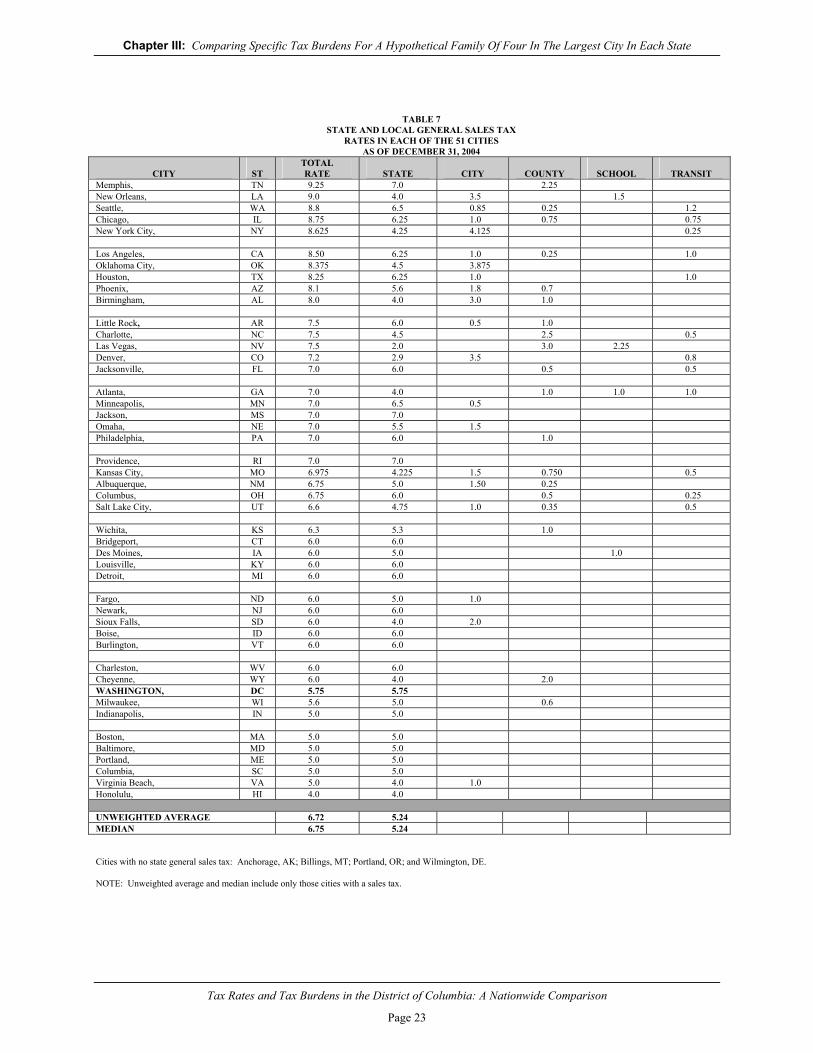
Residents of 47 of the 51 cities in this study are subject to some form of a sales and use tax. The combined sales tax rates range from 9.25 percent in Memphis, Tennessee to 4 percent in Honolulu as indicated in Table 7, page 23. The highest state sales tax rate is 7 percent in Mississippi, Rhode Island and Tennessee; while the lowest state rate of 2 percent is found in Nevada. Sales taxes are levied by nineteen of the 51 cities in addition to state sales taxes with the highest city rate at 4.125 percent in New York City. Of the nineteen counties levying a sales tax, the highest rate (3.0 percent) is in Clark County (Las Vegas). Four school districts and twelve transit districts also levy sales taxes, with rates ranging from 0.25 percent, in New York City and Columbus, Ohio, to 2.25 percent in Las Vegas.
The average sales tax burden is the second highest of the four major tax types at the
$25,000 income level, according to Table 1. It is third highest tax paid at the four other income levels. However, the sales tax burden is far below the levels of property and income taxes at the four highest income levels. For cities subject to a sales tax, the highest burdens occur in Memphis, Tennessee; Phoenix, Arizona; and New Orleans, Louisiana. The cities with a sales tax having the lowest burdens include Manchester, New Hampshire; Boston, Massachusetts; and Honolulu, Hawaii.
Table 1 shows that the sales tax is regressive; the $25,000 income family pays an average
1.8 percent for sales taxes, while the $150,000 family pays 1.6 percent. Factors that make the sales tax regressive include a flat tax rate as well as a tax base which includes tangible necessities but not necessarily services. Factors which can lessen the regressivity of the sales tax include the exemption of groceries and the taxation of certain services.
Chapter III: Comparing Specific Tax Burdens For A Hypothetical Family Of Four In The Largest City In Each State
Tax Rates and Tax Burdens in the District of Columbia: A Nationwide Comparison
Page 23
TABLE 7 STATE AND LOCAL GENERAL SALES TAX RATES IN EACH OF THE 51 CITIES
AS OF DECEMBER 31, 2004
CITY
ST TOTAL RATE
STATE
CITY
COUNTY
SCHOOL
TRANSIT
Memphis, TN 9.25 7.0 2.25 New Orleans, LA 9.0 4.0 3.5 1.5 Seattle, WA 8.8 6.5 0.85 0.25 1.2 Chicago, IL 8.75 6.25 1.0 0.75 0.75 New York City, NY 8.625 4.25 4.125 0.25 Los Angeles, CA 8.50 6.25 1.0 0.25 1.0 Oklahoma City, OK 8.375 4.5 3.875 Houston, TX 8.25 6.25 1.0 1.0 Phoenix, AZ 8.1 5.6 1.8 0.7 Birmingham, AL 8.0 4.0 3.0 1.0 Little Rock, AR 7.5 6.0 0.5 1.0 Charlotte, NC 7.5 4.5 2.5 0.5 Las Vegas, NV 7.5 2.0 3.0 2.25 Denver, CO 7.2 2.9 3.5 0.8 Jacksonville, FL 7.0 6.0 0.5 0.5 Atlanta, GA 7.0 4.0 1.0 1.0 1.0 Minneapolis, MN 7.0 6.5 0.5 Jackson, MS 7.0 7.0 Omaha, NE 7.0 5.5 1.5 Philadelphia, PA 7.0 6.0 1.0 Providence, RI 7.0 7.0 Kansas City, MO 6.975 4.225 1.5 0.750 0.5 Albuquerque, NM 6.75 5.0 1.50 0.25 Columbus, OH 6.75 6.0 0.5 0.25 Salt Lake City, UT 6.6 4.75 1.0 0.35 0.5 Wichita, KS 6.3 5.3 1.0 Bridgeport, CT 6.0 6.0 Des Moines, IA 6.0 5.0 1.0 Louisville, KY 6.0 6.0 Detroit, MI 6.0 6.0 Fargo, ND 6.0 5.0 1.0 Newark, NJ 6.0 6.0 Sioux Falls, SD 6.0 4.0 2.0 Boise, ID 6.0 6.0 Burlington, VT 6.0 6.0 Charleston, WV 6.0 6.0 Cheyenne, WY 6.0 4.0 2.0 WASHINGTON, DC 5.75 5.75 Milwaukee, WI 5.6 5.0 0.6 Indianapolis, IN 5.0 5.0 Boston, MA 5.0 5.0 Baltimore, MD 5.0 5.0 Portland, ME 5.0 5.0 Columbia, SC 5.0 5.0 Virginia Beach, VA 5.0 4.0 1.0 Honolulu, HI 4.0 4.0 UNWEIGHTED AVERAGE 6.72 5.24 MEDIAN 6.75 5.24
Cities with no state general sales tax: Anchorage, AK; Billings, MT; Portland, OR; and Wilmington, DE. NOTE: Unweighted average and median include only those cities with a sales tax.
Chapter III: Comparing Specific Tax Burdens For A Hypothetical Family Of Four In The Largest City In Each State
Tax Rates and Tax Burdens in the District of Columbia: A Nationwide Comparison
Page 24
Automobile Taxes
Residents of all 51 cities in this study are subject to gasoline taxes and some type of automobile registration fee or tax. The automobile taxes included in this study are gasoline taxes, motor vehicle registration fees, excise taxes and personal property taxes. Twelve of the cities levy a personal property tax based on the value of motor vehicles owned by a taxpayer. Gasoline tax rates in each of the 51 cities as of January 1, 2004 are compared in Table 8, page 25. The gasoline tax rates vary from as high as 33 cents per gallon in Las Vegas, Nevada; and 32.6 cents in Honolulu, Hawaii, to a low of 7.5 cents per gallon in Atlanta, Georgia and 8 cents per gallon in Anchorage, Alaska.
As noted before, citizens in all 51 cities are subject to some type of automobile
registration fee and tax. They are usually either flat per-vehicle rates or excise taxes based on value. The types of registration and other automobile taxes to which residents of the 51 cities are subject are summarized in Table 9, page 26.
Twelve cities levy personal property taxes on automobiles using various methods. Some
cities use a combination of assessment levels and tax rates, which may or may not be the same as is used for other personal property or for real property. Others use the same assessment system and property tax rate for automobiles as they do for personal residences.
The assumptions used for calculating automobile personal property taxes, excise taxes,
the gasoline tax and registration fees are presented in Table 10, page 26.
The lowest tax burdens at all income levels in this study are the automobile tax burdens. Providence, Rhode Island; Jackson, Mississippi; Bridgeport, Connecticut; and Columbia, South Carolina are among the cities with high automobile tax burdens. These cities levy either a personal property tax or a very high excise tax. Anchorage, Alaska; Albuquerque, New Mexico; and Indianapolis, Indiana have consistently low automobile tax burdens. All of these cities have flat registration rates or registration by weight, moderate gasoline tax rates and no personal property or excise tax.
Automobile tax burdens in the 51 cities are regressive on the average as shown in Table
1. The $25,000 family pays 0.9 percent of income for automobile related taxes, while the $150,000 income family pays an average of 0.4 percent. Since gasoline consumption does not necessarily increase at the same rate as income, a flat tax rate on gasoline will not be progressive. Similarly, in a society where ownership of at least one automobile by a family is almost a necessity, any tax (excise or personal property) based on the value of vehicle ownership tends to be regressive.

Chapter III: Comparing Specific Tax Burdens For A Hypothetical Family Of Four In The Largest City In Each State
Tax Rates and Tax Burdens in the District of Columbia: A Nationwide Comparison
Page 25
TABLE 8 GASOLINE TAX RATES IN THE 51 CITIES AS OF DECEMBER 31, 2004
(STATE AND LOCAL RATES) CITY ST TOTAL RATE STATE RATE LOCAL RATE
Las Vegas, NV 33.0 24.0 09.0 Honolulu, HI 32.6 16.1 16.5 Providence, RI 31.0 31.0 00.0 Philadelphia, PA 30.0 30.0 00.0 Milwaukee, WI 29.1 29.1 00.0 Jacksonville, FL 28.2 14.3 13.9 Seattle, WA 28.0 28.0 00.0 Billings, MT 27.0 27.0 00.0 Portland, OR 27.0 24.0 03.0 Charlotte, NC 26.85 26.85 00.0 Omaha, NE 26.3 26.3 00.0 Los Angeles, CA 26.2 26.2 00.0 Columbus, OH 26.0 26.0 00.0 Portland, ME 25.2 25.2 00.0 Bridgeport, CT 25.0 25.0 00.0 Boise, ID 25.0 25.0 00.0 Salt Lake City, UT 24.5 24.5 00.0 Chicago, IL 24.0 19.0 05.0 Wichita, KS 24.0 24.0 00.0 Kansas City, MO 24.0 24.0 00.0 Baltimore, MD 23.5 23.5 00.0 Wilmington, DE 23.0 23.0 00.0 New York City, NY 22.6 22.6 00.0 Denver, CO 22.0 22.0 00.0 Sioux Falls, SD 22.0 22.0 00.0 Little Rock, AR 21.7 21.7 00.0 Boston, MA 21.0 21.0 00.0 Fargo, ND 21.0 21.0 00.0 Des Moines, IA 20.5 20.5 00.0 Charleston, WV 20.5 20.5 00.0 WASHINGTON, DC 20.0 20.0 00.0 New Orleans, LA 20.0 20.0 00.0 Minneapolis, MN 20.0 20.0 00.0 Memphis, TN 20.0 20.0 00.0 Houston, TX 20.0 20.0 00.0 Burlington, VT 20.0 20.0 00.0 Manchester, NH 19.5 19.5 00.0 Albuquerque, NM 19.5 19.5 00.0 Detroit, MI 19.0 19.0 00.0 Jackson, MS 18.4 18.4 00.0 Oklahoma City, OK 18.4 18.4 00.0 Birmingham, AL 18.3 18.3 01.0 Phoenix, AZ 18.0 18.0 00.0 Indianapolis, IN 18.0 18.0 00.0 Virginia Beach, VA 17.5 17.5 00.0 Louisville, KY 16.4 16.4 00.0 Columbia, SC 16.0 16.0 00.0 Cheyenne, WY 14.0 14.0 00.0 Newark, NJ 10.5 10.5 00.0 Anchorage, AK 08.0 08.0 00.0 Atlanta, GA 07.5 07.5 00.0 UNWEIGHTED AVERAGE 22.0 MEDIAN 21.7

Chapter III: Comparing Specific Tax Burdens For A Hypothetical Family Of Four In The Largest City In Each State
Tax Rates and Tax Burdens in the District of Columbia: A Nationwide Comparison
Page 26
TABLE 9
SUMMARY OF TYPES OF AUTOMOBILE
REGISTRATION TAXES 2004
TYPE OF REGISTRATION NUMBER OF STATES
Flat Rate Only 30 Weight Only 13 Weight and Age 3 Horsepower Only 1 Age Only 2 Value Only 1 Value and Age 1
51 OTHER AUTO TAXES (INCLUDING LOCAL)
Personal Property 12 Excise:
Value and Age 9 Value Based 5 Age Based 1
TABLE 10 AUTOMOBILE TAX ASSUMPTIONS
2004
Market Values
Estimated
Estimated
Engine Mileage Annual Income Size Retail Trade-In Loan Per Gasoline Level Description Of Auto Liters 1/ Weight 2/ Year Price 2/ Value 2/ Value 2/ Gallon 1/ Usage 3/
$ 25,000 Sedan, 4 Door 1.8 2,544 lbs. 1999 $ 5,600 $ 4,225 $ 3,799 22 682 Gallons 4 cylinder, 5 Speed $ 50,000 Sedan, 4 Door 2.4 3,131 lbs. 2000 $11,475 $ 9,450 $ 8,429 23 652 Gallons 4 Cylinder, Automatic $ 75,000 Sedan, 4 Door 3.0 3,309 lbs. 2003 $17,925 $15,350 $13,677 21 714 Gallons 6 Cylinder, Automatic Coupe, 2 Door 1.9 2,425 lbs. 2000 $ 6,500 $ 5,000 $ 4,530 24 313 Gallons 4 Cylinder, Automatic $100,000 Sedan, 4 Door 3.0 3,494 lbs. 2002 $27,825 $24,075 $21,379 20 750 Gallons 6 Cylinder, Automatic Sedan, 4 Door 3.0 3,331 lbs. 2000 $ 6,925 $ 5,325 $ 4,766 20 375 Gallons 6 Cylinder, Automatic $150,000 Sedan, 4 Door 4.0 3,955 lbs. 2002 $33,925 $29,350 $25,711 19 789 Gallons 8 Cylinder, Automatic Sedan, 4 Door 3.8 3,440 lbs. 1999 $ 7,050 $ 5,400 $ 4,822 20 375 Gallons 6 Cylinder, Automatic
1/ Gas Mileage Guide, EPA fuel economy estimates for city driving, U.S. Department of Energy. 2/ National Automobile Dealers Association Used Car Guide. 3/ Assumes 15,000 miles driven for all vehicles, except second cars, which are assumed to be driven 7,500 miles.

Chapter IV: How Do Tax Burdens In Washington, D.C., Compare With Those In The Largest City In Each State?
Tax Rates and Tax Burdens in the District of Columbia: A Nationwide Comparison
Page 27
CHAPTER IV
How Do Tax Burdens In Washington, D.C., Compare
With Those In The Largest City In Each State?
The nation's capital, Washington, D.C., is unique in many respects. It has a special status in which the day-to-day activities and functions of state, county, city and special districts are combined in one governmental unit. The Mayor and the 13-member District of Columbia Council combine the functions of a state legislature, a county board of commissioners and a city council. Due to this combination of responsibilities, the District has the taxing powers of a state, a county and a municipality, although these powers are limited by actions of the federal government. The graduated income tax, the general sales and use tax and the per gallon gasoline tax are all comparable in form to those levied by most states. The property tax based on assessed value is similar to the type levied in cities and counties. As a result, the tax burden of District residents should be compared to the combined state and local burdens borne by residents of other large cities.
The burden of each of the four major taxes for Washington, D.C. is compared with the 51-
city average at all income levels in Table 11, page 30. The difference between the Washington, D.C. tax burden and the 51-city average increases, on a percentage basis, as the income level rises. This is because the District has a slightly more progressive tax system than the average of the 51 cities in the study. The District of Columbia ranks thirty-five at the $25,000 income level; nineteenth at the $50,000 income level; seventeenth at the $75,000 and thirteenth at the $100,000 income level; and fourteenth at the $150,000 income level.
The District of Columbia has a relatively high percentage of low-income taxpayers, which
limits the District's revenue-raising capacity. Despite these limitations, the District of Columbia must perform and provide funding for functions usually provided at both state and local levels of government. The non-municipal functions include responsibility for welfare programs, physical and mental health care, and maintenance of the public education system.
Individual Income Tax
The individual income tax burden for Washington, D.C. is substantially above the average for the 44 cities that levy an individual income tax at all income levels. Washington, D.C. levies an individual income tax with three rates (for tax year 2004): 5 percent on the first $10,000 of taxable income; 7.5 percent on the next $20,000 of taxable income; and 9.0 percent on taxable income over $30,000. For tax year 2004 personal exemptions of $1,370 per dependent were allowed, as well as a $1,370 exemption for the filer and spouse, respectively. A standard
Chapter IV: How Do Tax Burdens In Washington, D.C., Compare With Those In The Largest City In Each State?
Tax Rates and Tax Burdens in the District of Columbia: A Nationwide Comparison
Page 28
deduction of $2,000 ($1,000 for married-separate) was in effect for the period of this study. Itemized deductions are the same as those allowed in computing the federal income tax, but the District does not allow the deduction of its own individual income tax. Washington, D.C. also has "circuit-breaker" property tax relief programs for both elderly and non-elderly qualified homeowners and renters, as well as a low-income credit, which eliminates the District income tax for taxpayers with no federal income tax liability.
The individual income tax burden for Washington, D.C. is substantially above the average
of the 51 cities at all five income levels studied according to Table 11. The high income tax burden on those subject to the tax is due in part to restrictions on the individual income tax base of the District. Federal law prohibits Washington, D.C. from taxing the earnings of non-residents working within the city, a restriction not imposed on any other city in the nation. As a result of this, the District of Columbia taxes residents at higher rates than would otherwise be the case since approximately 67 percent of the wages and salaries earned in the District of Columbia are earned by non-residents.
Real Property Tax
Property tax burdens in the District of Columbia are below the 51-city average at all income levels according to Table 11. A slightly higher than average housing-to-income ratio (Table 5) is offset by a low property tax rate (Table 4) combined with a $30,000 homestead deduction, which helps reduce the Washington, D.C., property tax burden. As of October 1, 2005, the homestead deduction will increased to $60,000 and the District of Columbia’s 12 percent cap on the growth of homestead tax liability will drop to 10 percent.
The tax on residential property in the District of Columbia is based on the assessed value of
the property. All property is assessed at a statutory level of 100 percent of its estimated market value. The tax rate on residential owner-occupied property in the District of Columbia is $0.96 per $100 for 2004. Homeowners deduct a homestead exemption of $30,000 from the assessed base, not the tax bill, before calculation of the property tax for all owner-occupied dwellings. The calculation will respond to the 12 percent cap on growth of the liability. As of October 1, 2005, the tax rate for Class One will be lowered to $.92 per $100 of assessed value with a 10 percent cap.
The calculations in this study are based on a single year and do not adjust for capped
growth. Despite the assumption of regressivity present in the housing value assumptions (Chapter I), the computed property tax for Washington, D.C., is slightly progressive because of the homestead deduction which reduces the property tax of each homeowner by $364.80 (at the $0.96 rate). The burden is 2.3 percent at the $25,000 income level and 2.7 percent at $150,000 income.
Sales Tax The District of Columbia levies a sales tax with five different rates. This rate structure is

Chapter IV: How Do Tax Burdens In Washington, D.C., Compare With Those In The Largest City In Each State?
Tax Rates and Tax Burdens in the District of Columbia: A Nationwide Comparison
Page 29
utilized, in part, to take advantage of the District's special status as a tourist center and to increase the contribution of non-residents working in the city. These differential rates illustrate the concept of tax exporting. The table below details the sales tax rates in effect at the end of 2004.
Items Sales Tax Rate Tangible Personal Property 5.75% Alcohol for off premises consumption 9% Restaurant Meals, Take-Out Food, rental cars, Telephone calling cards 10% Commercial Parking 12% Hotel, Motel Rooms 14.5%
Items exempt from the District of Columbia sales tax include groceries and prescription drugs.
The sales tax burden in the District of Columbia is lower than the 51-City average at all the
income levels.
Automobile Taxes
Washington, D.C. taxes gasoline and requires registration fees for automobile owners. The gasoline tax rate is 20 cents per gallon. Registration fees of $72 on cars weighing less than 3,500 pounds and $115 on cars equal to or greater than 3,500 pounds were in effect for the period of this study. The District of Columbia does not impose an annual excise tax or personal property tax on automobiles.
Washington, D.C., automobile tax burdens are below the 51-city average at all but the
lowest income level as shown in Table 11. High registration fees and a flat gasoline tax rate cause the District auto tax burden to be regressive. Washington, D.C., automobile tax burdens represent 1.0 percent of income at $25,000 and 0.3 percent at $150,000.
Summary
As noted above, the tax burden of the District of Columbia is influenced by many factors. One of the major reasons District of Columbia tax burdens are above the average is the restriction on the District's taxing authority mandated by Congress. Factors such as the prohibition on taxing non-resident income, plus the large percentage of tax-exempt properties (over fifty-seven percent of District acreage is tax exempt), have combined to create difficult conditions under which to raise revenues to operate the city. Some of the positive factors, which tend to increase the District tax base, include substantial tourist activity as well as large volume of business and lobbying activity generated by the federal presence.
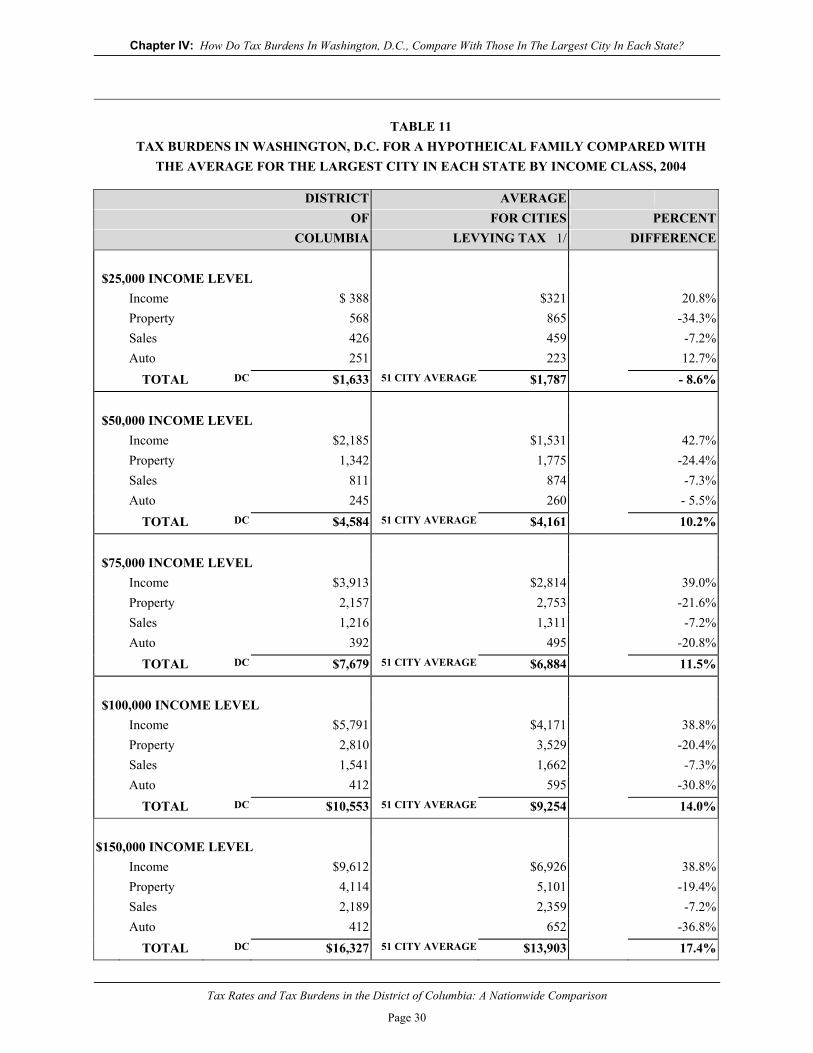
Chapter IV: How Do Tax Burdens In Washington, D.C., Compare With Those In The Largest City In Each State?
Tax Rates and Tax Burdens in the District of Columbia: A Nationwide Comparison
Page 30
TABLE 11 TAX BURDENS IN WASHINGTON, D.C. FOR A HYPOTHEICAL FAMILY COMPARED WITH
THE AVERAGE FOR THE LARGEST CITY IN EACH STATE BY INCOME CLASS, 2004
DISTRICT AVERAGE OF FOR CITIES PERCENT
COLUMBIA LEVYING TAX 1/ DIFFERENCE
$25,000 INCOME LEVEL Income $ 388 $321 20.8%Property 568 865 -34.3%Sales 426 459 -7.2%Auto 251 223 12.7%
TOTAL DC $1,633 51 CITY AVERAGE $1,787 - 8.6%
$50,000 INCOME LEVEL Income $2,185 $1,531 42.7%Property 1,342 1,775 -24.4%Sales 811 874 -7.3%Auto 245 260 - 5.5%
TOTAL DC $4,584 51 CITY AVERAGE $4,161 10.2%
$75,000 INCOME LEVEL Income $3,913 $2,814 39.0%Property 2,157 2,753 -21.6%Sales 1,216 1,311 -7.2%Auto 392 495 -20.8%
TOTAL DC $7,679 51 CITY AVERAGE $6,884 11.5%
$100,000 INCOME LEVEL Income $5,791 $4,171 38.8%Property 2,810 3,529 -20.4%Sales 1,541 1,662 -7.3%Auto 412 595 -30.8%
TOTAL DC $10,553 51 CITY AVERAGE $9,254 14.0%
$150,000 INCOME LEVEL Income $9,612 $6,926 38.8%Property 4,114 5,101 -19.4%Sales 2,189 2,359 -7.2%Auto 412 652 -36.8%
TOTAL DC $16,327 51 CITY AVERAGE $13,903 17.4%
Chapter V: Why Do Tax Burdens Differ From One City To Another?
Tax Rates and Tax Burdens in the District of Columbia: A Nationwide Comparison
Page 31
1/ Income and sales averages are based on cities actually levying tax.. As a result, the overall average is not equal to the sum of the averages for each separate tax type.
CHAPTER V
Why Do Tax Burdens Differ From One City To Another?
In the preceding chapters, the differences in tax burdens for the largest city in each state in the United States were discussed. The assumptions used to compute the various tax burdens will affect to some extent the relative tax burdens for the 51 cities. This is especially true for the real estate tax, because both the methodology used to derive housing values and the relative housing values from one income level to another and from one city to another are important determinants of the real property tax burden. However, no matter what set of assumptions is used in such a study, there will be substantial tax burden differences from one city to another. Some of the reasons for these differences are as follows:
1) This study only measures major state and local tax burdens for individuals.
Business tax burdens also differ substantially from one city to another. Many cities, because of a large manufacturing base or because of a dominant industry, can shift a large portion of the tax burden away from individuals to businesses. Cities in natural resource states, for example, may shift a substantial portion of the tax burden to industry, thus exporting, to some extent, their local government tax burden. Convention and tourist activity in cities such as Chicago, Washington, D.C., New York City and Las Vegas can help reduce local tax burdens by increasing sales tax, gasoline tax and parking tax revenues from non-residents, another form of tax exporting.
2) Service demands in each of the 51 cities may vary a great deal. Cold weather services, such as snow removal, in northern cities may increase costs. Furthermore, citizens of some cities simply desire, or are accustomed to, more government services than residents of other cities.
3) The costs of providing services may differ substantially from one city to
another. Wage levels, efficiency of the work force and costs of overhead items, such as utilities, may be very different.
4) The tax base of each city is different. Cities that have a relatively large
percentage of employed residents will normally have a broad tax base. This type of city can levy taxes at lower rates than can those with low levels
of employment or high levels of exempt property. External forces such as the federal presence in Washington, D.C. can restrict the tax base. The tax base

Chapter V: Why Do Tax Burdens Differ From One City To Another?
Tax Rates and Tax Burdens in the District of Columbia: A Nationwide Comparison
Page 32
can also be defined by the scope of a particular tax. For example, it is desirable from a social point of view to exempt groceries from the sales tax; however, such an exemption can narrow the sales tax base and may require a higher sales tax rate in order to raise sufficient revenues.
5) The proportion of public versus private services may differ from one city to
another. Some cities may provide services such as garbage collection and hospital care, while in other cities; the private sector may perform these services for a fee.
As a result, a city in which the private sector performs such functions may
have a lower tax burden than one in which these functions are performed by the city. In these instances, the fees charged by the private sector represent payments by individuals for public services that are not reflected in tax burdens.
6) Certain taxes that are not discussed in this study may affect state and local tax
burdens. Taxes not covered by the study, which are levied on individuals, include liquor and cigarette taxes and taxes on public utility bills.
7) The state and local tax burdens in this study are computed without regard to
their effect on the federal tax burden of individuals in the respective cities. To some extent, high state and local income and property taxes can be used to partially alleviate federal tax burdens through itemized deductions.
As noted in Chapter V, the number and kind of public services each city provides
necessarily has a bearing on the amount of revenue that must be raised. The tax burden comparisons in this report must be studied in the context of these differing conditions.
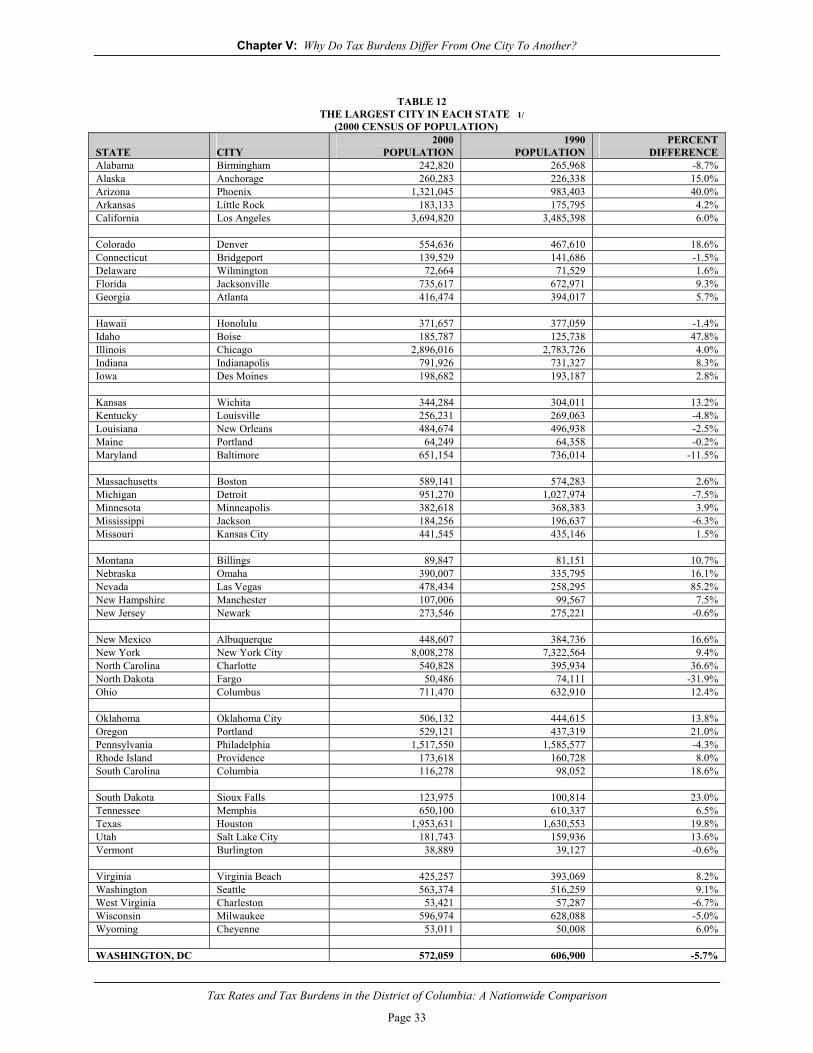
Chapter V: Why Do Tax Burdens Differ From One City To Another?
Tax Rates and Tax Burdens in the District of Columbia: A Nationwide Comparison
Page 33
TABLE 12
THE LARGEST CITY IN EACH STATE 1/ (2000 CENSUS OF POPULATION)
STATE
CITY
2000 POPULATION
1990 POPULATION
PERCENT DIFFERENCE
Alabama Birmingham 242,820 265,968 -8.7% Alaska Anchorage 260,283 226,338 15.0% Arizona Phoenix 1,321,045 983,403 40.0% Arkansas Little Rock 183,133 175,795 4.2% California Los Angeles 3,694,820 3,485,398 6.0% Colorado Denver 554,636 467,610 18.6% Connecticut Bridgeport 139,529 141,686 -1.5% Delaware Wilmington 72,664 71,529 1.6% Florida Jacksonville 735,617 672,971 9.3% Georgia Atlanta 416,474 394,017 5.7% Hawaii Honolulu 371,657 377,059 -1.4% Idaho Boise 185,787 125,738 47.8% Illinois Chicago 2,896,016 2,783,726 4.0% Indiana Indianapolis 791,926 731,327 8.3% Iowa Des Moines 198,682 193,187 2.8% Kansas Wichita 344,284 304,011 13.2% Kentucky Louisville 256,231 269,063 -4.8% Louisiana New Orleans 484,674 496,938 -2.5% Maine Portland 64,249 64,358 -0.2% Maryland Baltimore 651,154 736,014 -11.5% Massachusetts Boston 589,141 574,283 2.6% Michigan Detroit 951,270 1,027,974 -7.5% Minnesota Minneapolis 382,618 368,383 3.9% Mississippi Jackson 184,256 196,637 -6.3% Missouri Kansas City 441,545 435,146 1.5% Montana Billings 89,847 81,151 10.7% Nebraska Omaha 390,007 335,795 16.1% Nevada Las Vegas 478,434 258,295 85.2% New Hampshire Manchester 107,006 99,567 7.5% New Jersey Newark 273,546 275,221 -0.6% New Mexico Albuquerque 448,607 384,736 16.6% New York New York City 8,008,278 7,322,564 9.4% North Carolina Charlotte 540,828 395,934 36.6% North Dakota Fargo 50,486 74,111 -31.9% Ohio Columbus 711,470 632,910 12.4% Oklahoma Oklahoma City 506,132 444,615 13.8% Oregon Portland 529,121 437,319 21.0% Pennsylvania Philadelphia 1,517,550 1,585,577 -4.3% Rhode Island Providence 173,618 160,728 8.0% South Carolina Columbia 116,278 98,052 18.6% South Dakota Sioux Falls 123,975 100,814 23.0% Tennessee Memphis 650,100 610,337 6.5% Texas Houston 1,953,631 1,630,553 19.8% Utah Salt Lake City 181,743 159,936 13.6% Vermont Burlington 38,889 39,127 -0.6% Virginia Virginia Beach 425,257 393,069 8.2% Washington Seattle 563,374 516,259 9.1% West Virginia Charleston 53,421 57,287 -6.7% Wisconsin Milwaukee 596,974 628,088 -5.0% Wyoming Cheyenne 53,011 50,008 6.0% WASHINGTON, DC 572,059 606,900 -5.7%

Chapter V: Why Do Tax Burdens Differ From One City To Another?
Tax Rates and Tax Burdens in the District of Columbia: A Nationwide Comparison
Page 34
1/ Source: U.S. Census Bureau, Census 2000. Table DP-1. Profile of General Demographic Characteristics: 2000.

Part II
A Comparison of Selected Tax Rates In The
District of Columbia With Those In The 50 States
As of January 1, 2005

Part II: A Comparison of Selected Tax Rates In The District of Columbia With Those In The 50 States
Tax Rates and Tax Burdens in the District of Columbia: A Nationwide Comparison
Page 36
Overview As can be seen from a review of the major taxes compared in this report, the tax rates in the
District of Columbia are among the highest in the nation. Of the 13 taxes compared, District tax categories that are higher than in most of the states include: cigarette; corporate income; individual income; deed recordation; motor vehicle excise; motor vehicle registration fees; and sales and use. In four tax categories -- insurance premiums, beer, dessert wine, and distilled spirits, -- the District has lower tax rates than most states. The District’s motor fuel tax rate is very close to average.
TABLE 13
COMPARISON OF SELECTED STATE TAX RATES NUMBER OF JURISDICTIONS
TAX
LEVYING TAX
LOWER THAN DC
SAME AS DC
HIGHER THAN DC
Individual Income 43 1/
37 2/
1 5 2/
Corporate Income 44
42 0 2
Insurance 48
5 0 43
Sales and Use 45
25 0 20
Beer 50
7 1 42
Light Wine 46
6 2 38
Distilled Spirits 32
0 1 31
Cigarette 50
34 3 13
Motor Fuel 50
20 4 26
Motor Vehicle Excise Light Cars < 3,500 lbs. 46
30 9 7
Heavy Cars > 3,500 lbs. 46
44 2 0
Motor Vehicle Registration 3/ 49
49 0 0
Deed Recordation 36
36 0 0
1/ Includes two states, which tax dividends and/or interest only. 2/ Comparisons are based on highest comparable rate in each jurisdiction. Those based on federal liability are not included. 3/ Heavy cars (> 3,500 lbs.)

Part II: A Comparison of Selected Tax Rates In The District of Columbia With Those In The 50 States
Tax Rates and Tax Burdens in the District of Columbia: A Nationwide Comparison
Page 37
TABLE 14
INDIVIDUAL INCOME TAX WASHINGTON METROPOLITAN AREA
JANUARY 1, 2005
PERSONAL EXEMPTIONS
(CREDITS)
TAXABLE INCOME
RATES
DISTRICT OF COLUMBIA Single $1,370
Married Filing Separately $1,370
Married Filing Jointly $2,740
Head of Household $2,740
Dependent (additional) $1,370
Blind (additional) $1,370
Age 65 and over (additional) $1,370
Standard 1/
$0 - $10,000 $10,000-$30,000
Over $30,000
5.0% $ 500 + 7.5% of excess > $10,000 $2,000 + 9.0% of excess > $30,000
MARYLAND 2/
Single $2,400
Married Filing Separately $2,400
Married Filing Jointly $4,800
Head of Household $2,400
Dependent (additional) $2,400
Blind (additional) $1,000
Age 65 and over (additional) $1,000
Standard 3/
$0 - $1,000 $1,001-$2,000 $2,001-$3,000 Over $3,000
2.0% $20 + 3.00% of excess > $1,000 $50 + 4.00% of excess > $2,000 $90 + 4.75% of excess > $3,000
VIRGINIA
Single $ 800
Married Filing Separately $ 800
Married Filing Jointly $1,600
Head of Household $ 800
Dependent (additional) $ 800
Blind (additional) $ 800
Age 65 and over (additional) $ 800
Standard 4/
$0 - $3,000 $3,001-$5,000 $5,001-$17,000 Over $17,000
2.0% $ 60 + 3.00% of excess > $ 3,000 $ 120 + 5.00% of excess > $ 5,000 $ 720 + 5.75% of excess > $17,000
1/ Married persons filing separately - $1,000; all others - $2,000. 2/ Maryland rates do not include local rates that may be as low as 1.25% in Worchester County and as much as 3.2% in Howard, Montgemery and Prince George’s Counties. BaltimoreCity, which is used in this study, local rate is 3.05%. 3/ 15% of Maryland AGI not to exceed $2,000 ($4,000 for joint and head of household returns and those filing as qualifying widow(er) with dependent child). The minimum is $1,500 for single, married filing separately and dependent taxpayers. All others are allowed a minimum of $3,000. 4/ Single - $3,000; married persons filing separately - $2,500; and married persons filing jointly or combined separate - $5,000.
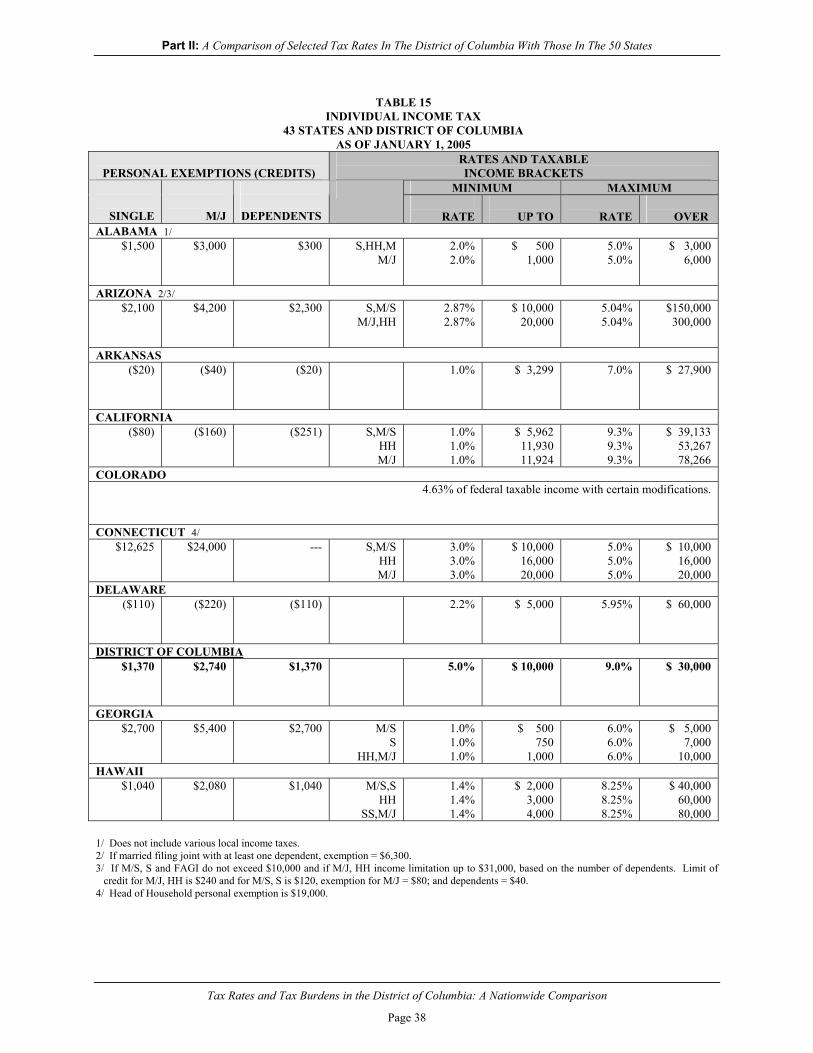
Part II: A Comparison of Selected Tax Rates In The District of Columbia With Those In The 50 States
Tax Rates and Tax Burdens in the District of Columbia: A Nationwide Comparison
Page 38
TABLE 15
INDIVIDUAL INCOME TAX 43 STATES AND DISTRICT OF COLUMBIA
AS OF JANUARY 1, 2005
PERSONAL EXEMPTIONS (CREDITS) RATES AND TAXABLE INCOME BRACKETS
MINIMUM MAXIMUM
SINGLE
M/J
DEPENDENTS
RATE
UP TO
RATE
OVER ALABAMA 1/
$1,500 $3,000 $300 S,HH,MM/J
2.0% 2.0%
$ 5001,000
5.0% 5.0%
$ 3,0006,000
ARIZONA 2/3/ $2,100 $4,200
$2,300
S,M/S
M/J,HH2.87% 2.87%
$ 10,00020,000
5.04% 5.04%
$150,000300,000
ARKANSAS ($20) ($40) ($20) 1.0% $ 3,299 7.0% $ 27,900
CALIFORNIA ($80) ($160) ($251) S,M/S
HH M/J
1.0% 1.0% 1.0%
$ 5,962 11,930 11,924
9.3% 9.3% 9.3%
$ 39,133 53,267 78,266
COLORADO 4.63% of federal taxable income with certain modifications.
CONNECTICUT 4/ $12,625 $24,000 --- S,M/S
HH M/J
3.0% 3.0% 3.0%
$ 10,000 16,000 20,000
5.0% 5.0% 5.0%
$ 10,000 16,000 20,000
DELAWARE ($110) ($220) ($110) 2.2% $ 5,000 5.95% $ 60,000
DISTRICT OF COLUMBIA $1,370 $2,740 $1,370 5.0% $ 10,000 9.0% $ 30,000
GEORGIA $2,700 $5,400 $2,700 M/S
S HH,M/J
1.0% 1.0% 1.0%
$ 500 750
1,000
6.0% 6.0% 6.0%
$ 5,000 7,000
10,000HAWAII
$1,040 $2,080 $1,040 M/S,SHH
SS,M/J
1.4% 1.4% 1.4%
$ 2,000 3,000 4,000
8.25% 8.25% 8.25%
$ 40,000 60,000 80,000
1/ Does not include various local income taxes. 2/ If married filing joint with at least one dependent, exemption = $6,300. 3/ If M/S, S and FAGI do not exceed $10,000 and if M/J, HH income limitation up to $31,000, based on the number of dependents. Limit of credit for M/J, HH is $240 and for M/S, S is $120, exemption for M/J = $80; and dependents = $40. 4/ Head of Household personal exemption is $19,000.

Part II: A Comparison of Selected Tax Rates In The District of Columbia With Those In The 50 States
Tax Rates and Tax Burdens in the District of Columbia: A Nationwide Comparison
Page 39
TABLE 15 (continued)
INDIVIDUAL INCOME TAX 43 STATES AND DISTRICT OF COLUMBIA
AS OF JANUARY 1, 2005
PERSONAL EXEMPTIONS (CREDITS) RATES AND TAXABLE INCOME BRACKETS
MINIMUM MAXIMUM
SINGLE
M/J
DEPENDENTS
RATE
UP TO
RATE
OVER IDAHO 1/
$3,050 $6,100 $3,050 1.6%
$ 1,104 7.8%
$ 22,074
ILLINOIS $2,000 $4,000
$2,000
3.0% of taxable net income.
INDIANA 2/ $1,000 $2,000 $2,000 3.4% of federal adjusted gross income.
IOWA ($40) ($80) ($40) 0.36% $ 1,224 8.98% $ 55,080
KANSAS $2,250 $4,500 $2,250 S.M/S
M/J3.5% 3.5%
$ 15,00030,000
6.45% 6.45%
$ 30,00060,000
KENTUCKY ($20) ($40) ($20) 2.0%
$ 3,000
6.0%
$ 8,000
LOUISIANA $4,500 $9,000 $1,000 2.0%
$ 12,500 6.0%
$ 25,000
MAINE $2,850 $5,700 $2,850 S,M/S
HH M/J
2.0% 2.0% 2.0%
$ 4,350 6,550 8,700
8.5% 8.5% 8.5%
$ 17,350 26,050 34,700
MARYLAND 2/ $2,400 $4,800 $2,400 2.0%
$ 1, 000 4.75%
$ 3,000
MASSACHUSETTS $4,400 $8,800 $1,000 5.3% of taxable income.
MICHIGAN 2/ $3,100 $6,200 $600 4.0% of federal adjusted gross income.
1/ Does not include filing fee of $10. 2/ Does not include various local income taxes.
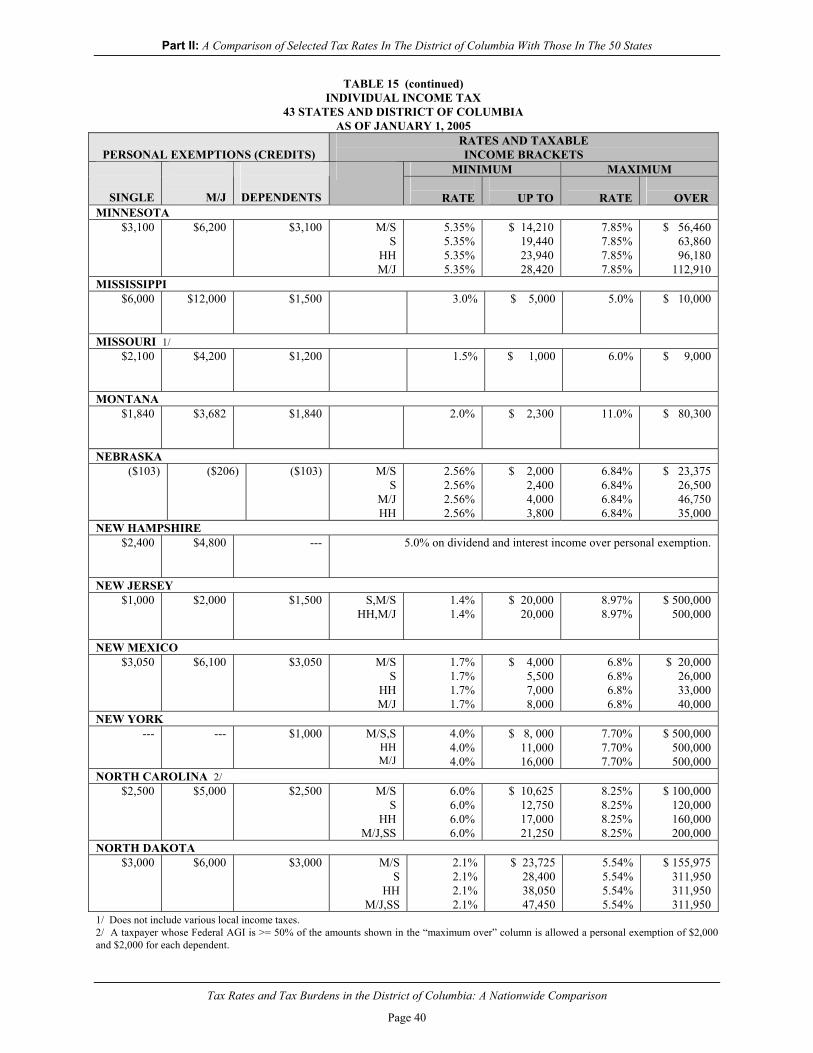
Part II: A Comparison of Selected Tax Rates In The District of Columbia With Those In The 50 States
Tax Rates and Tax Burdens in the District of Columbia: A Nationwide Comparison
Page 40
TABLE 15 (continued) INDIVIDUAL INCOME TAX
43 STATES AND DISTRICT OF COLUMBIA AS OF JANUARY 1, 2005
PERSONAL EXEMPTIONS (CREDITS)
RATES AND TAXABLE INCOME BRACKETS
MINIMUM MAXIMUM
SINGLE
M/J
DEPENDENTS
RATE
UP TO
RATE
OVER MINNESOTA
$3,100 $6,200 $3,100 M/S S
HHM/J
5.35% 5.35% 5.35% 5.35%
$ 14,21019,440 23,940 28,420
7.85% 7.85% 7.85% 7.85%
$ 56,46063,860 96,180
112,910 MISSISSIPPI
$6,000 $12,000
$1,500
3.0% $ 5,000 5.0% $ 10,000
MISSOURI 1/ $2,100 $4,200 $1,200 1.5% $ 1,000 6.0% $ 9,000
MONTANA $1,840 $3,682 $1,840 2.0% $ 2,300 11.0% $ 80,300
NEBRASKA ($103) ($206) ($103) M/S
SM/J HH
2.56% 2.56% 2.56% 2.56%
$ 2,0002,400 4,000 3,800
6.84% 6.84% 6.84% 6.84%
$ 23,37526,500 46,750 35,000
NEW HAMPSHIRE $2,400 $4,800 --- 5.0% on dividend and interest income over personal exemption.
NEW JERSEY $1,000 $2,000 $1,500 S,M/S
HH,M/J 1.4% 1.4%
$ 20,000 20,000
8.97% 8.97%
$ 500,000 500,000
NEW MEXICO $3,050 $6,100 $3,050 M/S
S HH M/J
1.7% 1.7% 1.7% 1.7%
$ 4,000 5,500 7,000 8,000
6.8% 6.8% 6.8% 6.8%
$ 20,000 26,000 33,000
40,000 NEW YORK
--- --- $1,000 M/S,S HH M/J
4.0% 4.0% 4.0%
$ 8, 000 11,000 16,000
7.70% 7.70% 7.70%
$ 500,000 500,000 500,000
NORTH CAROLINA 2/ $2,500 $5,000 $2,500 M/S
S HH
M/J,SS
6.0% 6.0% 6.0% 6.0%
$ 10,625 12,750 17,000 21,250
8.25% 8.25% 8.25% 8.25%
$ 100,000 120,000 160,000 200,000
NORTH DAKOTA $3,000 $6,000 $3,000 M/S
S HH
M/J,SS
2.1% 2.1% 2.1% 2.1%
$ 23,725 28,400 38,050 47,450
5.54% 5.54% 5.54% 5.54%
$ 155,975 311,950 311,950 311,950
1/ Does not include various local income taxes. 2/ A taxpayer whose Federal AGI is >= 50% of the amounts shown in the “maximum over” column is allowed a personal exemption of $2,000 and $2,000 for each dependent.

Part II: A Comparison of Selected Tax Rates In The District of Columbia With Those In The 50 States
Tax Rates and Tax Burdens in the District of Columbia: A Nationwide Comparison
Page 41
TABLE 15 (continued) INDIVIDUAL INCOME TAX
43 STATES AND DISTRICT OF COLUMBIA AS OF JANUARY 1, 2005
PERSONAL EXEMPTIONS (CREDITS)
RATES AND TAXABLE INCOME BRACKETS
MINIMUM MAXIMUM
SINGLE
M/J
DEPENDENTS
RATE
UP TO
RATE
OVER OHIO 1/
$1,250
$2,500
$1,250 0.743% $ 5,000 7.5% $200,000
OKLAHOMA Without federal deduction
$1,000 $2,000 $1,000 S,M/S SS,HH,M/J
0.5% 0.5%
$ 1,000 2,000
6.65% 6.65%
$ 10,000 21,000
With federal deduction $1,000 $2,000 $1,000 S,M/S
SS,HH,M/J 0.5% 0.5%
$ 1,000 2,000
10.0% 10.0%
$ 16,000 24,000
OREGON 1/
($151) ($302) ($151) S,M/S HH,M/J
5.0% 5.0%
$ 2,600 5,200
9.0% 9.0%
$ 6,500 13,000
PENNSYLVANIA 1/
--- --- --- 3.07% of specified classes of taxable income is effective rate.
RHODE ISLAND $3,050 $6,100 $3,050 M/S
S HH M/J
3.75% 3.75% 3.75% 3.75%
$ 23,725 28,400 38,050 47,450
9.9% 9.9%
9.9% 9.9%
$ 155,975 311,950 311,950 311,950
SOUTH CAROLINA $3,050 $6,100 $3,050
2/ 2.5% $ 2,460
7.0%
$ 12,300
TENNESSEE $1,250 $2,500 --- 6.0% on interest and dividend income.
UTAH $2,250 $4,300 $2,250 M/S,S
HH,M/J 2.3% 2.3%
$ 863 1,726
7.0% 7.0%
$ 4,313 8,626
VERMONT $3,100 $6,200 $3,100 3.6% $29,050 9.5% $319,100
VIRGINIA $800 $1,600 $800 2.0%
$ 3,000 5.75%
$ 17,000
WEST VIRGINIA $2,000 $4,000 $2,000 M/S
S,SS,HH,M/J 3.0% 3.0%
$ 5,000 10,000
6.5% 6.5%
$ 30,000 60,000
WISCONSIN
$700
$1,400 $700 M/S HH,S
M/J
4.6% 4.6% 4.6%
$ 5,890 8,840
11,780
6.75% 6.75% 6.75%
$ 88,390 132,580 176,770
1/ Does not include various local income taxes. 2/ Additional $3,050 for child under 6.

Part II: A Comparison of Selected Tax Rates In The District of Columbia With Those In The 50 States
Tax Rates and Tax Burdens in the District of Columbia: A Nationwide Comparison
Page 42
TABLE 16
CHARACTERISTICS OF STATE INDIVIDUAL INCOME TAXES
JURISDICTION
FEDERAL INCOME TAX DEDUCTIBLE
NO INCOME TAX
WITH-HOLDING
FEDERAL DEFINITION OF INCOME FOR STATE TAX BASE
STATE DEFINITION OF INCOME FOR STATE TAX BASE
FEDERAL TAX
LIABILITY FOR STATE TAX BASE
ALABAMA AL AL AL
ALASKA AK
ARIZONA AZ AZ
ARKANSAS AR AR
CALIFORNIA CA CA
COLORADO CO CO
CONNECTICUT CT CT
DELAWARE DE DE
DISTRICT OF COLUMBIA
DC
DC
FLORIDA FL
GEORGIA GA GA
HAWAII HI HI
IDAHO ID ID
ILLINOIS IL IL
INDIANA IN IN
IOWA IA IA IA
KANSAS KS KS
KENTUCKY KY KY
LOUISIANA LA LA LA
MAINE ME ME
MARYLAND MD MD
MASSACHUSETTS MA MA
MICHIGAN MI MI
MINNESOTA MN MN
MISSISSIPPI MS MS
MISSOURI MO MO MO
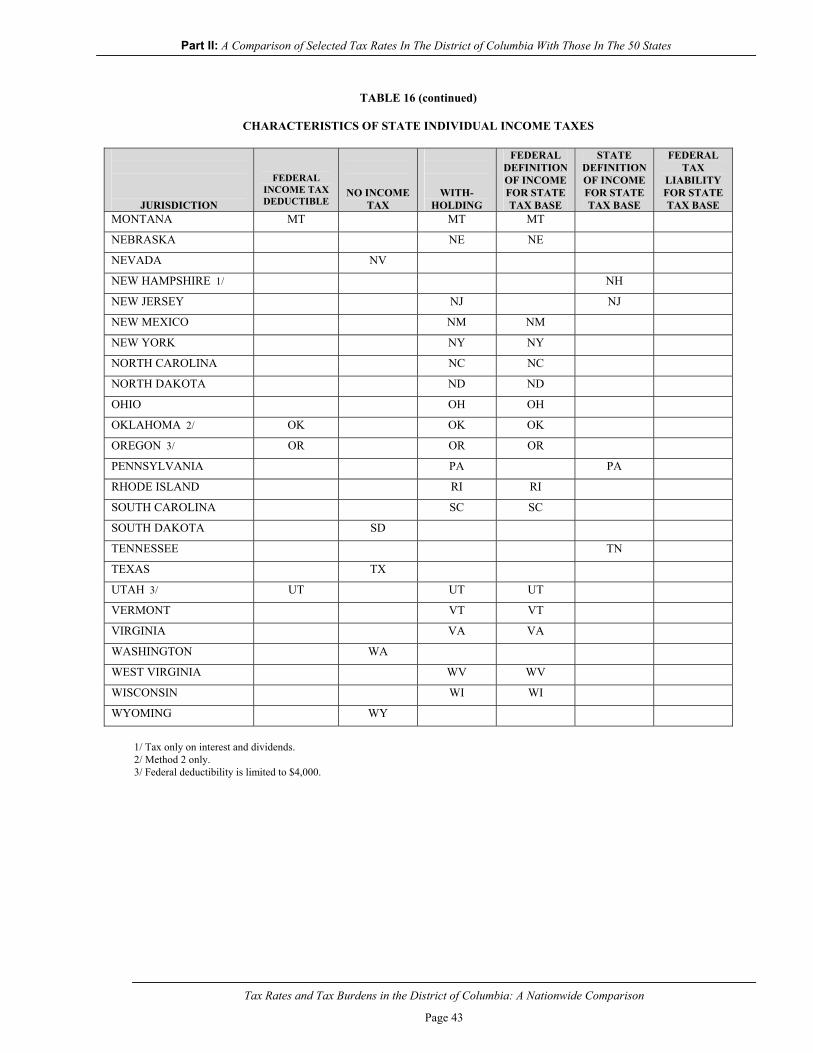
Part II: A Comparison of Selected Tax Rates In The District of Columbia With Those In The 50 States
Tax Rates and Tax Burdens in the District of Columbia: A Nationwide Comparison
Page 43
TABLE 16 (continued)
CHARACTERISTICS OF STATE INDIVIDUAL INCOME TAXES
JURISDICTION
FEDERAL INCOME TAX DEDUCTIBLE
NO INCOME TAX
WITH-HOLDING
FEDERAL DEFINITION OF INCOME FOR STATE TAX BASE
STATE DEFINITION OF INCOME FOR STATE TAX BASE
FEDERAL TAX
LIABILITY FOR STATE TAX BASE
MONTANA MT MT MT
NEBRASKA NE NE
NEVADA NV
NEW HAMPSHIRE 1/ NH
NEW JERSEY NJ NJ
NEW MEXICO NM NM
NEW YORK NY NY
NORTH CAROLINA NC NC
NORTH DAKOTA ND ND
OHIO OH OH
OKLAHOMA 2/ OK OK OK
OREGON 3/ OR OR OR
PENNSYLVANIA PA PA
RHODE ISLAND RI RI
SOUTH CAROLINA SC SC
SOUTH DAKOTA SD
TENNESSEE TN
TEXAS TX
UTAH 3/ UT UT UT
VERMONT VT VT
VIRGINIA VA VA
WASHINGTON WA
WEST VIRGINIA WV WV
WISCONSIN WI WI
WYOMING WY
1/ Tax only on interest and dividends. 2/ Method 2 only. 3/ Federal deductibility is limited to $4,000.
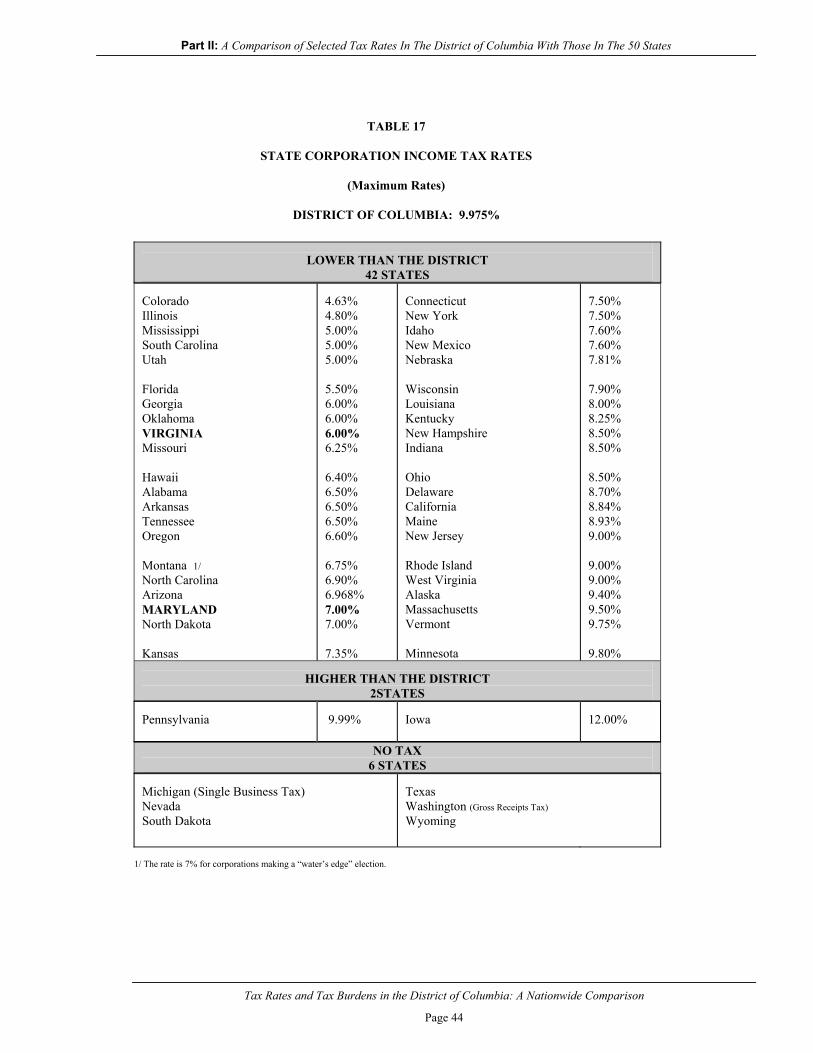
Part II: A Comparison of Selected Tax Rates In The District of Columbia With Those In The 50 States
Tax Rates and Tax Burdens in the District of Columbia: A Nationwide Comparison
Page 44
TABLE 17
STATE CORPORATION INCOME TAX RATES
(Maximum Rates)
DISTRICT OF COLUMBIA: 9.975%
LOWER THAN THE DISTRICT
42 STATES Colorado Illinois Mississippi South Carolina Utah Florida Georgia Oklahoma VIRGINIA Missouri Hawaii Alabama Arkansas Tennessee Oregon Montana 1/ North Carolina Arizona MARYLAND North Dakota Kansas
4.63% 4.80% 5.00% 5.00% 5.00% 5.50% 6.00% 6.00% 6.00% 6.25% 6.40% 6.50% 6.50% 6.50% 6.60% 6.75% 6.90% 6.968% 7.00% 7.00% 7.35%
Connecticut New York Idaho New Mexico Nebraska Wisconsin Louisiana Kentucky New Hampshire Indiana Ohio Delaware California Maine New Jersey Rhode Island West Virginia Alaska Massachusetts Vermont Minnesota
7.50% 7.50% 7.60% 7.60% 7.81% 7.90% 8.00% 8.25% 8.50% 8.50% 8.50% 8.70% 8.84% 8.93% 9.00% 9.00% 9.00% 9.40% 9.50% 9.75% 9.80%
HIGHER THAN THE DISTRICT
2STATES Pennsylvania
9.99%
Iowa
12.00%
NO TAX 6 STATES
Michigan (Single Business Tax) Nevada South Dakota
Texas Washington (Gross Receipts Tax) Wyoming
1/ The rate is 7% for corporations making a “water’s edge” election.

Part II: A Comparison of Selected Tax Rates In The District of Columbia With Those In The 50 States
Tax Rates and Tax Burdens in the District of Columbia: A Nationwide Comparison
Page 45
TABLE 18
STATE GROSS PREMIUMS TAX RATES ON FOREIGN LIFE INSURERS
DISTRICT OF COLUMBIA: 1.7% 1/
LOWER THAN THE DISTRICT 5 STATES
South Carolina Wyoming Nebraska
0.75% 0.75% 1.00%
Ohio New York
1.40% 1.50%
HIGHER THAN THE DISTRICT 43 STATES
Connecticut Florida Indiana Iowa Tennessee Texas North Carolina 2/ Arizona Colorado Delaware Kansas Kentucky Maine MARYLAND Massachusetts Minnesota Missouri New Hampshire North Dakota Pennsylvania Rhode Island Vermont
1.75% 1.75% 1.75% 1.75% 1.75% 1.75% 1.90% 2.00% 2.00% 2.00% 2.00% 2.00% 2.00% 2.00% 2.00% 2.00% 2.00% 2.00% 2.00% 2.00% 2.00% 2.00%
Washington West Virginia 3/ Wisconsin New Jersey Georgia Louisiana 4/ Oklahoma Utah VIRGINIA Alabama California Arkansas South Dakota Alaska Hawaii Montana Idaho Mississippi New Mexico Nevada Illinois 5/
2.00% 2.00% 2.00% 2.10% 2.25% 2.25% 2.25% 2.25% 2.25% 2.30% 2.35% 2.50% 2.50% 2.70% 2.75% 2.75% 3.00% 3.00% 3.00% 3.50% 5.00%
NO TAX 2 STATES
Michigan (Single Business Tax) Oregon 1/ The District levies an additional fee 0.30 percent to offset the administrative costs of regulations. 2/ An additional 6.5% insurance regulatory charge applied to premium tax liability. An additional 1.33% premium tax for fire related insurance policies. 3/ An additional 1% premium tax for fire and casualty insurance. There is also a surcharge on fire and casualty insurance policyholders that is equal to 1% of the gross direct premium paid on each policy. 4/ Maximum rate. 5/ An additional 1% premium tax for fire or fire related insurance policies.

Part II: A Comparison of Selected Tax Rates In The District of Columbia With Those In The 50 States
Tax Rates and Tax Burdens in the District of Columbia: A Nationwide Comparison
Page 46
TABLE 19
STATE GENERAL SALES AND USE TAX RATES
DISTRICT OF COLUMBIA: 5.75%
LOWER THAN THE DISTRICT
25 STATES Nevada (4.5) Colorado (5.0%) Alabama (4.5%) Georgia (3%) Hawaii Louisiana (5%) South Dakota (2%) VIRGINIA (1%) Wyoming (1%) Missouri (5.3125%) New York (4.5%) North Carolina (3%) Oklahoma (5%)
2.00% 2.90% 4.00% 4.00% 4.00% 4.00% 4.00% 4.00% 4.00% 4.225% 4.25% 4.50% 4.50%
Utah (1.85%) Iowa (2%) Maine MARYLAND Massachusetts New Mexico 1/ North Dakota (2.0%) South Carolina Kansas (2%) Wisconsin (.6%) Nebraska (2.6875%) Arizona
4.75% 5.00% 5.00% 5.00% 5.00% 5.00% 5.00% 5.00% 5.30% 5.30% 5.50% 5.60%
HIGHER THAN THE DISTRICT
20 STATES Arkansas (5.5%) California (2.50%) Connecticut Florida Idaho Indiana Kentucky Michigan New Jersey Ohio (3%)
6.00% 6.00% 6.00% 6.00% 6.00% 6.00% 6.00% 6.00% 6.00% 6.00%
Pennsylvania (1%) Vermont West Virginia Illinois (3%) Texas (2%) Minnesota (1%) Washington (2.4%) Mississippi Rhode Island Tennessee (2.75%)
6.00% 6.00% 6.00% 6.25% 6.25% 6.50% 6.50% 7.00% 7.00% 7.00%
NO TAX
5 STATES Alaska Delaware Montana New Hampshire Oregon
1/ .5% credit within municipal boundaries => 4.5% state rate within municipalities. Note: Maximum local rates in parentheses
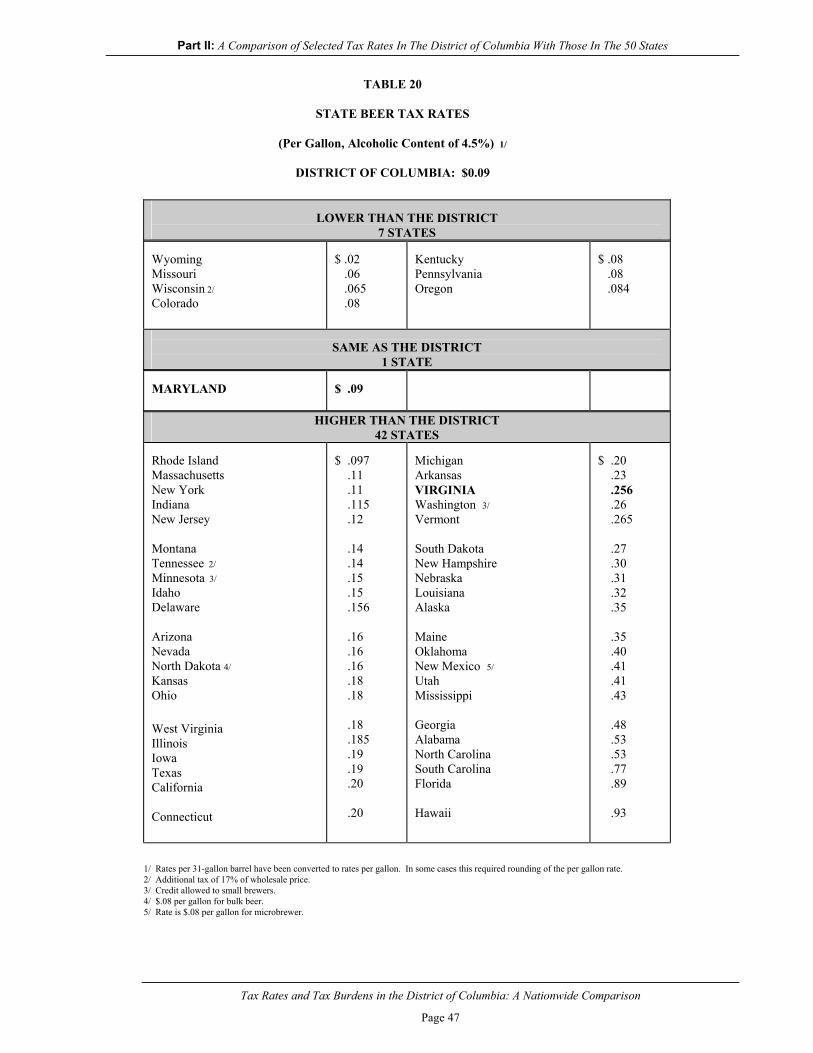
Part II: A Comparison of Selected Tax Rates In The District of Columbia With Those In The 50 States
Tax Rates and Tax Burdens in the District of Columbia: A Nationwide Comparison
Page 47
TABLE 20
STATE BEER TAX RATES
(Per Gallon, Alcoholic Content of 4.5%) 1/
DISTRICT OF COLUMBIA: $0.09
LOWER THAN THE DISTRICT
7 STATES Wyoming Missouri Wisconsin 2/ Colorado
$ .02 .06 .065 .08
Kentucky Pennsylvania Oregon
$ .08 .08 .084
SAME AS THE DISTRICT
1 STATE MARYLAND
$ .09
HIGHER THAN THE DISTRICT 42 STATES
Rhode Island Massachusetts New York Indiana New Jersey Montana Tennessee 2/ Minnesota 3/ Idaho Delaware Arizona Nevada North Dakota 4/ Kansas Ohio West Virginia Illinois Iowa Texas California Connecticut
$ .097 .11 .11 .115 .12 .14 .14 .15 .15 .156 .16 .16 .16 .18 .18 .18 .185 .19 .19 .20 .20
Michigan Arkansas VIRGINIA Washington 3/ Vermont South Dakota New Hampshire Nebraska Louisiana Alaska Maine Oklahoma New Mexico 5/ Utah Mississippi Georgia Alabama North Carolina South Carolina Florida Hawaii
$ .20 .23 .256 .26 .265 .27 .30 .31 .32 .35 .35 .40 .41 .41 .43 .48 .53 .53 .77 .89 .93
1/ Rates per 31-gallon barrel have been converted to rates per gallon. In some cases this required rounding of the per gallon rate. 2/ Additional tax of 17% of wholesale price. 3/ Credit allowed to small brewers. 4/ $.08 per gallon for bulk beer. 5/ Rate is $.08 per gallon for microbrewer.

Part II: A Comparison of Selected Tax Rates In The District of Columbia With Those In The 50 States
Tax Rates and Tax Burdens in the District of Columbia: A Nationwide Comparison
Page 48
TABLE 21
STATE LIGHT WINE TAX RATES (Per Gallon, Alcoholic Content of 12%)
DISTRICT OF COLUMBIA: $0.30
MONOPOLY STATES 4 STATES
New Hampshire Pennsylvania 1/
Utah 2/ Wyoming
LOWER THAN THE DISTRICT
6 STATES Louisiana New York California
$ .11 .19 .20
Texas Wisconsin Colorado
$ .20 .25 .28
SAME AS THE DISTRICT
2 STATES Kansas
$ .30
Minnesota
$ .30
HIGHER THAN THE DISTRICT
38 STATES Ohio Mississippi Missouri MARYLAND Idaho Indiana Kentucky North Dakota Massachusetts Vermont Connecticut Maine Rhode Island Michigan Oregon Nevada New Jersey Oklahoma Illinois
$ .32 .35 .36 .40 .45 .47 .50 .50 .55 .55 .60 .60 .60 .61 .67 .70 .70 .72 .73
Arkansas North Carolina Arizona Washington South Carolina South Dakota Nebraska Delaware West Virginia Montana Tennessee Hawaii Georgia VIRGINIA Alabama Iowa New Mexico Florida Alaska
$ .75 .79 .84 .87 .90 .93 .95 .97 1.00 1.02 1.21 1.38 1.51 1.51 1.70 1.75 1.90 2.25 2.50
1/ 18% wine & liquor tax on top of a 30% markup. 2/ 13% wine & liquor tax on top of monopoly markup of at least 64.5%.

Part II: A Comparison of Selected Tax Rates In The District of Columbia With Those In The 50 States
Tax Rates and Tax Burdens in the District of Columbia: A Nationwide Comparison
Page 49
TABLE 22
STATE DISTILLED SPIRITS TAX RATES
(Per Gallon)
DISTRICT OF COLUMBIA: $ 1.50
CONTROL BOARD STATES
18 STATES Alabama Idaho Iowa 1/ Maine Michigan Mississippi Montana New Hampshire North Carolina 2/
Ohio Oregon Pennsylvania 3/ Utah 4/ Vermont VIRGINIA Washington West Virginia Wyoming
SAME AS THE DISTRICT
1 STATE MARYLAND
$ 1.50
HIGHER THAN THE DISTRICT
31 STATES Kentucky Missouri Colorado Texas Alaska Arkansas 5/ Kansas Louisiana North Dakota Indiana South Carolina Arizona Wisconsin California Nevada Delaware
$ 1.92 2.00 2.28 2.40 2.50 2.50 2.50 2.50 2.50 2.68 2.72 3.00 3.25 3.30 3.60 3.75 6/
Nebraska Rhode Island Georgia South Dakota Massachusetts New Jersey Tennessee Connecticut Illinois Minnesota Oklahoma Hawaii New York Florida New Mexico
$3.75 3.75 3.79 3.93 4.05 4.40 4.40 4.50 4.50 5.03 5.56 5.98 6.43 6.50 6.75
1/ 14.30% plus 50% markup. 2/ 25% Excise Tax. An additional 6% state sales tax. 3/ 18% wine & liquor tax on top of a 30% markup. 4/ 13% wine & liquor tax on top of at least 64.5% markup. 5/ Containing more than 21% of alcohol by weight. 6/ Distilled spirits less than 30% proof at $1.10 per gallon.
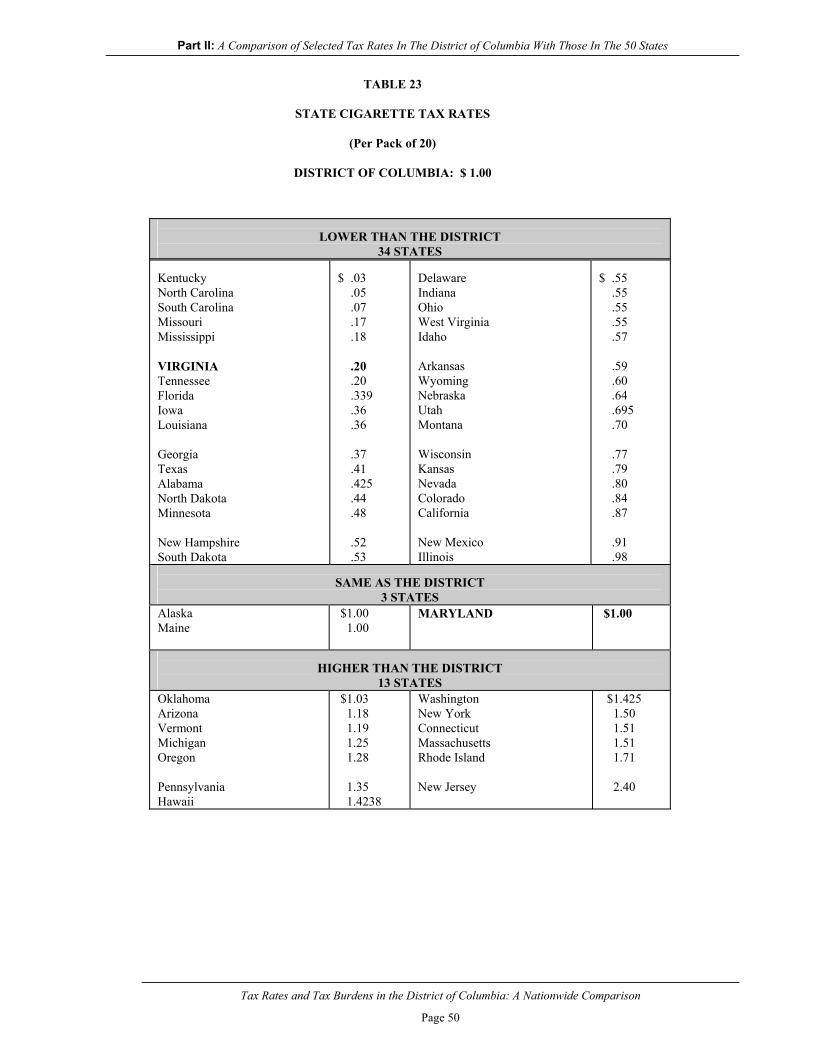
Part II: A Comparison of Selected Tax Rates In The District of Columbia With Those In The 50 States
Tax Rates and Tax Burdens in the District of Columbia: A Nationwide Comparison
Page 50
TABLE 23
STATE CIGARETTE TAX RATES
(Per Pack of 20)
DISTRICT OF COLUMBIA: $ 1.00
LOWER THAN THE DISTRICT 34 STATES
Kentucky North Carolina South Carolina Missouri Mississippi VIRGINIA Tennessee Florida Iowa Louisiana Georgia Texas Alabama North Dakota Minnesota New Hampshire South Dakota
$ .03 .05 .07 .17 .18 .20 .20 .339 .36 .36 .37 .41 .425 .44 .48 .52 .53
Delaware Indiana Ohio West Virginia Idaho Arkansas Wyoming Nebraska Utah Montana Wisconsin Kansas Nevada Colorado California New Mexico Illinois
$ .55 .55 .55 .55 .57 .59 .60 .64 .695 .70 .77 .79 .80 .84 .87 .91 .98
SAME AS THE DISTRICT
3 STATES Alaska Maine
$1.00 1.00
MARYLAND
$1.00
HIGHER THAN THE DISTRICT
13 STATES Oklahoma Arizona Vermont Michigan Oregon Pennsylvania Hawaii
$1.03 1.18 1.19 1.25 1.28 1.35 1.4238
Washington New York Connecticut Massachusetts Rhode Island New Jersey
$1.425 1.50 1.51 1.51 1.71 2.40

Part II: A Comparison of Selected Tax Rates In The District of Columbia With Those In The 50 States
Tax Rates and Tax Burdens in the District of Columbia: A Nationwide Comparison
Page 51
TABLE 24
MOTOR FUEL TAX RATES
(Per Gallon)
DISTRICT OF COLUMBIA: $ .20
LOWER THAN THE DISTRICT
20 STATES Georgia Alaska Wyoming Florida New Jersey Kentucky Hawaii South Carolina New Mexico Oklahoma
$ .075 .08 .14 .143 .145 .15 .16 .16 .17 .17
Missouri VIRGINIA Alabama Arizona Indiana California Mississippi Illinois Michigan New Hampshire
$ .1703 .175 .18 .18 .18 .18 .18 .19 .19 .195
SAME AS THE DISTRICT
4 STATES Louisiana Minnesota
$ .20 .20
Texas Vermont
$ .20 .20
HIGHER THAN THE DISTRICT
26 STATES Iowa West Virginia Massachusetts North Dakota Tennessee Arkansas Colorado South Dakota Delaware Nevada New York MARYLAND Kansas
$ .203 .205 .21 .21 .214 .215 .22 .22 .23 .23 .232 .235 .24
Oregon Utah North Carolina Maine Connecticut Idaho Nebraska Ohio Montana Washington Wisconsin 1/ Pennsylvania Rhode Island
$ .24 .245 .2455 .252 .25 .25 .254 .26 .27 .28 .291 .30 .30
1/ Motor fuel tax rate will increase from $0.291 to $0.299, effective April 1, 2005.
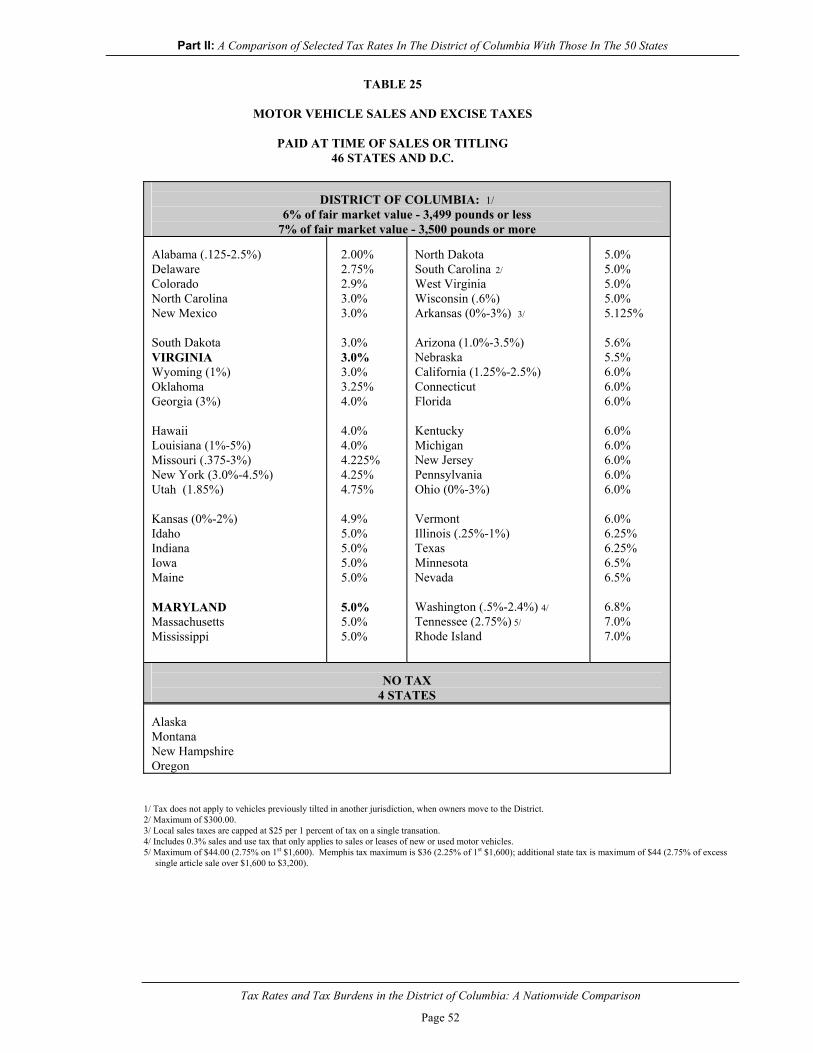
Part II: A Comparison of Selected Tax Rates In The District of Columbia With Those In The 50 States
Tax Rates and Tax Burdens in the District of Columbia: A Nationwide Comparison
Page 52
TABLE 25
MOTOR VEHICLE SALES AND EXCISE TAXES
PAID AT TIME OF SALES OR TITLING 46 STATES AND D.C.
DISTRICT OF COLUMBIA: 1/
6% of fair market value - 3,499 pounds or less 7% of fair market value - 3,500 pounds or more
Alabama (.125-2.5%) Delaware Colorado North Carolina New Mexico South Dakota VIRGINIA Wyoming (1%) Oklahoma Georgia (3%) Hawaii Louisiana (1%-5%) Missouri (.375-3%) New York (3.0%-4.5%) Utah (1.85%) Kansas (0%-2%) Idaho Indiana Iowa Maine MARYLAND Massachusetts Mississippi
2.00% 2.75% 2.9% 3.0% 3.0% 3.0% 3.0% 3.0% 3.25% 4.0% 4.0% 4.0% 4.225% 4.25% 4.75% 4.9% 5.0% 5.0% 5.0% 5.0% 5.0% 5.0% 5.0%
North Dakota South Carolina 2/ West Virginia Wisconsin (.6%) Arkansas (0%-3%) 3/ Arizona (1.0%-3.5%) Nebraska California (1.25%-2.5%) Connecticut Florida Kentucky Michigan New Jersey Pennsylvania Ohio (0%-3%) Vermont Illinois (.25%-1%) Texas Minnesota Nevada Washington (.5%-2.4%) 4/ Tennessee (2.75%) 5/ Rhode Island
5.0% 5.0% 5.0% 5.0% 5.125% 5.6% 5.5% 6.0% 6.0% 6.0% 6.0% 6.0% 6.0% 6.0% 6.0% 6.0% 6.25% 6.25% 6.5% 6.5% 6.8% 7.0% 7.0%
NO TAX
4 STATES Alaska Montana New Hampshire Oregon
1/ Tax does not apply to vehicles previously tilted in another jurisdiction, when owners move to the District. 2/ Maximum of $300.00. 3/ Local sales taxes are capped at $25 per 1 percent of tax on a single transation. 4/ Includes 0.3% sales and use tax that only applies to sales or leases of new or used motor vehicles. 5/ Maximum of $44.00 (2.75% on 1st $1,600). Memphis tax maximum is $36 (2.25% of 1st $1,600); additional state tax is maximum of $44 (2.75% of excess single article sale over $1,600 to $3,200).

Part II: A Comparison of Selected Tax Rates In The District of Columbia With Those In The 50 States
Tax Rates and Tax Burdens in the District of Columbia: A Nationwide Comparison
Page 53
TABLE 26
STATE MOTOR VEHICLE REGISTRATION FEES
Automobile Costing $7,900, Bought New and Weighing 3,522 Pounds (4-Door, 6-Passenger, 8-Cylinder)
DISTRICT OF COLUMBIA: $ 115.00 1/
LOWER THAN THE DISTRICT 49 STATES
Arizona 2/ Indiana Kentucky South Carolina Mississippi Nebraska Oregon Wyoming Montana Delaware Georgia North Carolina Tennessee New York Alabama Utah Arkansas Kansas Maine Massachusetts Louisiana Colorado VIRGINIA California Rhode Island
$ 8.00 12.00 12.00 12.00 15.00 15.00 15.00 15.00 18.75 20.00 20.00 20.00 21.50 22.50 23.00 24.50 25.00 25.00 25.00 25.00 26.50 28.74 29.50 30.00 30.00
West Virginia New Hampshire Florida Nevada Washington 3/ Alaska Connecticut Pennsylvania Missouri Ohio 4/ New Mexico South Dakota Vermont Hawaii Idaho Wisconsin Texas MARYLAND 5/ Illinois North Dakota New Jersey Oklahoma Iowa Minnesota 6/
$ 30.00 31.20 32.50 33.00 33.75 34.00 35.00 36.00 39.00 39.50 42.00 42.00 43.00 46.42 48.00 55.00 59.80 64.00 78.00 79.00 81.00 93.00 93.00 108.75
OTHER BASIS
Michigan
1/ $72 (3,499 lbs. or less); $115 (3,500 lbs. to 4,999 lbs.); $155 (5,000 lbs. and over); and $36 (clean fuel or electric vehicle). 2/ There is also a $1.50 fee earmarked for air quality. 3/ Does not include local vehicle excise taxes levied in certain urban areas. 4/ Local fees not included. 5/ Includes $13.50 fee earmarked for Emergency Medical Services System. 6/ Maximum tax.
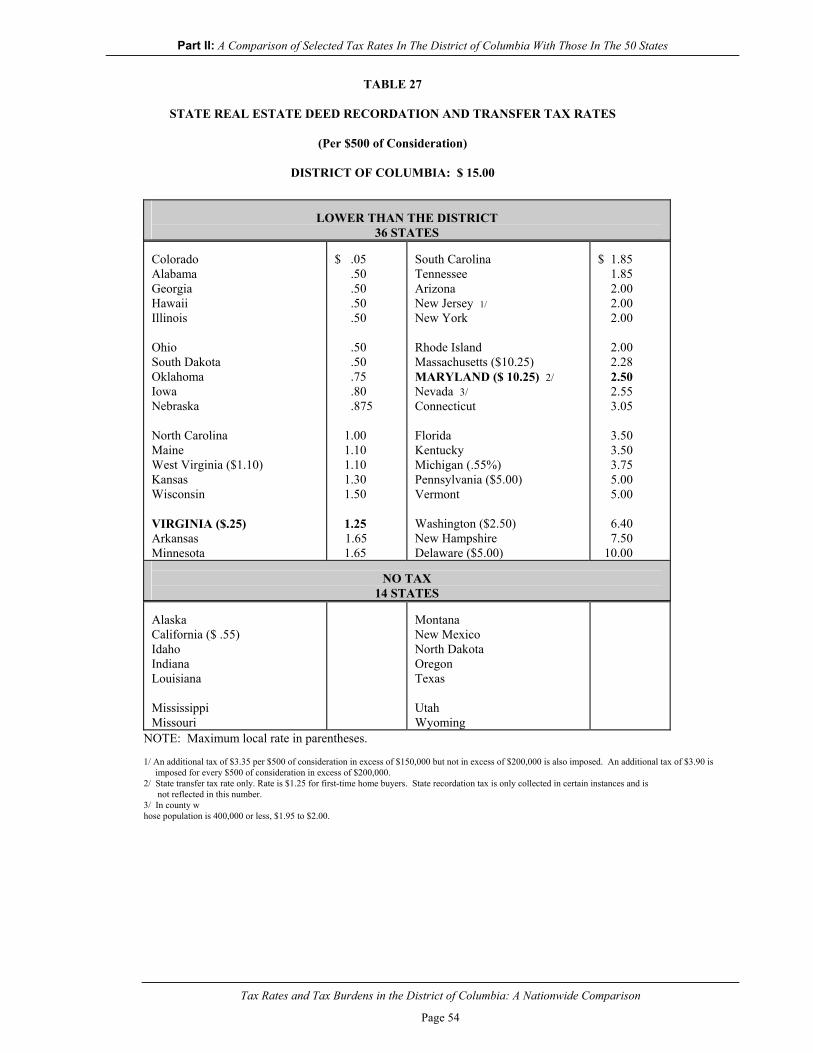
Part II: A Comparison of Selected Tax Rates In The District of Columbia With Those In The 50 States
Tax Rates and Tax Burdens in the District of Columbia: A Nationwide Comparison
Page 54
TABLE 27
STATE REAL ESTATE DEED RECORDATION AND TRANSFER TAX RATES
(Per $500 of Consideration)
DISTRICT OF COLUMBIA: $ 15.00
LOWER THAN THE DISTRICT
36 STATES Colorado Alabama Georgia Hawaii Illinois Ohio South Dakota Oklahoma Iowa Nebraska North Carolina Maine West Virginia ($1.10) Kansas Wisconsin VIRGINIA ($.25) Arkansas Minnesota
$ .05 .50 .50 .50 .50 .50 .50 .75 .80 .875 1.00 1.10 1.10 1.30 1.50 1.25 1.65 1.65
South Carolina Tennessee Arizona New Jersey 1/ New York Rhode Island Massachusetts ($10.25) MARYLAND ($ 10.25) 2/ Nevada 3/ Connecticut Florida Kentucky Michigan (.55%) Pennsylvania ($5.00) Vermont Washington ($2.50) New Hampshire Delaware ($5.00)
$ 1.85 1.85 2.00 2.00 2.00 2.00 2.28 2.50 2.55 3.05 3.50 3.50 3.75 5.00 5.00 6.40 7.50 10.00
NO TAX
14 STATES Alaska California ($ .55) Idaho Indiana Louisiana Mississippi Missouri
Montana New Mexico North Dakota Oregon Texas Utah Wyoming
NOTE: Maximum local rate in parentheses. 1/ An additional tax of $3.35 per $500 of consideration in excess of $150,000 but not in excess of $200,000 is also imposed. An additional tax of $3.90 is imposed for every $500 of consideration in excess of $200,000. 2/ State transfer tax rate only. Rate is $1.25 for first-time home buyers. State recordation tax is only collected in certain instances and is not reflected in this number. 3/ In county w hose population is 400,000 or less, $1.95 to $2.00.

Part II: A Comparison of Selected Tax Rates In The District of Columbia With Those In The 50 States
Tax Rates and Tax Burdens in the District of Columbia: A Nationwide Comparison
Page 55
TABLE 28
TYPES OF STATE INHERITANCE AND ESTATE TAXES
INHERITANCE TAX STATES WITH AN ESTATE TAX TO ABSORB FEDERAL CREDIT
12 STATES Connecticut Idaho Indiana Iowa Kentucky Louisiana
MARYLAND 1/ Nebraska New Hampshire New Jersey Pennsylvania Tennessee
ESTATE TAX STATES WITH AN ESTATE TAX TO ABSORB FEDERAL CREDIT
10 STATES Alaska Illinois Massachusetts Mississippi Montana
Ohio Oklahoma Rhode Island South Dakota West Virginia
ESTATE TAX TO ABSORB FEDERAL CREDIT
29 STATES AND D.C. Alabama Arizona Arkansas California Colorado Delaware District of Columbia 2/ Hawaii Florida Georgia Kansas Maine Minnesota 3/ Michigan Missouri
Nevada New Mexico New York North Carolina 4/ North Dakota Oregon South Carolina Texas Utah Vermont VIRGINIA Washington 5/ Wisconsin 6/ Wyoming
1/ Decoupled from federal estate tax except for thresholds. 2/ The District’s Estate Tax is no longer in conformity with the Federal Estate Tax. Except for raising the filing threshold from $600,000 to $675,000 (January 1, 2002), the District’s Inheritance and Estate Tax Act of 2002 retains all aspects of the District Estate Tax, as it existed on January 1, 1986. Hence, the District Estate Tax is decoupled from recent and forthcoming Federal Estate Tax law changes as stipulated in the Federal Economic Growth and Tax Relief Reconciliation Act of 2001. 3/ Tax equal to the maximum credit for state dealth taxes allowed against the Federal Estate Tax under pre 2001 federal law. 4/ NC will not conform to the phase-out of the state death tax credit enacted in the Federal Economic Growth and Tax Relief reconciliation Act of 2001 until
July1, 2005. For estates of decedents dying prior to July 1, 2005, the NC estate tax is equal to the state death tax credit for federal purposes without regard to the phase-out and termination of the federal credit.
5/ Phased out pursuant to 2001 legislative enacted by Congress and affirmed by a February 3, 2005 ruling by the Washington State Supreme Court. 6/ For deaths after September30, 2002, and before January 1, 2008, Wisconsin’s estate tax equals the credit allowed under federal law in effect in December 31, 2000. Thus, Wisconsin will not follow phase-out of the state death tax credit enacted in the Federal Economic Growth and Tax Relief Reconciliation Act of 2001, until January 1, 2008.

Part II: A Comparison of Selected Tax Rates In The District of Columbia With Those In The 50 States
Tax Rates and Tax Burdens in the District of Columbia: A Nationwide Comparison
Page 56
OFFICE LOCATIONS AND TELEPHONE NUMBERS Government of the District of Columbia
Office of the Chief Financial Officer John A. Wilson Building
1350 Pennsylvania Avenue, NW, Suite 203 Washington, DC 20004
Office hours: Monday through Friday, 8:00 a.m. – 6:00 p.m. (202) 727-2476
Office of the Chief Financial Officer
Natwar M. Gandhi, Chief Financial Officer Lucille Dickinson, Chief of Staff Jerry L. Malone, General Counsel Angell Jacobs, Chief of Operations James Hightower, Interim Chief Information Officer Paul Lundquist, Executive Director for Management and Administration Maryann Young, Public Affairs Officer Sebastian Lorigo, Executive Director for Integrity and Oversight John P. Ross, Director and Senior Advisor for Economic Development Finance
Office of Revenue Analysis Julia Friedman, Deputy Chief Financial Officer 441 4th Street, NW, Suite 410 South, Washington, DC 20001 (202) 727-7775 Office of Budget and Planning Bert Molina, Deputy Chief Financial Officer 1350 Pennsylvania Avenue, NW, Suite 229, Washington, DC 20004 (202) 727-6343 Office of Finance and Treasury Lasana Mack, Acting Deputy Chief Financial Officer and Treasurer 441 4th Street, NW, Suite 360 North, Washington, DC 20001 (202) 727-6055 Office of Financial Operations and Systems Anthony F. Pompa, Deputy Chief Financial Officer 810 1st Street, NE, Suite 200, Washington, DC 20002 (202) 442-8200 Office of Tax and Revenue Sheryl Hobbs-Newman, Deputy Chief Financial Officer 941 North Capitol Street, NE, Suite 800, Washington, DC 20002 (202) 442-6200 Government Directions Barbara D. Jumper, Associate Chief Financial Officer Economic Development and Regulation Henry W. Mosley, Associate Chief Financial Officer Government Services Pamela D. Graham, Associate Chief Financial Officer Public Safety and Justice Steward D. Beckham, Associate Chief Financial Officer Human Support Services Deloras A. Shepherd, Associate Chief Financial Officer

Prepared By:
Government of The District of Columbia
Office of Revenue Analysis 441 4th Street, NW
Suite 410 South Washington, D.C. 20001
(202) 727-7775