Embed Size (px)
Citation preview
Graduate Outlook 2015
The Report of the 2015 Graduate Outlook Survey: Perspectives on Graduate Recruitment
Acknowledgements Darren Matthews (Research Team Leader, Graduate Careers Australia) was the principal author of this report. Bruce Guthrie edited the report and supplied additional content. Edwina Lindsay (Research Associate, Graduate Careers Australia) was the project manager of the 2015 Graduate Outlook Survey and Dr Noel Edge was the project director. The authors and project director wish to acknowledge with gratitude the people involved in this research process. Thanks to the many graduate employers and graduates who took the time to complete the 2015 Graduate Outlook Survey. If it were not for the effort of all of these individuals, these important data would not be available. Thank you all for your continued support. © 2016 Graduate Careers Australia All rights reserved. No part of this publication may be copied or reproduced, stored in a retrieval system or transmitted in any form or by any means electronic, mechanical, photocopy, recording or otherwise without the prior written permission of the publishers. Published by: Graduate Careers Australia Ltd (trading as Graduate Careers Australia) PO Box 13222, Law Courts, Melbourne, VIC 8006 Level 9, 552 Lonsdale Street, Melbourne VIC 3000 Telephone: (03) 9605 3700 Facsimile: (03) 9670 5752 Email: [email protected] Web: www.graduatecareers.com.au ISBN: 978-0-9871853-0-3
1
Contents Introduction ..................................................................................................................................................... 2
Graduate Recruitment ..................................................................................................................................... 3
2014 Recruitment Numbers ............................................................................................................................... 5
Graduate Skills Shortages ................................................................................................................................... 6
Recruitment of International Graduates ............................................................................................................ 8
Graduate Recruitment Practices .................................................................................................................... 10
Undergraduate and Employee Referral Programs ........................................................................................... 12
Graduate Recruitment and Preferred Institutions ............................................................................................ 13
Verbatim Responses ......................................................................................................................................... 14
Graduate Recruitment Practices and Social Media .......................................................................................... 16
Verbatim Responses ......................................................................................................................................... 18
Graduate Attributes ....................................................................................................................................... 19
Key Selection Criteria ........................................................................................................................................ 19
Least Desirable Graduate Characteristics ........................................................................................................ 20
Employers’ Ratings of Their 2014 Graduate Recruits ....................................................................................... 21
2015 Graduate Recruitment ............................................................................................................................. 23
Graduate Employability Skills ........................................................................................................................... 24
Verbatim Responses ......................................................................................................................................... 24
2014 Graduate Intake .................................................................................................................................... 27
Graduate Training ............................................................................................................................................ 27
Graduate Salaries ............................................................................................................................................. 27
Graduate Retention .......................................................................................................................................... 28
Verbatim Responses ......................................................................................................................................... 31
New Graduate Employees’ Perspectives ........................................................................................................ 34
Entering the Workforce .................................................................................................................................... 34
Application Process .......................................................................................................................................... 36
Applications and Social Media ......................................................................................................................... 38
Job Satisfaction ................................................................................................................................................ 39
Retention .......................................................................................................................................................... 40
References and Further Reading .................................................................................................................... 42
Appendix A: The Survey Method ................................................................................................................... 43
2
Introduction Welcome to Graduate Outlook 2015, Graduate Careers Australia’s (GCA) annual report on graduate recruitment practices and trends in Australia. Now in its eleventh year, the Graduate Outlook Survey (GOS) examines the current perspectives of graduate recruiters to present a focused and meaningful overview of the graduate labour market. The GOS is undertaken to obtain an indication of the outlook for graduate recruitment in Australia and, in 2015, was targeted at recruiters who hired graduates in 2014 to commence work in 2014-15. This year’s report continues the examination of graduate intake numbers, as well as recruiters’ perceptions of the calibre of their candidates, and their retention strategies. Current graduate recruitment practices are examined in detail, including promotional techniques, recruitment through additional channels such as undergraduate programs and employee referrals, and the recruitment of international graduates. Some of these areas have been investigated every year since the inception of this series, allowing for the examination of graduate recruitment trends over the last ten years. The report explores recruitment from particular institutions and graduate training procedures, as well as the role of the graduate’s social media profile and its influence in the recruitment decision-making process. Recruiters’ comments are included to expand on related questions and are unedited except for minor modifications to aid comprehension. In the 2015 GOS, we added a survey of graduate employees. Topics covered include application processes, retention, and their satisfaction with their graduate position.
3
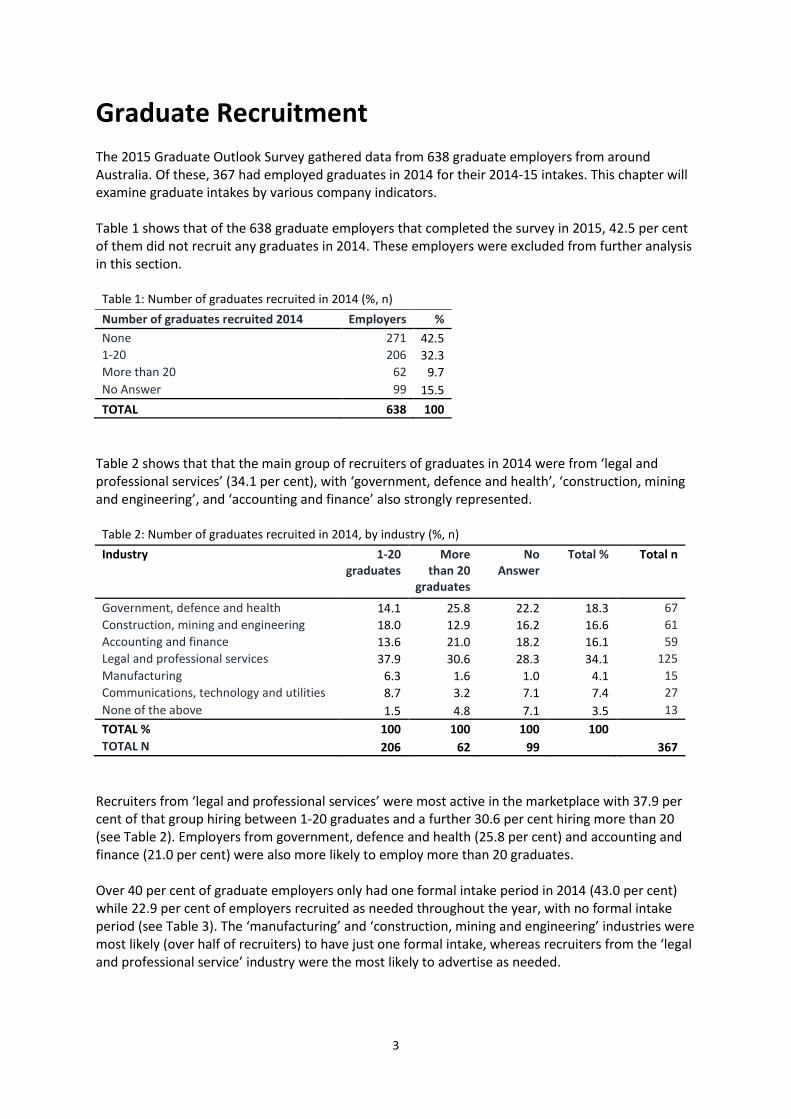
Graduate Recruitment The 2015 Graduate Outlook Survey gathered data from 638 graduate employers from around Australia. Of these, 367 had employed graduates in 2014 for their 2014-15 intakes. This chapter will examine graduate intakes by various company indicators. Table 1 shows that of the 638 graduate employers that completed the survey in 2015, 42.5 per cent of them did not recruit any graduates in 2014. These employers were excluded from further analysis in this section.
Table 1: Number of graduates recruited in 2014 (%, n)
Number of graduates recruited 2014 Employers %
None 271 42.5
1-20 206 32.3
More than 20 62 9.7
No Answer 99 15.5
TOTAL 638 100
Table 2 shows that that the main group of recruiters of graduates in 2014 were from ‘legal and professional services’ (34.1 per cent), with ‘government, defence and health’, ‘construction, mining and engineering’, and ‘accounting and finance’ also strongly represented.
Table 2: Number of graduates recruited in 2014, by industry (%, n)
Industry 1-20 graduates
More than 20
graduates
No Answer
Total % Total n
Government, defence and health 14.1 25.8 22.2 18.3 67
Construction, mining and engineering 18.0 12.9 16.2 16.6 61
Accounting and finance 13.6 21.0 18.2 16.1 59
Legal and professional services 37.9 30.6 28.3 34.1 125
Manufacturing 6.3 1.6 1.0 4.1 15
Communications, technology and utilities 8.7 3.2 7.1 7.4 27
None of the above 1.5 4.8 7.1 3.5 13
TOTAL % 100 100 100 100 TOTAL N 206 62 99 367
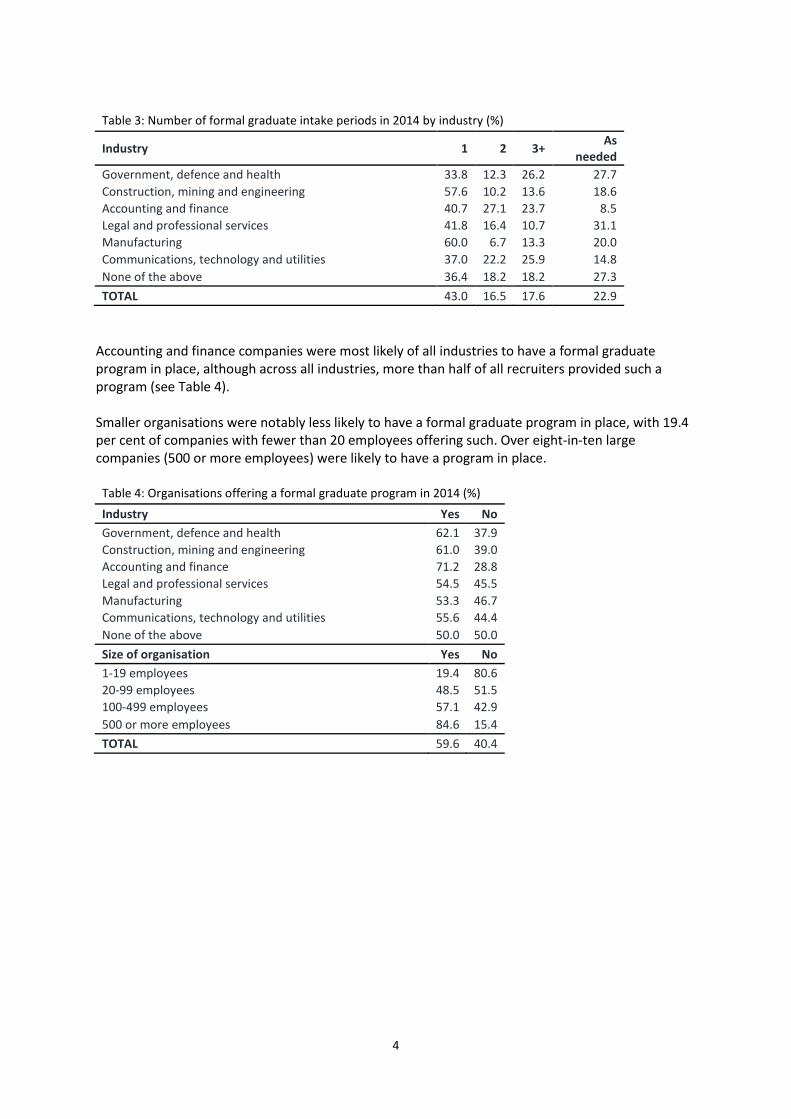
Recruiters from ‘legal and professional services’ were most active in the marketplace with 37.9 per cent of that group hiring between 1-20 graduates and a further 30.6 per cent hiring more than 20 (see Table 2). Employers from government, defence and health (25.8 per cent) and accounting and finance (21.0 per cent) were also more likely to employ more than 20 graduates. Over 40 per cent of graduate employers only had one formal intake period in 2014 (43.0 per cent) while 22.9 per cent of employers recruited as needed throughout the year, with no formal intake period (see Table 3). The ‘manufacturing’ and ‘construction, mining and engineering’ industries were most likely (over half of recruiters) to have just one formal intake, whereas recruiters from the ‘legal and professional service’ industry were the most likely to advertise as needed.
4
Table 3: Number of formal graduate intake periods in 2014 by industry (%)
Industry 1 2 3+
As needed
Government, defence and health 33.8 12.3 26.2 27.7
Construction, mining and engineering 57.6 10.2 13.6 18.6
Accounting and finance 40.7 27.1 23.7 8.5
Legal and professional services 41.8 16.4 10.7 31.1
Manufacturing 60.0 6.7 13.3 20.0
Communications, technology and utilities 37.0 22.2 25.9 14.8
None of the above 36.4 18.2 18.2 27.3
TOTAL 43.0 16.5 17.6 22.9
Accounting and finance companies were most likely of all industries to have a formal graduate program in place, although across all industries, more than half of all recruiters provided such a program (see Table 4). Smaller organisations were notably less likely to have a formal graduate program in place, with 19.4 per cent of companies with fewer than 20 employees offering such. Over eight-in-ten large companies (500 or more employees) were likely to have a program in place.
Table 4: Organisations offering a formal graduate program in 2014 (%)
Industry Yes No
Government, defence and health 62.1 37.9
Construction, mining and engineering 61.0 39.0
Accounting and finance 71.2 28.8
Legal and professional services 54.5 45.5
Manufacturing 53.3 46.7
Communications, technology and utilities 55.6 44.4
None of the above 50.0 50.0
Size of organisation Yes No
1-19 employees 19.4 80.6
20-99 employees 48.5 51.5
100-499 employees 57.1 42.9
500 or more employees 84.6 15.4
TOTAL 59.6 40.4
5
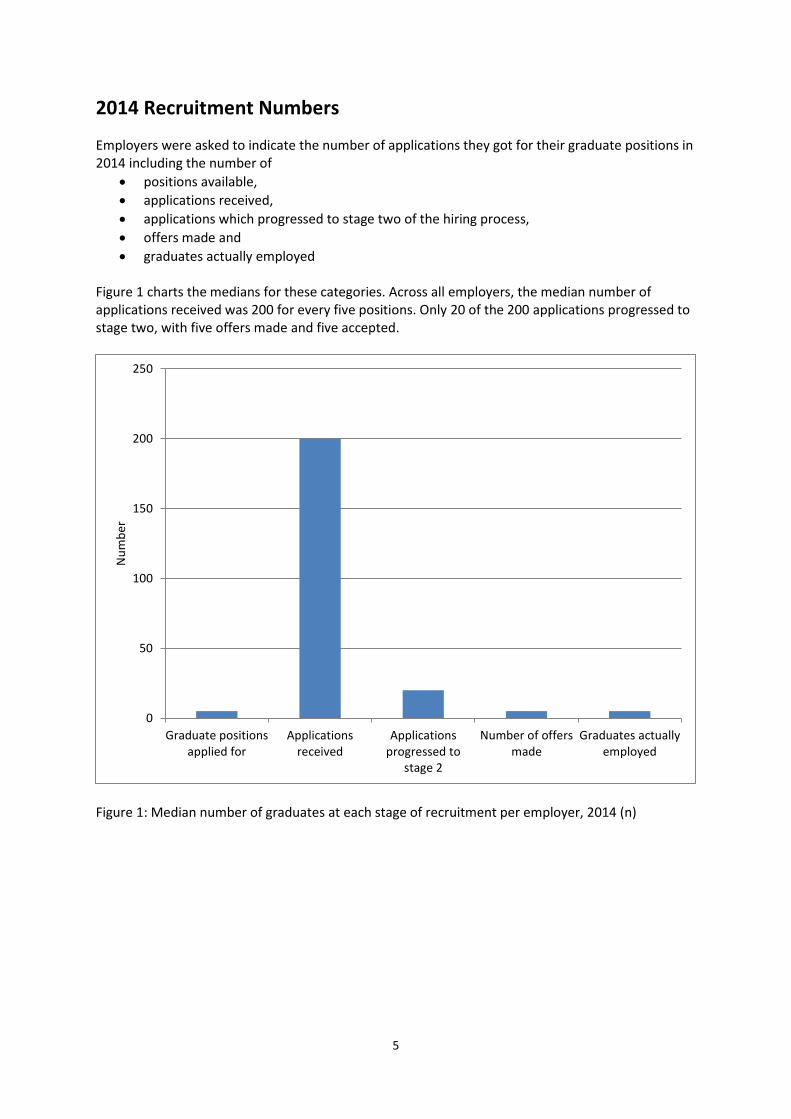
2014 Recruitment Numbers
Employers were asked to indicate the number of applications they got for their graduate positions in 2014 including the number of
positions available,
applications received,
applications which progressed to stage two of the hiring process,
offers made and
graduates actually employed Figure 1 charts the medians for these categories. Across all employers, the median number of applications received was 200 for every five positions. Only 20 of the 200 applications progressed to stage two, with five offers made and five accepted.
Figure 1: Median number of graduates at each stage of recruitment per employer, 2014 (n)
0
50
100
150
200
250
Graduate positionsapplied for
Applicationsreceived
Applicationsprogressed to
stage 2
Number of offersmade
Graduates actuallyemployed
Nu
mb
er
6
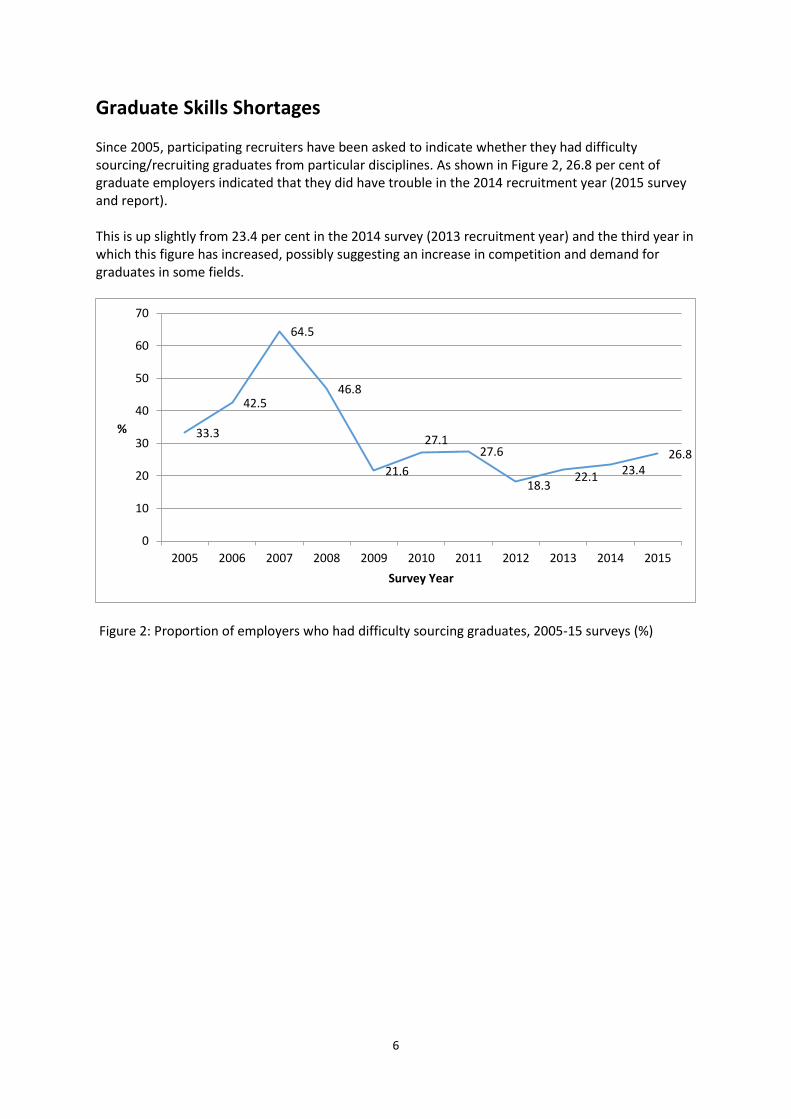
Graduate Skills Shortages Since 2005, participating recruiters have been asked to indicate whether they had difficulty sourcing/recruiting graduates from particular disciplines. As shown in Figure 2, 26.8 per cent of graduate employers indicated that they did have trouble in the 2014 recruitment year (2015 survey and report). This is up slightly from 23.4 per cent in the 2014 survey (2013 recruitment year) and the third year in which this figure has increased, possibly suggesting an increase in competition and demand for graduates in some fields.
Figure 2: Proportion of employers who had difficulty sourcing graduates, 2005-15 surveys (%)
33.3
42.5
64.5
46.8
21.6
27.1 27.6
18.3 22.1
23.4 26.8
0
10
20
30
40
50
60
70
2005 2006 2007 2008 2009 2010 2011 2012 2013 2014 2015
%
Survey Year
7
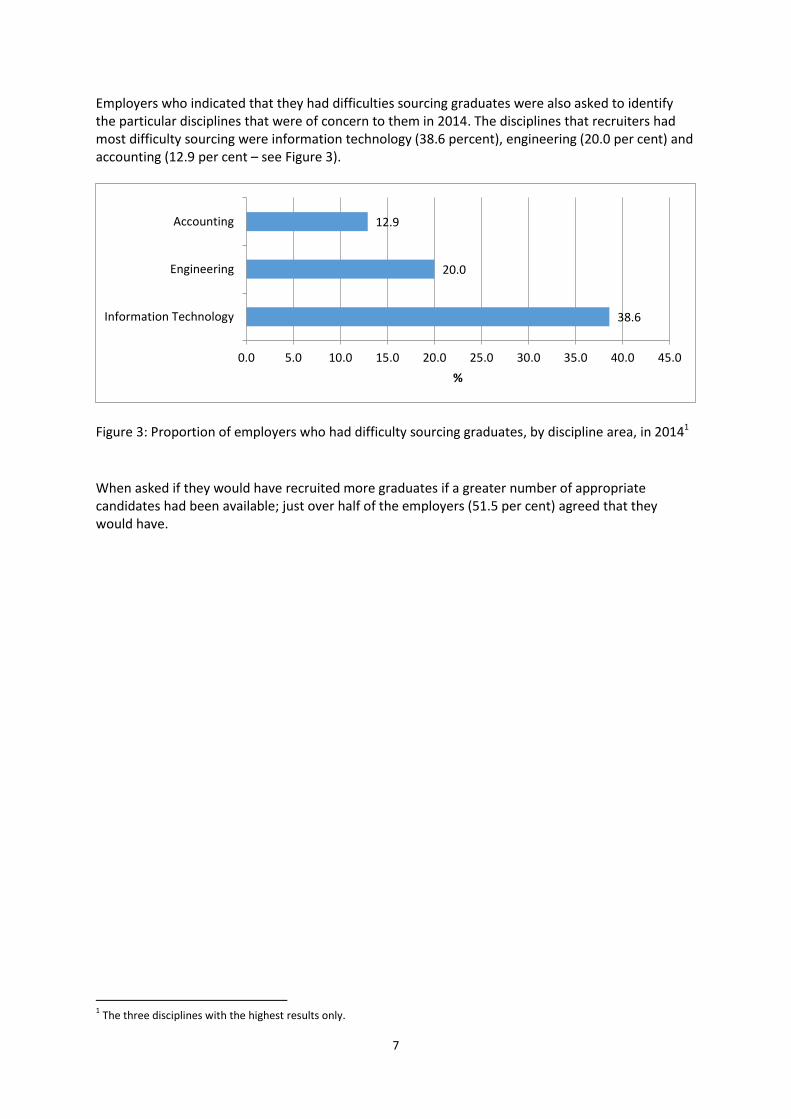
Employers who indicated that they had difficulties sourcing graduates were also asked to identify the particular disciplines that were of concern to them in 2014. The disciplines that recruiters had most difficulty sourcing were information technology (38.6 percent), engineering (20.0 per cent) and accounting (12.9 per cent – see Figure 3).
Figure 3: Proportion of employers who had difficulty sourcing graduates, by discipline area, in 20141
When asked if they would have recruited more graduates if a greater number of appropriate candidates had been available; just over half of the employers (51.5 per cent) agreed that they would have.
1 The three disciplines with the highest results only.
38.6
20.0
12.9
0.0 5.0 10.0 15.0 20.0 25.0 30.0 35.0 40.0 45.0
Information Technology
Engineering
Accounting
%
8
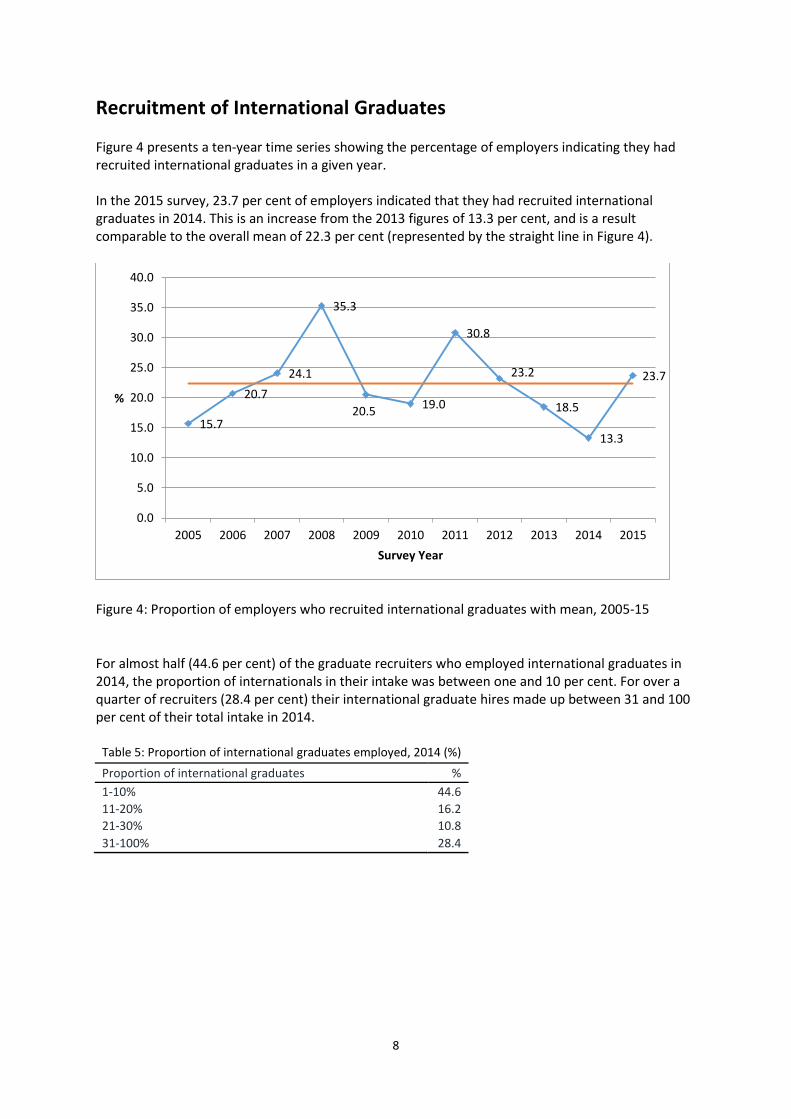
Recruitment of International Graduates Figure 4 presents a ten-year time series showing the percentage of employers indicating they had recruited international graduates in a given year. In the 2015 survey, 23.7 per cent of employers indicated that they had recruited international graduates in 2014. This is an increase from the 2013 figures of 13.3 per cent, and is a result comparable to the overall mean of 22.3 per cent (represented by the straight line in Figure 4).
Figure 4: Proportion of employers who recruited international graduates with mean, 2005-15
For almost half (44.6 per cent) of the graduate recruiters who employed international graduates in 2014, the proportion of internationals in their intake was between one and 10 per cent. For over a quarter of recruiters (28.4 per cent) their international graduate hires made up between 31 and 100 per cent of their total intake in 2014.
Table 5: Proportion of international graduates employed, 2014 (%)
Proportion of international graduates %
1-10% 44.6
11-20% 16.2
21-30% 10.8
31-100% 28.4
15.7
20.7
24.1
35.3
20.5 19.0
30.8
23.2
18.5
13.3
23.7
0.0
5.0
10.0
15.0
20.0
25.0
30.0
35.0
40.0
2005 2006 2007 2008 2009 2010 2011 2012 2013 2014 2015
%
Survey Year
9
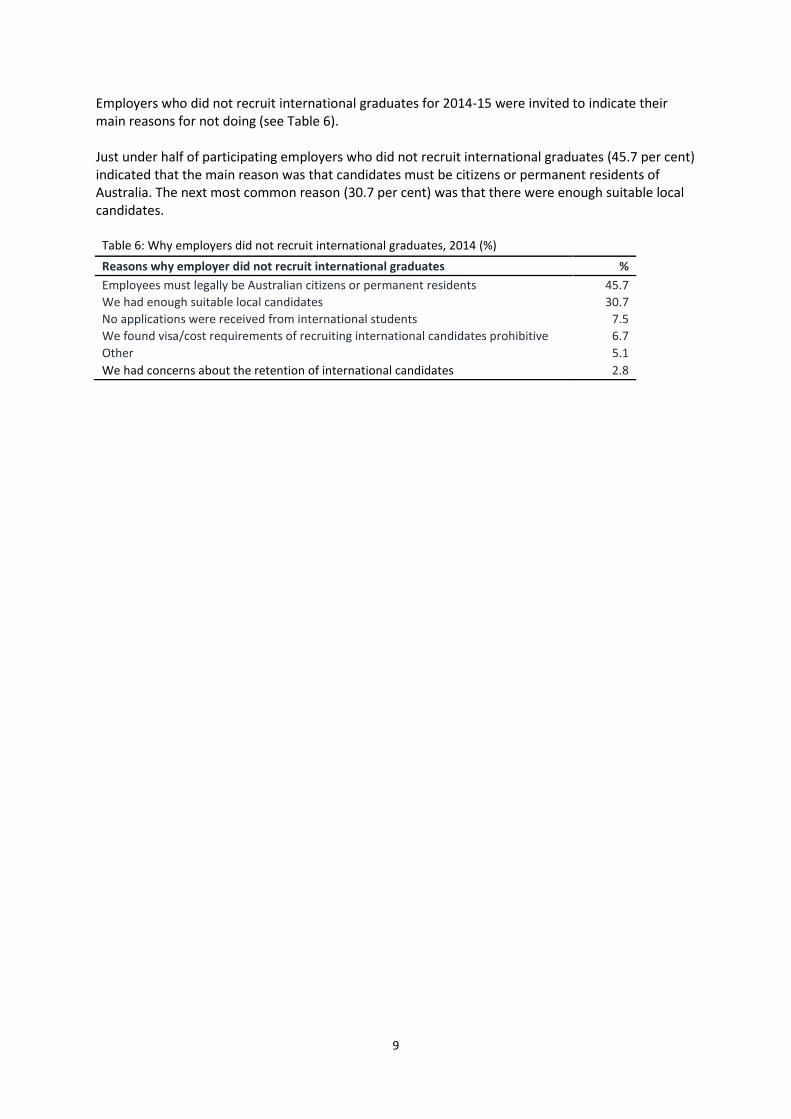
Employers who did not recruit international graduates for 2014-15 were invited to indicate their main reasons for not doing (see Table 6). Just under half of participating employers who did not recruit international graduates (45.7 per cent) indicated that the main reason was that candidates must be citizens or permanent residents of Australia. The next most common reason (30.7 per cent) was that there were enough suitable local candidates.
Table 6: Why employers did not recruit international graduates, 2014 (%)
Reasons why employer did not recruit international graduates %
Employees must legally be Australian citizens or permanent residents 45.7
We had enough suitable local candidates 30.7
No applications were received from international students 7.5
We found visa/cost requirements of recruiting international candidates prohibitive 6.7
Other 5.1
We had concerns about the retention of international candidates 2.8
10
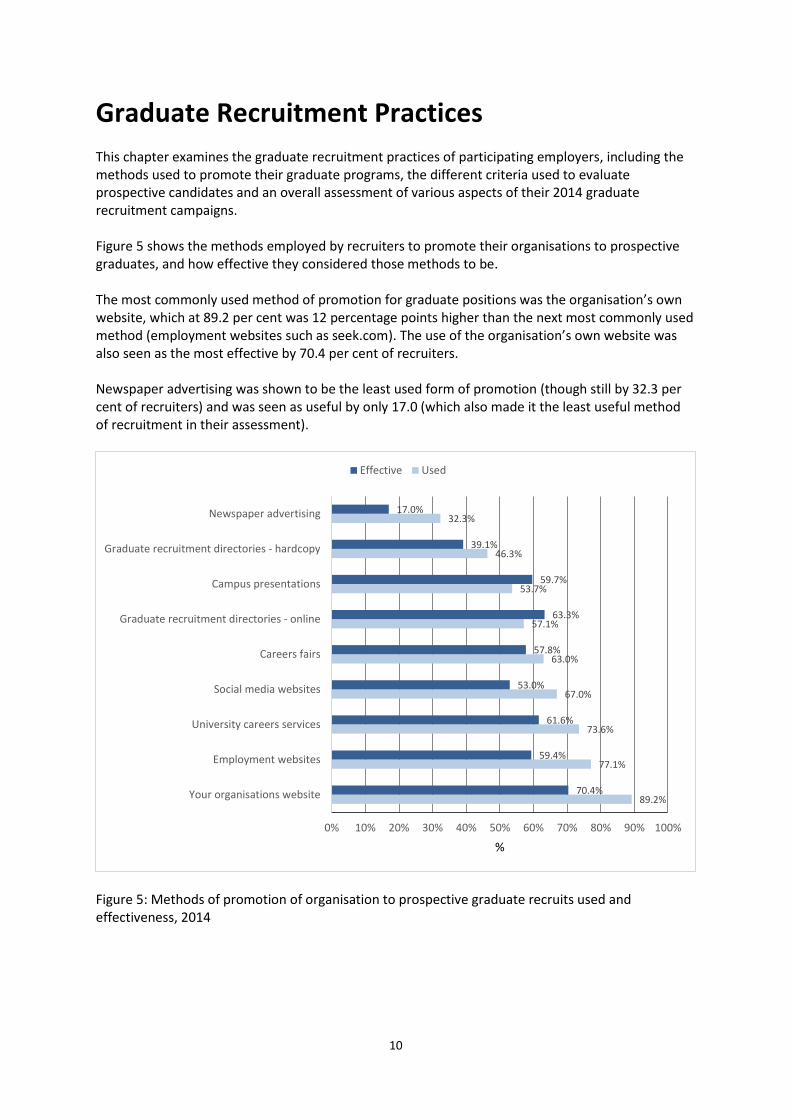
Graduate Recruitment Practices This chapter examines the graduate recruitment practices of participating employers, including the methods used to promote their graduate programs, the different criteria used to evaluate prospective candidates and an overall assessment of various aspects of their 2014 graduate recruitment campaigns. Figure 5 shows the methods employed by recruiters to promote their organisations to prospective graduates, and how effective they considered those methods to be. The most commonly used method of promotion for graduate positions was the organisation’s own website, which at 89.2 per cent was 12 percentage points higher than the next most commonly used method (employment websites such as seek.com). The use of the organisation’s own website was also seen as the most effective by 70.4 per cent of recruiters. Newspaper advertising was shown to be the least used form of promotion (though still by 32.3 per cent of recruiters) and was seen as useful by only 17.0 (which also made it the least useful method of recruitment in their assessment).
Figure 5: Methods of promotion of organisation to prospective graduate recruits used and effectiveness, 2014
89.2%
77.1%
73.6%
67.0%
63.0%
57.1%
53.7%
46.3%
32.3%
70.4%
59.4%
61.6%
53.0%
57.8%
63.3%
59.7%
39.1%
17.0%
0% 10% 20% 30% 40% 50% 60% 70% 80% 90% 100%
Your organisations website
Employment websites
University careers services
Social media websites
Careers fairs
Graduate recruitment directories - online
Campus presentations
Graduate recruitment directories - hardcopy
Newspaper advertising
%
Effective Used
11
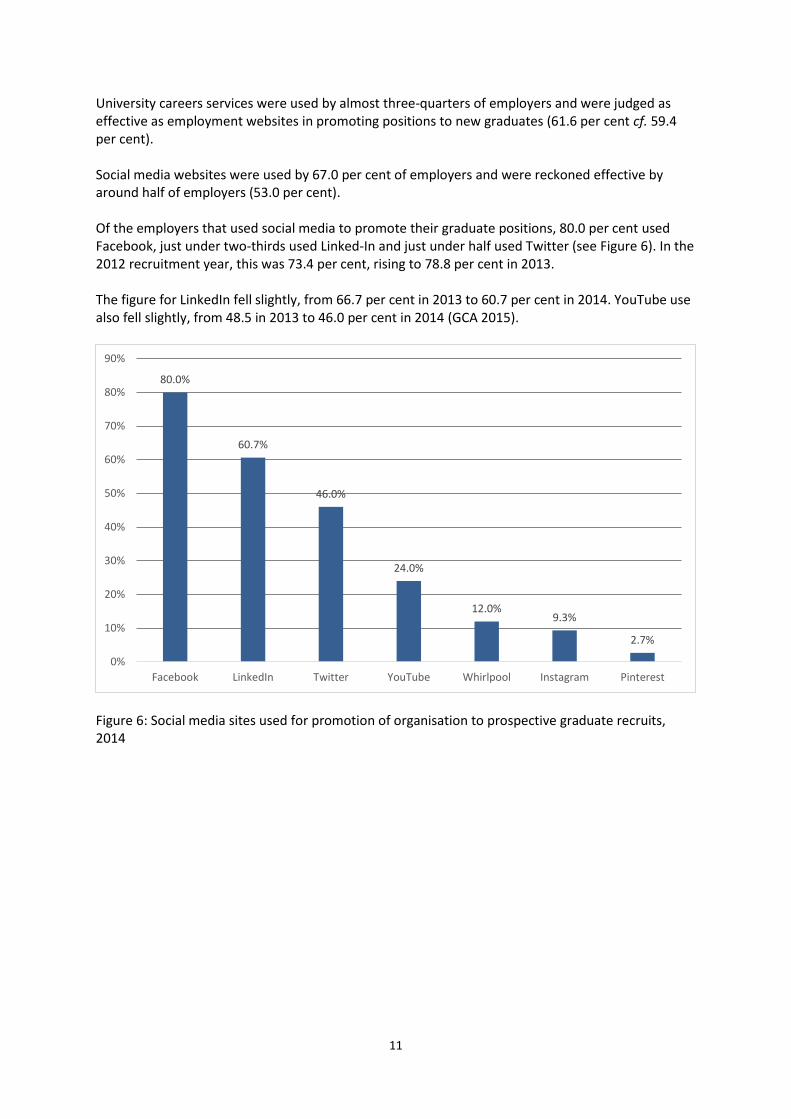
University careers services were used by almost three-quarters of employers and were judged as effective as employment websites in promoting positions to new graduates (61.6 per cent cf. 59.4 per cent). Social media websites were used by 67.0 per cent of employers and were reckoned effective by around half of employers (53.0 per cent). Of the employers that used social media to promote their graduate positions, 80.0 per cent used Facebook, just under two-thirds used Linked-In and just under half used Twitter (see Figure 6). In the 2012 recruitment year, this was 73.4 per cent, rising to 78.8 per cent in 2013. The figure for LinkedIn fell slightly, from 66.7 per cent in 2013 to 60.7 per cent in 2014. YouTube use also fell slightly, from 48.5 in 2013 to 46.0 per cent in 2014 (GCA 2015).
Figure 6: Social media sites used for promotion of organisation to prospective graduate recruits, 2014
80.0%
60.7%
46.0%
24.0%
12.0% 9.3%
2.7%
0%
10%
20%
30%
40%
50%
60%
70%
80%
90%
Facebook LinkedIn Twitter YouTube Whirlpool Instagram Pinterest
12
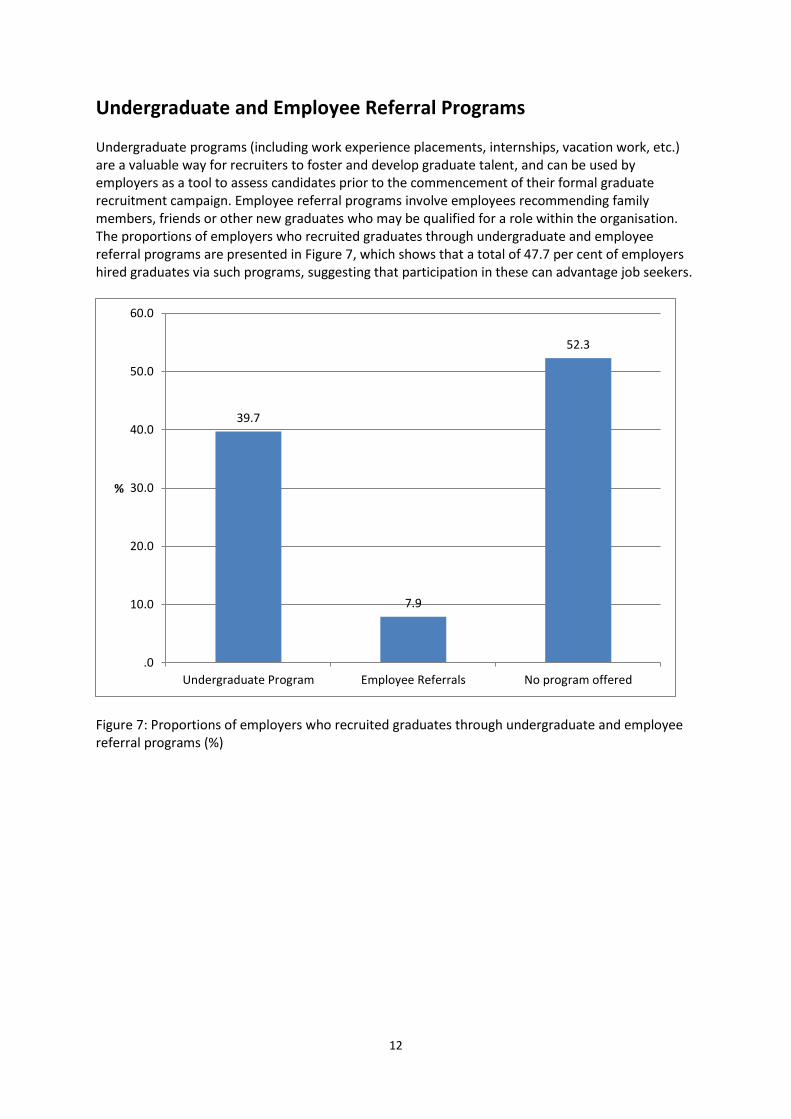
Undergraduate and Employee Referral Programs Undergraduate programs (including work experience placements, internships, vacation work, etc.) are a valuable way for recruiters to foster and develop graduate talent, and can be used by employers as a tool to assess candidates prior to the commencement of their formal graduate recruitment campaign. Employee referral programs involve employees recommending family members, friends or other new graduates who may be qualified for a role within the organisation. The proportions of employers who recruited graduates through undergraduate and employee referral programs are presented in Figure 7, which shows that a total of 47.7 per cent of employers hired graduates via such programs, suggesting that participation in these can advantage job seekers.
Figure 7: Proportions of employers who recruited graduates through undergraduate and employee referral programs (%)
39.7
7.9
52.3
.0
10.0
20.0
30.0
40.0
50.0
60.0
Undergraduate Program Employee Referrals No program offered
%
13
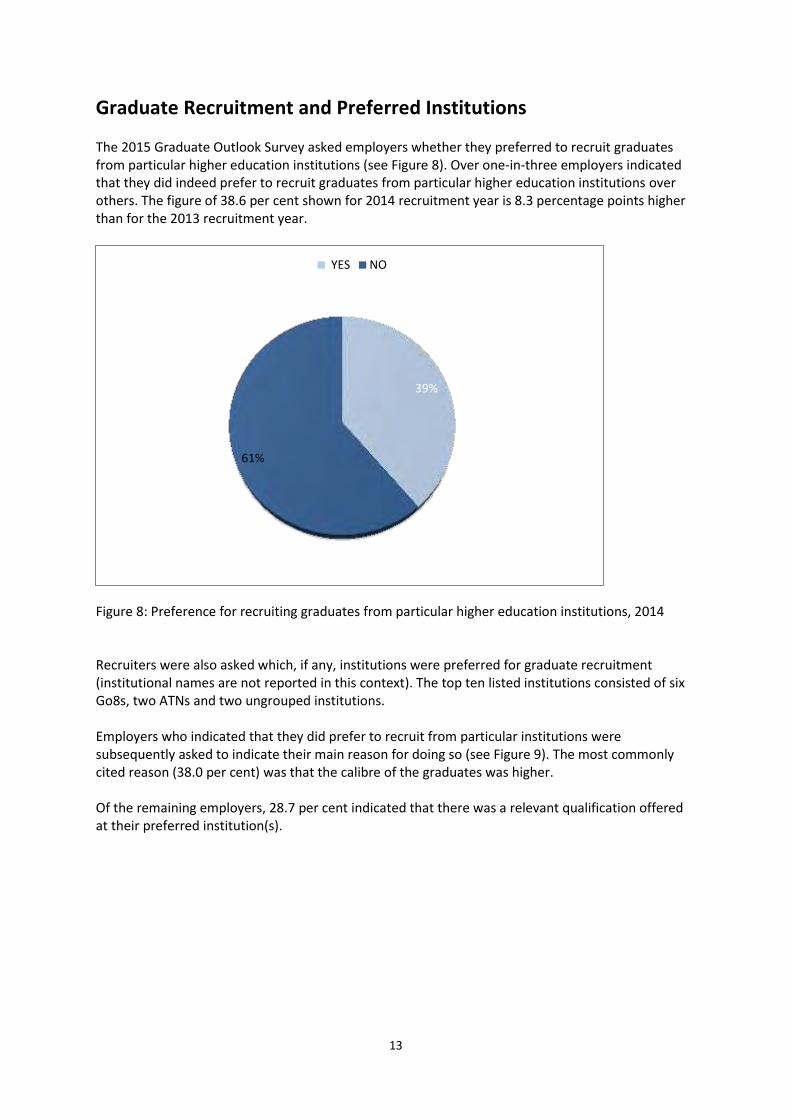
Graduate Recruitment and Preferred Institutions The 2015 Graduate Outlook Survey asked employers whether they preferred to recruit graduates from particular higher education institutions (see Figure 8). Over one-in-three employers indicated that they did indeed prefer to recruit graduates from particular higher education institutions over others. The figure of 38.6 per cent shown for 2014 recruitment year is 8.3 percentage points higher than for the 2013 recruitment year.
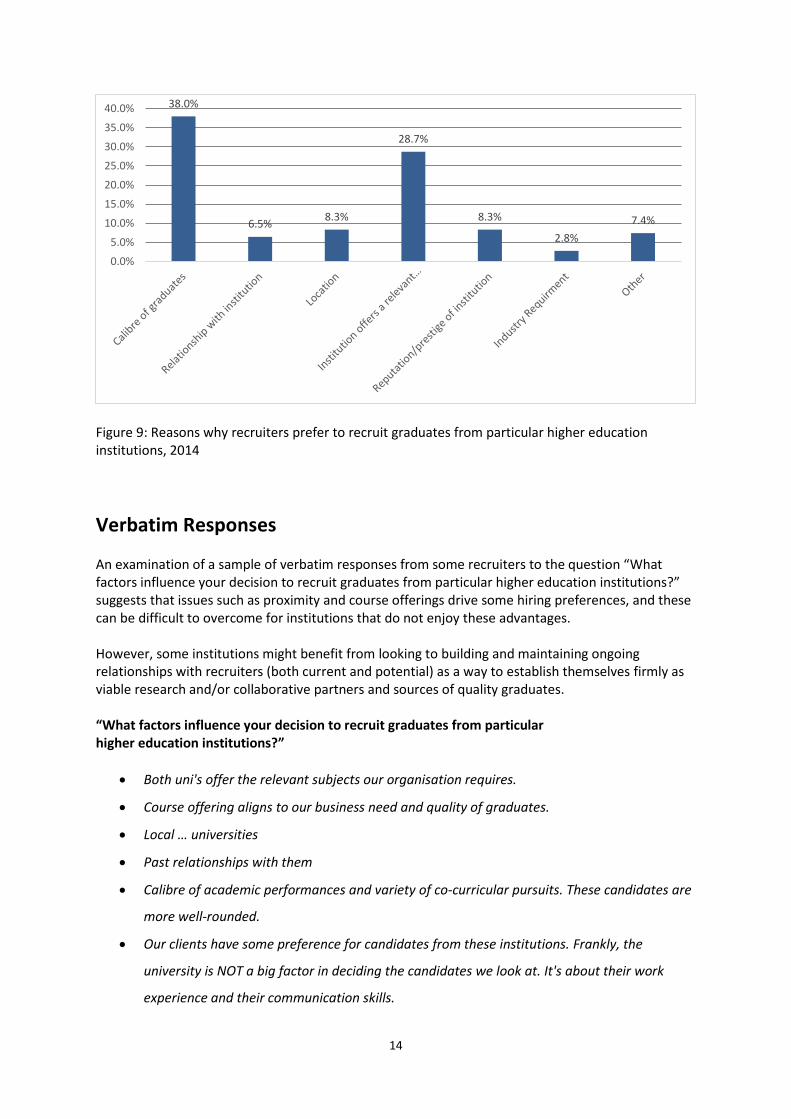
Figure 8: Preference for recruiting graduates from particular higher education institutions, 2014 Recruiters were also asked which, if any, institutions were preferred for graduate recruitment (institutional names are not reported in this context). The top ten listed institutions consisted of six Go8s, two ATNs and two ungrouped institutions. Employers who indicated that they did prefer to recruit from particular institutions were subsequently asked to indicate their main reason for doing so (see Figure 9). The most commonly cited reason (38.0 per cent) was that the calibre of the graduates was higher. Of the remaining employers, 28.7 per cent indicated that there was a relevant qualification offered at their preferred institution(s).
39%
61%
YES NO
14
Figure 9: Reasons why recruiters prefer to recruit graduates from particular higher education institutions, 2014
Verbatim Responses An examination of a sample of verbatim responses from some recruiters to the question “What factors influence your decision to recruit graduates from particular higher education institutions?” suggests that issues such as proximity and course offerings drive some hiring preferences, and these can be difficult to overcome for institutions that do not enjoy these advantages. However, some institutions might benefit from looking to building and maintaining ongoing relationships with recruiters (both current and potential) as a way to establish themselves firmly as viable research and/or collaborative partners and sources of quality graduates. “What factors influence your decision to recruit graduates from particular higher education institutions?”
Both uni's offer the relevant subjects our organisation requires.
Course offering aligns to our business need and quality of graduates.
Local … universities
Past relationships with them
Calibre of academic performances and variety of co-curricular pursuits. These candidates are
more well-rounded.
Our clients have some preference for candidates from these institutions. Frankly, the
university is NOT a big factor in deciding the candidates we look at. It's about their work
experience and their communication skills.
38.0%
6.5% 8.3%
28.7%
8.3%
2.8%
7.4%
0.0%
5.0%
10.0%
15.0%
20.0%
25.0%
30.0%
35.0%
40.0%
15
Preferred universities, high quality students, but we would take from any university if it was
the right candidate.
Relationships with universities, quality of graduates, specific courses offered.
Research partnerships
Standard of education tends to be higher, communication skills better, more ambitious
students. We also take work experience students from <name of institution deleted> which is
a great way to find out whether they are the type of candidates that we want in our
organisation.
Reputation
16
Graduate Recruitment Practices and Social Media
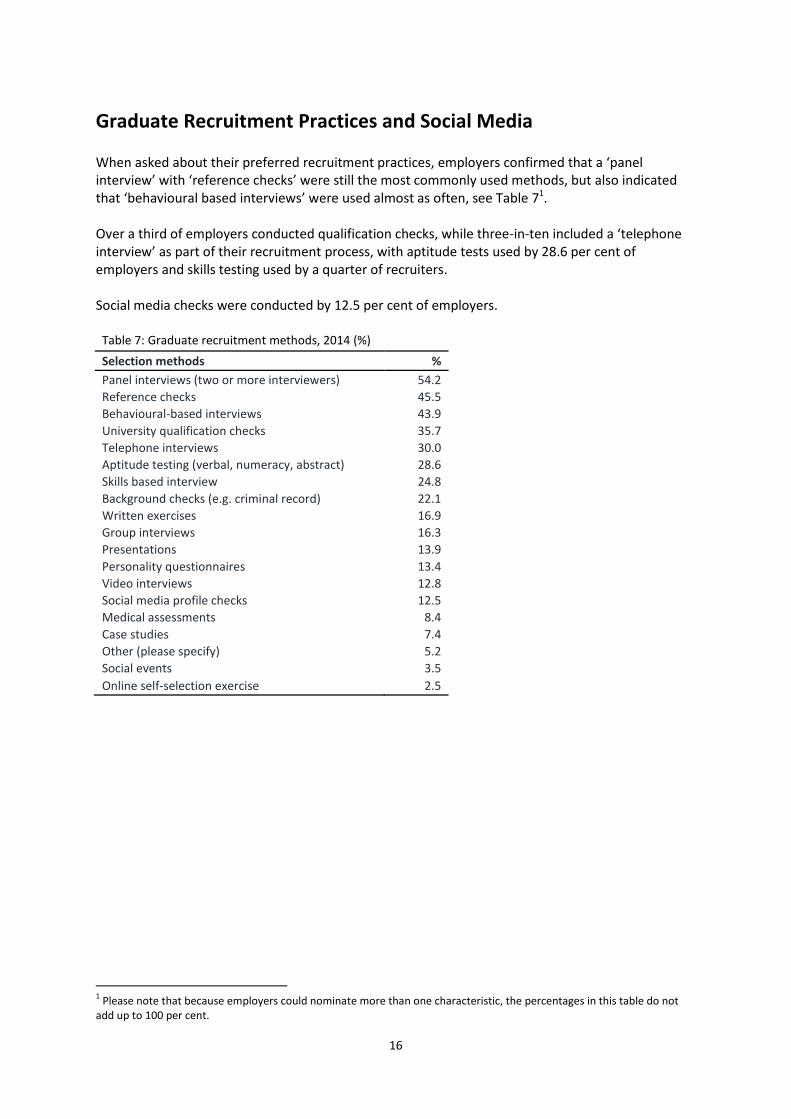
When asked about their preferred recruitment practices, employers confirmed that a ‘panel interview’ with ‘reference checks’ were still the most commonly used methods, but also indicated that ‘behavioural based interviews’ were used almost as often, see Table 71. Over a third of employers conducted qualification checks, while three-in-ten included a ‘telephone interview’ as part of their recruitment process, with aptitude tests used by 28.6 per cent of employers and skills testing used by a quarter of recruiters. Social media checks were conducted by 12.5 per cent of employers.
Table 7: Graduate recruitment methods, 2014 (%)
Selection methods %
Panel interviews (two or more interviewers) 54.2
Reference checks 45.5
Behavioural-based interviews 43.9
University qualification checks 35.7
Telephone interviews 30.0
Aptitude testing (verbal, numeracy, abstract) 28.6
Skills based interview 24.8
Background checks (e.g. criminal record) 22.1
Written exercises 16.9
Group interviews 16.3
Presentations 13.9
Personality questionnaires 13.4
Video interviews 12.8
Social media profile checks 12.5
Medical assessments 8.4
Case studies 7.4
Other (please specify) 5.2
Social events 3.5
Online self-selection exercise 2.5
1 Please note that because employers could nominate more than one characteristic, the percentages in this table do not
add up to 100 per cent.
17
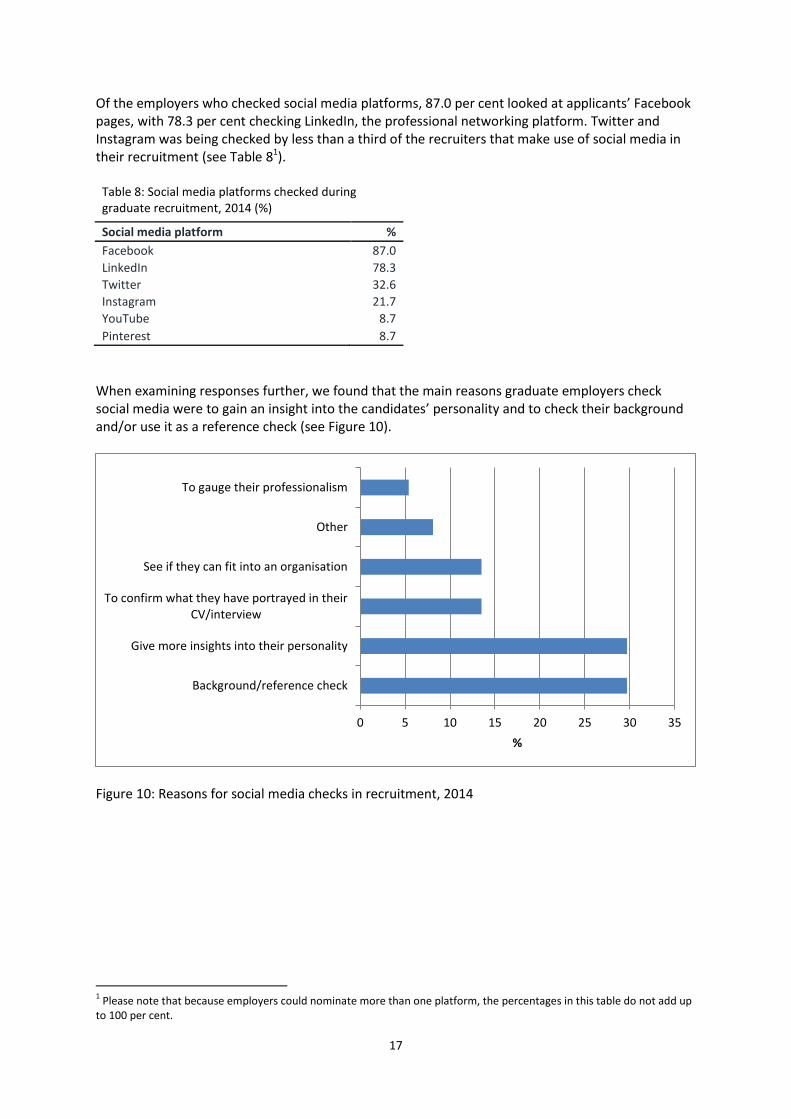
Of the employers who checked social media platforms, 87.0 per cent looked at applicants’ Facebook pages, with 78.3 per cent checking LinkedIn, the professional networking platform. Twitter and Instagram was being checked by less than a third of the recruiters that make use of social media in their recruitment (see Table 81).
Table 8: Social media platforms checked during graduate recruitment, 2014 (%)
Social media platform %
Facebook 87.0
LinkedIn 78.3
Twitter 32.6
Instagram 21.7
YouTube 8.7
Pinterest 8.7
When examining responses further, we found that the main reasons graduate employers check social media were to gain an insight into the candidates’ personality and to check their background and/or use it as a reference check (see Figure 10).
Figure 10: Reasons for social media checks in recruitment, 2014
1 Please note that because employers could nominate more than one platform, the percentages in this table do not add up
to 100 per cent.
0 5 10 15 20 25 30 35
Background/reference check
Give more insights into their personality
To confirm what they have portrayed in theirCV/interview
See if they can fit into an organisation
Other
To gauge their professionalism
%
18
Verbatim Responses Employers’ verbatim responses (below, selected to give an overview of the views expressed) to the question “Why do you check an applicant's social media?” are revealing, if occasionally pointed.
Because if they are stupid enough to post themselves doing stupid or illegal things they are unemployable to us. We find this very often.
More generally, reasons given for using social media as part of the recruitment process fell into the areas of vetting applicants’ CVs and/or checking for organisational ‘fit’, or as one recruiter put it, “to identify any red flags”. “Why do you check an applicant's social media?”
360 [degree] view of character
All of the obvious reasons: personality, security levels, beliefs
Consistency of message against resume
How could you not?
It provides further information about the individual that may not become evident in CV's,
interviews etc
It's more relevant than a reference check
See under the hood [bonnet]
To assess whether there are any concerns with the individual posing a negative impact on
our organisation
To ensure we are not interviewing or hiring candidates who appear to have an exotic
weekend life
To get a sense of their professional profile and additional background. Also to find out about
interests, skill endorsements and network.
To see how the person presents themselves as they are going to be the face or our business
To verify claims regarding location, education, former employers, and to view their social
standing (Facebook) and public profile
We wanted to ensure that their values were in alignment with our values. We were not
interested in interviewing any candidates who had other priorities in their personal lives.
19
Graduate Attributes This chapter of Graduate Outlook 2015 contains important information intended to assist employers and graduates in planning their recruitment strategies. Key areas investigated within this section include selection criteria utilised when assessing potential graduate employees, as well as the role of graduates’ social media profiles and their influence in the recruitment decision-making process.
Key Selection Criteria
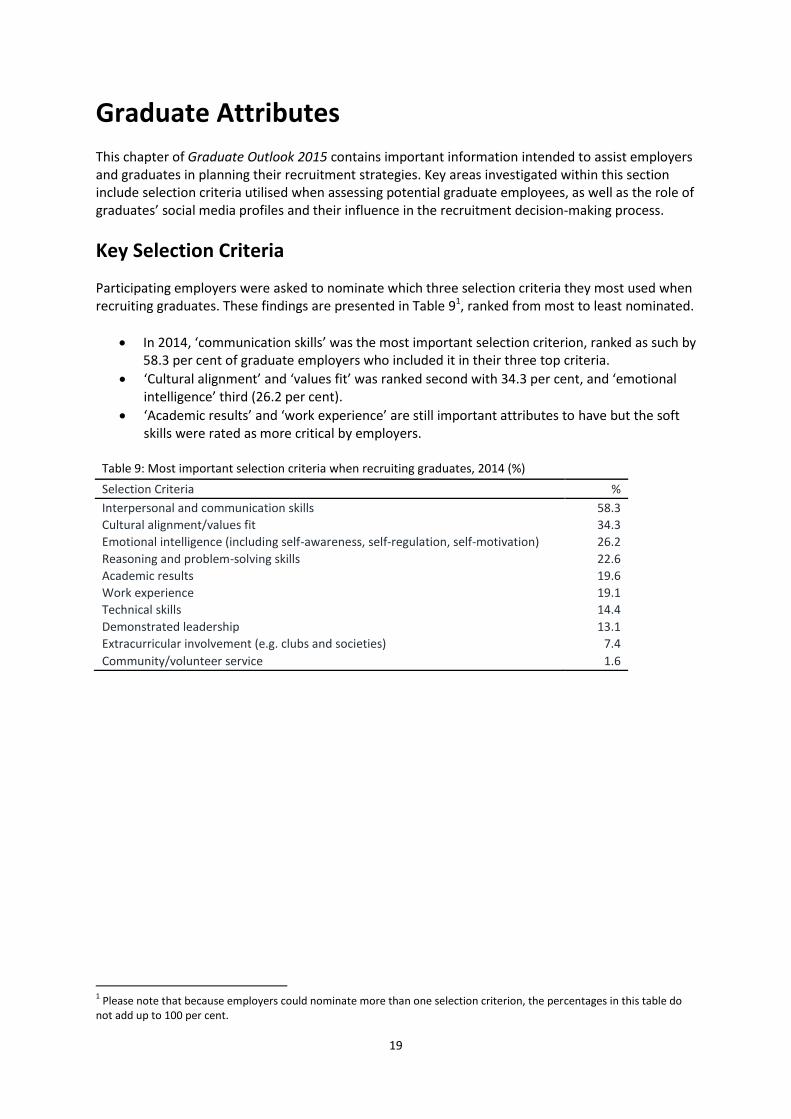
Participating employers were asked to nominate which three selection criteria they most used when recruiting graduates. These findings are presented in Table 91, ranked from most to least nominated.
In 2014, ‘communication skills’ was the most important selection criterion, ranked as such by 58.3 per cent of graduate employers who included it in their three top criteria.
‘Cultural alignment’ and ‘values fit’ was ranked second with 34.3 per cent, and ‘emotional intelligence’ third (26.2 per cent).
‘Academic results’ and ‘work experience’ are still important attributes to have but the soft skills were rated as more critical by employers.
Table 9: Most important selection criteria when recruiting graduates, 2014 (%)
Selection Criteria %
Interpersonal and communication skills 58.3
Cultural alignment/values fit 34.3
Emotional intelligence (including self-awareness, self-regulation, self-motivation) 26.2
Reasoning and problem-solving skills 22.6
Academic results 19.6
Work experience 19.1
Technical skills 14.4
Demonstrated leadership 13.1
Extracurricular involvement (e.g. clubs and societies) 7.4
Community/volunteer service 1.6
1 Please note that because employers could nominate more than one selection criterion, the percentages in this table do
not add up to 100 per cent.
20
Least Desirable Graduate Characteristics
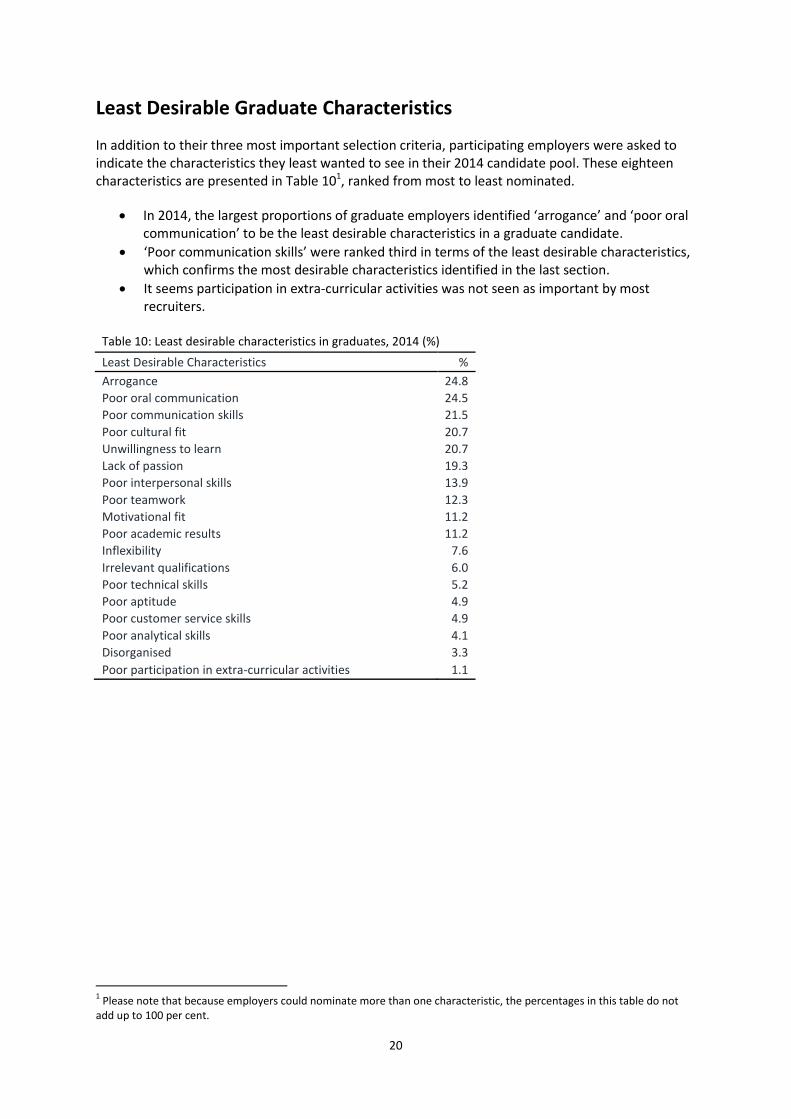
In addition to their three most important selection criteria, participating employers were asked to indicate the characteristics they least wanted to see in their 2014 candidate pool. These eighteen characteristics are presented in Table 101, ranked from most to least nominated.
In 2014, the largest proportions of graduate employers identified ‘arrogance’ and ‘poor oral communication’ to be the least desirable characteristics in a graduate candidate.
‘Poor communication skills’ were ranked third in terms of the least desirable characteristics, which confirms the most desirable characteristics identified in the last section.
It seems participation in extra-curricular activities was not seen as important by most recruiters.
Table 10: Least desirable characteristics in graduates, 2014 (%)
Least Desirable Characteristics %
Arrogance 24.8
Poor oral communication 24.5
Poor communication skills 21.5
Poor cultural fit 20.7
Unwillingness to learn 20.7
Lack of passion 19.3
Poor interpersonal skills 13.9
Poor teamwork 12.3
Motivational fit 11.2
Poor academic results 11.2
Inflexibility 7.6
Irrelevant qualifications 6.0
Poor technical skills 5.2
Poor aptitude 4.9
Poor customer service skills 4.9
Poor analytical skills 4.1
Disorganised 3.3
Poor participation in extra-curricular activities 1.1
1 Please note that because employers could nominate more than one characteristic, the percentages in this table do not
add up to 100 per cent.
21
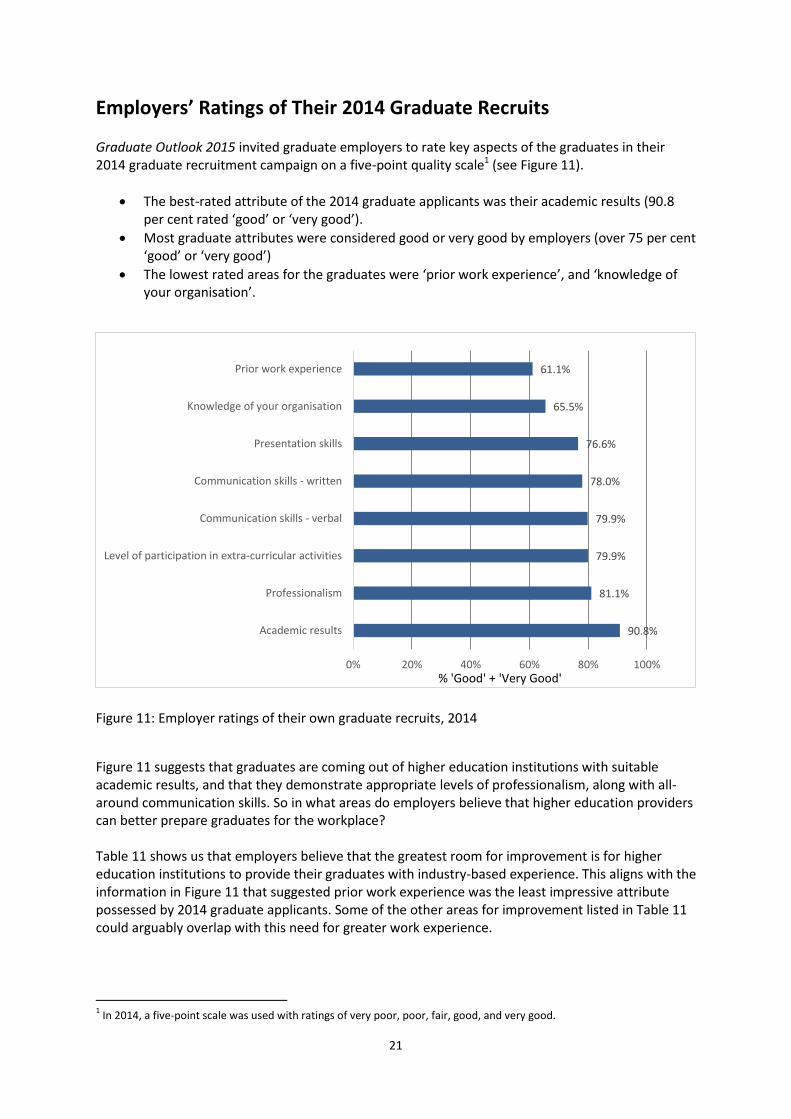
Employers’ Ratings of Their 2014 Graduate Recruits Graduate Outlook 2015 invited graduate employers to rate key aspects of the graduates in their 2014 graduate recruitment campaign on a five-point quality scale1 (see Figure 11).
The best-rated attribute of the 2014 graduate applicants was their academic results (90.8 per cent rated ‘good’ or ‘very good’).
Most graduate attributes were considered good or very good by employers (over 75 per cent ‘good’ or ‘very good’)
The lowest rated areas for the graduates were ‘prior work experience’, and ‘knowledge of your organisation’.
Figure 11: Employer ratings of their own graduate recruits, 2014
Figure 11 suggests that graduates are coming out of higher education institutions with suitable academic results, and that they demonstrate appropriate levels of professionalism, along with all-around communication skills. So in what areas do employers believe that higher education providers can better prepare graduates for the workplace? Table 11 shows us that employers believe that the greatest room for improvement is for higher education institutions to provide their graduates with industry-based experience. This aligns with the information in Figure 11 that suggested prior work experience was the least impressive attribute possessed by 2014 graduate applicants. Some of the other areas for improvement listed in Table 11 could arguably overlap with this need for greater work experience.
1 In 2014, a five-point scale was used with ratings of very poor, poor, fair, good, and very good.
90.8%
81.1%
79.9%
79.9%
78.0%
76.6%
65.5%
61.1%
0% 20% 40% 60% 80% 100%
Academic results
Professionalism
Level of participation in extra-curricular activities
Communication skills - verbal
Communication skills - written
Presentation skills
Knowledge of your organisation
Prior work experience
% 'Good' + 'Very Good'
22
Table 11: How higher education providers could better prepare their graduates for the workplace, 2014 (%)
Areas for improvement %
Require graduates to have completed industry-based experience 32.4
Teach students a wider set of skills 14.8
Train students for the recruitment/ job application process 12.0
Other 9.7
Coursework to be more practical in nature 8.3
Ensure a subject focuses on being work-ready 7.9
Teach graduates to have realistic expectations of employment conditions 7.4
Graduates are adequately prepared 4.2
Teach students how to apply what they have learnt to real-life 3.2
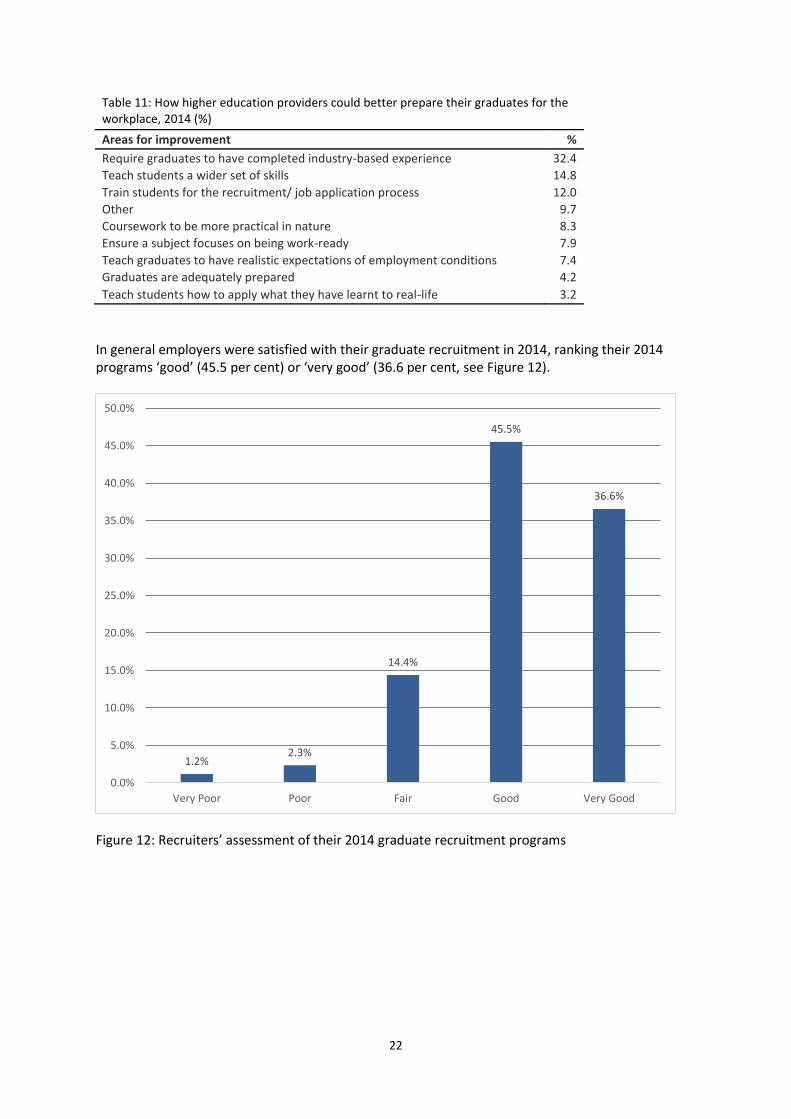
In general employers were satisfied with their graduate recruitment in 2014, ranking their 2014 programs ‘good’ (45.5 per cent) or ‘very good’ (36.6 per cent, see Figure 12).
Figure 12: Recruiters’ assessment of their 2014 graduate recruitment programs
1.2% 2.3%
14.4%
45.5%
36.6%
0.0%
5.0%
10.0%
15.0%
20.0%
25.0%
30.0%
35.0%
40.0%
45.0%
50.0%
Very Poor Poor Fair Good Very Good
23
2015 Graduate Recruitment
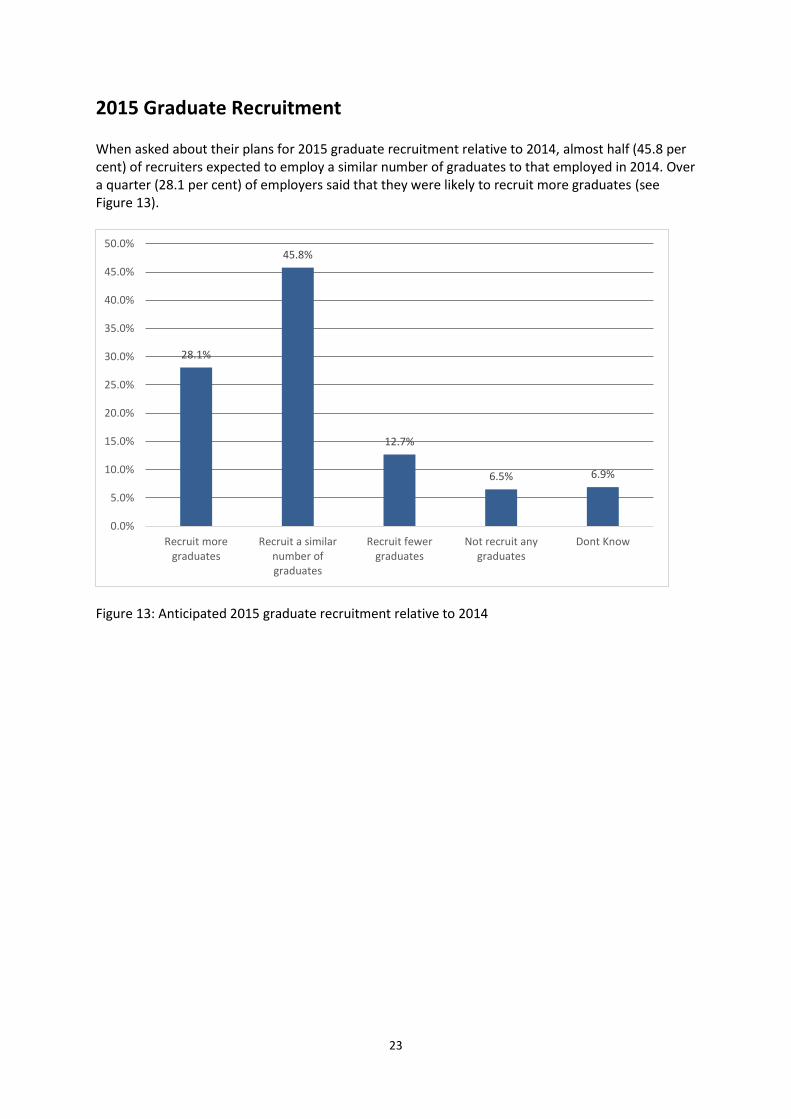
When asked about their plans for 2015 graduate recruitment relative to 2014, almost half (45.8 per cent) of recruiters expected to employ a similar number of graduates to that employed in 2014. Over a quarter (28.1 per cent) of employers said that they were likely to recruit more graduates (see Figure 13).
Figure 13: Anticipated 2015 graduate recruitment relative to 2014
28.1%
45.8%
12.7%
6.5% 6.9%
0.0%
5.0%
10.0%
15.0%
20.0%
25.0%
30.0%
35.0%
40.0%
45.0%
50.0%
Recruit moregraduates
Recruit a similarnumber ofgraduates
Recruit fewergraduates
Not recruit anygraduates
Dont Know
24
Graduate Employability Skills
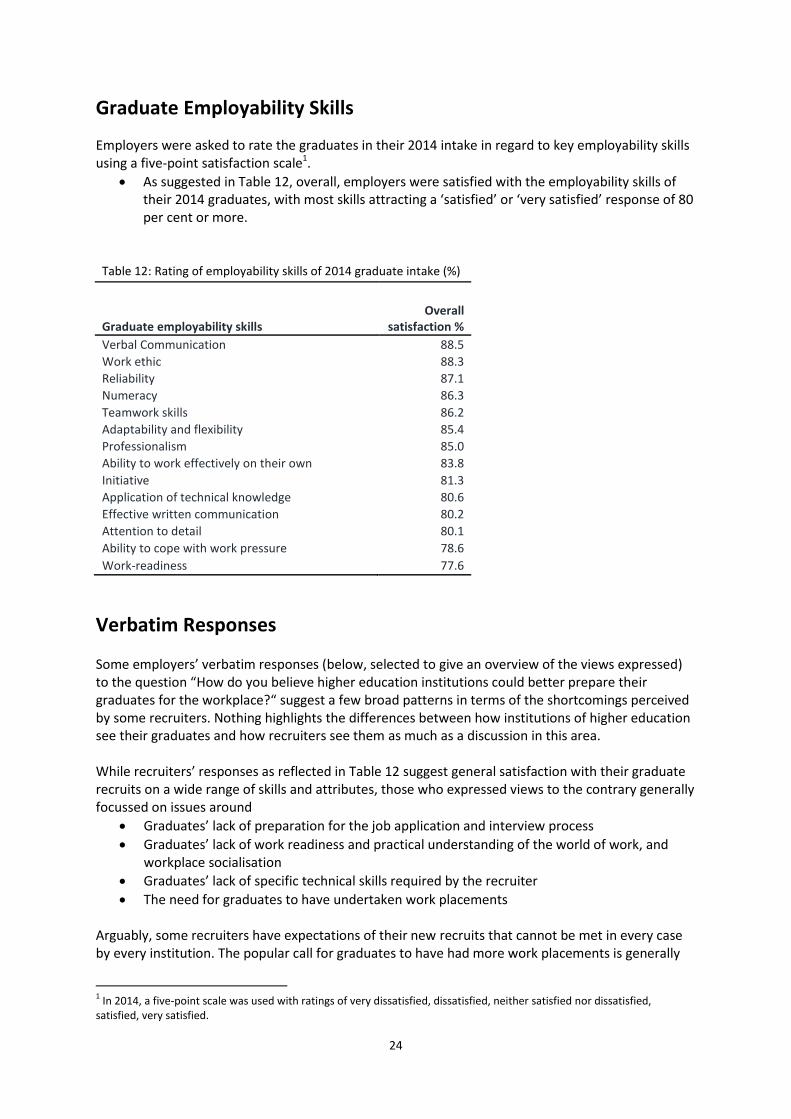
Employers were asked to rate the graduates in their 2014 intake in regard to key employability skills using a five-point satisfaction scale1.
As suggested in Table 12, overall, employers were satisfied with the employability skills of their 2014 graduates, with most skills attracting a ‘satisfied’ or ‘very satisfied’ response of 80 per cent or more.
Table 12: Rating of employability skills of 2014 graduate intake (%)
Graduate employability skills Overall
satisfaction %
Verbal Communication 88.5
Work ethic 88.3
Reliability 87.1
Numeracy 86.3
Teamwork skills 86.2
Adaptability and flexibility 85.4
Professionalism 85.0
Ability to work effectively on their own 83.8
Initiative 81.3
Application of technical knowledge 80.6
Effective written communication 80.2
Attention to detail 80.1
Ability to cope with work pressure 78.6
Work-readiness 77.6
Verbatim Responses Some employers’ verbatim responses (below, selected to give an overview of the views expressed) to the question “How do you believe higher education institutions could better prepare their graduates for the workplace?“ suggest a few broad patterns in terms of the shortcomings perceived by some recruiters. Nothing highlights the differences between how institutions of higher education see their graduates and how recruiters see them as much as a discussion in this area. While recruiters’ responses as reflected in Table 12 suggest general satisfaction with their graduate recruits on a wide range of skills and attributes, those who expressed views to the contrary generally focussed on issues around
Graduates’ lack of preparation for the job application and interview process
Graduates’ lack of work readiness and practical understanding of the world of work, and workplace socialisation
Graduates’ lack of specific technical skills required by the recruiter
The need for graduates to have undertaken work placements Arguably, some recruiters have expectations of their new recruits that cannot be met in every case by every institution. The popular call for graduates to have had more work placements is generally
1 In 2014, a five-point scale was used with ratings of very dissatisfied, dissatisfied, neither satisfied nor dissatisfied,
satisfied, very satisfied.
25
not met by recruiters offering to make such placements possible (and notwithstanding the actual number of such placements that would be needed to make this an eventuality). And this does not take into account the legalities of the human resources issues related to such an undertaking. An earlier suggestion arising from some recruiters’ preferences to hire graduates from preferred institutions related to the need for institutions to develop and maintain research and/or collaborative partnerships with employers. If this was addressed, it could see recruiters able to advise institutions on the broad and specific skills they needed to see in their recruits. It could also result in recruiters having a greater understanding of the constraints and possibilities inherent in the education of students towards graduation. Verbatim responses from employers follow. “How do you believe higher education institutions could better prepare their graduates for the workplace?”
Many graduates seem surprised that I understand the areas of study they have covered and
even more surprised that I expect them to apply what they have used at uni in the
workplace!
I have employed full time uni students for many years and there is … [a] chasm between
what they learn at uni and applying it in real life
Ensuring a subject is included in the degree that focuses on being 'work ready'
Including some kind of industry based learning experience during the degree
Partnering with employers to allow them to participate in lectures, or do presentations
All degrees should introduce a compulsory work experience component in their course. We
find graduates from disciplines such as accounting and human resources less job ready than
engineering students, as most don't seek out vacation work.
Apart from gaining a better understanding of a particular industry/ies, they [need to] learn
how to manage their time, work to deadlines and improve writing/presentation skills
By giving them a realistic understand of how hard they must work to keep growing a career
and give them a better understanding of the basic skills they need in their chosen
employment
Course work to be more practical in nature. This would complement any other work
experience/placements.
During interviewing graduate candidates, we saw a pattern in their expectations of
employment conditions that we believe is unrealistic for their first position within industry.
Specifically, they all believed that they were worth salaries that were being paid to industry
experienced experts from their first day, as well as expecting to have many technology perks
(equipment, tele-commuting, overseas education and travel etc) in their probation period. In
26
our particular organisation, employees must prove their value to the team and clients to be
given these types of perks.
Running more group projects at universities. There are some degrees which have very little
group work, which means students lack teaming skills, and building relationships.
[Modify graduate] expectations of first position out of university and preparation for
interviews
Greater resilience, emotional intelligence and communication skills to adapt to a corporate
environment
I feel running a compulsory subject around employability skills would be beneficial
Reality check!
There needs to be a deeper engagement with industry
Understand that they start at the bottom of the corporate ladder. "Management" students,
in particular, seem to have the idea that they will be in managerial roles.
Unpaid 2-3 week work placements are an excellent way for organisations to find out about
suitable candidates. This also gives candidates an idea of the actual working environment.
However, some recruiters were satisfied with the graduates they were interviewing:
Candidates are quite well prepared
I am very satisfied with the experience of those that applied
They do a good job
They [the institution] provide the most relevant candidates to us
27
2014 Graduate Intake
Graduate Training
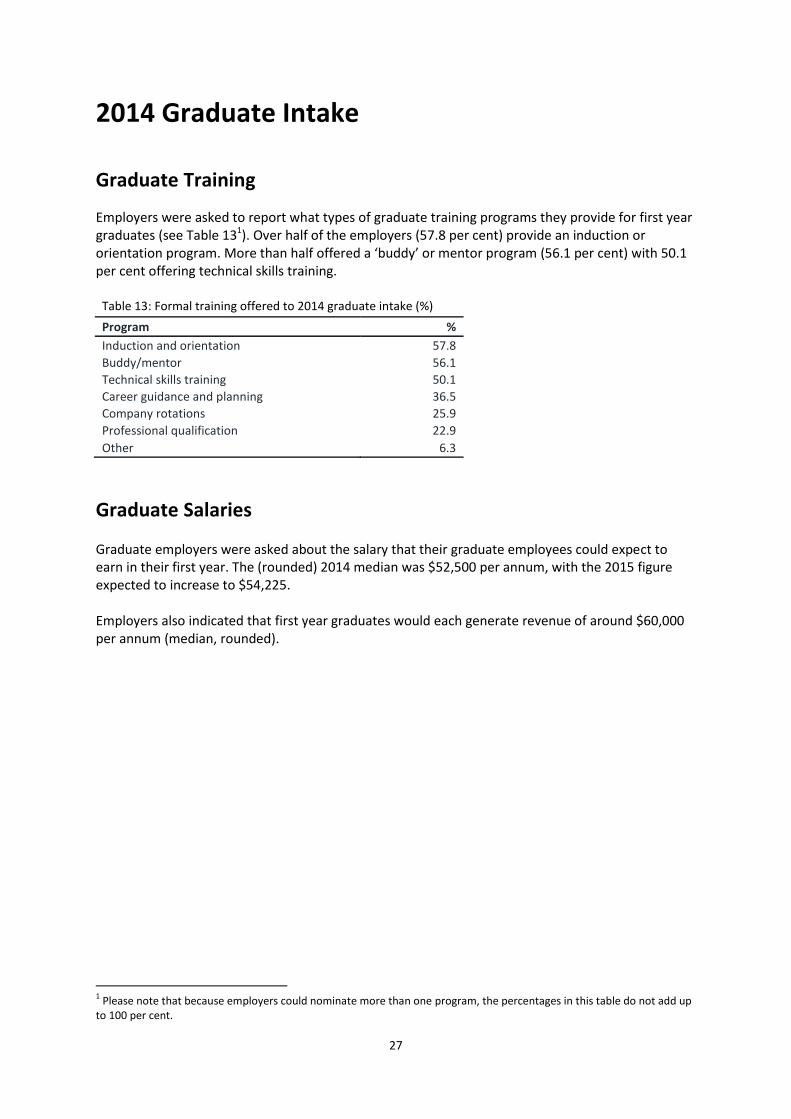
Employers were asked to report what types of graduate training programs they provide for first year graduates (see Table 131). Over half of the employers (57.8 per cent) provide an induction or orientation program. More than half offered a ‘buddy’ or mentor program (56.1 per cent) with 50.1 per cent offering technical skills training.
Table 13: Formal training offered to 2014 graduate intake (%)
Program %
Induction and orientation 57.8
Buddy/mentor 56.1
Technical skills training 50.1
Career guidance and planning 36.5
Company rotations 25.9
Professional qualification 22.9
Other 6.3
Graduate Salaries Graduate employers were asked about the salary that their graduate employees could expect to earn in their first year. The (rounded) 2014 median was $52,500 per annum, with the 2015 figure expected to increase to $54,225. Employers also indicated that first year graduates would each generate revenue of around $60,000 per annum (median, rounded).
1 Please note that because employers could nominate more than one program, the percentages in this table do not add up
to 100 per cent.
28
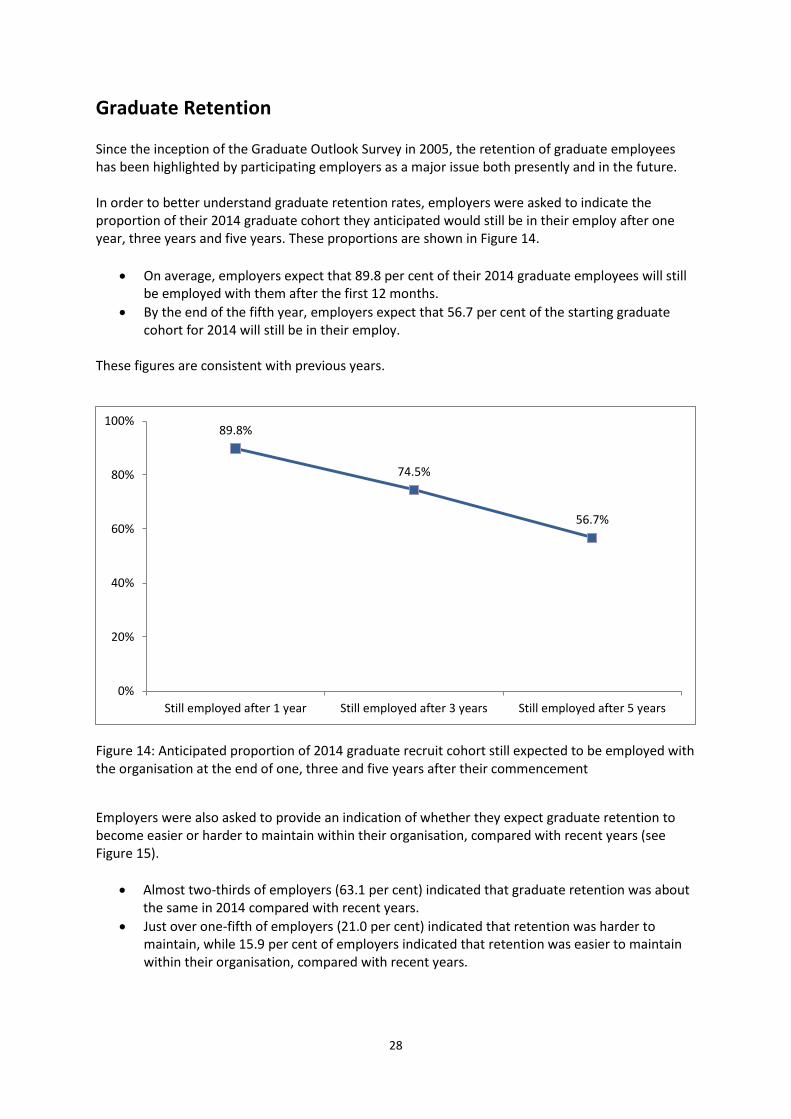
Graduate Retention
Since the inception of the Graduate Outlook Survey in 2005, the retention of graduate employees has been highlighted by participating employers as a major issue both presently and in the future. In order to better understand graduate retention rates, employers were asked to indicate the proportion of their 2014 graduate cohort they anticipated would still be in their employ after one year, three years and five years. These proportions are shown in Figure 14.
On average, employers expect that 89.8 per cent of their 2014 graduate employees will still be employed with them after the first 12 months.
By the end of the fifth year, employers expect that 56.7 per cent of the starting graduate cohort for 2014 will still be in their employ.
These figures are consistent with previous years.
Figure 14: Anticipated proportion of 2014 graduate recruit cohort still expected to be employed with the organisation at the end of one, three and five years after their commencement
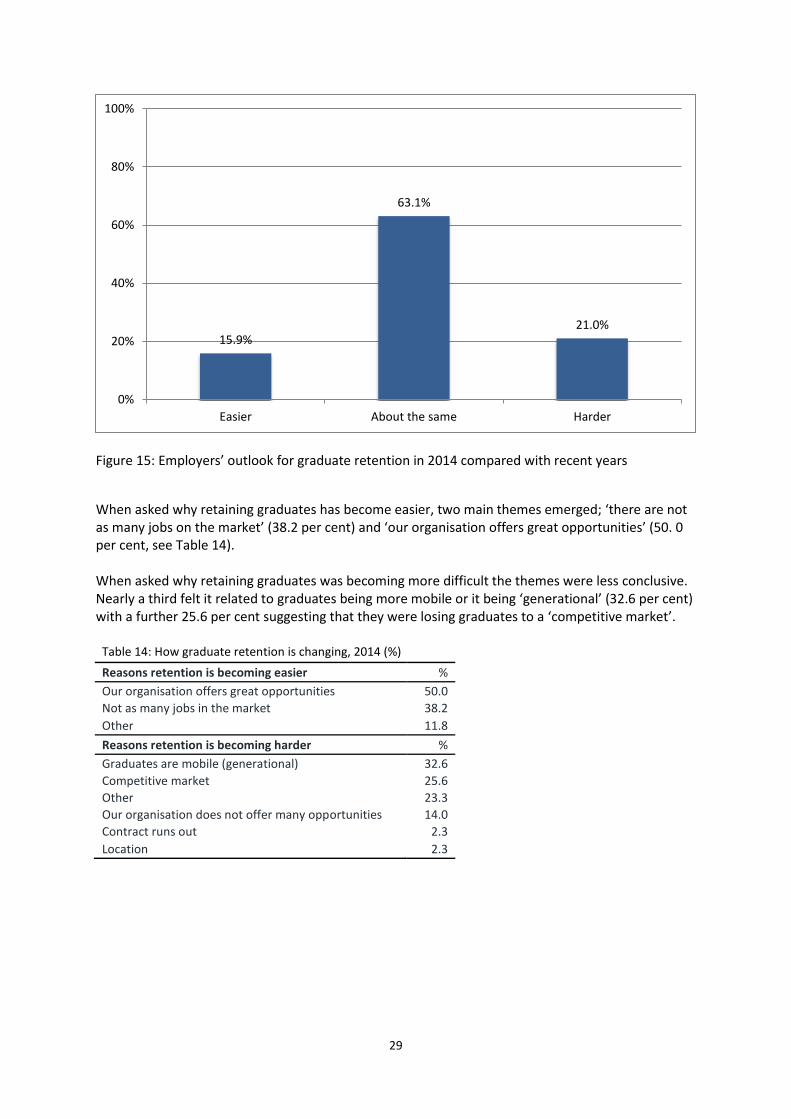
Employers were also asked to provide an indication of whether they expect graduate retention to become easier or harder to maintain within their organisation, compared with recent years (see Figure 15).
Almost two-thirds of employers (63.1 per cent) indicated that graduate retention was about the same in 2014 compared with recent years.
Just over one-fifth of employers (21.0 per cent) indicated that retention was harder to maintain, while 15.9 per cent of employers indicated that retention was easier to maintain within their organisation, compared with recent years.
89.8%
74.5%
56.7%
0%
20%
40%
60%
80%
100%
Still employed after 1 year Still employed after 3 years Still employed after 5 years
29
Figure 15: Employers’ outlook for graduate retention in 2014 compared with recent years
When asked why retaining graduates has become easier, two main themes emerged; ‘there are not as many jobs on the market’ (38.2 per cent) and ‘our organisation offers great opportunities’ (50. 0 per cent, see Table 14). When asked why retaining graduates was becoming more difficult the themes were less conclusive. Nearly a third felt it related to graduates being more mobile or it being ‘generational’ (32.6 per cent) with a further 25.6 per cent suggesting that they were losing graduates to a ‘competitive market’.
Table 14: How graduate retention is changing, 2014 (%)
Reasons retention is becoming easier %
Our organisation offers great opportunities 50.0
Not as many jobs in the market 38.2
Other 11.8
Reasons retention is becoming harder %
Graduates are mobile (generational) 32.6
Competitive market 25.6
Other 23.3
Our organisation does not offer many opportunities 14.0
Contract runs out 2.3
Location 2.3
15.9%
63.1%
21.0%
0%
20%
40%
60%
80%
100%
Easier About the same Harder
30
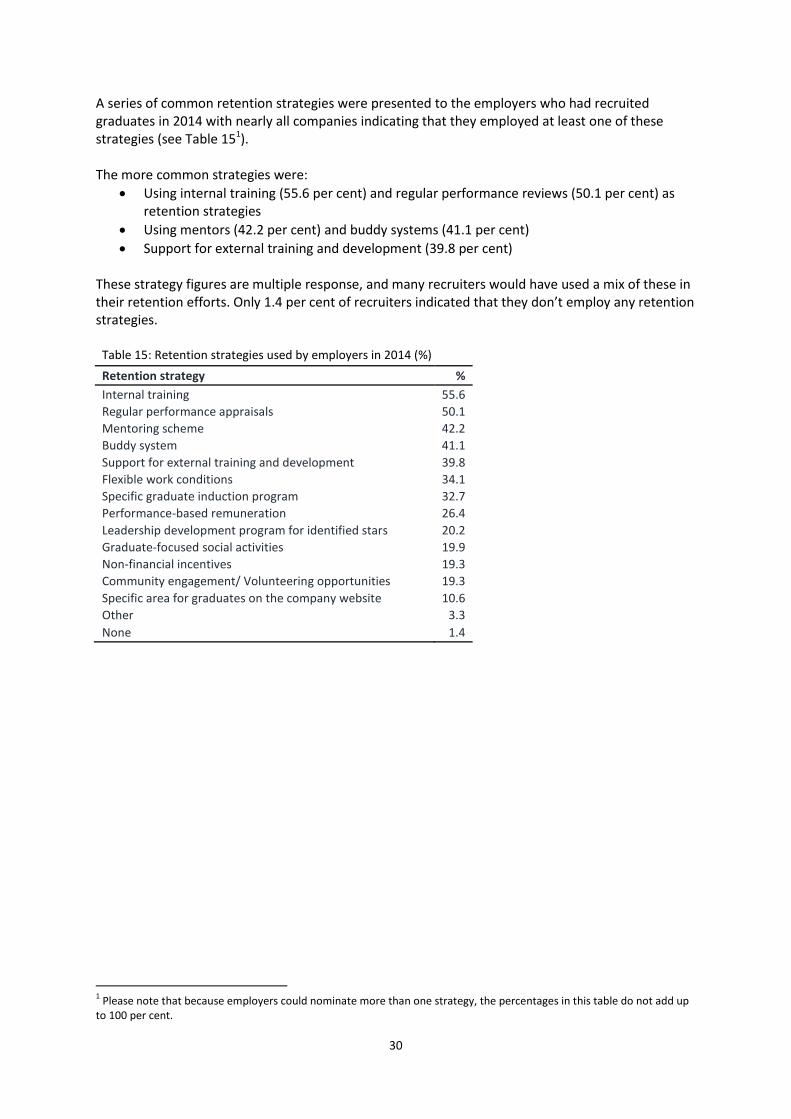
A series of common retention strategies were presented to the employers who had recruited graduates in 2014 with nearly all companies indicating that they employed at least one of these strategies (see Table 151). The more common strategies were:
Using internal training (55.6 per cent) and regular performance reviews (50.1 per cent) as retention strategies
Using mentors (42.2 per cent) and buddy systems (41.1 per cent)
Support for external training and development (39.8 per cent) These strategy figures are multiple response, and many recruiters would have used a mix of these in their retention efforts. Only 1.4 per cent of recruiters indicated that they don’t employ any retention strategies.
Table 15: Retention strategies used by employers in 2014 (%)
Retention strategy %
Internal training 55.6
Regular performance appraisals 50.1
Mentoring scheme 42.2
Buddy system 41.1
Support for external training and development 39.8
Flexible work conditions 34.1
Specific graduate induction program 32.7
Performance-based remuneration 26.4
Leadership development program for identified stars 20.2
Graduate-focused social activities 19.9
Non-financial incentives 19.3
Community engagement/ Volunteering opportunities 19.3
Specific area for graduates on the company website 10.6
Other 3.3
None 1.4
1 Please note that because employers could nominate more than one strategy, the percentages in this table do not add up
to 100 per cent.
31
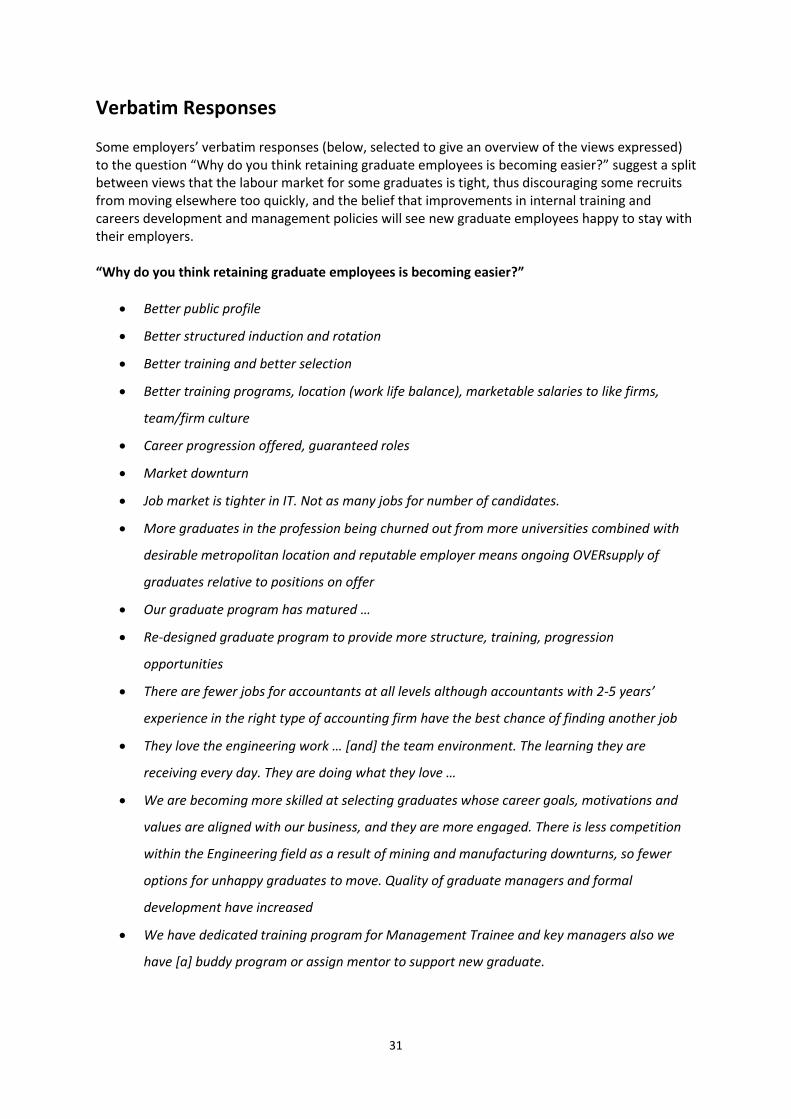
Verbatim Responses Some employers’ verbatim responses (below, selected to give an overview of the views expressed) to the question “Why do you think retaining graduate employees is becoming easier?” suggest a split between views that the labour market for some graduates is tight, thus discouraging some recruits from moving elsewhere too quickly, and the belief that improvements in internal training and careers development and management policies will see new graduate employees happy to stay with their employers. “Why do you think retaining graduate employees is becoming easier?”
Better public profile
Better structured induction and rotation
Better training and better selection
Better training programs, location (work life balance), marketable salaries to like firms,
team/firm culture
Career progression offered, guaranteed roles
Market downturn
Job market is tighter in IT. Not as many jobs for number of candidates.
More graduates in the profession being churned out from more universities combined with
desirable metropolitan location and reputable employer means ongoing OVERsupply of
graduates relative to positions on offer
Our graduate program has matured …
Re-designed graduate program to provide more structure, training, progression
opportunities
There are fewer jobs for accountants at all levels although accountants with 2-5 years’
experience in the right type of accounting firm have the best chance of finding another job
They love the engineering work … [and] the team environment. The learning they are
receiving every day. They are doing what they love …
We are becoming more skilled at selecting graduates whose career goals, motivations and
values are aligned with our business, and they are more engaged. There is less competition
within the Engineering field as a result of mining and manufacturing downturns, so fewer
options for unhappy graduates to move. Quality of graduate managers and formal
development have increased
We have dedicated training program for Management Trainee and key managers also we
have [a] buddy program or assign mentor to support new graduate.
32
We have implemented a Career and Competency Framework within the organisation which
has made career progression more transparent and accessible for all employees. Our
retention rates have decreased across the board as a result of this Framework.
We have started student placements within the organisation, which has strengthened our
capacity to attract graduates
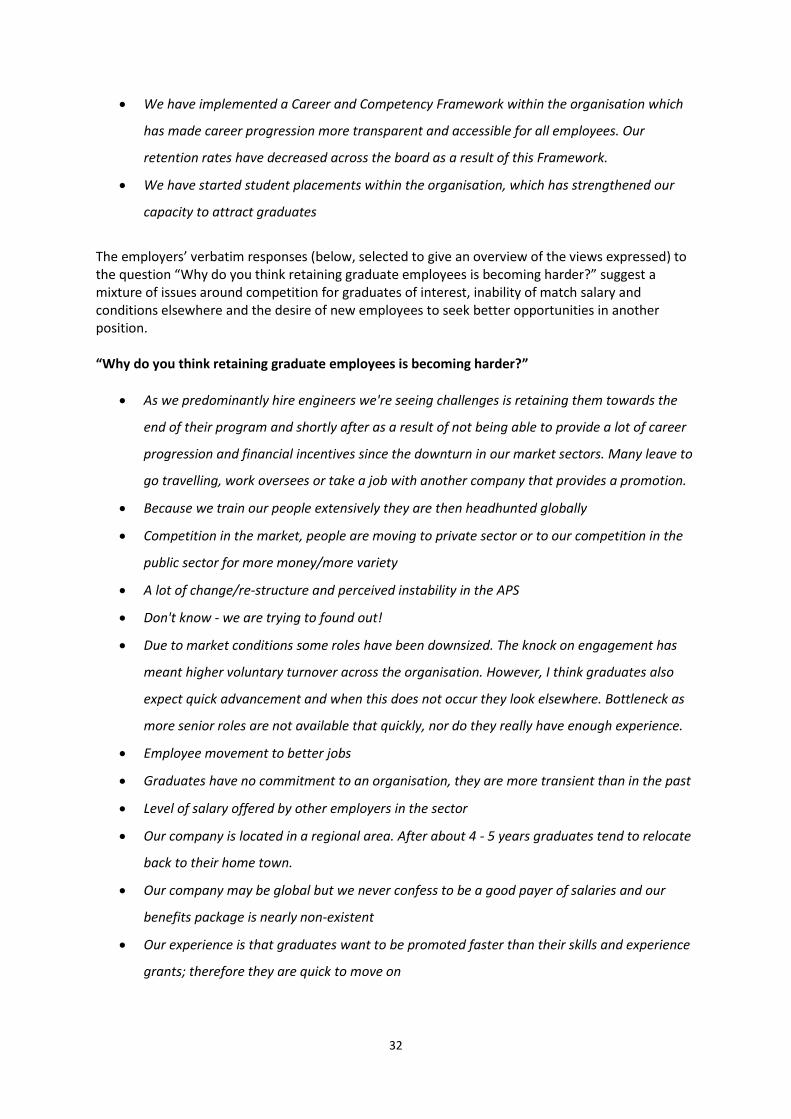
The employers’ verbatim responses (below, selected to give an overview of the views expressed) to the question “Why do you think retaining graduate employees is becoming harder?” suggest a mixture of issues around competition for graduates of interest, inability of match salary and conditions elsewhere and the desire of new employees to seek better opportunities in another position. “Why do you think retaining graduate employees is becoming harder?”
As we predominantly hire engineers we're seeing challenges is retaining them towards the
end of their program and shortly after as a result of not being able to provide a lot of career
progression and financial incentives since the downturn in our market sectors. Many leave to
go travelling, work oversees or take a job with another company that provides a promotion.
Because we train our people extensively they are then headhunted globally
Competition in the market, people are moving to private sector or to our competition in the
public sector for more money/more variety
A lot of change/re-structure and perceived instability in the APS
Don't know - we are trying to found out!
Due to market conditions some roles have been downsized. The knock on engagement has
meant higher voluntary turnover across the organisation. However, I think graduates also
expect quick advancement and when this does not occur they look elsewhere. Bottleneck as
more senior roles are not available that quickly, nor do they really have enough experience.
Employee movement to better jobs
Graduates have no commitment to an organisation, they are more transient than in the past
Level of salary offered by other employers in the sector
Our company is located in a regional area. After about 4 - 5 years graduates tend to relocate
back to their home town.
Our company may be global but we never confess to be a good payer of salaries and our
benefits package is nearly non-existent
Our experience is that graduates want to be promoted faster than their skills and experience
grants; therefore they are quick to move on

33
Promotion opportunities within the government sector have been limited over the past 2
years
The wage does not increase or reflect the increase in skill base of the employee
The work is repetitive year on year and they don't have the patience to see beyond where
they are at a particular point in time
34
New Graduate Employees’ Perspectives In order to gain an all-round perspective of the graduate employment market, the 2015 GOS gave employers the opportunity to provide the work contact details of their 2014 graduate employees so that they too could be surveyed about their experience. Of the employers that did so, we received 135 responses from recently graduated employees.
Entering the Workforce
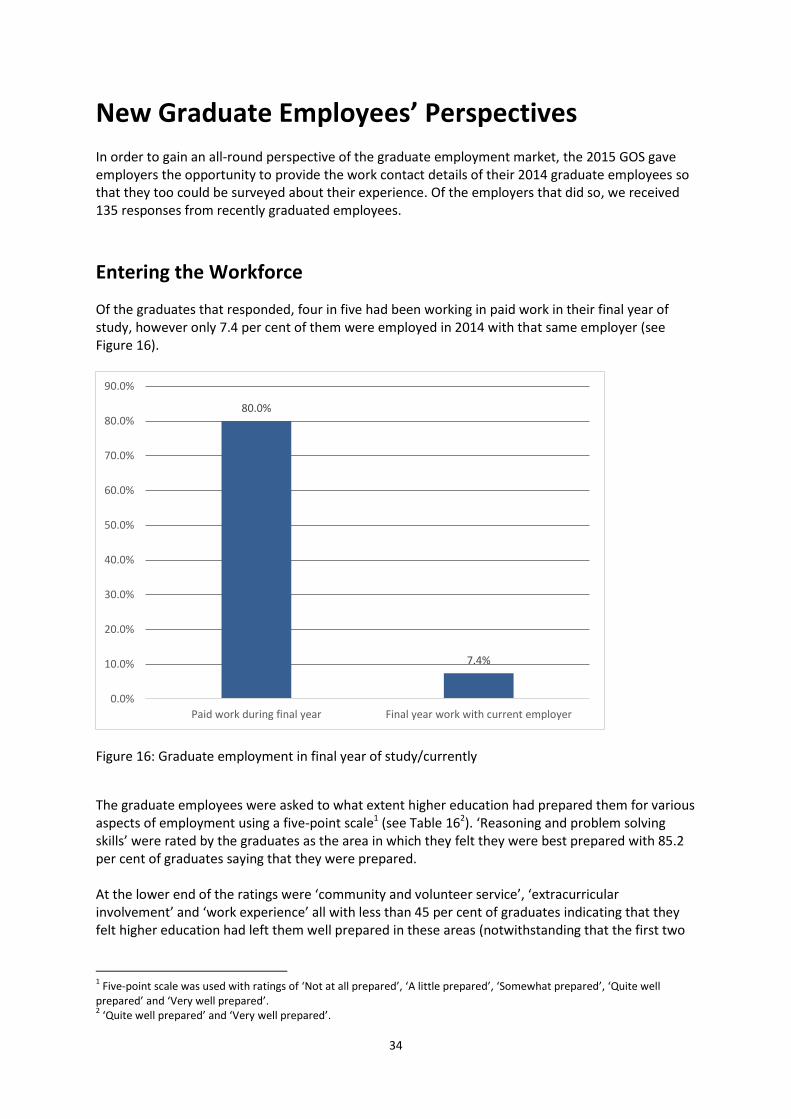
Of the graduates that responded, four in five had been working in paid work in their final year of study, however only 7.4 per cent of them were employed in 2014 with that same employer (see Figure 16).
Figure 16: Graduate employment in final year of study/currently
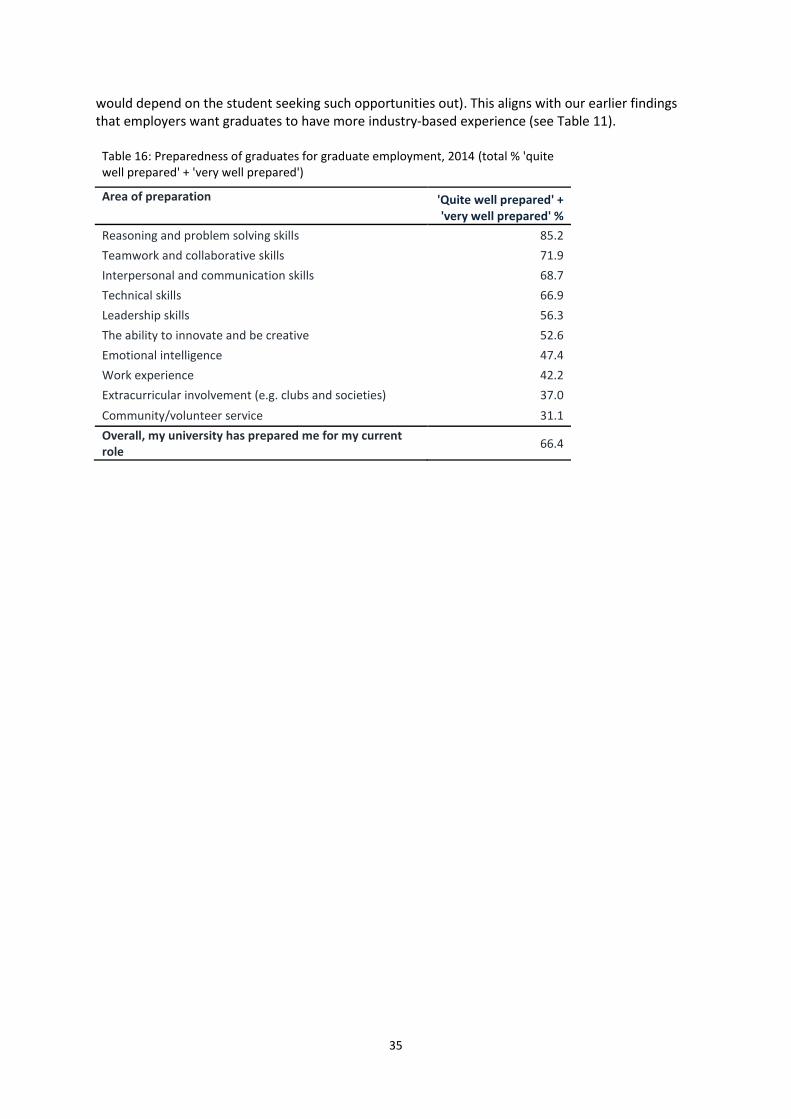
The graduate employees were asked to what extent higher education had prepared them for various aspects of employment using a five-point scale1 (see Table 162). ‘Reasoning and problem solving skills’ were rated by the graduates as the area in which they felt they were best prepared with 85.2 per cent of graduates saying that they were prepared. At the lower end of the ratings were ‘community and volunteer service’, ‘extracurricular involvement’ and ‘work experience’ all with less than 45 per cent of graduates indicating that they felt higher education had left them well prepared in these areas (notwithstanding that the first two
1 Five-point scale was used with ratings of ‘Not at all prepared’, ‘A little prepared’, ‘Somewhat prepared’, ‘Quite well
prepared’ and ‘Very well prepared’. 2 ‘Quite well prepared’ and ‘Very well prepared’.
80.0%
7.4%
0.0%
10.0%
20.0%
30.0%
40.0%
50.0%
60.0%
70.0%
80.0%
90.0%
Paid work during final year Final year work with current employer
35
would depend on the student seeking such opportunities out). This aligns with our earlier findings that employers want graduates to have more industry-based experience (see Table 11).
Table 16: Preparedness of graduates for graduate employment, 2014 (total % 'quite well prepared' + 'very well prepared')
Area of preparation 'Quite well prepared' + 'very well prepared' %
Reasoning and problem solving skills 85.2
Teamwork and collaborative skills 71.9
Interpersonal and communication skills 68.7
Technical skills 66.9
Leadership skills 56.3
The ability to innovate and be creative 52.6
Emotional intelligence 47.4
Work experience 42.2
Extracurricular involvement (e.g. clubs and societies) 37.0
Community/volunteer service 31.1
Overall, my university has prepared me for my current role
66.4
36
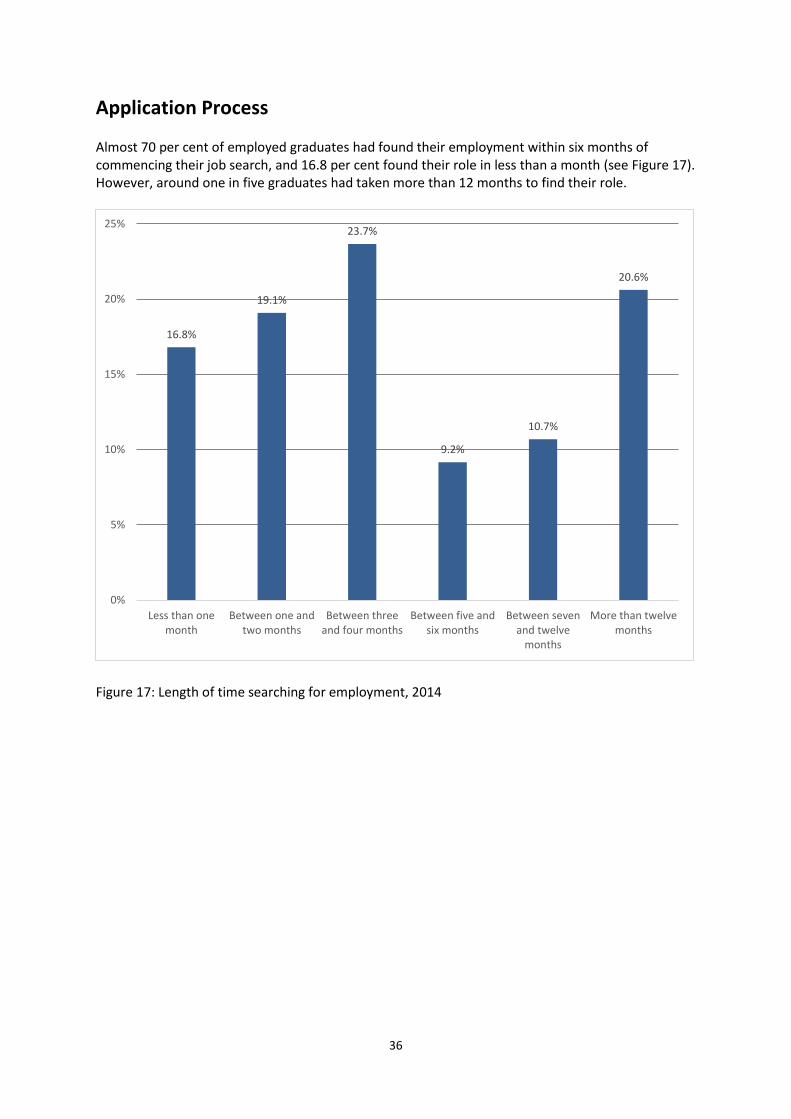
Application Process Almost 70 per cent of employed graduates had found their employment within six months of commencing their job search, and 16.8 per cent found their role in less than a month (see Figure 17). However, around one in five graduates had taken more than 12 months to find their role.
Figure 17: Length of time searching for employment, 2014
16.8%
19.1%
23.7%
9.2%
10.7%
20.6%
0%
5%
10%
15%
20%
25%
Less than onemonth
Between one andtwo months
Between threeand four months
Between five andsix months
Between sevenand twelve
months
More than twelvemonths
37
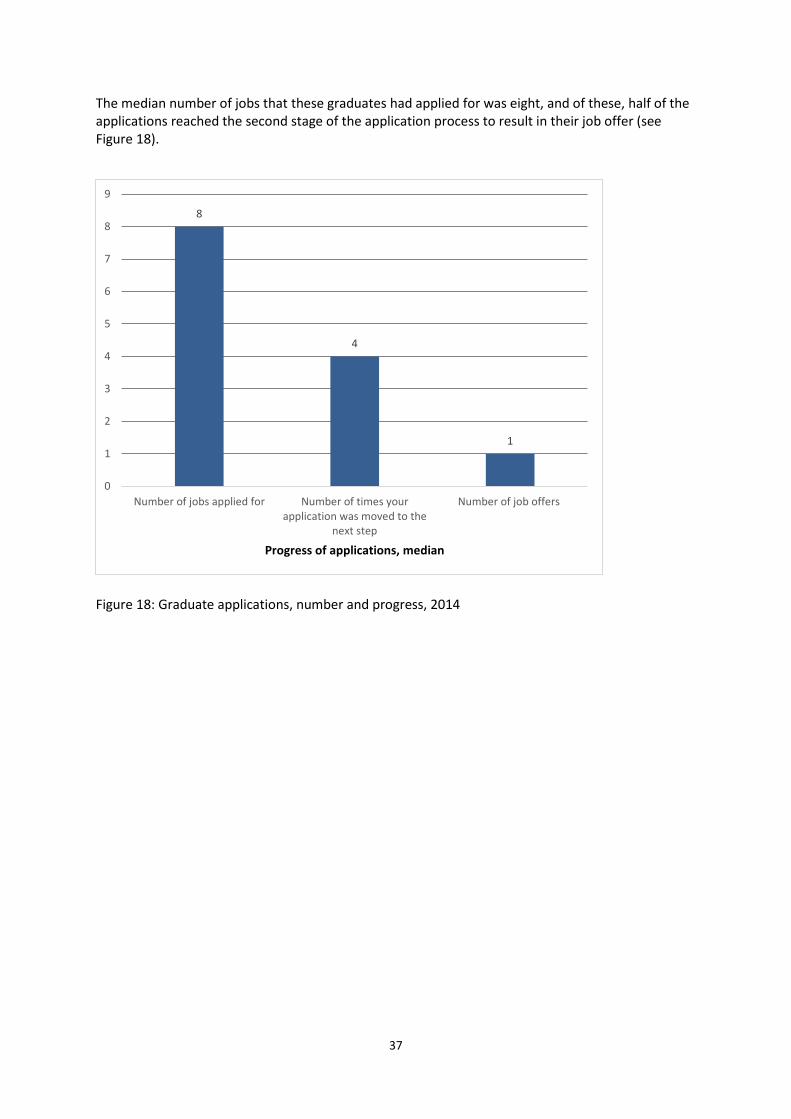
The median number of jobs that these graduates had applied for was eight, and of these, half of the applications reached the second stage of the application process to result in their job offer (see Figure 18).
Figure 18: Graduate applications, number and progress, 2014
8
4
1
0
1
2
3
4
5
6
7
8
9
Number of jobs applied for Number of times yourapplication was moved to the
next step
Number of job offers
Progress of applications, median
38
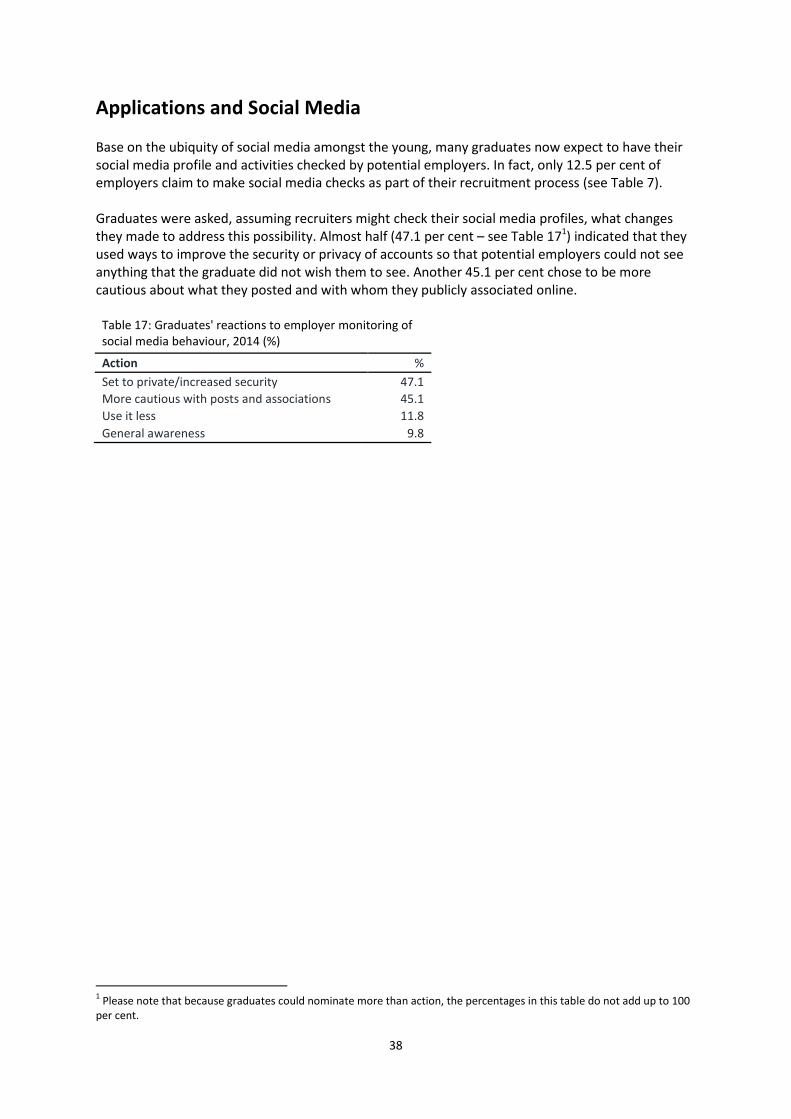
Applications and Social Media Base on the ubiquity of social media amongst the young, many graduates now expect to have their social media profile and activities checked by potential employers. In fact, only 12.5 per cent of employers claim to make social media checks as part of their recruitment process (see Table 7). Graduates were asked, assuming recruiters might check their social media profiles, what changes they made to address this possibility. Almost half (47.1 per cent – see Table 171) indicated that they used ways to improve the security or privacy of accounts so that potential employers could not see anything that the graduate did not wish them to see. Another 45.1 per cent chose to be more cautious about what they posted and with whom they publicly associated online.
Table 17: Graduates' reactions to employer monitoring of social media behaviour, 2014 (%)
Action %
Set to private/increased security 47.1
More cautious with posts and associations 45.1
Use it less 11.8
General awareness 9.8
1 Please note that because graduates could nominate more than action, the percentages in this table do not add up to 100
per cent.
39
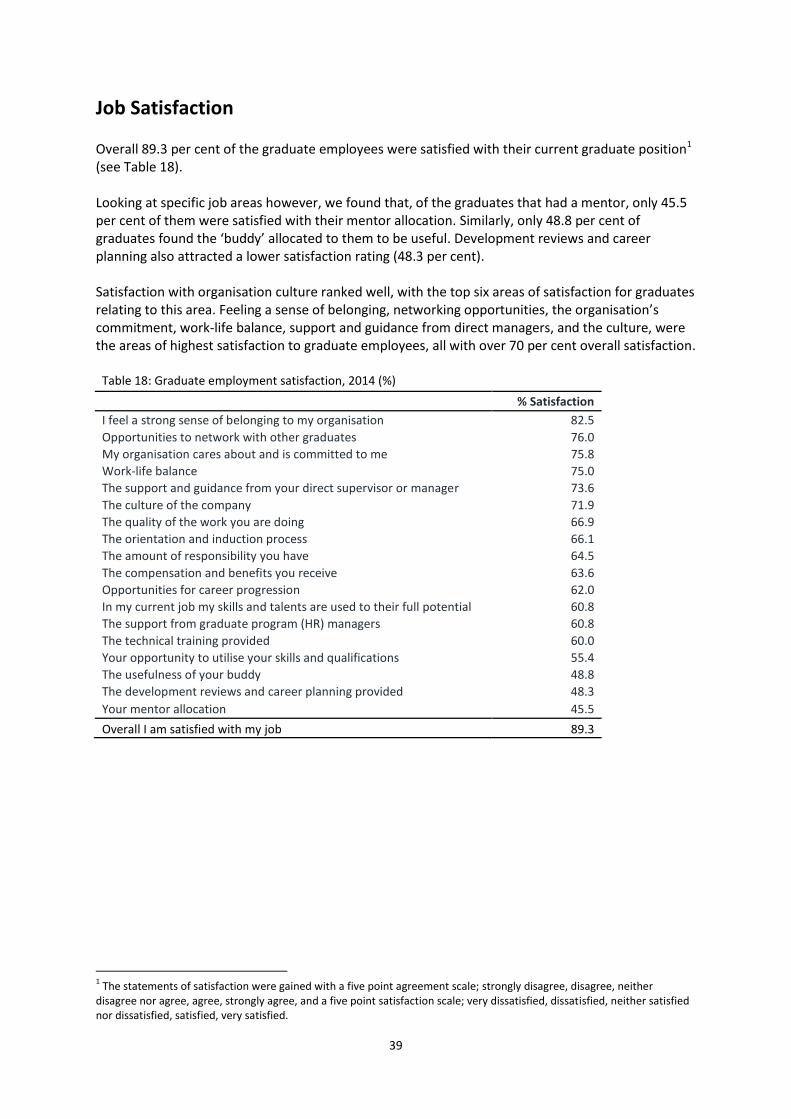
Job Satisfaction
Overall 89.3 per cent of the graduate employees were satisfied with their current graduate position1 (see Table 18). Looking at specific job areas however, we found that, of the graduates that had a mentor, only 45.5 per cent of them were satisfied with their mentor allocation. Similarly, only 48.8 per cent of graduates found the ‘buddy’ allocated to them to be useful. Development reviews and career planning also attracted a lower satisfaction rating (48.3 per cent). Satisfaction with organisation culture ranked well, with the top six areas of satisfaction for graduates relating to this area. Feeling a sense of belonging, networking opportunities, the organisation’s commitment, work-life balance, support and guidance from direct managers, and the culture, were the areas of highest satisfaction to graduate employees, all with over 70 per cent overall satisfaction.
Table 18: Graduate employment satisfaction, 2014 (%)
% Satisfaction
I feel a strong sense of belonging to my organisation 82.5
Opportunities to network with other graduates 76.0
My organisation cares about and is committed to me 75.8
Work-life balance 75.0
The support and guidance from your direct supervisor or manager 73.6
The culture of the company 71.9
The quality of the work you are doing 66.9
The orientation and induction process 66.1
The amount of responsibility you have 64.5
The compensation and benefits you receive 63.6
Opportunities for career progression 62.0
In my current job my skills and talents are used to their full potential 60.8
The support from graduate program (HR) managers 60.8
The technical training provided 60.0
Your opportunity to utilise your skills and qualifications 55.4
The usefulness of your buddy 48.8
The development reviews and career planning provided 48.3
Your mentor allocation 45.5
Overall I am satisfied with my job 89.3
1 The statements of satisfaction were gained with a five point agreement scale; strongly disagree, disagree, neither
disagree nor agree, agree, strongly agree, and a five point satisfaction scale; very dissatisfied, dissatisfied, neither satisfied nor dissatisfied, satisfied, very satisfied.
40
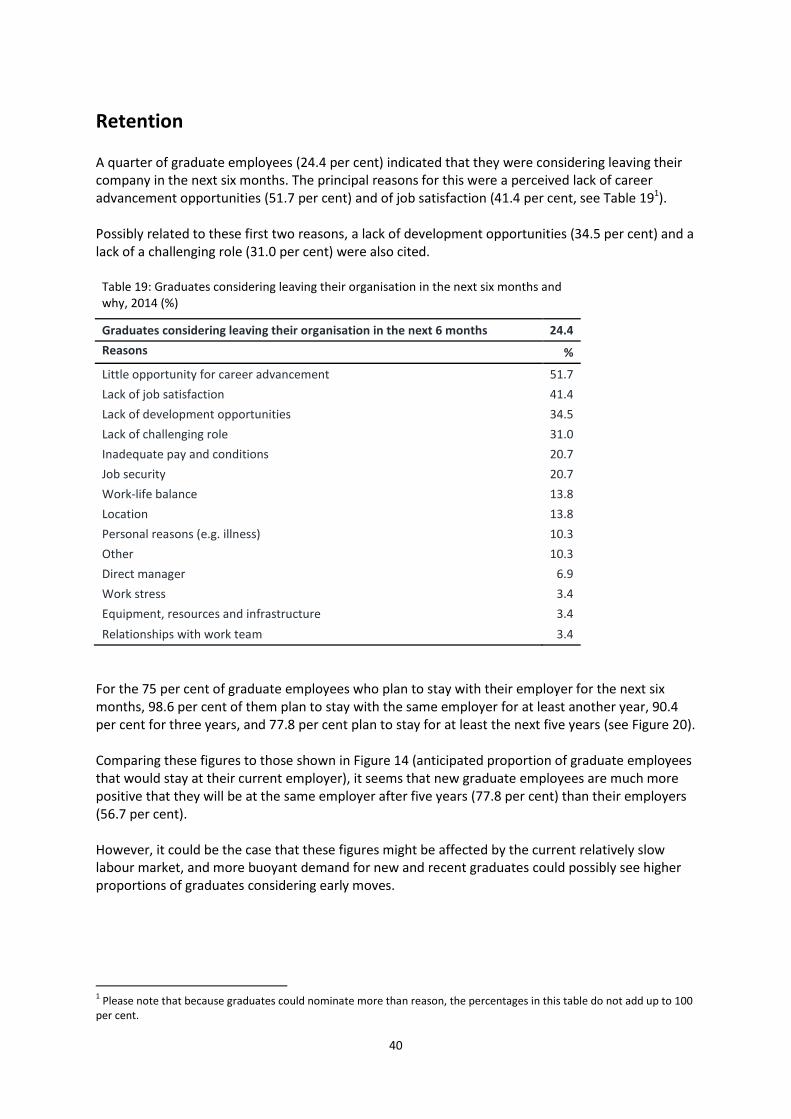
Retention
A quarter of graduate employees (24.4 per cent) indicated that they were considering leaving their company in the next six months. The principal reasons for this were a perceived lack of career advancement opportunities (51.7 per cent) and of job satisfaction (41.4 per cent, see Table 191). Possibly related to these first two reasons, a lack of development opportunities (34.5 per cent) and a lack of a challenging role (31.0 per cent) were also cited.
Table 19: Graduates considering leaving their organisation in the next six months and why, 2014 (%)
Graduates considering leaving their organisation in the next 6 months 24.4
Reasons %
Little opportunity for career advancement 51.7
Lack of job satisfaction 41.4
Lack of development opportunities 34.5
Lack of challenging role 31.0
Inadequate pay and conditions 20.7
Job security 20.7
Work-life balance 13.8
Location 13.8
Personal reasons (e.g. illness) 10.3
Other 10.3
Direct manager 6.9
Work stress 3.4
Equipment, resources and infrastructure 3.4
Relationships with work team 3.4
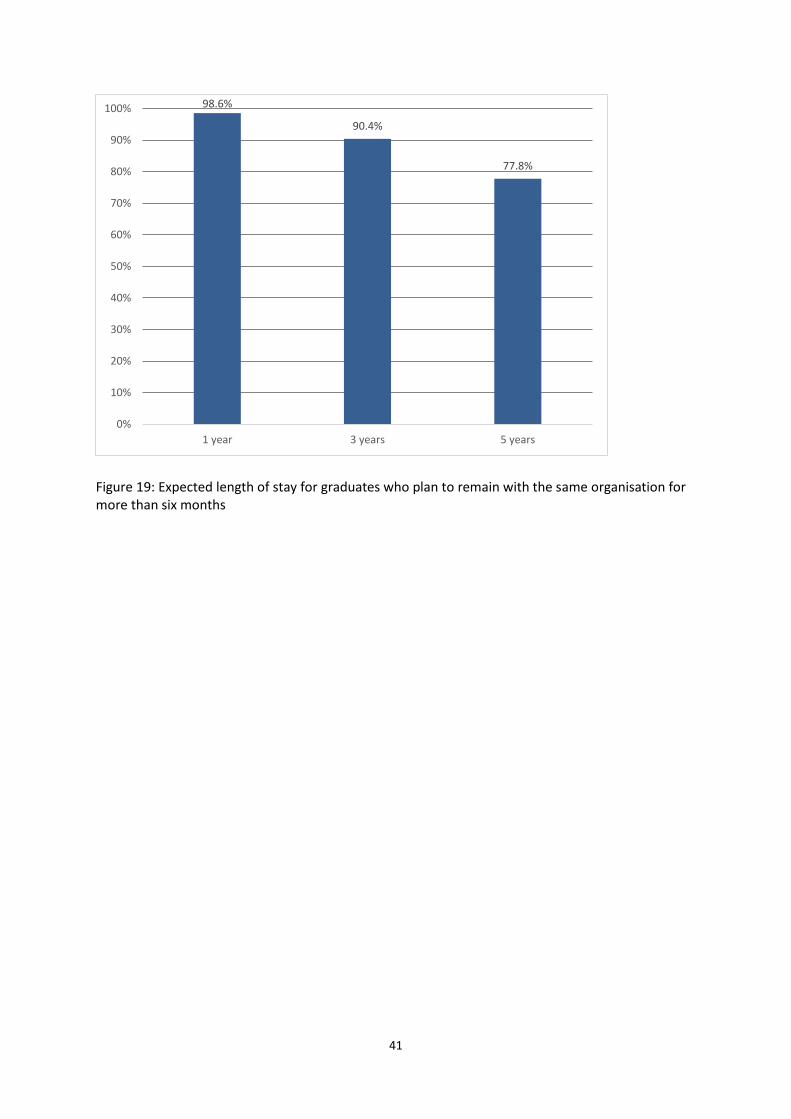
For the 75 per cent of graduate employees who plan to stay with their employer for the next six months, 98.6 per cent of them plan to stay with the same employer for at least another year, 90.4 per cent for three years, and 77.8 per cent plan to stay for at least the next five years (see Figure 20). Comparing these figures to those shown in Figure 14 (anticipated proportion of graduate employees that would stay at their current employer), it seems that new graduate employees are much more positive that they will be at the same employer after five years (77.8 per cent) than their employers (56.7 per cent). However, it could be the case that these figures might be affected by the current relatively slow labour market, and more buoyant demand for new and recent graduates could possibly see higher proportions of graduates considering early moves.
1 Please note that because graduates could nominate more than reason, the percentages in this table do not add up to 100
per cent.
41
Figure 19: Expected length of stay for graduates who plan to remain with the same organisation for more than six months
98.6%
90.4%
77.8%
0%
10%
20%
30%
40%
50%
60%
70%
80%
90%
100%
1 year 3 years 5 years
42
References and Further Reading GCA, 2005. Graduate Outlook 2005. Melbourne: Graduate Careers Australia. GCA, 2006. Graduate Outlook 2006. Melbourne: Graduate Careers Australia. GCA, 2007. Graduate Outlook 2007. Melbourne: Graduate Careers Australia. GCA, 2008. Graduate Outlook 2008. Melbourne: Graduate Careers Australia. GCA, 2009. Graduate Outlook 2009. Melbourne: Graduate Careers Australia. GCA, 2011. Graduate Outlook 2010. Melbourne: Graduate Careers Australia. GCA, 2012. Graduate Outlook 2011. Melbourne: Graduate Careers Australia. GCA, 2013. Graduate Outlook 2012. Melbourne: Graduate Careers Australia. GCA, 2014. Graduate Outlook 2013. Melbourne: Graduate Careers Australia. GCA, 2015. Graduate Outlook 2014. Melbourne: Graduate Careers Australia.
43
Appendix A: The Survey Method
Graduate employers from across Australia who either were contained in GCA’s employer database,
or in the employer databases of participating higher education institutions, were invited to
participate in the 2015 Graduate Outlook Survey (GOS). Employers were contacted via email with an
invitation to participate in the online survey.
From May to June of 2015, 638 graduate employers completed the 2015 GOS, of which 367
employed graduates in 2014. These 367 respondents’ data were considered usable for the
remainder of the survey.
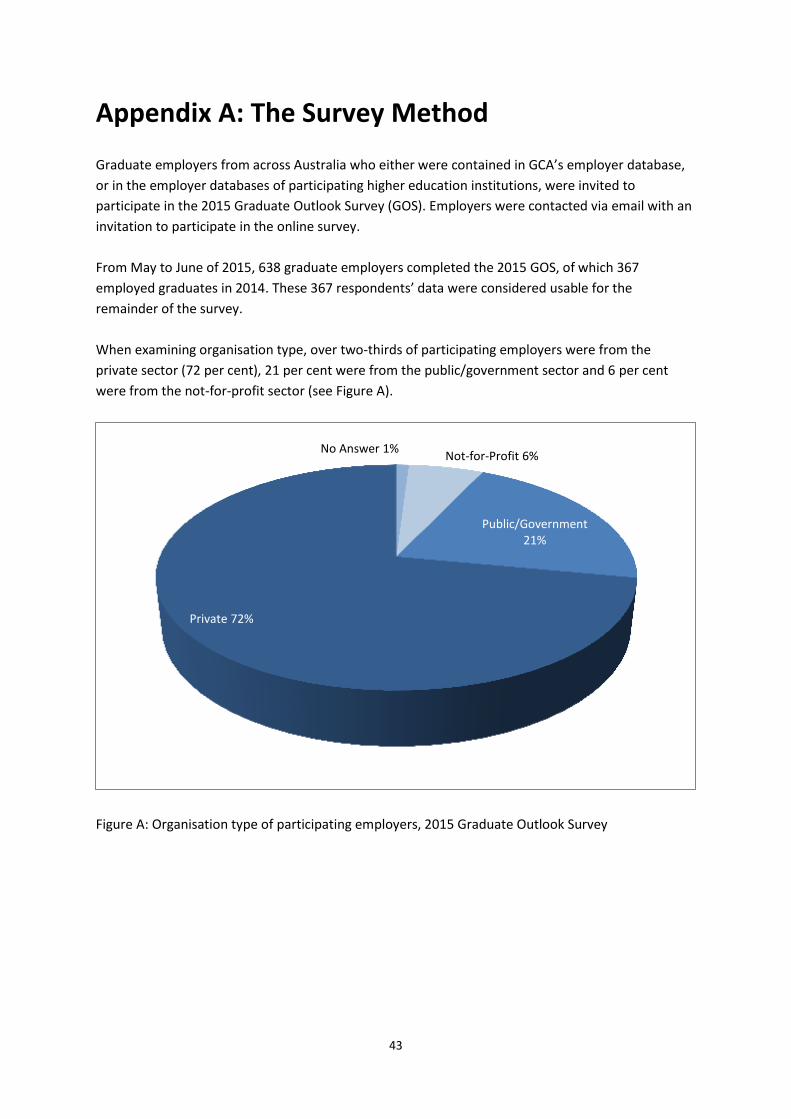
When examining organisation type, over two-thirds of participating employers were from the
private sector (72 per cent), 21 per cent were from the public/government sector and 6 per cent
were from the not-for-profit sector (see Figure A).
Figure A: Organisation type of participating employers, 2015 Graduate Outlook Survey
No Answer 1% Not-for-Profit 6%
Public/Government 21%
Private 72%
44
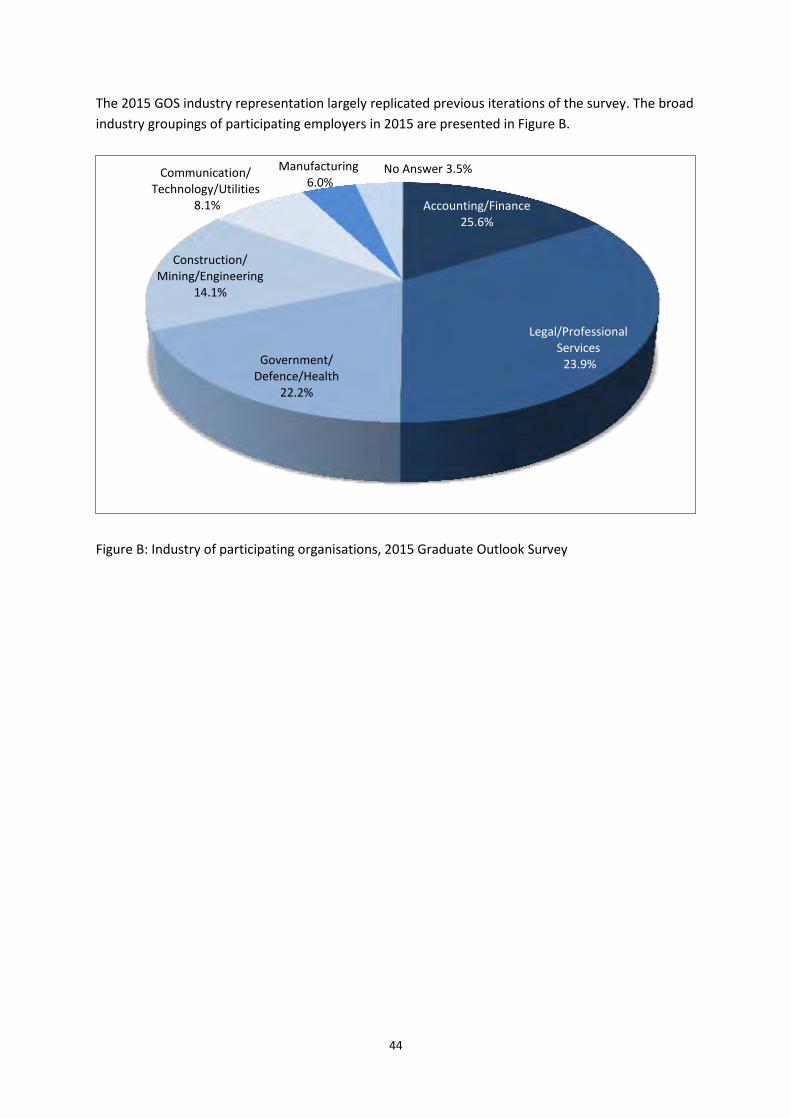
The 2015 GOS industry representation largely replicated previous iterations of the survey. The broad
industry groupings of participating employers in 2015 are presented in Figure B.
Figure B: Industry of participating organisations, 2015 Graduate Outlook Survey
Accounting/Finance 25.6%
Legal/Professional Services 23.9% Government/
Defence/Health 22.2%
Construction/ Mining/Engineering
14.1%
Communication/ Technology/Utilities
8.1%
Manufacturing 6.0%
No Answer 3.5%
45
Level 9, 552 Lonsdale Street, Melbourne VIC 3000 PO Box 13222, Law Courts, Melbourne VIC 8006
tel: +61 3 9605 3700 fax:
+61 3 9670 5752
Email: [email protected] www.graduatecareers.com.au
Graduate Careers Australia Ltd
[Trading as Graduate Careers Australia]