Embed Size (px)
Citation preview

Graphs in the primary gradesAuthor(s): MORRIS PINCUS and FRANCES MORGENSTERNSource: The Arithmetic Teacher, Vol. 17, No. 6 (OCTOBER 1970), pp. 499-501Published by: National Council of Teachers of MathematicsStable URL: http://www.jstor.org/stable/41186248 .
Accessed: 12/06/2014 18:21
Your use of the JSTOR archive indicates your acceptance of the Terms & Conditions of Use, available at .http://www.jstor.org/page/info/about/policies/terms.jsp
.JSTOR is a not-for-profit service that helps scholars, researchers, and students discover, use, and build upon a wide range ofcontent in a trusted digital archive. We use information technology and tools to increase productivity and facilitate new formsof scholarship. For more information about JSTOR, please contact [email protected].
.
National Council of Teachers of Mathematics is collaborating with JSTOR to digitize, preserve and extendaccess to The Arithmetic Teacher.
http://www.jstor.org
This content downloaded from 185.44.77.89 on Thu, 12 Jun 2014 18:21:01 PMAll use subject to JSTOR Terms and Conditions
Graphs in the primary grades MORRIS PINCUS and FRANCES MORGENSTERN
Morris Pincus is Principal at P.S. 194 in Brooklyn, New York, and is a lecturer at Brooklyn College.
Frances Morgenstern is Principal at P.S. 195 in Brooklyn, New York.
JLYlany topics that were formerly intro- duced in the upper grades are now being introduced successfully in the lower grades, some as early as kindergarten. The con- struction and reading of graphs is one of these topics.
Information in graphic form is interest- ing to young children because it is pre- sented in a concrete or pictorial way. Graphs encourage discovery inasmuch as relationships, patterns, trends, and signif- icant changes in the data can be readily perceived. Ideas and information that might otherwise seem complicated or ob- scure can be grasped in this more concise and simplified form. The use of words is re- duced to a minimum or eliminated. Be- cause graphs make possible the presenta- tion and analysis of data in an interesting and clear form, data for their construction can be drawn from other curricular areas, especially science and social studies.
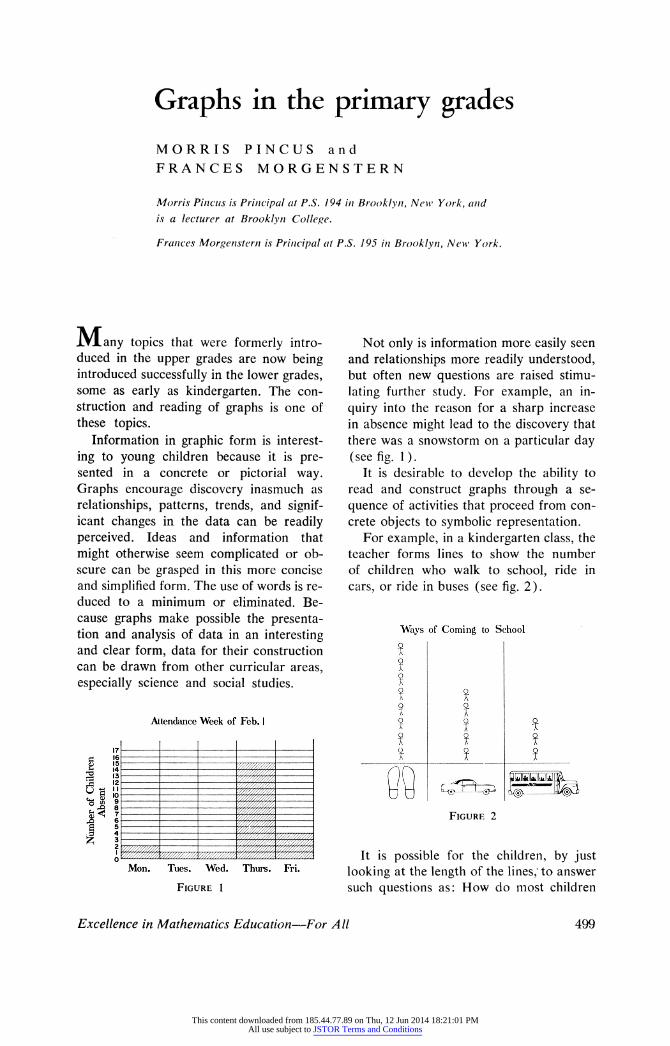
Figure 1
Not only is information more easily seen and relationships more readily understood, but often new questions are raised stimu- lating further study. For example, an in- quiry into the reason for a sharp increase in absence might lead to the discovery that there was a snowstorm on a particular day (see fig. 1).
It is desirable to develop the ability to read and construct graphs through a se- quence of activities that proceed from con- crete objects to symbolic representation.
For example, in a kindergarten class, the teacher forms lines to show the number of children who walk to school, ride in cars, or ride in buses (see fig. 2).
Figure 2
It is possible for the children, by just looking at the length of the lines; to answer such questions as: How do most children
Excellence in Mathematics Education - For All 499
This content downloaded from 185.44.77.89 on Thu, 12 Jun 2014 18:21:01 PMAll use subject to JSTOR Terms and Conditions
come? Do more children come by car or by bus?
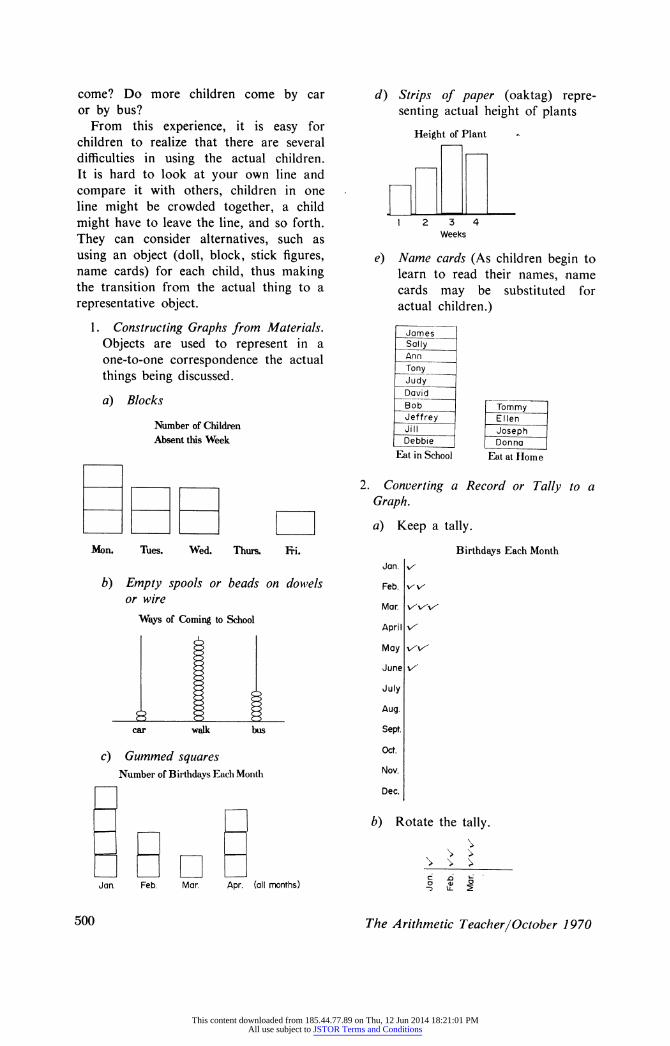
From this experience, it is easy for children to realize that there are several difficulties in using the actual children. It is hard to look at your own line and compare it with others, children in one line might be crowded together, a child might have to leave the line, and so forth. They can consider alternatives, such as using an object (doll, block, stick figures, name cards) for each child, thus making the transition from the actual thing to a representative object.
1. Constructing Graphs from Materials. Objects are used to represent in a one-to-one correspondence the actual things being discussed.
a) Blocks
Number of Children Absent this Week
Mon. Tues. Wed. Thurs. Fri.
b) Empty spools or beads on dowels or wire
Ways of Coming to School
car walk bus
č) Gummed squares Number of Birthdays Each Month
Jan Feb. Mar. Apr. (all months)
d) Strips of paper (oaktag) repre- senting actual height of plants
Height of Plant
12 3 4 Weeks
e) Name cards (As children begin to learn to read their names, name cards may be substituted for actual children.)
James Sally Ann Tony Judy David Bob Tommy Jeffrey Ellen Jill Joseph Debbie
| | Donna
Eat in School Eat at Home
2. Converting a Record or Tally to a Graph.
a) Keep a tally.
Birthdays Each Month Jan. 'S
Feb. >^v
Mar v'W"
April v"
May '/'S
June '/
July
Aug.
Sept.
Oct.
Nov.
Dec.
b) Rotate the tally.
. * ' О О) О -э Ll 5
500 The Arithmetic Teacher /October 1970
This content downloaded from 185.44.77.89 on Thu, 12 Jun 2014 18:21:01 PMAll use subject to JSTOR Terms and Conditions
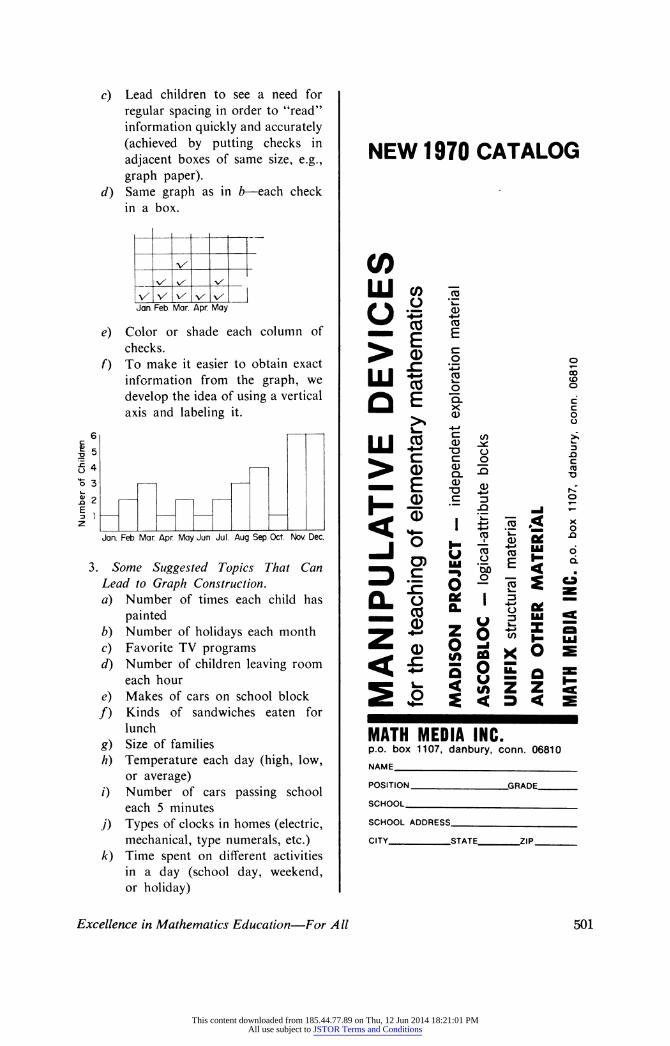
c) Lead children to see a need for regular spacing in order to "read" information quickly and accurately (achieved by putting checks in adjacent boxes of same size, e.g., graph paper).
d) Same graph as in b - each check in a box.
y/_
'/_ '/_ __ _vl V'V ''/ 1 y/ 'y/' I Jan. Feb. Mar. Apr. May
e) Color or shade each column of checks.
0 To make it easier to obtain exact information from the graph, we develop the idea of using a vertical axis and labeling it.
6 i - i - i i5 6 i m - i - i
о 3 i 1 i k_ О) о , , , ■° á I
, I ,
I , I
I ,_ _ _ _ Jan. Feb Mar. Apr May Jun. Jul. Aug Sep. Oct. Nov. Dec.
3. Some Suggested Topics That Can Lead to Graph Construction. a) Number of times each child has
painted b) Number of holidays each month c) Favorite TV programs d) Number of children leaving room
each hour e) Makes of cars on school block /) Kinds of sandwiches eaten for
lunch g) Size of families h) Temperature each day (high, low,
or average) /) Number of cars passing school
each 5 minutes j) Types of clocks in homes (electric,
mechanical, type numerals, etc.) k) Time spent on different activities
in a day (school day, weekend, or holiday)
NEW 1970 CATALOG
-| 1 LU to 1 ¡
ř I 8. Ш I ¡ I I - E -§ в H- %
s i _ -. £
^ о н I le _
! з I ? К 2 I i 5 « l. з ? I о 2 e s « = CL о g °- i в * = _ со °- Mm о * SS «s 2 Ä 5 О « î S 5 2
* « 8 й x о S
^ * s g s о s < ^ z z g ^ S < э < s
MATH MEDIA INC. p.o. box 1107, danbury, conn. 06810 NAME
POSITION .GRADE
SCHOOL
SCHOOL ADDRESS
CITY STATE ZIP
Excellence in Mathematics Education - For All 501
This content downloaded from 185.44.77.89 on Thu, 12 Jun 2014 18:21:01 PMAll use subject to JSTOR Terms and Conditions