Embed Size (px)
Citation preview


Parent Researcher Collaboration
Japan 2006 Round Table parents and researchers together

2015 San Francisco ACOGFirst time stillbirth has been on the program!
3 hour course Etiology, managementAnd prevention of stillbirth
Session OB’s Guide toStillbirth Bereavement(Rana Berry)
Learn and lunchStillbirth Evaluation
Highest contributor to perinatal mortality
Rarely mentioned
“How come no one mentionedstillbirth until we had one?”
(Chris Wildsmith stillbirth parent)


First message:healthy habits, resourcesSmoking cessationhealthy habits in pregnancyExercise is good!Be mindful of fetal movementIf diagnosed with maternal or fetal risk factors
don’t be afraid of asking questions!

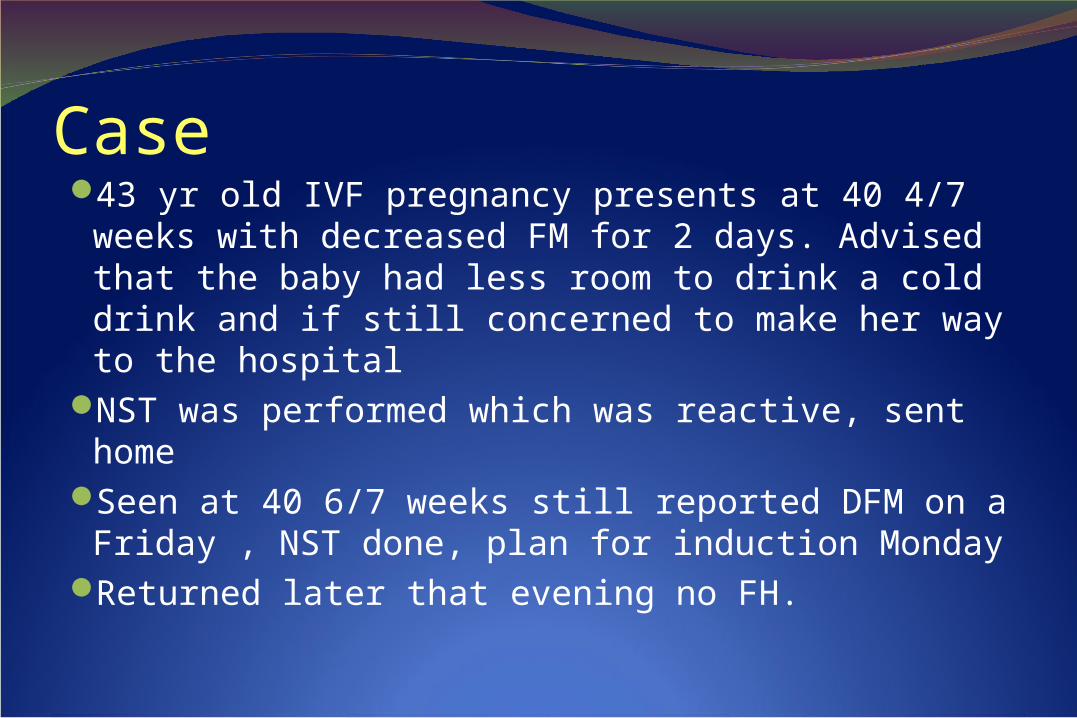
Case43 yr old IVF pregnancy presents at 40 4/7
weeks with decreased FM for 2 days. Advised that the baby had less room to drink a cold drink and if still concerned to make her way to the hospital
NST was performed which was reactive, sent home
Seen at 40 6/7 weeks still reported DFM on a Friday , NST done, plan for induction Monday
Returned later that evening no FH.
DFM at TERMOut-come based on if
the person on call believes that DFM maters
No standard protocolTypical NST>HomeMissed opportunity to
review other potential risks (age, parity)
We know multiple consultations is associated with increased risk
LETS TALK…
Lancet 1989Randomized 60,000 womenDuring the study stillbirth rate 2.8 in
both arms when the pre-study rates were 4.0/1000
Randomize knowledge and vigilance?Hawthorn effect- participate a study for stillbirthStudy it and you will reduce it!
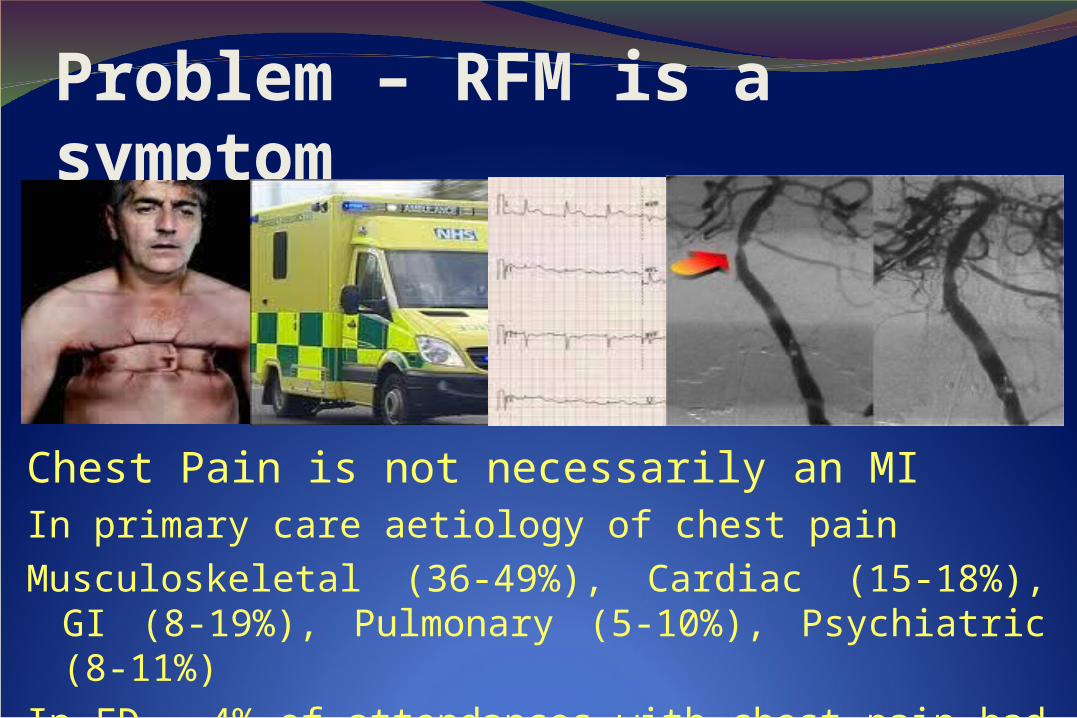
Problem – RFM is a symptomAnother symptom - Chest Pain
Chest Pain is not necessarily an MIIn primary care aetiology of chest pain
Musculoskeletal (36-49%), Cardiac (15-18%), GI (8-19%), Pulmonary (5-10%), Psychiatric (8-11%)
In ED – 4% of attendances with chest pain had MI

1. Use an existing tool to study DFM2. In the setting of quality improvementstudy your outcomes with DFM.
“and meet new friends”
Provider Response
50% of patients were evaluated within 1 hour after they reported decreased fetal movement to their provider.
7% were either admitted for observation or
induction delivery
6% of babies were admitted to the neonatal intensive care unit after delivery.
The rate of US increased from 11% to 18%
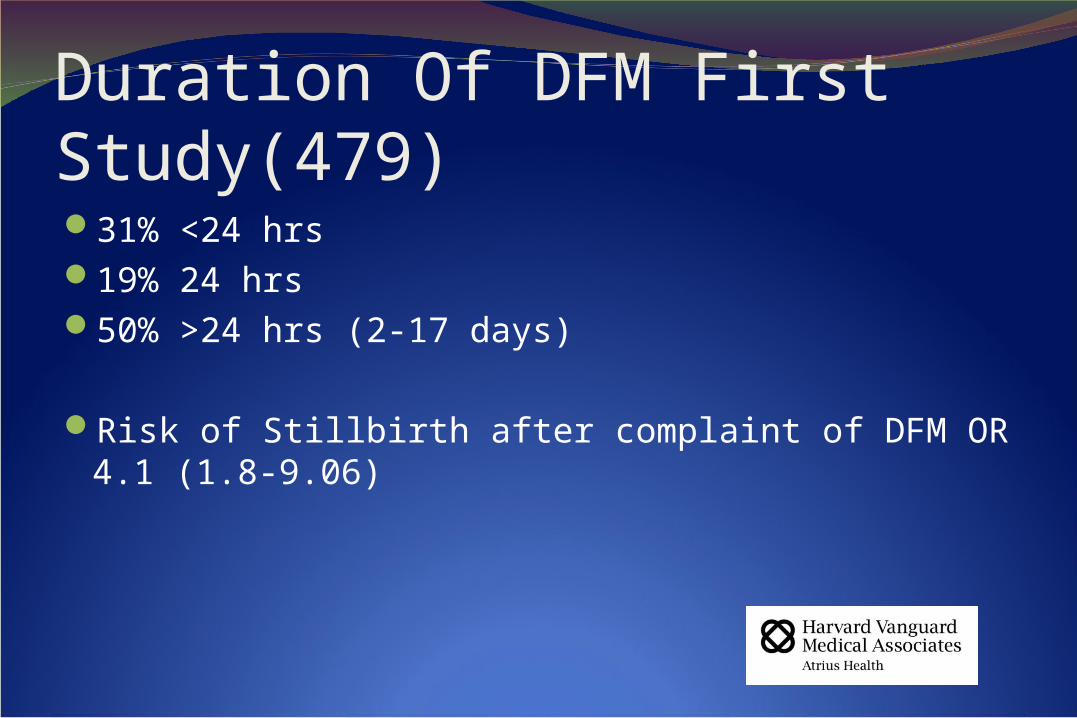
Duration Of DFM First Study(479)31% <24 hrs19% 24 hrs50% >24 hrs (2-17 days)
Risk of Stillbirth after complaint of DFM OR 4.1 (1.8-9.06)
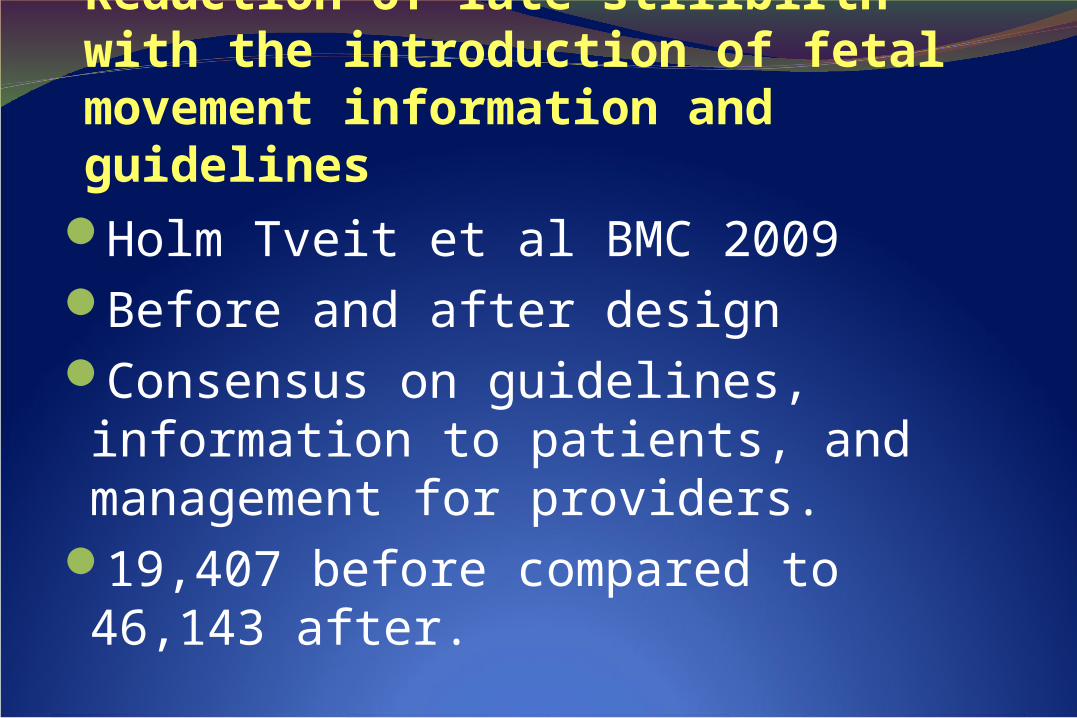
Reduction of late stillbirth with the introduction of fetal movement information and guidelines
Holm Tveit et al BMC 2009Before and after designConsensus on guidelines, information to patients, and management for providers.
19,407 before compared to 46,143 after.
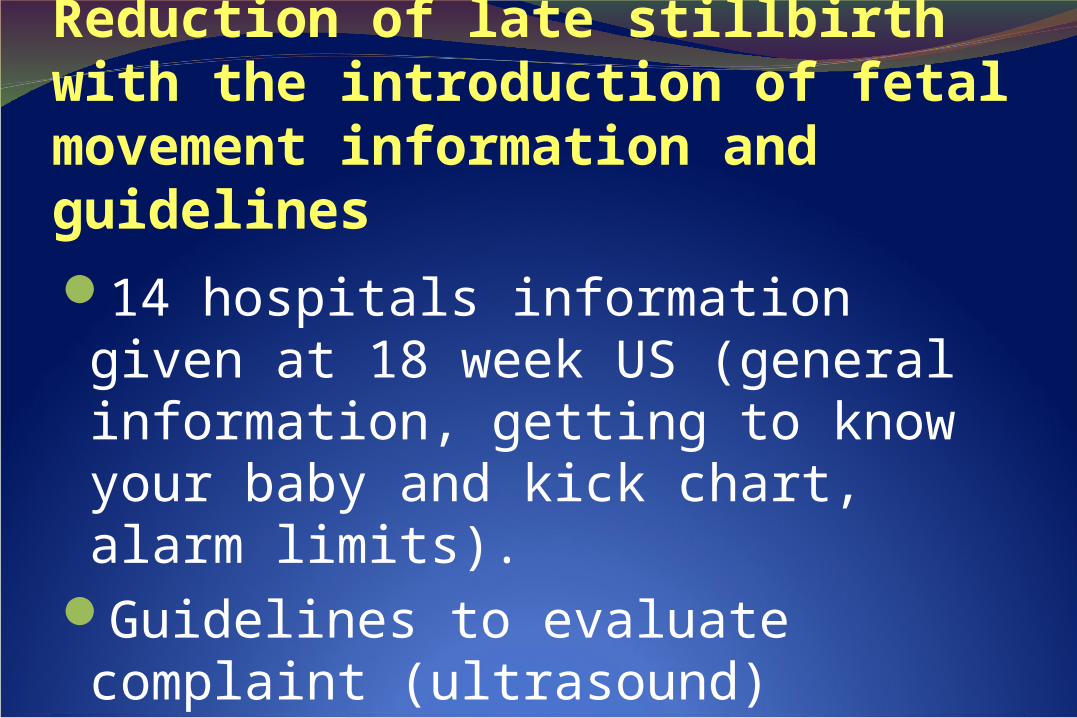
Reduction of late stillbirth with the introduction of fetal movement information and guidelines14 hospitals information given at 18 week US (general information, getting to know your baby and kick chart, alarm limits).
Guidelines to evaluate complaint (ultrasound)
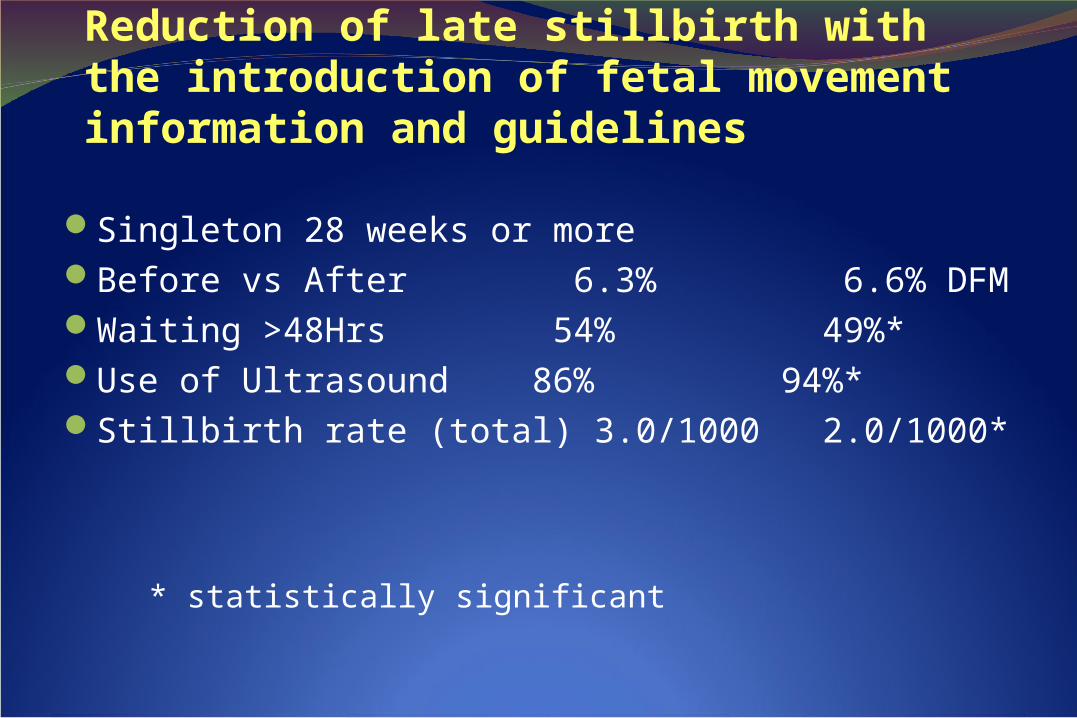
Reduction of late stillbirth with the introduction of fetal movement information and guidelines
Singleton 28 weeks or moreBefore vs After 6.3% 6.6% DFMWaiting >48Hrs 54% 49%* Use of Ultrasound 86% 94%*Stillbirth rate (total) 3.0/1000 2.0/1000*
* statistically significant
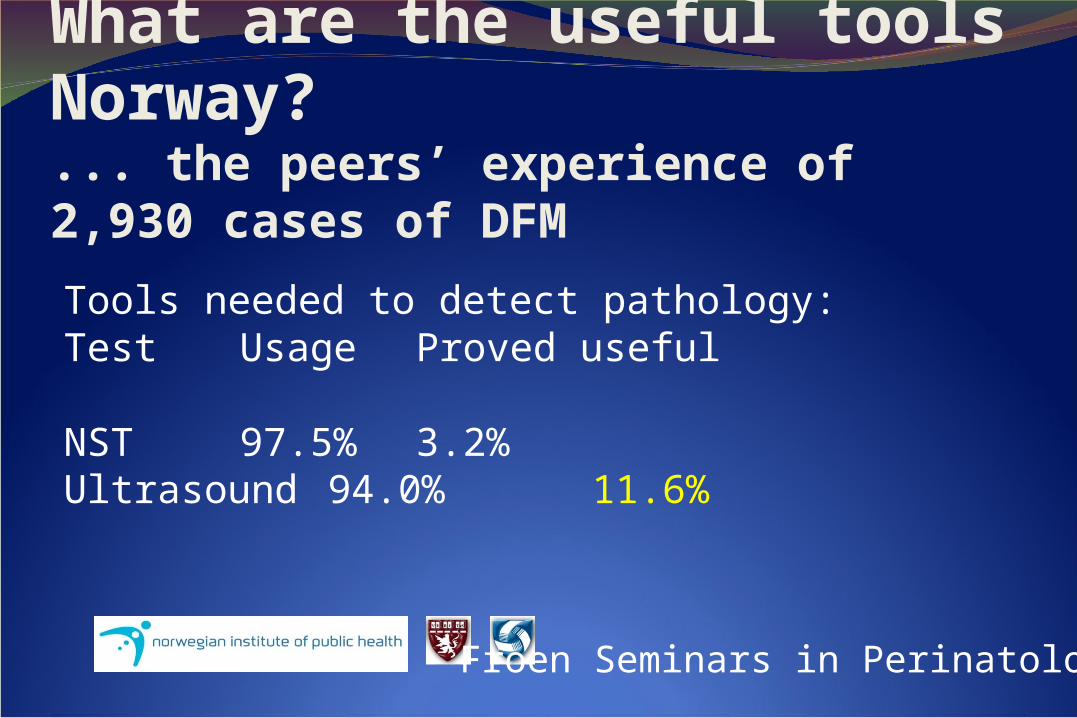
What are the useful tools Norway?... the peers’ experience of 2,930 cases of DFM
Tools needed to detect pathology:Test Usage Proved useful
NST 97.5% 3.2%
Ultrasound 94.0% 11.6%
Froen Seminars in Perinatology
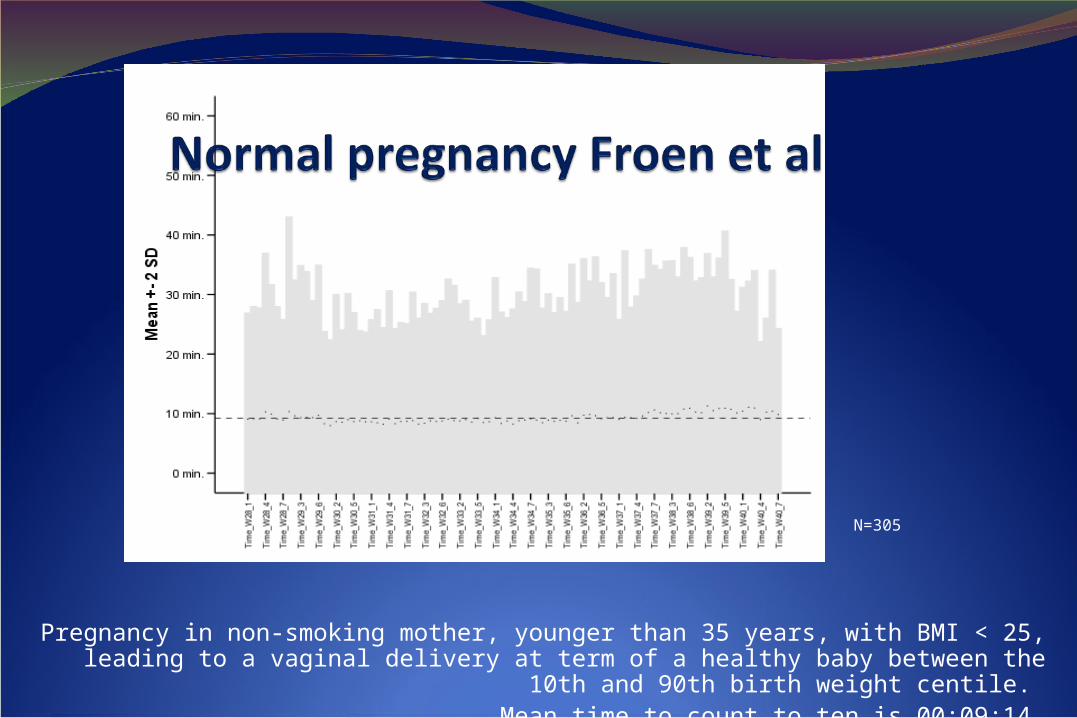
Pregnancy in non-smoking mother, younger than 35 years, with BMI < 25, leading to a vaginal delivery at term of a healthy baby between the 10th and 90th birth
weight centile. Mean time to count to ten is 00:09:14.
N=305
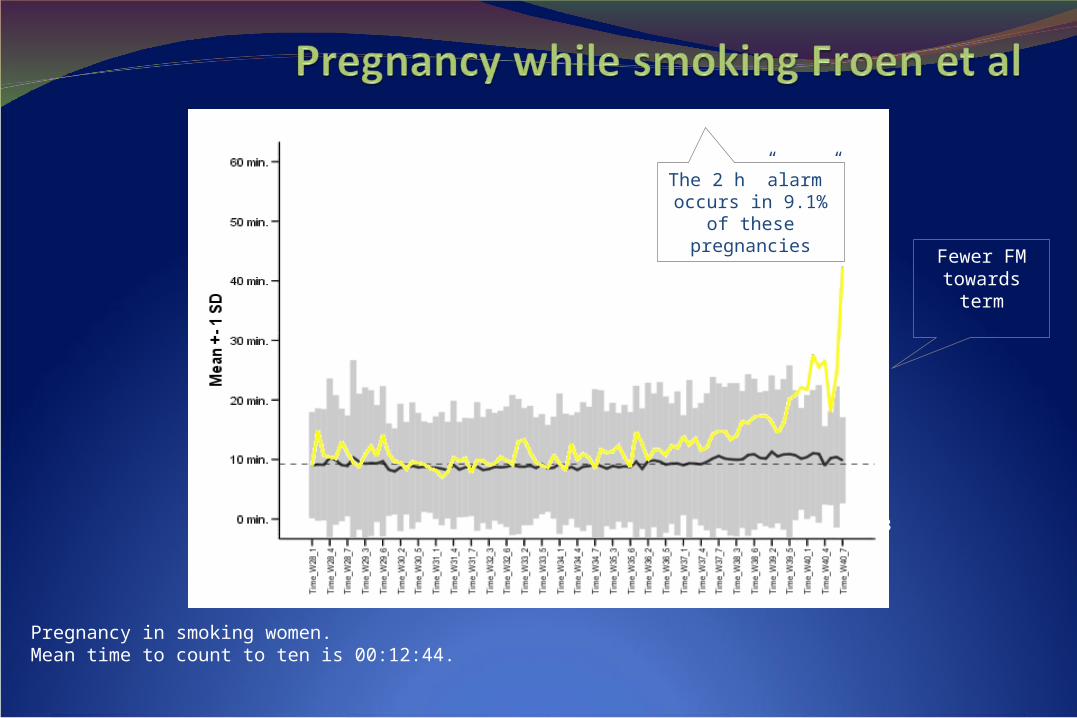
Pregnancy in smoking women. Mean time to count to ten is 00:12:44.
N=33
Fewer FM towards term
The 2 h ”alarm” occurs in 9.1% of these pregnancies
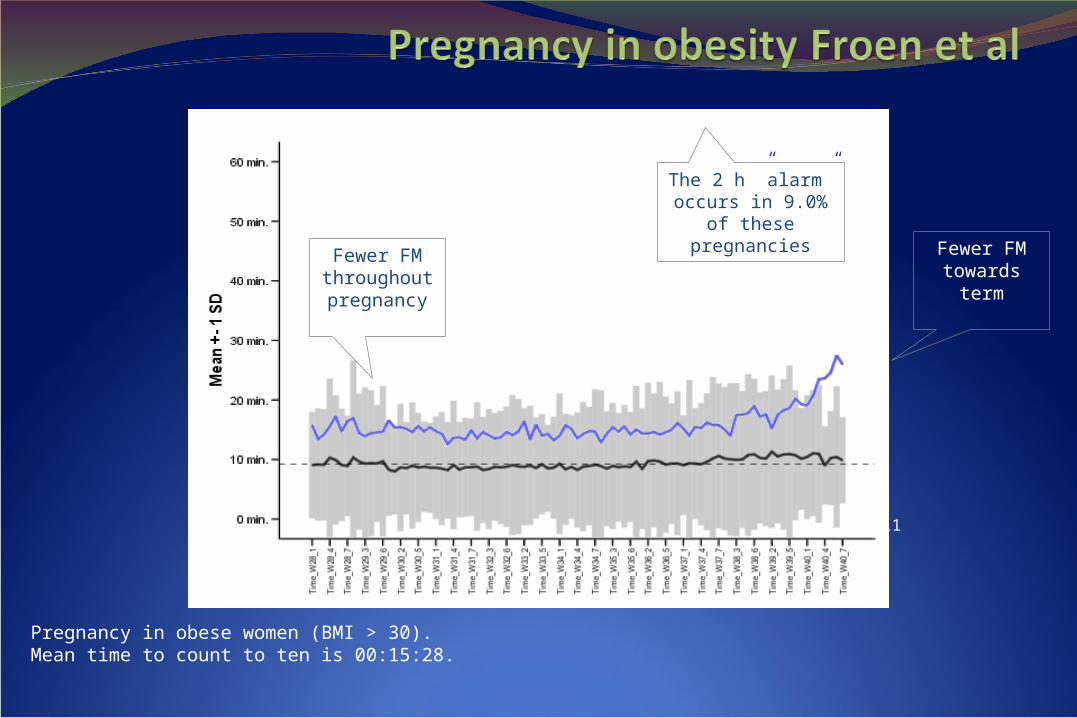
Pregnancy in obese women (BMI > 30). Mean time to count to ten is 00:15:28.
N=111
Fewer FM throughout pregnancy
Fewer FM towards term
The 2 h ”alarm” occurs in 9.0% of these pregnancies
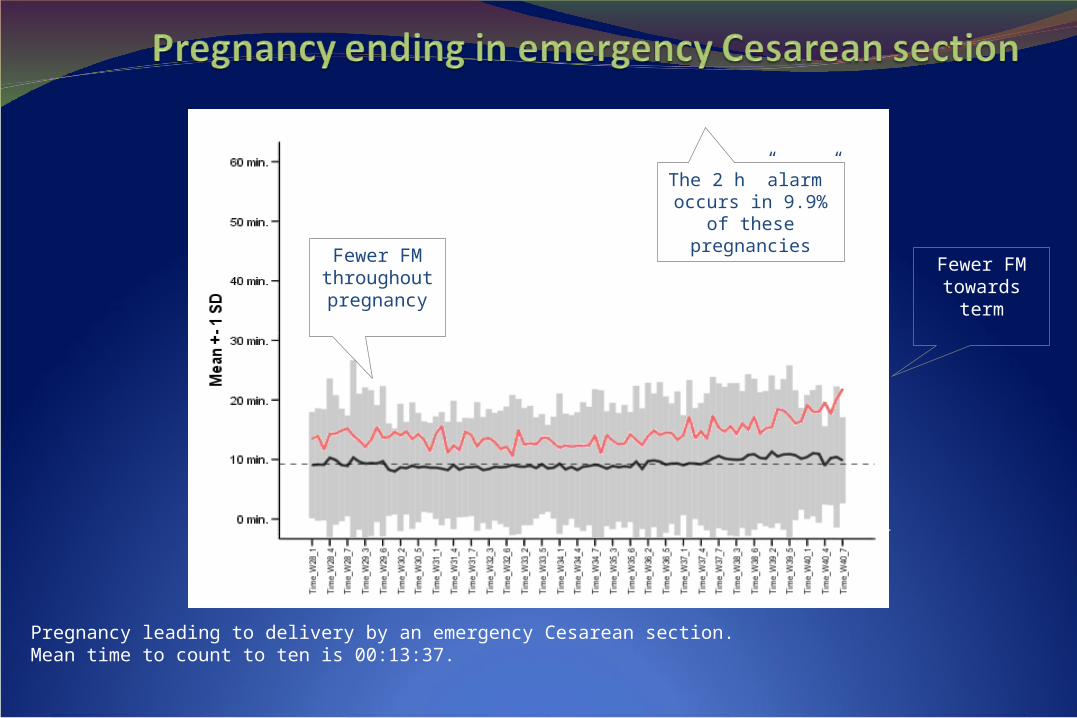
Pregnancy leading to delivery by an emergency Cesarean section. Mean time to count to ten is 00:13:37.
N=81
Fewer FM towards term
Fewer FM throughout pregnancy
The 2 h ”alarm” occurs in 9.9% of these pregnancies
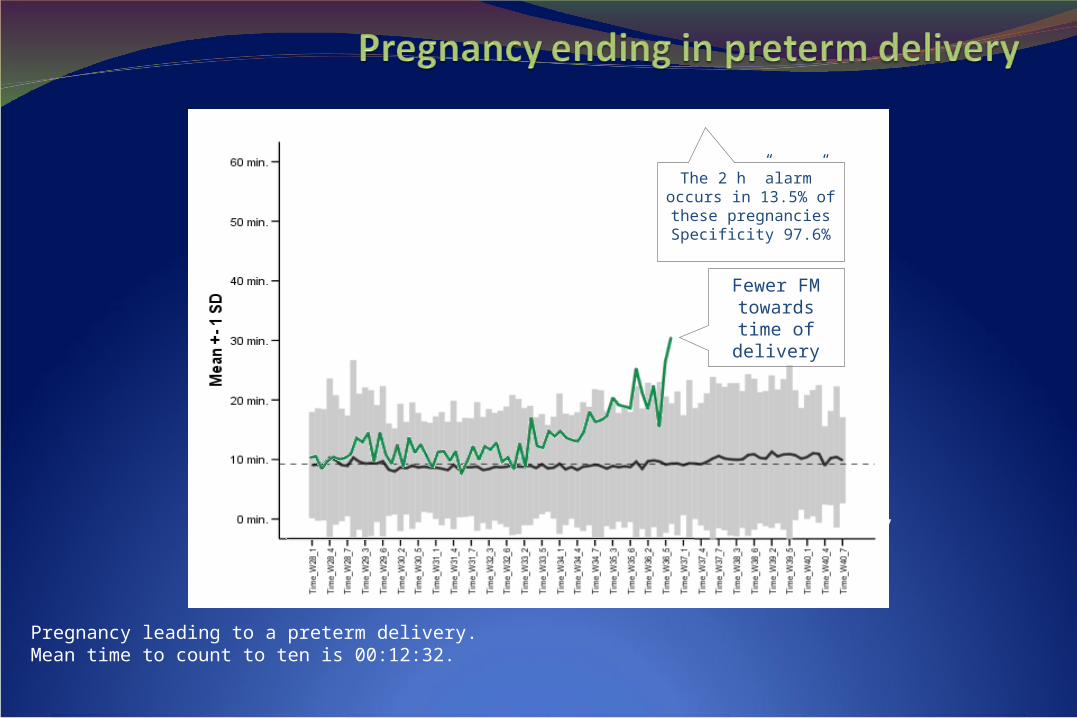
Pregnancy leading to a preterm delivery. Mean time to count to ten is 00:12:32.
N=37
Fewer FM towards time of delivery
The 2 h ”alarm” occurs in 13.5% of these pregnancies Specificity 97.6%
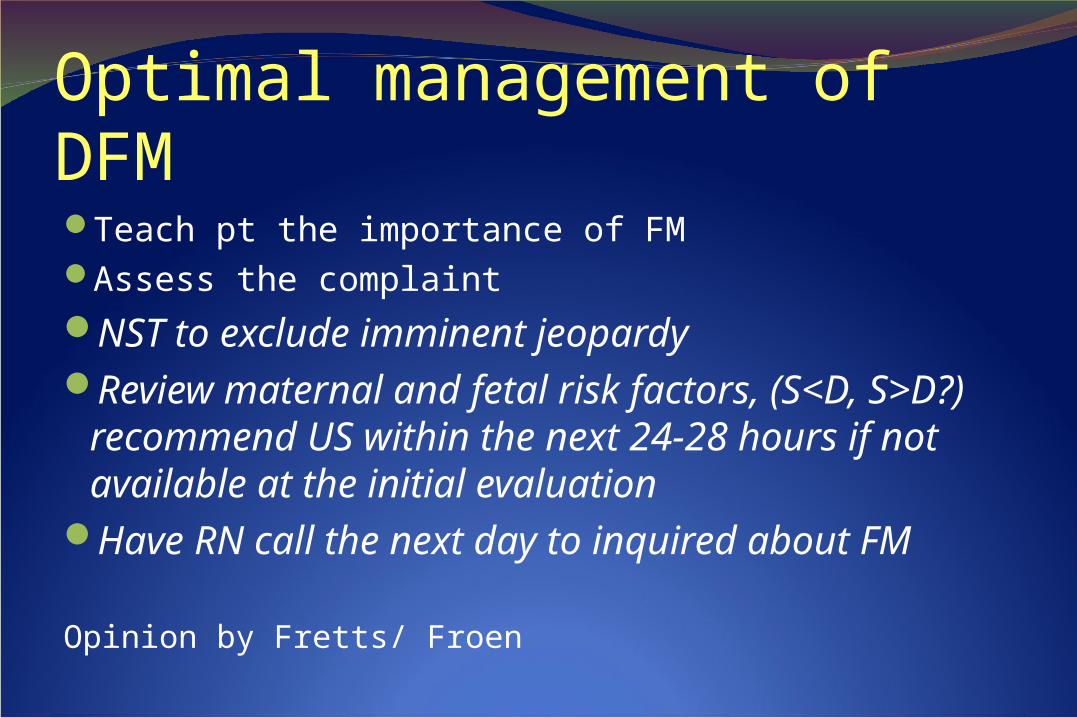
Optimal management of DFMTeach pt the importance of FMAssess the complaintNST to exclude imminent jeopardyReview maternal and fetal risk factors, (S<D,
S>D?) recommend US within the next 24-28 hours if not available at the initial evaluation
Have RN call the next day to inquired about FM
Opinion by Fretts/ Froen
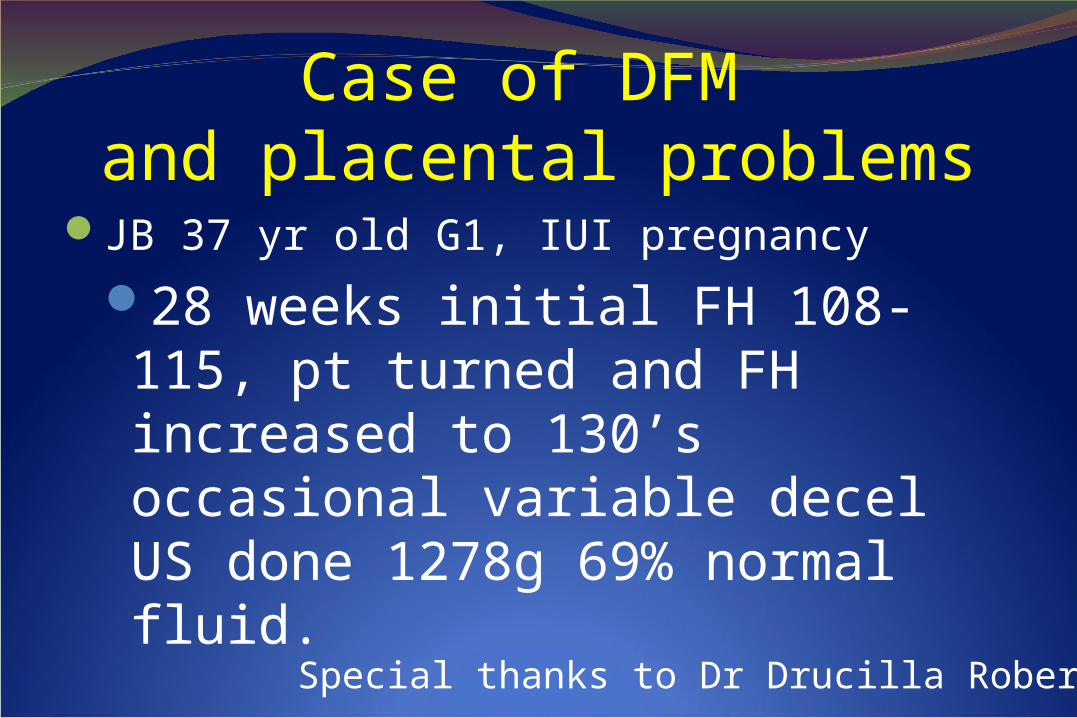
Case of DFM and placental problems
JB 37 yr old G1, IUI pregnancy
28 weeks initial FH 108-115, pt turned and FH increased to 130’s occasional variable decel US done 1278g 69% normal fluid.
Special thanks to Dr Drucilla Roberts
29 weeks, pt anxious slight increase in BP 144/70- 138/72, urine negative for protein, PIH eval negative
31 weeks called 8:30 reports DFM for 1 hr-but because of impending storm asked to come for NSTSeen at 10 am pt reports no FM NST non-reactive minimal variability with no accels or decels sent directly to hospital
JBSeen in hospital BPP 2/10 (2 for fluid)Classical c/section at 12:46 under spinalMale born 3 lb 12 oz APGARS 1,5, baby intubated and transferred to level three nursery
Maternal post-partum uncomplicatedAt 18 months of age the boy is doing well, no issues related to prematurity
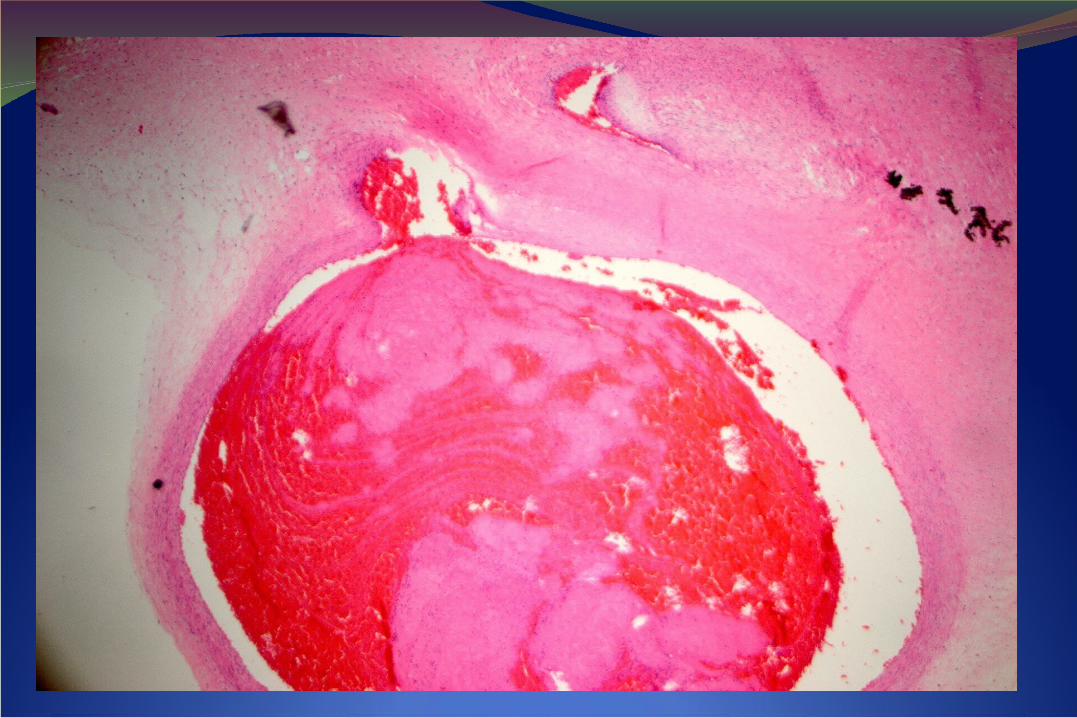
Placenta238g, ~10th percentile for 31 weeks GA
Fetal thrombotic vasculopathyMeconium pigmentAcute villous edemaFeatures suggestive of villous maturational arrest


Nice Save!!!

One family NOTPart of the stillbirthClub!

RESEARCHRESEARCH

Large prospective observational cohort
10,000 singleton pregnancies
Multi-center (8 sites)Case Western Reserve University
Columbia University
Indiana University
University of Pittsburgh
Northwestern University
University of California – Irvine
University of Pennsylvania
University of Utah
RTI International – DCC
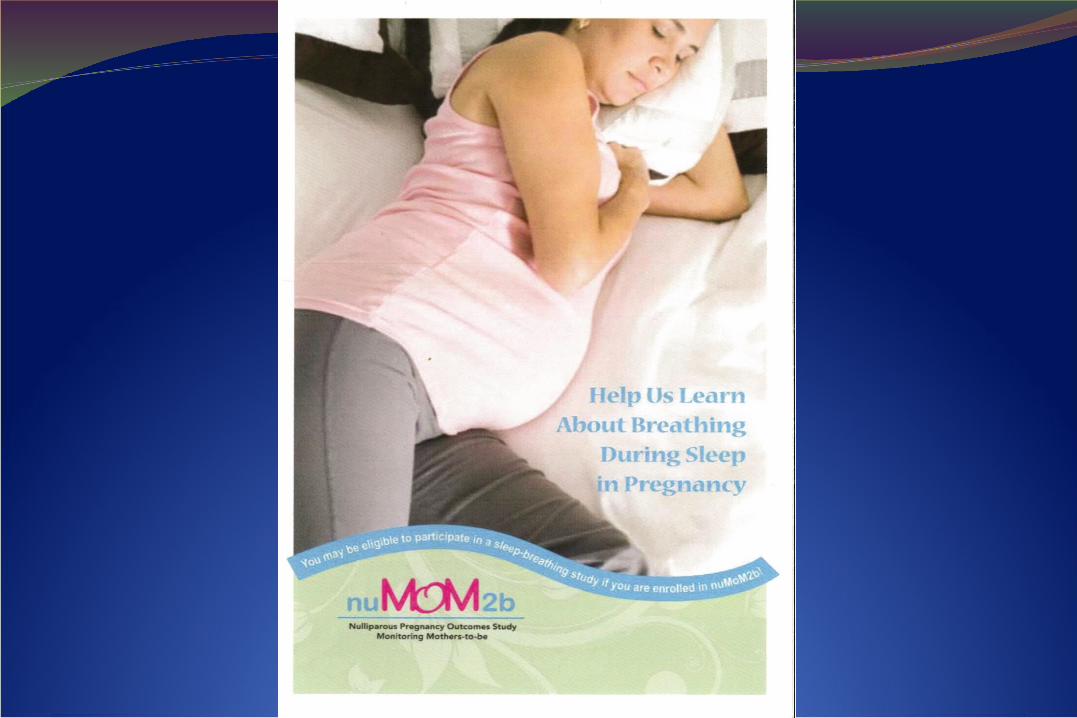
nuMoM2b
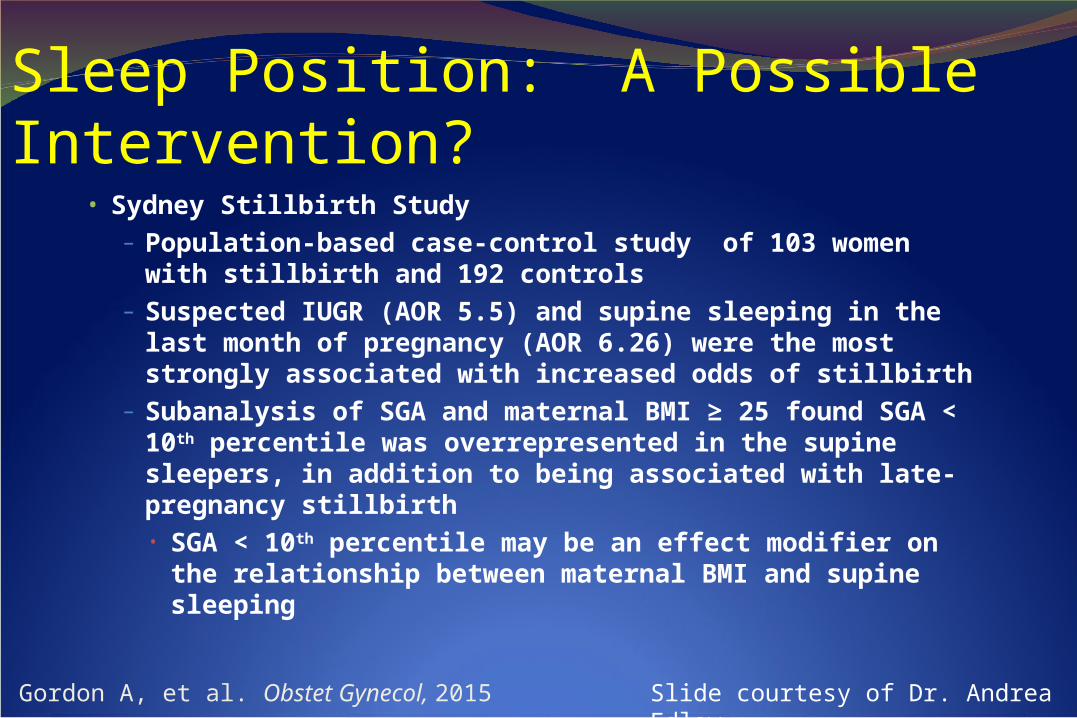
Sleep Position: A Possible Intervention?• Sydney Stillbirth Study
– Population-based case-control study of 103 women with stillbirth and 192 controls
– Suspected IUGR (AOR 5.5) and supine sleeping in the last month of pregnancy (AOR 6.26) were the most strongly associated with increased odds of stillbirth
– Subanalysis of SGA and maternal BMI ≥ 25 found SGA < 10th percentile was overrepresented in the supine sleepers, in addition to being associated with late-pregnancy stillbirth• SGA < 10th percentile may be an effect modifier on
the relationship between maternal BMI and supine sleeping
Gordon A, et al. Obstet Gynecol, 2015 Slide courtesy of Dr. Andrea Edlow
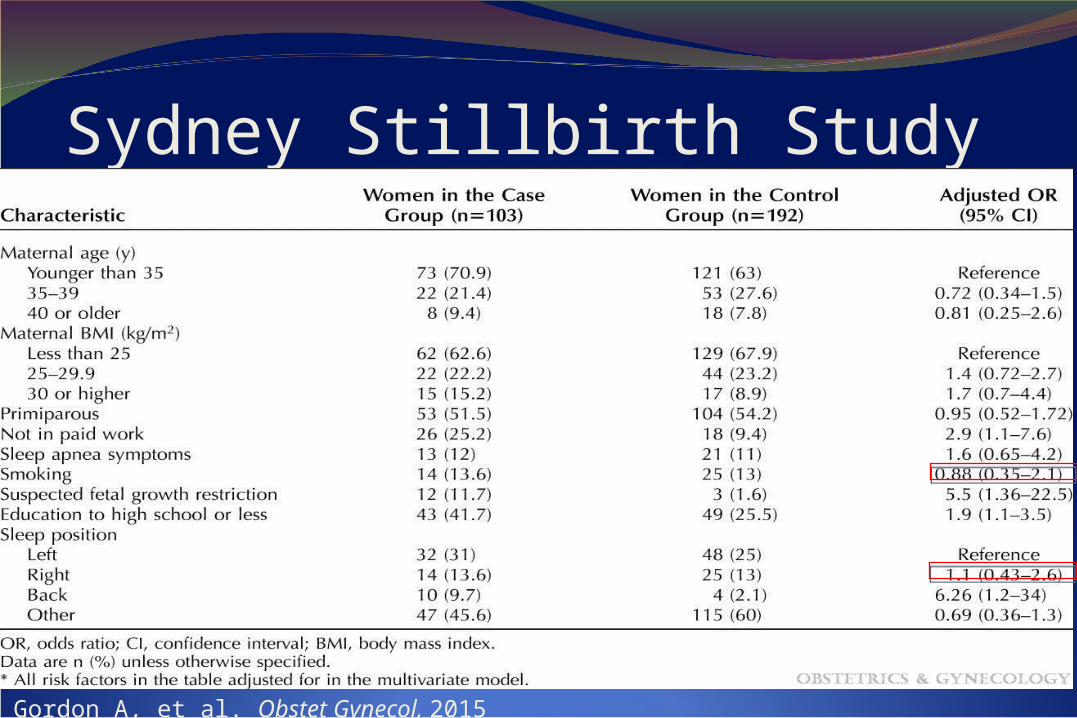
Sydney Stillbirth Study
Gordon A, et al. Obstet Gynecol, 2015
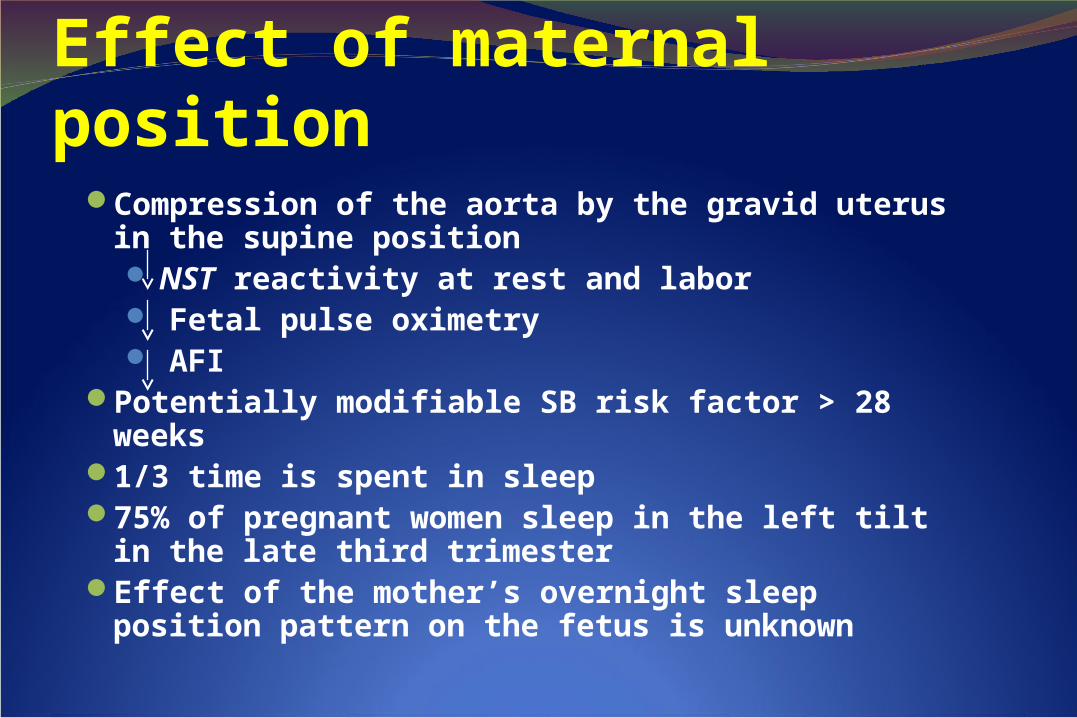
Effect of maternal positionCompression of the aorta by the gravid uterus in the
supine position NST reactivity at rest and labor Fetal pulse oximetry AFI
Potentially modifiable SB risk factor > 28 weeks 1/3 time is spent in sleep75% of pregnant women sleep in the left tilt in the late
third trimesterEffect of the mother’s overnight sleep position pattern
on the fetus is unknown
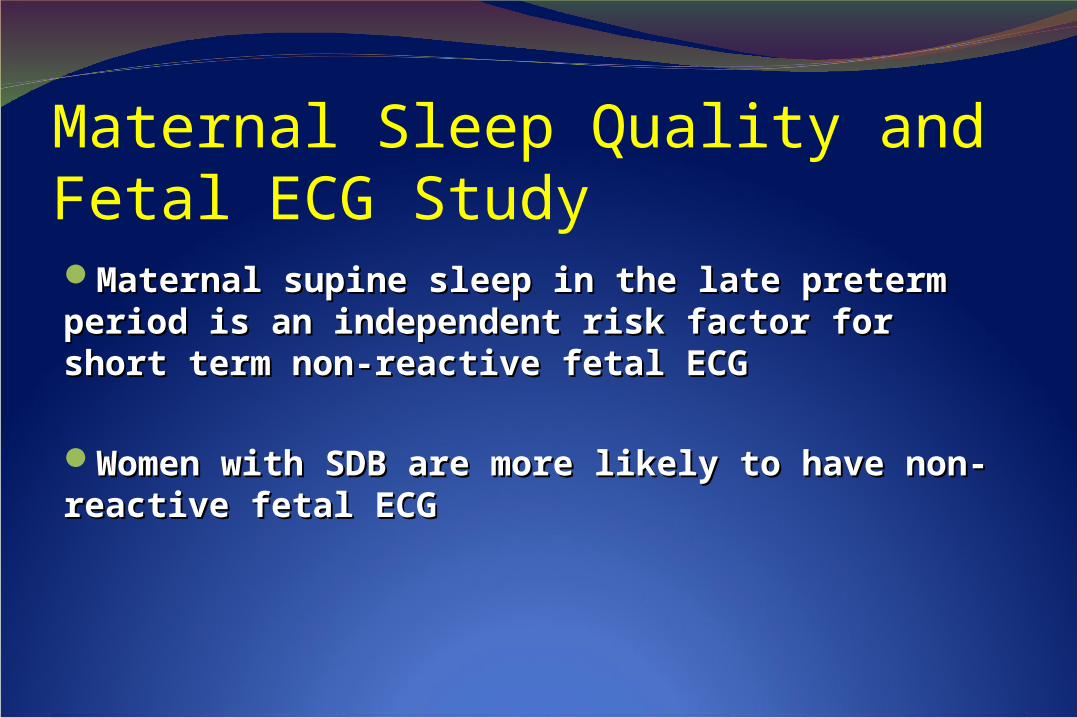
Maternal Sleep Quality and Fetal ECG StudyMaternal supine sleep in the late preterm period is an Maternal supine sleep in the late preterm period is an independent risk factor for short term non-reactive fetal independent risk factor for short term non-reactive fetal ECG ECG
Women with SDB are more likely to have non-reactive Women with SDB are more likely to have non-reactive fetal ECGfetal ECG
Sleep Sub-studyPrimary Aim: Sleep disordered breathing (SDB) is a risk
factor for APO among nulliparas
SDB leads to pathophysiology similar to APOIncreased sympathetic toneOxidative stressSystemic inflammationInsulin resistanceHyperlipidemia
SDB may be a modifiable risk factor for adverse pregnancy outcomes
NICHD Nulliparous Pregnancy Outcomes Study Monitoring Mothers-to-be (nuMoM2b)
Adverse Pregnancy OutcomesPregnancies often complicated
Preterm birth
Preeclampsia / gestational high BP
Fetal growth restriction
Stillbirth
Interventions in subsequent pregnancies to reduce the risk of recurrent pregnancy complications
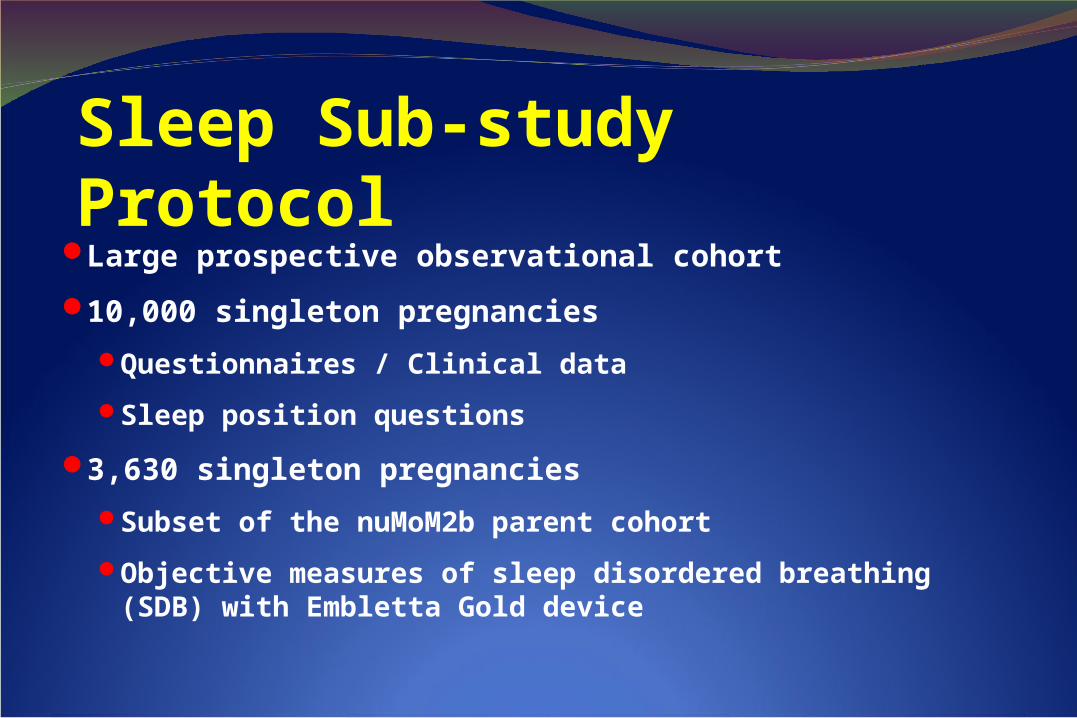
Sleep Sub-studyProtocol
Large prospective observational cohort
10,000 singleton pregnancies
Questionnaires / Clinical data
Sleep position questions
3,630 singleton pregnancies
Subset of the nuMoM2b parent cohort
Objective measures of sleep disordered breathing (SDB) with Embletta Gold device
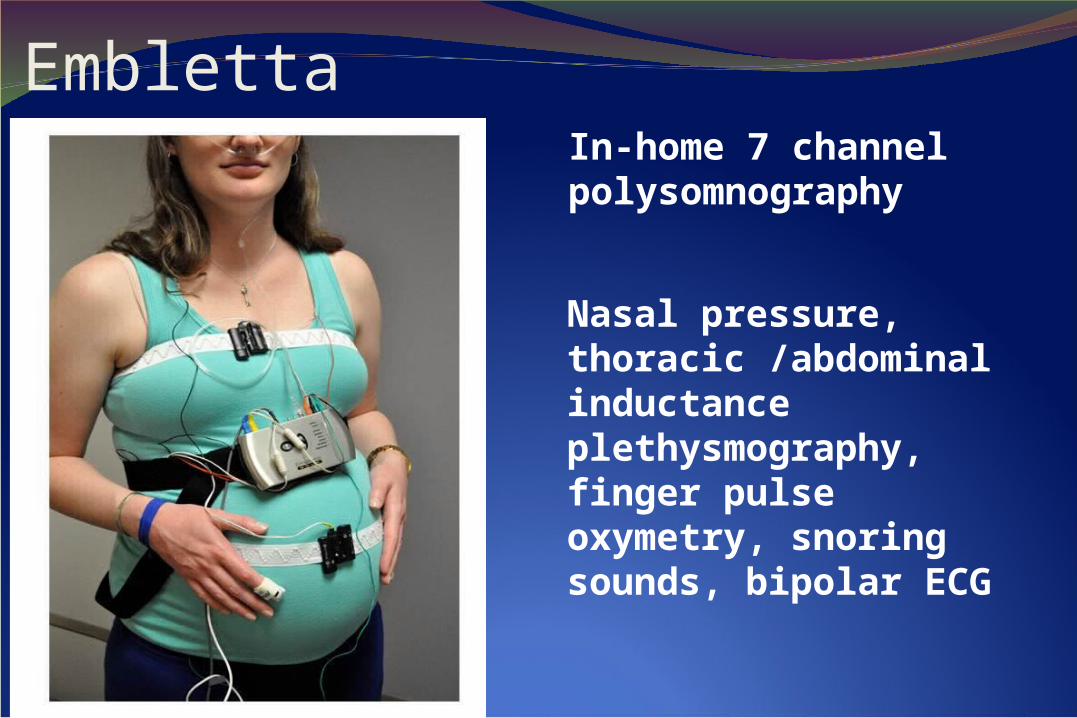
Embletta
Nasal pressure, thoracic /abdominal inductance plethysmography, finger pulse oxymetry, snoring sounds, bipolar ECG
In-home 7 channel polysomnography
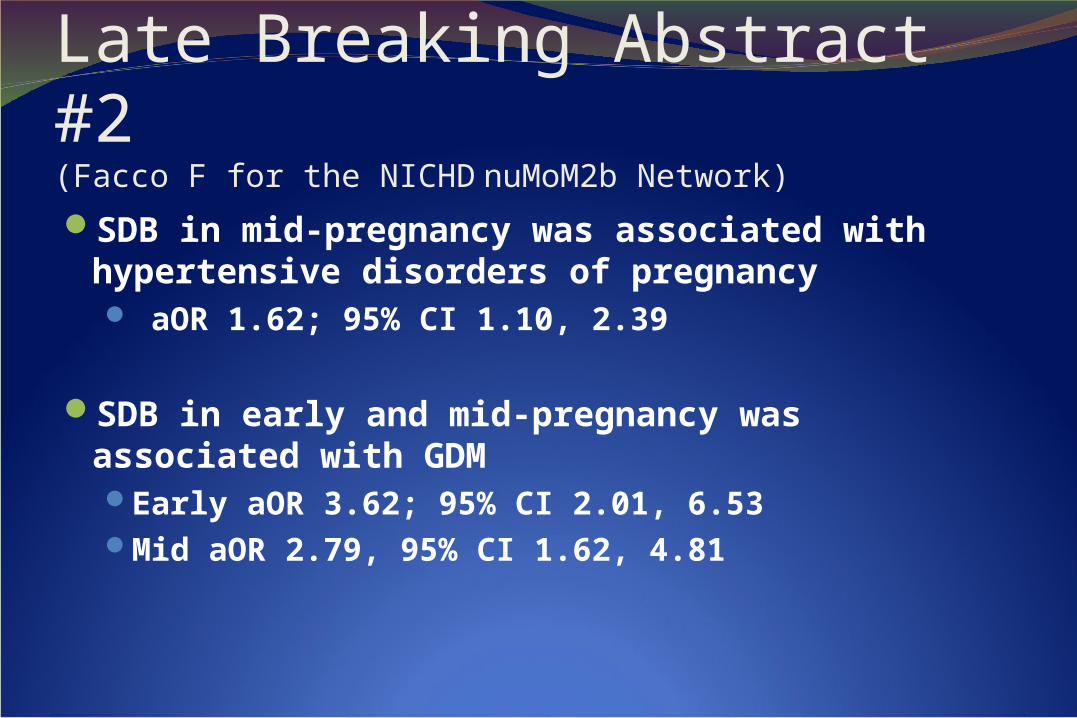
Late Breaking Abstract #2(Facco F for the NICHD nuMoM2b Network)
SDB in mid-pregnancy was associated with hypertensive disorders of pregnancy aOR 1.62; 95% CI 1.10, 2.39
SDB in early and mid-pregnancy was associated with GDMEarly aOR 3.62; 95% CI 2.01, 6.53Mid aOR 2.79, 95% CI 1.62, 4.81
Induction as an intervention?
Increasing maternal and perinatal risks after 39 weeks

When is the best time for delivery?
Delivery Expectant management
≥ 42 weeks < 39 weeks
39 - 41 weeks
Slide courtesy of Dr. Bill Grobman
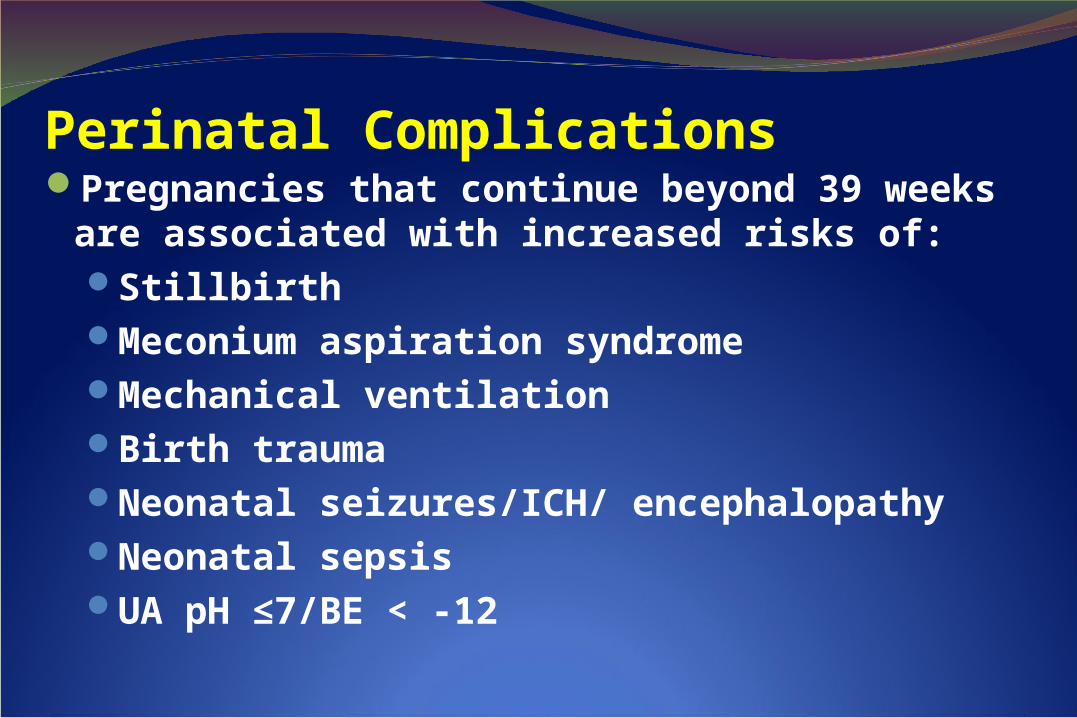
Perinatal ComplicationsPregnancies that continue beyond 39 weeks are
associated with increased risks of:StillbirthMeconium aspiration syndromeMechanical ventilationBirth traumaNeonatal seizures/ICH/ encephalopathyNeonatal sepsisUA pH ≤7/BE < -12
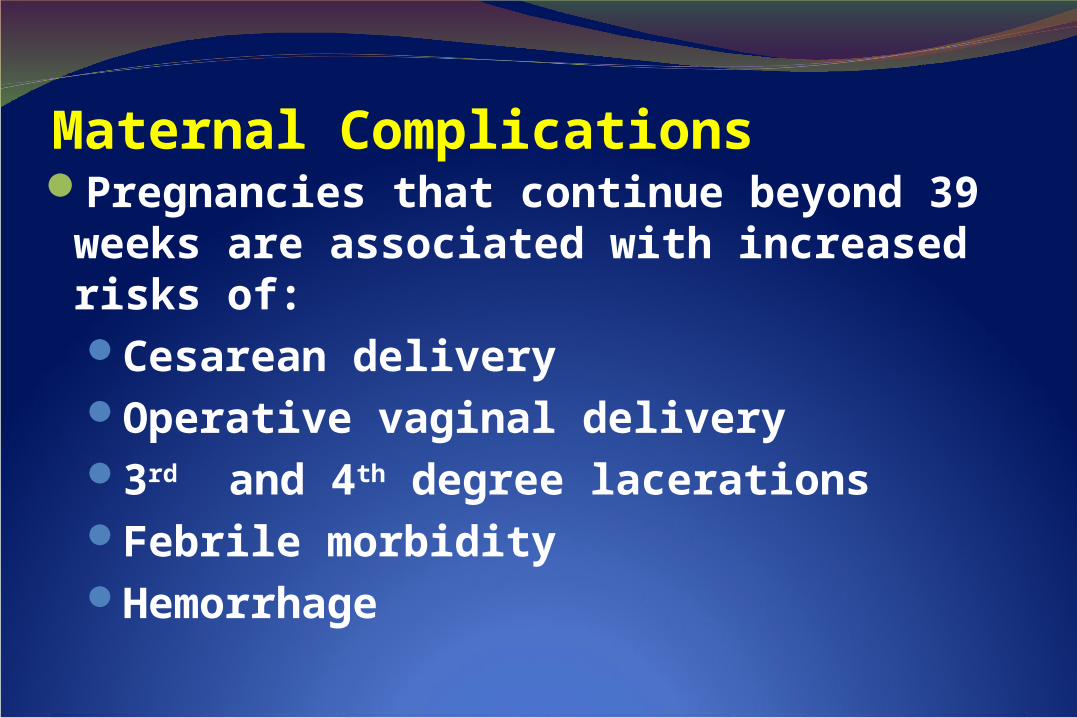
Maternal ComplicationsPregnancies that continue beyond 39 weeks
are associated with increased risks of: Cesarean deliveryOperative vaginal delivery3rd and 4th degree lacerationsFebrile morbidityHemorrhage
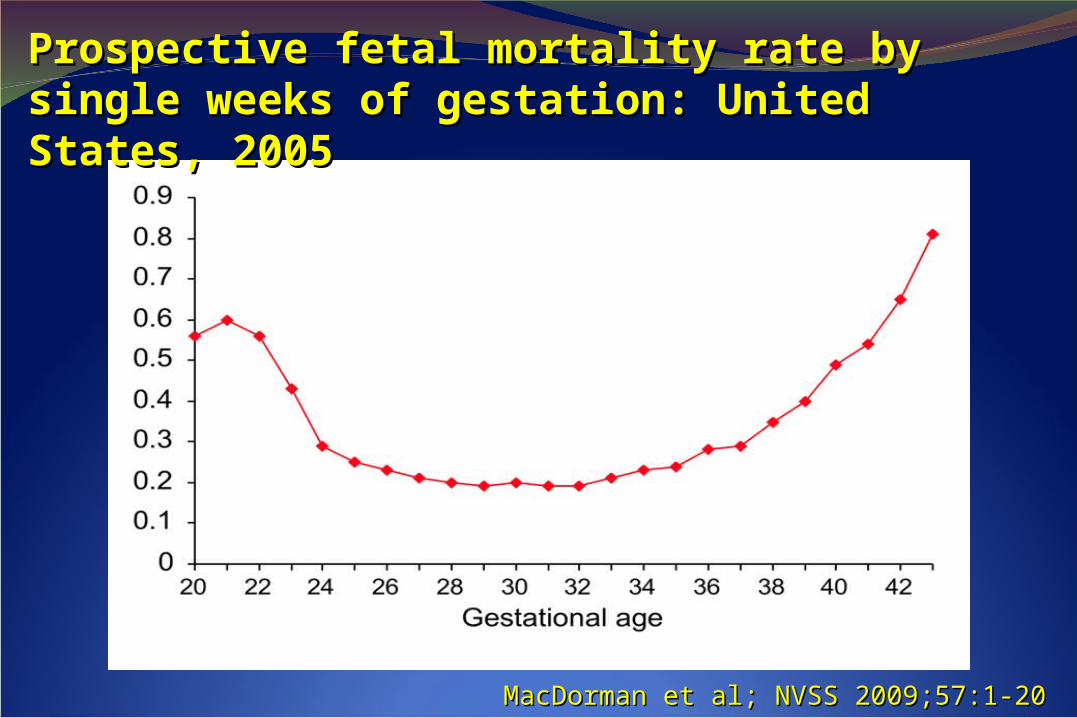
MacDorman et al; NVSS 2009;57:1-20MacDorman et al; NVSS 2009;57:1-20
Prospective fetal mortality rate by single weeks Prospective fetal mortality rate by single weeks of gestation: United States, 2005of gestation: United States, 2005
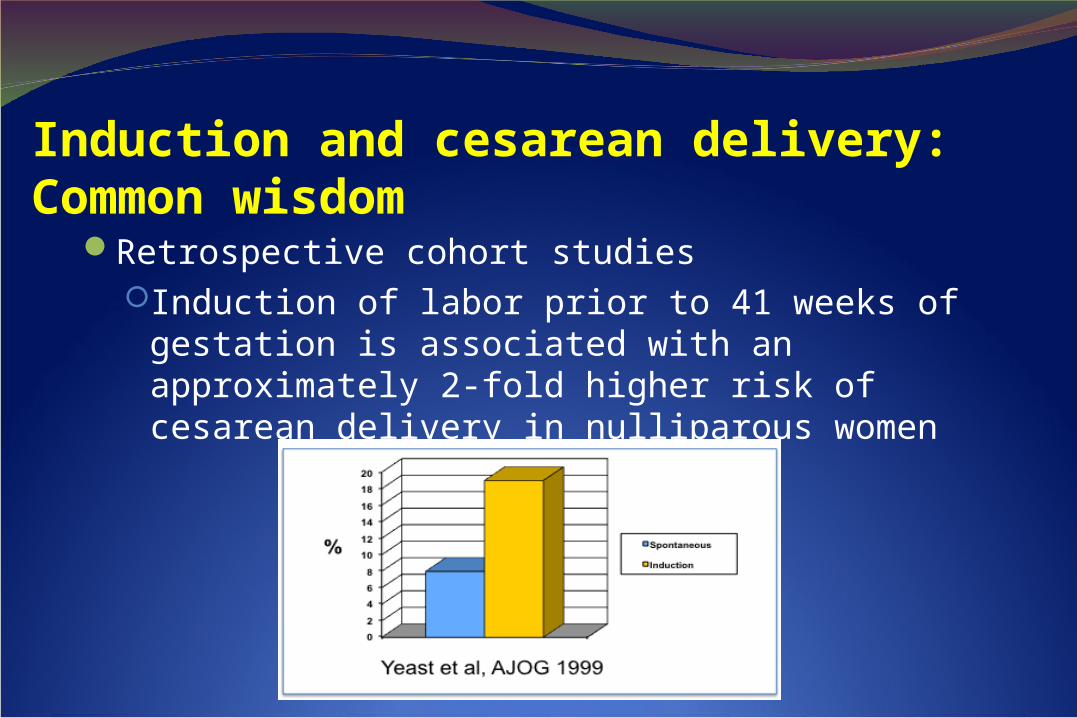
Induction and cesarean delivery:Common wisdom
Retrospective cohort studies Induction of labor prior to 41 weeks of
gestation is associated with an approximately 2-fold higher risk of cesarean delivery in nulliparous women
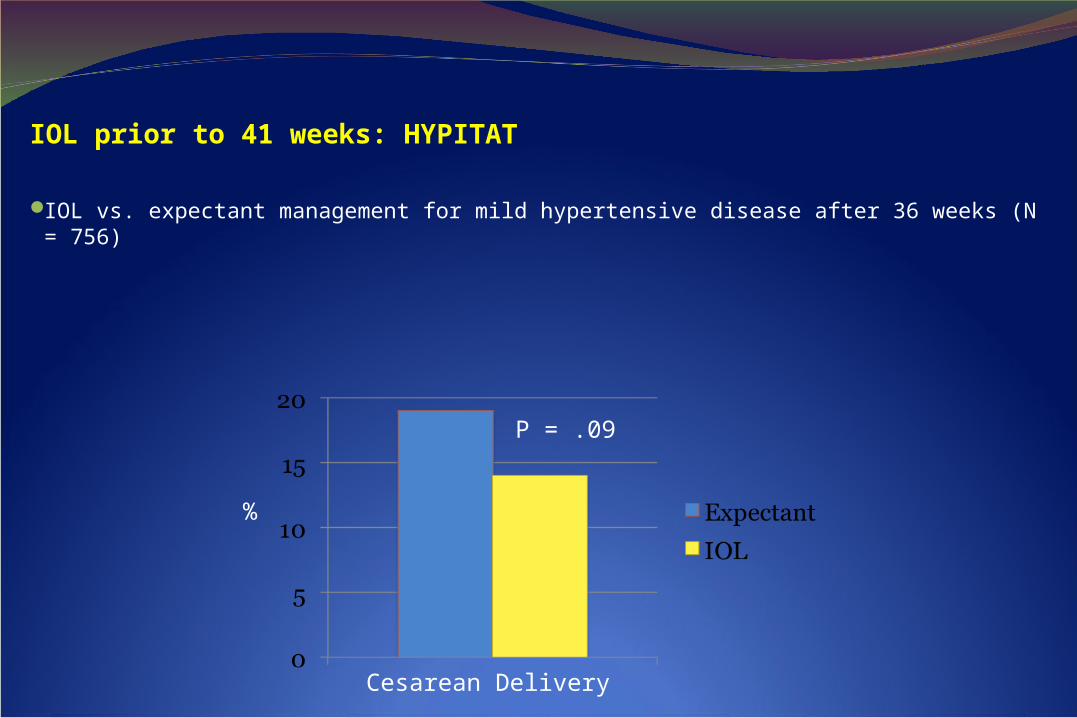
IOL prior to 41 weeks: HYPITAT
IOL vs. expectant management for mild hypertensive disease after 36 weeks (N = 756)
%
P = .09
Cesarean Delivery
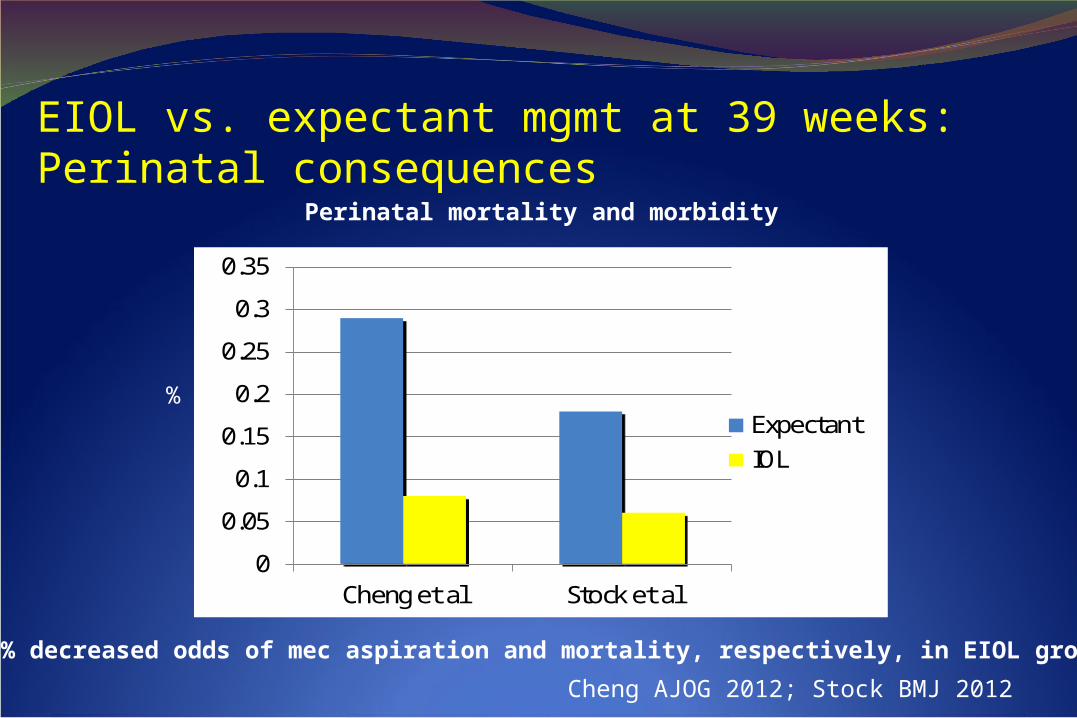
EIOL vs. expectant mgmt at 39 weeks: Perinatal consequences
%
Cheng AJOG 2012; Stock BMJ 2012
0
0.05
0.1
0.15
0.2
0.25
0.3
0.35
Cheng et al Stock et al
ExpectantIOL
Perinatal mortality and morbidity
70% decreased odds of mec aspiration and mortality, respectively, in EIOL group
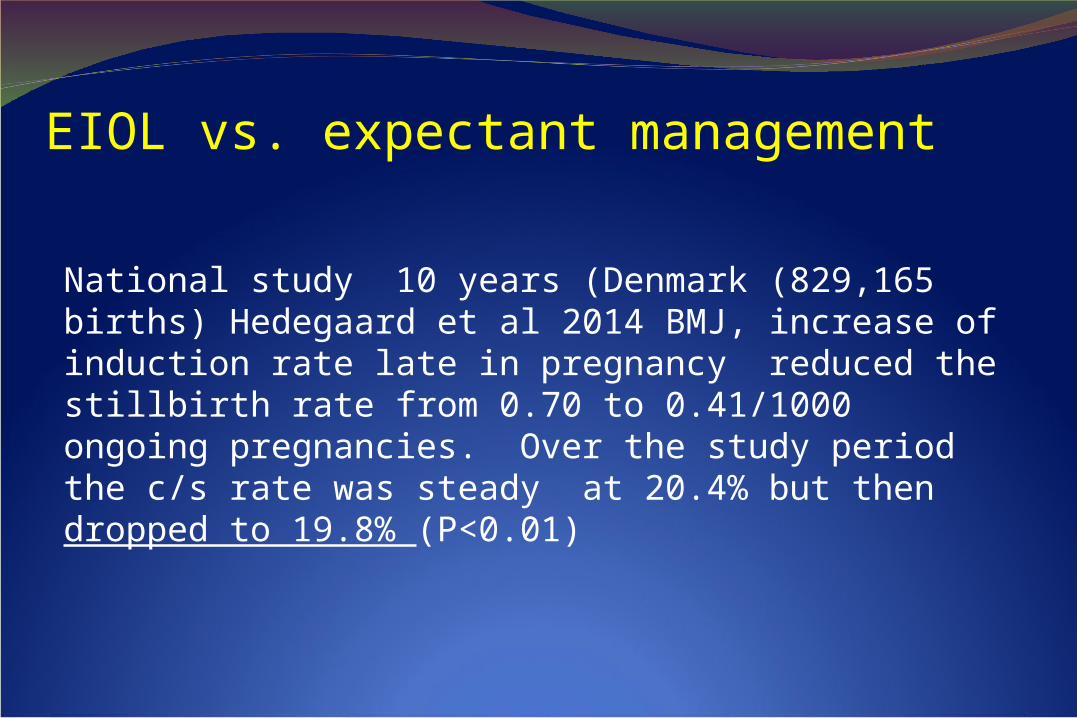
National study 10 years (Denmark (829,165 births) Hedegaard et al 2014 BMJ, increase of induction rate late in pregnancy reduced the stillbirth rate from 0.70 to 0.41/1000 ongoing pregnancies. Over the study period the c/s rate was steady at 20.4% but then dropped to 19.8% (P<0.01)
EIOL vs. expectant management