Embed Size (px)
Citation preview
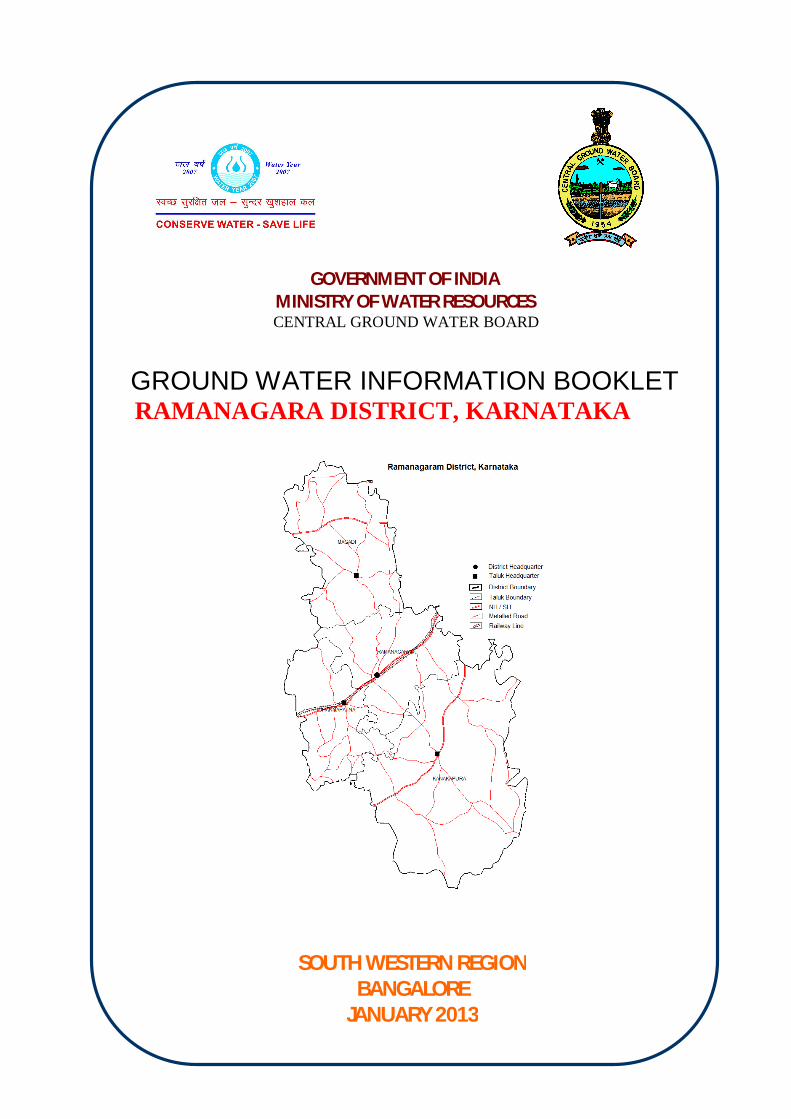
GOVERNMENT OF INDIA MINISTRY OF WATER RESOURCES
CENTRAL GROUND WATER BOARD
GROUND WATER INFORMATION BOOKLET
RAMANAGARA DISTRICT, KARNATAKA
SOUTH WESTERN REGION BANGALORE
JANUARY 2013
Foreword
Groundwater is an essential component of the environment and economy. It sustains the
flow in our rivers and plays an important role in maintaining the fragile ecosystems. The
groundwater dependence of agrarian states like Karnataka is high. Recent studies indicate
that 26 percent of the area of Karnataka State is under over exploited category and number
of blocks is under critical category. In view of the growing concerns of sustainability of
ground water sources, immediate attention is required to augment groundwater resources in
stressed areas. Irrigated agriculture in the state is putting additional stress on the
groundwater system and needs proper management of the resources.
Central Ground Water Board is providing all technical input for effective management of
ground water resources in the state. The groundwater scenario compiled on administrative
divisions gives a better perspective for planning various ground water management
measures by local administrative bodies. With this objective, Central Ground Water Board is
publishing the revised groundwater information booklet for all the districts of the state.
I do appreciate the efforts of Dr. K.Md.Najeeb, Regional Director and his fleet of dedicated
Scientists of South Western Region, Bangalore for bringing out this booklet. I am sure these
brochures will provide a portrait of the groundwater resources in each district for planning
effective management measures by the administrators, planners and the stake holders.
Susil Gupta Chairman
PREFACE
Ground water contributes to about eighty percent of the drinking water requirements
in the rural areas, fifty percent of the urban water requirements and more than fifty
percent of the irrigation requirements of the nation. Central Ground Water Board has
decided to bring out district level ground water information booklets highlighting the
ground water scenario, its resource potential, quality aspects, recharge – discharge
relationship, vulnerability area etc., for all the districts of the country. As part of this,
Central Ground Water Board, South Western Region, Bangalore, is preparing such
booklets for all the 30 districts of Karnataka state, incorporating the data up to the
period 2011-12.
The Ramanagara District Ground Water Information Booklet has been prepared
based on the information available and data collected from various state and central
government organisations by several hydro-scientists of Central Ground Water
Board with utmost care and dedication. This booklet has been prepared by Shri.
G.R.C.Reddy, Scientist-D. The figures were prepared by Sri. J. Sivaramakrishnan,
Assistant Hydrogeologist and the rainfall data provided by Shri H.P.Jayaprakash
Scientist-C. The efforts of Report processing section in finalizing and bringing out the
report in this format are commendable
I take this opportunity to congratulate them for the diligent and careful compilation
and observation in the form of this booklet, which will certainly serve as a guiding
document for further work and help the planners, administrators, academicians,
hydrogeologists and engineers to plan the water resources management in a better
way in the district.
(Dr. K.Md.Najeeb)
Regional Director
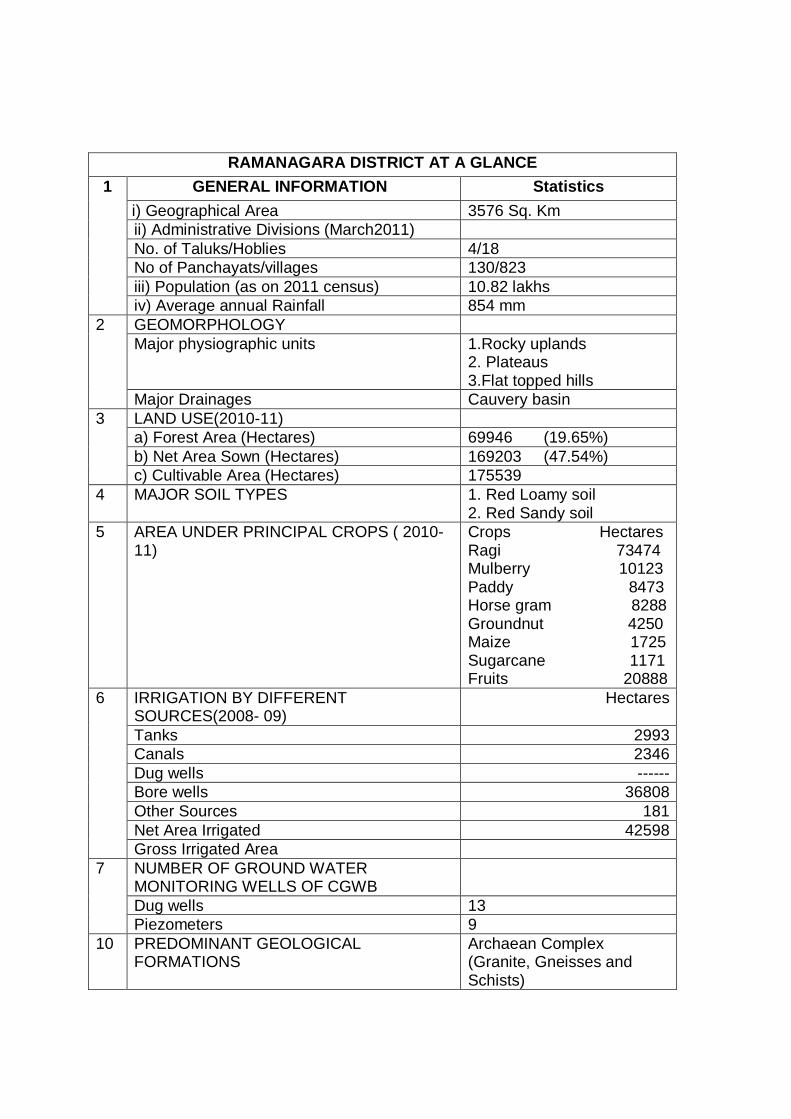
RAMANAGARA DISTRICT AT A GLANCE 1 GENERAL INFORMATION Statistics
i) Geographical Area 3576 Sq. Km ii) Administrative Divisions (March2011) No. of Taluks/Hoblies 4/18 No of Panchayats/villages 130/823 iii) Population (as on 2011 census) 10.82 lakhs iv) Average annual Rainfall 854 mm
2 GEOMORPHOLOGY Major physiographic units 1.Rocky uplands
2. Plateaus 3.Flat topped hills
Major Drainages Cauvery basin 3 LAND USE(2010-11)
a) Forest Area (Hectares) 69946 (19.65%) b) Net Area Sown (Hectares) 169203 (47.54%) c) Cultivable Area (Hectares) 175539
4 MAJOR SOIL TYPES 1. Red Loamy soil 2. Red Sandy soil
5 AREA UNDER PRINCIPAL CROPS ( 2010-11)
Crops Hectares Ragi 73474 Mulberry 10123 Paddy 8473 Horse gram 8288 Groundnut 4250 Maize 1725 Sugarcane 1171 Fruits 20888
6 IRRIGATION BY DIFFERENT SOURCES(2008- 09)
Hectares
Tanks 2993 Canals 2346 Dug wells ------ Bore wells 36808 Other Sources 181 Net Area Irrigated 42598 Gross Irrigated Area
7 NUMBER OF GROUND WATER MONITORING WELLS OF CGWB
Dug wells 13 Piezometers 9
10 PREDOMINANT GEOLOGICAL FORMATIONS
Archaean Complex (Granite, Gneisses and Schists)
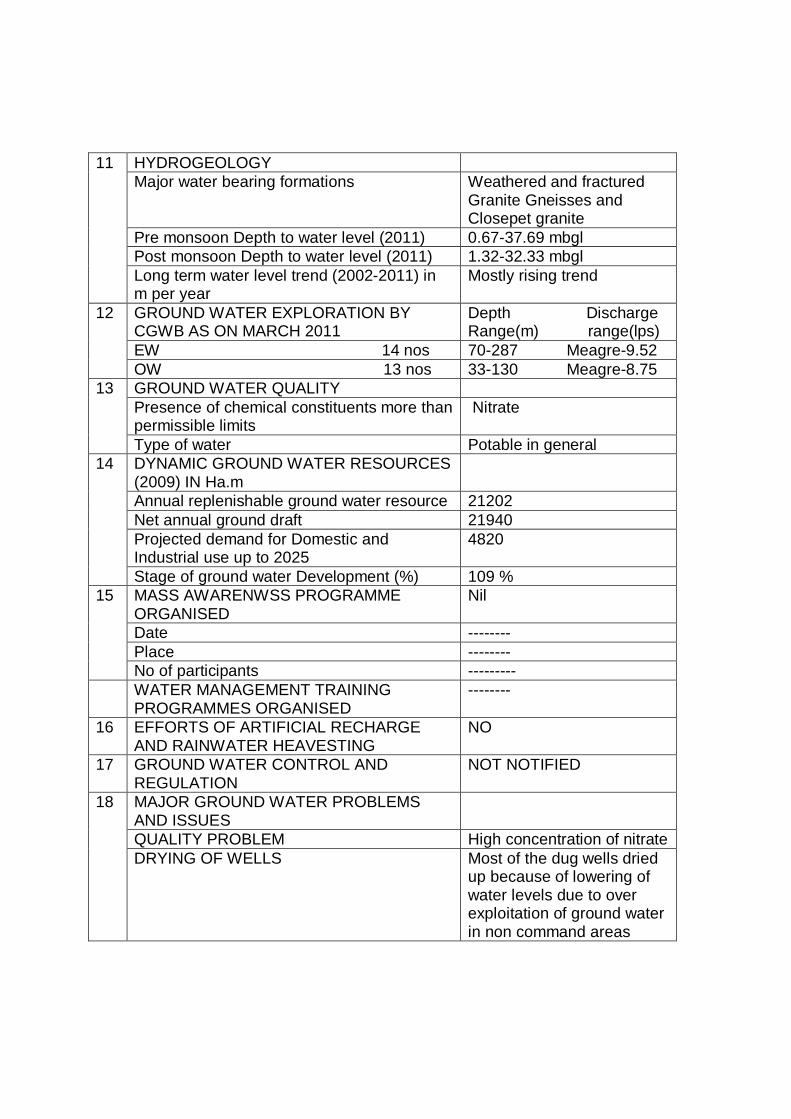
11 HYDROGEOLOGY Major water bearing formations Weathered and fractured
Granite Gneisses and Closepet granite
Pre monsoon Depth to water level (2011) 0.67-37.69 mbgl Post monsoon Depth to water level (2011) 1.32-32.33 mbgl Long term water level trend (2002-2011) in m per year
Mostly rising trend
12 GROUND WATER EXPLORATION BY CGWB AS ON MARCH 2011
Depth Discharge Range(m) range(lps)
EW 14 nos 70-287 Meagre-9.52 OW 13 nos 33-130 Meagre-8.75
13 GROUND WATER QUALITY Presence of chemical constituents more than permissible limits
Nitrate
Type of water Potable in general 14 DYNAMIC GROUND WATER RESOURCES
(2009) IN Ha.m
Annual replenishable ground water resource 21202 Net annual ground draft 21940 Projected demand for Domestic and Industrial use up to 2025
4820
Stage of ground water Development (%) 109 % 15 MASS AWARENWSS PROGRAMME
ORGANISED Nil
Date -------- Place -------- No of participants ---------
WATER MANAGEMENT TRAINING PROGRAMMES ORGANISED
--------
16 EFFORTS OF ARTIFICIAL RECHARGE AND RAINWATER HEAVESTING
NO
17 GROUND WATER CONTROL AND REGULATION
NOT NOTIFIED
18 MAJOR GROUND WATER PROBLEMS AND ISSUES
QUALITY PROBLEM High concentration of nitrate DRYING OF WELLS Most of the dug wells dried
up because of lowering of water levels due to over exploitation of ground water in non command areas
1.0 Introduction Ramanagara District was carved out of Bangalore Rural district in 10th September 2007 with Channapatna, Kanakapura, Magadi and Ramanagara taluks. Ramanagara is approximately 50 km southwest of Bangalore. Ramanagara is also famous for some of the world's oldest granite outcrops. The Closepet granites are the major geological feature of the district.
Ramanagara district is located in the southeastern part of Karnataka state between the north latitude 12°24' and 13°09' and East longitude 77°06' and 77°34'. The district is bounded by Tumkur and Bangalore Rural districts in the north, by Mandya district on the west, Chamarajanagar district on the south and on east by Bangalore Urban district and Tamilnadu state.
1.1 Administrative Setup and Accessibility The district covers an area of 3576 sq km. The district is divided into four taluks namely Channapatna, Kanakapura, Magadi and Ramanagara. There are18 hoblies,130 gram panchayats, 4 towns /urban agglomerations, 2 Municipalities and 823 villages. Out of 823 villages 770 are inhabited and remaining 53 are uninhabited villages. Ramanagara district is well served by road, railway and airways. The National Highways-NH-209 &206 are passing through the district. The interior villages are well connected by metal roads. The railway line connecting Bangalore, Mysore and Hassan passes through the district. The Bangalore international airport is located in this district. Map showing location, administrative divisions, roads etc is given in fig 1. 1.2 Population As per 2011 census, the total population in the district is 10,82,739 persons which is 1.77% of Karnataka population, with a density of 303 persons/sq.km. The percentage decadal growth rate is 5.06% (2001-2011).The rural and urban population constitutes 75.31% and 24.69%respectively.The sex ratio is 976 and the literates constitute 69.20% of total population. 1.3 Drainage The entire area of Ramanagara district is part of the Cauvery basin. The major tributaries of the Cauvery river draining the district are Arkavathi and Shimsha rivers. The Arkavathi basin is primarily comprised of four watersheds viz 4B3B5,6,7 and 8 and Shimsha river comprised of three watersheds 4B3C1,2 and 5. The rivers and streams originate from small watersheds and empty into number of tanks scattered in the district. The drainage pattern in the area can be described as semi dendritic to dendritic. Drainage map of the district is given in fig 2.
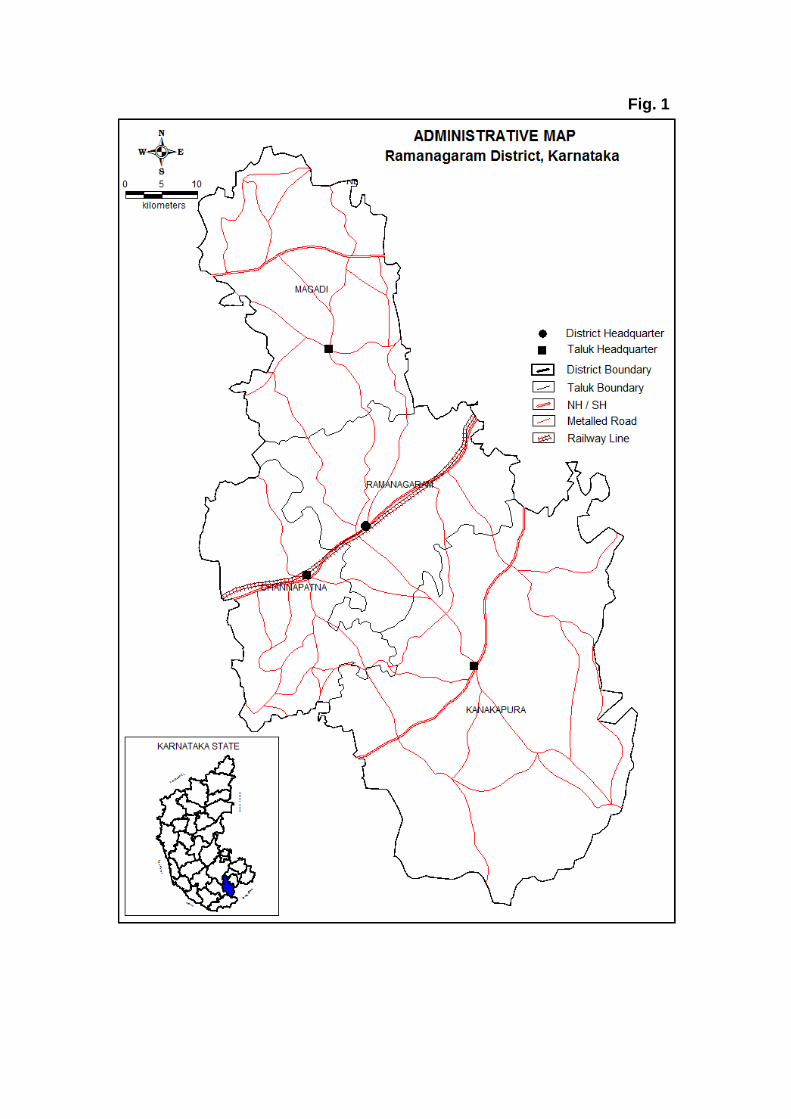
Fig. 1
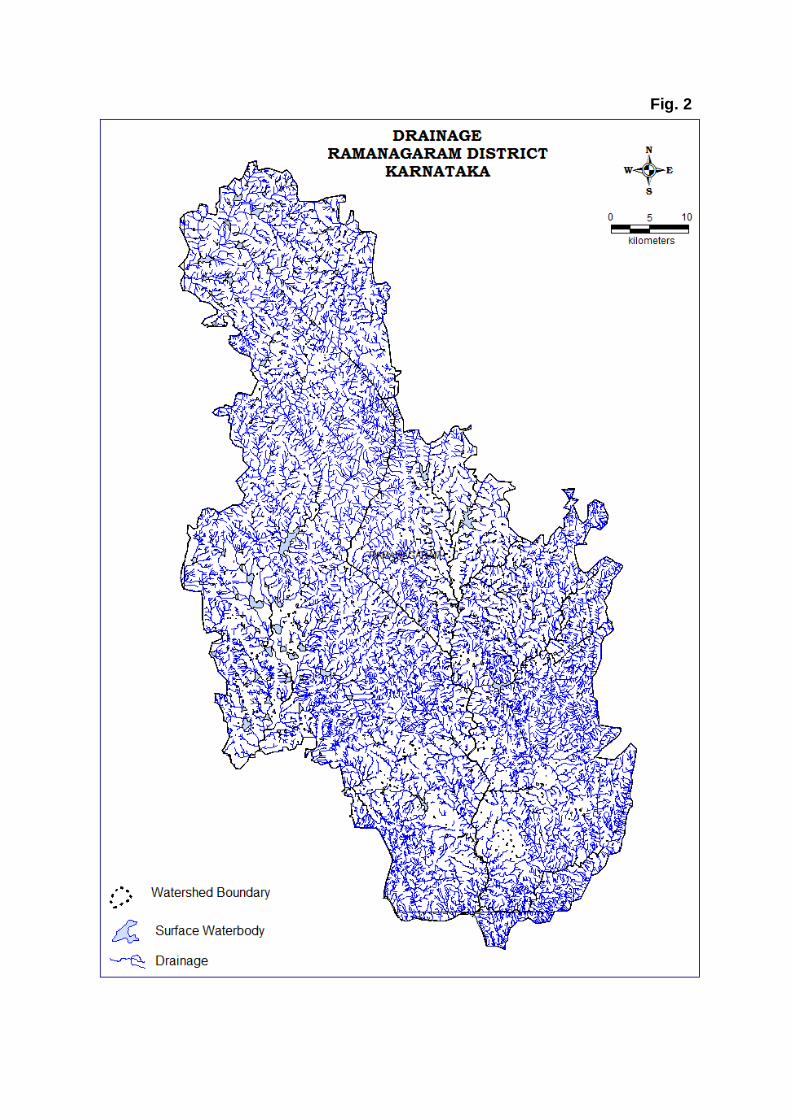
Fig. 2
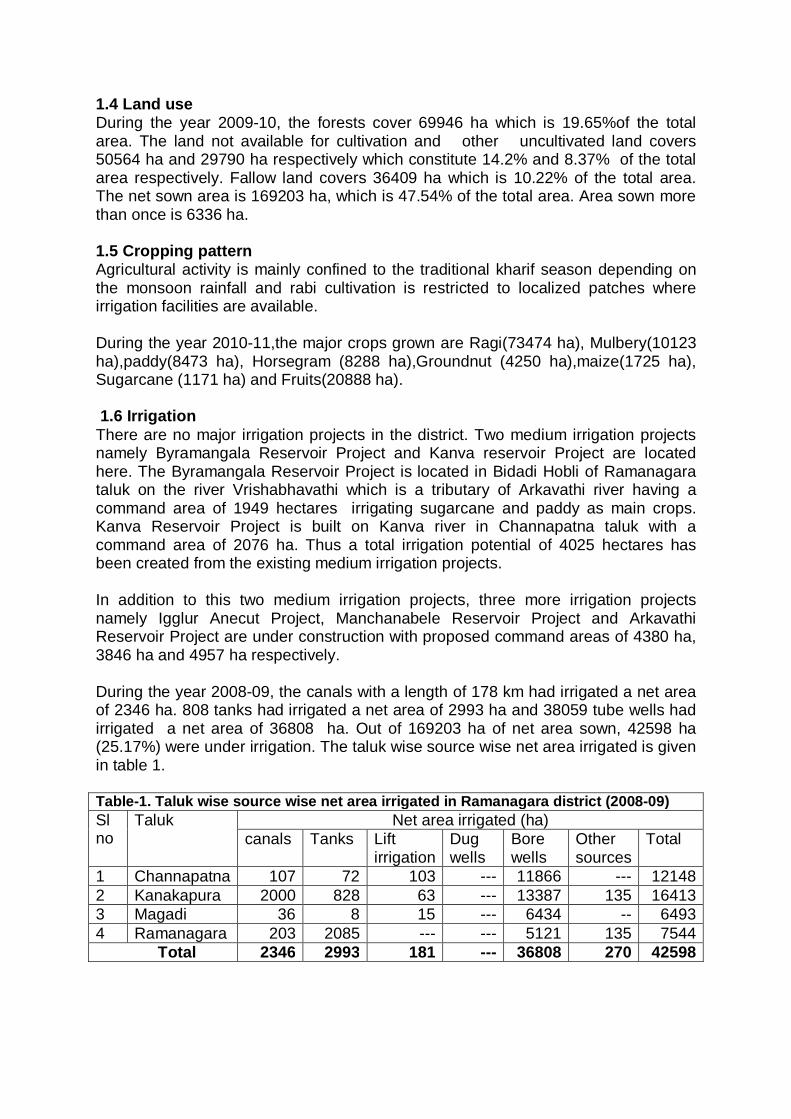
1.4 Land use During the year 2009-10, the forests cover 69946 ha which is 19.65%of the total area. The land not available for cultivation and other uncultivated land covers 50564 ha and 29790 ha respectively which constitute 14.2% and 8.37% of the total area respectively. Fallow land covers 36409 ha which is 10.22% of the total area. The net sown area is 169203 ha, which is 47.54% of the total area. Area sown more than once is 6336 ha. 1.5 Cropping pattern Agricultural activity is mainly confined to the traditional kharif season depending on the monsoon rainfall and rabi cultivation is restricted to localized patches where irrigation facilities are available. During the year 2010-11,the major crops grown are Ragi(73474 ha), Mulbery(10123 ha),paddy(8473 ha), Horsegram (8288 ha),Groundnut (4250 ha),maize(1725 ha), Sugarcane (1171 ha) and Fruits(20888 ha). 1.6 Irrigation There are no major irrigation projects in the district. Two medium irrigation projects namely Byramangala Reservoir Project and Kanva reservoir Project are located here. The Byramangala Reservoir Project is located in Bidadi Hobli of Ramanagara taluk on the river Vrishabhavathi which is a tributary of Arkavathi river having a command area of 1949 hectares irrigating sugarcane and paddy as main crops. Kanva Reservoir Project is built on Kanva river in Channapatna taluk with a command area of 2076 ha. Thus a total irrigation potential of 4025 hectares has been created from the existing medium irrigation projects. In addition to this two medium irrigation projects, three more irrigation projects namely Igglur Anecut Project, Manchanabele Reservoir Project and Arkavathi Reservoir Project are under construction with proposed command areas of 4380 ha, 3846 ha and 4957 ha respectively. During the year 2008-09, the canals with a length of 178 km had irrigated a net area of 2346 ha. 808 tanks had irrigated a net area of 2993 ha and 38059 tube wells had irrigated a net area of 36808 ha. Out of 169203 ha of net area sown, 42598 ha (25.17%) were under irrigation. The taluk wise source wise net area irrigated is given in table 1. Table-1. Taluk wise source wise net area irrigated in Ramanagara district (2008-09) Sl no
Taluk Net area irrigated (ha) canals Tanks Lift
irrigation Dug wells
Bore wells
Other sources
Total
1 Channapatna 107 72 103 --- 11866 --- 12148 2 Kanakapura 2000 828 63 --- 13387 135 16413 3 Magadi 36 8 15 --- 6434 -- 6493 4 Ramanagara 203 2085 --- --- 5121 135 7544 Total 2346 2993 181 --- 36808 270 42598
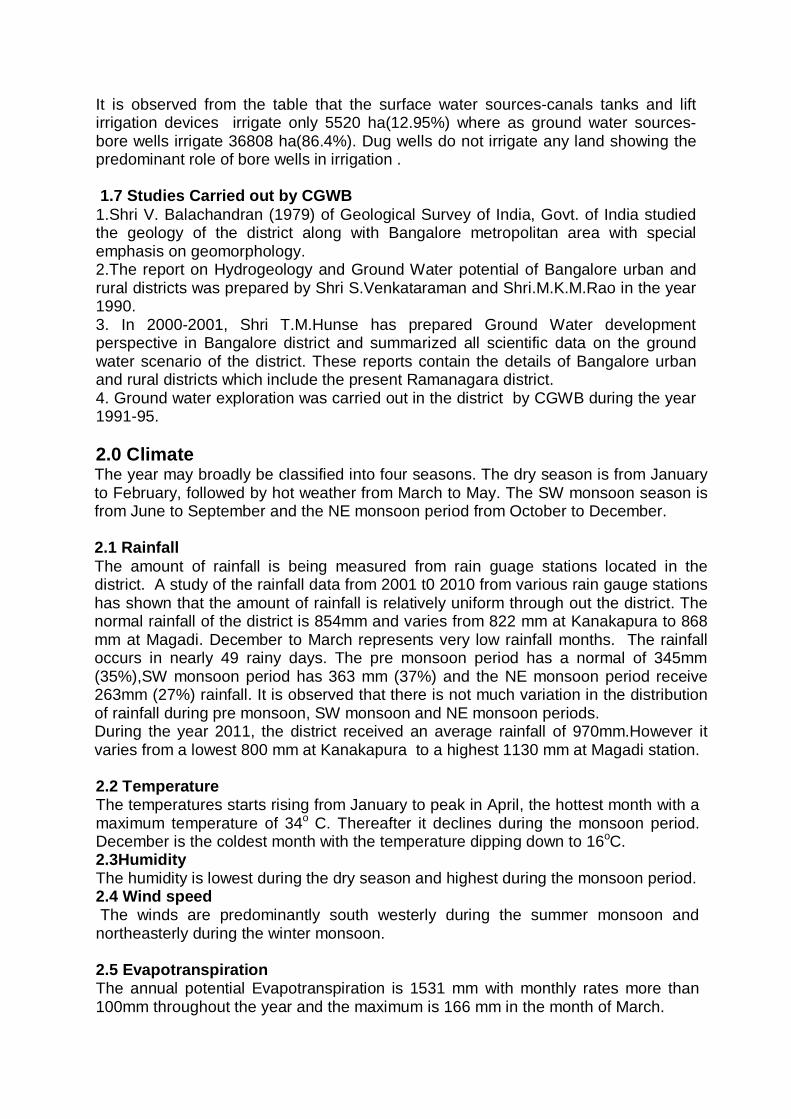
It is observed from the table that the surface water sources-canals tanks and lift irrigation devices irrigate only 5520 ha(12.95%) where as ground water sources- bore wells irrigate 36808 ha(86.4%). Dug wells do not irrigate any land showing the predominant role of bore wells in irrigation . 1.7 Studies Carried out by CGWB 1.Shri V. Balachandran (1979) of Geological Survey of India, Govt. of India studied the geology of the district along with Bangalore metropolitan area with special emphasis on geomorphology. 2.The report on Hydrogeology and Ground Water potential of Bangalore urban and rural districts was prepared by Shri S.Venkataraman and Shri.M.K.M.Rao in the year 1990. 3. In 2000-2001, Shri T.M.Hunse has prepared Ground Water development perspective in Bangalore district and summarized all scientific data on the ground water scenario of the district. These reports contain the details of Bangalore urban and rural districts which include the present Ramanagara district. 4. Ground water exploration was carried out in the district by CGWB during the year 1991-95. 2.0 Climate The year may broadly be classified into four seasons. The dry season is from January to February, followed by hot weather from March to May. The SW monsoon season is from June to September and the NE monsoon period from October to December. 2.1 Rainfall The amount of rainfall is being measured from rain guage stations located in the district. A study of the rainfall data from 2001 t0 2010 from various rain gauge stations has shown that the amount of rainfall is relatively uniform through out the district. The normal rainfall of the district is 854mm and varies from 822 mm at Kanakapura to 868 mm at Magadi. December to March represents very low rainfall months. The rainfall occurs in nearly 49 rainy days. The pre monsoon period has a normal of 345mm (35%),SW monsoon period has 363 mm (37%) and the NE monsoon period receive 263mm (27%) rainfall. It is observed that there is not much variation in the distribution of rainfall during pre monsoon, SW monsoon and NE monsoon periods. During the year 2011, the district received an average rainfall of 970mm.However it varies from a lowest 800 mm at Kanakapura to a highest 1130 mm at Magadi station. 2.2 Temperature The temperatures starts rising from January to peak in April, the hottest month with a maximum temperature of 34o C. Thereafter it declines during the monsoon period. December is the coldest month with the temperature dipping down to 16oC. 2.3Humidity The humidity is lowest during the dry season and highest during the monsoon period. 2.4 Wind speed The winds are predominantly south westerly during the summer monsoon and northeasterly during the winter monsoon. 2.5 Evapotranspiration The annual potential Evapotranspiration is 1531 mm with monthly rates more than 100mm throughout the year and the maximum is 166 mm in the month of March.
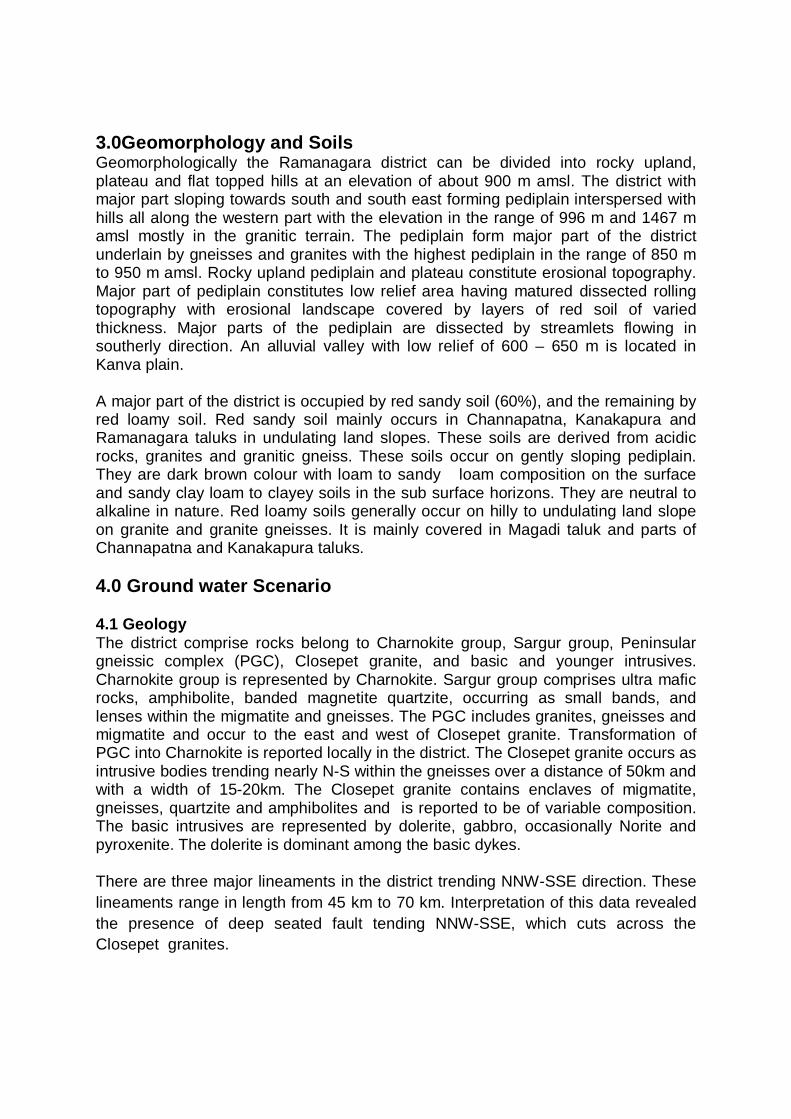
3.0Geomorphology and Soils Geomorphologically the Ramanagara district can be divided into rocky upland, plateau and flat topped hills at an elevation of about 900 m amsl. The district with major part sloping towards south and south east forming pediplain interspersed with hills all along the western part with the elevation in the range of 996 m and 1467 m amsl mostly in the granitic terrain. The pediplain form major part of the district underlain by gneisses and granites with the highest pediplain in the range of 850 m to 950 m amsl. Rocky upland pediplain and plateau constitute erosional topography. Major part of pediplain constitutes low relief area having matured dissected rolling topography with erosional landscape covered by layers of red soil of varied thickness. Major parts of the pediplain are dissected by streamlets flowing in southerly direction. An alluvial valley with low relief of 600 – 650 m is located in Kanva plain. A major part of the district is occupied by red sandy soil (60%), and the remaining by red loamy soil. Red sandy soil mainly occurs in Channapatna, Kanakapura and Ramanagara taluks in undulating land slopes. These soils are derived from acidic rocks, granites and granitic gneiss. These soils occur on gently sloping pediplain. They are dark brown colour with loam to sandy loam composition on the surface and sandy clay loam to clayey soils in the sub surface horizons. They are neutral to alkaline in nature. Red loamy soils generally occur on hilly to undulating land slope on granite and granite gneisses. It is mainly covered in Magadi taluk and parts of Channapatna and Kanakapura taluks. 4.0 Ground water Scenario 4.1 Geology The district comprise rocks belong to Charnokite group, Sargur group, Peninsular gneissic complex (PGC), Closepet granite, and basic and younger intrusives. Charnokite group is represented by Charnokite. Sargur group comprises ultra mafic rocks, amphibolite, banded magnetite quartzite, occurring as small bands, and lenses within the migmatite and gneisses. The PGC includes granites, gneisses and migmatite and occur to the east and west of Closepet granite. Transformation of PGC into Charnokite is reported locally in the district. The Closepet granite occurs as intrusive bodies trending nearly N-S within the gneisses over a distance of 50km and with a width of 15-20km. The Closepet granite contains enclaves of migmatite, gneisses, quartzite and amphibolites and is reported to be of variable composition. The basic intrusives are represented by dolerite, gabbro, occasionally Norite and pyroxenite. The dolerite is dominant among the basic dykes. There are three major lineaments in the district trending NNW-SSE direction. These lineaments range in length from 45 km to 70 km. Interpretation of this data revealed the presence of deep seated fault tending NNW-SSE, which cuts across the Closepet granites.
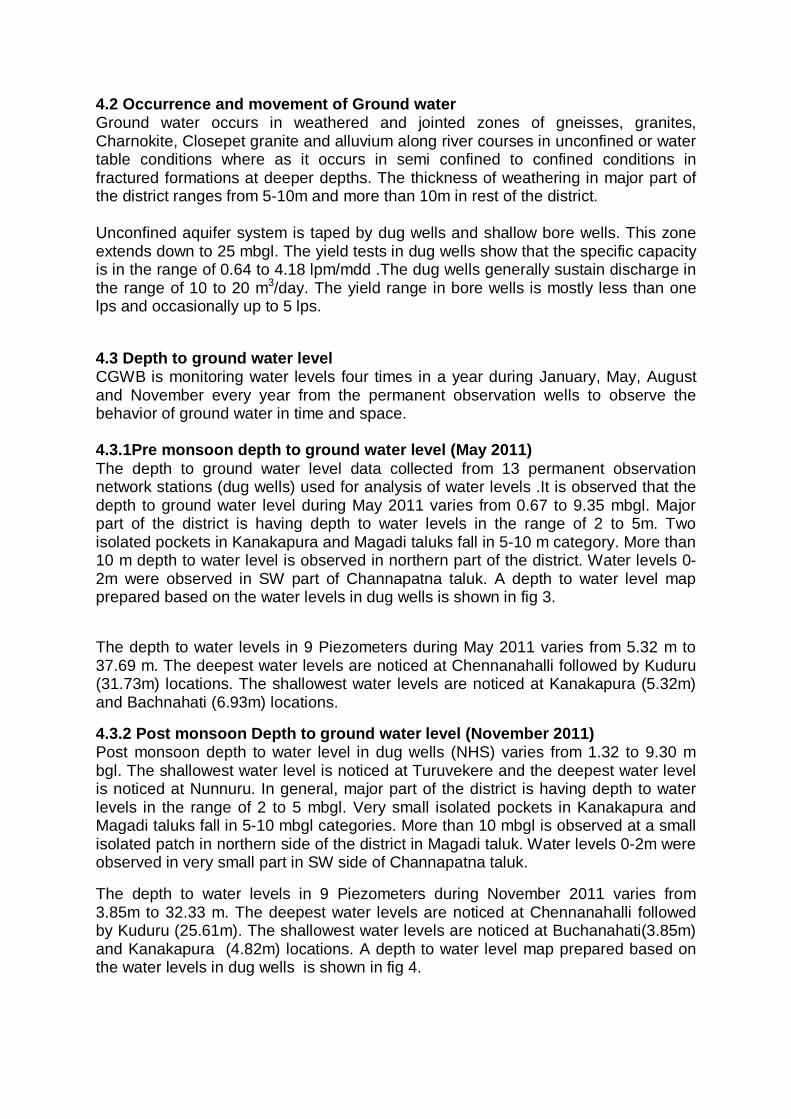
4.2 Occurrence and movement of Ground water Ground water occurs in weathered and jointed zones of gneisses, granites, Charnokite, Closepet granite and alluvium along river courses in unconfined or water table conditions where as it occurs in semi confined to confined conditions in fractured formations at deeper depths. The thickness of weathering in major part of the district ranges from 5-10m and more than 10m in rest of the district. Unconfined aquifer system is taped by dug wells and shallow bore wells. This zone extends down to 25 mbgl. The yield tests in dug wells show that the specific capacity is in the range of 0.64 to 4.18 lpm/mdd .The dug wells generally sustain discharge in the range of 10 to 20 m3/day. The yield range in bore wells is mostly less than one lps and occasionally up to 5 lps.
4.3 Depth to ground water level CGWB is monitoring water levels four times in a year during January, May, August and November every year from the permanent observation wells to observe the behavior of ground water in time and space. 4.3.1Pre monsoon depth to ground water level (May 2011) The depth to ground water level data collected from 13 permanent observation network stations (dug wells) used for analysis of water levels .It is observed that the depth to ground water level during May 2011 varies from 0.67 to 9.35 mbgl. Major part of the district is having depth to water levels in the range of 2 to 5m. Two isolated pockets in Kanakapura and Magadi taluks fall in 5-10 m category. More than 10 m depth to water level is observed in northern part of the district. Water levels 0-2m were observed in SW part of Channapatna taluk. A depth to water level map prepared based on the water levels in dug wells is shown in fig 3.
The depth to water levels in 9 Piezometers during May 2011 varies from 5.32 m to 37.69 m. The deepest water levels are noticed at Chennanahalli followed by Kuduru (31.73m) locations. The shallowest water levels are noticed at Kanakapura (5.32m) and Bachnahati (6.93m) locations.
4.3.2 Post monsoon Depth to ground water level (November 2011) Post monsoon depth to water level in dug wells (NHS) varies from 1.32 to 9.30 m bgl. The shallowest water level is noticed at Turuvekere and the deepest water level is noticed at Nunnuru. In general, major part of the district is having depth to water levels in the range of 2 to 5 mbgl. Very small isolated pockets in Kanakapura and Magadi taluks fall in 5-10 mbgl categories. More than 10 mbgl is observed at a small isolated patch in northern side of the district in Magadi taluk. Water levels 0-2m were observed in very small part in SW side of Channapatna taluk.
The depth to water levels in 9 Piezometers during November 2011 varies from 3.85m to 32.33 m. The deepest water levels are noticed at Chennanahalli followed by Kuduru (25.61m). The shallowest water levels are noticed at Buchanahati(3.85m) and Kanakapura (4.82m) locations. A depth to water level map prepared based on the water levels in dug wells is shown in fig 4.
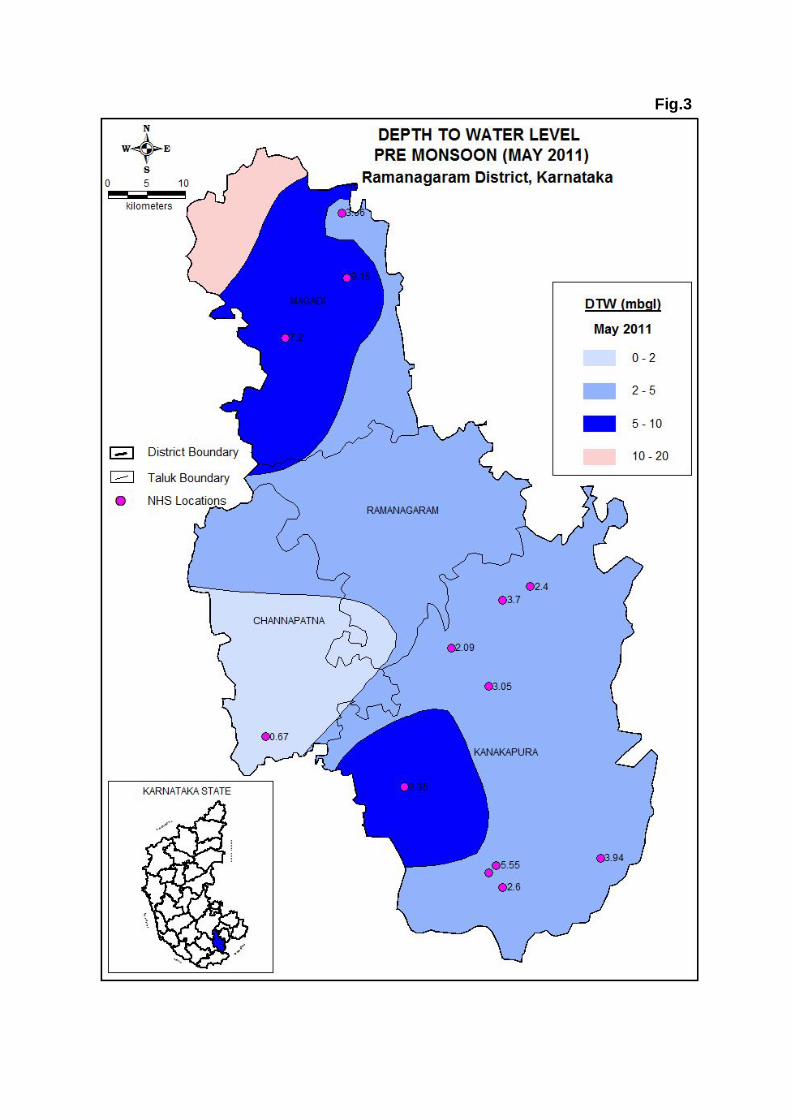
Fig.3
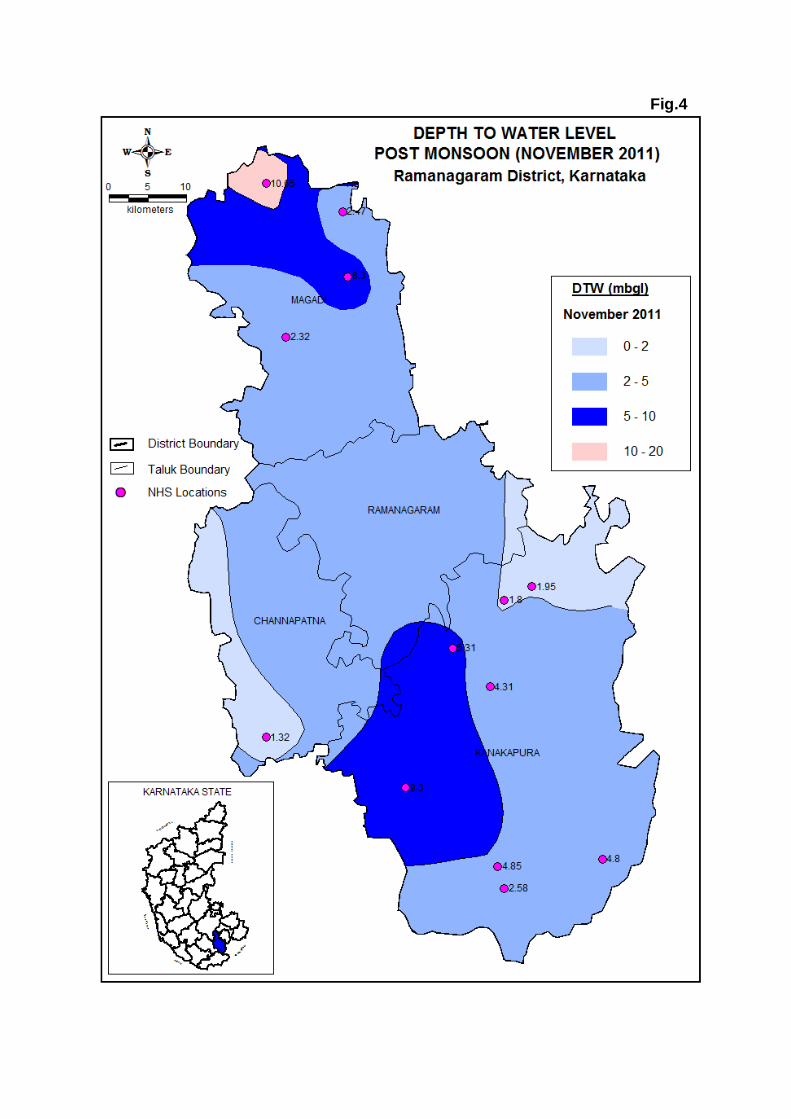
Fig.4
4.4 Ground Water level Fluctuation
4.4.1 Seasonal Fluctuation (May 2011 vs November 2011)
It is observed from the depth to water level data that there is both rise and fall in water levels during November 2011 when compared to May 2011 water levels in dug wells .Out of 13 dug wells, water level rise is observed in 8 stations ranging from 0.02 to 4.88m. In the remaining 5 stations water level fall is observed in the range of 0.19 to 3.22 m. The highest rise (4.88m) is noticed at Magadi station in Magadi taluk. The highest fall (3.22m) is noticed at Gonaldoddi station in Kanakapura taluk.
However, all the Piezometers have shown rise in water levels ranging from 0.5m to 9.31m. The highest rise (9.31m) is noticed at Magadi station in Magadi taluk.
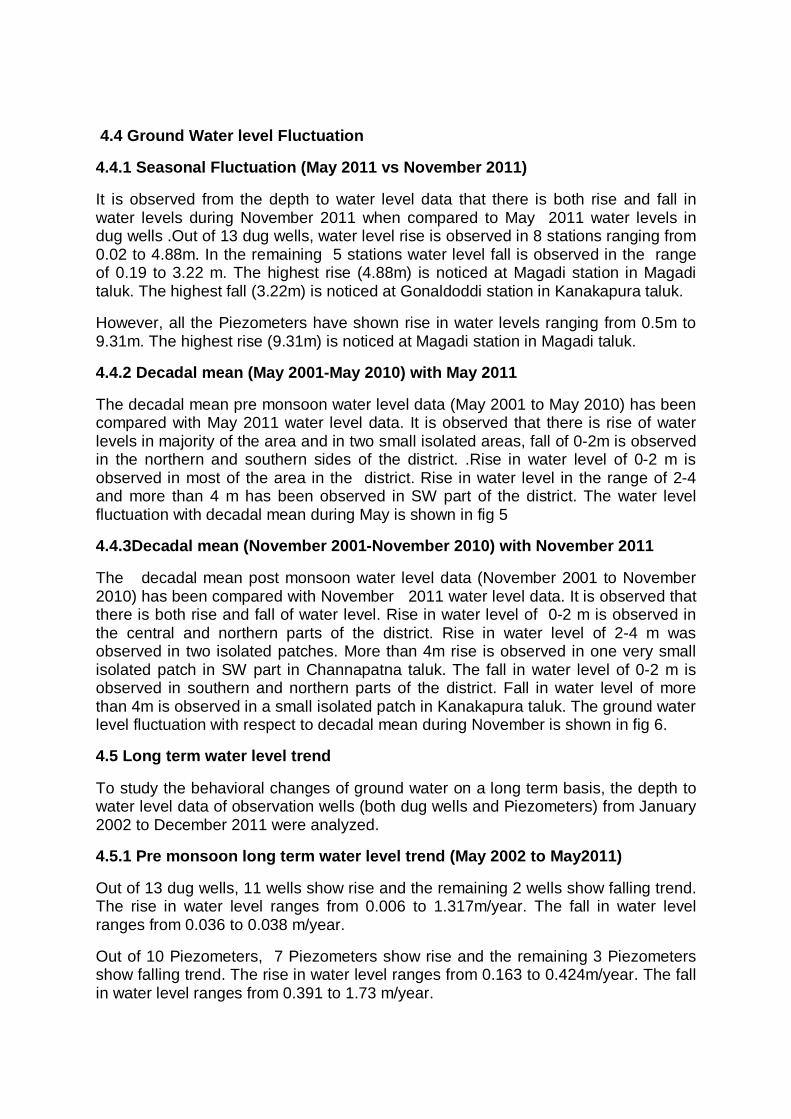
4.4.2 Decadal mean (May 2001-May 2010) with May 2011
The decadal mean pre monsoon water level data (May 2001 to May 2010) has been compared with May 2011 water level data. It is observed that there is rise of water levels in majority of the area and in two small isolated areas, fall of 0-2m is observed in the northern and southern sides of the district. .Rise in water level of 0-2 m is observed in most of the area in the district. Rise in water level in the range of 2-4 and more than 4 m has been observed in SW part of the district. The water level fluctuation with decadal mean during May is shown in fig 5
4.4.3Decadal mean (November 2001-November 2010) with November 2011
The decadal mean post monsoon water level data (November 2001 to November 2010) has been compared with November 2011 water level data. It is observed that there is both rise and fall of water level. Rise in water level of 0-2 m is observed in the central and northern parts of the district. Rise in water level of 2-4 m was observed in two isolated patches. More than 4m rise is observed in one very small isolated patch in SW part in Channapatna taluk. The fall in water level of 0-2 m is observed in southern and northern parts of the district. Fall in water level of more than 4m is observed in a small isolated patch in Kanakapura taluk. The ground water level fluctuation with respect to decadal mean during November is shown in fig 6.
4.5 Long term water level trend
To study the behavioral changes of ground water on a long term basis, the depth to water level data of observation wells (both dug wells and Piezometers) from January 2002 to December 2011 were analyzed.
4.5.1 Pre monsoon long term water level trend (May 2002 to May2011)
Out of 13 dug wells, 11 wells show rise and the remaining 2 wells show falling trend. The rise in water level ranges from 0.006 to 1.317m/year. The fall in water level ranges from 0.036 to 0.038 m/year.
Out of 10 Piezometers, 7 Piezometers show rise and the remaining 3 Piezometers show falling trend. The rise in water level ranges from 0.163 to 0.424m/year. The fall in water level ranges from 0.391 to 1.73 m/year.
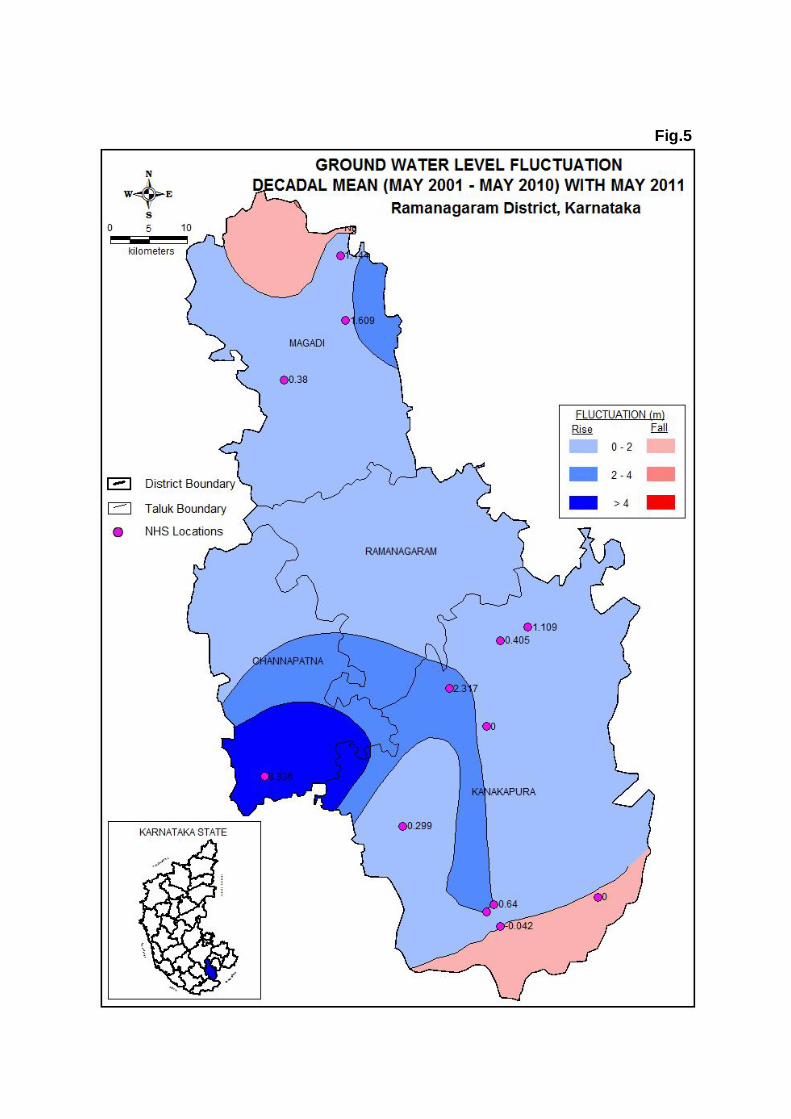
Fig.5
Fig. 6
4.5.2 Post monsoon long term water level trend (November 2002 to November2011) Out of 16 dug wells, 10 wells show rise and the remaining 6 wells show falling trend. The rise in water level ranges from 0.012 to 0.897m/year. The fall in water level ranges from 0.022 to 0.326 m/year.
Out of 10 Piezometers,7 Piezometers show rise and the remaining 3 Piezometers show falling trend. The rise in water level ranges from 0.009 to 0.853m/year. The fall in water level ranges from 0.065 to 0.692 m/year.
4.5.3 Long term water level trend during the decade (January 2002 to December 2011) Out of 20 dug well stations 15 stations show rise and the remaining 5 stations show fall in water level . The rise in water level ranges from 0.023 to 0.918m/year. The fall in water level ranges from 0.009 to 0.0241 m/year. The highest rise in water level of 0.918m/year was noticed at uyamballi in Kanakapura taluk followed by 0.437 m/year at Chandasipalya in Magadi taluk. Fall in water level is noticed at Kothahalli,,Rudrapura, Attamgere, naikanahalli and Hegnuru stations.
Out of 11 Piezometer stations ,7 stations show rise and the remaining 4 stations show fall in water level . The rise in water level ranges from 0.190 to 3.337m/year. The fall in water level ranges from 0.226 to 1.021m/year. The highest rise in water level of 3.337 m/year was noticed at Channapatna followed by 0.818 m/year at Thalaghattapura in Kanakapura taluk . Fall in water level is noticed at Kuduru, solur, Jayamangala and Chennenahalli stations.
Ground water exploration Under Ground water exploration programme during the years 1991-1995, CGWB has constructed 14 EWs and 13 OWs in the district down to a maximum depth of 287 m bgl. at Malligunte site in Magadi taluk. The drilling discharges ranges from negligible to 9.52 lps. Highest yield of 9.52lps was noticed at Padavanagere village in Kanakapura taluk. The Transmissivity ranges from 6-535 m2/day. Highest T is noticed at Kanakapura village in Kanakapura taluk. The Storativity ranges from 4.8*10-2 at Kanchagarahalli in Ramanagara taluk to 9.02*10-4 at Kanakapura village in Kanakapura taluk. The location of exploratory wells is shown in fig 7.
Urban Hydrogeology
Ramanagara, the district head quarters is the only urban centre in the district. The Ground water here is not under threat as the city is provided with piped water supply from surface water sources. Ground Water caters only a minor part of the requirement of the town.
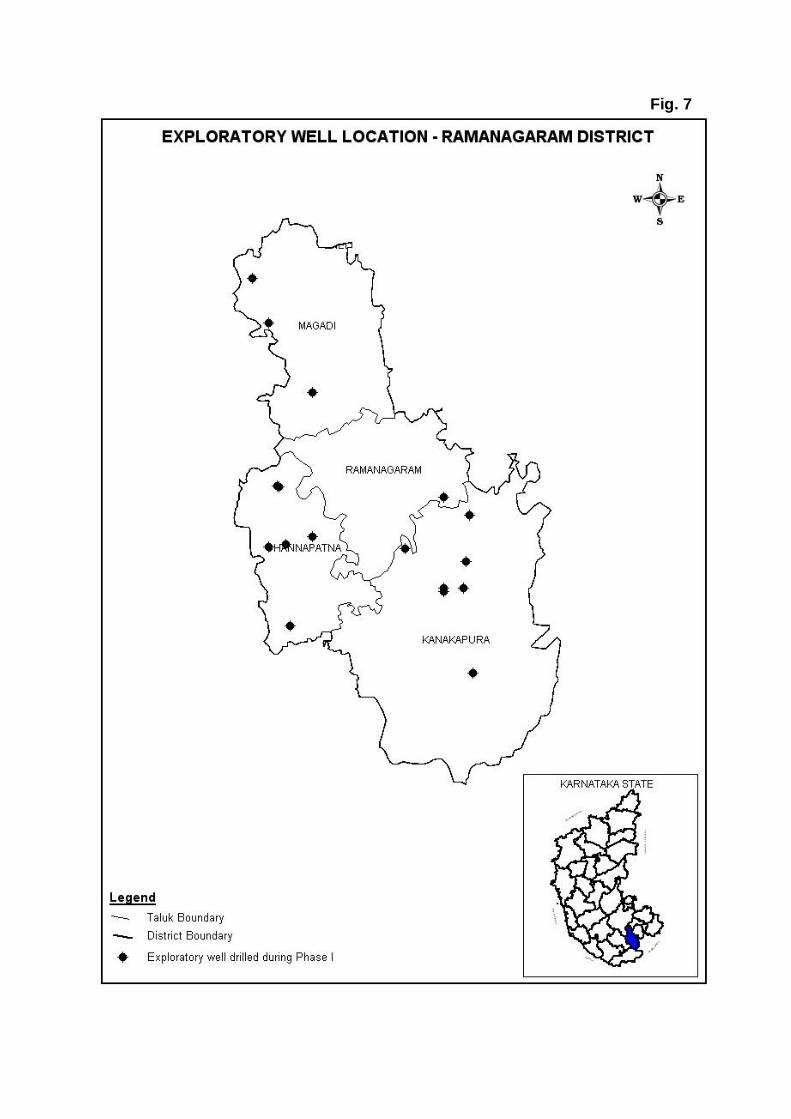
Fig. 7
Mining Hydrogeology
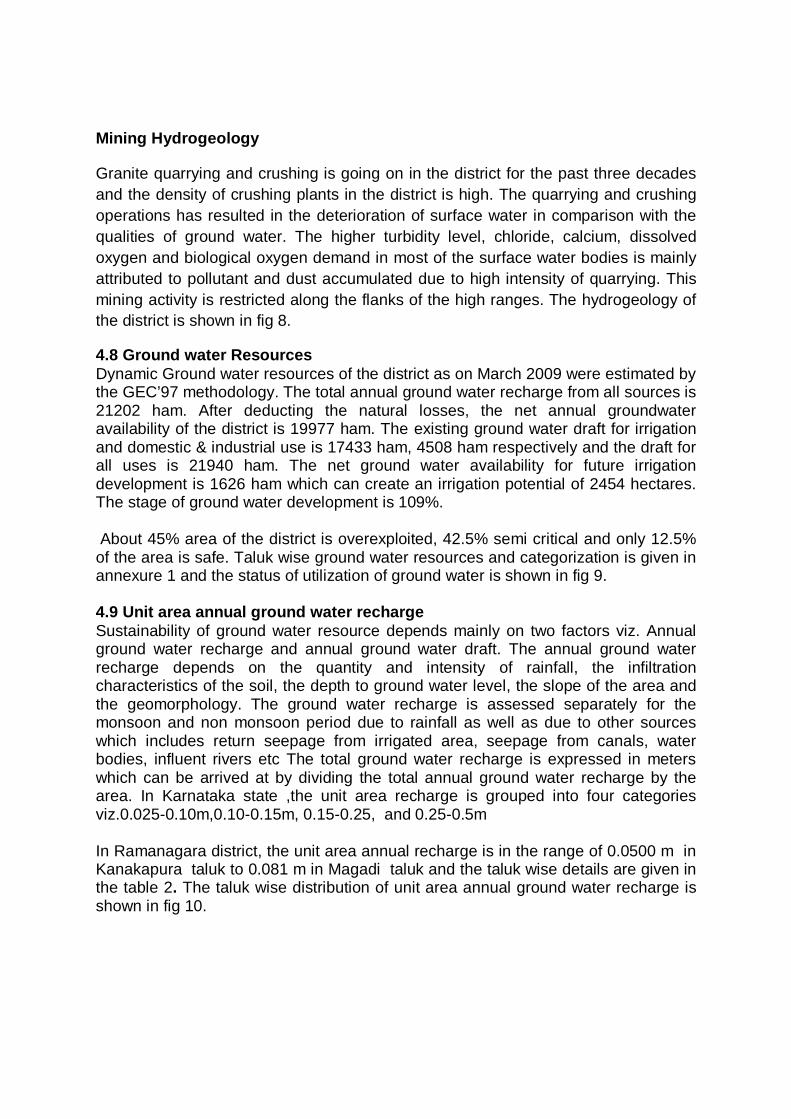
Granite quarrying and crushing is going on in the district for the past three decades and the density of crushing plants in the district is high. The quarrying and crushing operations has resulted in the deterioration of surface water in comparison with the qualities of ground water. The higher turbidity level, chloride, calcium, dissolved oxygen and biological oxygen demand in most of the surface water bodies is mainly attributed to pollutant and dust accumulated due to high intensity of quarrying. This mining activity is restricted along the flanks of the high ranges. The hydrogeology of the district is shown in fig 8.
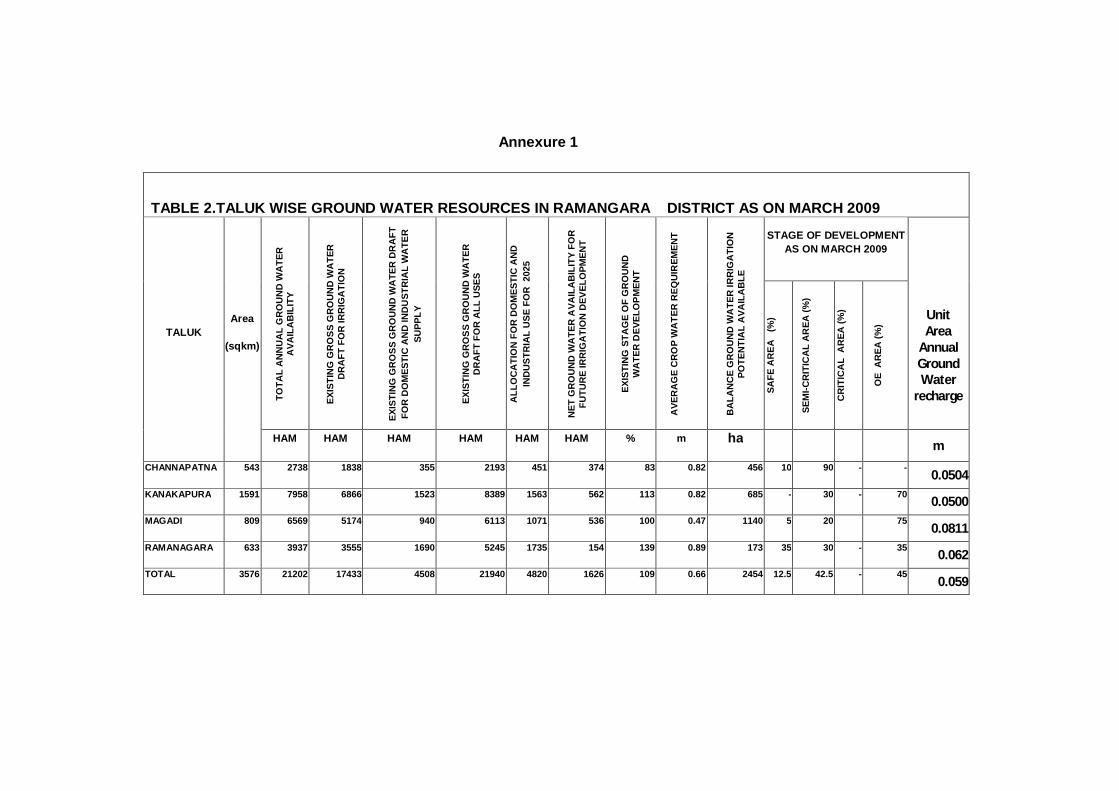
4.8 Ground water Resources Dynamic Ground water resources of the district as on March 2009 were estimated by the GEC’97 methodology. The total annual ground water recharge from all sources is 21202 ham. After deducting the natural losses, the net annual groundwater availability of the district is 19977 ham. The existing ground water draft for irrigation and domestic & industrial use is 17433 ham, 4508 ham respectively and the draft for all uses is 21940 ham. The net ground water availability for future irrigation development is 1626 ham which can create an irrigation potential of 2454 hectares. The stage of ground water development is 109%. About 45% area of the district is overexploited, 42.5% semi critical and only 12.5% of the area is safe. Taluk wise ground water resources and categorization is given in annexure 1 and the status of utilization of ground water is shown in fig 9. 4.9 Unit area annual ground water recharge Sustainability of ground water resource depends mainly on two factors viz. Annual ground water recharge and annual ground water draft. The annual ground water recharge depends on the quantity and intensity of rainfall, the infiltration characteristics of the soil, the depth to ground water level, the slope of the area and the geomorphology. The ground water recharge is assessed separately for the monsoon and non monsoon period due to rainfall as well as due to other sources which includes return seepage from irrigated area, seepage from canals, water bodies, influent rivers etc The total ground water recharge is expressed in meters which can be arrived at by dividing the total annual ground water recharge by the area. In Karnataka state ,the unit area recharge is grouped into four categories viz.0.025-0.10m,0.10-0.15m, 0.15-0.25, and 0.25-0.5m In Ramanagara district, the unit area annual recharge is in the range of 0.0500 m in Kanakapura taluk to 0.081 m in Magadi taluk and the taluk wise details are given in the table 2. The taluk wise distribution of unit area annual ground water recharge is shown in fig 10.
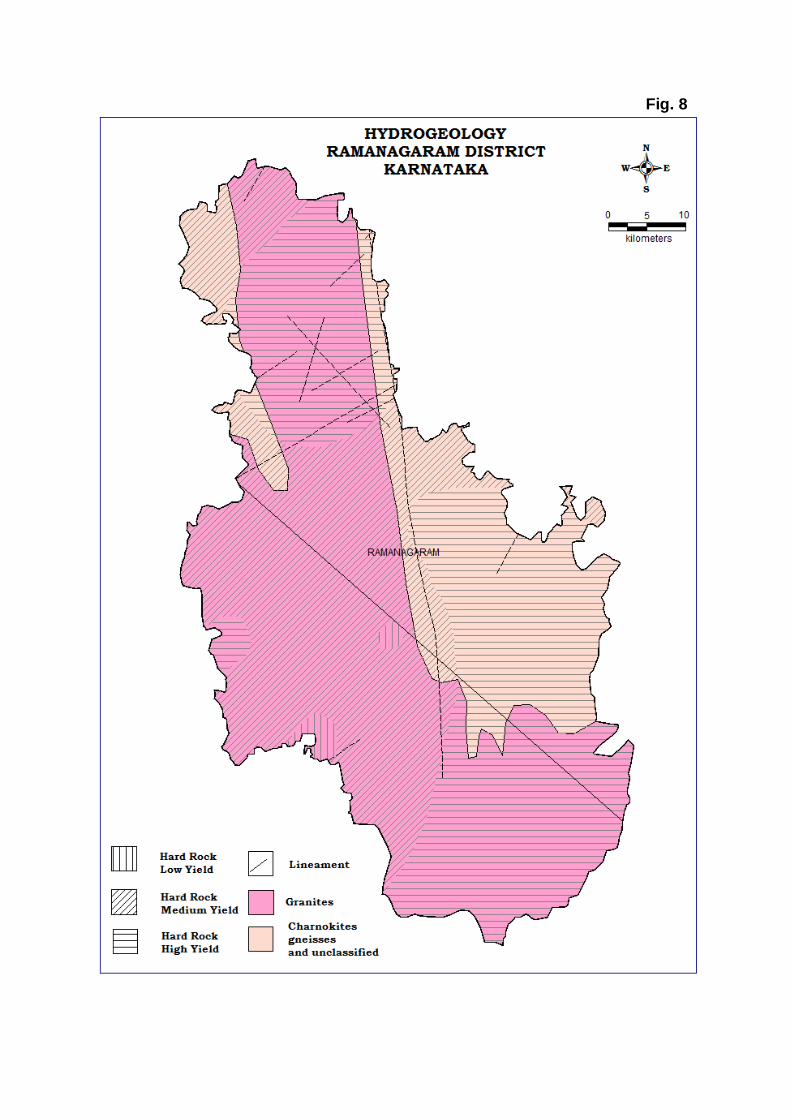
Fig. 8
Fig. 9
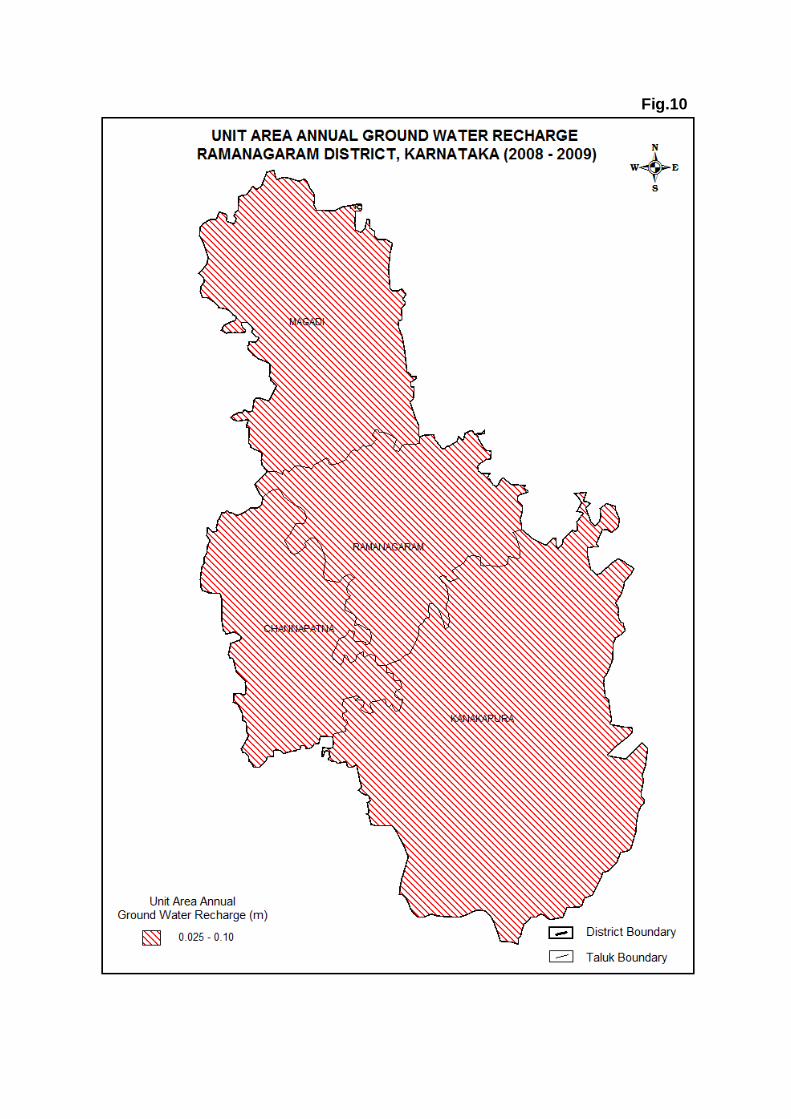
Fig.10
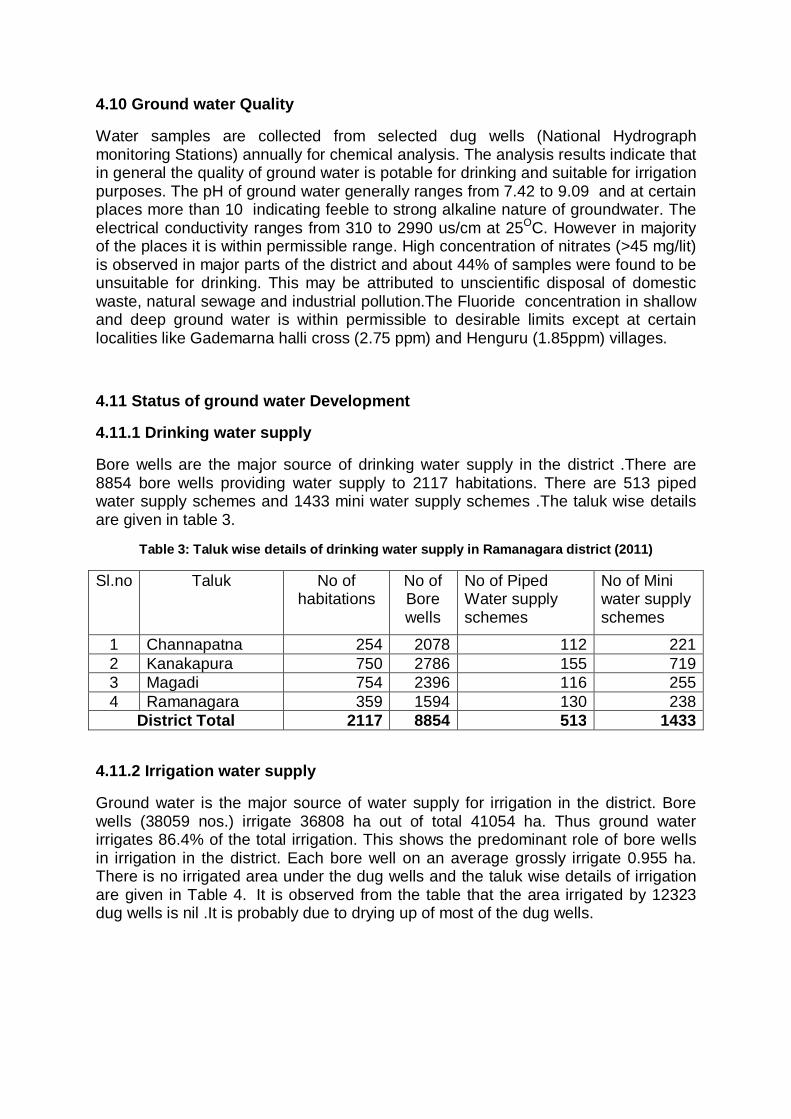
4.10 Ground water Quality
Water samples are collected from selected dug wells (National Hydrograph monitoring Stations) annually for chemical analysis. The analysis results indicate that in general the quality of ground water is potable for drinking and suitable for irrigation purposes. The pH of ground water generally ranges from 7.42 to 9.09 and at certain places more than 10 indicating feeble to strong alkaline nature of groundwater. The electrical conductivity ranges from 310 to 2990 us/cm at 25OC. However in majority of the places it is within permissible range. High concentration of nitrates (>45 mg/lit) is observed in major parts of the district and about 44% of samples were found to be unsuitable for drinking. This may be attributed to unscientific disposal of domestic waste, natural sewage and industrial pollution.The Fluoride concentration in shallow and deep ground water is within permissible to desirable limits except at certain localities like Gademarna halli cross (2.75 ppm) and Henguru (1.85ppm) villages.
4.11 Status of ground water Development
4.11.1 Drinking water supply
Bore wells are the major source of drinking water supply in the district .There are 8854 bore wells providing water supply to 2117 habitations. There are 513 piped water supply schemes and 1433 mini water supply schemes .The taluk wise details are given in table 3.
Table 3: Taluk wise details of drinking water supply in Ramanagara district (2011)
Sl.no Taluk No of habitations
No of Bore wells
No of Piped Water supply schemes
No of Mini water supply schemes
1 Channapatna 254 2078 112 221 2 Kanakapura 750 2786 155 719 3 Magadi 754 2396 116 255 4 Ramanagara 359 1594 130 238
District Total 2117 8854 513 1433
4.11.2 Irrigation water supply
Ground water is the major source of water supply for irrigation in the district. Bore wells (38059 nos.) irrigate 36808 ha out of total 41054 ha. Thus ground water irrigates 86.4% of the total irrigation. This shows the predominant role of bore wells in irrigation in the district. Each bore well on an average grossly irrigate 0.955 ha. There is no irrigated area under the dug wells and the taluk wise details of irrigation are given in Table 4. It is observed from the table that the area irrigated by 12323 dug wells is nil .It is probably due to drying up of most of the dug wells.
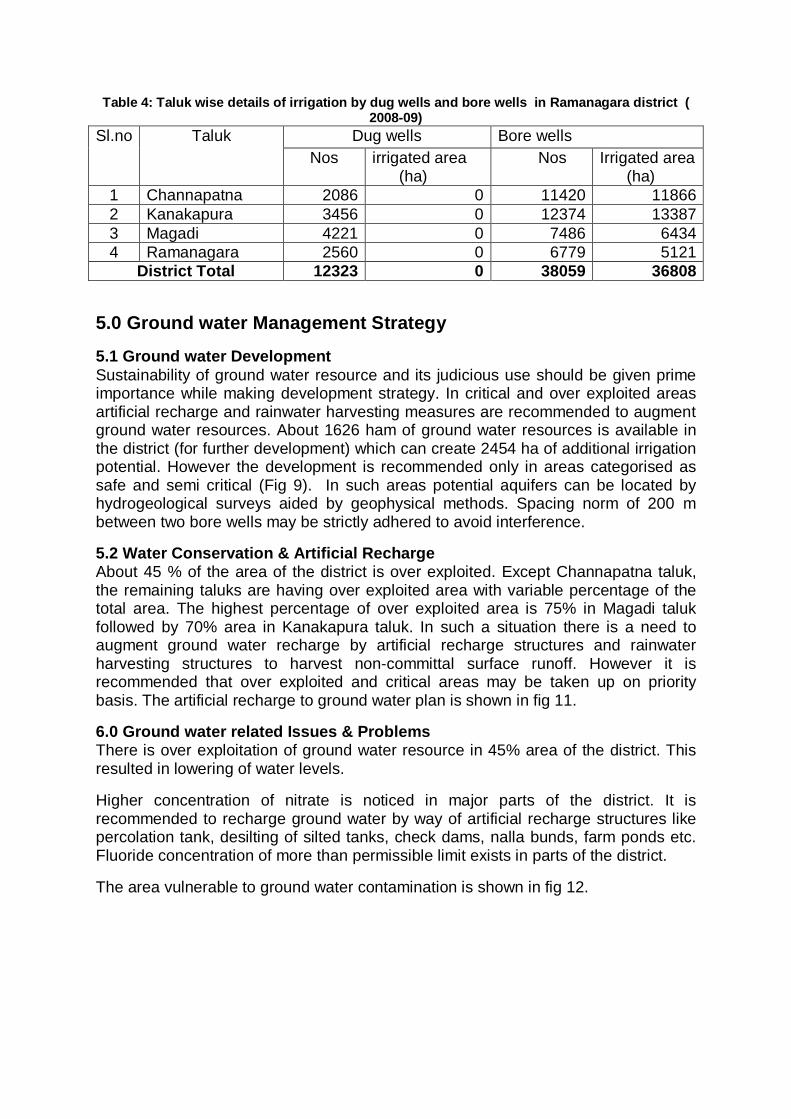
Table 4: Taluk wise details of irrigation by dug wells and bore wells in Ramanagara district ( 2008-09)
Sl.no Taluk Dug wells Bore wells Nos
irrigated area (ha)
Nos Irrigated area (ha)
1 Channapatna 2086 0 11420 11866 2 Kanakapura 3456 0 12374 13387 3 Magadi 4221 0 7486 6434 4 Ramanagara 2560 0 6779 5121
District Total 12323 0 38059 36808
5.0 Ground water Management Strategy
5.1 Ground water Development Sustainability of ground water resource and its judicious use should be given prime importance while making development strategy. In critical and over exploited areas artificial recharge and rainwater harvesting measures are recommended to augment ground water resources. About 1626 ham of ground water resources is available in the district (for further development) which can create 2454 ha of additional irrigation potential. However the development is recommended only in areas categorised as safe and semi critical (Fig 9). In such areas potential aquifers can be located by hydrogeological surveys aided by geophysical methods. Spacing norm of 200 m between two bore wells may be strictly adhered to avoid interference.
5.2 Water Conservation & Artificial Recharge About 45 % of the area of the district is over exploited. Except Channapatna taluk, the remaining taluks are having over exploited area with variable percentage of the total area. The highest percentage of over exploited area is 75% in Magadi taluk followed by 70% area in Kanakapura taluk. In such a situation there is a need to augment ground water recharge by artificial recharge structures and rainwater harvesting structures to harvest non-committal surface runoff. However it is recommended that over exploited and critical areas may be taken up on priority basis. The artificial recharge to ground water plan is shown in fig 11.
6.0 Ground water related Issues & Problems There is over exploitation of ground water resource in 45% area of the district. This resulted in lowering of water levels.
Higher concentration of nitrate is noticed in major parts of the district. It is recommended to recharge ground water by way of artificial recharge structures like percolation tank, desilting of silted tanks, check dams, nalla bunds, farm ponds etc. Fluoride concentration of more than permissible limit exists in parts of the district.
The area vulnerable to ground water contamination is shown in fig 12.
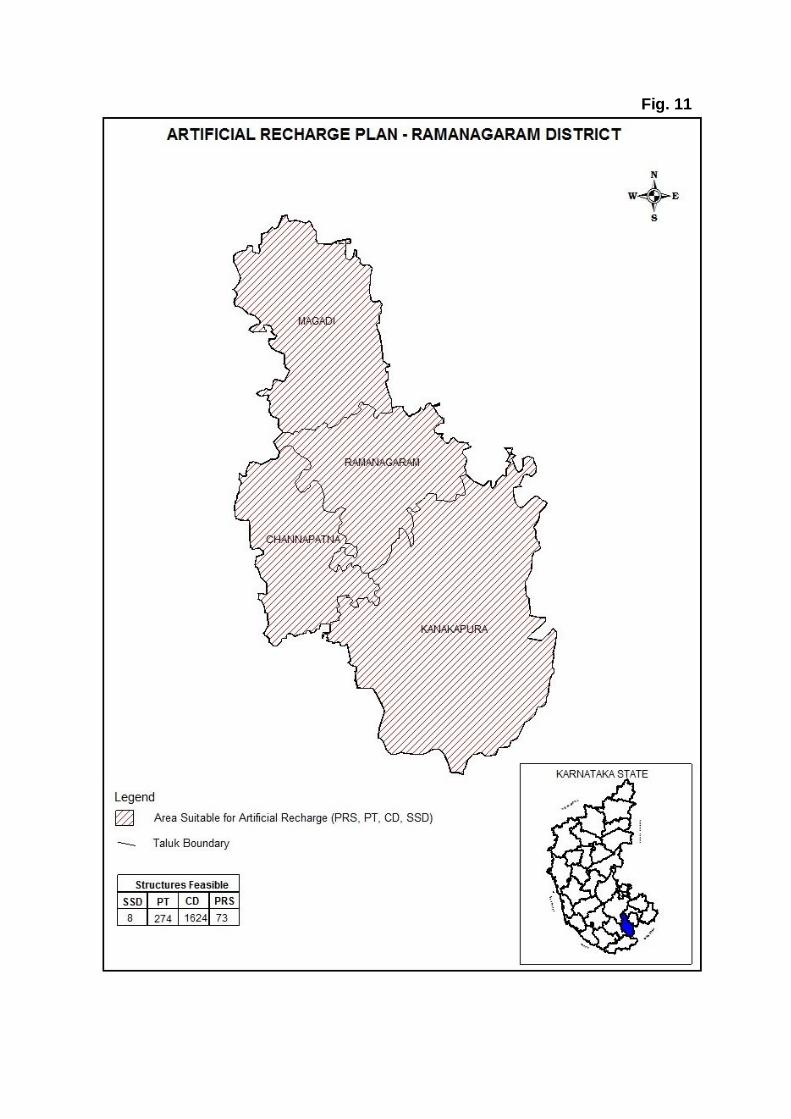
Fig. 11
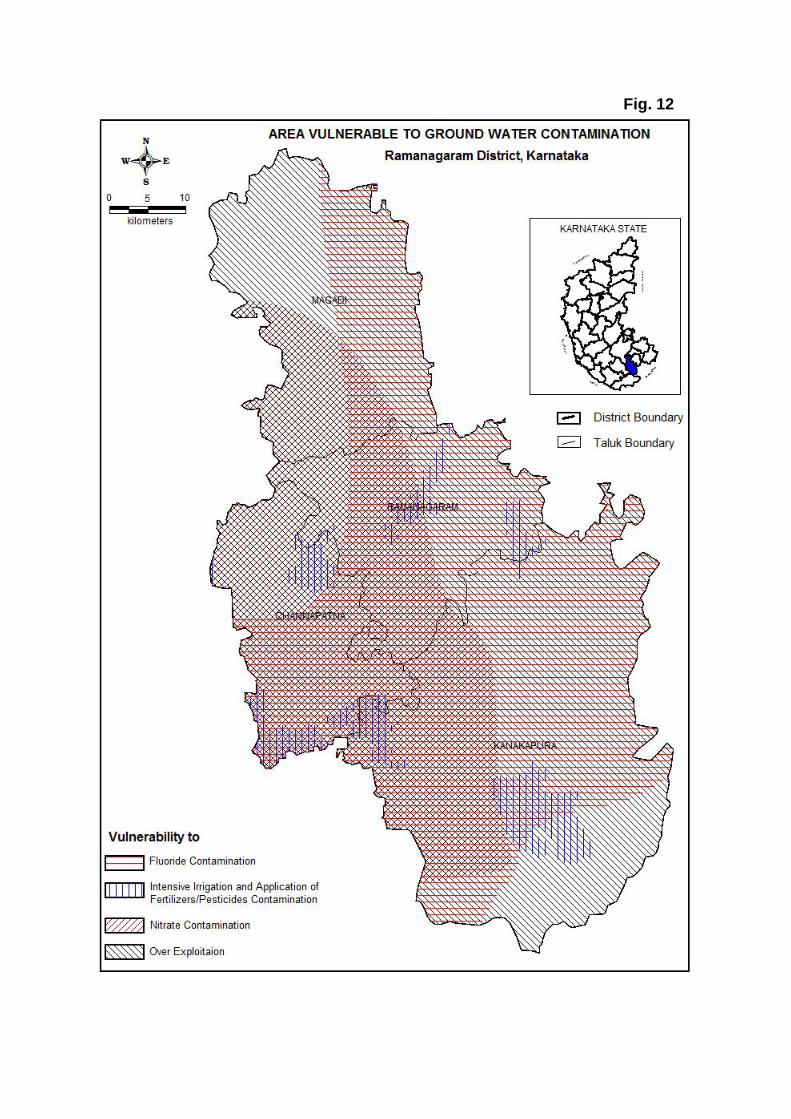
Fig. 12
7.0 Awareness Training
7.1 Mass awareness & Water Management Training Programmes
No Mass awareness & Water Management Training Programmes were conducted in the district so for.
7.2 Participation in Exhibition, Mela, fair etc
No exhibition was conducted in the district
8.0 Areas Notified by CGWA/SGWA
No area in the district is notified so far
9.0 Recommendations
Ground water is the major source for drinking and irrigation purposes in the district. About 90% of the drinking requirements and 86.4% of irrigations requirements are met from ground water. This has resulted in over exploitation in about 45% of the area. Considering the prevailing scenario of the groundwater resources and development the following recommendations are made for the optimal groundwater draft and sustainable development of resources in the district. 1. Construction of check dams across nallahs and streams at appropriate places such as water table depleting areas, over exploited and critical areas and in those areas where water quality problem exists. 2. Considering the fresh water scarcity in the district, a comprehensive programme should be formulated to harvest the rain water through roof top, check dams, surface tanks etc, which in turn restrict the surface flows and augment the groundwater resources. 3. The ground water worthy areas such as topographic lows, valley portions, low fluctuations zones should be developed with adequate soil conservation measures to prevent the soil erosion during rainy seasons. 4. Constant monitoring of ground water quality should be maintained in fluoride and nitrate contaminated areas to prevent further deterioration and related problems. 5. Mass awareness programmes should be conducted for public awareness about the limited availability and pollution of ground water resource. 6. Farmers should be educated to grow less water intensive crops and adopt micro irrigation systems. Government should provide subsidy in such ventures. 7. Sites for bore wells should be selected with the technical advice from qualified persons.
8.Conjunctive use of both surface and ground water to be implemented in the canal command areas, which will improve the quality of ground water, prevent water logging and availability of canal water to the tail end areas.
Annexure 1
TABLE 2.TALUK WISE GROUND WATER RESOURCES IN RAMANGARA DISTRICT AS ON MARCH 2009
TALUK Area
(sqkm)
TOTA
L A
NN
UA
L G
RO
UN
D W
ATE
R
AVA
ILA
BIL
ITY
EXIS
TIN
G G
RO
SS G
RO
UN
D W
ATE
R
DR
AFT
FO
R IR
RIG
ATI
ON
EXIS
TIN
G G
RO
SS G
RO
UN
D W
ATE
R D
RA
FT
FOR
DO
MES
TIC
AN
D IN
DU
STR
IAL
WA
TER
SU
PPLY
EXIS
TIN
G G
RO
SS G
RO
UN
D W
ATE
R
DR
AFT
FO
R A
LL U
SES
ALL
OC
ATI
ON
FO
R D
OM
ESTI
C A
ND
IN
DU
STR
IAL
USE
FO
R 2
025
NET
GR
OU
ND
WA
TER
AVA
ILA
BIL
ITY
FOR
FU
TUR
E IR
RIG
ATI
ON
DEV
ELO
PMEN
T
EXIS
TIN
G S
TAG
E O
F G
RO
UN
D
WA
TER
DEV
ELO
PMEN
T
AVE
RA
GE
CR
OP
WA
TER
REQ
UIR
EMEN
T
BA
LAN
CE
GR
OU
ND
WA
TER
IRR
IGA
TIO
N
POTE
NTI
AL
AVA
ILA
BLE
STAGE OF DEVELOPMENT AS ON MARCH 2009
SAFE
AR
EA
(%)
SEM
I-CR
ITIC
AL
AR
EA (%
)
CR
ITIC
AL
AR
EA (%
)
OE
AR
EA (%
)
Unit Area
Annual Ground Water
recharge
HAM HAM HAM HAM HAM HAM % m ha m CHANNAPATNA 543 2738 1838 355 2193 451 374 83 0.82 456 10 90 - -
0.0504KANAKAPURA 1591 7958 6866 1523 8389 1563 562 113 0.82 685 - 30 - 70
0.0500MAGADI 809 6569 5174 940 6113 1071 536 100 0.47 1140 5 20 75
0.0811RAMANAGARA 633 3937 3555 1690 5245 1735 154 139 0.89 173 35 30 - 35
0.062TOTAL 3576 21202 17433 4508 21940 4820 1626 109 0.66 2454 12.5 42.5 - 45
0.059