Embed Size (px)
Citation preview
Hydrol. Earth Syst. Sci., 19, 1093–1106, 2015
www.hydrol-earth-syst-sci.net/19/1093/2015/
doi:10.5194/hess-19-1093-2015
© Author(s) 2015. CC Attribution 3.0 License.
Groundwater as an emergency source for drought mitigation in the
Crocodile River catchment, South Africa
F. E. F. Mussá1,2, Y. Zhou1, S. Maskey1, I. Masih1, and S. Uhlenbrook1,3
1UNESCO-IHE, Institute for Water Education, P.O. Box 3015, 2601 DA Delft, the Netherlands2Eduardo Mondlane University, Faculty of Engineering, Av. de Moçambique km 1.5, C. Postal 257, Maputo, Mozambique3Delft University of Technology, Section of Water Resources, P.O. Box 5048, 2600 GA Delft, the Netherlands
Correspondence to: F. E. F. Mussá ([email protected]) and Y. Zhou ([email protected])
Received: 31 January 2014 – Published in Hydrol. Earth Syst. Sci. Discuss.: 6 March 2014
Revised: 25 December 2014 – Accepted: 29 January 2015 – Published: 26 February 2015
Abstract. Global climate change has received much atten-
tion worldwide in the scientific as well as in the political
community, indicating that changes in precipitation, extreme
droughts and floods may increasingly threaten many regions.
Drought is a natural phenomenon that causes social, econom-
ical and environmental damage to society. In this study, we
assess the drought intensity and severity and the groundwa-
ter potential to be used as a supplementary source of water to
mitigate drought impacts in the Crocodile River catchment,
a water-stressed sub-catchment of the Incomati River catch-
ment in South Africa. The research methodology consists of
three parts. First, the spatial and temporal variation of the me-
teorological and hydrological drought severity and intensity
over the catchment were evaluated. The Standardized Pre-
cipitation Index (SPI) was used to analyse the meteorolog-
ical drought and the Standardized Runoff Index (SRI) was
used for the hydrological drought. Second, the water deficit
in the catchment during the drought period was computed
using a simple water balance method. Finally, a groundwa-
ter model was constructed in order to assess the feasibility of
using groundwater as an emergency source for drought im-
pact mitigation. Results show that the low-rainfall areas are
more vulnerable to severe meteorological droughts (lower
and upper crocodile). Moreover, the most water stressed sub-
catchments with high level of water uses but limited stor-
age, such as the Kaap located in the middle catchment and
the Lower Crocodile sub-catchments, are more vulnerable
to severe hydrological droughts. The analysis of the poten-
tial groundwater use during droughts showed that a deficit
of 97 Mm3 yr−1 could be supplied from groundwater with-
out considerable adverse impacts on the river base flow and
groundwater storage. Abstraction simulations for different
scenarios of extremely severe droughts reveal that it is possi-
ble to use groundwater to cope with the droughts in the catch-
ment. However, local groundwater exploitation in Nelspruit
and White River sub-catchment will cause large drawdowns
(> 10 m) and high base flow reduction (> 20 %). This case
study shows that conjunctive water management of ground-
water and surface water resources is necessary to mitigate the
impacts of droughts.
1 Introduction
Global climate change is one of the serious environmental
challenges which the world is facing this century (IPCC,
2013). It is related to systematic changes of the entire world’s
weather and climate patterns beyond the natural variability
limits, and increased droughts are among the consequences.
Drought is a natural phenomenon that may cause serious so-
cial, economical and environmental damage, in particular in
areas where the water resources are already highly utilized.
A number of different reactive and proactive measures on
regional or national scale can be used to reduce its impacts.
These measures include: the use of resilience buildings of
rain-fed farming system for water harvesting for supplemen-
tal irrigation in semi-arid regions (Rockström, 2003); the
use of groundwater, use of storage in mountain rivers where
precipitation is higher, and the construction of water distribu-
tion and water storage systems (MacDonald, 2007); and the
artificial groundwater recharge with excess water from wet
periods and reuse of treated wastewater (Zhou et al., 2011).
Published by Copernicus Publications on behalf of the European Geosciences Union.
1094 F. E. F. Mussá et al.: Groundwater as an emergency source for drought mitigation
Along the same lines, Pavelic et al. (2012) propose capturing
the peak flow (surplus of water) during the wet season and
recharging shallow alluvial aquifers in a distributed manner
upstream of the flood-prone areas. Two large regional
projects have been conducted in Africa to investigate the
groundwater potential for water supply during drought. The
Groundwater and Drought Management Project (SADC,
http://archive.iwlearn.net/www.sadc-groundwater.org/) has
developed strategic regional approaches to support and
enhance the capacity of the Southern African Development
Community in the definition of drought management
policies, specifically in relation to the role, availability and
supply potential of groundwater resources. Groundwater Re-
sources Investigation for Drought Mitigation in Africa Pro-
gramme (GRIDMAP, http://www.unesco.org/new/fileadmin/
MULTIMEDIA/FIELD/Nairobi/pdf/GRIDMAPFlyer.pdf)
aimed at assessing the availability of groundwater resources
in the Horn of Africa and determining how much ground-
water resources can be utilized safely for emergency and
long-term development demands.
The Incomati river catchment is a transboundary river
catchment located in the southeastern part of Africa which
flows through South Africa, Swaziland and Mozambique and
discharges into the Indian Ocean. The river catchment is
characterized as a semi-arid climate subject to hydrological
extremes: severe droughts and floods. The Crocodile River
is one of the most important tributaries of Incomati. In the
Crocodile catchment, data and knowledge are limited regard-
ing the groundwater resources and its potential for use during
the drought period. One of the first attempts to provide maps
of sustainable groundwater harvest potential (GHP) was by
Baron et al. (1998), which was based on hydrogeological
maps developed by Vegter (1995). The GHP maps cover the
whole South Africa and provide a first estimate of the max-
imum mean annual amount of water that can be abstracted
from groundwater without depleting the aquifers. However,
the use of these maps for local groundwater management
planning is limited due to high uncertainty. The GHP maps
were updated by Water Systems Management (2001) and
DWAF (2006). However, the update in the part of the Inco-
mati catchment is largely based on interpolation from some
experimental data from the surrounding catchments, thus as-
sociated with high uncertainty.
Some groundwater studies have been carried out recently
in the Incomati catchment. Consultec and BKS (2001) quan-
tified groundwater availability in the Incomati catchment
aiming to assess its potential contribution to the total wa-
ter resources of the catchment. Tanner and Mauritius (2010)
made a groundwater potential assessment study for the whole
Incomati catchment based on the aquifer classifications sug-
gested by DWAF (2006). Their study produced maps of the
Incomati groundwater availability (in terms of low, medium
or high water availability) and the average well yield of In-
comati, without distinction between wet and dry periods.
Some groundwater studies have been done in the Kruger Na-
tional Park, a conservation area partly located in the Lower
Crocodile (Fundisi et al., 2012; Niekerk et al., 2012; Fis-
cher et al., 2009, 2010; Leyland and Witthüser, 2008). So far,
many of the groundwater potential assessment studies have
been performed at a large scale, but no groundwater poten-
tial assessment study has been carried out in the Crocodile
River catchment.
Due to the intense agricultural activity, the Crocodile River
catchment is highly water stressed. The surface water is in-
sufficient to meet the demands especially during drought pe-
riods. Small-scale farmers are the most vulnerable and af-
fected by drought hazards. The downstream country Mozam-
bique is also highly affected when droughts occur in this
catchment because of reduced transboundary flows (Zaag
and Vaz, 2003). In order to mitigate and manage water short-
age during droughts, measures are being taken on the catch-
ment scale. These measures include water transfer from adja-
cent catchments (Sabie and Komati) into the Crocodile River
catchment, storage in reservoirs, water restrictions to avoid
system failure and simple management models being setup
to quantify the risks (Tanner and Mauritius, 2010). Although
groundwater is used locally, it is not a main component of
the actual drought mitigation and management plan. How-
ever, groundwater has been considered as a potential source
to mitigate the impact of droughts and help to meet future
increased water demand in the region (DWA, 2013).
Given the vulnerability of the Crocodile catchment to cli-
mate change, the necessity of further expanding agricultural
activities and lack of knowledge on groundwater availability
in drought periods, research on drought and the feasibility
of using groundwater as an emergency source to mitigate its
impacts is of great importance. The specific objectives of this
study are: (i) classifying spatially the meteorological and hy-
drological droughts in terms of intensity and severity, (ii) as-
sessing the water availability versus demand in the catchment
during the drought periods, and (iii) formulating drought mit-
igation strategies by assessing the groundwater availability
during drought periods.
2 Material and methods
2.1 Study area
The Crocodile River catchment has an area of around
10 446 km2 and presents a wide range of elevation varying
from around 2030 m in the most upstream part and gradually
decreasing to 140 m at the outlet (Fig. 1). The main economic
activities in the catchment are agriculture and forestry, with
urban development and mining activities occupying a sec-
ondary role. According to the Incomati Water Availability
Assessment Study (DWAF, 2009) the total area of irrigated
agriculture and commercial forestry in the Crocodile catch-
ment was 2452 km2 in 2004 which corresponds to around
Hydrol. Earth Syst. Sci., 19, 1093–1106, 2015 www.hydrol-earth-syst-sci.net/19/1093/2015/
F. E. F. Mussá et al.: Groundwater as an emergency source for drought mitigation 1095
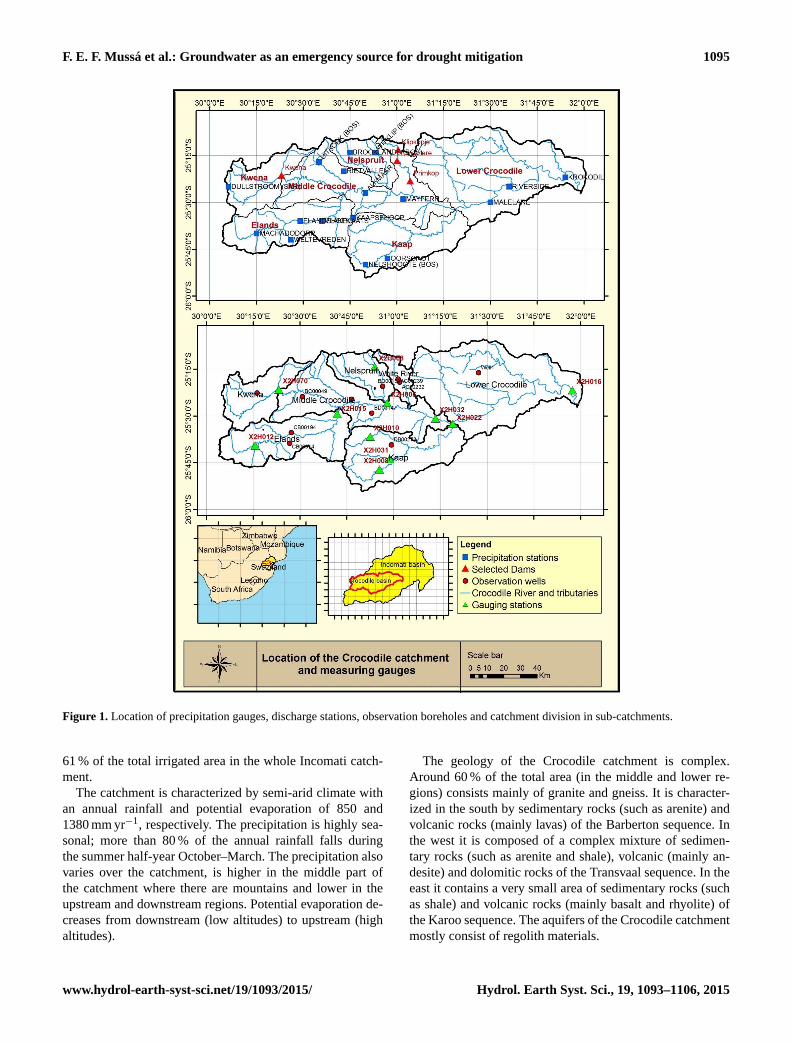
Figure 1. Location of precipitation gauges, discharge stations, observation boreholes and catchment division in sub-catchments.
61 % of the total irrigated area in the whole Incomati catch-
ment.
The catchment is characterized by semi-arid climate with
an annual rainfall and potential evaporation of 850 and
1380 mm yr−1, respectively. The precipitation is highly sea-
sonal; more than 80 % of the annual rainfall falls during
the summer half-year October–March. The precipitation also
varies over the catchment, is higher in the middle part of
the catchment where there are mountains and lower in the
upstream and downstream regions. Potential evaporation de-
creases from downstream (low altitudes) to upstream (high
altitudes).
The geology of the Crocodile catchment is complex.
Around 60 % of the total area (in the middle and lower re-
gions) consists mainly of granite and gneiss. It is character-
ized in the south by sedimentary rocks (such as arenite) and
volcanic rocks (mainly lavas) of the Barberton sequence. In
the west it is composed of a complex mixture of sedimen-
tary rocks (such as arenite and shale), volcanic (mainly an-
desite) and dolomitic rocks of the Transvaal sequence. In the
east it contains a very small area of sedimentary rocks (such
as shale) and volcanic rocks (mainly basalt and rhyolite) of
the Karoo sequence. The aquifers of the Crocodile catchment
mostly consist of regolith materials.
www.hydrol-earth-syst-sci.net/19/1093/2015/ Hydrol. Earth Syst. Sci., 19, 1093–1106, 2015
1096 F. E. F. Mussá et al.: Groundwater as an emergency source for drought mitigation
Table 1. List of data sets used.
Station name Station number Start year End year % of
missing data
Precipitation stations
Alkmaar 0555567 W 1940 2012 0.0
Oorschot 0518859 W 1940 2000 0.0
Elandshoek 0517816 W 1940 2000 3.3
Rietvallei 0555441 W 1940 2001 5.0
Machadodorp 0517430 W 1940 2012 11.1
Kaapsehoop 0518455 W 1940 2000 28.3
Vlakplaats 0518186 W 1940 2001 4.9
Dullstroom 0554175 W 1940 2000 0.0
Mayfern 0556088 W 1940 2012 9.7
Weltevreden 0517762 W 1940 2012 4.2
Nelshoogte 0518589 W 1940 2012 4.2
Brooklands 0555405 W 1940 2012 1.4
Riverside 0557115 W 1940 2000 3.3
Witklip 0555673 W 1940 2012 0.0
Malelane 0556898 W 1940 2000 0.0
Krokodilbrug 0557712 W 1940 2012 0.0
Uitsoek 0555137 W 1940 2012 16.7
Discharge stations
Boschrand X2H005 1960 2012 0.0
Sassenheim X2H008 1948 2012 2.8
Bellevue X2H010 1948 2012 0.0
Geluk X2H012 1956 2012 0.0
Lindenau X2H015 1959 2012 4.9
Ten Bosch X2H016 1960 2012 3.5
Dolton X2H022 1960 2012 7.5
Bornmans Drift X2H031 1966 2012 5.9
Weltevrede X2H032 1968 2012 3.1
Witklip Dam X2H068 1969 2012 0.0
Kwena Dam X2H070 1979 2012 0.0
2.2 Data sets
Lynch (2003) developed a rainfall database of the South
African region with data starting from around 1900 and end-
ing in 2001. The database consists of daily precipitation
records and data quality control gathered from the three main
custodians of rainfall data in South Africa which include:
SAWS (South Africa Weather Service), SASRI (South Africa
Sugarcane Research Institution) and ARC (Agricultural Re-
search Council). Additionally, a large number of municipal-
ities, private companies and individuals in South Africa also
contributed with rainfall data to the database. Lynch (2003)
computed the percentage of non-missing data of the time se-
ries for each station.
Data from this database were used and from 2001 on-
wards, data provided only by SAWS were used. 17 precip-
itation stations with low percentage of missing data (Table 1)
and a good spatial variability (Fig. 1) were selected. The time
period for less missing data corresponds to the period of 1940
to 2011. Similarly, 11 gauging stations of river discharges
were selected based on the length of the time series (at least
30 years of data), missing data in the time series (Table 1)
and spatial variability of the stations (Fig. 1).
Objectives Methodology Results
Drought mitigation scenarios
• Construction of transient groundwater flow model
• Simulation of drought mitigation scenarios
• Feasibility of using groundwater for mitigating extreme droughts
Assessment of groundwater resources
• Construction and calibration of steady groundwater flow model
• Groundwater recharge• Baseflow
Determination of water deficit during the drought
• Water balance method• Water deficit = water
availability – water demand
• Water deficit per sub-catchments
• Groundwater requirement per sub-catchments
Identification of severe droughts
• Standardized Precipitation Index (SPI)
• Standardized Runoff Index (SRI)
• Computation of drought severity and intensity
• Temporal changes of drought severity
• Spatial distribution of drought severity
• Drought severity per sub-catchments
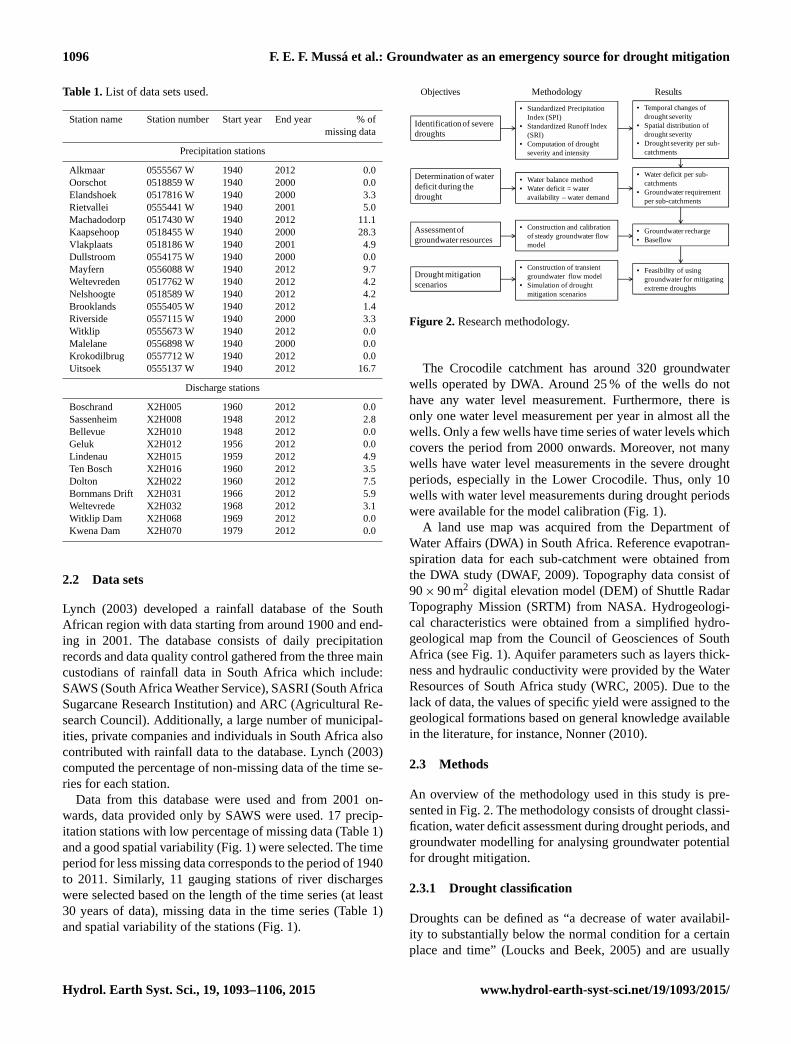
Figure 2. Research methodology.
The Crocodile catchment has around 320 groundwater
wells operated by DWA. Around 25 % of the wells do not
have any water level measurement. Furthermore, there is
only one water level measurement per year in almost all the
wells. Only a few wells have time series of water levels which
covers the period from 2000 onwards. Moreover, not many
wells have water level measurements in the severe drought
periods, especially in the Lower Crocodile. Thus, only 10
wells with water level measurements during drought periods
were available for the model calibration (Fig. 1).
A land use map was acquired from the Department of
Water Affairs (DWA) in South Africa. Reference evapotran-
spiration data for each sub-catchment were obtained from
the DWA study (DWAF, 2009). Topography data consist of
90× 90 m2 digital elevation model (DEM) of Shuttle Radar
Topography Mission (SRTM) from NASA. Hydrogeologi-
cal characteristics were obtained from a simplified hydro-
geological map from the Council of Geosciences of South
Africa (see Fig. 1). Aquifer parameters such as layers thick-
ness and hydraulic conductivity were provided by the Water
Resources of South Africa study (WRC, 2005). Due to the
lack of data, the values of specific yield were assigned to the
geological formations based on general knowledge available
in the literature, for instance, Nonner (2010).
2.3 Methods
An overview of the methodology used in this study is pre-
sented in Fig. 2. The methodology consists of drought classi-
fication, water deficit assessment during drought periods, and
groundwater modelling for analysing groundwater potential
for drought mitigation.
2.3.1 Drought classification
Droughts can be defined as “a decrease of water availabil-
ity to substantially below the normal condition for a certain
place and time” (Loucks and Beek, 2005) and are usually
Hydrol. Earth Syst. Sci., 19, 1093–1106, 2015 www.hydrol-earth-syst-sci.net/19/1093/2015/
F. E. F. Mussá et al.: Groundwater as an emergency source for drought mitigation 1097
Table 2. SPI or SRI classes.
SPI or SRI range Classification
SPI or SRI ≤−2.0 Extremely dry
−2.0 < SPI or SRI ≤−1.5 Severely dry
−1.5 < SPI or SRI ≤−1.0 Moderately dry
−1.0 < SPI or SRI ≤ 1.0 Near normal
1.0 < SPI or SRI ≤ 1.5 Moderately wet
1.5 < SPI or SRI ≤ 2.0 Severely wet
SPI or SRI ≥ 2.0 Extremely wet
Source: Sienze and Jahnke-Bornemann (2012).
classified as meteorological, hydrological and agricultural
droughts. In this research, we focus on meteorological and
hydrological droughts. Several drought indices can be used
to identify droughts (Werick et al., 1994; Baykan and Özçe-
lik, 2006; Palmer, 1965, 1968; Willeke, 1994; McKee et al.,
1993; Shukla and Wood, 2008). Furthermore, droughts can
be classified according to its duration, severity and intensity.
Drought duration is the time during which a drought index re-
mains below a certain critical value, whereas drought severity
is represented as the cumulative of a drought index below a
critical value within the drought duration and drought inten-
sity as the average of the drought index over the drought du-
ration (Mishra and Singh, 2010). Comparison of the advan-
tages, disadvantages and applicability of the various drought
indices has been reported in the literature (Loucks and Beek,
2005; Zargar et al., 2011; Mishra and Singh, 2010; Guttman,
1998; Sims et al., 2002). In this study, we applied the com-
monly used Standardized Precipitation Index (SPI) (McKee
et al., 1993) and Standardized Runoff Index (SRI) (Shukla
and Wood, 2008) to analyse meteorological droughts and hy-
drological droughts, respectively. Both SPI and SRI can be
expressed on different timescales, e.g. 3 months, 6 months
and 12 months. Table 2 shows how an event can be classified
according to the SPI and SRI values.
First, we calculated 12-month SPI for 17 precipitation sta-
tions and 12-month SRI for 12 discharge stations for the pe-
riod from 1940 to 2011. Then, for each severe drought with
SPI or SRI values−1.5 or below, we determined severity and
intensity of both meteorological and hydrological droughts.
A threshold value of −1 (SPI or SRI) was used to define a
drought event (beginning and ending of a drought).
From the drought severity calculated for each rainfall sta-
tion, we derived average severity of meteorological drought
for each sub-catchment based on the Thiessen polygons
method. The hydrological drought severity for each sub-
catchment corresponds to the drought severity of the dis-
charge station at the outlet of that sub-catchment.
Furthermore, the most severe drought was selected to
show the variability of the drought severity and intensity over
the catchment. For this drought, the drought severity and in-
tensity was determined for each precipitation station. Krig-
ing interpolation (Matheron, 1963) was used to produce the
meteorological drought severity contour map over the catch-
ment.
2.3.2 Water deficit during drought period
For the water deficit computation, the catchment was di-
vided into seven main sub-catchments (see Fig. 1). The water
deficit per sub-catchment during a drought was computed as
the water availability minus the water requirements. The wa-
ter availability was considered to be the natural flow of the
river computed by DWAF (2009) minus the stream flow re-
duction due to the forestry water use.
The main water requirements in the Crocodile catchment
include irrigation, domestic and industrial supply, and a min-
imum transboundary flow, which is the agreed minimum
discharge that has to be released to the Mozambican terri-
tory. Irrigation constitutes the principal water demand. Do-
mestic and industrial water requirements were provided by
DWAF (2009) study and the minimum transboundary flow
of 0.9 m3 s−1 was obtained from the Water Use Agreement
signed between Mozambique, Swaziland and South Africa
(TPTC, 2002). Irrigation water requirements were computed
based on the FAO’s recommendations (FAO, 1997). The ef-
fective precipitation, i.e. the precipitation available in the soil
for the plants, is one of the necessary components for the ir-
rigation water requirement computation. We computed the
effective precipitation based on a fixed percentage approach
(Smith, 1988). It consists of determining the 80 % proba-
ble rainfall (P80) and correcting for possible outfluxes due
to runoff and percolation. As the main focus of this paper is
to compute the irrigation requirements for the worst drought,
instead of using the P80, the average observed precipitation
during the drought period was used which is close to the P70.
2.3.3 Groundwater modelling to develop a drought
mitigation strategy
A numerical groundwater model was constructed to assess
groundwater potential during the drought period and to sim-
ulate the impacts of groundwater abstraction on the stor-
age, water levels and base flow reduction in the river. The
most severe drought observed within the study period was
selected. The groundwater model is based on the widely used
modelling software MODFLOW (McDonald and Harbaugh,
1983). First, a steady-state model was constructed, with the
objective of determining the initial conditions for the tran-
sient model. Second, a simplified transient natural model was
built with recharge on a monthly scale representing the av-
erage monthly recharge for the drought period. The model
consists of one layer representing the weathered and frac-
tured rocks. A model grid cell of 1× 1 km2 was used, in line
with the coarse spatial data sets available. The river catch-
ment boundary was defined as the model boundary, given the
www.hydrol-earth-syst-sci.net/19/1093/2015/ Hydrol. Earth Syst. Sci., 19, 1093–1106, 2015
1098 F. E. F. Mussá et al.: Groundwater as an emergency source for drought mitigation
Table 3. Water transfer in the Crocodile catchment.
Transfer from Transfer to Amount transfer
(Mm3 yr−1)
Nelspruit White River 3.0
Sabie and Lomati∗ Kaap 8.5
Middle Crocodile Lower Crocodile 25.6
Sabie and Lomati∗ Lower Crocodile 6.0
Source: DWAF (2009); ∗ outside the Crocodile.
fact that the shallow groundwater flow is mainly discharged
to the rivers in the catchment.
Initial values of the recharge to the groundwater from the
sub-catchments were computed by using the Thornthwaite
water balance model from the US Geological Survey (Mc-
Cabe and Markstrom, 2007). The water balance model was
calibrated using the available river discharge data from sev-
eral sub-catchments.
The MODFLOW Evaporation package parameters were
determined for each sub-catchment. The evaporation surface
is the same as surface elevation of the catchment. An extinc-
tion depth of 5 m, the average root depth of pine and euca-
lypt trees (Alliance, 2002), was assigned for the forestry-
dominated sub-catchments, namely Nelspruit, White River,
Elands and Kaap sub-catchments; the depth of 2 m, the av-
erage root depth of grass roots under semi-arid conditions
(Murphy, 2010), was assigned for Kwena, Middle Crocodile
and Lower Crocodile sub-catchments which are mainly cov-
ered by savannas. The reference evaporation provided by
DWAF (2009) is assigned as the maximum rate of evapo-
ration. The River package was used to simulate groundwater
discharges to rivers as base flow. Finally, the model was cali-
brated in the steady state manually to adjust the groundwater
recharge using the available observed groundwater levels and
the river discharges.
2.4 Scenarios using groundwater as an emergency
source
As the objective here is to use the groundwater only as an
emergency source, the existing drought mitigation strategy
of the catchment was taken into account for the computation
of the groundwater abstraction needs. The existing drought
mitigation strategy comprises the storage of surplus water
(during the wet season) in dams and water transfers within
the catchment and from out of the catchment (Table 3). Only
the storage of the major dams (storage capacity > 1.0 Mm3)
are considered – these dams are Kwena, Klipkopje, Long-
mere and Primkop dams with full storage capacities of 158.9,
11.9, 4.3 and 2 Mm3, respectively.
It was assumed that the surplus water of the wet season
would be stored in dams and further used in the dry period.
This useful water surplus (UWS) was obtained by subtract-
ing evaporation from the dams from the water surplus and
Table 4. Abstractions simulation scenarios.
Scenarios Recharge Wells abstraction
Simulation 1 Reduced in 10 % Increased in 10 %
Simulation 2 Reduced in 25 % Increased in 25 %
Simulation 3 Reduced in 50 % Increased in 50 %
Simulation 4 Reduced in 50 % Increased in 100 %
applying a reduction factor of 0.7 to take into account the
losses in the river channel. Thus, for each sub-catchment, the
groundwater abstraction need was computed using
GWN=WDi−UWS+ Tout− Tin, (1)
where GWN is the groundwater abstraction need
(Mm3 yr−1), WDi the initial water deficit (Mm3 yr−1),
UWS useful water surplus (Mm3 yr−1), Tout the water
transferred out of the catchment (Mm3 yr−1), and Tin the
water transferred into the catchment (Mm3 yr−1).
The water to be abstracted from the groundwater per sub-
catchment corresponds to the groundwater abstraction needs.
Based on the amount of groundwater abstraction needs, a
number of wells were placed over the sub-catchments based
on the topography; places near cities and irrigation areas
were also a target for the well locations. Rock formations
with higher borehole yield were also used as a criterion for
the well locations; however, in many cases it was not possible
to avoid placing wells in low borehole yield regions as these
were found to be the most dominant formation in the sub-
catchment – for instance, the White River. Then model simu-
lations were performed to test whether the amounts of water
can be abstracted. Finally, for an extremely severe drought,
more severe than the most severe drought registered in the
last 50 years, model simulations were carried out for differ-
ent scenarios. For such a severe drought precipitation would
be less, consequently recharge would be reduced and water
demand would be higher. Therefore, four simulation scenar-
ios (Table 4) were proposed where baseline recharge (be-
tween 1992 and 1995) was reduced and well abstractions
linearly increased. These scenarios of recharge values mimic
extremely severe drought conditions.
3 Results and discussion
3.1 Results of drought classification
3.1.1 Drought classification over time
The results of the SPI and SRI of 12-month scale indicated
that droughts occurred during 1966, 1978, 1983, 1992–1995,
and 2003–2004 (Fig. 3). In other words, in the 50 years from
1960 to 2011, six droughts occurred. Results of the drought
severity for Elands River sub-catchment (station X2H015)
Hydrol. Earth Syst. Sci., 19, 1093–1106, 2015 www.hydrol-earth-syst-sci.net/19/1093/2015/
F. E. F. Mussá et al.: Groundwater as an emergency source for drought mitigation 1099
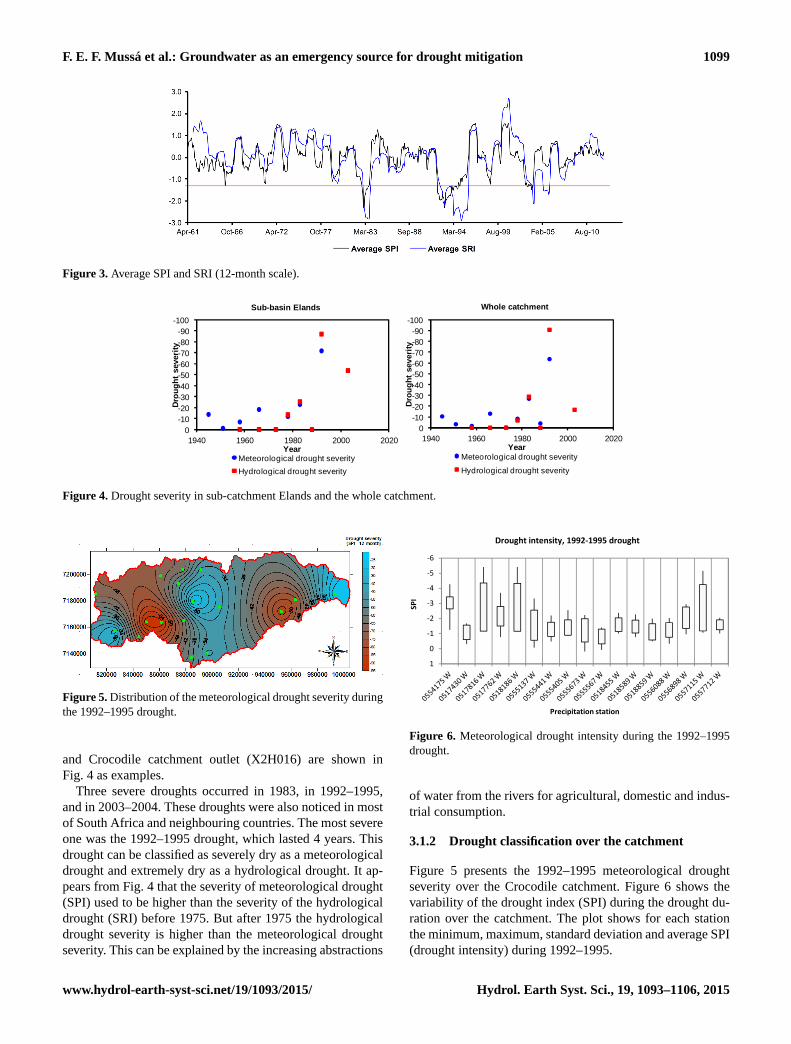
Figure 3. Average SPI and SRI (12-month scale).
-100-90-80-70-60-50-40-30-20-10
01940 1960 1980 2000 2020
Dro
ug
ht
seve
rity
Year
Sub-basin Elands
Meteorological drought severity
Hydrological drought severity
-100-90-80-70-60-50-40-30-20-10
01940 1960 1980 2000 2020
Dro
ug
ht
seve
rity
Year
Whole catchment
Meteorological drought severity
Hydrological drought severity
Figure 4. Drought severity in sub-catchment Elands and the whole catchment.
Figure 5. Distribution of the meteorological drought severity during
the 1992–1995 drought.
and Crocodile catchment outlet (X2H016) are shown in
Fig. 4 as examples.
Three severe droughts occurred in 1983, in 1992–1995,
and in 2003–2004. These droughts were also noticed in most
of South Africa and neighbouring countries. The most severe
one was the 1992–1995 drought, which lasted 4 years. This
drought can be classified as severely dry as a meteorological
drought and extremely dry as a hydrological drought. It ap-
pears from Fig. 4 that the severity of meteorological drought
(SPI) used to be higher than the severity of the hydrological
drought (SRI) before 1975. But after 1975 the hydrological
drought severity is higher than the meteorological drought
severity. This can be explained by the increasing abstractions
-6
-5
-4
-3
-2
-1
0
1
SP
I
Precipitation station
Drought intensity, 1992-1995 drought
Figure 6. Meteorological drought intensity during the 1992–1995
drought.
of water from the rivers for agricultural, domestic and indus-
trial consumption.
3.1.2 Drought classification over the catchment
Figure 5 presents the 1992–1995 meteorological drought
severity over the Crocodile catchment. Figure 6 shows the
variability of the drought index (SPI) during the drought du-
ration over the catchment. The plot shows for each station
the minimum, maximum, standard deviation and average SPI
(drought intensity) during 1992–1995.
www.hydrol-earth-syst-sci.net/19/1093/2015/ Hydrol. Earth Syst. Sci., 19, 1093–1106, 2015
1100 F. E. F. Mussá et al.: Groundwater as an emergency source for drought mitigation
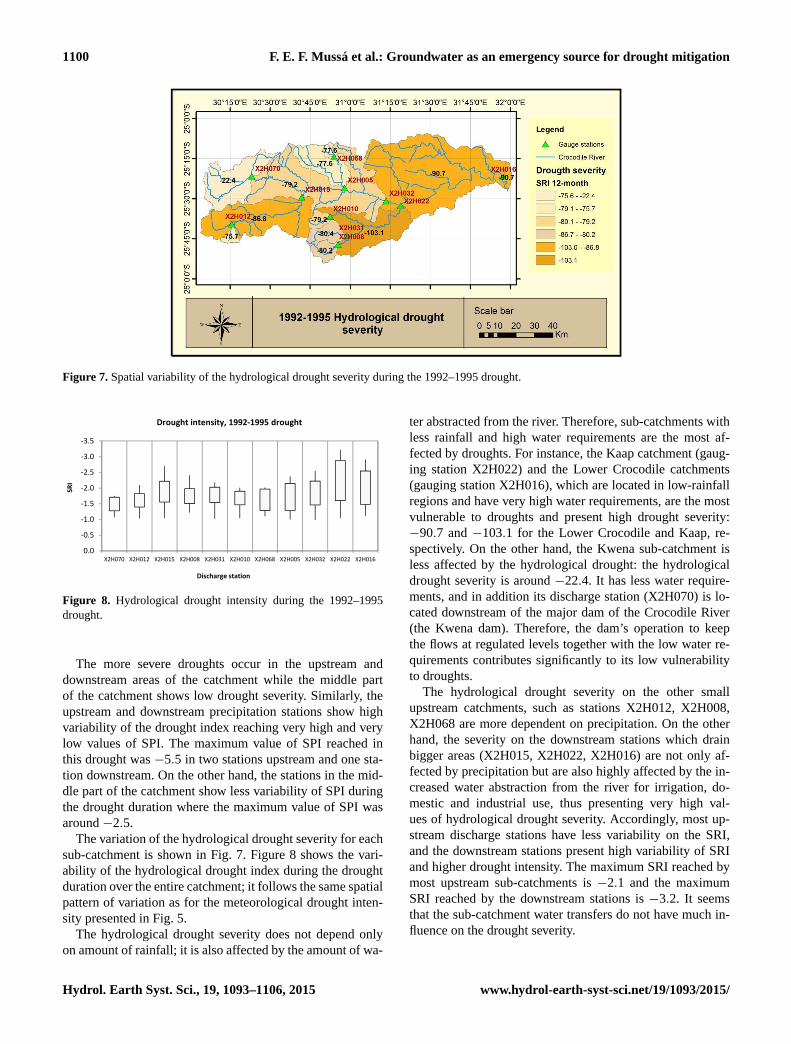
Figure 7. Spatial variability of the hydrological drought severity during the 1992–1995 drought.
-3.5
-3.0
-2.5
-2.0
-1.5
-1.0
-0.5
0.0
X2H070 X2H012 X2H015 X2H008 X2H031 X2H010 X2H068 X2H005 X2H032 X2H022 X2H016
SR
I
Discharge station
Drought intensity, 1992-1995 drought
Figure 8. Hydrological drought intensity during the 1992–1995
drought.
The more severe droughts occur in the upstream and
downstream areas of the catchment while the middle part
of the catchment shows low drought severity. Similarly, the
upstream and downstream precipitation stations show high
variability of the drought index reaching very high and very
low values of SPI. The maximum value of SPI reached in
this drought was −5.5 in two stations upstream and one sta-
tion downstream. On the other hand, the stations in the mid-
dle part of the catchment show less variability of SPI during
the drought duration where the maximum value of SPI was
around −2.5.
The variation of the hydrological drought severity for each
sub-catchment is shown in Fig. 7. Figure 8 shows the vari-
ability of the hydrological drought index during the drought
duration over the entire catchment; it follows the same spatial
pattern of variation as for the meteorological drought inten-
sity presented in Fig. 5.
The hydrological drought severity does not depend only
on amount of rainfall; it is also affected by the amount of wa-
ter abstracted from the river. Therefore, sub-catchments with
less rainfall and high water requirements are the most af-
fected by droughts. For instance, the Kaap catchment (gaug-
ing station X2H022) and the Lower Crocodile catchments
(gauging station X2H016), which are located in low-rainfall
regions and have very high water requirements, are the most
vulnerable to droughts and present high drought severity:
−90.7 and −103.1 for the Lower Crocodile and Kaap, re-
spectively. On the other hand, the Kwena sub-catchment is
less affected by the hydrological drought: the hydrological
drought severity is around −22.4. It has less water require-
ments, and in addition its discharge station (X2H070) is lo-
cated downstream of the major dam of the Crocodile River
(the Kwena dam). Therefore, the dam’s operation to keep
the flows at regulated levels together with the low water re-
quirements contributes significantly to its low vulnerability
to droughts.
The hydrological drought severity on the other small
upstream catchments, such as stations X2H012, X2H008,
X2H068 are more dependent on precipitation. On the other
hand, the severity on the downstream stations which drain
bigger areas (X2H015, X2H022, X2H016) are not only af-
fected by precipitation but are also highly affected by the in-
creased water abstraction from the river for irrigation, do-
mestic and industrial use, thus presenting very high val-
ues of hydrological drought severity. Accordingly, most up-
stream discharge stations have less variability on the SRI,
and the downstream stations present high variability of SRI
and higher drought intensity. The maximum SRI reached by
most upstream sub-catchments is −2.1 and the maximum
SRI reached by the downstream stations is −3.2. It seems
that the sub-catchment water transfers do not have much in-
fluence on the drought severity.
Hydrol. Earth Syst. Sci., 19, 1093–1106, 2015 www.hydrol-earth-syst-sci.net/19/1093/2015/
F. E. F. Mussá et al.: Groundwater as an emergency source for drought mitigation 1101
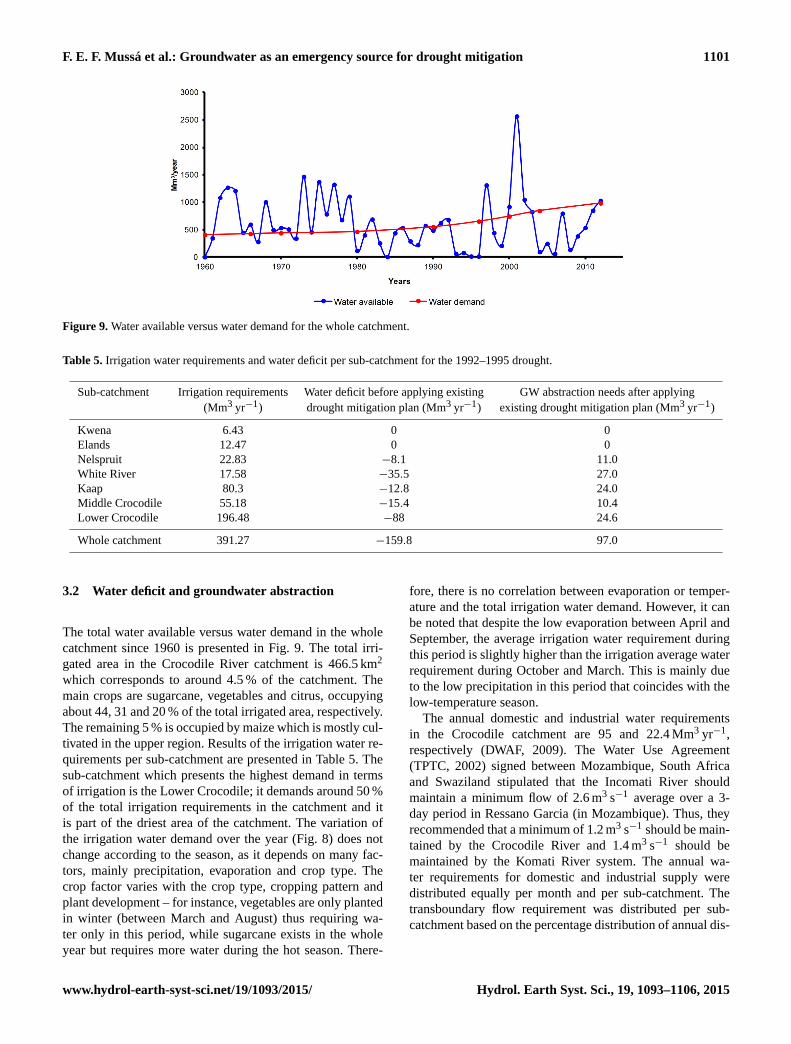
Figure 9. Water available versus water demand for the whole catchment.
Table 5. Irrigation water requirements and water deficit per sub-catchment for the 1992–1995 drought.
Sub-catchment Irrigation requirements Water deficit before applying existing GW abstraction needs after applying
(Mm3 yr−1) drought mitigation plan (Mm3 yr−1) existing drought mitigation plan (Mm3 yr−1)
Kwena 6.43 0 0
Elands 12.47 0 0
Nelspruit 22.83 −8.1 11.0
White River 17.58 −35.5 27.0
Kaap 80.3 −12.8 24.0
Middle Crocodile 55.18 −15.4 10.4
Lower Crocodile 196.48 −88 24.6
Whole catchment 391.27 −159.8 97.0
3.2 Water deficit and groundwater abstraction
The total water available versus water demand in the whole
catchment since 1960 is presented in Fig. 9. The total irri-
gated area in the Crocodile River catchment is 466.5 km2
which corresponds to around 4.5 % of the catchment. The
main crops are sugarcane, vegetables and citrus, occupying
about 44, 31 and 20 % of the total irrigated area, respectively.
The remaining 5 % is occupied by maize which is mostly cul-
tivated in the upper region. Results of the irrigation water re-
quirements per sub-catchment are presented in Table 5. The
sub-catchment which presents the highest demand in terms
of irrigation is the Lower Crocodile; it demands around 50 %
of the total irrigation requirements in the catchment and it
is part of the driest area of the catchment. The variation of
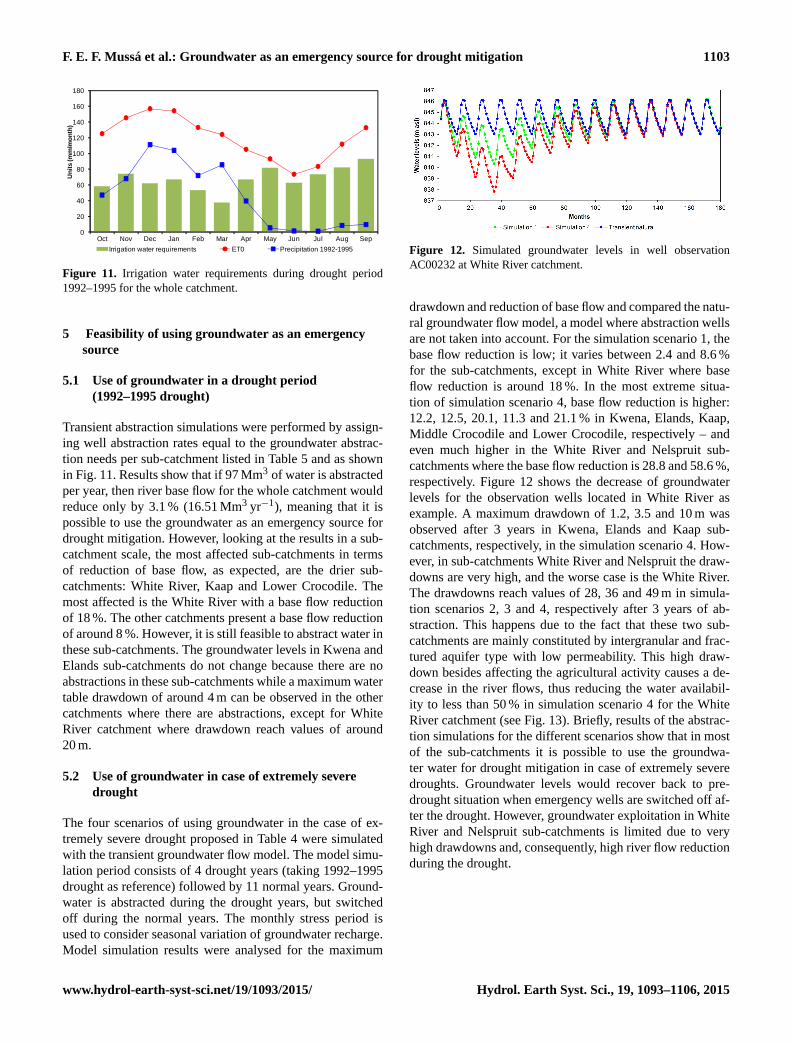
the irrigation water demand over the year (Fig. 8) does not
change according to the season, as it depends on many fac-
tors, mainly precipitation, evaporation and crop type. The
crop factor varies with the crop type, cropping pattern and
plant development – for instance, vegetables are only planted
in winter (between March and August) thus requiring wa-
ter only in this period, while sugarcane exists in the whole
year but requires more water during the hot season. There-
fore, there is no correlation between evaporation or temper-
ature and the total irrigation water demand. However, it can
be noted that despite the low evaporation between April and
September, the average irrigation water requirement during
this period is slightly higher than the irrigation average water
requirement during October and March. This is mainly due
to the low precipitation in this period that coincides with the
low-temperature season.
The annual domestic and industrial water requirements
in the Crocodile catchment are 95 and 22.4 Mm3 yr−1,
respectively (DWAF, 2009). The Water Use Agreement
(TPTC, 2002) signed between Mozambique, South Africa
and Swaziland stipulated that the Incomati River should
maintain a minimum flow of 2.6 m3 s−1 average over a 3-
day period in Ressano Garcia (in Mozambique). Thus, they
recommended that a minimum of 1.2 m3 s−1 should be main-
tained by the Crocodile River and 1.4 m3 s−1 should be
maintained by the Komati River system. The annual wa-
ter requirements for domestic and industrial supply were
distributed equally per month and per sub-catchment. The
transboundary flow requirement was distributed per sub-
catchment based on the percentage distribution of annual dis-
www.hydrol-earth-syst-sci.net/19/1093/2015/ Hydrol. Earth Syst. Sci., 19, 1093–1106, 2015
1102 F. E. F. Mussá et al.: Groundwater as an emergency source for drought mitigation
Table 6. Groundwater model calibration results.
Recharge Net recharge Simulated base Observed base %
(Mm3 yr−1) (Mm3 yr−1) flow (Mm3 yr−1) flow (Mm3 yr−1) Difference
Kwena 97.15 99.39 55.74 54.97 1.4 %
Elands 141.78 162.90 127.25 126.18 0.8 %
Nelspruit 103.73 102.45 45.09 45.19 −0.2 %
White River 21.98 24.48 10.01 9.91 1.0 %
Kaap 21.80 54.28 61.20 61.32 −0.2 %
Middle Crocodile 68.67 66.85 196.43 197.90 −0.7 %
Lower Crocodile 21.98 18.67 32.87 32.56 0.9 %
Whole catchment 477.07 529.01 528.59 528.04 0.1 %
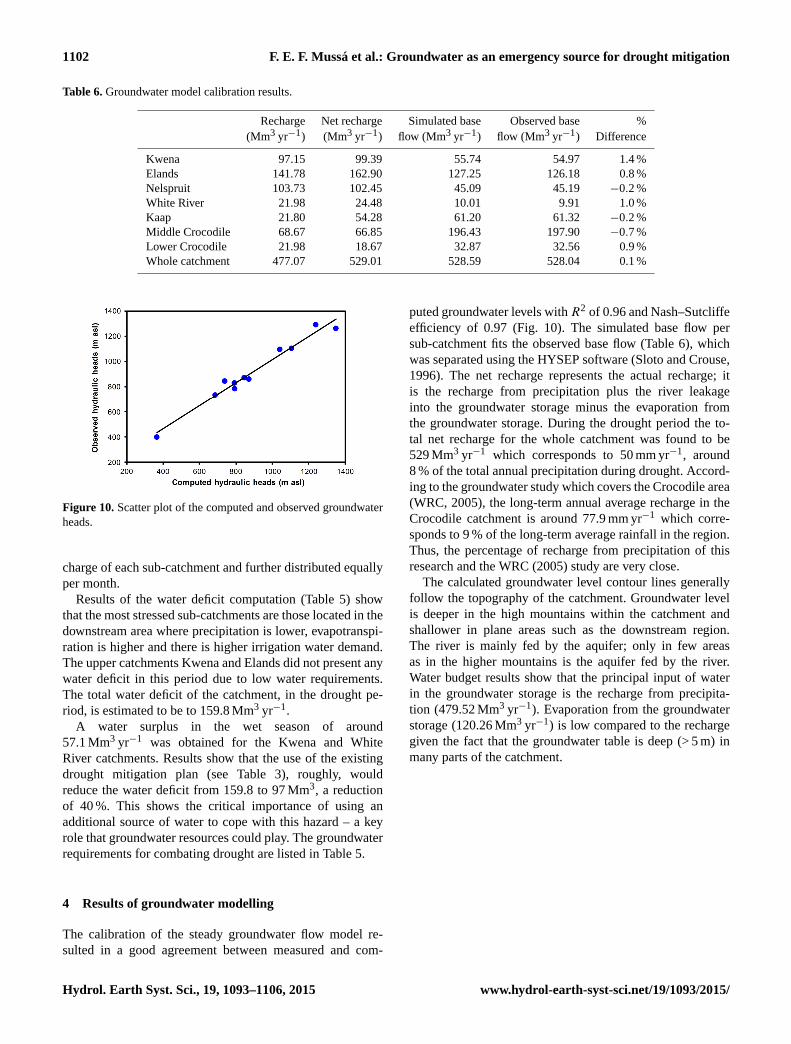
Figure 10. Scatter plot of the computed and observed groundwater
heads.
charge of each sub-catchment and further distributed equally
per month.
Results of the water deficit computation (Table 5) show
that the most stressed sub-catchments are those located in the
downstream area where precipitation is lower, evapotranspi-
ration is higher and there is higher irrigation water demand.
The upper catchments Kwena and Elands did not present any
water deficit in this period due to low water requirements.
The total water deficit of the catchment, in the drought pe-
riod, is estimated to be to 159.8 Mm3 yr−1.
A water surplus in the wet season of around
57.1 Mm3 yr−1 was obtained for the Kwena and White
River catchments. Results show that the use of the existing
drought mitigation plan (see Table 3), roughly, would
reduce the water deficit from 159.8 to 97 Mm3, a reduction
of 40 %. This shows the critical importance of using an
additional source of water to cope with this hazard – a key
role that groundwater resources could play. The groundwater
requirements for combating drought are listed in Table 5.
4 Results of groundwater modelling
The calibration of the steady groundwater flow model re-
sulted in a good agreement between measured and com-
puted groundwater levels with R2 of 0.96 and Nash–Sutcliffe
efficiency of 0.97 (Fig. 10). The simulated base flow per
sub-catchment fits the observed base flow (Table 6), which
was separated using the HYSEP software (Sloto and Crouse,
1996). The net recharge represents the actual recharge; it
is the recharge from precipitation plus the river leakage
into the groundwater storage minus the evaporation from
the groundwater storage. During the drought period the to-
tal net recharge for the whole catchment was found to be
529 Mm3 yr−1 which corresponds to 50 mm yr−1, around
8 % of the total annual precipitation during drought. Accord-
ing to the groundwater study which covers the Crocodile area
(WRC, 2005), the long-term annual average recharge in the
Crocodile catchment is around 77.9 mm yr−1 which corre-
sponds to 9 % of the long-term average rainfall in the region.
Thus, the percentage of recharge from precipitation of this
research and the WRC (2005) study are very close.
The calculated groundwater level contour lines generally
follow the topography of the catchment. Groundwater level
is deeper in the high mountains within the catchment and
shallower in plane areas such as the downstream region.
The river is mainly fed by the aquifer; only in few areas
as in the higher mountains is the aquifer fed by the river.
Water budget results show that the principal input of water
in the groundwater storage is the recharge from precipita-
tion (479.52 Mm3 yr−1). Evaporation from the groundwater
storage (120.26 Mm3 yr−1) is low compared to the recharge
given the fact that the groundwater table is deep (> 5 m) in
many parts of the catchment.
Hydrol. Earth Syst. Sci., 19, 1093–1106, 2015 www.hydrol-earth-syst-sci.net/19/1093/2015/
F. E. F. Mussá et al.: Groundwater as an emergency source for drought mitigation 1103
0
20
40
60
80
100
120
140
160
180
Oct Nov Dec Jan Feb Mar Apr May Jun Jul Aug Sep
Un
its
(mm
/mo
nth
)
Irrigation water requirements ET0 Precipitation 1992-1995
Figure 11. Irrigation water requirements during drought period
1992–1995 for the whole catchment.
5 Feasibility of using groundwater as an emergency
source
5.1 Use of groundwater in a drought period
(1992–1995 drought)
Transient abstraction simulations were performed by assign-
ing well abstraction rates equal to the groundwater abstrac-
tion needs per sub-catchment listed in Table 5 and as shown
in Fig. 11. Results show that if 97 Mm3 of water is abstracted
per year, then river base flow for the whole catchment would
reduce only by 3.1 % (16.51 Mm3 yr−1), meaning that it is
possible to use the groundwater as an emergency source for
drought mitigation. However, looking at the results in a sub-
catchment scale, the most affected sub-catchments in terms
of reduction of base flow, as expected, are the drier sub-
catchments: White River, Kaap and Lower Crocodile. The
most affected is the White River with a base flow reduction
of 18 %. The other catchments present a base flow reduction
of around 8 %. However, it is still feasible to abstract water in
these sub-catchments. The groundwater levels in Kwena and
Elands sub-catchments do not change because there are no
abstractions in these sub-catchments while a maximum water
table drawdown of around 4 m can be observed in the other
catchments where there are abstractions, except for White
River catchment where drawdown reach values of around
20 m.
5.2 Use of groundwater in case of extremely severe
drought
The four scenarios of using groundwater in the case of ex-
tremely severe drought proposed in Table 4 were simulated
with the transient groundwater flow model. The model simu-
lation period consists of 4 drought years (taking 1992–1995
drought as reference) followed by 11 normal years. Ground-
water is abstracted during the drought years, but switched
off during the normal years. The monthly stress period is
used to consider seasonal variation of groundwater recharge.
Model simulation results were analysed for the maximum
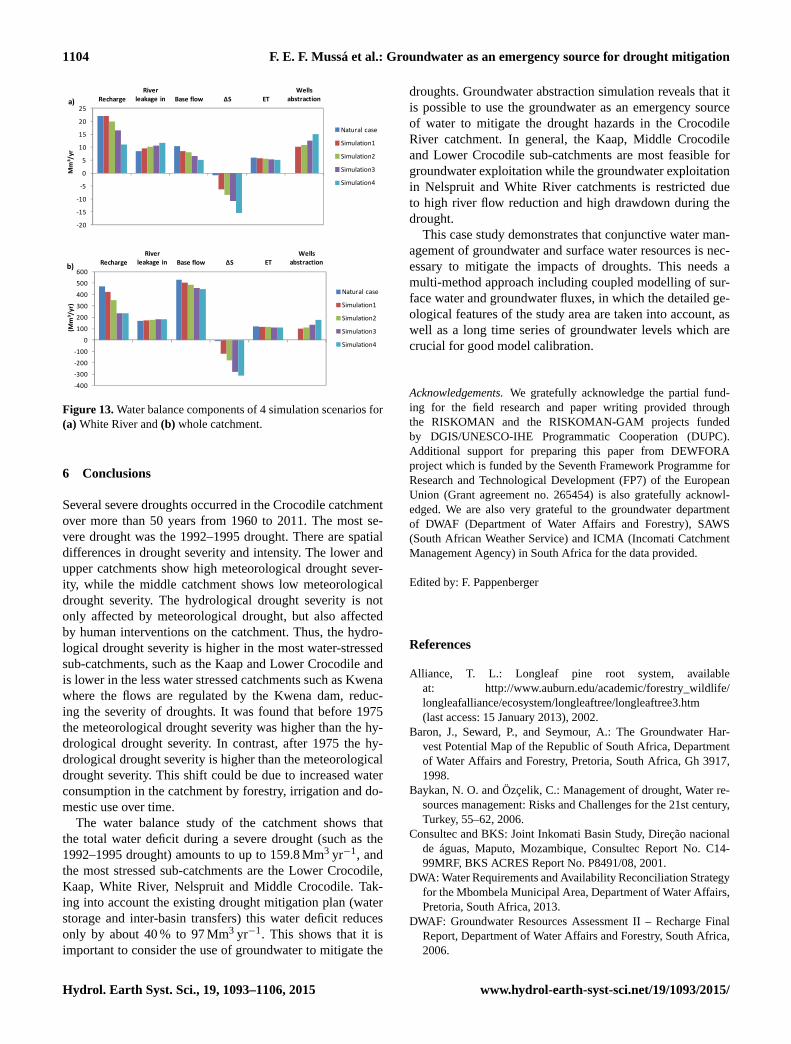
Figure 12. Simulated groundwater levels in well observation
AC00232 at White River catchment.
drawdown and reduction of base flow and compared the natu-
ral groundwater flow model, a model where abstraction wells
are not taken into account. For the simulation scenario 1, the
base flow reduction is low; it varies between 2.4 and 8.6 %
for the sub-catchments, except in White River where base
flow reduction is around 18 %. In the most extreme situa-
tion of simulation scenario 4, base flow reduction is higher:
12.2, 12.5, 20.1, 11.3 and 21.1 % in Kwena, Elands, Kaap,
Middle Crocodile and Lower Crocodile, respectively – and
even much higher in the White River and Nelspruit sub-
catchments where the base flow reduction is 28.8 and 58.6 %,
respectively. Figure 12 shows the decrease of groundwater
levels for the observation wells located in White River as
example. A maximum drawdown of 1.2, 3.5 and 10 m was
observed after 3 years in Kwena, Elands and Kaap sub-
catchments, respectively, in the simulation scenario 4. How-
ever, in sub-catchments White River and Nelspruit the draw-
downs are very high, and the worse case is the White River.
The drawdowns reach values of 28, 36 and 49 m in simula-
tion scenarios 2, 3 and 4, respectively after 3 years of ab-
straction. This happens due to the fact that these two sub-
catchments are mainly constituted by intergranular and frac-
tured aquifer type with low permeability. This high draw-
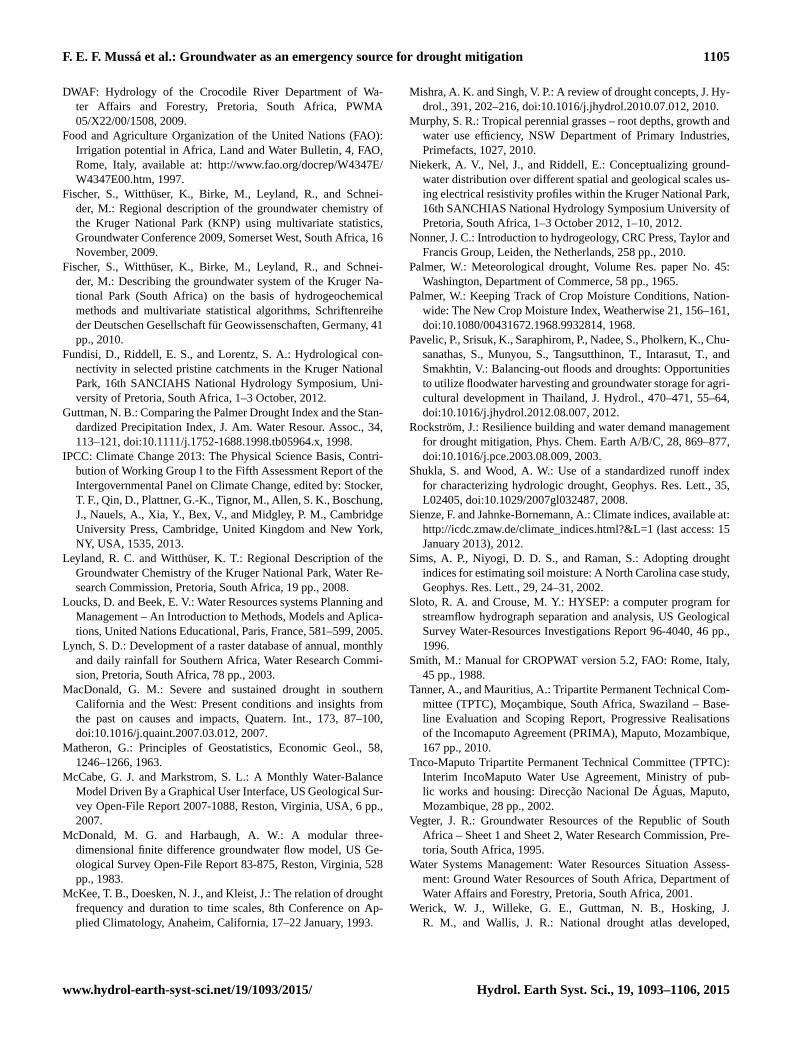
down besides affecting the agricultural activity causes a de-
crease in the river flows, thus reducing the water availabil-
ity to less than 50 % in simulation scenario 4 for the White
River catchment (see Fig. 13). Briefly, results of the abstrac-
tion simulations for the different scenarios show that in most
of the sub-catchments it is possible to use the groundwa-
ter water for drought mitigation in case of extremely severe
droughts. Groundwater levels would recover back to pre-
drought situation when emergency wells are switched off af-
ter the drought. However, groundwater exploitation in White
River and Nelspruit sub-catchments is limited due to very
high drawdowns and, consequently, high river flow reduction
during the drought.
www.hydrol-earth-syst-sci.net/19/1093/2015/ Hydrol. Earth Syst. Sci., 19, 1093–1106, 2015
1104 F. E. F. Mussá et al.: Groundwater as an emergency source for drought mitigation
-400
-300
-200
-100
0
100
200
300
400
500
600
Recharge
River
leakage in Base flow ΔS ET
Wells
abstraction
(Mm
³/y
r)
b)
Natural case
Simulation1
Simulation2
Simulation3
Simulation4
-20
-15
-10
-5
0
5
10
15
20
25
Recharge
River
leakage in Base flow ΔS ET
Wells
abstraction
Mm
³/y
r
a)
Natural case
Simulation1
Simulation2
Simulation3
Simulation4
Figure 13. Water balance components of 4 simulation scenarios for
(a) White River and (b) whole catchment.
6 Conclusions
Several severe droughts occurred in the Crocodile catchment
over more than 50 years from 1960 to 2011. The most se-
vere drought was the 1992–1995 drought. There are spatial
differences in drought severity and intensity. The lower and
upper catchments show high meteorological drought sever-
ity, while the middle catchment shows low meteorological
drought severity. The hydrological drought severity is not
only affected by meteorological drought, but also affected
by human interventions on the catchment. Thus, the hydro-
logical drought severity is higher in the most water-stressed
sub-catchments, such as the Kaap and Lower Crocodile and
is lower in the less water stressed catchments such as Kwena
where the flows are regulated by the Kwena dam, reduc-
ing the severity of droughts. It was found that before 1975
the meteorological drought severity was higher than the hy-
drological drought severity. In contrast, after 1975 the hy-
drological drought severity is higher than the meteorological
drought severity. This shift could be due to increased water
consumption in the catchment by forestry, irrigation and do-
mestic use over time.
The water balance study of the catchment shows that
the total water deficit during a severe drought (such as the
1992–1995 drought) amounts to up to 159.8 Mm3 yr−1, and
the most stressed sub-catchments are the Lower Crocodile,
Kaap, White River, Nelspruit and Middle Crocodile. Tak-
ing into account the existing drought mitigation plan (water
storage and inter-basin transfers) this water deficit reduces
only by about 40 % to 97 Mm3 yr−1. This shows that it is
important to consider the use of groundwater to mitigate the
droughts. Groundwater abstraction simulation reveals that it
is possible to use the groundwater as an emergency source
of water to mitigate the drought hazards in the Crocodile
River catchment. In general, the Kaap, Middle Crocodile
and Lower Crocodile sub-catchments are most feasible for
groundwater exploitation while the groundwater exploitation
in Nelspruit and White River catchments is restricted due
to high river flow reduction and high drawdown during the
drought.
This case study demonstrates that conjunctive water man-
agement of groundwater and surface water resources is nec-
essary to mitigate the impacts of droughts. This needs a
multi-method approach including coupled modelling of sur-
face water and groundwater fluxes, in which the detailed ge-
ological features of the study area are taken into account, as
well as a long time series of groundwater levels which are
crucial for good model calibration.
Acknowledgements. We gratefully acknowledge the partial fund-
ing for the field research and paper writing provided through
the RISKOMAN and the RISKOMAN-GAM projects funded
by DGIS/UNESCO-IHE Programmatic Cooperation (DUPC).
Additional support for preparing this paper from DEWFORA
project which is funded by the Seventh Framework Programme for
Research and Technological Development (FP7) of the European
Union (Grant agreement no. 265454) is also gratefully acknowl-
edged. We are also very grateful to the groundwater department
of DWAF (Department of Water Affairs and Forestry), SAWS
(South African Weather Service) and ICMA (Incomati Catchment
Management Agency) in South Africa for the data provided.
Edited by: F. Pappenberger
References
Alliance, T. L.: Longleaf pine root system, available
at: http://www.auburn.edu/academic/forestry_wildlife/
longleafalliance/ecosystem/longleaftree/longleaftree3.htm
(last access: 15 January 2013), 2002.
Baron, J., Seward, P., and Seymour, A.: The Groundwater Har-
vest Potential Map of the Republic of South Africa, Department
of Water Affairs and Forestry, Pretoria, South Africa, Gh 3917,
1998.
Baykan, N. O. and Özçelik, C.: Management of drought, Water re-
sources management: Risks and Challenges for the 21st century,
Turkey, 55–62, 2006.
Consultec and BKS: Joint Inkomati Basin Study, Direção nacional
de águas, Maputo, Mozambique, Consultec Report No. C14-
99MRF, BKS ACRES Report No. P8491/08, 2001.
DWA: Water Requirements and Availability Reconciliation Strategy
for the Mbombela Municipal Area, Department of Water Affairs,
Pretoria, South Africa, 2013.
DWAF: Groundwater Resources Assessment II – Recharge Final
Report, Department of Water Affairs and Forestry, South Africa,
2006.
Hydrol. Earth Syst. Sci., 19, 1093–1106, 2015 www.hydrol-earth-syst-sci.net/19/1093/2015/
F. E. F. Mussá et al.: Groundwater as an emergency source for drought mitigation 1105
DWAF: Hydrology of the Crocodile River Department of Wa-
ter Affairs and Forestry, Pretoria, South Africa, PWMA
05/X22/00/1508, 2009.
Food and Agriculture Organization of the United Nations (FAO):
Irrigation potential in Africa, Land and Water Bulletin, 4, FAO,
Rome, Italy, available at: http://www.fao.org/docrep/W4347E/
W4347E00.htm, 1997.
Fischer, S., Witthüser, K., Birke, M., Leyland, R., and Schnei-
der, M.: Regional description of the groundwater chemistry of
the Kruger National Park (KNP) using multivariate statistics,
Groundwater Conference 2009, Somerset West, South Africa, 16
November, 2009.
Fischer, S., Witthüser, K., Birke, M., Leyland, R., and Schnei-
der, M.: Describing the groundwater system of the Kruger Na-
tional Park (South Africa) on the basis of hydrogeochemical
methods and multivariate statistical algorithms, Schriftenreihe
der Deutschen Gesellschaft für Geowissenschaften, Germany, 41
pp., 2010.
Fundisi, D., Riddell, E. S., and Lorentz, S. A.: Hydrological con-
nectivity in selected pristine catchments in the Kruger National
Park, 16th SANCIAHS National Hydrology Symposium, Uni-
versity of Pretoria, South Africa, 1–3 October, 2012.
Guttman, N. B.: Comparing the Palmer Drought Index and the Stan-
dardized Precipitation Index, J. Am. Water Resour. Assoc., 34,
113–121, doi:10.1111/j.1752-1688.1998.tb05964.x, 1998.
IPCC: Climate Change 2013: The Physical Science Basis, Contri-
bution of Working Group I to the Fifth Assessment Report of the
Intergovernmental Panel on Climate Change, edited by: Stocker,
T. F., Qin, D., Plattner, G.-K., Tignor, M., Allen, S. K., Boschung,
J., Nauels, A., Xia, Y., Bex, V., and Midgley, P. M., Cambridge
University Press, Cambridge, United Kingdom and New York,
NY, USA, 1535, 2013.
Leyland, R. C. and Witthüser, K. T.: Regional Description of the
Groundwater Chemistry of the Kruger National Park, Water Re-
search Commission, Pretoria, South Africa, 19 pp., 2008.
Loucks, D. and Beek, E. V.: Water Resources systems Planning and
Management – An Introduction to Methods, Models and Aplica-
tions, United Nations Educational, Paris, France, 581–599, 2005.
Lynch, S. D.: Development of a raster database of annual, monthly
and daily rainfall for Southern Africa, Water Research Commi-
sion, Pretoria, South Africa, 78 pp., 2003.
MacDonald, G. M.: Severe and sustained drought in southern
California and the West: Present conditions and insights from
the past on causes and impacts, Quatern. Int., 173, 87–100,
doi:10.1016/j.quaint.2007.03.012, 2007.
Matheron, G.: Principles of Geostatistics, Economic Geol., 58,
1246–1266, 1963.
McCabe, G. J. and Markstrom, S. L.: A Monthly Water-Balance
Model Driven By a Graphical User Interface, US Geological Sur-
vey Open-File Report 2007-1088, Reston, Virginia, USA, 6 pp.,
2007.
McDonald, M. G. and Harbaugh, A. W.: A modular three-
dimensional finite difference groundwater flow model, US Ge-
ological Survey Open-File Report 83-875, Reston, Virginia, 528
pp., 1983.
McKee, T. B., Doesken, N. J., and Kleist, J.: The relation of drought
frequency and duration to time scales, 8th Conference on Ap-
plied Climatology, Anaheim, California, 17–22 January, 1993.
Mishra, A. K. and Singh, V. P.: A review of drought concepts, J. Hy-
drol., 391, 202–216, doi:10.1016/j.jhydrol.2010.07.012, 2010.
Murphy, S. R.: Tropical perennial grasses – root depths, growth and
water use efficiency, NSW Department of Primary Industries,
Primefacts, 1027, 2010.
Niekerk, A. V., Nel, J., and Riddell, E.: Conceptualizing ground-
water distribution over different spatial and geological scales us-
ing electrical resistivity profiles within the Kruger National Park,
16th SANCHIAS National Hydrology Symposium University of
Pretoria, South Africa, 1–3 October 2012, 1–10, 2012.
Nonner, J. C.: Introduction to hydrogeology, CRC Press, Taylor and
Francis Group, Leiden, the Netherlands, 258 pp., 2010.
Palmer, W.: Meteorological drought, Volume Res. paper No. 45:
Washington, Department of Commerce, 58 pp., 1965.
Palmer, W.: Keeping Track of Crop Moisture Conditions, Nation-
wide: The New Crop Moisture Index, Weatherwise 21, 156–161,
doi:10.1080/00431672.1968.9932814, 1968.
Pavelic, P., Srisuk, K., Saraphirom, P., Nadee, S., Pholkern, K., Chu-
sanathas, S., Munyou, S., Tangsutthinon, T., Intarasut, T., and
Smakhtin, V.: Balancing-out floods and droughts: Opportunities
to utilize floodwater harvesting and groundwater storage for agri-
cultural development in Thailand, J. Hydrol., 470–471, 55–64,
doi:10.1016/j.jhydrol.2012.08.007, 2012.
Rockström, J.: Resilience building and water demand management
for drought mitigation, Phys. Chem. Earth A/B/C, 28, 869–877,
doi:10.1016/j.pce.2003.08.009, 2003.
Shukla, S. and Wood, A. W.: Use of a standardized runoff index
for characterizing hydrologic drought, Geophys. Res. Lett., 35,
L02405, doi:10.1029/2007gl032487, 2008.
Sienze, F. and Jahnke-Bornemann, A.: Climate indices, available at:
http://icdc.zmaw.de/climate_indices.html?&L=1 (last access: 15
January 2013), 2012.
Sims, A. P., Niyogi, D. D. S., and Raman, S.: Adopting drought
indices for estimating soil moisture: A North Carolina case study,
Geophys. Res. Lett., 29, 24–31, 2002.
Sloto, R. A. and Crouse, M. Y.: HYSEP: a computer program for
streamflow hydrograph separation and analysis, US Geological
Survey Water-Resources Investigations Report 96-4040, 46 pp.,
1996.
Smith, M.: Manual for CROPWAT version 5.2, FAO: Rome, Italy,
45 pp., 1988.
Tanner, A., and Mauritius, A.: Tripartite Permanent Technical Com-
mittee (TPTC), Moçambique, South Africa, Swaziland – Base-
line Evaluation and Scoping Report, Progressive Realisations
of the Incomaputo Agreement (PRIMA), Maputo, Mozambique,
167 pp., 2010.
Tnco-Maputo Tripartite Permanent Technical Committee (TPTC):
Interim IncoMaputo Water Use Agreement, Ministry of pub-
lic works and housing: Direcção Nacional De Águas, Maputo,
Mozambique, 28 pp., 2002.
Vegter, J. R.: Groundwater Resources of the Republic of South
Africa – Sheet 1 and Sheet 2, Water Research Commission, Pre-
toria, South Africa, 1995.
Water Systems Management: Water Resources Situation Assess-
ment: Ground Water Resources of South Africa, Department of
Water Affairs and Forestry, Pretoria, South Africa, 2001.
Werick, W. J., Willeke, G. E., Guttman, N. B., Hosking, J.
R. M., and Wallis, J. R.: National drought atlas developed,
www.hydrol-earth-syst-sci.net/19/1093/2015/ Hydrol. Earth Syst. Sci., 19, 1093–1106, 2015
1106 F. E. F. Mussá et al.: Groundwater as an emergency source for drought mitigation
Eos, Transactions American Geophysical Union, 75, 89–90,
doi:10.1029/94eo00706, 1994.
Willeke, G.: The National Drought Atlas, US Army Corps of Engi-
neers, Water Resources Support Center, Institute for Water Re-
sources, Report 94-NDS-4, 1994.
WRC: Water Resources of South Africa, Water Research Comis-
sion, Pietermaritzburg, South Africa, K5/1491, 2005.
Zaag, P. V. D. and Vaz, Á. C.: Sharing the Incomati waters: cooper-
ation and competition in the balance, IWA Publishing, London,
UK, 5, 349–368, 2003.
Zargar, A., Sadiq, R., Naser, B., and Khan, F. I.: A review of drought
indices, Environmental Reviews, 333–349, doi:10.1139/a11-013,
2011.
Zhou, Y., Wang, L., Liu, J., and Ye, C.: Impacts of drought on
groundwater depletion in the Beijing Plain, China, in: Climate
Change Effects on Groundwater Resources: A Global Synthe-
sis of Findings and Recommendations, edited by: Treidel, H.,
Martin-Bordes, J. L., and Gurdak, J. J., CRC Press, London, UK,
281–303, 2011.
Hydrol. Earth Syst. Sci., 19, 1093–1106, 2015 www.hydrol-earth-syst-sci.net/19/1093/2015/