Embed Size (px)
Citation preview
Groundwater Drought Assessment for Barind Irrigation Project in Northwestern Bangladesh
S.K. Adhikary a, S.K. Das a, G.C. Saha b and T. Chaki c
a College of Engineering and Science, Victoria University, Melbourne 14428, Victoria 8001, Australia b Department of Civil Engineering, Khulna University of Engineering & Technology, Khulna, Bangladesh
c Water Resources Planning Division, Institute of Water Modelling (IWM), Dhaka 1206, Bangladesh Email: [email protected]
Abstract: Natural droughts are recurring phenomena that usually affect nearly all components of the hydrological cycle. Groundwater (GW) drought is a particular type of hydrological drought. It is generally caused when the GW heads in an aquifer fall below a critical or threshold level over a certain period of time due to natural and/or human induced causes and interventions. In the recent past, there was increased frequency of droughts in Bangladesh. Particularly, the northwestern region of the country was severely affected by the occurrence of droughts and high variability in rainfall. The country’s largest groundwater-fed irrigation project, Barind irrigation project is located in this region, wherein about 75% of irrigation water comes from the GW source. The national water policy of Bangladesh has also suggested the GW development for irrigation in both the public and private sectors. Therefore, it is essential to investigate the occurrence and distribution of GW drought severity for the effective GW resource management of the Barind Irrigation Project in the northwestern Bangladesh.
Barind Irrigation Project is located within the Barind Tract area, which covers most parts of seven northwestern districts, namely Bogra, Dinajpur, Joypurhat, Naogaon, Pabna, Rajshahi, and Rangpur under Rajshahi division in Bangladesh. Barind Multi-purpose Development Authority (BMDA) reported that 6000 deep tube wells and 66000 shallow tube wells were installed by the year of 2000 for irrigation development. The GW dependent irrigation system in the area has reached a critical phase as the GW level has dropped below the depth of the shallow tube wells in many places. The recently published GW zoning map indicates that a record of 60% irrigated croplands in Naogaon district have become critical for shallow tube well operation. The overexploitation has caused the GW level falls to the extent of not getting fully replenished by the rainfall recharge. If this over-utilization of the Barind aquifer continues, it may result in its exhaustion after few years that will have certain impact on the agriculture-based economy of the country. Hence, the main objective of this study is to assess GW drought at a specific part (Naogaon district) of Barind Irrigation Project in the northwestern Bangladesh, where GW scarcity is increasing day by day.
Available GW level and climate (rainfall and temperature) data are collected from the relevant organizations in Bangladesh. The cumulative deficit (CD) approach from threshold GW level is applied to evaluate the drought severity. Different threshold levels (70%, 80%, and 90%) of the mean GW level for the whole area are computed to visualize the drought severity in the GW system. The estimated CD values at different monitoring wells are interpolated in the ArcGIS platform to produce the spatial GW drought maps, each of which represents the drought severity for each specific threshold value.
Meteorological drought has been computed by the Standardized Precipitation Index (SPI) method and wet events are identified from time series data of precipitation. The SPI is used to identify any likely relationship of GW drought and wet events with the GW level. Similarly, temperature records are used to explore any possible connection between GW and climate in the study area.
Spatial maps of GW drought for different threshold levels indicate that GW drought is a frequent event in most part of the study area and the northern part is free from drought events. The GW hydrographs for most of the monitoring wells exhibit significant declination of GW table in the study period because of the extensive GW withdrawal from the underground aquifer, which is the main reason for the GW drought occurrence. The study finds that GW drought is correlated to the meteorological drought event, which indicates that the deficiency in rainfall may exacerbate the GW drought conditions. The study finally recommends that development and conjunctive use of GW and surface water resources should be undertaken and practiced to satisfy the increased irrigation water demand in the Barind Irrigation Project as well as to reduce the growing pressure on the GW reserves in northwestern Bangladesh.
Keywords: Barind Irrigation Project, Cumulative Deficit Approach, Groundwater Drought, Meteorological Drought, Standardized Precipitation Index
20th International Congress on Modelling and Simulation, Adelaide, Australia, 1–6 December 2013 www.mssanz.org.au/modsim2013
2917
Adhikary et al., Groundwater drought assessment for Barind irrigation project in northwestern Bangladesh
1. INTRODUCTION
Natural droughts are recurring phenomena generally affecting nearly all components of the water cycle that can be classified into meteorological, agricultural and hydrological droughts. Hydrological droughts, which include both streamflow and groundwater (GW) droughts, usually occur due to the deficiencies in surface and sub-surface water supplies. The GW drought is a very specific type of hydrological drought that occurs when groundwater recharge, heads or discharge deviate from normal (Tallaksen and van Lanen, 2004). Calow et al. (1999) referred GW drought as a circumstance of failing GW sources as a direct consequence of drought. It is now well-recognized that GW drought occurs when the GW heads in an aquifer fall below a critical or threshold level over a certain period of time resulting in several adverse effects. Like other drought types, GW droughts are caused by the low precipitation in combination with high evapotranspiration, as their combined effect causes low GW recharge of underground aquifer. Another cause of GW drought is GW abstraction and thus its overexploitation creates GW droughts (van Lanen and Peters, 2000). Identification of GW drought is possible by using three variables namely recharge, GW levels, and GW discharge from aquifer to surface water (SW) system (van Lanen and Peters, 2000). However, it is often not possible to measure GW recharge and discharge directly, and for this reason these parameters are commonly estimated by indirect method or through simulation process.
Every year, Bangladesh experiences a dry period for 6 months, from November to April, when rainfall is normally low. Bangladesh has already experienced an increased frequency of drought in recent years. It is a recurrent phenomenon in some parts of the country, but the northwestern region is severely drought prone because of the high variability in rainfall (Shahid and Behrawan, 2008). All the rivers and cannels of this area dry up during the dry season, and make the people completely dependent on GW, especially for irrigation. About 75% water for irrigation in the region comes from GW (Bari and Anwar, 2000). The national water policy of Bangladesh (WaRPO, 1999) has encouraged GW development for irrigation in both the public and private sectors. After the introduction of BMDP (Barind Multi-purpose Development Project) in 1986, 6,000 deep tube wells were installed in the area. In addition to that about 66,000 shallow tube wells were also installed in private sectors by the year of 2000 for the exploitation of GW for irrigation. The BMDP have taken necessary protective measures to ensure that the annual withdrawal is less than the annual recharge to keep the GW level in position. They estimated GW recharge in the area was at least one-third of the annual rainfall, and that was about 500 mm per annum (Asaduzzaman and Rushton, 2006). Islam and Kanungoe (2005) estimated the long-term annual average recharge of 152.7 mm using water balance study and aquifer simulation modeling. However, exploitation of GW continues on the basis of one-third rainfall recharge hypothesis of BMDP, which is beyond the sustainable yield according to Islam and Kanungoe (2005).
The overexploitation has caused the GW level to fall to the extent of not getting fully replenished through recharge. The GW-based irrigation system in the area has reached a critical phase as the phreatic water level has dropped below the depth of the shallow wells in many places. The recently published GW zoning map shows that a record high of 60% irrigated croplands in Naogaon district, and 10% in Rajshahi and Chapainawabganj districts have become critical for shallow tube-well operation (BADC, 2005). Prolonged absence of GW within the range of shallow tube wells, particularly during dry season, is a major problem in the area. The problem is becoming progressively more acute with the growth of population and extension of the irrigated agriculture. This necessitates undertaking a study related to the causes and distribution of GW drought severity to help local water resource management and agricultural organizations as well as the development/planning authorities to improve their understanding for sustainable GW resource management in the region. Therefore, the main objective of this study is to assess GW drought at a specific location (Naogaon District) of the Barind Irrigation Project under Rajshahi division in the northwestern Bangladesh, where GW scarcity is increasing day by day.
2. DESCRIPTION OF THE STUDY AREA
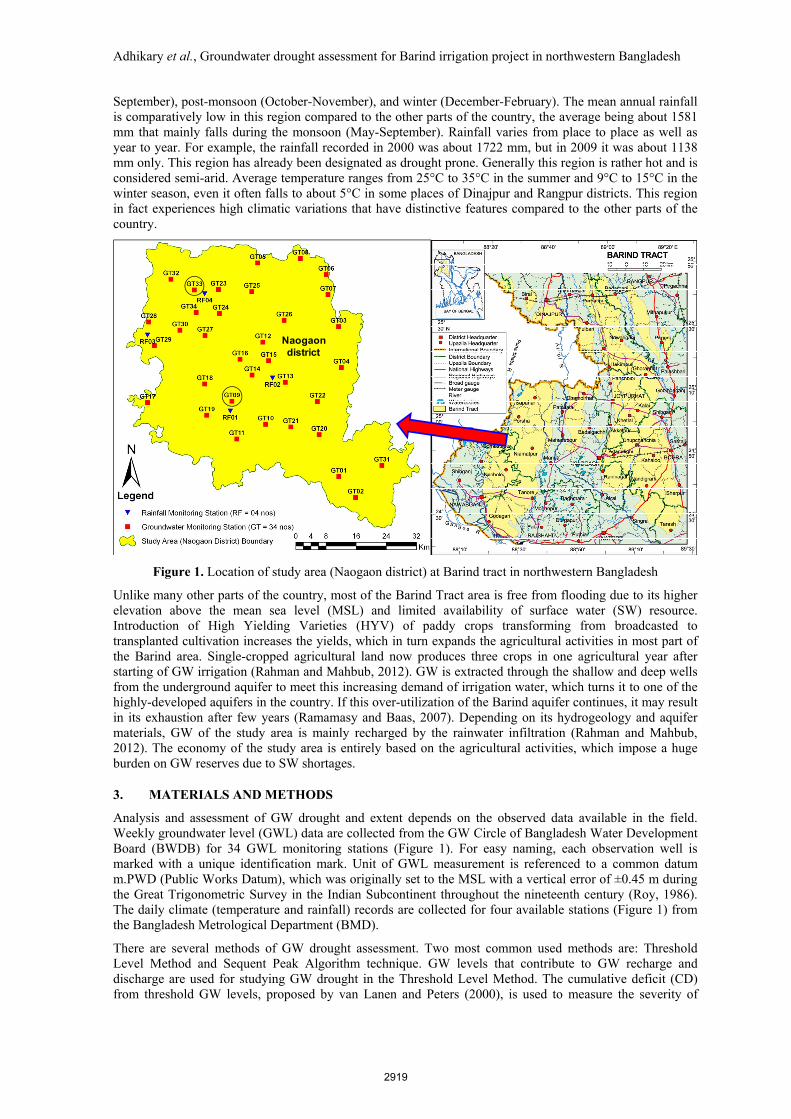
The Naogaon district under Rajshahi division in the northwestern Bangladesh has been taken as a case study area for this study. The intention of selecting such a small area was to express the study findings and relevant impact in a more detailed way at local scale so that local level policy can be undertaken. The location of the study area along with GW observation wells, climate (rainfall and temperature) data monitoring stations are shown in Figure 1. The study area is incorporated within the Barind Irrigation Project located under the Barind Tract. The total area of Barind Tract covers an area of about 7,770 sq. km. that includes most parts of Bogra, Dinajpur, Joypurhat, Naogaon, Pabna, Rajshahi, and Rangpur districts under Rajshahi division. The Barind Tract lies in the monsoon (May-September) region of the summer dominant hemisphere and the climate of the area is generally hot and humid. Based on rainfall, humidity, temperature and wind pressure, the weather condition is classified into four types, namely pre-monsoon (March-May), monsoon (June-
2918
Adhikary et al., Groundwater drought assessment for Barind irrigation project in northwestern Bangladesh
September), post-monsoon (October-November), and winter (December-February). The mean annual rainfall is comparatively low in this region compared to the other parts of the country, the average being about 1581 mm that mainly falls during the monsoon (May-September). Rainfall varies from place to place as well as year to year. For example, the rainfall recorded in 2000 was about 1722 mm, but in 2009 it was about 1138 mm only. This region has already been designated as drought prone. Generally this region is rather hot and is considered semi-arid. Average temperature ranges from 25°C to 35°C in the summer and 9°C to 15°C in the winter season, even it often falls to about 5°C in some places of Dinajpur and Rangpur districts. This region in fact experiences high climatic variations that have distinctive features compared to the other parts of the country.
Naogaondistrict
Figure 1. Location of study area (Naogaon district) at Barind tract in northwestern Bangladesh
Unlike many other parts of the country, most of the Barind Tract area is free from flooding due to its higher elevation above the mean sea level (MSL) and limited availability of surface water (SW) resource. Introduction of High Yielding Varieties (HYV) of paddy crops transforming from broadcasted to transplanted cultivation increases the yields, which in turn expands the agricultural activities in most part of the Barind area. Single-cropped agricultural land now produces three crops in one agricultural year after starting of GW irrigation (Rahman and Mahbub, 2012). GW is extracted through the shallow and deep wells from the underground aquifer to meet this increasing demand of irrigation water, which turns it to one of the highly-developed aquifers in the country. If this over-utilization of the Barind aquifer continues, it may result in its exhaustion after few years (Ramamasy and Baas, 2007). Depending on its hydrogeology and aquifer materials, GW of the study area is mainly recharged by the rainwater infiltration (Rahman and Mahbub, 2012). The economy of the study area is entirely based on the agricultural activities, which impose a huge burden on GW reserves due to SW shortages.
3. MATERIALS AND METHODS
Analysis and assessment of GW drought and extent depends on the observed data available in the field. Weekly groundwater level (GWL) data are collected from the GW Circle of Bangladesh Water Development Board (BWDB) for 34 GWL monitoring stations (Figure 1). For easy naming, each observation well is marked with a unique identification mark. Unit of GWL measurement is referenced to a common datum m.PWD (Public Works Datum), which was originally set to the MSL with a vertical error of ±0.45 m during the Great Trigonometric Survey in the Indian Subcontinent throughout the nineteenth century (Roy, 1986). The daily climate (temperature and rainfall) records are collected for four available stations (Figure 1) from the Bangladesh Metrological Department (BMD).
There are several methods of GW drought assessment. Two most common used methods are: Threshold Level Method and Sequent Peak Algorithm technique. GW levels that contribute to GW recharge and discharge are used for studying GW drought in the Threshold Level Method. The cumulative deficit (CD) from threshold GW levels, proposed by van Lanen and Peters (2000), is used to measure the severity of
2919
Adhikary et al., Groundwater drought assessment for Barind irrigation project in northwestern Bangladesh
droughts. Although the fixed threshold provides quite acceptable results, the cumulative deficit is preferred as the major droughts can be identified more clearly. The best results can be obtained for a fixed threshold level and the cumulative deficit (van Lanen and Peters, 2000, Shahid and Hazarika, 2009). The cumulative deficit is the summation of GW level departed below a threshold level over a period. GW drought events in a year are identified by calculating the cumulative deficit in meter below a threshold GW level and can be expressed by Equation (1).
( ) <Δ−
+= − Otherwise
iftCDCD xttx
tt 01
ϕϕϕϕ (1)
where CDt and CDt-1 are cumulative deficit at day t and t-1 (m/day), is GW level at day t (m), is threshold GW level (m), and Δt is the time step. GW drought in this study is assessed based on GWL data. The time step to be used in the analysis of GW drought in CD based Threshold Level Method should necessarily be large, usually more than a week or a month, due to the slow response of GWL to rainfall and other hydrologic parameters. Therefore, collected weekly data of GWL is converted to monthly data, which have been used for GW drought assessment. Different threshold levels (70%, 80%, and 90%) of the mean GWL of the whole study area are computed to visualize the GW drought severity at each GW observation well location. The estimated CD values at different wells are interpolated in ArcGIS platform to show the spatial extent of GW drought severity of specific threshold.
Standardized Precipitation Index (SPI) method proposed by McKee et al. (1993) is used to identify the meteorological drought and wet events from precipitation time series data. SPI can be calculated simply by taking the difference of the precipitation (Xi) from the mean (P) for a particular time step, and then dividing it by the standard deviation (S), which can be presented by Equation (2).
SD
PXSPI i −
= (2)
Monthly rainfall is used to identify meteorological drought event and develop any likely relationship with GW drought. Similarly, monthly temperature is used to investigate any possible relationship between GW and climate. SPI is also been used to correlate drought and wet events with minimum GWL of the whole study area.
4. RESULTS AND DISCUSSION
4.1. Analysis of Groundwater Hydrograph
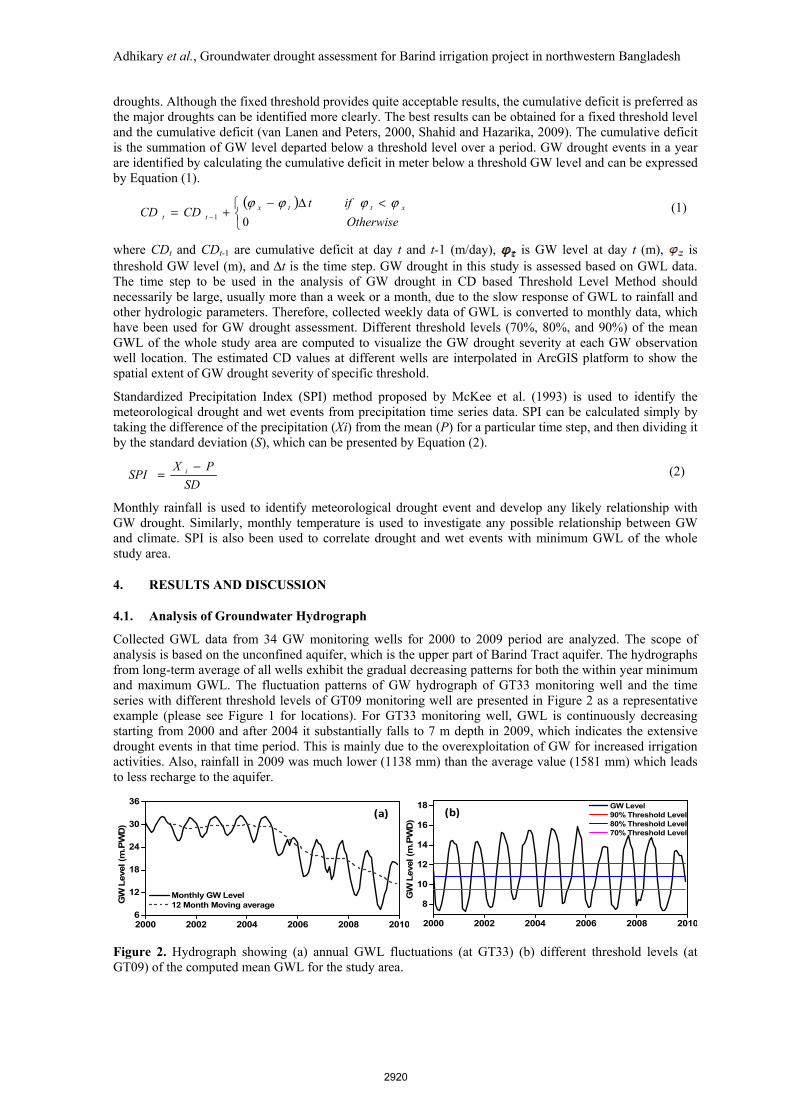
Collected GWL data from 34 GW monitoring wells for 2000 to 2009 period are analyzed. The scope of analysis is based on the unconfined aquifer, which is the upper part of Barind Tract aquifer. The hydrographs from long-term average of all wells exhibit the gradual decreasing patterns for both the within year minimum and maximum GWL. The fluctuation patterns of GW hydrograph of GT33 monitoring well and the time series with different threshold levels of GT09 monitoring well are presented in Figure 2 as a representative example (please see Figure 1 for locations). For GT33 monitoring well, GWL is continuously decreasing starting from 2000 and after 2004 it substantially falls to 7 m depth in 2009, which indicates the extensive drought events in that time period. This is mainly due to the overexploitation of GW for increased irrigation activities. Also, rainfall in 2009 was much lower (1138 mm) than the average value (1581 mm) which leads to less recharge to the aquifer.
2000 2002 2004 2006 2008 20106
12
18
24
30
36
GW
Lev
el (m
.PW
D)
Monthly GW Level 12 Month Moving average
2000 2002 2004 2006 2008 2010
8
10
12
14
16
18
GW
Leve
l (m
.PW
D)
GW Level 90% Threshold Level 80% Threshold Level 70% Threshold Level
(a) (b)
Figure 2. Hydrograph showing (a) annual GWL fluctuations (at GT33) (b) different threshold levels (at GT09) of the computed mean GWL for the study area.
2920
Adhikary et al., Groundwater drought assessment for Barind irrigation project in northwestern Bangladesh
4.2. Extent of Groundwater Drought
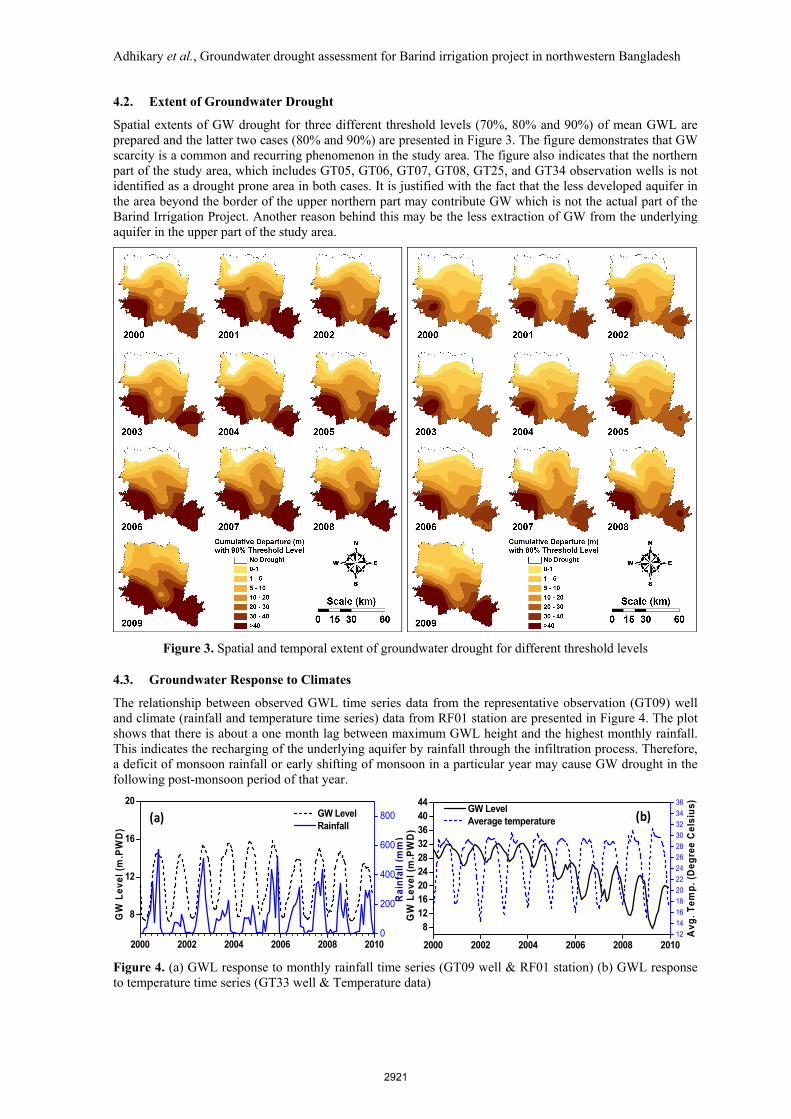
Spatial extents of GW drought for three different threshold levels (70%, 80% and 90%) of mean GWL are prepared and the latter two cases (80% and 90%) are presented in Figure 3. The figure demonstrates that GW scarcity is a common and recurring phenomenon in the study area. The figure also indicates that the northern part of the study area, which includes GT05, GT06, GT07, GT08, GT25, and GT34 observation wells is not identified as a drought prone area in both cases. It is justified with the fact that the less developed aquifer in the area beyond the border of the upper northern part may contribute GW which is not the actual part of the Barind Irrigation Project. Another reason behind this may be the less extraction of GW from the underlying aquifer in the upper part of the study area.
Figure 3. Spatial and temporal extent of groundwater drought for different threshold levels
4.3. Groundwater Response to Climates
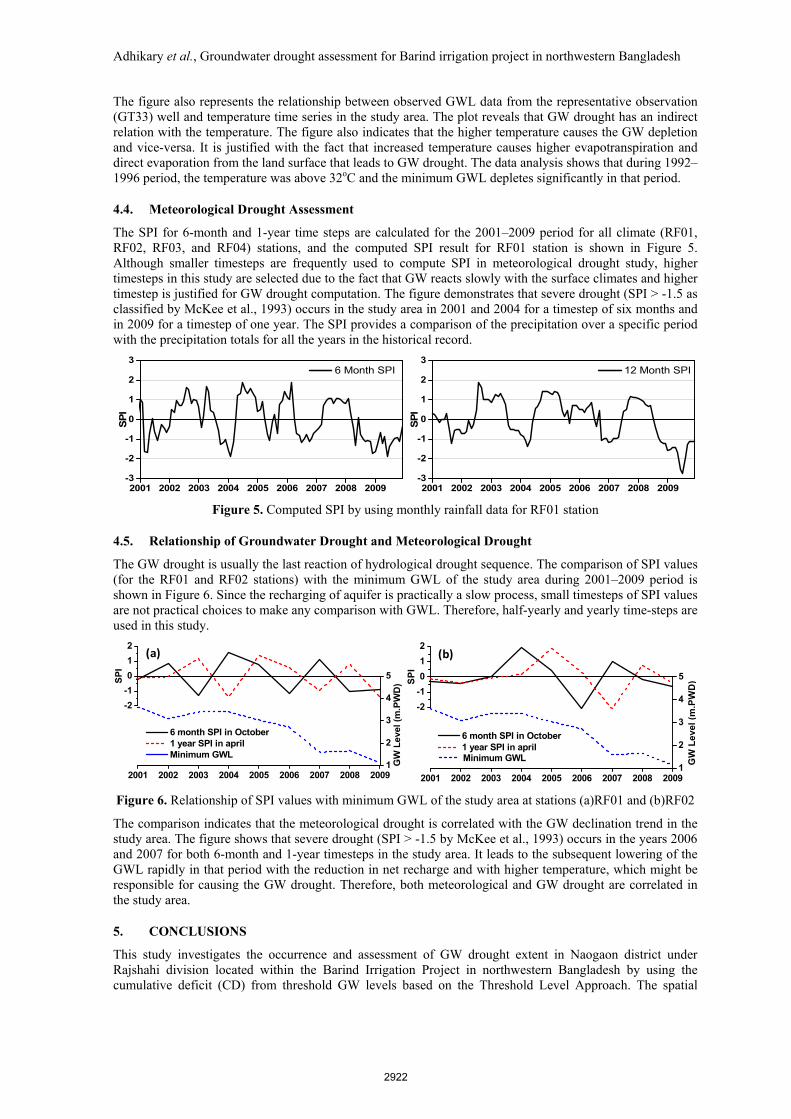
The relationship between observed GWL time series data from the representative observation (GT09) well and climate (rainfall and temperature time series) data from RF01 station are presented in Figure 4. The plot shows that there is about a one month lag between maximum GWL height and the highest monthly rainfall. This indicates the recharging of the underlying aquifer by rainfall through the infiltration process. Therefore, a deficit of monsoon rainfall or early shifting of monsoon in a particular year may cause GW drought in the following post-monsoon period of that year.
2000 2002 2004 2006 2008 2010
8
12
16
20 GW Level Rainfall
GW
Lev
el (
m.P
WD
)
0
200
400
600
800
Rai
nfa
ll (
mm
)
2000 2002 2004 2006 2008 2010
8121620242832364044
GW Level Average temperature
GW
Lev
el (
m.P
WD
)
12141618202224262830323436
Avg
. T
emp
. (D
eg
ree
Cel
siu
s)
(a) (b)
Figure 4. (a) GWL response to monthly rainfall time series (GT09 well & RF01 station) (b) GWL response to temperature time series (GT33 well & Temperature data)
2921
Adhikary et al., Groundwater drought assessment for Barind irrigation project in northwestern Bangladesh
The figure also represents the relationship between observed GWL data from the representative observation (GT33) well and temperature time series in the study area. The plot reveals that GW drought has an indirect relation with the temperature. The figure also indicates that the higher temperature causes the GW depletion and vice-versa. It is justified with the fact that increased temperature causes higher evapotranspiration and direct evaporation from the land surface that leads to GW drought. The data analysis shows that during 1992–1996 period, the temperature was above 32oC and the minimum GWL depletes significantly in that period.
4.4. Meteorological Drought Assessment
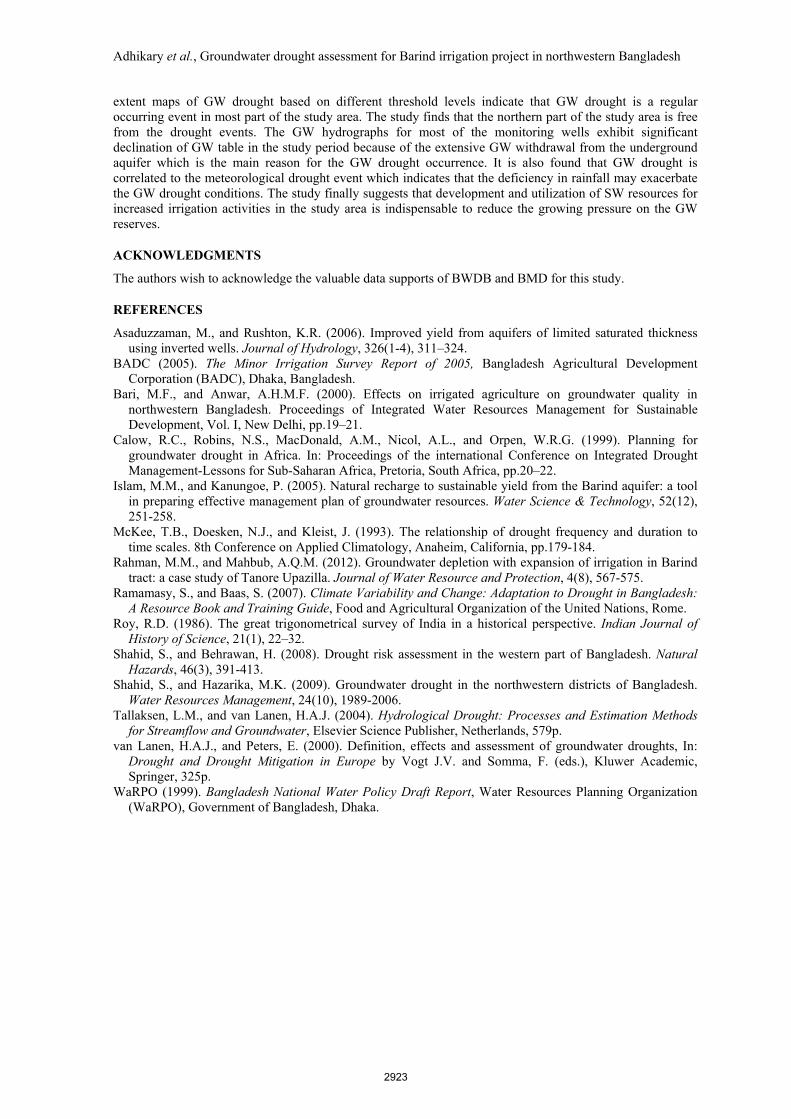
The SPI for 6-month and 1-year time steps are calculated for the 2001–2009 period for all climate (RF01, RF02, RF03, and RF04) stations, and the computed SPI result for RF01 station is shown in Figure 5. Although smaller timesteps are frequently used to compute SPI in meteorological drought study, higher timesteps in this study are selected due to the fact that GW reacts slowly with the surface climates and higher timestep is justified for GW drought computation. The figure demonstrates that severe drought (SPI > -1.5 as classified by McKee et al., 1993) occurs in the study area in 2001 and 2004 for a timestep of six months and in 2009 for a timestep of one year. The SPI provides a comparison of the precipitation over a specific period with the precipitation totals for all the years in the historical record.
2001 2002 2003 2004 2005 2006 2007 2008 2009-3
-2
-1
0
1
2
3
SP
I
6 Month SPI
2001 2002 2003 2004 2005 2006 2007 2008 2009-3
-2
-1
0
1
2
3
SP
I
12 Month SPI
Figure 5. Computed SPI by using monthly rainfall data for RF01 station
4.5. Relationship of Groundwater Drought and Meteorological Drought
The GW drought is usually the last reaction of hydrological drought sequence. The comparison of SPI values (for the RF01 and RF02 stations) with the minimum GWL of the study area during 2001–2009 period is shown in Figure 6. Since the recharging of aquifer is practically a slow process, small timesteps of SPI values are not practical choices to make any comparison with GWL. Therefore, half-yearly and yearly time-steps are used in this study.
-2
-1
0
1
2
2001 2002 2003 2004 2005 2006 2007 2008 20091
2
3
4
5
GW
Lev
el (
m.P
WD
) SP
I
6 month SPI in October 1 year SPI in april Minimum GWL
-2
-1
0
1
2
2001 2002 2003 2004 2005 2006 2007 2008 20091
2
3
4
5
GW
Lev
el (
m.P
WD
)
6 month SPI in October 1 year SPI in april
SP
I
Minimum GWL
(a) (b)
Figure 6. Relationship of SPI values with minimum GWL of the study area at stations (a)RF01 and (b)RF02
The comparison indicates that the meteorological drought is correlated with the GW declination trend in the study area. The figure shows that severe drought (SPI > -1.5 by McKee et al., 1993) occurs in the years 2006 and 2007 for both 6-month and 1-year timesteps in the study area. It leads to the subsequent lowering of the GWL rapidly in that period with the reduction in net recharge and with higher temperature, which might be responsible for causing the GW drought. Therefore, both meteorological and GW drought are correlated in the study area.
5. CONCLUSIONS
This study investigates the occurrence and assessment of GW drought extent in Naogaon district under Rajshahi division located within the Barind Irrigation Project in northwestern Bangladesh by using the cumulative deficit (CD) from threshold GW levels based on the Threshold Level Approach. The spatial
2922
Adhikary et al., Groundwater drought assessment for Barind irrigation project in northwestern Bangladesh
extent maps of GW drought based on different threshold levels indicate that GW drought is a regular occurring event in most part of the study area. The study finds that the northern part of the study area is free from the drought events. The GW hydrographs for most of the monitoring wells exhibit significant declination of GW table in the study period because of the extensive GW withdrawal from the underground aquifer which is the main reason for the GW drought occurrence. It is also found that GW drought is correlated to the meteorological drought event which indicates that the deficiency in rainfall may exacerbate the GW drought conditions. The study finally suggests that development and utilization of SW resources for increased irrigation activities in the study area is indispensable to reduce the growing pressure on the GW reserves.
ACKNOWLEDGMENTS
The authors wish to acknowledge the valuable data supports of BWDB and BMD for this study.
REFERENCES
Asaduzzaman, M., and Rushton, K.R. (2006). Improved yield from aquifers of limited saturated thickness using inverted wells. Journal of Hydrology, 326(1-4), 311–324.
BADC (2005). The Minor Irrigation Survey Report of 2005, Bangladesh Agricultural Development Corporation (BADC), Dhaka, Bangladesh.
Bari, M.F., and Anwar, A.H.M.F. (2000). Effects on irrigated agriculture on groundwater quality in northwestern Bangladesh. Proceedings of Integrated Water Resources Management for Sustainable Development, Vol. I, New Delhi, pp.19–21.
Calow, R.C., Robins, N.S., MacDonald, A.M., Nicol, A.L., and Orpen, W.R.G. (1999). Planning for groundwater drought in Africa. In: Proceedings of the international Conference on Integrated Drought Management-Lessons for Sub-Saharan Africa, Pretoria, South Africa, pp.20–22.
Islam, M.M., and Kanungoe, P. (2005). Natural recharge to sustainable yield from the Barind aquifer: a tool in preparing effective management plan of groundwater resources. Water Science & Technology, 52(12), 251-258.
McKee, T.B., Doesken, N.J., and Kleist, J. (1993). The relationship of drought frequency and duration to time scales. 8th Conference on Applied Climatology, Anaheim, California, pp.179-184.
Rahman, M.M., and Mahbub, A.Q.M. (2012). Groundwater depletion with expansion of irrigation in Barind tract: a case study of Tanore Upazilla. Journal of Water Resource and Protection, 4(8), 567-575.
Ramamasy, S., and Baas, S. (2007). Climate Variability and Change: Adaptation to Drought in Bangladesh: A Resource Book and Training Guide, Food and Agricultural Organization of the United Nations, Rome.
Roy, R.D. (1986). The great trigonometrical survey of India in a historical perspective. Indian Journal of History of Science, 21(1), 22–32.
Shahid, S., and Behrawan, H. (2008). Drought risk assessment in the western part of Bangladesh. Natural Hazards, 46(3), 391-413.
Shahid, S., and Hazarika, M.K. (2009). Groundwater drought in the northwestern districts of Bangladesh. Water Resources Management, 24(10), 1989-2006.
Tallaksen, L.M., and van Lanen, H.A.J. (2004). Hydrological Drought: Processes and Estimation Methods for Streamflow and Groundwater, Elsevier Science Publisher, Netherlands, 579p.
van Lanen, H.A.J., and Peters, E. (2000). Definition, effects and assessment of groundwater droughts, In: Drought and Drought Mitigation in Europe by Vogt J.V. and Somma, F. (eds.), Kluwer Academic, Springer, 325p.
WaRPO (1999). Bangladesh National Water Policy Draft Report, Water Resources Planning Organization (WaRPO), Government of Bangladesh, Dhaka.
2923