Embed Size (px)
Citation preview

Group 7 - Reshoring Chao Xu Tolga Ozdil Kiran Bhimani Yuexin Zhang Ziyuan Wei Cong Wang
What is Reshoring?
- Many major companies in the world move their manufacturing facilities and services to countries that has cheap working and labor costs. However, reshoring became a viable option as the manufacturing costs and wages started to increase as well as time/communication problems became more apparent in the past decade. - Reshoring is the practice of bringing manufacturing and services back to the U.S. from overseas.
Benefits of Reshoring
Strengthen the U.S. economy - Balance trade and budget deficits - Reduce Unemployment - Well-paying manufacturing jobs - Fosters a skilled workforce Manufacturing Companies - Reducing the total cost of products - Improve balance sheets - More Effective Product innovations
Problem Statement
• Off shoring for GE used to be the most feasible action for the company could take in order to profit from mass-production. However, off shoring in general is not as profitable as it was before. GE started to re-shore to their original countries but this process is highly risky and must be done according to a carefully studied plan of action.
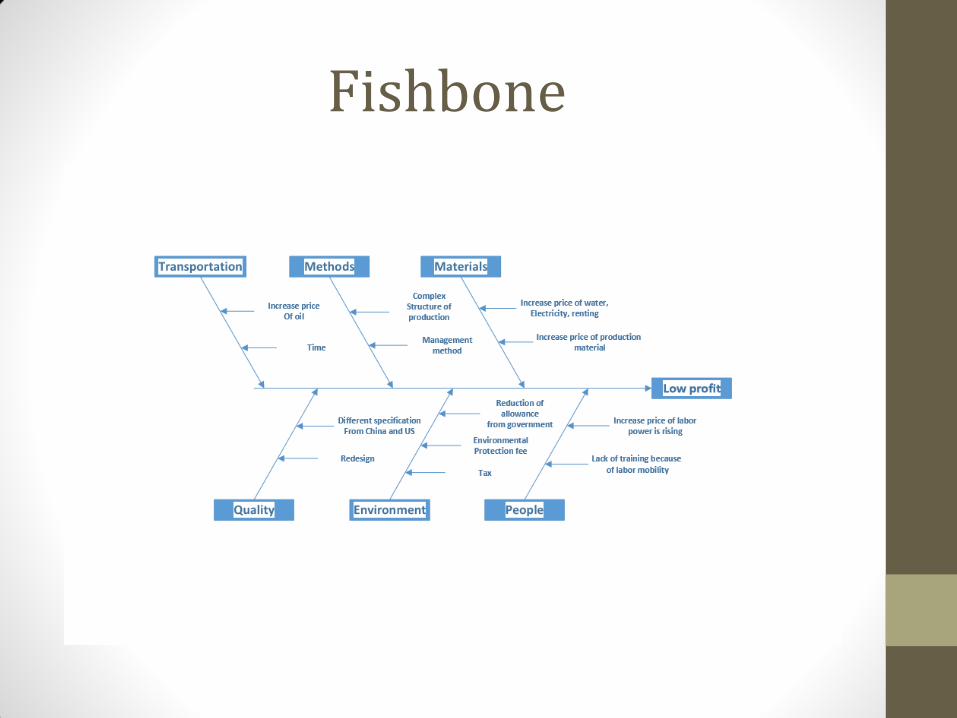
Fishbone
Fault Tree Analysis
•Fault Tree Analysis (FTA) is a top down failure consequence assessment technique that is useful in identifying safety concerns so that product modifications can be made.
•Originally developed in 1962 at Bell Laboratories and the technique remains relevant today
•Mainly used in the fields of safety engineering and reliability engineering to understand how systems can fail, to identify the best ways to reduce risk.
Benefits of FTA
•Identification of single failure points
•Identification of safety concerns
•Evaluation of software and man-machine interfaces
•Evaluation of design change impacts
•Simplification of maintenance and trouble-shooting procedures
•Assessment of modifications or enhancements
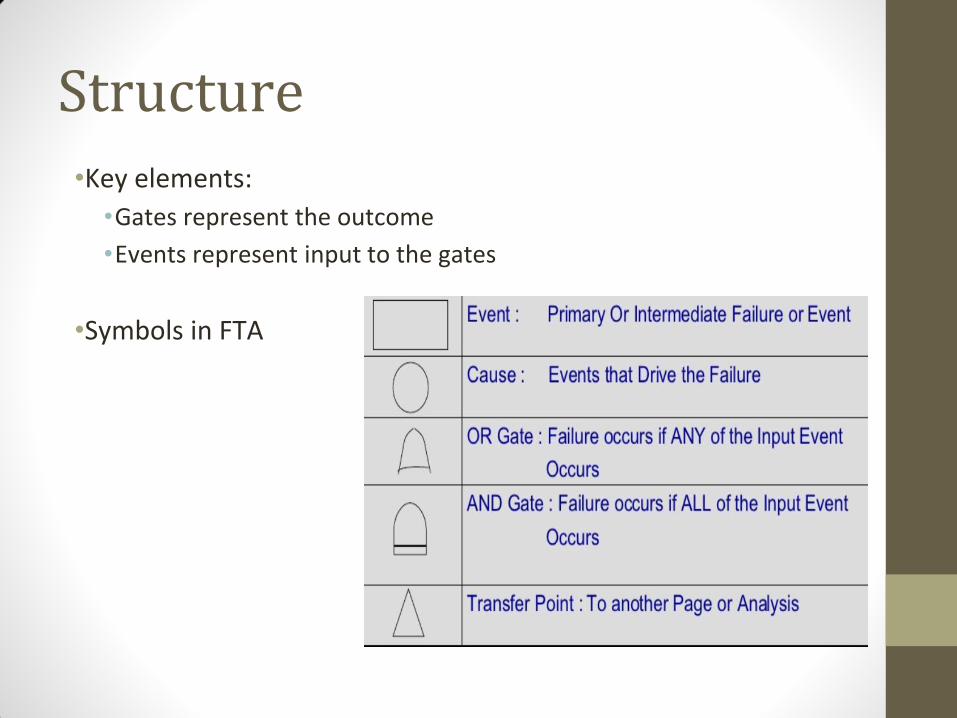
Structure •Key elements:
•Gates represent the outcome
•Events represent input to the gates
•Symbols in FTA
Procedure
•Define an event of interest as the top event of the cause and effect tree.
•Define the next level of the tree
•Develop questions to examine the credibility of branches
•Gather data to answer questions
•Determine whether the branch is credible
•Determine whether the branch is sufficiently developed
•Stop branch development
•Stop when the scenario model is complete
•Identify causal factors
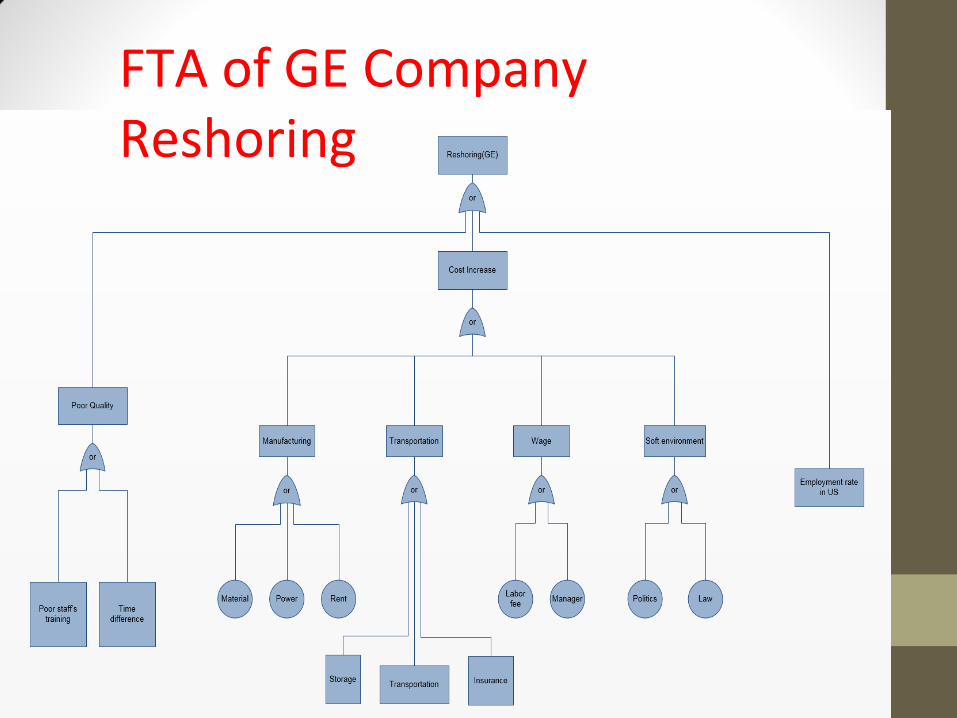
FTA of GE Company Reshoring
Reliability Analysis
Introduction
•Reliability is a devices ability to function within specifications for a period of time without failing. Statistics along with known standard distribution’s can be used to examine the device reliability and to determine confidence intervals that can be used to predict a product performance.
Introduction
•MTTF (Mean Time to Failure), Failure Rate & Censored Data
•The Mean Time to Failure is a measure of how long we would expect a typical water heater to last and is calculated for these experiments on the chi-sq distribution. The more samples or experiments tested, the more accurate of product reliability can be determined.
•When we have an experiment where we are missing information, the experiment is cut short, censored experiments might not accurately specify product reliability.
Exponential Distribution
•We will use the exponential distribution to represent out MTTF. In Minitab (a computational statistics tool) we can use the random number generator to create 30 time measurements with a mean of 203 hours.
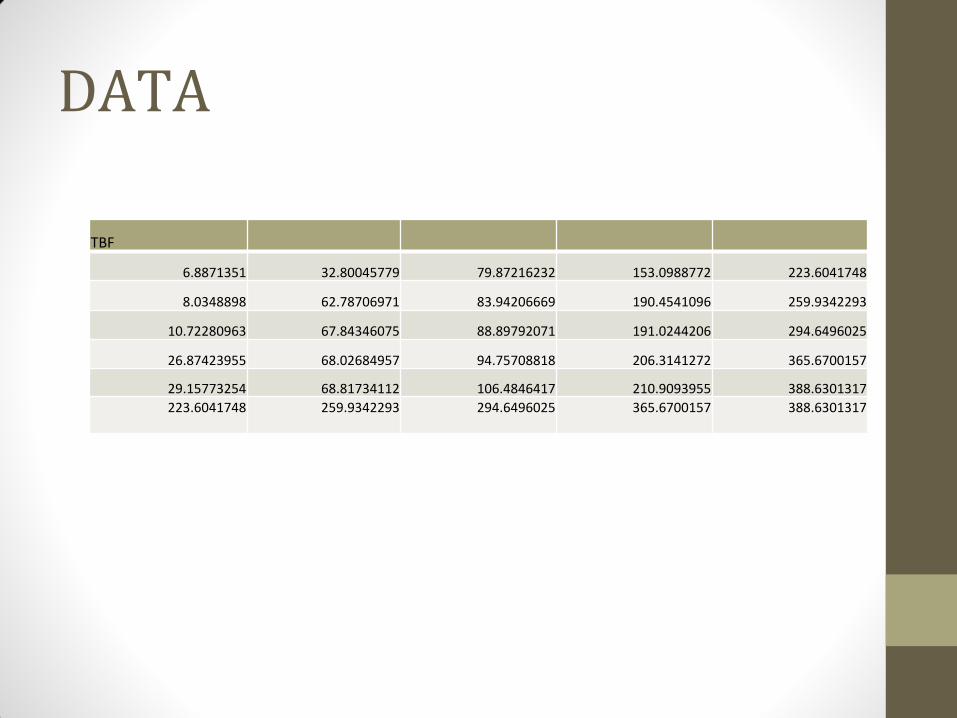
DATA
TBF
6.8871351 32.80045779 79.87216232 153.0988772 223.6041748
8.0348898 62.78706971 83.94206669 190.4541096 259.9342293
10.72280963 67.84346075 88.89792071 191.0244206 294.6496025
26.87423955 68.02684957 94.75708818 206.3141272 365.6700157
29.15773254 68.81734112 106.4846417 210.9093955 388.6301317
223.6041748
259.9342293
294.6496025
365.6700157
388.6301317
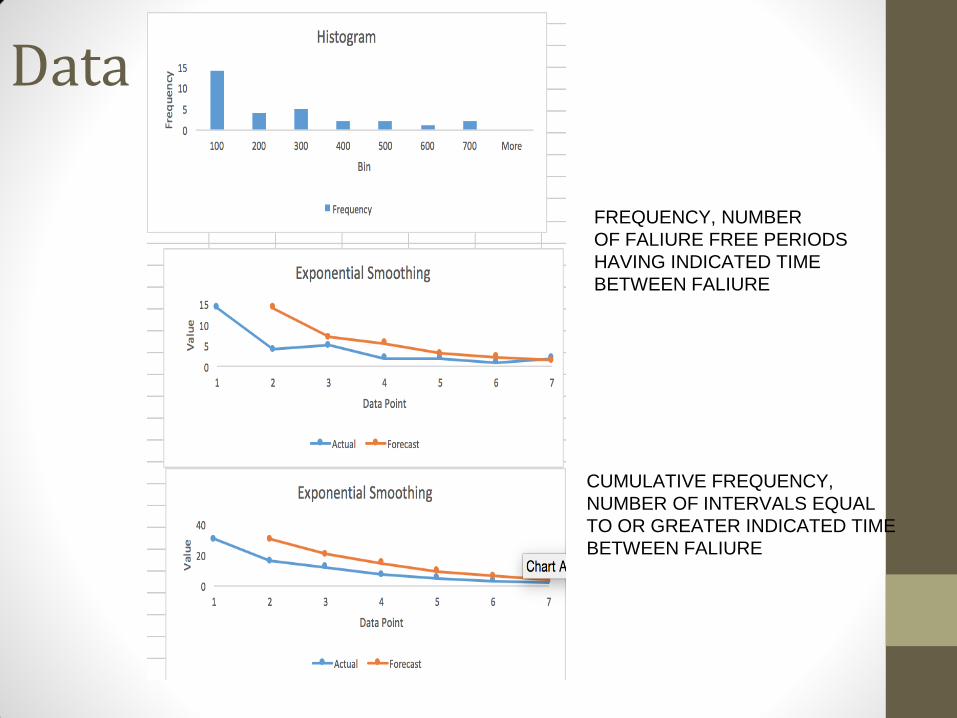
Data
FREQUENCY, NUMBER
OF FALIURE FREE PERIODS
HAVING INDICATED TIME
BETWEEN FALIURE
CUMULATIVE FREQUENCY,
NUMBER OF INTERVALS EQUAL
TO OR GREATER INDICATED TIME
BETWEEN FALIURE
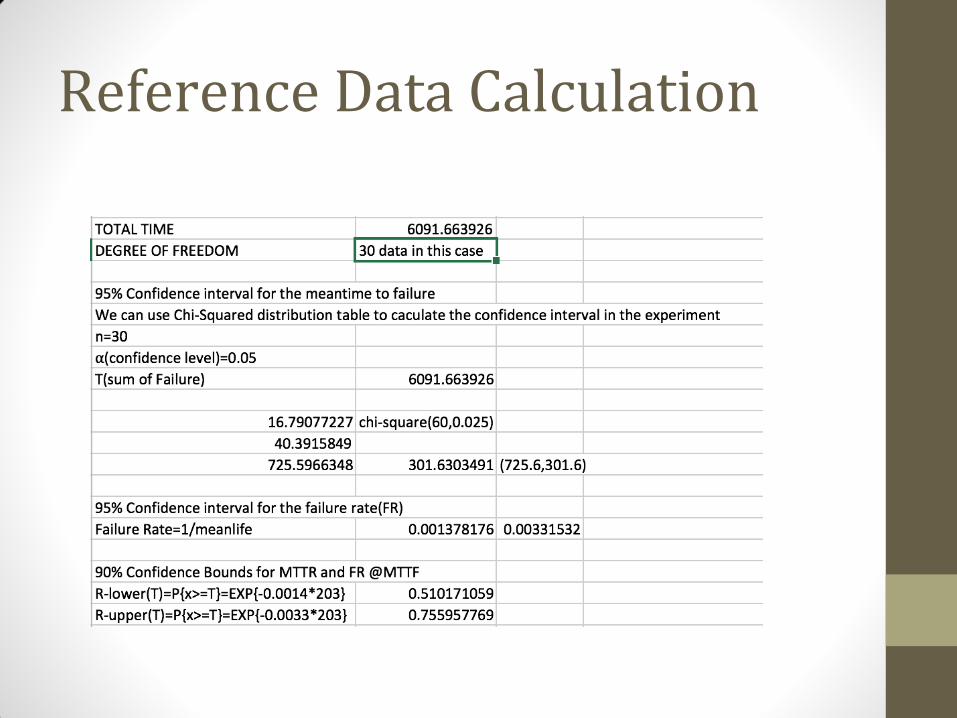
Reference Data Calculation
Conclusion for reference data
•Therefore from the data analysis we can see with 95% confidence level for mission time of 6091 hours from the test data we can say that the diagnosis of a water heater results in complete success is between 51% to 75%.
•The goal is probably met, but the rate is not good enough… we would like to improve over time.
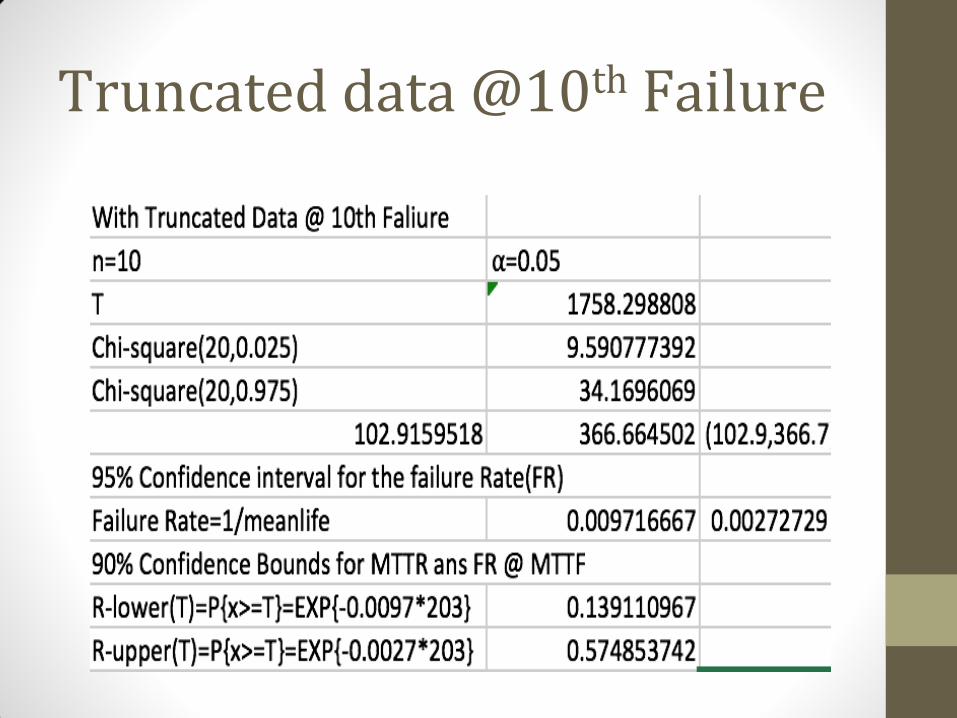
Truncated data @10th Failure
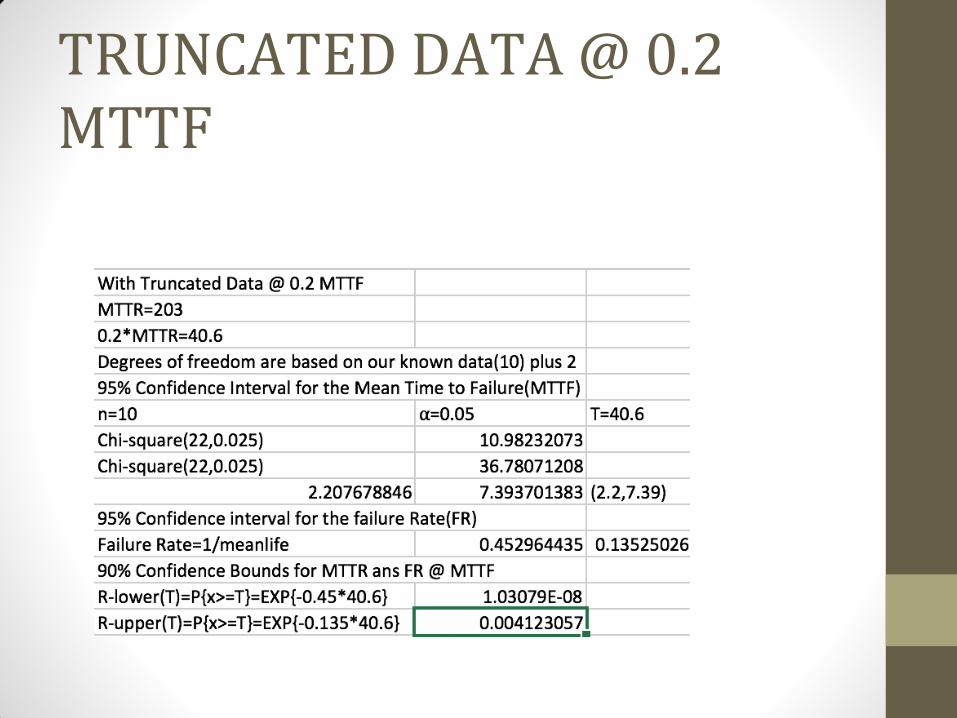
TRUNCATED DATA @ 0.2 MTTF
Reliability Analysis Conclusion •Based on the calculations above, and considering that the reference data is most accurate , we see that in both cases on censored (truncated) data we get a larger confidence interval and larger failure rate when we are forced to use incomplete data.
Reshoring Conclusion
•Reshoring has its time and place
•According to the semester’s worth of data analysis including: FTA analysis, Reliability Analysis, Cause and Effect, Supply Chain Analysis, Six sigma and more, we can strongly conclude that Reshoring will be beneficial to our company.