Embed Size (px)
Citation preview
Scientia Horticulturae, 47 ( 1991 ) 283-293 283 Elsevier Science Publ ishers B.V., Ams te rdam
Growth and water use of young, closely planted peach trees
P.D. Mitchell, A.M. Boland, J.L. Irvine and P.H. Jerie Department of Agriculture and Rural Affairs, Institute for Irrigation and Salinity Research, Tatura,
Fic. 3616, Australia
(Accepted 20 December 1990)
ABSTRACT
Mitchell, P.D., Boland, A.M., Irvine, J.L. and Jerie, P.H., 1991. Growth and water use of young, closely planted peach trees. Scientia Hortic., 47: 283-293.
Water use of peach trees (Prunus persica (L.) Batsch) was studied in the first and second year after planting in 33 drainage lysimeters, resembling a small, but typical 4 m × 1 m orchard. In both years, tree water use was monitored weekly by measuring irrigation, drainage, and the change in water con- tent within the profile with a neutron probe. Irrigation was compared between different levels and in Year 2 between two frequencies of irrigation. Weekly water use was calculated over tree size using trunk cross-sectional area (TCA) and /o r canopy surface area (CS) as estimates of tree size. Within years, weekly water use expressed as litres per millimetre of class A pan evaporation (ET/E) in- creased progressively over the season. Adjusted for tree size using TCA and /o r CS, ET/E tended to be similar throughout the season. The means of these adjusted figures for Year 1 were 0.22 m m - evaporation cm -2 TCA and 1.19 mm -~ evaporation m -2 CS; for Year 2, 0.14 1 m m - ' evaporation c m - 2 TCA and 0.71 I m m - ~ evaporation m - 2 CS. It is suggested that the above discrepancies between years were associated with less advection in the more compact orchard of year 2, the canopy of the trees being joined along the row, approaching a 2 m width across the row and over 3 m high. In both years trees grew faster and used more water at the higher level of irrigation.
Keywords: drainage lysimeters; peach; Prunus persica.
Abbreviations: CS (m 2) =canopy surface area; E ( m m ) = e v a p o r a t i o n from U.S. Class A pan; EP (mm or 1) = E X planting area (m2); ET (mm or 1) =tree water use; RDI =regulated deficit irri- gation; TCA (cm 2) = trunk cross-sectional area 15 cm from ground level.
I N T R O D U C T I O N
The scheduling of irrigation to orchards is often based on open pan evapo- ration (E) . Tree water use (ET) in millimetres is then assumed to be propor- tional to E which would occur over a free water surface equivalent in size to the orchard area.
Under trickle or microjet irrigation, each tree receives known amounts
0304 -4238 /91 /$03 .50 © 1991 - - Elsevier Science Publ ishers B.V.
284 P.D. MITCHELL ET AL.
(litres) of water. It is more convenient to express ET in terms of litres per tree. E is then calculated in litres using the conversion expression 1 m m m - 2 = l l over a free water surface equivalent to the area available to each tree (EP), or in some cases to the mean canopy area. A crop coefficient then specifies the proportional relationship of E to ET. Worthington et al. (1984) thus calculated the mean ET of peach trees in weighing lysimeters to be 139 1 day- ' in July. Using the above conversion expression, ET was 0.9 of E cal- culated over an area equivalent to the canopy cover and as such 0.9 was the crop coefficient.
It is more convenient in established orchards, however, to use a crop coef- ficient which defines the proportional relationship of ET to EP. Thus in Aus- tralia, once the canopy covers 50% of the orchard floor, ET is obtained from EP in millimetres or litres using crop coefficients of 0.8- 1.0 over the majority of the season (Mitchell and van den Ende, 1979).
Other workers have established crop coefficients to relate ET to EP in es- tablished orchards (Klein, 1983; Miyamoto, 1983; Ruggiero, 1985; Natali et al., 1985a, b). The fact that their findings vary, probably reflects differences in environment, tree size and species. For instance, Klein measured a maxi- m u m crop coefficient of 0.68 on 4-year-old peach trees planted at a density of 370 trees ha-1 and whose canopy covered 70-80% of the orchard. On the other hand, at a much higher density ( 1666 trees ha - ~ ) Natali et al. (1985b) found crop coefficients to be as high as 1.25.
Such wide discrepancies are hard to reconcile. Even wider differences could be expected from young trees as canopy volume increases. Klein ( 1983 ) mea- sured steadily increasing crop coefficients for ET calculated from EP during the first 3 years of his experiment, ment ioned above.
The wide and changing variation in crop coefficients referred to above, highlights the need for a more precise means of estimating ET from E. More specifically, on young trees the use of E to accurately schedule irrigation could depend on an easy measure of changing canopy cover. On such trees, canopy cover should relate to tree size. Trunk cross-sectional area (TCA) is a reliable measure of tree size (Westwood and Roberts, 1970) and is also readily esti- mated from trunk diameter or circumference measurements.
Black et al. (1977) used TCA to find a relationship between TCA and E which was sufficiently reliable to predict the rapidly increasing water needs of strongly growing peach trees. Black et al. suggests, however, that this rela- t ionship could be greatly influenced by tree spacing and shape, advective en- ergy being a major component of the energy balance in young open orchards. The work described in this present paper further explores the concepts put forward by Black et al. ( 1977 ).
Drainage lysimeters were constructed to study the effect of regulated deficit irrigation (RDI) (Chalmers et al., 1981; Mitchell and Chalmers, 1982; Mitchell et al., 1984, 1989 ) using salty water on heavily cropped trees, grow-
GROWTH AND WATER USE OF YOUNG PEACH TREES 285
ing in a deep soil profile. The work reported in the present paper, however, relates to the water use of young peach trees during the establishment period when max imum tree growth is desirable.
M A T E R I A L S A N D M E T H O D S
In the winter of 1987, 33 lysimeters (Fig. 1 ) were installed in a single row and filled with a sandy loam. A peach tree (cultivar 'Golden Queen') was planted slightly offset from the centre of each lysimeter. A spacing of 0.1 m between the lysimeters, which were 0.9 m in diameter, ensured that the trees were spaced 1 m apart. An access tube for a neutron probe was installed in the centre of each lysimeter. The lysimeter trees were guarded on each side by two rows of trees, the rows being spaced 4 m apart and the trees within the row, 1 m apart. The rows adjacent to the lysimeter were 4 m from the lysi- meter trees. A row of five trees spaced 1 m apart guarded each end of the above planting.
All trees were trained to a central leader shape and were trickle irrigated with six drippers ringed around each tree providing 21 of water h - i. The loam and the drippers in the lysimeter were covered with plastic to eliminate evap- oration from the ground surface and to minimise rain intake.
The pF (i.e. the relationship of soil water suction to water content) of the sandy loam was determined.
One of the requirements of the planned experiment was to be able to re-
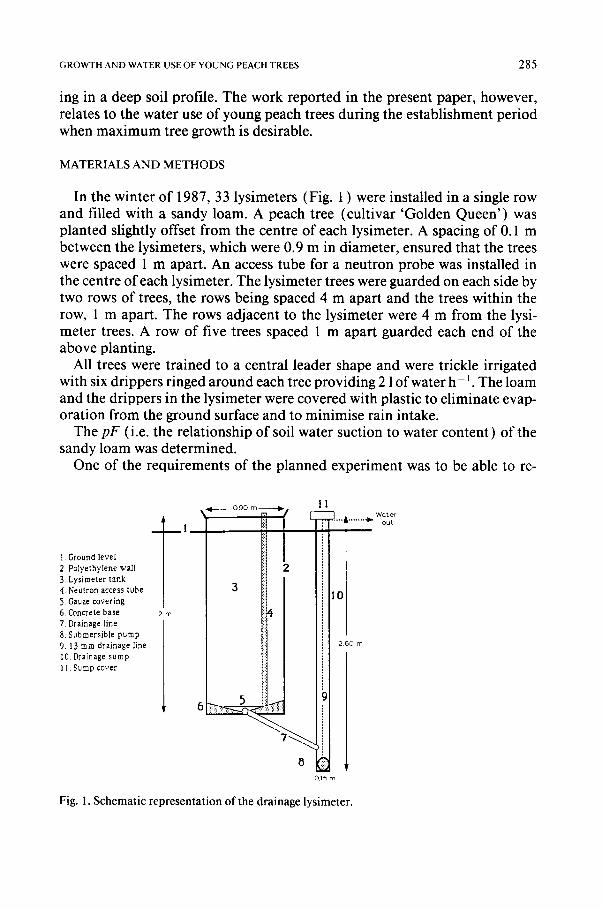
I. Ground level 2 Polyethylene wall 3. Lysimeter tank 4. Neutron access tube 5. Gauze covering 6. Concrete base 7. Drainage line 8. Submersible pump 9.13 mm drainage line I0. Drainage sump I I. Sump cover
1-- 2 m
1
0 . 9 0 m Ib 11 I
6 i:i: 0 1 5 m
2 6 0 m
Fig . 1. S c h e m a t i c r e p r e s e n t a t i o n o f t h e d r a i n a g e l y s i m e t e r .
W a t e r b . . . . . . . . I b o u t
286 P.D. MITCHELL ET AL.
strict irrigation water to the top half of the 1.8 m deep lysimeters. Thus, be- sides maintaining rapid tree growth, it was also desirable to use the first 2 years of the experiment to study the hydraulic relationships within the lysi- meter using different levels and frequency of irrigation. These were adjusted so as not to impair the ultimate requirement of fully grown, uniform trees within 2 years of planting.
In the 1987-1988 season (Year 1 ), 12 trees were selected and irrigated with three levels of irrigation replicated four times along the lysimeter row. The treatments involved a control, where the moisture content within the lysime- ter was maintained at a stable level throughout the season with at least 10% drainage. In the remaining two treatments, which received one-half and one- quarter of the water received by the control, the soil profile within the lysi- meter was allowed to dry until the moisture content of the quarter treatment was close to half the available water held within the lysimeter between - 0.1 and - 16 bar. This involved three drying cycles alternating with periods of wetting-up, when the approximate soil suction within the lysimeter was re- turned to - 0.1 bar. The trees were moni tored for ET during the weeks ending 11 January (middle of drying cycle 1 ), 1, 8 and 15 February (drying cycle 2 ) and 16 and 21 March (drying cycle 3 ). Irrigation was metered, drainage and changes of soil water in the lysimeter were estimated from neutron probe readings at the start and end of each week. The diameter of the trunk 15 cm from ground level, tree height, and width across the tree centre in two direc- tions - - one parallel to and one at right angles to the tree line - - were mea- sured at each of the above dates. The measurements of width were taken at approximately one-third of the height of the tree. The above treatments are henceforth referred to as control, half t reatment and quarter treatment.
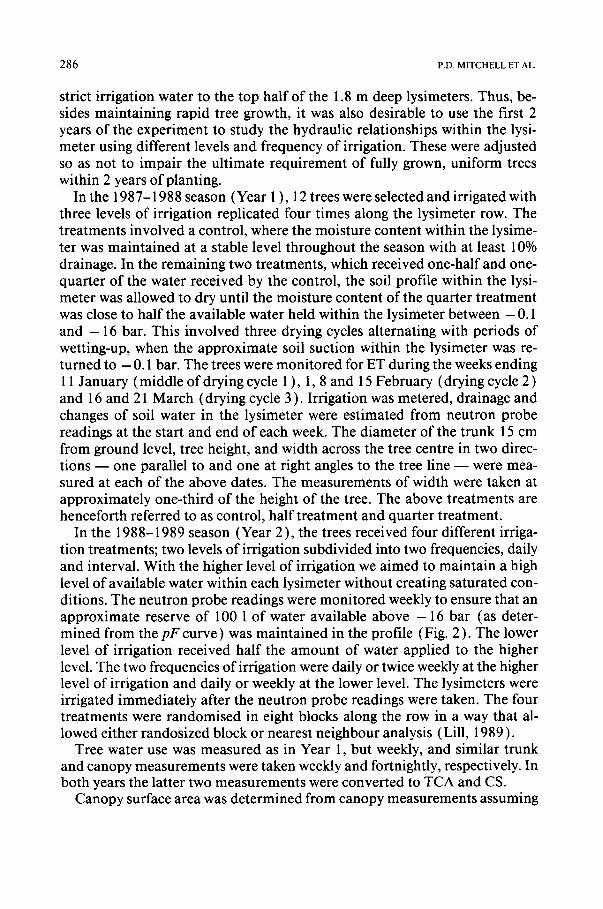
In the 1988-1989 season (Year 2 ), the trees received four different irriga- tion treatments; two levels of irrigation subdivided into two frequencies, daily and interval. With the higher level of irrigation we aimed to maintain a high level of available water within each lysimeter without creating saturated con- ditions. The neutron probe readings were moni tored weekly to ensure that an approximate reserve of 100 1 of water available above - 1 6 bar (as deter- mined from the pF curve ) was maintained in the profile (Fig. 2 ). The lower level of irrigation received half the amount of water applied to the higher level. The two frequencies of irrigation were daily or twice weekly at the higher level of irrigation and daily or weekly at the lower level. The lysimeters were irrigated immediately after the neutron probe readings were taken. The four treatments were randomised in eight blocks along the row in a way that al- lowed either randosized block or nearest neighbour analysis (Lill, 1989 ).
Tree water use was measured as in Year 1, but weekly, and similar trunk and canopy measurements were taken weekly and fortnightly, respectively. In both years the latter two measurements were converted to TCA and CS.
Canopy surface area was determined from canopy measurements assuming
GROWTH AND WATER USE OF YOUNG PEACH TREES 287
LITRES 20O
150
100
50
-~- Low ]~
I I J 1 L I I I I I I I t I I I I t
OCT NOV DEC JAN FEB MAR MONTH
Fig. 2. Mean soil water available above - 16 bar to peach trees, at the high and low levels of irrigation, at weekly times of measurement during Year 2.
a rectangular tree shape for up to two-thirds of the height of the tree, allowing for a 0.2 m clearance between canopy and ground level. A conical shape was assumed for the remaining third of the height.
Evaporation from a U.S. Class A pan, approximately 50 m from the plant- ing site, was used in both years to calculate ET/E (i.e. tree water use in litres per millimetre of E) which was then adjusted for tree size using the appropri- ate two estimates of tree size (i.e. TCA and CS).
All data were analysed by analysis of variance with a randomised block design. In Year 2 the nearest neighbour analysis failed to reduce the square error of the mean, suggesting a lack of trend in the experimental site. The randomised block analysis was thus used in both years.
RESULTS
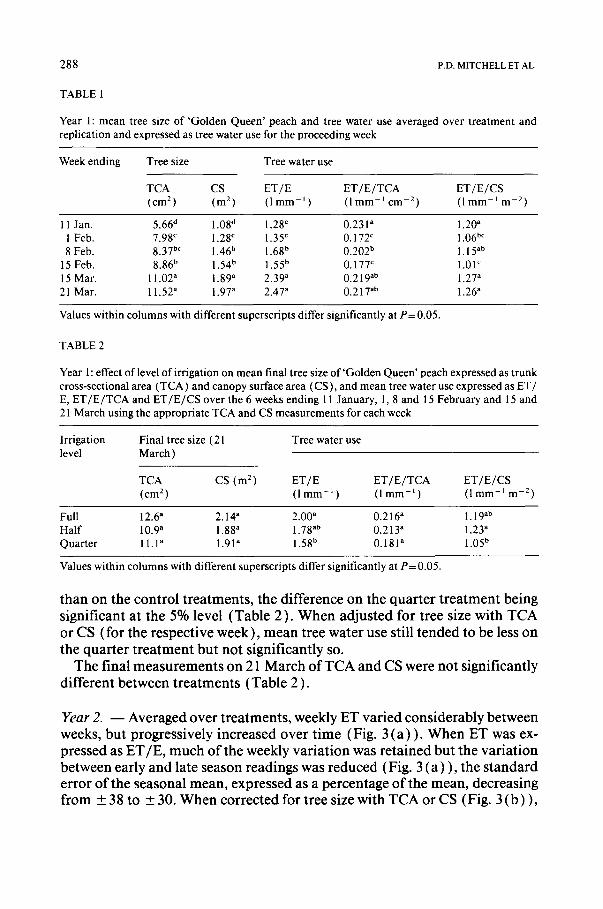
Y e a r 1. ~ Between times of measurement, TCA, CS and ET/E averaged over treatments tended to increase progressively with t ime (Table 1 ). When ad- justed for TCA, ET/E was similar for the weeks ending 8 February and 15 and 21 March and the March measurements did not differ significantly from the measurements for the week ending 11 January (Table 1 ). Measurements on 1 and 15 February, however, were less than those in January and March. Similar tendencies were shown for ET /E adjusted for CS with no significant differences between the weeks ending 11 January, 8 February and 15 and 21 March. There were no interactions between treatments and week of measurements.
Averaged over the 6 weeks during which water use was measured, tree water use on the half and quarter treatments was 11% and 21%, respectively, less
288 P.D. MITCHELL ET AL.
TABLE 1
Year 1: mean tree size of 'Golden Queen ' peach and tree water use averaged over treatment and replication and expressed as tree water use for the proceeding week
Week ending Tree size Tree water use
TCA CS E T / E E T / E / T C A E T / E / C S (cm 2) (m 2) ( l m m - j ) ( l m m - t c m -2) ( l m m - l m -2)
11 Jan. 5.66 ~ 1.08 d 1.28 c 0.231 ~ 1.20 ~ 1 Feb. 7.98 c 1.28 c 1.35 ~ 0.172 c 1.06 bc 8 Feb. 8.37 bc 1.46 b 1.68 b 0.202 b 1.15 ab
15 Feb. 8.86 b 1.54 b 1.55 b 0.177 c 1.01 ~
15 Mar. 11.02 ~ 1.89 a 2.39 a 0.219 ab 1.27 a 21 Mar. 11.52 ~ 1.97 a 2.47 ~ 0.217 ab 1.26 a
Values within columns with different superscripts differ significantly at P = 0.05.
TABLE 2
Year 1: effect of level of irrigation on mean final tree size o f 'Go lden Queen' peach expressed as trunk cross-sectional area (TCA) and canopy surface area (CS) , and mean tree water use expressed as ET/ E, E T / E / T C A and E T / E / C S over the 6 weeks ending 11 January, 1, 8 and 15 February and 15 and 21 March using the appropriate TCA and CS measurements for each week
Irrigation Final tree size (21 Tree water use level March )
TCA CS (m 2) E T / E E T / E / T C A E T / E / C S (cm 2) ( l m m - l ) ( l m m - l ) ( l m m - l m -2)
Full 12.6 a 2.14 a 2.00 a 0.216 a 1.19 ab Half 10.9 a 1.88 a 1.78 ~b 0.213 a 1.23 ~ Quarter 11.1 a 1.91 a 1.58 b 0.181 a 1.05 b
Values within columns with different superscripts differ significantly at P = 0.05.
than on the control treatments, the difference on the quarter treatment being significant at the 5% level (Table 2). When adjusted for tree size with TCA or CS (for the respective week), mean tree water use still tended to be less on the quarter treatment but not significantly so.
The final measurements on 21 March of TCA and CS were not significantly different between treatments (Table 2 ).
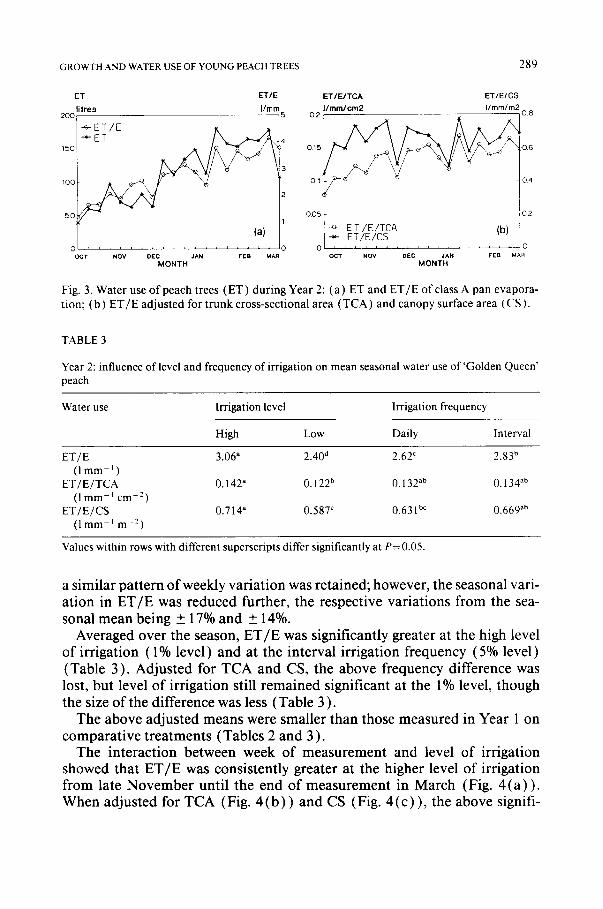
Y e a r 2 . - - Averaged over treatments, weekly ET varied considerably between weeks, but progressively increased over time (Fig. 3 (a ) ) . When ET was ex- pressed as ET/E, much of the weekly variation was retained but the variation between early and late season readings was reduced (Fig. 3 (a) ), the standard error of the seasonal mean, expressed as a percentage of the mean, decreasing from +_ 38 to +_ 30. When corrected for tree size with TCA or CS (Fig. 3 (b) ),
G R O W T H AND WATER USE OF Y O U N G PEACH TREES 289
ET ET/E
l itres I/mm 200 5
[~-ET/E ?x I-'-ET / ~ 2 ~ 4
lOO o (a) 0 I , , h i i i ~ I i i i i i i i ~ b , 0
OCT NOV DEC JAN FEB MAR MONTH
ET/E/TCA ET/E/CS I/mm/cm2 I/mm/m2
0.2 I ~ 10.8
0.15 0 6
o.o~/ I o.~
E T /E /TCA (b) • -"- ET/E/CS
0 I , , h , ~ i , t i , , J ~ , ~ I , , J O
OCT NOV DEC JAN FEB MAR MONTH
Fig. 3. Water use o f peach trees (ET) during Year 2: ( a ) ET and E T / E of class A p a n e v a p o r a -
t ion ; ( b ) E T / E adjusted for trunk cross-sectional area (TCA) and canopy surface area ( C S ) .
TABLE 3
Year 2: influence of level and frequency of irrigation on mean seasonal water use o f 'Go lden Queen ' peach
Water use Irrigation level Irrigation frequency
High Low Daily Interval
E T / E 3.06 a 2.400 2.62 c 2.83 b
( l m m -I ) E T / E / T C A 0.142 a 0.122 b 0.132 ab 0.134 ~b
( l m m -] cm -2 ) E T / E / C S 0.714 ~ 0.587 c 0.63 lbC 0.669.b
( l m m - I m - 2 )
Values within rows with different superscripts differ significantly at P = 0.05.
a similar pattern of weekly variation was retained; however, the seasonal vari- ation in ET/E was reduced further, the respective variations from the sea- sonal mean being _+ 17% and _+ 14%.
Averaged over the season, ET/E was significantly greater at the high level of irrigation ( 1% level) and at the interval irrigation frequency (5% level) (Table 3). Adjusted for TCA and CS, the above frequency difference was lost, but level of irrigation still remained significant at the 1% level, though the size of the difference was less (Table 3 ).
The above adjusted means were smaller than those measured in Year 1 on comparative treatments (Tables 2 and 3 ).
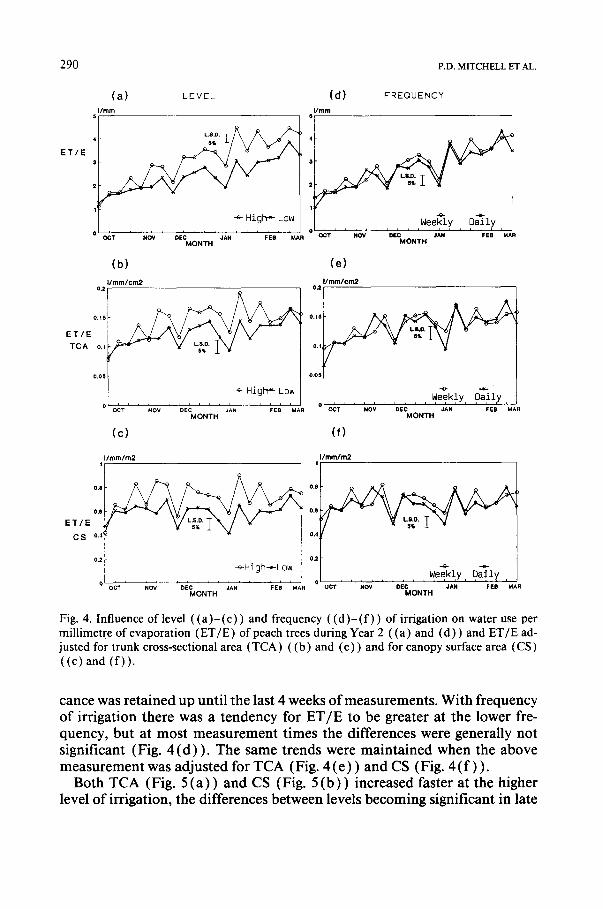
The interaction between week of measurement and level of irrigation showed that ET/E was consistently greater at the higher level of irrigation from late November until the end of measurement in March (Fig. 4 (a) ) . When adjusted for TCA (Fig. 4 ( b ) ) and CS (Fig. 4 ( c ) ) , the above signifi-
290 P.D. MITCHELL ET AL.
ET/E
( a ) LEVEL I/ram
L.S.D.
-~- High'- LOW
OCT NOV DECMoNT H JAN FEB MAR
(b) I/mm/cm2 o.2
ET/E °'~5 ~ TCA o.1
o.o."
-e- High'- Low
@ OCT NOV DECMoNT H JAN
(c)
( d ) FREQUENCY
I/ram 5,
3
o OCT NOV DEC JAN FEB MAR MONTH
(e) I/mm/cm2
o . 1 5 ~
o.1
o.o5
-~ p~l ,y W e e k l y o i , , , , . . . . . . . . . . .
OCT NOV DEC JAN FEB MAR MONTH
(f)
o.
o.@ ET/E
CS 0.4
Cram/m2
-e-High--Low
OCT NOV DE~doNTH JAN FEB MAR
I/rnm/m2 ,[ I
o . o ~
o,6
o,4
o,2
O i i , , , J , , , , , , , , , , O C T N O V D E C d A N F E B MAR
MONTH
Fig. 4. Influence of level ( (a)- (c) ) and frequency ( (d) - ( f ) ) of irrigation on water use per millimetre of evaporation (ET/E) of peach trees during Year 2 ((a) and (d)) and ET/E ad- justed for trunk cross-sectional area (TCA) ((b) and (e)) and for canopy surface area (CS) ((c) and (f)).
cance was retained up until the last 4 weeks o f measurements. With frequency o f irrigation there was a tendency for E T / E to be greater at the lower fre- quency, but at most measurement t imes the differences were generally not significant (Fig. 4 ( d ) ) . The same trends were maintained when the above measurement was adjusted for TCA (Fig. 4 ( e ) ) and CS (Fig. 4 ( f ) ).
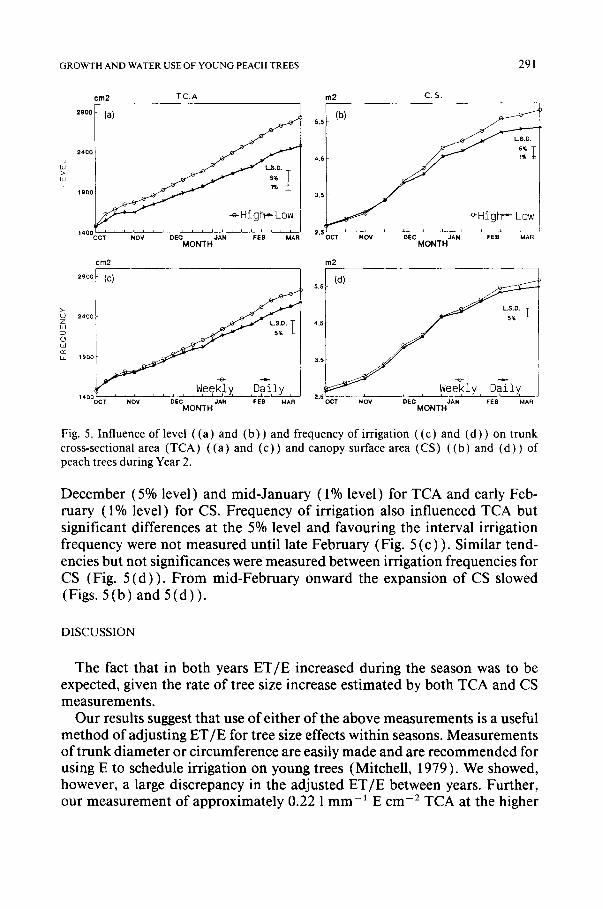
Both TCA (Fig. 5 ( a ) ) and CS (Fig. 5 ( b ) ) increased faster at the higher level o f irrigation, the differences between levels becoming significant in late
GROWTH AND WATER USE OF YOUNG PEACH TREES 291
c m 2 T.C.A
2900 (a)
2400
L~.D,
1900
~High~Low 1 400OCT NOV DEC JAN FEB MAR
MONTH
crn2
2400
(c)
L.$.D,
1900 5 ~
Weekly Daily , ; L , . . . . . . . , l , , ,
1400OCT NOV DEC JAN FEB MAR MONTH
m2 C.S.
s.s (b)
LS.O.
4.5 5 3.5
-~Hi~r ~- Low , , , z , t , , , L
2.5 OCT NOV DEC JAN FEEl MAR MONTH
rn2
55~ Idl !
L.S.D.
4.St
a.S~
OCT NOV DEC JAN FEB MAR MONTH
Fig. 5. Influence of level ((a) and (b)) and frequency of irrigation ((c) and (d)) on trunk cross-sectional area (TCA) ((a) and (c)) and canopy surface area (CS) ((b) and (d)) of peach trees during Year 2.
December (5% level) and mid-January (1% level) for TCA and early Feb- ruary ( 1% level) for CS. Frequency of irrigation also influenced TCA but significant differences at the 5% level and favouring the interval irrigation frequency were not measured until late February (Fig. 5 (c)). Similar tend- encies but not significances were measured between irrigation frequencies for CS (Fig. 5(d)) . From mid-February onward the expansion of CS slowed (Figs. 5(b) and 5(d)) .
DISCUSSION
The fact that in both years ET/E increased during the season was to be expected, given the rate of tree size increase estimated by both TCA and CS measurements.
Our results suggest that use of either of the above measurements is a useful method of adjusting ET/E for tree size effects within seasons. Measurements of trunk diameter or circumference are easily made and are recommended for using E to schedule irrigation on young trees (Mitchell, 1979). We showed, however, a large discrepancy in the adjusted ET/E between years. Further, our measurement of approximately 0.22 1 mm-' E cm -2 TCA at the higher
292 P.D. MITCHELL ET AL.
level of irrigation at the end of Year 1 is much less than the 0.35 1 m m -1 E cm-2 TCA which gave max imum growth on yearling peach trees planted in an orchard at a spacing of 6 m × 3 m with the ground mulched with black plastic (Black et al., 1977 ). This result was equivalent to an application rate of 2.2 E over the area of the mean canopy cover, a figure which would appear grossly excessive in terms of an energy balance. In an at tempt to explain such a high figure, the authors referred to the possibility of a large advective com- ponent in the total energy balance in young orchards, an effect which gradu- ally diminishes as the trees grow. The authors suggested a changing relation- ship between tree size and ET as the orchard becomes more crowded.
The trees in the Black et al. experiment were of an open vase shape. It is difficult and meaningless to relate the ground cover of our central leader trained tree to such trees and compare ET over canopy area. Nevertheless, our results support the argument of Black et al. (1977), the orchard in Year 1 being more compact than the orchard described by those authors but much more open in Year 1 than in Year 2. Further, the above could explain an anomaly early in Year 2. In October and November, leaf cover was develop- ing slowly and the figures for water use in this period seemed excessive com- pared with those in December. This could be associated with the gradual tran- sition from the more open orchard of Year 1 to the closer tree configuration of Year 2, with its lower water use per unit of tree size.
Greater ET and tree growth at the higher levels of irrigation suggests that vegetative growth will respond to and use additional water. Thus, where drainage is good, high levels of irrigation will establish peach orchards quickly. The loss between levels of irrigation of significant ET /E adjusted for tree size late in Year 2 could be explained by slower canopy development from mid- February onwards. The drying out of the higher level treatment late in the season (Fig. 2 ) may also be attributed to the above.
Our results emphasise the value of adequate irrigation to encourage rapid growth of young orchards and highlight the importance of precise irrigation scheduling based on changing tree size, orchard density and class A pan evaporation.
ACKNOWLEDGEMENTS
We would like to thank I. Goodwin and K.J. Armstrong for their valuable technical assistance and Dr. A.P.L. Callinan for his biometrical advice and for designing the experimental layout in Year 2. The experiment was partially funded by the Australian Centre for International Agricultural Research (ACIAR).
GROWTH AND WATER USE OF YOUNG PEACH TREES 293
REFERENCES
Black, J.D.F., Mitchell, P.D. and Newgreen, P.N., 1977. Optimum irrigation rates for young trickle irrigated peach trees. Aust. J. Exp. Agric. Anim. Hush., 17" 342-345.
Chalmers, D.J., Mitchell, P.D. and van Heek, L., 1981. Control of peach tree growth and pro- ductivity by regulated water supply, tree density and summer pruning. J. Am. Soc. Hortic. Sci., 106: 307-312.
Klein, I., 1983. Drip irrigation based on soil matric potential conserves water in peach and grape. Hortscience, 18: 942-944.
Lill, W., 1989. A program for nearest neighbour analysis. Bull. N. S. W. Dep. Agric. Fish., Mur- ray and Riverina Region, Australia.
Mitchell, P.D., 1979. Trickle irrigation: The water needs of young peach trees. Agnote Agdex 215/56 l, Dep. Agric. Rural Affairs, Vic., Australia.
Mitchell, P.D. and Chalmers, D.J., 1982. The effect of reduced water supply on peach tree growth and yields. J. Am. Soc. Hortic. Sci., 107: 853-856.
Mitchell, P.D. and van den Ende, B., 1979. Irrigating Tatura trellis orchards. Agnote Agdex 210/566, Dep. Agric. Rural Affairs, Vic., Australia.
Mitchell, P.D., Jerie, P.H. and Chaimers, D.J., 1984. The effect of regulated water deficits on tree growth, flowering, fruit growth and yield. J. Am. Soc. Hortic. Sci., 109: 604-606.
Mitchell, P.D., van den Ende, B., Jerie, P.H. and Chalmers, D.J., 1989. Responses of Bartlett pear to withholding irrigation, regulated deficit irrigation and tree spacing. J. Am. Soc. Hot- tic. Sci., 114: 15-19.
Miyamoto, S., 1983. Consumptive water use of irrigated pecans. J. Am. Soc. Hortic. Sci., 108: 676-681.
Natali, S., Xiloyannis, C. and Barbieri, A., 1985a. Water consumption of peach trees grafted on four different rootstocks. Acta Hortic., 173" 355-362.
Natali, S., Xiloyannis, C. and Mugano, M., 1985b. Water consumption in high density peach trees. Acta Hortic., 173: 413-419.
Ruggiero, C., 1985. Responses of orange and young apricot trees to different water regimes. Acta Hortic., 171: 427-440.
Westwood, M.N. and Roberts, A.N., 1970. The relation between trunk cross-sectional area and weight of apple trees. J. Am. Soc. Hortic~ Sci., 95: 28-30.
Worthington, J.W., Marshall, M.J. and Rodrigue, P., 1984. Water requirements of peach as recorded by weighing lysimeters. HortScience, 19:90-91.