Embed Size (px)
Citation preview
Growth of Employee-Benefit Plans, 1954-h 1
This year’s rcvicw of cmploywbcncfit plans, l&c those plcpn~cd in eu&‘c~ &D-S by the Social Scrzrrity Administration, pwsents data on covcmge, contribrc- tious, and bww$is. Special ronsidcration is given in the cwrcnt survry to dewlopm&s during the past dwadc in thP jkld of privatr pension plans, which inucasingly aTr providing bcncjits suppkm&ary to those Tuu~lcr the Federal program of old-age, survivors, and disability insurance.
THE GROW:TH of employee-benefit plans from 19.54 through 1961 may be measured in several lvays. One index of their increase is the amount of employer and cmployec contributions, which almost, doubled in 1954-61, and another is the amount of bcncfit outlays, which advanced 148 percent. The most, mclaningful index is coverage. Seventy-eight percent of thr Nation’s employed wage and salary labor forw had life insurance coverage’ at the end of 1961, compared with 56 percent in 19.54. Seventy percent had some form of health insurance, com- pawd with 59 prrccnt in the earlier year. Of the nongovcrnmcnt wage and salary labor force, 45 percent had the protection of private pension plans in 1961 and 31 percent in 19.54. The extent of their covcrage under plans providing temporary disa- bility insurance has leveled off, rising only 2 pcr- ccntagc points to 52 percent in 1961.
An “rmployw-benefit plan,” as dcfinrd here, is any typcl of plan sponsored or initiated unilaterally or jointly by c,mploytrs and rmployccs and pro- viding btncfits that stem from the employment relationship and that are not, underwritten or paid dircrtly by government (Fcdrral, Statct, and locsal). In gcnrral, the intent is to include plans that pro- vidc in an orderly, prcldctcrmincld fashion for (1) income maintcnanrc during periods when rrgular earnings arc cut off bccausr of death, acridcnt, sick- ncss, rrtircmcnt, or urwmploymcnt, and (2) hcncfit,s to meet spc~rifit~d expc’nscs usually associated with illntss or injury. Thr scrics thus cscludrs such fringe bcncfits as paid vacations, holidays, and rest
*Division of Rrwsrrh and Statistics. l~krrliw :trticlvs in this series havr appeared in the iLInrrh or .4pril issrrw of thcl Rd- letin.
4
by ALFRED M. SKOLNIK*
periods; leave with pay (except formal sick leave); savings and stock-purchase plans; discount pri- vileges; and free meals.
Private plans written in compliance with State temporary disability insurance laws are included in the series, but workmen’s compensation and statutory provisions for employer’s liability are excluded. This decision is based on several considerations.
First, the private temporary disabilit’y plans, many of which were initiated before the passage of the compulsory laws, are strongly voluntary and flexible in character-especially with respect to benefit provisions. They are thus unlike the work- men’s compensation programs, which rarely deviate from the statutory pattern.
Second, the data on the relative extent and nature of the protection existing through privat’c arrange- ments against t,ht risk of nonoccupational disability would be gwatly distorted if that segment of private coverage written under the compulsory lams were omitted. Compulsory workmen’s compensation programs, on the other hand, arc’ in operation in all States, and thrir omission makes no distortion in the national pirturt such as omission of coverage in only a few States would create.
Third, the tc,rm “employee-benefit plan” as com- monly used, understood, and accepted by manage- ment, labor, government, and other interested parties embraces private temporary disability (wage-replawmcnt) insurance. Workmen’s com- pcnsat,ion, in contrast, bccauw of its long, historical government-legal background, has t,raditionally brcn regarded as outsidtl the purview of “fringe” bcnrfits, which arc normally srtbjcrt to bargaining or sponsorship by employers and employees.
Government, c~mployws who are covered by c,mployrc-brnefit plans that arc undcrwritttn by nongovcrnmcntal agt>rwics arc includrd in the series, whcthrr or not t,hc govtxrnmrnt unit cont,ributes (as an cmployrr) to the financing of the program. Spwifically involwd hrrr arc plans providing gowrnmr~nt rmployws with group lift insurance, awidrntal drath and dismc~mbcrmrnt insurance, and hospital, surgical, wgular mrdical, and major medical c~xpc~nsr insuranw. Excludrd arc rrtircl- mcnt and sick-lravt, plans for governmc~nt em-
SOCIAL SECURITY
ployees, mherc the government in its capacity as employer pays benefits directly to its employees.
Coverage
Only one major type of employee-benefit plan showed a 1961 increase in employee coverage that was substantially greater t,han that, rcgistSercd in 1960 (table 1). This was lift, insurance, n-hirh increased its coverage by 2.5 million to reach a high of 45.9 million. The new group life insuranw pro- gram instituted for an estimated 500,000 nonoperat- ing railroad cmployccs is partly responsible for this growth.
Even major medical cxpcnsc insurance, which has enjoyed phenomenal growth in the past decade, registered merely the same numerical gain in covcr-
EXPERIENCE IN 1961
Employee-benefit plans continued to grow in 1961 as a significant element in the economic secur- ity structure that has devcloped since the 1930’s to meet the contingencies of old age, death, accident, disability, unemployment, and the costs of medical care. Despite the continuing growth in coverage, contributions, and benefits, in recent years there has been some slackening in the rate of increase.
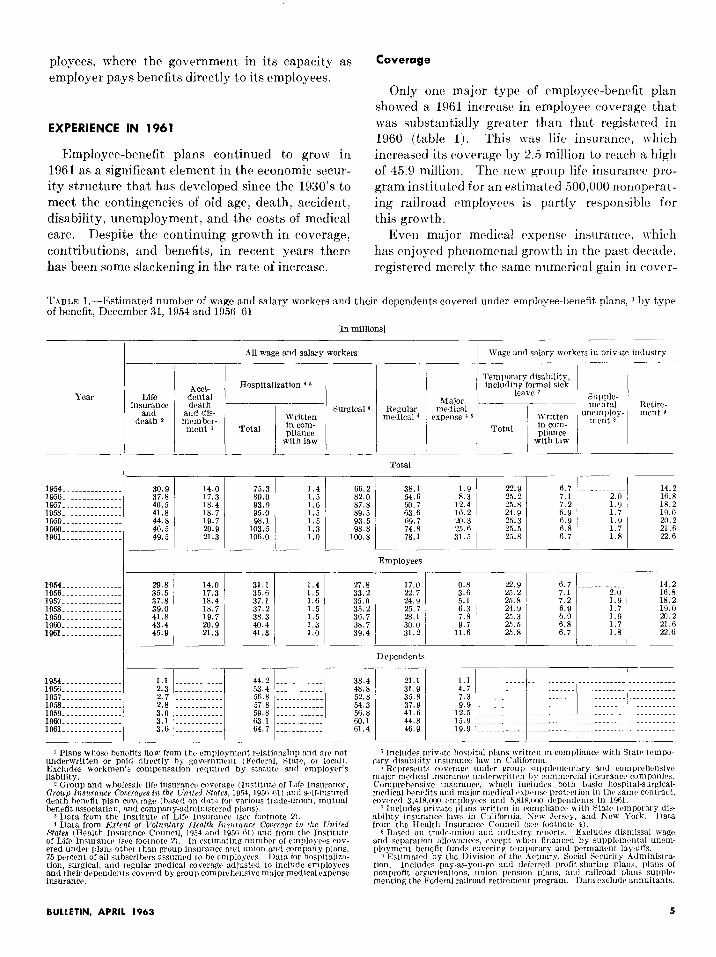
TABLE l.-Estimated number of wage 2nd salary workers and their dependents covered under employee-benefit plans, 1 by type of benefit, December 31, 1954 and 1956-61
[In millions]
I 811 wage and salary workers Wage and salary workers in private industry
Temporary disability, AC& Hospitalization 4 5 including formal sick
Life %%!
leevc 7 insurance ?vlsjor
and and dis- Surgical 4 Regular medical %%% Retire- “lent 9
death 2 member- Written medical 4 expense ’ 6 1 Written “lent 3 Total in corn-
u”c$“~l,Y-
Total in can- p1iance
I I
pliance with law with law
Total
38.1 54.F 60.7
Z:” 74.; 78.1
1.9 1 22.9 6.7 8.3 I 25.2 7.1
12.4 25.8 7.2 16.2 24.9 6.9 20.3 25.3 6.9 25.6 25.5 6.8 31.5 23.8 6.7
1.4 1.5 1.6
66.2 82.0 87.8 89.5 93.5 98.8
100.8
14.2 2.0 16.8 1.9 18.2 1.7 19.0 1.9 Xl.2 1.7 21.6
I 1.8 22.R
1954.....-.-..-..-. 30.9 14.0 1956.....-...a 37.8 17.3 1957.......-....... 40.5 18.4 1958.-.....--....- 41.8 18.7 1959.............-. 44.8 19.7 1960.. . . . . . . . . . . . . . 46.5 20.9 1961...- . . . . . . . . .._ 49.5 21.3
75.3 89.0 93.9 95.0 98.1
:;::I5
1.5 1.5 1.3 1.0
Employees
, / I I I I I 31.1 1.4 35.6 1.5 37.1 1.6 37.2 1.5 38.3 1.5
27.8 17.0 0.8 22.9 6.7 .-._..____.. 14.2 33.2 22.7 3.6 25.2 7.1 16.8 35.0 24.9 5.1 25.8 7.2
f:“, I 18.2
35.2 25.7 6.3 i 24.9 6.9 1.7 19.0 36.7 28.1 i.8 25.3 6.9 1.9 20.2 38.7 9.7 25.5 6.8 1.7 2l.fi 39.4 11.6 25.8 6.7 1.8 22.6
1954...........-.- 29.8 14.0 1956 ._... . . . . -.- ~. 35.5 17.3 1957-...-...-...... 37.8 18.4 1958.........-..... 39.0 18.7 1959.. ._....._.._.. 41.8 19.7 1960..- ._... 43.4 20.9 196..--...-.- .._.. 45.9 , 21.3
1.3 1.0
I I I I I I
Dependents
44.2 I...._....... 38.4 53.4 ‘...-.- 48.8 56.8 / . . . . . . . . . . . 52.8 57.8 . . . . . . . . . . -~ 54.3 59.8 . . . . . . . . ..~. 56.8 63.1 . . . . . . . . . . ~~ 60.1 64.7 __.......... 61.4
21.1 31.9 35.8 37.9 41.6 44.8 46.9
1954...-.-.-.---.-. 1.1 .- _._._.. -.. 1956.-........ 2.3 -...~ . . . . . . 1957....--...-.-... 2.7 ..~ . . . . . . . . 1958.....-......-.. 2.8 . . . . . . 1959.-....-... 3.0 _........... 196l.....-.....--. 3.1 ~~ . . . . . . . . . 1961.. ._.____..._.. 3.6 .- . . . . .
1 Plans whose benrfits flow from the employment relationship and nrc not underwritten or paid directly by govcrmnwt (Federal. Starr*, or IocW. Excludes workmen’s comprnsation rrquiwd by stat,utr and cmploycr’s liability.
2 Group and nholesalc lifr insurancr covcragr’ (Institut,? of LIfc Insuranre, aroup Insurance Cowrnqrs in the Lrniled Stnfrs, 1954, 195&61~ rind wlf-insured death hcncfit plan covcragr (ha.& on data. for various tmde-union. mutual benefit association, and cornparry-sdnlinistrn,d r~lans).
1 Data from the InsLitutv of Lif(, Insurnnw (xc footnote 2). 4 Data from Extent of lbluntnry Iknlth I~~wrance Cotwnqe ia the C%ited
States (&altb Insurance Council, 1954 and 195fiAl) and from thl, Institute of Lift Insuranct~ fsw footnotr a. In cstimnting numhrr of cmplo~ct~s cov- ered under plans otbcr than group insurance and union and company plans. 75 pcrcrnt of all subscribers nssrmwd to hr ~mr~loyws. IMa for hospitalizn- tion, surgical, and regular mcdicnl cowrapc ndjnstc~d to include emglopces and their duprndents covered by group compwhensiw major medical expense insurance.
5 Includes private hospital plans writtw in compliance with Stat? ttmpo- rary disability insurnnce law m C:llifornia.
6 Rcprwnts cowragr rmdw group suppltmc~ntnry and comprrbcnsiw major nwdical insurarrn~ urrdcrwrittvn by commcraal insnranw cnmpnmcs. Comprehensive insurance, which includes both basic bospital-surgical- medicnl hcnrfits and major medical c~rwnsr protrction in tb(, samr contract, cowred 3,418,OoO unpl~yws and 5.818,OOO dependents in 19Al.
i Includes private plans written in compliance with State tcmpornry dis- ability insurancr lsws in Callrornia, Sew Jrrsry. and New York. I)ata from the Hcaltb Insurance Council (SW footnotc 4).
8 Bawd on tmdr-union and industry rcrrorts. Excludes dismisssl wage and separation allownnrer, rlxrpt wbcn finnncrd hy sur)plcmrrrtaI unem- ploymrnt hcnefit lunds covcrinp temporary and permanent lay-offs.
9 Estxnatcd hy the 1)ivision of thr I\ctuary, Social Security .4dministro- tion. Includes pay-as-you-go and d~~fwrcd profit-shnring ~lnns, plans of nonprofit organizatums. union pension plans, and railroad plans soIq& mating the Federal railroad retircmcnt progrun. Datacxcludr annuitants.
BULLETIN, APRIL 1963 5
age during 1961 as in the preceding year-l.9 mil- lion. The 1960 and 1961 increases, however, were the highest for the period under review and brought the total number of employees covered by this type of insurance to 11.6 million by the end of 1961.
The 1961 gains for practically all types of plan mere also lower than the 1959 advances, though higher than the increases in 1958. The short-lived recession of 1960-61, while having some dampening effect on the expansion of employee-benefit plans, obviously did not produce as great a slackening in growth as the one that occurred in the recession year 1958.
The same general picture prevailed with respect to dependents’ coverage, except that the 1961 ad- vances in coverage for surgical and regular medical benefits did not exceed even those of 1958. This development was offset by the growth in depend- ents’ coverage under major medical expense insurance. Four miilion more dependents were covered under that program in 1961 than in 1960, the greatest absolute (though not percentage) gain for any year since 1954-the first year for which the estimates were made,
The recent slowing down in the rate of growth of surgical expense insurance is clear from the widened gap between the number having hospital expense protection and the number with surgical expense protection. In 1954, 9.1 million more employees and dependents had hospitalization in- surance than surgical expense insurance. By 1959 this number had dropped to 4.6 million, and since then the difference has increased, amounting to 5.2 million by the end of 1961.
As in previous years, the plans providing tem- porary disability benefits showed the lowest gains. The total of 25.8 million employees covered for this type of benefit at the end of 1961 was only 300,000 higher than the number in 1960. Since 1954, these plans have expanded their employee coverage by only 13 percent. During the same period, the in- crease for life insurance plans was 54 percent, for hospital plans it was 33 percent, and for private retirement plans, 59 percent.
The slow growth in the temporary disability plans may have resulted partly from the shift in coverage that has taken place from private plans to State-operated funds under the compulsory laws of California and New Jersey. In California alone the number of workers under private plans dropped from a high of 1.6 million in 1957 to 1.0 million in 1961. For all private plans written in compliance
with the compulsory laws, coverage dropped from 7.2 million to 6.7 million during this period.
Plans providing supplemental unemployment benefits are the only type covering fewer employees in 1961 than in 1956, when they were first included in the series. Such plans are largely concentrated in the mass-production indust’ries, especially auto- mobile, farm-equipment, and steel manufacturing, that have experienced significant reductions in employment. For employees in other industries, such as apparel workers and longshoremen, em- ployer-financed funds have been developed that are especially designed to provide severance pay for permanent lay-offs caused primarily by automation or plant shutdown.’ The supplemental unemploy- ment data presented here do not include any esti- mates for plans that are limited to severance pay of this kind.
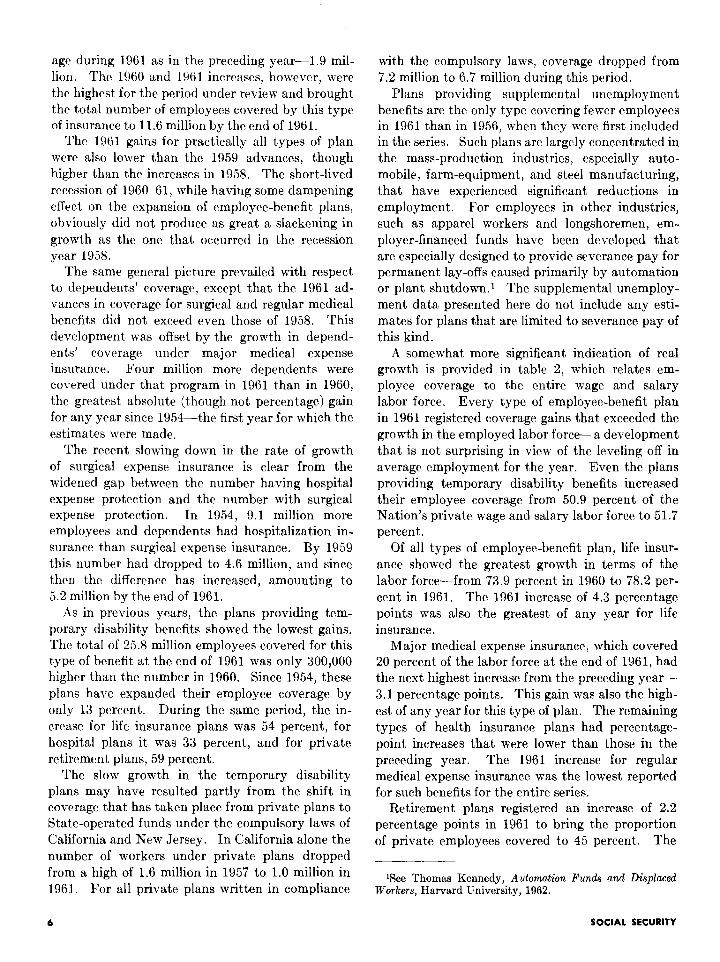
A somewhat more significant indication of real growth is provided in table 2, which relates em- ployee coverage to the entire wage and salary labor force. Every type of employee-benefit plan in 1961 registered coverage gains that exceeded the growth in the employed labor force-a development that is not surprising in view of the leveling off in average employment for the year. Even the plans providing temporary disability benefits increased their employee coverage from 50.9 percent of the Nation’s private wage and salary labor force to 51.7 percent.
Of all types of employee-benefit plan, life insur- ance showed the greatest growth in terms of the labor force-from 73.9 percent in 1960 to 78.2 per- cent in 1961. The 1961 increase of 4.3 percentage points was also the greatest of any year for life insurance.
Major medical expense insurance, which covered 20 percent of the labor force at the end of 1961, had the next highest increase from the preceding year- 3.1 percentage points. This gain was also the high- est of any year for this type of plan. The remaining types of health insurance plans had percentage- point increases that were lower than those in the preceding year. The 1961 increase for regular medical expense insurance was the lowest reported for such benefits for the entire series.
Retirement plans registered an increase of 2.2 percentage points in 1961 to bring the proportion of private employees covered to 45 percent. The
‘See Thomas Kennedy, Automation Funds and Displcwd Workers, Harvard University, 1962.
6 SOCIAL SECURITY
average annual increase since 1934 has been 2.0 percentage points.
It should be noted that a measure of growth based on the relationship of coverage to the employed labor force has certain limitations. The coverage estimates are based for the most part on reports by private insurance companies and other nongovern- ment agencies. The insurance industry generally bases its reports on active participants (in a plan) -a group not necessarily restrict)cd to wage and salary workers currently employed.
Some group life and health insurance policies are sold, for example, to trade, farm, professional, and other associations, including veterans’ groups and credit unions, that include in their membership persons not in the wage and salary labor force. Active participants may also include persons who have been laid off or retired. The practice of con- tinuing the covcrage of a rctircd worker as a mem- ber of the existing group is particularly prevalent, in group lift insurance and is becoming increasingly significant in group health insurance. Many group plans permit a person who is temporarily laid off to continue his group covcrage, on payment of pre- miums, for 3-6 months or even longer.
No attempt has bwn made in this series to adjust the covrragc data on health and \vcllfnrc plans for any overstatement resulting from the inclusion of persons who are laid off, retired, or otherwise not currently employed as n-age and salary workers.? Conceptually, a good case can be madr for including retired and laid-oft workers, since it can be argued that the bcncfits paid to them certainly stt>m from the employment relationship. Moreover, if their number doc>s not fluctuate wildly from year to year, the absolute figures lend tht>mselves to trend analysis without too much distortion.
A special problem does dcvclop, however, when attempts are made to relut,r t,hc number of workers covered to the total employed labor force during a downward swing in the business cycle. Ratios so computed are bound to ovcrstatcl t,hc extent, of pro- tection since the numerator of the fract,ion n-ill be unduly inflated by the inclusion of persons who are temporarily or permanently laid off and who are no longer included in the denominator. Thus, any use
2iZn understatement of coverage under health insurance may result, to the extent that working wives rhoose coverage through their husband’s group plan rather than their own.
TABLE 2.-Coverage and contributions under employee-benefit plans, * by type of benefit, in relation to employed wage and salary labor force and payroll, 1954 and 1956-61
Life insurance
and death
Acci-
%%’ and dis- member-
merit
Hospital- ization Surgical Regular
medical Major
medical expense
Temporary disability, z%- Rrtire- including
fOrUS UllNllplO~- merit
sick leave ment
Covered employees as percent of all wage and salary workers s Covered employees as percent of wege and salary workers in
private industry 3
1954 _._______ -.-_- ___. I??,” 26.4 56.7 52.5 32.1 31.0 1956 _..___.__ --- _..._.
660 30.4 62.3 58.5 40.0
ii:: $Lj ..- _...... i:i- 34.2
1957...- __.._. -.- . . . . . . .._. 32.2 64.6 61.2 9.0 52.2 3.t 36.9 1958-..- ._.___._.... -- _.___ 1959...--.~..--..-...- ..___
%:: Z 66.5 62.9 44::05
11.2 39.7 2’7 63.6 48.7 2:: 51.2
52.0 I;! 40.9
1960 .___._.._. -- . ..__ --__-. :i:i 35.5 65.9 51.0 50.9 43.1 1961_________-... .___.--- 36.2 70.2 67.1 53.1 19.7 51.7 3.6 45.3
Employer and employee contributions as percent of all wages and sslsrles ’
I / I
Employer and employee contributions
60.37 6 .41 6 .45 6 .47 6 .48 6.49 6.53
0.01
:?I:: .I2 .14 .18 .24
as percent of wages and salaries in private industry 6
/ 0.48 ____----------
.48 0.07
.52 .09
.54
.52 2
.53 .05
.54 .05
2.13 2.16 2.31 2.38 2.43 2.36 2.35
1 Plans whose benefits flow from the employment relntionship and are not underwritten or paid directly by gowmment (Federal, State. or locnl). Excludes workmen’s compensation required by statute and employer’s liability.
2 Coverage of privntr and public employees related to average number of private and government full-time and part-time employees-58.7 million in 1961 (Tahlc VI-14 in C. S. Income and Output, .4 Supplement to the S’vrW’ oJ Current Business, 1958, and in Suraey oJ Current Buiness, National Inconle Number. J..,-. 1 nco\
u,y LJUL,. 3 Covers ge of private employees related to wage and salary employed labor
BULLETIN, APRIL 1963
I I I I
force in private industryA9.8 million in 1960 (from table VI-14 in sources listed in footnote 2).
’ Amounts for private and public employees related to private and govern- ment wages and salaries-$265.6 billion in 1961 (from table VI-2 in sources listed in footnote 2).
5 Amounts for private cmployws rrlet?d to wages and salaries in private industry-$2’2i.O hillion in 1961 (from table VI-2 in sources listed in footnote 2).
6 Data on contributions for surgical and regular medical bencEts not avail- able separately.
7
of the year-to-year changes in t’he index must take into consideration concurrent changes in the eco- nomic situation, especially in employment.
Contributions
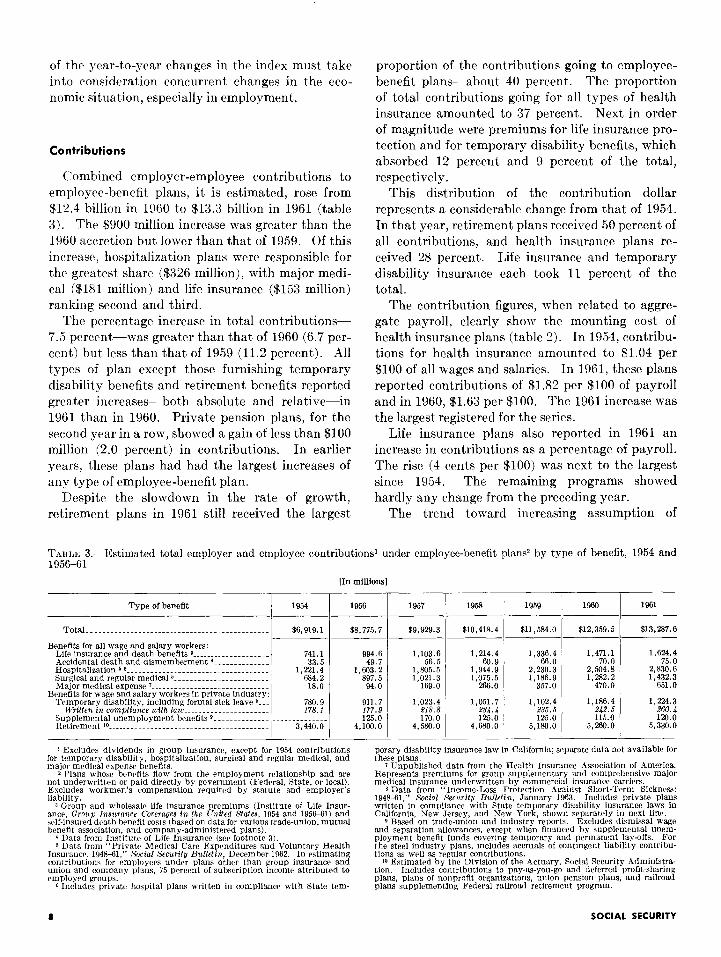
C’ombincd employer-employee contributions to employee-benefit plans, it is estimated, rose from $12.4 billion in 1960 to $13.3 billion in 1961 (table 3). The $900 million increase was greater than the 1960 accretion but lower than that of 1959. Of this increase, hospitalization plans were responsible for the greatest share ($326 million), with major medi- cal ($181 million) and life insurance ($153 million) ranking second and third.
The percentage increase in total contributions- 7.5 percent-was greater than that of 1960 (6.7 per- cent) but less than that of 1959 (11.2 percent). All types of plan except those furnishing temporary disability benefits and retirement benefits reported greater increases-both absolute and relative-in 1961 than in 1960. Private pension plans, for the second year in a row, showed a gain of less than $100 million (2.0 percent) in contributions. In earlier years, these plans had had the largest increases of any type of employee-benefit plan.
Despite the slowdown in the rate of growth, retirement, plans in 1961 still received the largest
proportion of the contributions going to employee- benefit plans-about 40 percent. The proportion of total contributions going for all types of health insurance amounted to 37 percent. Next in order of magnitude were premiums for life insurance pro- tection and for temporary disability benefits, which absorbed 12 percent and 9 percent of the total, respectively.
This distribution of the contribution dollar represents a considerable change from that of 1954. In that year, retirement plans received 50 percent of all contributions, and health insurance plans re- ceived 28 percent. Life insurance and temporary disability insurance each took 11 percent of the total.
The contribution figures, when related to aggre- gate payroll, clearly show the mounting cost of health insurance plans (table 2). In 1954, contribu- tions for health insurance amounted to $1.04 per $100 of all wages and salaries. In 1961, these plans reported contributions of $1.82 per $100 of payroll and in 1960, $1.63 per $100. The 1961 increase was the largest registered for the series.
Life insurance plans also reported in 1961 an increase in contributions as a percentage of payroll. The rise (4 cents per $100) was next to the largest since 1954. The remaining programs showed hardly any change from the preceding year.
The trend toward increasing assumption of
TABLE 3.-Estimated total employer and employee contributions’ under employee-benefit plans? by type of benefit, 1954 and 1956-61
Type of benefit 1954
I Total . . ..___......__._. --.-.__- _.... .__.. -...- ._._
- Benefits for all wage and salary workers:
Life insurance and death benefits 3 . . . .._._... -_._ Accidental d&h and dismemberment 4 ._._ --.__ Hospitalization56..- ._.......__._..._._..- _.... --.__ Surgical and regular medical 5.- _.........__..... ._.. Majormedicralexpense’....... ..__.. . ..-_ _... . . . . .
Benefits for wage and salary workers in private industry: Temporary disability, including formal sick leave a...
Written in compliance with law . . .._........ ~_-- . . . . . Supplemental unemployment benefits 8. . . . . . .._._... .._. Retirrmcnt 10~....-.....~.-.-....~~.~...-.....-.~.....
$6,919.1
741.1 33.5
1.221.4 684.2
18.0
7&x9 1%. 1
3,440.o
--
-
II” mlIlions1
1956 1957
b&775.7 $9,929.3
994.6 1,103.6 49.7 56.5
1,603.Z 1,805.5 897.5 1,021.3
94.0 169.0
911.7 1,023.4 177.9 218.8 125.0 170.0
4,100.o 4,530.o
1 Excludes dividends in group insurance, except for 1954 contributions for temporary disability, hospitalization, surgical and regular medical, and major medical ~xpcnse benefits.
2 Plans whose benefits flow from the employment relationship and are not undrrwrittrn or paid directly by government (Federal, State, or local). Excludes workmen’s compensation required by statute and employer’s liability.
3 Group and wholesale life insurance premiums (Institute of Life Insnr- ancr, Group Insurance Coverages in the L’nited Statep, 1954 and 195661) and self-insured death benefit costs (based on data for varwus trade-union, mutual benefit association, and company-administered plans).
4 Data from Institute of Life Insuranw (we footnote 3). 5 Data from “Private Medical Care Expenditures and Voluntary Health
Insurance, 1948-61,” Social Security Bulletin, December 1962. In estimating contributions for emgloyws under plans other than group insurance and union and company plans, 75 percent of subscription income attributed to rmploypd groups.
6 Includes private hospital plans written in compliance with State tem-
1953
$10,418.4
_- _- $11.534.0
1.214.4 1,336.4 1,471.l 60.9 66.0 70.0
1,944.g 2.230.3 2.504.8 1,075.5 1.186.9 1.282.2
266.0 357.0 470.0
I, 102.4 1,186.4 6%. 6 $49.6 125.0 115.0
5,180.o 5.260.0
1959
-
-_
--
-
1961
$13.287.6
1.6244 75.0
2,R30.6 1,432.3
651.0
1,224.3 660.4 120.0
5,330.o
~orary disability insurance law in California: separate data not available for these plans. t1
7 IJnpublished data from the Henlth Insurance Association of i\merica. Repr&nts premiums for group supplementary and comprehensive major Represents premiums for group supplementary and comprehensive major medical insurance underwritten by commercial insurance carriers. medical insurance underwritten by commercial insurance carriers.
8 Data from “Income-Loss Protection Against Short-Term Sickness: 8 Data from “Income-Loss Protection Against Short-Term Sickness: 194841,” Social Security &&tin, January 1%3. Includes private plans 194841,” Social Security &&tin, January 1%3. Includes private plans written in compliance with State temporary disability insurance laws in written in compliance with State temporary disability insurance laws in California, New Jersey, and New York, shown separately in next line. California, New Jersey, and New York, shown separately in next line.
9 Bawd on trade-union and industry reports. Excludes dismissal wage 9 Bawd on trade-union and industry reports. Excludes dismissal wage and separation allowances, except when financed by supplemental unem- and separation allowances, except when financed by supplemental unem- ployment benefit funds covering temporary and permanent lay-offs. For ployment benefit funds covering temporary and permanent lay-offs. For the steel industry plans, includes accruals of contingent liability contribu- the steel industry plans, includes accruals of contingent liability contribu- tions as wrll as regular contributions. tions as wrll as regular contributions.
10 Estimated by the Division of the Actuary, Social Security i\dministra- 10 Estimated by the Division of the Actuary, Social Security i\dministra- tion. Includes contributions to pay-as-you-go and deferred profit-sharing tion. Includes contributions to pay-as-you-go and deferred profit-sharing plans, plans of nonprofit organizations, union pension plans, and railmad plans, plans of nonprofit organizations, union pension plans, and railmad plans supplementing Federal railroad retirement program. plans supplementing Federal railroad retirement program.
0 SOCIAL SECURITY
health and welfare benefit costs by employers continued in 1961. The Health Insurance Institute reports, for example, that 39.7 percent of the workers included in a sample of new group policies issued by insurance companies in 1961 made no contribution to their own protection, in comparison with 33.6 percent in 1960.3 Paralleling develop- ments in the basic steel industry, the major union- negotiated agreements in the automobile industry in 1961 provided for full employer financing (pre- viously 50 percent) of hospital-surgical-medical benefits for active workers and .iO-percent company financing of similar benefits for r&red workers (previously met entirely by the retired workers). Company-paid health insurance was also extended to laid-off workers eligible for supplemental un- employment benefits. Under the agreements in the glass industry, a special employer-financed fund was established to assist employees in retaining group coverage for hospital benefits for at least 6 months after a layoff.
Surveys of collectively bargained health and welfare plans in California by the State Depart- ment of Industrial Relations show that the pro- portion of employees under noncontributory (em- ployer-financed) plans rose from 84 percent in 1956 to 88 percent in 1961.
A trend toward substantial employer financial
3Health Insurance Institute, Group Health Insurance Policies Issued in 1960 and Group Health Insurance Policies Issued in 1961.
participation has also taken place in rmployee- benefit plans for government employees. nIlring 1961, six States-Michigan, California, Connect- icut, Georgia, New Jersey, and Hawaii-estab- lished health insurance programs for their cm- ployees that are, at least in part, government financed. They thus joined the States, including New York, Massachusetts, Rhode Island, Vermont, Louisiana, Alaska, and Wisconsin, that had adopted such legislation in previous years. The Federal Government also put into effect on July 1, 1961, a health insurance plan for retired Federal employees and survivor annuitants, to which it contributed.
Beneflts
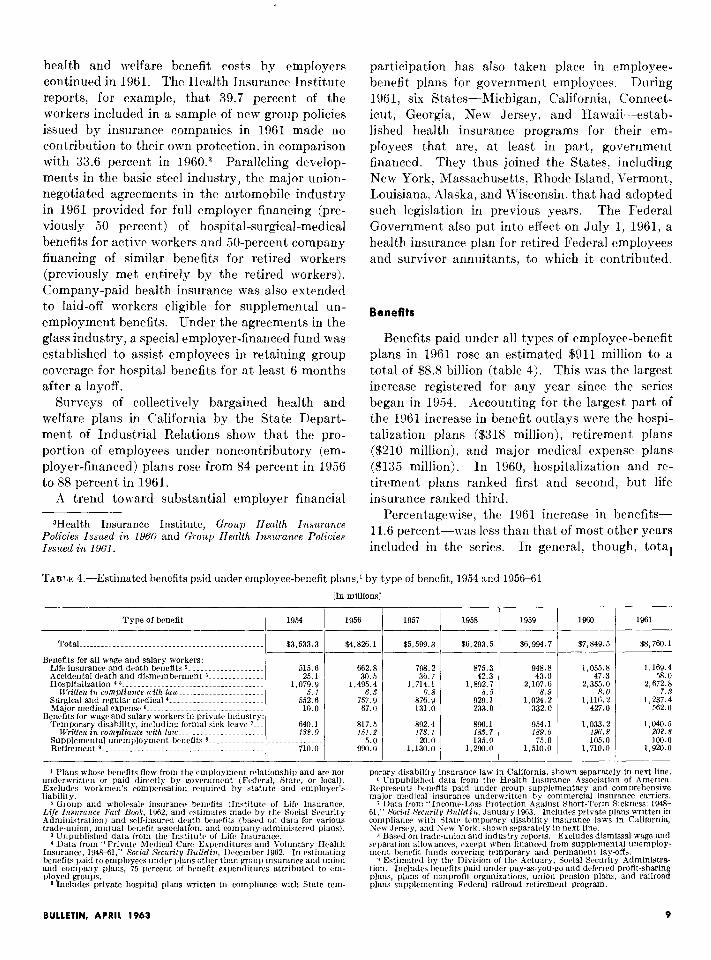
Benefits paid under all types of employee-benefit plans in 1961 rose an estimated $911 million to a total of $8.8 billion (table 4). This was the largest increase registered for any year since the series began in 1954. Accounting for the largest part of the 1961 increase in benefit outlays were the hospi- talization plans ($318 million), rctiremcnt plans ($210 million), and major medical expense plans ($135 million). In 1960, hospitalization and re- tirement plans ranked first and second, but life insurance ranked third.
Pcrcentagewise, the 1961 increase in benefits- 11.6 percent-was less than that of most other years included in the series. In general, though, total
TABLE 4.--Estimated benefits paid under employee-benefit plans,’ by type of benefit, 1954 and 1956-61
[In millions]
Type of benefit j 1g54 I_
Total.... . . .._.......... ~~ . . . . . . . . . . . .._...........
Benefits for all wage and salary workers: Life insurance and death benefits 2- . . . . .._.._..._.... Accidental death and dismemberment 3- ._......_....
Ui,itten in compliance with law . .._ ._..._.... ._.... Surgical and regular medical a .._........._. _..._.... Major medical expense 6 . . . . . . .~ . . . . . . . . . . . . . .._ ~~..
Benefits for wage and salary workers in private industry: Temporary disability. inclndinz formal sick leave I...
W&en in compli&ee with &mm...- . . . . . . . .._.. Supplemental uncmploymcnt benefits 8 . .._....._... Retirerncnt~.......~-~.....-......~-......-.....-....
$3,533.3 ~-
515.6 25.1
1r07::Y 552.6
10.0
640.1 132.0
710.0
1956
$4.826.1
1
IM2.8 30.5
,495.4 6.3
757.9 67.0
-
1 Plans whose benefits flow from the employment relationship and arc not underwritten or paid directly hy govrrrmwnt (Federal, State. or local). Excludes workmen’s compensation required hy statute and employer’s liability.
2 Qroup and wholesale insurance benefits (Institute of Life Insurance, Life Insurance Fart Rook. 1962. and estimates made by the Social Security Administration) and self-insured death benefits (bawd on data for various trade-union, mutual benefit association, and compnny-administered plans).
J Unpublished data from the Institute of Life Insurnncc. 4 Data from “Private Medical Care Expenditures and Voluntary Health
Insurance, 1948V61,” Social Security Hull&n, Drccmbrr 1962. In estimating benefits paid to employees under plans other than group insurance and union and wmoanv plans. 75 percent of benefit rxpenditurrs attributed to em- ployed tiouris.’ -
5 Includes private hospital plans written in compliance with State tem-
I
1957
$5,599.3
798.2 875.3 948.8 1.055.8 1.169.4 36.7 42.3 43.0 47.3 58.0
l,i14.1 1,892.7 2,107.F 2.355.0 2,672,s 6.8 8.5 a.9 a.0 7.9
876.9 929.1 1,024.2 1,116.Z 1,237.4 131.0 233.0 332.0 427.0 562.0
892.4 178.1 20.0
1,130.o L
896.1 954.1 1,033.2 183.7 tag. 6 196.) 135.0 75.0 105.0
1,290.o 1,510.o 1,710.o
1.040.5 t02.3 100.0
1.920.0
1958 1959 1960 .-
$6,293.5 %6,9!44.7 $7,849.5 .___
1961
$8,760.1
porary disability insurance law in California, shown sepwatrly in next line. 6 Vnpublishcd data from the Health Insurance -4ssociation of .4mcrica.
Represents hrrwfits paid under group supplementary and comprehensive major medical insurance underwritten by commercial insurance carriers.
7 Data from “Income-Ixxs Protection Against Short-Term Sickness: 1948- 61,” So&l Security Hu&tin, January 19% Includes private plans written in compliance with State temporary disability insurence laws in California, NW Jersey, and Sew York. shown separately in next line.
8 Bawd on trod+union and industry reports. Excludes dismissal wage and separation allowances, except when financed from supplrmenthl unemploy- ment hen& funds covering temporary and permanent lay-offs.
9 Estimated by the Division of the Actuary, Social Srcurity .4dministrs- tion. Includes benefits paid under pay-as-you-go and deferred profit-sharing plans, plans of nonprofit organizations, union pension plans, and railroad plans supplementing Federal railroad retirement program.
BULLETIN, APRIL 1963 9
benefit outlays have risen at a fairly smoot,h rate in recent years: 12.4 percent in 1958, 11.1 percent in 1959, and 12.2 percent in 1960.
All the major types of plans except those furnish- ing temporary disability benefits shared to about the same extent in the growth in benefit expendi- tures. Lift insurance benefits advanced by 11 per- cent from 1960 to 1961, hospital benefits by 13 per- cent, surgical and medical benefits by 11 percent, and ret’irement benefits by 12 percent. These in- creases differ little from those registered in the pre- ceding year. Temporary disability benefits in- creased less than 1 percent in 1961, but they had increased 8 percent, in the preceding year.
3Iajor medical expense insurance, which is de- signed to pay the especially heavy costs of catas- trophic or prolonged illness, continues to be the fastest-growing typr of employee-benefit plan. The dat)a given here refer exclusively to the benefits provided by commercial insurance carriers. Com- parable benefits provided by Blue Cross-Blue Shield and prepayment group-practice plans are included in table 4 under hospitalization and under the surg- ical and regular medical cxpcnsc category. To get a complete pict,ure of the amounts expended through employee-brncfit, plans for these categories, it would be necessary to distribute the major medical expenditures by type of service. The Health In- surance Association of America has estimated that, of the &X2 million in brncfit outlays under group major medical expense insurance in 1961, about, $307 million was for hospital expense and the balance for surgical and other medical expenses.
Primarily because of the sharp growth of major medical expense insurance, health insurance plans have been consuming an ever-increasing portion of thr benefit dollar. The major medical expense pro- grams, which accounted for less than 1 percent of benrfit,s in 1954, took 6 percent by 1961. Other types of health plan, while steadily increasing their dollar expenditures, hare no more than maint,ained their relative shares of the t,otal.
In 1961 as in 1959 and 1960, retirement, plans made 22 percent, of all benefit expenditures; in 1954 they paid 20 percent of the total. Life insurance benefits were responsible for 13 percent of the total outlay in 1961, compared with 15 percent in 1954. Temporary disability benefits showed the greatest relative drop ; in 1954 they accounted for 18 percent of all benefit expenditures and in 1961 for only 12 percent.
The greatest number of changes that took place in
health and welfare plans in 1961 involved increases in benefits, made mainly to keep up with rising wages and the higher cost of hospital and medical care. In many instances real gains were registered. The automobile industry, for example, in its I961 union settlement agreed to extend from 120 days to 365 days per disability the period for provision of hospital care and payment of in-hospital medical expenses.
A number of plans under collective bargaining added new benefits. In the Bell telephone system, for example, several additional operating companies established major medical expense insurance pro- grams. Other companies extended existing life insurance or health insurance to retired or laid-off workers. A leading example is the Radio Corpora- tion of America, which negotiated with various unions a company-paid program of basic and major medical benefits for employees retiring after 15 years’ service and for laid-off workers for 6 months. Agreements were also negotiated with various com- panies to continue benefits to laid-off workers in the meatpacking, longshore, glass, and cement industries.
Growing concern about the threat to job and income security caused by teChnologica1 change or plant relocation led during the year to adoption of more provisions in collective bargaining agree- ments for severance pay and to a liberalization in supplemental unemployment benefit provisions. Under the 1961 agreements in the automobile and farm-equipment industries, maximum weekly pay- ments from the supplemental unemployment funds were raised from $30 to $40. The total benefit, including the amount of t’he State unemployment insurance benefits, was changed from 65 percent of take-home pay to 62 percent of regular straight- time pay before taxes (about 75 percent of take- home pay), plus $1.50 for each dependent up to four. The maximum duration of benefits was doubled-to 52 weeks. Supplemental unemploy- ment benefits were also provided for those working short weeks. In the meatpacking industry, pro- visions were made for “technological adjustment pay” for workers laid off with 5 years’ service. Both the automobile and meatpacking industries in- creased separation pay and introduced relocation allowances for employees transferred to other plants.
In other negotiations, such as those between the International Longshoremen’s and Warehouse- men’s Union and the Pacific Maritime Association,
10 SOCIAL SECURITY
a special mechanization and modernizat,ion fund was established to provide guarant,ced weekly wages for persons whose earnings are reduced because of automation. Certain death, disability, and early retirement benefits are also provided from this fund.
RECENT TRENDS IN RETIREMENT PLANS
Coverage
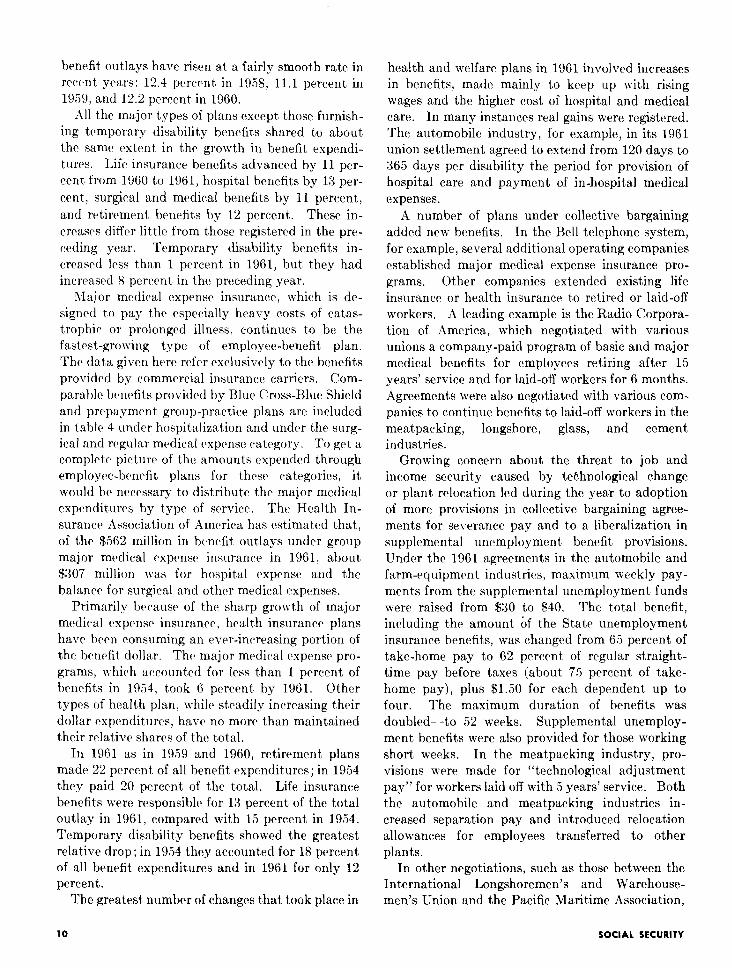
The number of workers covered by private pension plans and deferred profit-sharing plans increased by 1.0 million in 1961 to 22.6 million (ta,ble 5 and chart 1). This increase was smaller than that of 1960 (1.4 million) and 1959 (1.2 million) but larger than the gain in the 1958 recession year (800,000). The 1961 rate of growth-4.6 percent- was the lowest for any year in the period under review except 1958. Undoubtedly, a contributing factor to the 1961 slowdown was the economic situat,ion, which produced no advance in average employment for the year.
Of the total increase in 1961, 200,000 took place in insured pension plans and 800,000 in noninsured plans. At the end of the year the 17.5 million employees covered by noninsured plans represented 77 percent of total coverage. In 19.50 these plans covered 73 percent of the total.
Among the pension plans underwritten by in- surance companies, deposit administration plans4 cont’inued to grow more rapidly than group dc- ferred-annuity contract,s or individual policy trust plans. The deposit administration plans accounted for X5 percent of insured coverage at end of the year, compared with 23 percent in 1955 and 10 percent in 1950.6 They covered more than half the employees under the insured plans established during 1961.
The noninsured plans, generally funded through trustees, include corporate pension funds, multi-
4A deposit administration plan is a type of group annuity plan under which contributions are accumulated with interest in a central or pooled fund until an employee retires. .4t that time a lifetime paid-up annuity is purchased at the going rate by withdrawing the necessary premium from the fund. ITnder the conventional group deferred-annuity plans the annuity accruing to the employee is purchased annually and guaran- teed, with the yearly amount payable at retirement equaling the sum of the annual purchases. -4s a general rule, group annuity plans-unlike individual annuity plans-provide no life insurance benefits.
61nstitute of Life Insurance, The T&y of Life ZnszLrnnce Statistics, May 1962.
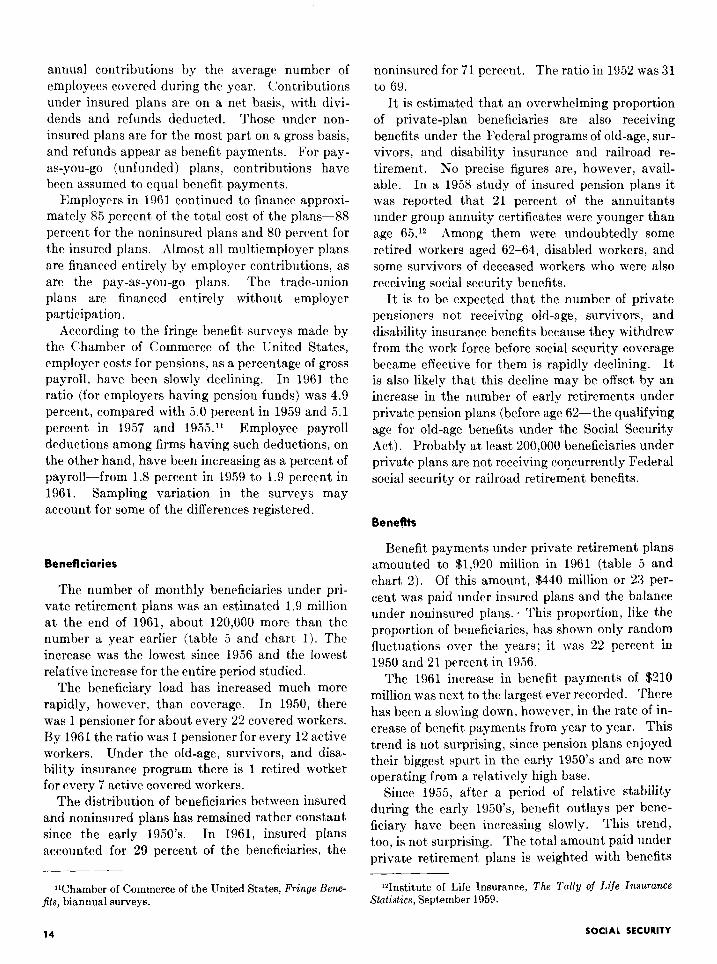
CHART l.-Cnvered workers and bcnrficiarics under nrivate pension and dcfcrred profit-sharing plans, at end of year, 1950-61
Millions of Persons
252
Beneficiaries I
0 I I I I I I I I 1 1950 ‘52 ‘54 ‘56 ‘58 ‘60 ‘62
cmploycr plans, pay-as-you-go plans, plans of non- profit organizations, union plans with no employer participation, and deferred profit-sharing plans. Under a trusteed pension plan, the necessary funds are annually deposited in a trust-usually managed by a bank or t’rust company that holds and invests the funds and pays benefits in accordance with the terms of the trust and the plan provisions.
Under a typical multiemployer pension plan a group of employers in the same area or industry make specified payments to a pooled central pen- sion fund, from which pensions are provided for their eligible workers. These plans are most’ com- monly found in the apparel, food, construction, mining, motor and water transportation, and service and trade indust,ries.
According to estimates made by the Bureau of Labor Statistics on t,he basis of data filed with the Department of Labor’s Officr of Welfare and Pen- sion Plans, about 3.3 million workers- active and retired-were covered by negotiated multiemployer pension plans in the spring of 1960.6 Such plans account for almost a sixth of the estimated number of workers, active and retired, covered by all private pension plans and for about a third of the estimated number under all collectively bargained plans. These plans have been growing in impor- tance. In 1950 only about a tenth of all covered
BBureau of Labor Statistics, M&iempZoyer Pension Plans Under Collective Bargaining, Spring 1960 (Bulletin No. 1326), June 1962.
BULLETIN, APRIL 1963 11
workers were under multiemploycr plans and in *Annuity Association, are included with all the 1954 about an Gghth. insured plans.
About a tenth of the workers under multiem- ployer pension plans had their benefits provided through an insurance company. The others had their benefits funded through a trust.
Plans t’hat make all benefit payments from cur- rent revenues or cash assets and do not accumulate reserves (generally through employer or employer- employee contributions) to meet future liabilities arc commonly termed “unfunded” or “pay-as-you- go” plans. A study by the Bureau of Labor Statistics, made at the request of and in cooperation with the Social Security Administration, revealed that an estimated 462,000 workers (active and re- tired) in private indust’ry in 1960 were covered under formal “unfunded” plans filed with the Office of Welfare and Pension Plans.7 Pay-as-you-go financing was also used by plans covering an addi- tional 904,000 workers to provide disability, death or other benefits that supplemented old-age benefits provided by funded plans.
Union-financed plans with no employer partic- ipation have been decreasing in importance, and many of them have been replaced by multiem- ployer or other negotiated plans. It is estimated that fewer t,han 1 million employees arc now covered exclusively by such trade-union plans.
A deferred profit-sharing plan is one in which the company’s payments into the retirement fund are partly or wholly dependent on annual profits. It is estimated that at the end of 1961 about 2.6 million employees were covered under such plans.
There is some overlap in coverage between plans of different types. Of the 2.6 million employees covered by deferred profit-sharing plans at the end of 1961, for example, it is estimated that two-thirds were also covered by regular pension plans. Simi- larly, some workers covered by trade-union plans (with no employer participation) are also members of multiemployer plans.
The noninsured plans of nonprofit organizations cover an estimated 200,000 persons, including employees in private schools, colleges, and universi- ties ; ministers and layworkers of churches; Red Cross workers; and others employed by charitable organizations. The insured plans of nonprofit organizations, such as college and university plans underwritten by the Teachers Insurance and
The Social Security Administration has made a review of existing pension surveys to determine to what extent employees may qualify for more than one pension from the same company.* These surveys indicate t,hat probably the number may be no more than 5-10 percent of all employees under pension plans. A typical arrangement provides for the first benefit to be paid by the company’s non-
‘Bureau of Labor Statistics, Prevalence and Characteristics of Zinfunded Pension Plans (Preliminary Release), January 1963.
*Joseph Krislov, Supplementary Private Pension Benej%s, Bureau of Old-Age and Survivors Insurance, Division of Pro- gram Analysis, May 1961.
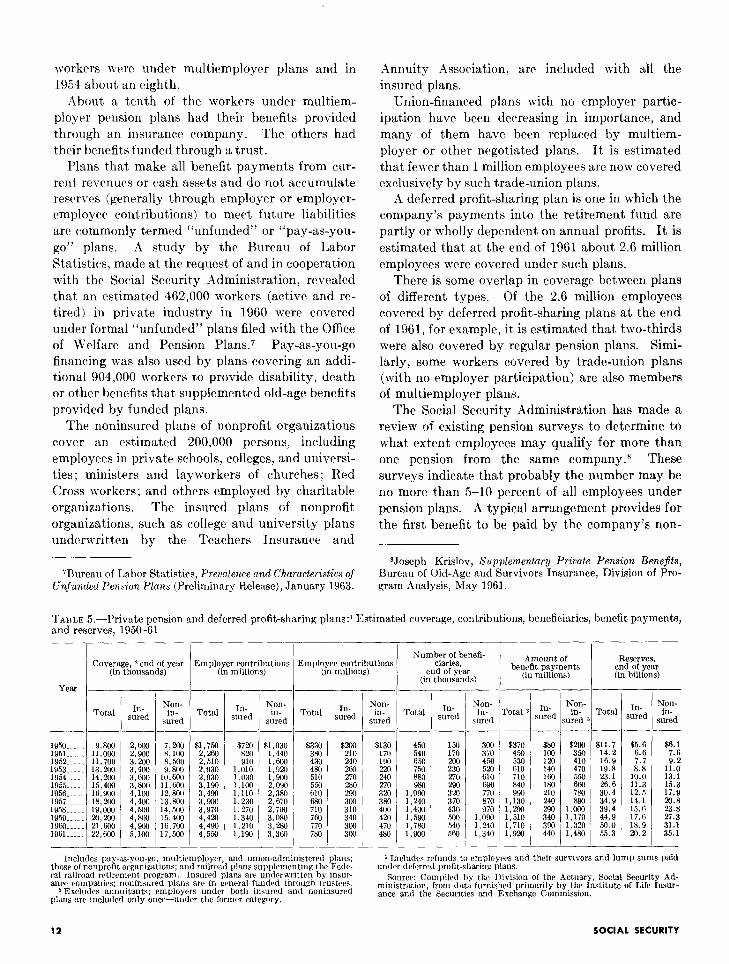
TABLE 5.-Private pension and deferred profit-sharing plans:’ Estimated coverage, contributions, beneficiaries, benefit payments, and reserves, 1950-61
-
Amount of benefit payments
(in millions)
NOD in-
inred _.
m3i f$
530 610 :2 710 160 840 1RO
1% 210 240
1.290 1,510 3? 1,710 1,920 z
3
_-
.ml 350 410 470 550
Et
1.Z 1,170 1,320 1,480
L i
Reserves, end of year (in billions)
Number of benefl- ciaries,
end of year (in thousands)
Employer contribution: (in millions)
i Employee contributions (in millions)
Coverage, *end of year (in thousands)
I
l- NOD
in- wed
Ill- sured
Non- in-
sured
300 370 4.50
I% 690 770 870
1,:: 1,240 1,340
Total In- sured
1950..... 9,800 2,ml 1951...__ 11,000 2.906 1952..... 11,700 3,200
1953..... 13,200 1954..... 14.200 %G 1955..... 15.400 3:800 1956..... 16,900 4, loo 19.57..... 18,200 4.4M1 1958..... 19,000 4,506 1959..... 20,200 4,800 1960 . .._. 21,600 4.900 1961..... 22,600 5.100
T T - _-
NOll- in-
sured
In- sured
$720 820 910
l.OlO 1 ,030 1,100 1,110 1,230 1,270 1,340 1,210 1,190
In- sured
Non- in-
sured
IQ- rured Total Total Total rota1
_-
i
Et n:500 9,800
10,606 11,600 12,x00 13,800 14,500 15.400 16,7W 17,500
SW 210 240
2
E 300 310 340 3wl 300
$130 170 190
2 no 320
g
470 480
450 540
% 880
1.Z 1,240 1,4Ml 1,590 1,786 1,900
150 170
g
290 320 370 430
2 5m
$11.7 14.2 16.9 19.8 23.1 26.6 30.4 34.9 39.4 44.9 50.0 55.3
$5.6 6.6 7.7 8.8
10.0 11.3 12.5 14.1
:::i 18.9 20.2
L
$6.1 7.6 9.2
11.0 13.1 15.3 17.9 20.8
S:3” 31.1 35.1
5 Includrs refunds to employers and their survivors and lump sums paid under deferred profit-sharing plans.
Source: Compiled by the Division of the Actuary, Social Security Ad- ministration, from data furnished primarily by the Institute of Life Insur- ance and the Securities and Exchange Commission.
SOCIAL SECURITY
1 Includes pay-as-you-go, multkmploycr, and union-administered plans; those of nonprofit organizations; and railroad plans supplcmcntinp th? Fed<,- ral railroad rrtiremrnt progxnn. Insured plans are undwwritten by insur- ance companies; noninsured plans arc in general funded through trustees.
2 Excludes annuitants; employers under both insured and noninsured plans arc included only once-under the former category.
12
contributory plan and the second by a supple- mentary plan, usually separately funded, to which employees contribute. Often the supplementary plan is limited to salaried employees and covers only earnings above a specified amount.
Allowance is made in table 5 for the overlap between plans of different’ types. Employees covered under both insured and noninsured plans are counted under the former category. The total number under noninsured plans is thus somewhat understated. The estimates of coverage exclude employees who have not yet met the age and/or service requirements for participation in the pension plan.
Since the coverage estimates are based in part on insurance industry reports that include persons who may be eligible for deferred paid-up annuities, even though no longer employed by the company with the plan, the coverage figures are somewhat overstated when they are related to the employed labor force.9 This overstatement may be of special significance during periods of recession, when the number of laid-off workers retaining vested rights to a pension may increase abnormally.
Contributions
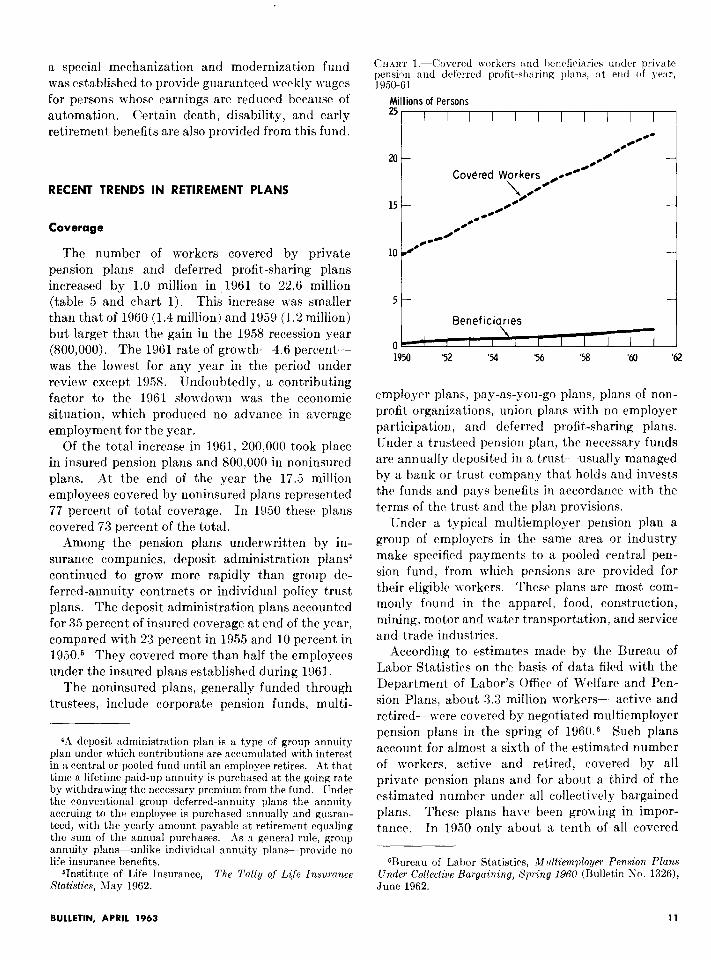
The increase in contributions under private pension plans for 1961 was even smaller than the coverage gains. Total estimated employer-em- ployee contributions of $5,330 million were only $70 million greater than the 1960 total (table 5 and chart 2). The increase was the smallest, absolutely and relatively, since the recession year 1954. In terms of total annual contributions per employee, the $241 average for 1961 was the lowest for the series that began in 1950.
The less-than-normal growth in contributions can be traced to several factors. As the result of Fed- eral legislation that gave insurance companies more equitable tax treatment on their pension-plan earn- ings from investment, the premium rates on group annuity policies have been dropping. Income from investment of reserves has been rising rapidly as a result of the accumulation of more and more assets on which to earn income and a shift within fund portfolios to assets with higher yields. The effect is
OFor noninsured pension plans the coverage data exclude, where possible, those who have left employment after having built up a vested right to a pension.
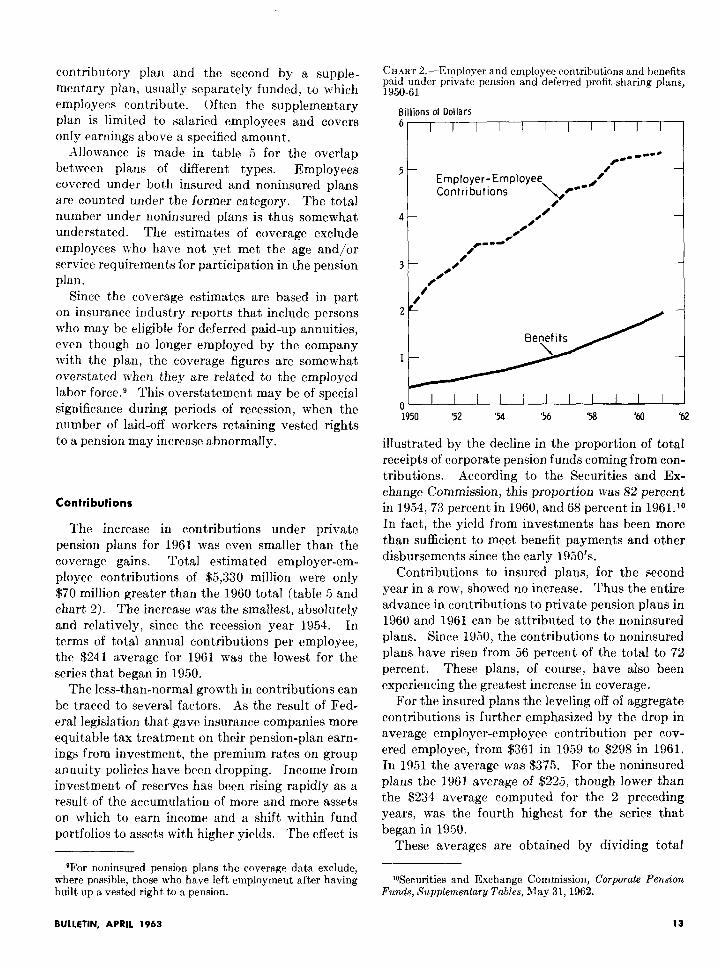
CHART 2.--F,mployer and employee contributions and benefits paid under private pension and deferred profit-sharing plans, 1950-61
;illions of Dollars
II I I I I I I I I I
0 I I I I I I I I I 1 1950 ‘52 ‘54 ‘56 ‘58 ‘60 ‘62
illustrated by the decline in the proportion of total receipts of corporate pension funds coming from con- tributions. According to the Securities and Ex- change Commission, this proportion was 82 percent in 1954, 73 percent in 1960, and 68 percent in 1961.1° In fact, the yield from investments has been more than sufficient to meet benefit payments and other disbursements since the early 1950’s.
Contributions to insured plans, for the second year in a row, showed no increase. Thus the entire advance in contributions to private pension plans in 1960 and 1961 can be attributed to the noninsured plans. Since 1950, the contributions to noninsured plans have risen from 56 percent of the total to 72 percent. These plans, of course, have also been experiencing the greatest increase in coverage.
For the insured plans the leveling off of aggregate contributions is further emphasized by the drop in average employer-employee contribution per cov- ered employee, from $361 in 1959 to $298 in 1961. In 1951 the average was $375. For the noninsured plans the 1961 average of $225, though lower than the $234 average computed for the 2 preceding years, was the fourth highest for the series that began in 1950.
These averages are obtained by dividing total
lOSecurities and Exchange Commission, Corporate Pension Funds, Supplementary Tables, May 31,1962.
BULLETIN, APRIL 1963 13
annual contributions by the average number of employees covered during the year. Contributions under insured plans are on a net basis, with divi- dends and refunds deducted. Those under non- insured plans are for the most part on a gross basis, and refunds appear as benefit payments. For pay- as-you-go (unfunded) plans, contributions have been assumed to equal benefit payments.
Employers in 1961 continued to finance approxi- mately 85 percent of the total cost of the plans-88 percent for the noninsured plans and 80 percent for the insured plans. Almost all multiemployer plans are financed entirely by employer contributions, as are the pay-as-you-go plans. The trade-union plans are financed entirely without employer participation.
According to the fringe benefit surveys made by the Chamber of Commerce of the United States, employer costs for pensions, as a percentage of gross payroll, have been slowly declining. In 1961 the ratio (for employers having pension funds) was 4.9 percent, compared with 5.0 percent in 1959 and 5.1 percent in 1957 and 195.5.” Employee payroll deductions among firms having such deductions, on the other hand, have been increasing as a percent of payroll-from 1.8 percent in 1959 to 1.9 percent in 1961. Sampling variation in the surveys may account for some of the differences registered.
Beneficiaries
The number of monthly beneficiaries under pri- vate retirement plans was an estimated 1.9 million at the end of 1961, about 120,000 more than the number a year earlier (table 5 and chart 1). The increase was the lowest since 1956 and the lowest relative increase for the entire period studied.
The beneficiary load has increased much more rapidly, however, than coverage. In 1950, there was 1 pensioner for about every 22 covered workers. By 1961 the ratio was 1 pensioner for every 12 active workers. Under the old-age, survivors, and disa- bility insurance program there is 1 retired worker for every 7 active covered workers.
The distribution of beneficiaries between insured and noninsured plans has remained rather constant since the early 1950’s. In 1961, insured plans accounted for 29 percent of the beneficiaries, the
noninsured for 71 percent. The ratio in 1952 was 31 to 69.
It is estimated that an overwhelming proportion of private-plan beneficiaries are also receiving benefits under the Federal programs of old-age, sur- vivors, and disability insurance and railroad re- tirement . No precise figures are, however, avail- able. In a 1958 study of insured pension plans it was reported that 21 percent of the annuitants under group annuity certificates were younger than age 65.12 Among them were undoubtedly some retired workers aged 62-64, disabled workers, and some survivors of deceased workers who were also receiving social security benefits.
It is to be expected that the number of private pensioners not receiving old-age, survivors, and disability insurance benefits because they withdrew from the work force before social security coverage became effective for them is rapidly declining. It is also likely that this decline may be offset by an increase in the number of early retirements under private pension plans (before age 62-the qualifying age for old-age benefits under the Social Security Act). Probably at least 200,000 beneficiaries under private plans are not receiving concurrently Federal social security or railroad retirement benefits.
Benefits
Benefit payments under private retirement plans amounted to $1,920 million in 1961 (table 5 and chart 2). Of this amount, $440 million or 23 per- cent was paid under insured plans and the balance under noninsured plans. . This proportion, like the proportion of beneficiaries, has shown only random fluctuations over the years; it was 22 percent in 1950 and 21 percent in 1956.
The 1961 increase in benefit payments of $210 million was next to the largest ever recorded. There has been a slowing down, however, in the rate of in- crease of benefit payments from year to year. This trend is not surprising, since pension plans enjoyed their biggest spurt in the early 1950’s and are now operating from a relatively high base.
Since 1955, after a period of relative stability during the early 1950’s, benefit outlays per bene- ficiary have been increasing slowly. This trend, too, is not surprising. The total amount paid under private retirement plans is weighted with benefits
“Chamber of Commerce of the United States, Fringe Bene fits, biannual surveys.
121nstitute of Life Insurance, The Tally of Life Insurance SkAtics, September 1959.
14 SOCIAL SECURITY
that reflect earnings levels and benefit formulas of earlier decades. Improvements and expansion of benefits under private pension plans in any year are for the most part not fully felt until many years have elapsed.
Precise data on average monthly or annual re- tirement benefit amounts cannot be derived from table 5, since the benefit payments reported include lump-sum benefits under noninsured plans. These benefits consist of (1) refunds of employee contribu- tions to individuals who withdraw from the plans before retirement, (2) payments of the excess of employee contributions to survivors of pensioners who die before they receive in retirement benefits an amount equal to their contributions, and (3) lump-sum payments made under deferred profit- sharing plans.
Among insured plans, the trend has been toward adopting plans that relate benefits to length of service alone, although plans that recognize both earnings and service still predominate. For ex- ample, according to a survey of 900 pension plans insured by the Connecticut General Life Insurance Company, 28 percent in 1961 used the former formula and 59 percent the latter.13 In a compar- able survey of 600 plans in 1957, the company re- ported proportions of 23 percent’ and 63 percent, respectively. The remaining plans used a combina- tion of the two formulas or the money-purchase approach, under which a percentage of annual salary is used to purchase as large an annuity as the premium rates at the employee’s age permit. The trend toward benefit’s based on service alone is attributed to the influence of union-negotiated plans.
Pension plans continue to bc revised mainly to raise the level of benefits. A rrvicw by the Bureau of Labor Statistics of 99 selected union-negotiated pension plans shows that 59 of the plans were revised between the winter of 1957-58 and the spring of 1951 to increase normal retirement bcne- fits for a given amount of service and carnings.la These changes, when translated into normal re- tirement benefits for a hypothet,ical worker retiring at age 65 with average annual earnings of $4,200 and 30 years of credited future service, show an
Wonnecticut General Life Insurance Company, Facts and Trends in Insured Pensions From an Analysis qf 900 GrouTI Plans, 1962.
14Harry E. Davis, “Recent Changes in Negotiated Pension Plans,” Monthly Labor Review, May 1962, pages 528-532.
increase from $178.6; in 1957-58 to $199.72 in 1961 in the prosprrtive avcragcl monthly rrtirrmcxnt benefit (including old-age, survivors, and disablity insurance bcnefit,s). Of t’his average increase of $21.07 a month, $13.57 was attributable to increase in privat)e-plan benefits and 57.50 to amendments in the Social Securit,y Act.
The year 1961 sari- additional liberalizations in benefits. The automobile workers ncgot,iated with the major car and truck manufacturers a raise, starting January 1, 1962, in the monthly pension from $2.50 to $2.80 for each year of service. Other increases in benefit levels n-erc negot,iatcd by unions in the elect,ricnl, communications, metalworking, woodworking, cement, and glas’s industries.
There was also further liberalizat,ion of the pro- visions concerning early retirement, disabilit,y, and vesting, which arose in part from concern over the impact of automation on older workers. A current trend under collective bargaining has been to pro- vide, in case of plant shutdowns, for early retire- ment benefits that, are larger than the actuarial equivalent of the normal retirement) pension. The agreement. negotiated in 1961 in the mratpacking industry with .$rmour and Company, for example, stipulated early retirement benefits at one and one- half times the normal benefit until bhc employee becomes eligible for benefits under the Social Security Act’. A\t that. time the company benefits would be rcduccd to normal ret,iremcnt benefits. Similar provisions had been negotiated earlier in the aubomobile and steel industries.
The study by the Connecticut General Life Insurance Company showed no general movement among private plans to follow t’he Federal program in lowering to 62 the retirement, age for women. The study showed, however, that the proportion of insured plans having early ret,irement options increased from 77 percent, in 1957 to 90 percent in 1961. Moreover, among the insured plans, the proportion that provide a level lifetime income to the retired employee, beginning before the Federal benefits are payable, rose from 48 percent in 1957 to 54 percent, in 1961.
T’est,ing provisions, which permit, an employee to t,crminatc his employment before retirement without, forfeiting the accrued pension resulting from his employer’s contribut)ions, have also con- tinued to grow, according to the Connecticut General study. Insured plans providing some form of vesting increased from 72 percent of the t,otal in 1957 to 76 percent in 1961.
BULLETIN, APRIL 1963 15
Partly as the result of the elimination of the age requirement for receipt of disability benefits under the Social Security Act, there has been a tendency to eliminate or lower the age requirement for disability benefits among private pension plans. The Na- tional In&trial Conference Board in a 1961 study of 695 pension plans with disability provisions found that 34 percent of the plans had some kind of age requirement (usually in conjunction with a service requirement). In an earlier survey of 327 com- panies with disability provisions in 1954, the Board reported that 40 percent of the plans had such a requirement. l5 Half the plans with an age re- quirement in 1954 stipulated at least age 55; the other half, age 50. In 1961, the proportion of plans with a qualification of age 55 or older had dropped to 27 percent, and those requiring age 50 had in- creased to .59 percent. In 14 percent of the plans the age qualification was less than 50 years.
The 1961 automobile settlement, reflecting the growing interest in survivor benefits, provided for an employer-subsidized joint-and-survivor option, eficctive January 1, 1963. The employee’s pension is reduced to 90 percent (and is further increased or decreased by M of 1 percent for each year the spouse is older or younger than the employee), with half the reduced pension payable to the surviving spouse on death. This arrangement is unusual in that the cost of a survivorship option is typically borne solely by the retiree.
The Department of Labor in its studies of 300 collectively bargained pension plans covering 4.7 million workers reports that in the winter of 1960- 61 only 6 percent of the plans, with 14 percent of the employees, provided benefits-usually flat amounts -to the survivors of a member who died before retirement.16 The proportions were somewhat higher for benefits payable to survivors of a mem- ber who died after retirement. About half the plans, with 39 percent of the membership, con- tained a survivorship option that allows covered workers to surrender part of their regular pension benefits to assure their survivors lifetime benefits.
‘Warland Fox, “Disability Pensions, 1961,” Management Record, September 1962, pages 16-20, and “Disability Pen- sions,” Management Record, June 1956, pages 194-197, 21% 221. Any comparison of the data from these two surveys must take into consideration the difference in the groups making up the samples for the 2 years. It is not known how many plans were common to both studies.
‘613ureau of Labor Statistics, Pension F’2ans 7Jnder Collective Bargaining: Benefits for Survivors, Winter 19fiO-fil (Bulletin No. 1334), August 1962.
A review by the Social Security Administration of survivor provisions in private pension plans indicates a similar picture among nonnegotiated plans. l7 These plans, however, are less likely to provide flat amounts. They are also more likely to permit a member--especially a salaried worker-to elect a survivorship option.
Department of Labor studies give some indica- tion of the growth in provisions for survivor bene- fits. For example, the 1957-58 study of 100 col- lectively bargained pension plans showed that seven were providing benefits to a survivor of a member who died before retirement; there were nine plans with this provision in the spring of 1961. The studies also showed 15 plans in the 1957-58 study and 21 plans in 1961 providing a benefit to the survivors of retired members. Finally, a joint-and-survivor option was provided in 43 plans in 1957-58 and in the later year 48 plans provided this option.
The Connecticut General study showed similar growth in survivor provisions among insured pen- sion plans. The proportion providing a survivorship option rose from 73 percent in 1957 to 82 percent in 1961.
Reserves
The dollar assets of retirement plans continued to grow at a higher-than-average pace during 1961. The rise of $5.3 billion in 1961 to a new high of $55.3 billion was the sharpest in the series except for the 1959 increase of $5.5 billion. Percent’agewise, how- ever, the 1961 increase of 10.6 percent was less than the average annual increase for the years under review.
Approximately 37 percent of the reserves was accumulated under insured plans in 1961; in 1950, the percentage was 48 percent. This drop, and the corresponding rise in the proportion of reserves accumulated by the noninsurcd plans, is partly attributable to the fact that many noninsured plans are relatively new. As they grow older, their assets increase in significance.
The average reserve per employee is much larger under insured plans than under self-insured plans. In 1961 the average amount per employee covered
“,Joseph Krislov, Survivor Benefits in Private Pension Plans, Bureau of Old-Age and Survivors Insurance, Division of Pro- gram Analysis (Analytical Note No. 13-62), June 1962.
16 SOCIAL SECURITY
in insured plans was $4,C40, and under noninsured plans $2,053. The relative difference has narrowed noticeably since 1950, when the average reserve per employee under insured plans was almost two and one-half times that under noninsured plans.
A continued shift in the composition of the portfolio of noninsured private pension plans is indicated by the reports of the Securities and Ex- change Commission. At the end of 1961, invest- ment in common and preferred stocks represented, on the basis of book value, 38 percent of total assets of corporate pension funds, compared with 35 per- cent a year earlier and 16 percent in 1951. The proportion of pension fund assets invested in United States Government securities declined from 32 percent in 1951 to 7 percent in 1960 and 6 percent in 1961. The holdings of corporate bonds, which were as low as 45 percent in 1951 and as high as 54 percent in 1957, declined from 49 percent in 1960 to 47 percent in 1961. The proportion of pension funds invested in mortages more than doubled from 1955 (the first year for which separate data are available) to 1961, rising from 1.0 percent to 2.8 percent.
The attempt to raise the proportion of assets
invested in common stock has meant that larger and larger proportions of the net cash inflow have been put into the stock market. During 1961 more than 55 percent of the net receipts of noninsured pension funds was used to purchase common stock, in comparison with 51 percent a year earlier and 24 percent in 1951.
The portfolio of the insured pension funds, in contrast, is concentrated in mortgages and bond holdings. (State laws generally require that in- surance companies invest in fixed income obliga- tions.) In 1961, 38.8 percent of insurance company reserves in general (which include pension reserves) was invested in corporate bonds, 9.2 percent in government bonds, and 34.9 percent in mortgages.‘8 Some change has taken place since 1951, when corporate bonds made up 38.1 percent of total holdings, government bonds 19.9 percent, and mortgages 28.3 percent. All other assets equaled 17.1 percent (including 4.9 percent in stocks) in 1961 and 13.7 percent (including 3.3 percent in stocks) in 1951.
‘%stitute of Life Insurance, Life Insurance Fact Book, 1963, page 67.
BULLETIN, APRIL 1963 17