Embed Size (px)
Citation preview
1
Growth of Himachal Pradesh Economy
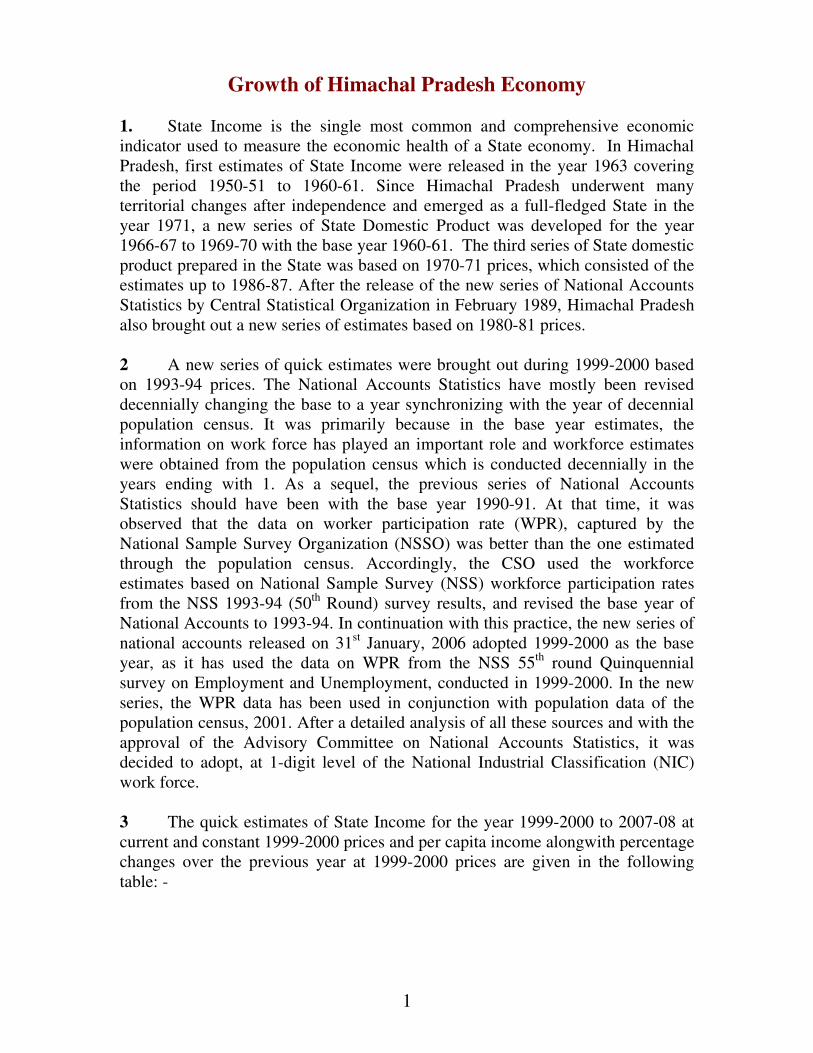
1. State Income is the single most common and comprehensive economic
indicator used to measure the economic health of a State economy. In Himachal
Pradesh, first estimates of State Income were released in the year 1963 covering
the period 1950-51 to 1960-61. Since Himachal Pradesh underwent many
territorial changes after independence and emerged as a full-fledged State in the
year 1971, a new series of State Domestic Product was developed for the year
1966-67 to 1969-70 with the base year 1960-61. The third series of State domestic
product prepared in the State was based on 1970-71 prices, which consisted of the
estimates up to 1986-87. After the release of the new series of National Accounts
Statistics by Central Statistical Organization in February 1989, Himachal Pradesh
also brought out a new series of estimates based on 1980-81 prices.
2 A new series of quick estimates were brought out during 1999-2000 based
on 1993-94 prices. The National Accounts Statistics have mostly been revised
decennially changing the base to a year synchronizing with the year of decennial
population census. It was primarily because in the base year estimates, the
information on work force has played an important role and workforce estimates
were obtained from the population census which is conducted decennially in the
years ending with 1. As a sequel, the previous series of National Accounts
Statistics should have been with the base year 1990-91. At that time, it was
observed that the data on worker participation rate (WPR), captured by the
National Sample Survey Organization (NSSO) was better than the one estimated
through the population census. Accordingly, the CSO used the workforce
estimates based on National Sample Survey (NSS) workforce participation rates
from the NSS 1993-94 (50th
Round) survey results, and revised the base year of
National Accounts to 1993-94. In continuation with this practice, the new series of
national accounts released on 31st January, 2006 adopted 1999-2000 as the base
year, as it has used the data on WPR from the NSS 55th
round Quinquennial
survey on Employment and Unemployment, conducted in 1999-2000. In the new
series, the WPR data has been used in conjunction with population data of the
population census, 2001. After a detailed analysis of all these sources and with the
approval of the Advisory Committee on National Accounts Statistics, it was
decided to adopt, at 1-digit level of the National Industrial Classification (NIC)
work force.
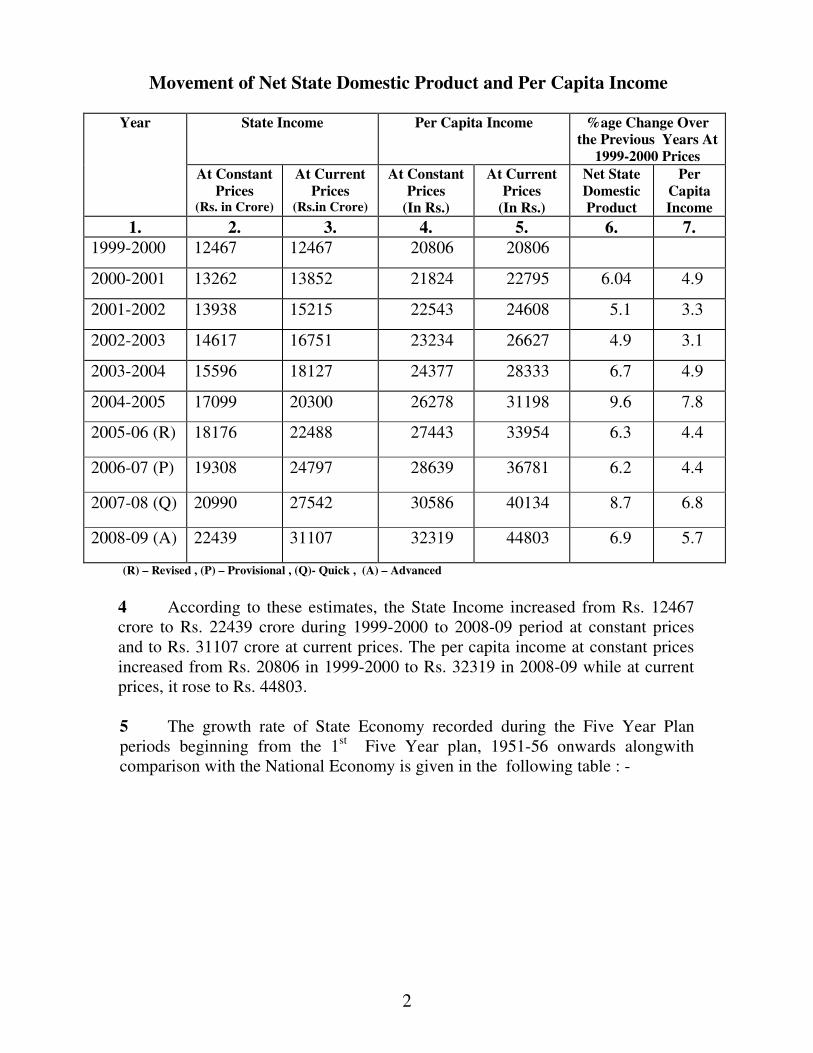
3 The quick estimates of State Income for the year 1999-2000 to 2007-08 at
current and constant 1999-2000 prices and per capita income alongwith percentage
changes over the previous year at 1999-2000 prices are given in the following
table: -
2
Movement of Net State Domestic Product and Per Capita Income
State Income Per Capita Income %age Change Over
the Previous Years At
1999-2000 Prices
Year
At Constant
Prices (Rs. in Crore)
At Current
Prices (Rs.in Crore)
At Constant
Prices
(In Rs.)
At Current
Prices
(In Rs.)
Net State
Domestic
Product
Per
Capita
Income
1. 2. 3. 4. 5. 6. 7.
1999-2000 12467 12467 20806 20806
2000-2001 13262 13852 21824 22795 6.04 4.9
2001-2002 13938 15215 22543 24608 5.1 3.3
2002-2003 14617 16751 23234 26627 4.9 3.1
2003-2004 15596 18127 24377 28333 6.7 4.9
2004-2005 17099 20300 26278 31198 9.6 7.8
2005-06 (R) 18176 22488 27443 33954 6.3 4.4
2006-07 (P) 19308 24797 28639 36781 6.2 4.4
2007-08 (Q) 20990 27542 30586 40134 8.7 6.8
2008-09 (A) 22439 31107 32319 44803 6.9 5.7
(R) – Revised , (P) – Provisional , (Q)- Quick , (A) – Advanced
4 According to these estimates, the State Income increased from Rs. 12467
crore to Rs. 22439 crore during 1999-2000 to 2008-09 period at constant prices
and to Rs. 31107 crore at current prices. The per capita income at constant prices
increased from Rs. 20806 in 1999-2000 to Rs. 32319 in 2008-09 while at current
prices, it rose to Rs. 44803.
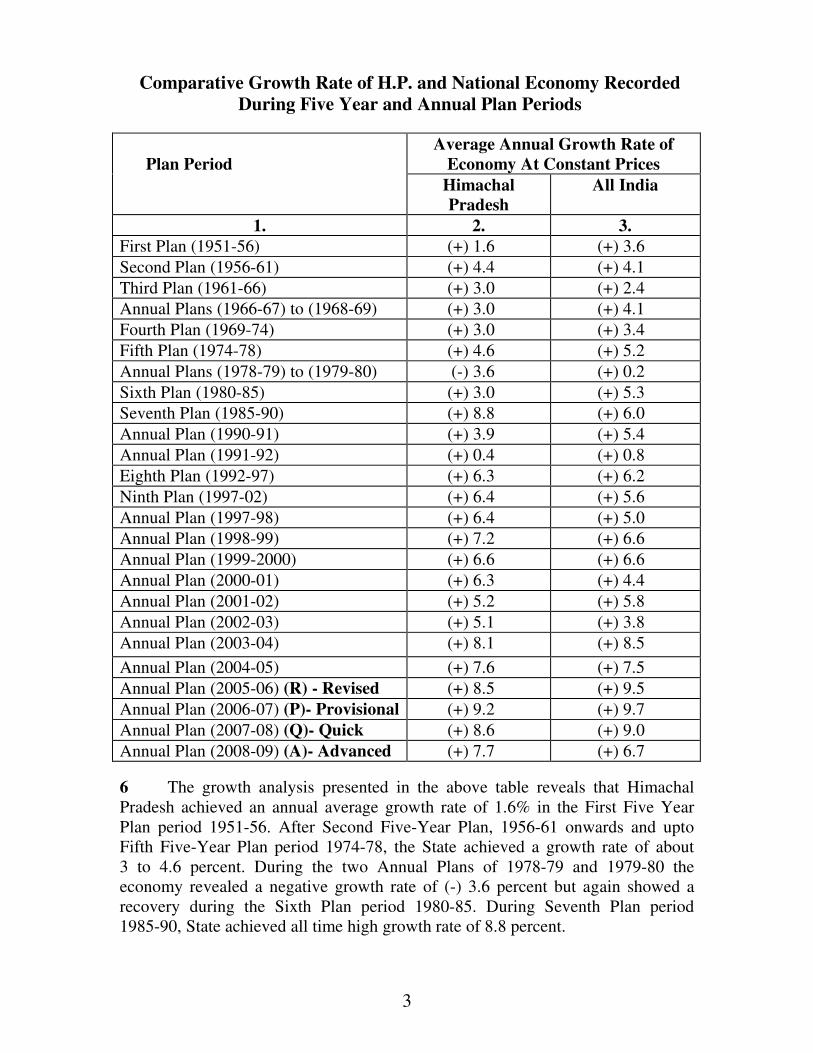
5 The growth rate of State Economy recorded during the Five Year Plan
periods beginning from the 1st Five Year plan, 1951-56 onwards alongwith
comparison with the National Economy is given in the following table : -
3
Comparative Growth Rate of H.P. and National Economy Recorded
During Five Year and Annual Plan Periods
Average Annual Growth Rate of
Economy At Constant Prices
Plan Period
Himachal
Pradesh
All India
1. 2. 3.
First Plan (1951-56) (+) 1.6 (+) 3.6
Second Plan (1956-61) (+) 4.4 (+) 4.1
Third Plan (1961-66) (+) 3.0 (+) 2.4
Annual Plans (1966-67) to (1968-69) (+) 3.0 (+) 4.1
Fourth Plan (1969-74) (+) 3.0 (+) 3.4
Fifth Plan (1974-78) (+) 4.6 (+) 5.2
Annual Plans (1978-79) to (1979-80) (-) 3.6 (+) 0.2
Sixth Plan (1980-85) (+) 3.0 (+) 5.3
Seventh Plan (1985-90) (+) 8.8 (+) 6.0
Annual Plan (1990-91) (+) 3.9 (+) 5.4
Annual Plan (1991-92) (+) 0.4 (+) 0.8
Eighth Plan (1992-97) (+) 6.3 (+) 6.2
Ninth Plan (1997-02) (+) 6.4 (+) 5.6
Annual Plan (1997-98) (+) 6.4 (+) 5.0
Annual Plan (1998-99) (+) 7.2 (+) 6.6
Annual Plan (1999-2000) (+) 6.6 (+) 6.6
Annual Plan (2000-01) (+) 6.3 (+) 4.4
Annual Plan (2001-02) (+) 5.2 (+) 5.8
Annual Plan (2002-03) (+) 5.1 (+) 3.8
Annual Plan (2003-04) (+) 8.1 (+) 8.5
Annual Plan (2004-05) (+) 7.6 (+) 7.5
Annual Plan (2005-06) (R) - Revised (+) 8.5 (+) 9.5
Annual Plan (2006-07) (P)- Provisional (+) 9.2 (+) 9.7
Annual Plan (2007-08) (Q)- Quick (+) 8.6 (+) 9.0
Annual Plan (2008-09) (A)- Advanced (+) 7.7 (+) 6.7
6 The growth analysis presented in the above table reveals that Himachal
Pradesh achieved an annual average growth rate of 1.6% in the First Five Year
Plan period 1951-56. After Second Five-Year Plan, 1956-61 onwards and upto
Fifth Five-Year Plan period 1974-78, the State achieved a growth rate of about
3 to 4.6 percent. During the two Annual Plans of 1978-79 and 1979-80 the
economy revealed a negative growth rate of (-) 3.6 percent but again showed a
recovery during the Sixth Plan period 1980-85. During Seventh Plan period
1985-90, State achieved all time high growth rate of 8.8 percent.
4
7. During Eighth Five-Year Plan period 1992-97, an annual average growth
rate of 6.3 percent was achieved against the envisaged target of 6 percent for
the State Economy. The National Economy attained an average growth rate of
6.2 percent against the target of 5.6 percent for this period. During Annual Plan
1997-98, the State economy achieved a growth of 6.4 percent whereas a growth
rate of 5.0 percent was recorded at the national level. During the Ninth Five-Year
Plan 1997-2002, the State economy achieved a growth rate of 6.4 percent.
8. In the first year 2002-03 of the 10th
Plan 2002-07, State economy achieved
a growth of 5.1 percent which continued rising in subsequent annual plans. As per
quick estimates, during the 10th
Plan period the State’s economy has achieved an
average growth rate of 7.7 percent as against 7.8 percent achieved at all India
level.
9 During the first two Annual Plans 2007-08 and 2008-09 of 11th Five Year
Plan 2007-12 a growth rate of 8.6 percent and 7.7 percent has been achieved
despite world wide slow down.
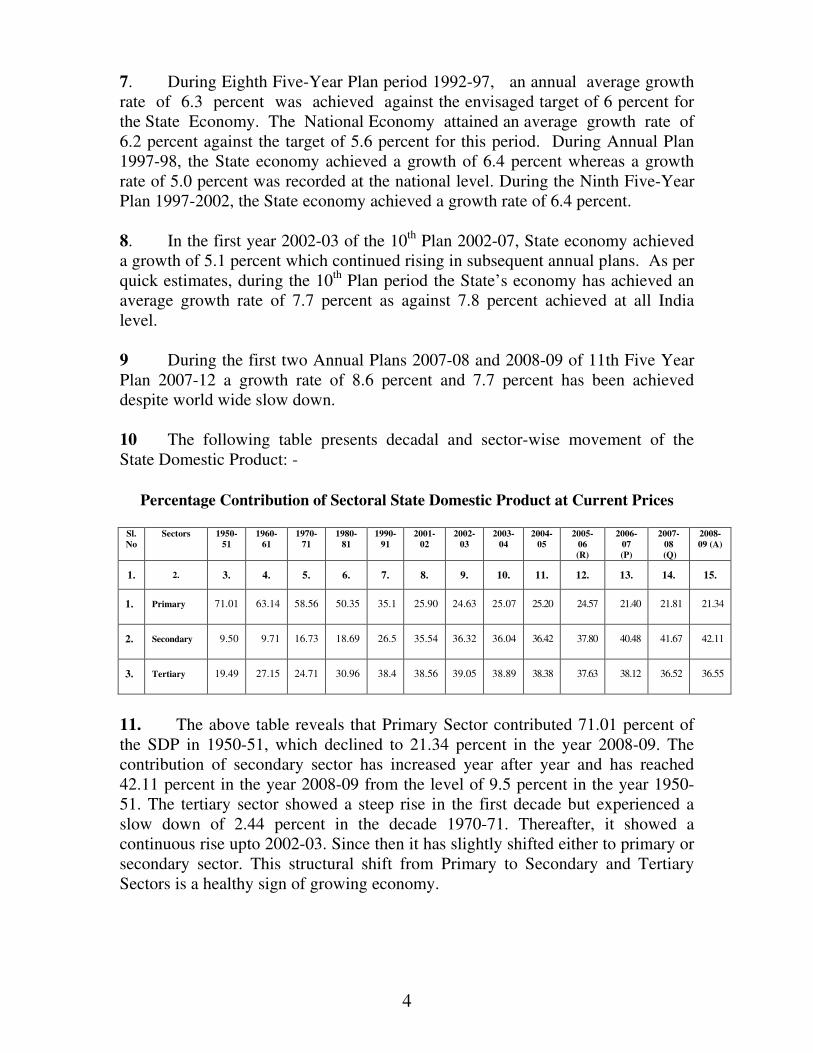
10 The following table presents decadal and sector-wise movement of the
State Domestic Product: -
Percentage Contribution of Sectoral State Domestic Product at Current Prices
Sl.
No
Sectors 1950-
51
1960-
61
1970-
71
1980-
81
1990-
91
2001-
02
2002-
03
2003-
04
2004-
05
2005-
06
(R)
2006-
07
(P)
2007-
08
(Q)
2008-
09 (A)
1. 2. 3. 4. 5. 6. 7. 8. 9. 10. 11. 12. 13. 14. 15.
1. Primary 71.01 63.14 58.56 50.35 35.1 25.90 24.63 25.07 25.20 24.57 21.40 21.81 21.34
2. Secondary 9.50 9.71 16.73 18.69 26.5 35.54 36.32 36.04 36.42 37.80 40.48 41.67 42.11
3. Tertiary 19.49 27.15 24.71 30.96 38.4 38.56 39.05 38.89 38.38 37.63 38.12 36.52 36.55
11. The above table reveals that Primary Sector contributed 71.01 percent of
the SDP in 1950-51, which declined to 21.34 percent in the year 2008-09. The
contribution of secondary sector has increased year after year and has reached
42.11 percent in the year 2008-09 from the level of 9.5 percent in the year 1950-
51. The tertiary sector showed a steep rise in the first decade but experienced a
slow down of 2.44 percent in the decade 1970-71. Thereafter, it showed a
continuous rise upto 2002-03. Since then it has slightly shifted either to primary or
secondary sector. This structural shift from Primary to Secondary and Tertiary
Sectors is a healthy sign of growing economy.
5
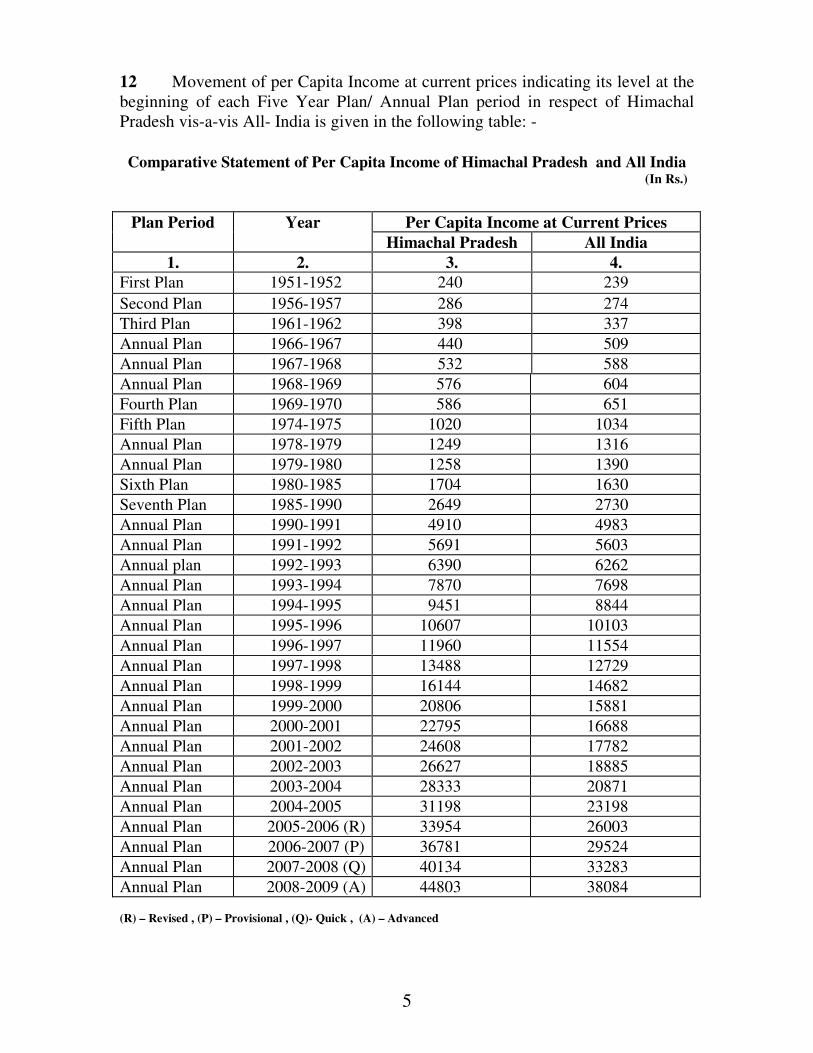
12 Movement of per Capita Income at current prices indicating its level at the
beginning of each Five Year Plan/ Annual Plan period in respect of Himachal
Pradesh vis-a-vis All- India is given in the following table: -
Comparative Statement of Per Capita Income of Himachal Pradesh and All India (In Rs.)
(R) – Revised , (P) – Provisional , (Q)- Quick , (A) – Advanced
Per Capita Income at Current Prices Plan Period Year
Himachal Pradesh All India
1. 2. 3. 4.
First Plan 1951-1952 240 239
Second Plan 1956-1957 286 274
Third Plan 1961-1962 398 337
Annual Plan 1966-1967 440 509
Annual Plan 1967-1968 532 588
Annual Plan 1968-1969 576 604
Fourth Plan 1969-1970 586 651
Fifth Plan 1974-1975 1020 1034
Annual Plan 1978-1979 1249 1316
Annual Plan 1979-1980 1258 1390
Sixth Plan 1980-1985 1704 1630
Seventh Plan 1985-1990 2649 2730
Annual Plan 1990-1991 4910 4983
Annual Plan 1991-1992 5691 5603
Annual plan 1992-1993 6390 6262
Annual Plan 1993-1994 7870 7698
Annual Plan 1994-1995 9451 8844
Annual Plan 1995-1996 10607 10103
Annual Plan 1996-1997 11960 11554
Annual Plan 1997-1998 13488 12729
Annual Plan 1998-1999 16144 14682
Annual Plan 1999-2000 20806 15881
Annual Plan 2000-2001 22795 16688
Annual Plan 2001-2002 24608 17782
Annual Plan 2002-2003 26627 18885
Annual Plan 2003-2004 28333 20871
Annual Plan 2004-2005 31198 23198
Annual Plan 2005-2006 (R) 33954 26003
Annual Plan 2006-2007 (P) 36781 29524
Annual Plan 2007-2008 (Q) 40134 33283
Annual Plan 2008-2009 (A) 44803 38084
6
13 The per capita income of Himachal Pradesh and All India increased
almost at the same pace from the period 1951-52 to 1996-97 but thereafter
Himachal Pradesh leaped forward and reached upto a level of Rs. 44803 by
March, 2009 as against the All India per capita income of Rs. 38084.