Embed Size (px)
Citation preview
Growth Trends in the Growth Trends in the Sacramento RegionSacramento Region
Jobs, Population and HouseholdsJobs, Population and Households19501950--20502050October 18th, 2002
Center for Continuing Study of the California Economy
(CCSCE)
DB Consulting
What We Will Do Today What We Will Do Today
• DESCRIBE the Expected Growth of the Sacramento Region
• EXAMINE the Impact of Expected Growth on Land Use Assuming Current Land-Use Trends Continue
• BEGIN a Process of Discussion About Regional Growth Choices
Major Sacramento Region Trends Major Sacramento Region Trends to 2050to 2050
• Substantial Future Growth – 1 Million Jobs, 1.7 Million Residents, 800,000 Households
• The Pace of Growth Will Slow Compared to the Past Fifty Years
• For the Next Thirty Years, a Large Share of Population and Household Growth Will Come From Residents Aged 55 and Over
• Average Household Size Will Fall
National Economic and National Economic and Demographic TrendsDemographic Trends
• The U.S. Will Add 150 Million Residents and 70 Million Jobs by 2050
• Immigration Will Account for a Larger Share of Population Growth
• Population 55+ Will Expand Rapidly as Baby Boomers Age
• Labor Force Growth Will Slow After 2010, Even as More Workers Postpone Retirement
• Productivity Gains Will Boost Real Incomes and the Standard of Living
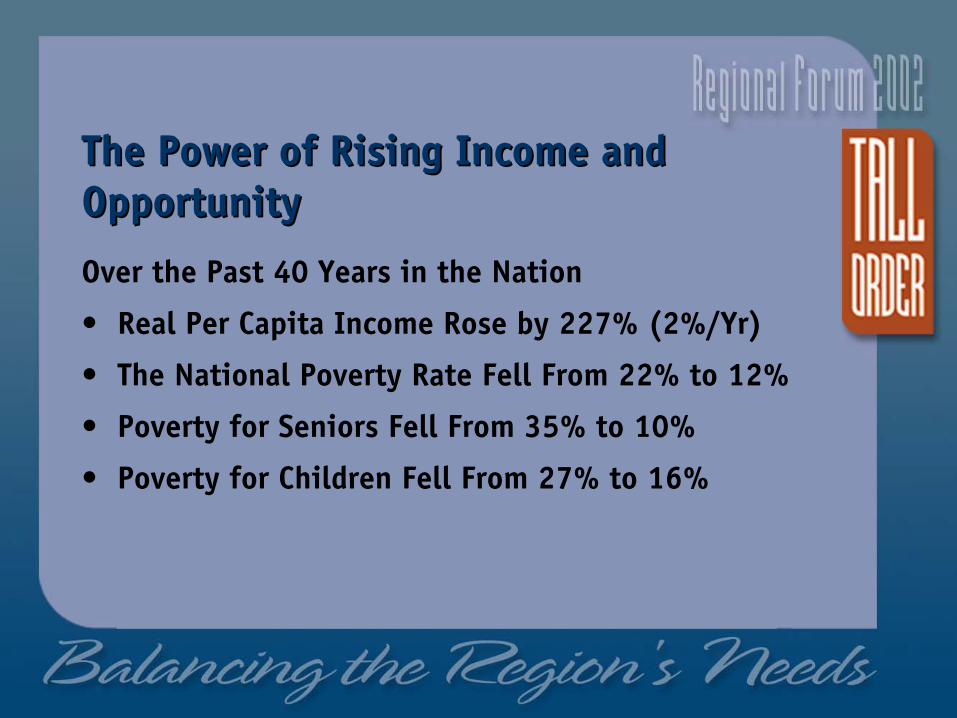
The Power of Rising Income and The Power of Rising Income and OpportunityOpportunity
Over the Past 40 Years in the Nation
• Real Per Capita Income Rose by 227% (2%/Yr)
• The National Poverty Rate Fell From 22% to 12%
• Poverty for Seniors Fell From 35% to 10%
• Poverty for Children Fell From 27% to 16%
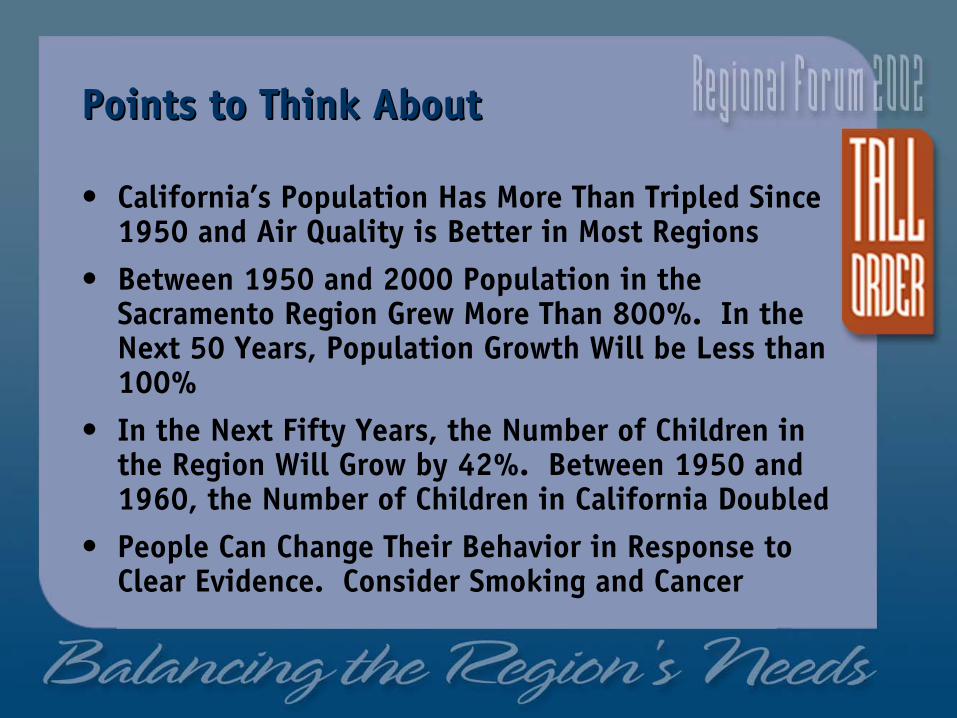
Points to Think AboutPoints to Think About
• California’s Population Has More Than Tripled Since 1950 and Air Quality is Better in Most Regions
• Between 1950 and 2000 Population in the Sacramento Region Grew More Than 800%. In the Next 50 Years, Population Growth Will be Less than 100%
• In the Next Fifty Years, the Number of Children in the Region Will Grow by 42%. Between 1950 and 1960, the Number of Children in California Doubled
• People Can Change Their Behavior in Response to Clear Evidence. Consider Smoking and Cancer
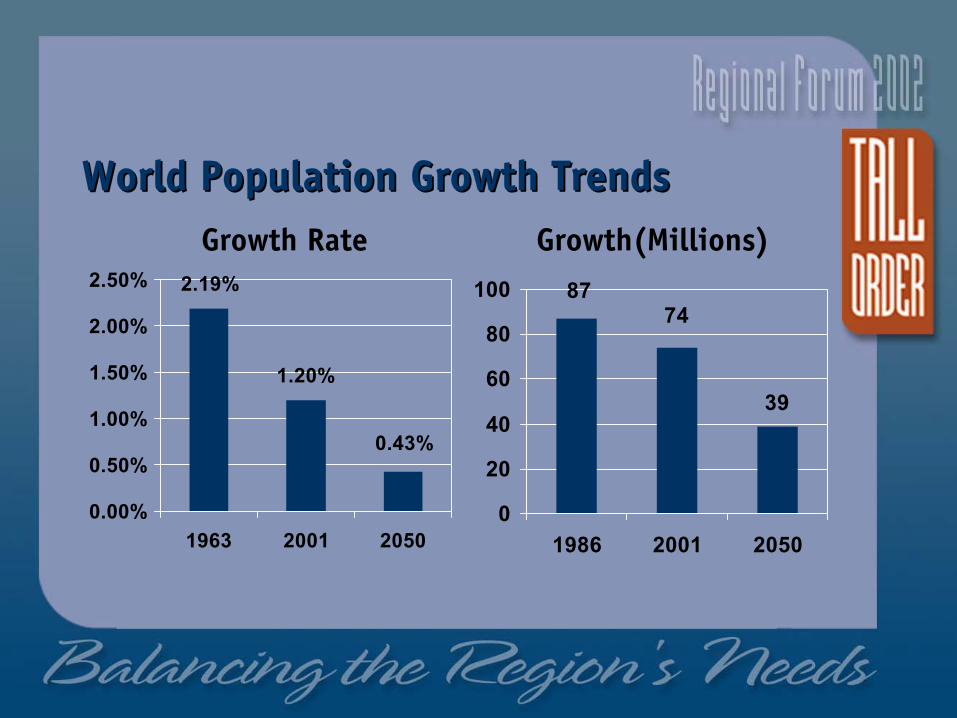
World Population Growth TrendsWorld Population Growth Trends
0.43%
1.20%
2.19%
0.00%
0.50%
1.00%
1.50%
2.00%
2.50%
1963 2001 2050
39
7487
0
20
40
60
80
100
1986 2001 2050
Growth Rate Growth(Millions)
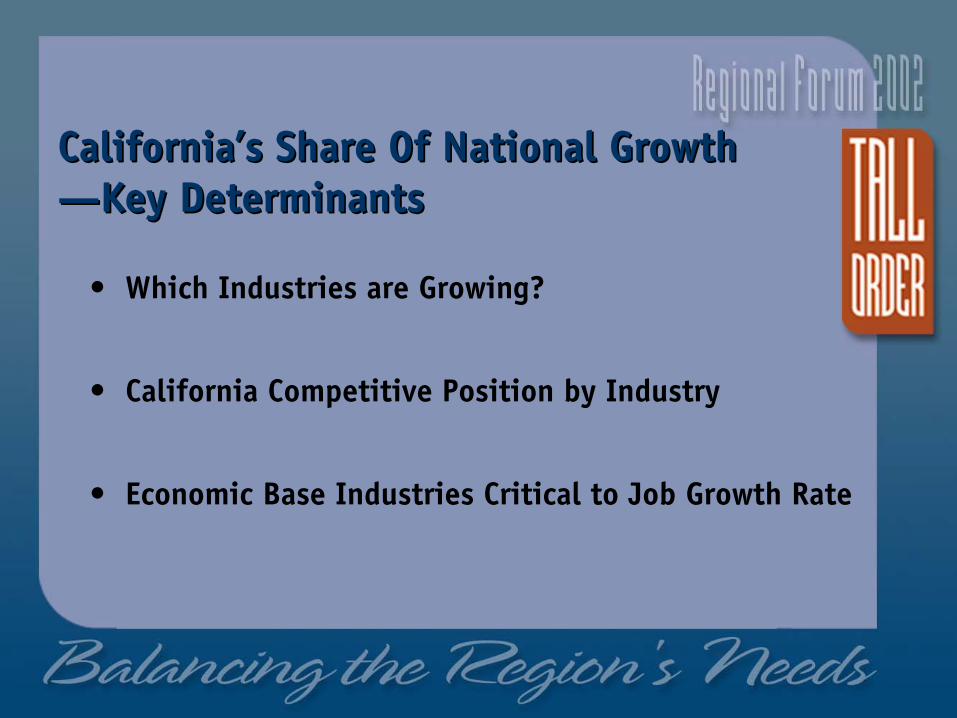
CaliforniaCalifornia’’s Share Of National Growths Share Of National Growth——Key DeterminantsKey Determinants
• Which Industries are Growing?
• California Competitive Position by Industry
• Economic Base Industries Critical to Job Growth Rate
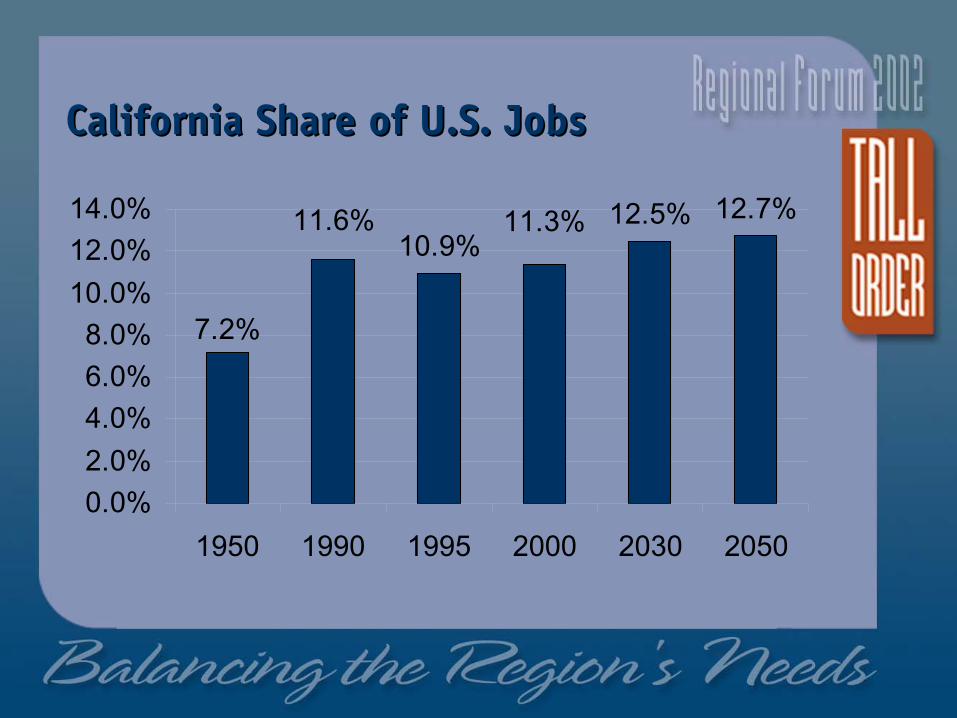
California Share of U.S. JobsCalifornia Share of U.S. Jobs
10.9%12.5% 12.7%
7.2%
11.3%11.6%
0.0%2.0%4.0%6.0%8.0%
10.0%12.0%14.0%
1950 1990 1995 2000 2030 2050
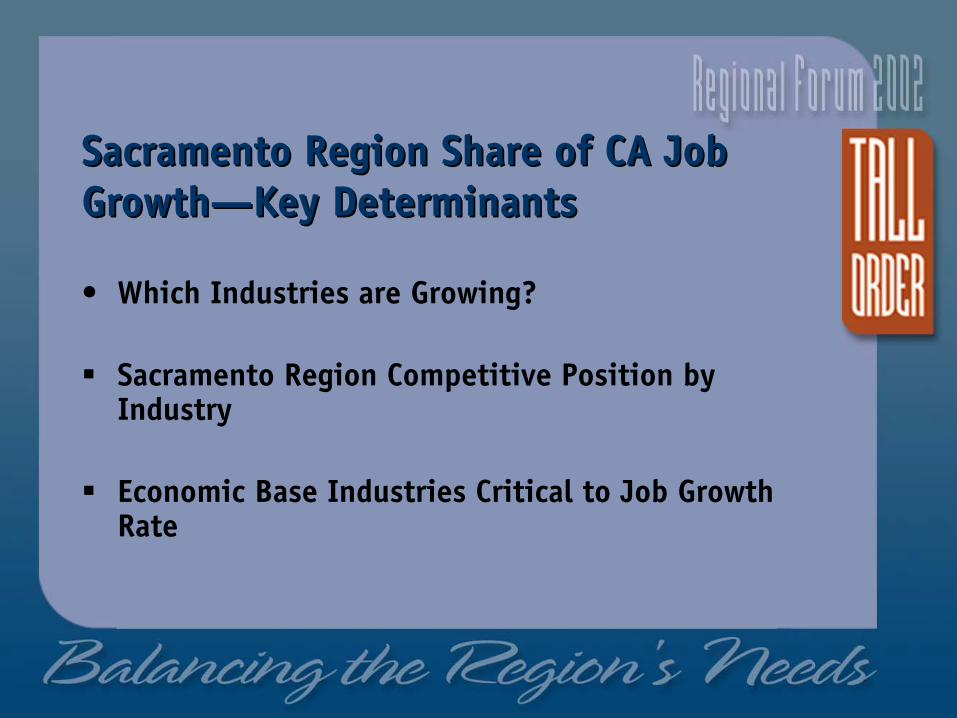
Sacramento Region Share of CA Job Sacramento Region Share of CA Job GrowthGrowth——Key DeterminantsKey Determinants
• Which Industries are Growing?
Sacramento Region Competitive Position by Industry
Economic Base Industries Critical to Job Growth Rate
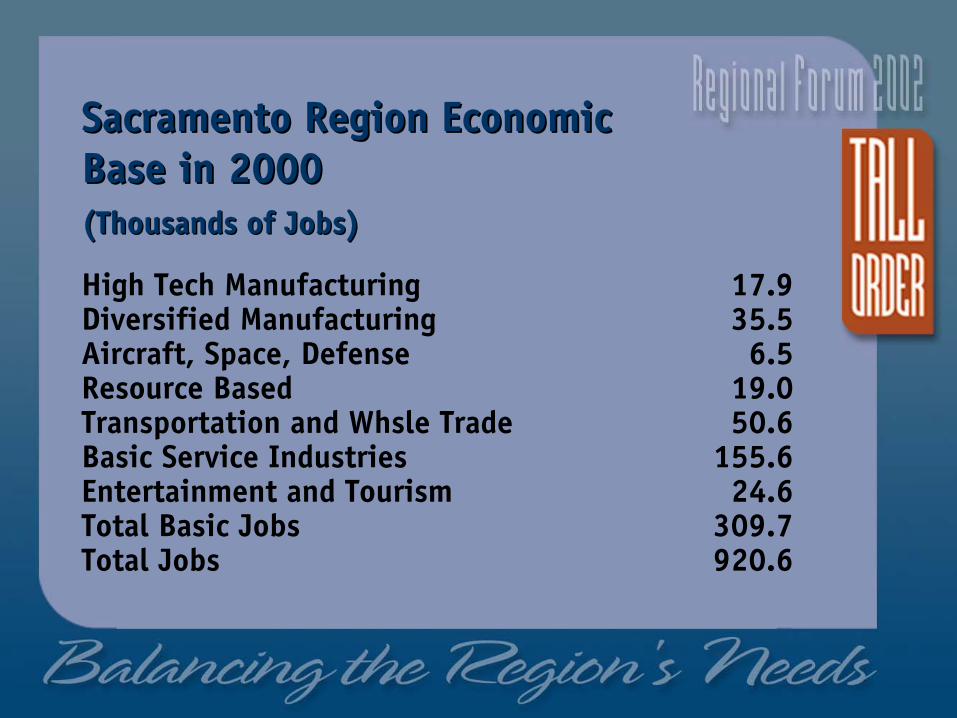
Sacramento Region Economic Sacramento Region Economic Base in 2000 Base in 2000 (Thousands of Jobs)(Thousands of Jobs)
High Tech Manufacturing 17.9Diversified Manufacturing 35.5Aircraft, Space, Defense 6.5Resource Based 19.0 Transportation and Whsle Trade 50.6Basic Service Industries 155.6Entertainment and Tourism 24.6Total Basic Jobs 309.7Total Jobs 920.6
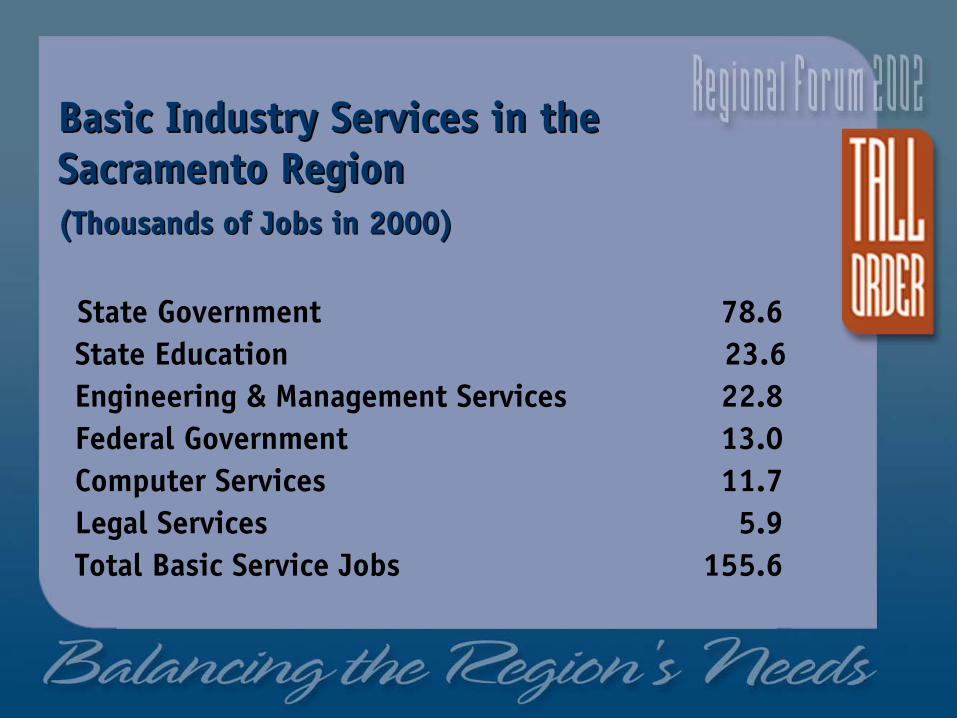
Basic Industry Services in the Basic Industry Services in the Sacramento RegionSacramento Region(Thousands of Jobs in 2000)(Thousands of Jobs in 2000)
State Government 78.6State Education 23.6Engineering & Management Services 22.8Federal Government 13.0Computer Services 11.7Legal Services 5.9Total Basic Service Jobs 155.6

Sacramento Region Sacramento Region Competitive AdvantagesCompetitive Advantages
• The Center of State Government
• A Growing Manufacturing Base
• A Critical Link in the I-80 Freight Corridor
• The Regional Center for Adjacent Counties
• A Lower-Cost California Location for Industry and People
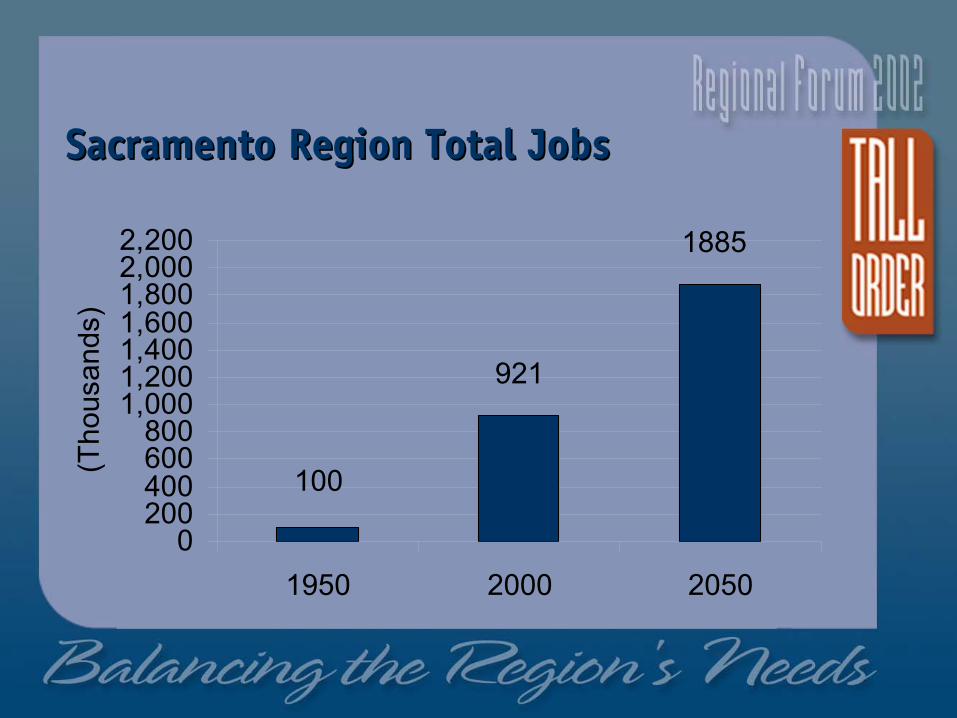
Sacramento Region Total JobsSacramento Region Total Jobs
100
1885
921
0200400600800
1,0001,2001,4001,6001,8002,0002,200
1950 2000 2050
(Tho
usan
ds)
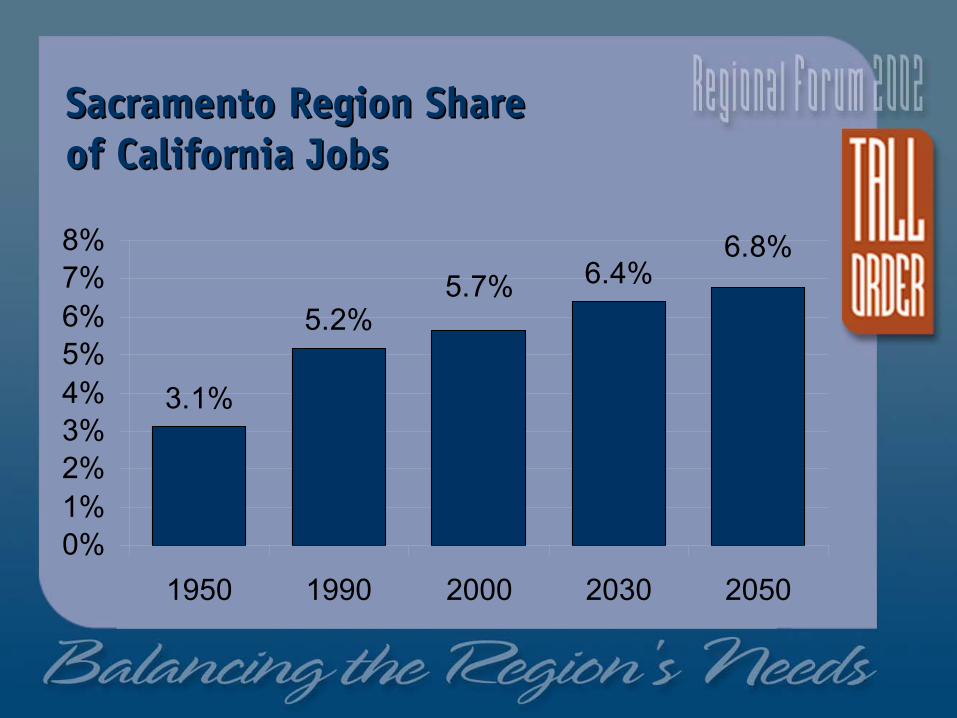
Sacramento Region Share Sacramento Region Share of California Jobsof California Jobs
3.1%
5.2%6.4%
6.8%5.7%
0%1%2%3%4%5%6%7%8%
1950 1990 2000 2030 2050
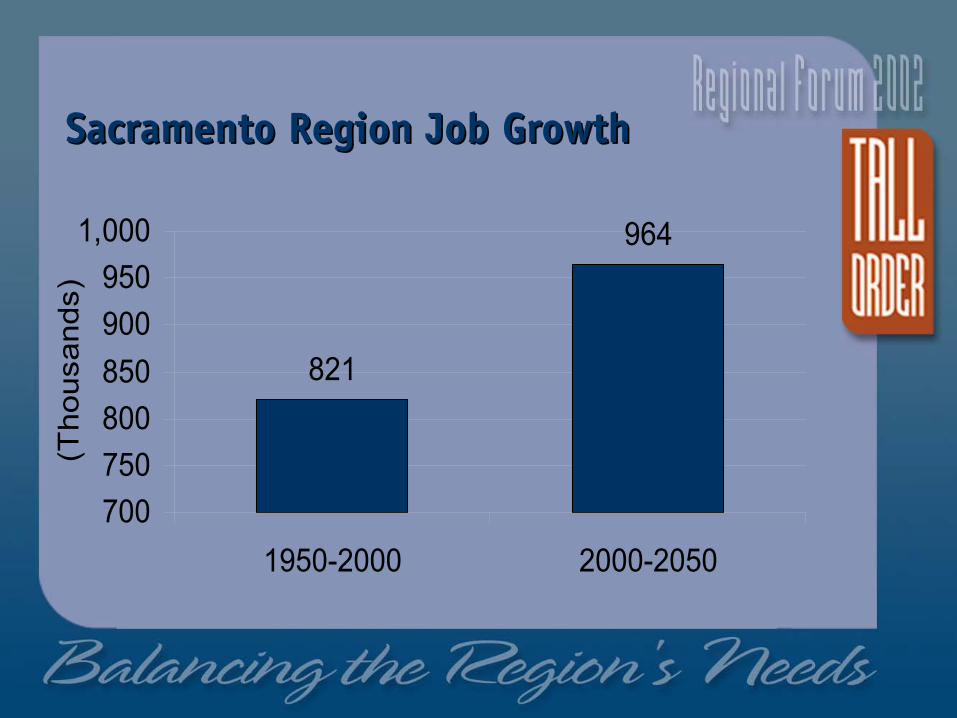
Sacramento Region Job GrowthSacramento Region Job Growth
964
821
700750800850900950
1,000
1950-2000 2000-2050
(Tho
usan
ds)
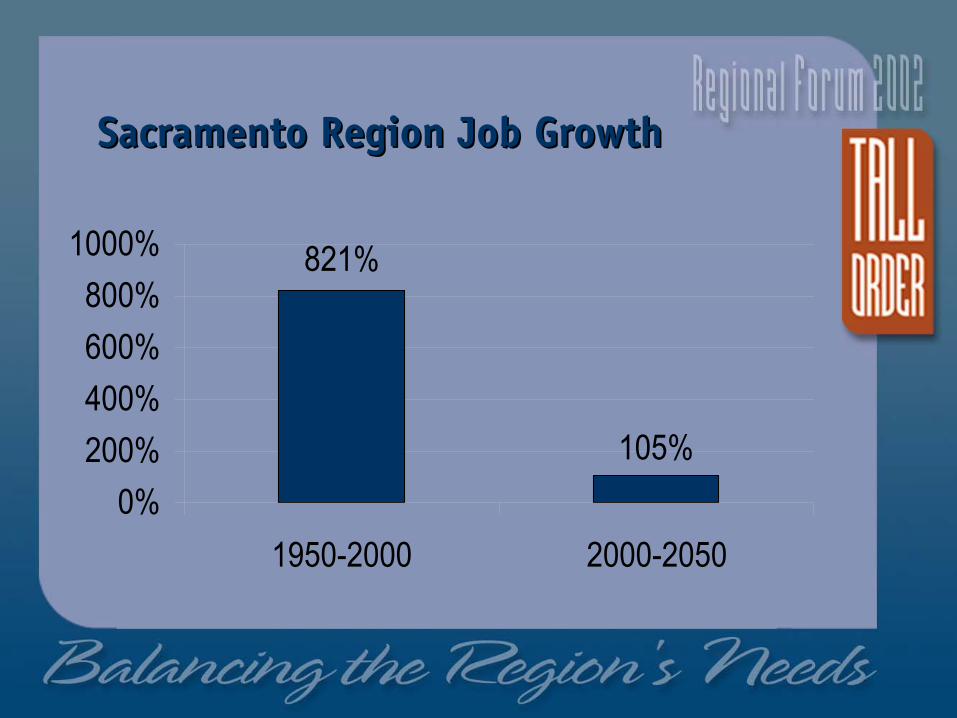
Sacramento Region Job Growth Sacramento Region Job Growth
105%
821%
0%200%400%600%800%
1000%
1950-2000 2000-2050
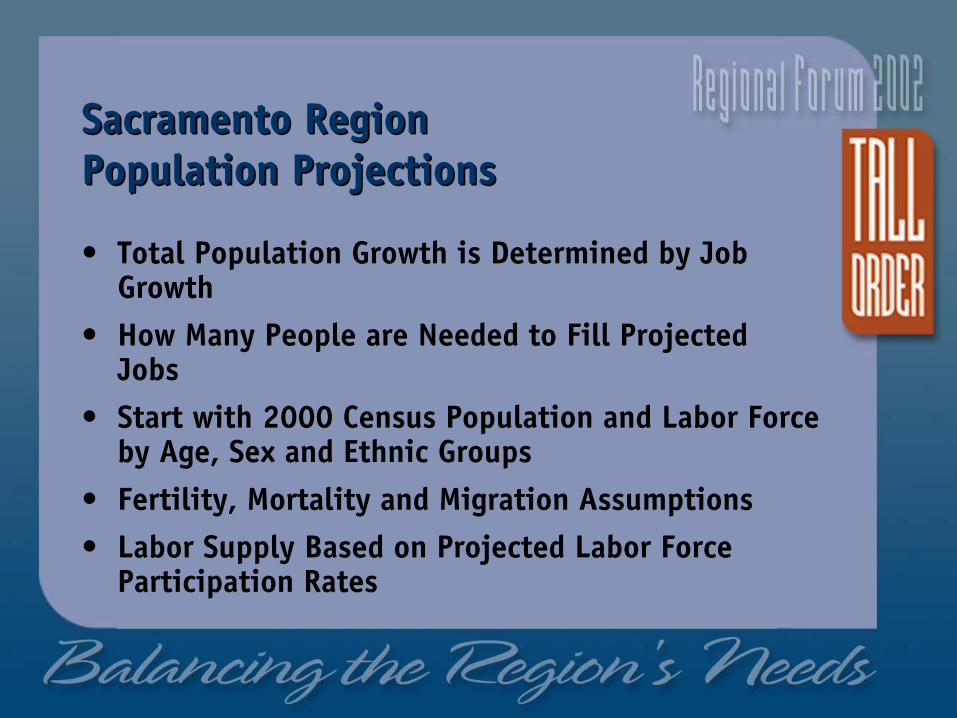
Sacramento Region Sacramento Region Population ProjectionsPopulation Projections
• Total Population Growth is Determined by Job Growth
• How Many People are Needed to Fill Projected Jobs
• Start with 2000 Census Population and Labor Force by Age, Sex and Ethnic Groups
• Fertility, Mortality and Migration Assumptions• Labor Supply Based on Projected Labor Force
Participation Rates
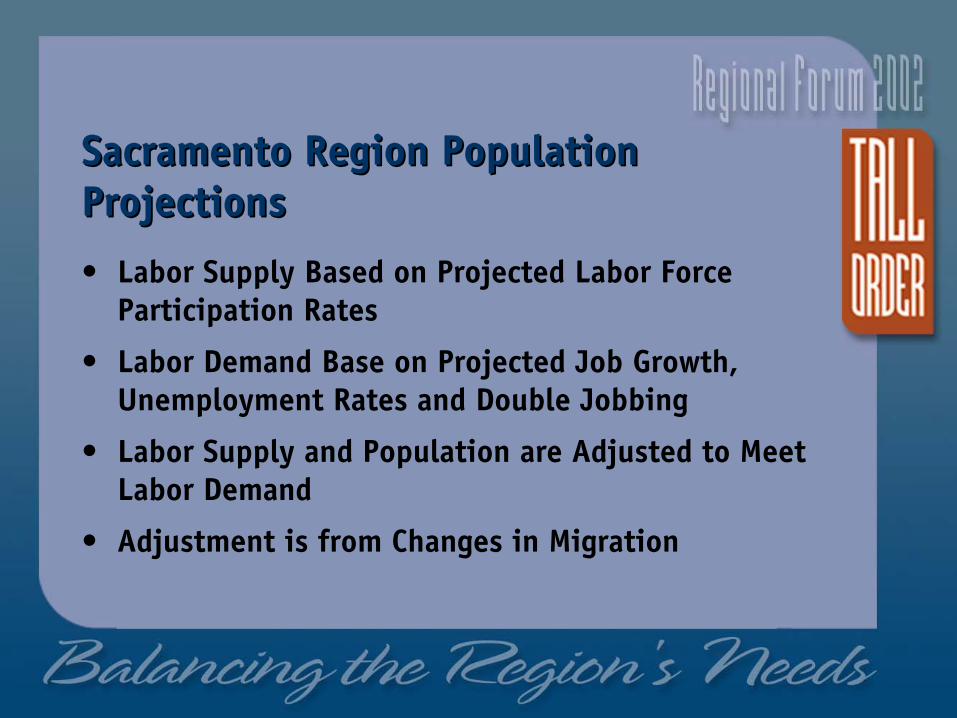
Sacramento Region Population Sacramento Region Population ProjectionsProjections
• Labor Supply Based on Projected Labor Force Participation Rates
• Labor Demand Base on Projected Job Growth, Unemployment Rates and Double Jobbing
• Labor Supply and Population are Adjusted to Meet Labor Demand
• Adjustment is from Changes in Migration
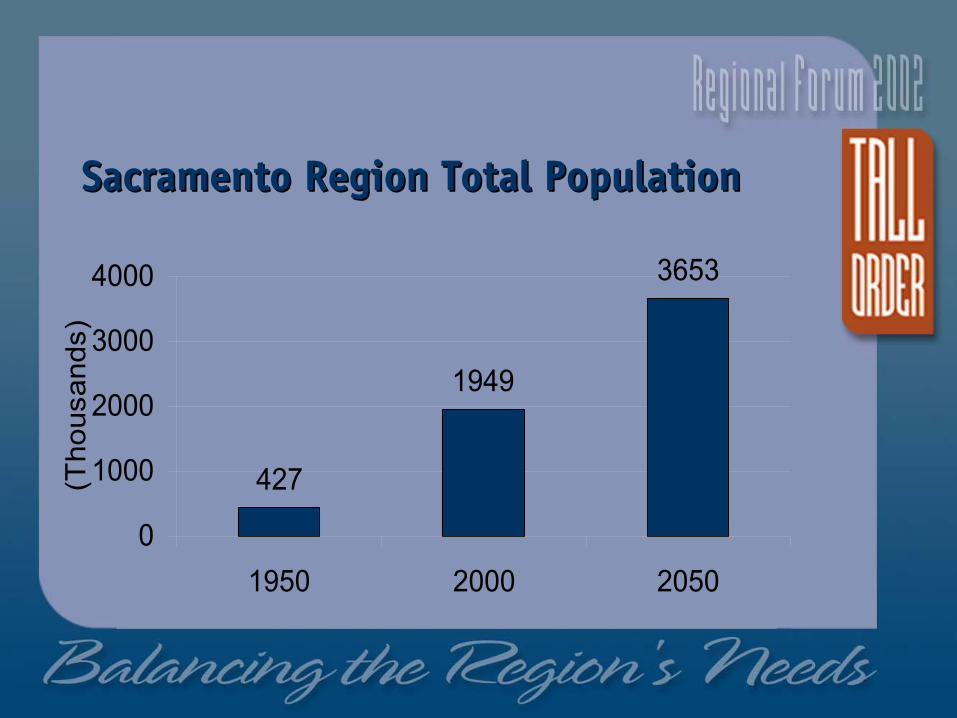
Sacramento Region Total PopulationSacramento Region Total Population
427
1949
3653
0
1000
2000
3000
4000
1950 2000 2050
(Tho
usan
ds)
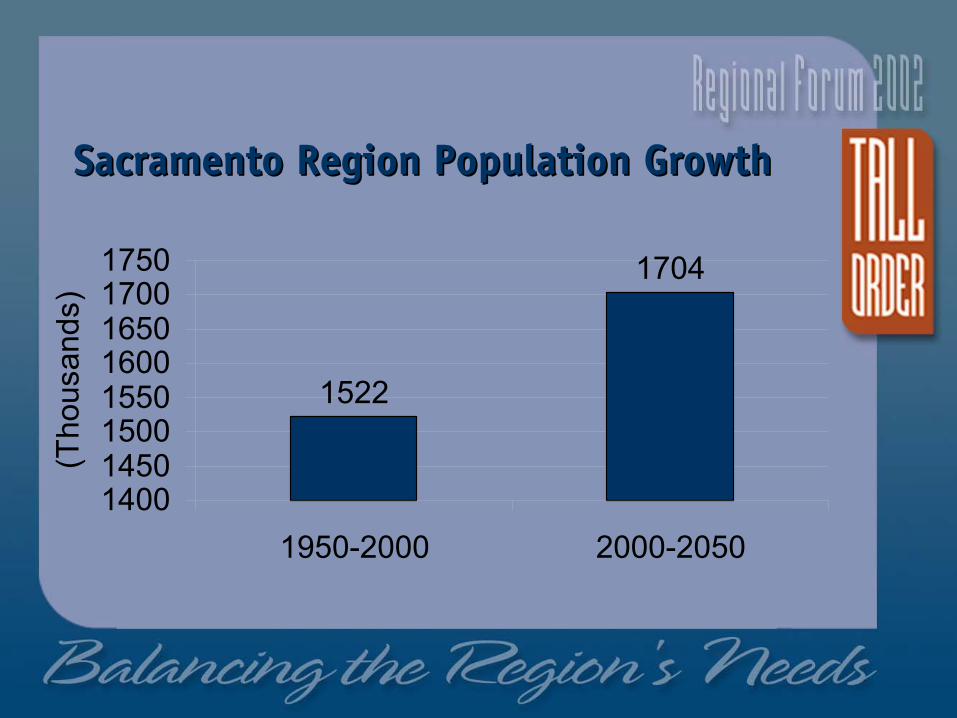
Sacramento Region Population Growth Sacramento Region Population Growth
1704
1522
14001450150015501600165017001750
1950-2000 2000-2050
(Tho
usan
ds)
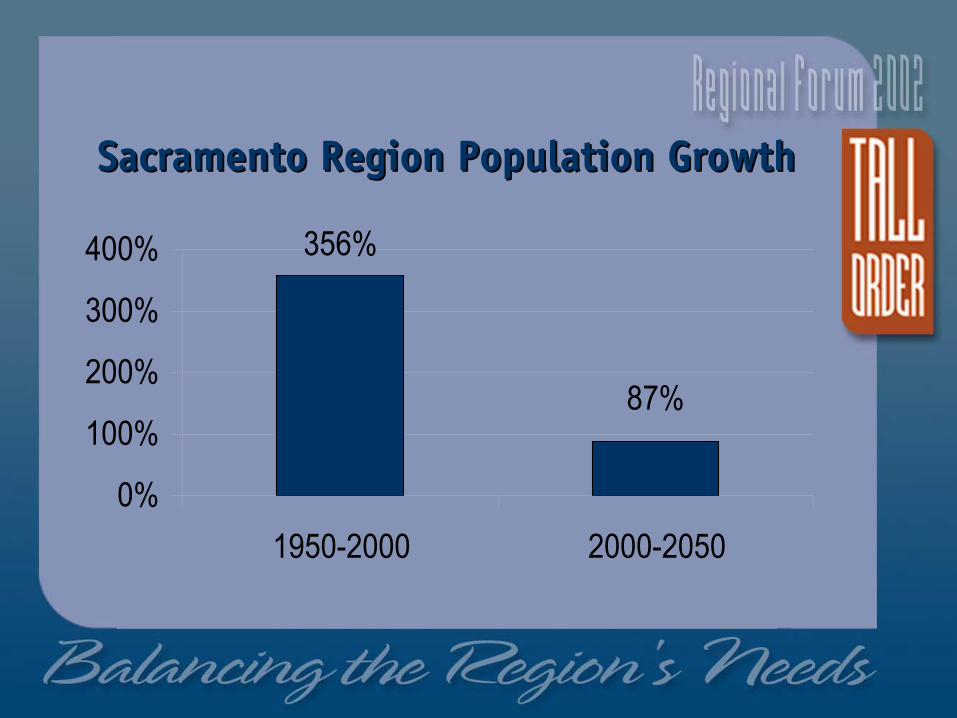
Sacramento Region Population GrowthSacramento Region Population Growth
356%
87%
0%
100%
200%
300%
400%
1950-2000 2000-2050
Ethnic Population Trends in the Ethnic Population Trends in the Sacramento RegionSacramento Region• The City of Sacramento has a Majority of
Minorities; One of the Most Diverse Cities in the Nation
• The Sacramento Region has the Highest Non-Hispanic White Share Among Major California Regions
• The Share of Hispanic and Asian Residents Will Rise Slowly Over the Next Fifty Years
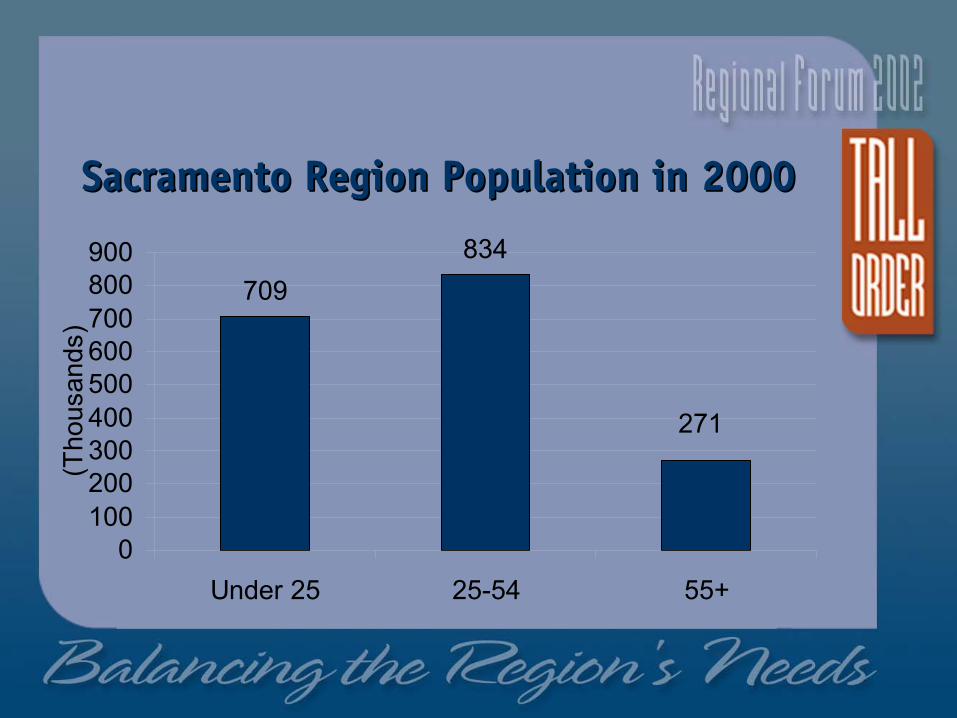
Sacramento Region Population in 2000Sacramento Region Population in 2000
834
271
709
0100200300400500600700800900
Under 25 25-54 55+
(Tho
usan
ds)
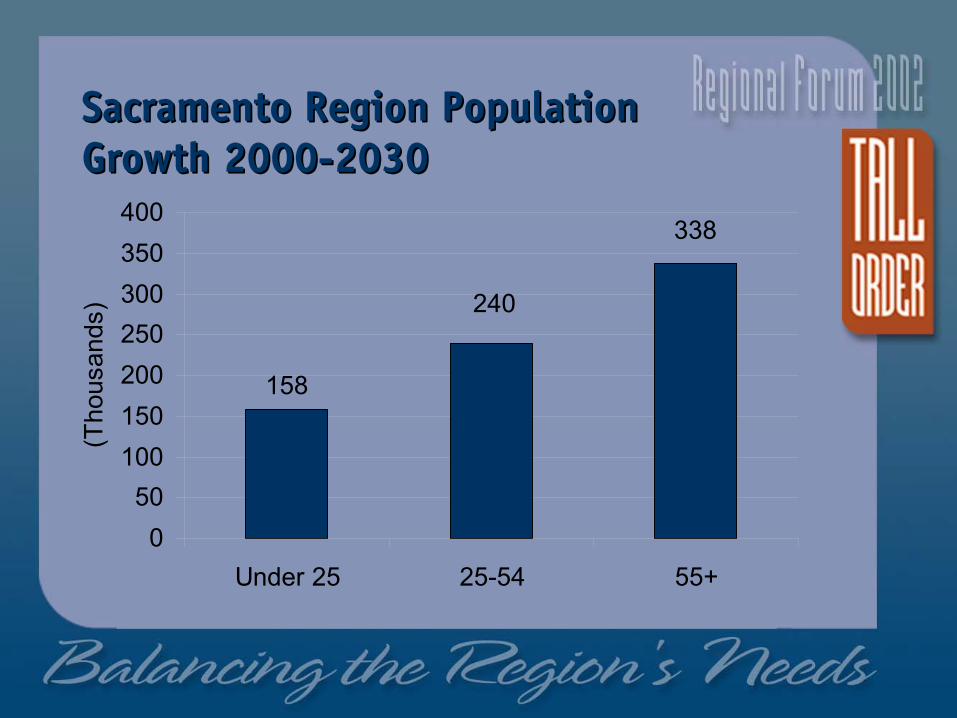
Sacramento Region Population Sacramento Region Population Growth 2000Growth 2000--20302030
158
240
338
050
100150200250300350400
Under 25 25-54 55+
(Tho
usan
ds)
Sacramento Region Household Sacramento Region Household ProjectionsProjections
• Derived from Population Projections by Age and Ethnic Group
• Based on Projections of Household Formation Rate Trends
• Household Formation Rates Show the Number of Households Formed in Each Age and Ethnic Group Or the Number of Adults per Household
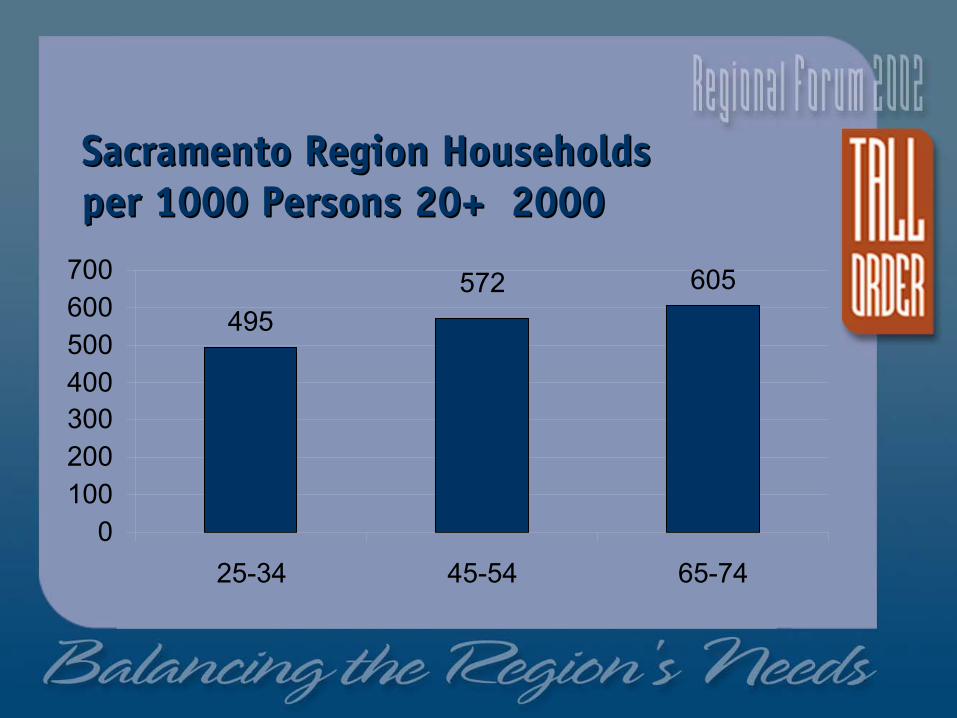
Sacramento Region Households Sacramento Region Households per 1000 Persons 20+ 2000per 1000 Persons 20+ 2000
495605572
0100200300400500600700
25-34 45-54 65-74
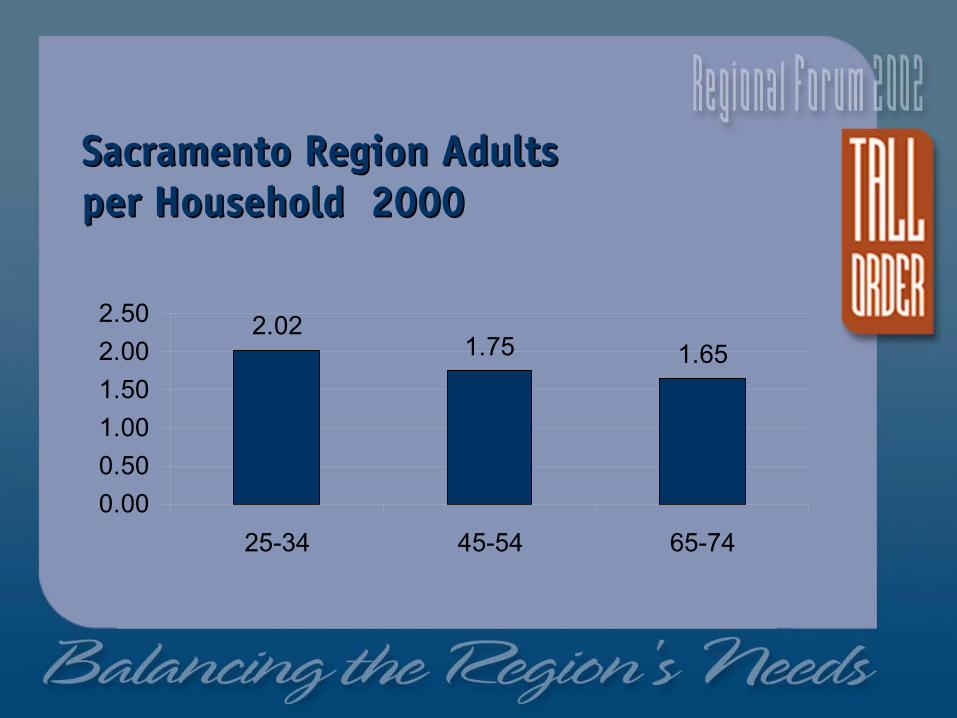
Sacramento Region Adults Sacramento Region Adults per Household 2000per Household 2000
2.021.75 1.65
0.000.501.001.502.002.50
25-34 45-54 65-74
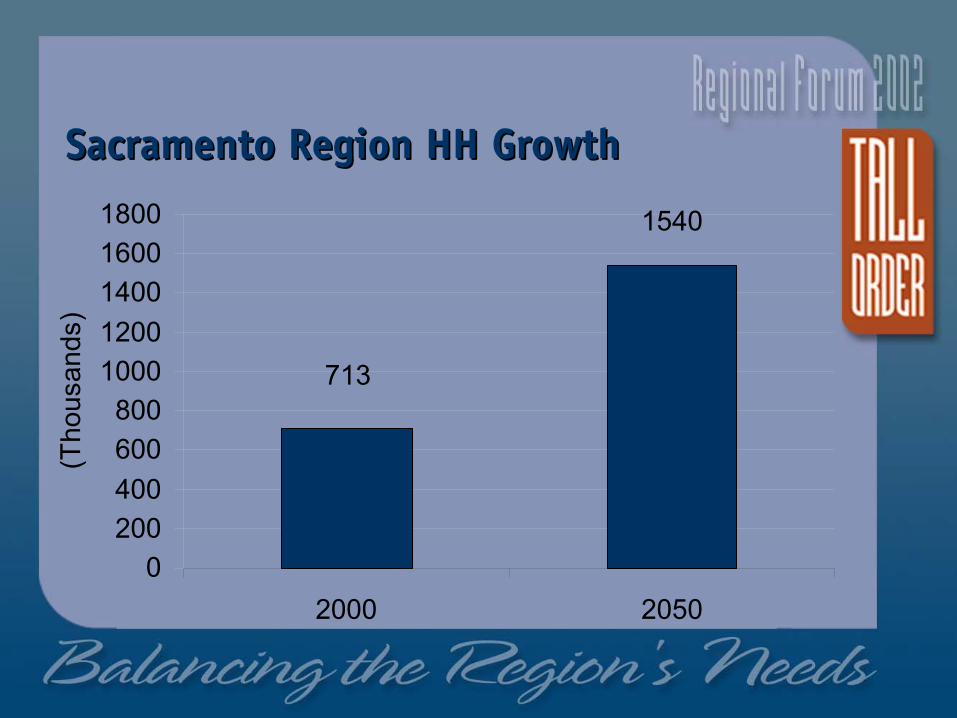
Sacramento Region HH GrowthSacramento Region HH Growth
1540
713
0200400600800
10001200140016001800
2000 2050
(Tho
usan
ds)
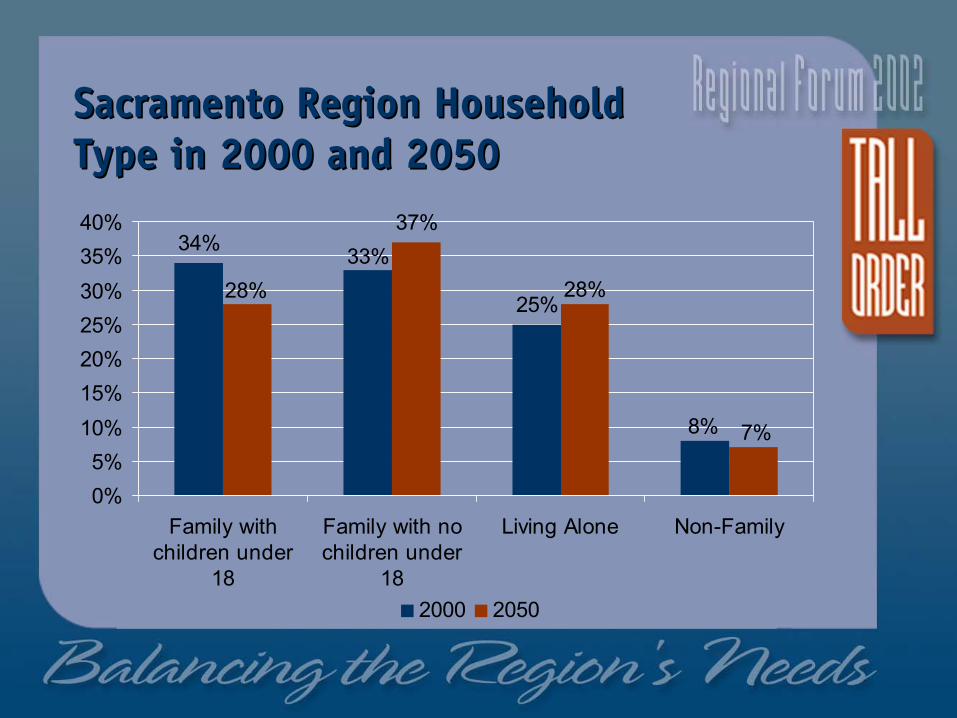
Sacramento Region Household Sacramento Region Household Type in 2000 and 2050Type in 2000 and 2050
34%
25%
37%
8%
33%
7%
28%28%
0%5%
10%15%20%25%30%35%40%
Family withchildren under
18
Family with nochildren under
18
Living Alone Non-Family
2000 2050
Sacramento Region Household Sacramento Region Household ProjectionsProjections
• Older Households Will be Major Market Force in Next 30 Years
• Older Households Will Continue to Increase Market Share After 2030
• Regional Household Size Will Shrink Over Time
• The Demand for Rental Housing Will Greatly Exceed Current Construction Levels
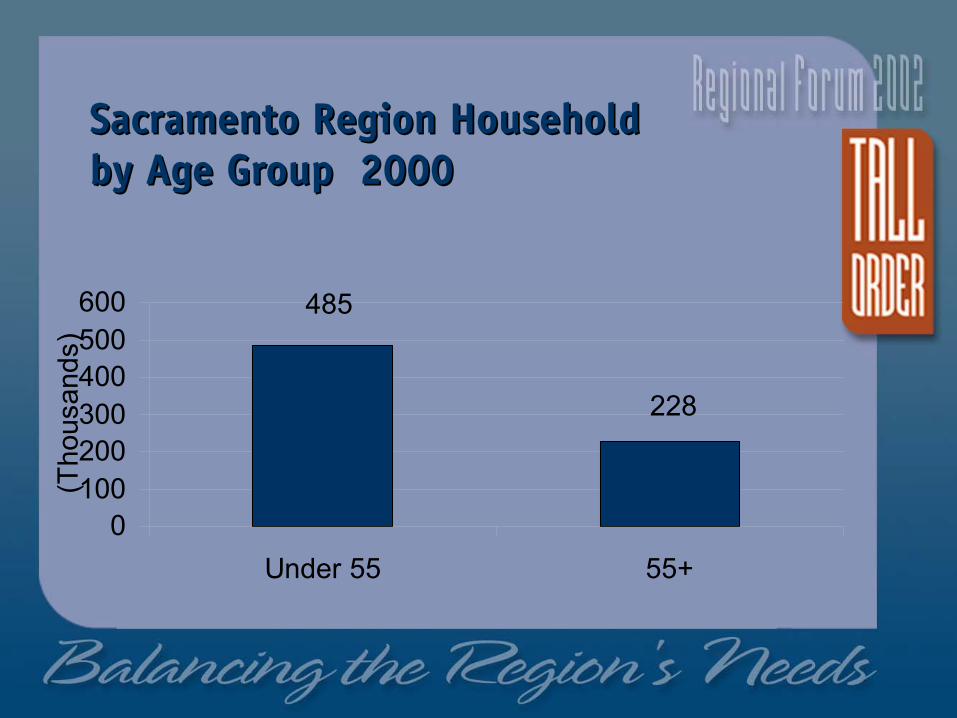
Sacramento Region Household Sacramento Region Household by Age Group 2000by Age Group 2000
228
485
0100200300400500600
Under 55 55+
(Tho
usan
ds)
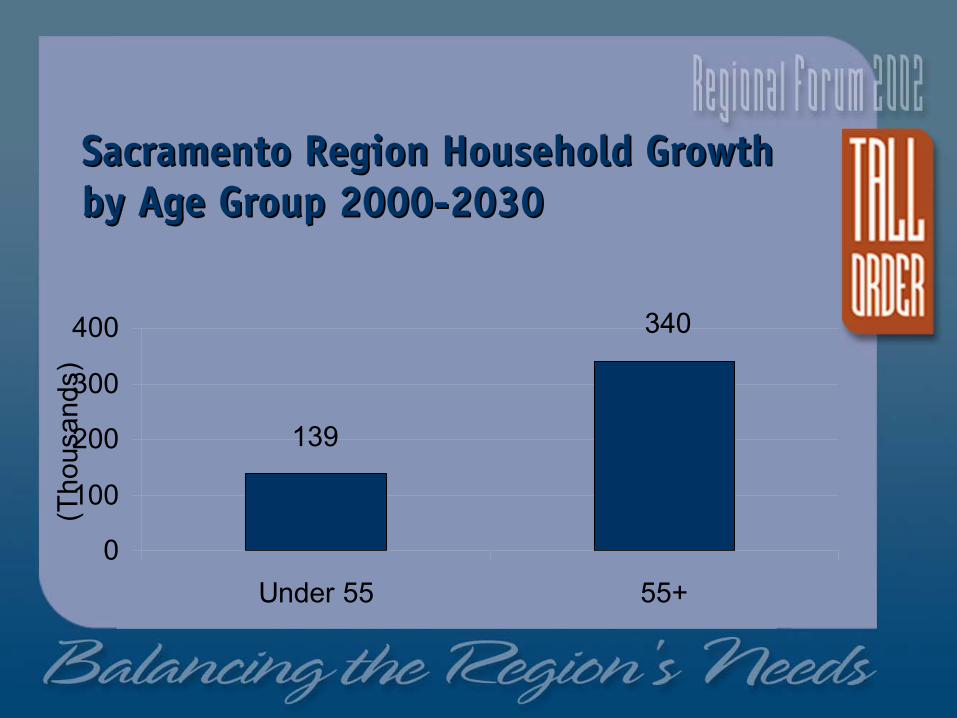
Sacramento Region Household Growth Sacramento Region Household Growth by Age Group 2000by Age Group 2000--20302030
340
139
0
100
200
300
400
Under 55 55+
(Tho
usan
ds)
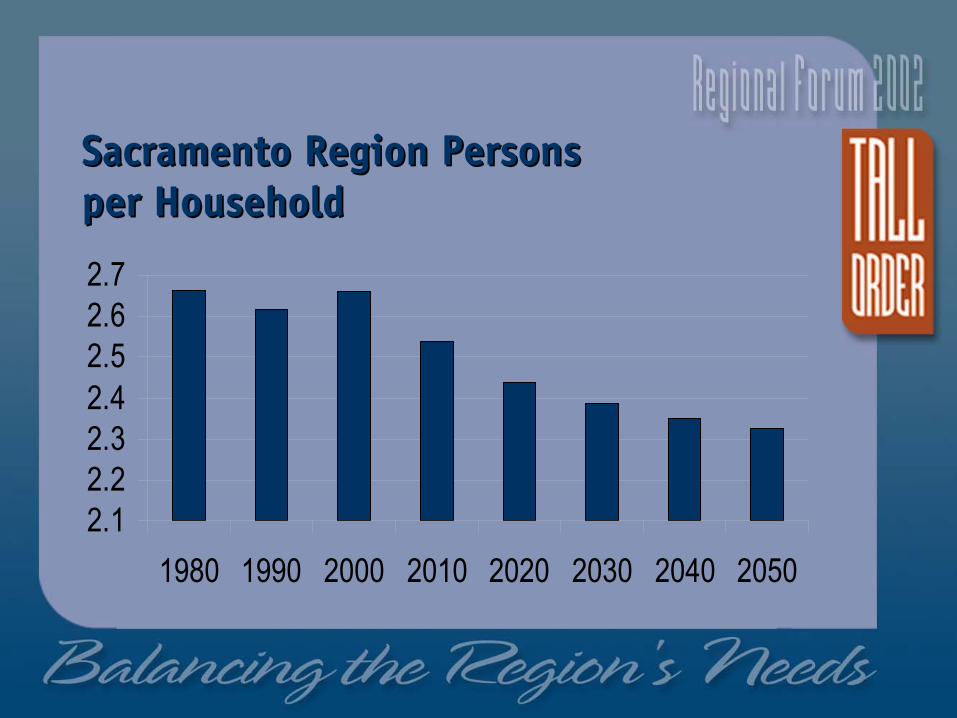
2.12.22.32.42.52.62.7
1980 1990 2000 2010 2020 2030 2040 2050
Sacramento Region Persons Sacramento Region Persons per Householdper Household
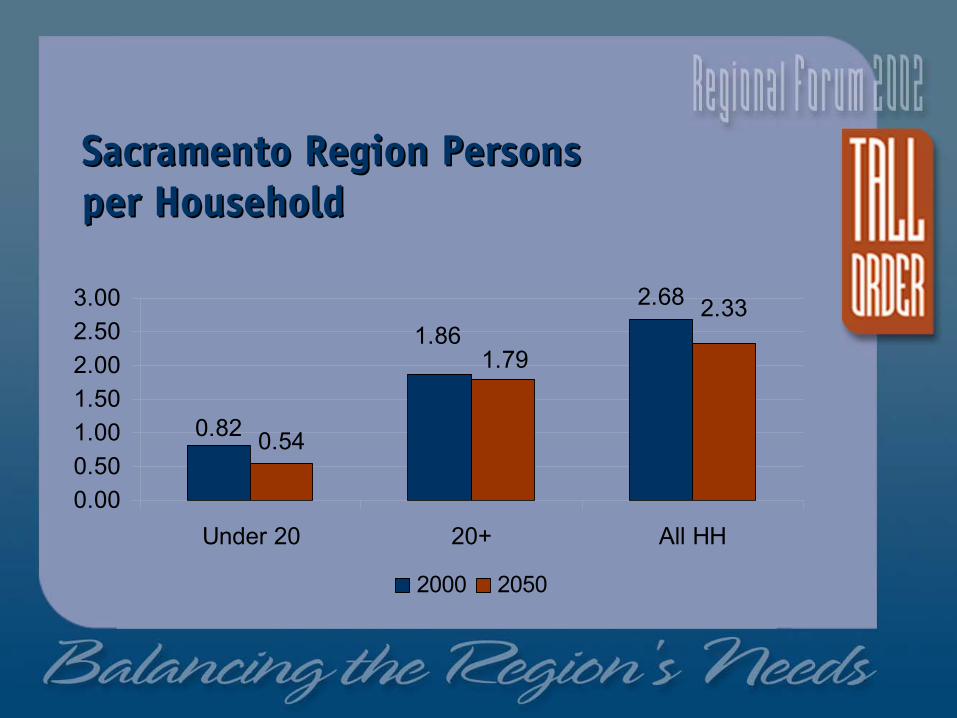
Sacramento Region Persons Sacramento Region Persons per Householdper Household
2.68
0.540.82
1.861.79
2.33
0.000.501.001.502.002.503.00
Under 20 20+ All HH
2000 2050
The Paradox of a High Quality of LifeThe Paradox of a High Quality of Life
• Regions That Have a High Quality of Life are Attractive to New Firms and Residents and Face Growth Pressures
• Regions That Have a Low Quality of Life Face Fewer Growth Pressures But Residents Suffer

The Paradox of A HighThe Paradox of A High--Wage Wage Economy or Why Regions CanEconomy or Why Regions Can’’t t Have Only HighHave Only High--Wage JobsWage Jobs
• Regional Economies That Generate Substantial Numbers of High-Wage Jobs Have More Residents With the Income to Pay for Services That Employ Lower-Wage Workers
• Regional Economies With Few High-Wage Jobs Will Have Less Income to Support Service Jobs