Embed Size (px)
Citation preview
Guidelines for Surveillance, Prevention, and Controlof West Nile Virus Infection — United States
West Nile Virus Infection — ContinuedThe introduction of West Nile (WN) virus in the northeastern United States during
the summer and fall of 1999 raised the issue of preparedness of public health agencies
to handle sporadic and outbreak-associated vectorborne diseases (1–3 ). In many local
and state health departments, vectorborne disease capacity has diminished. Because
it is unknown whether the virus can persist over the winter, whether it has already or
will spread to new geographic locations, and the public health and animal health
implications of this introduction, it is important to establish proactive laboratory-
based surveillance and prevention and control programs to limit the impact of the
virus in the United States. On November 8 and 9, 1999, CDC and the U.S. Department
of Agriculture (USDA) cosponsored a meeting of experts representing a wide range of
disciplines to review the outbreak and to provide input and guidance on the programs
that should be developed to monitor WN virus activity and to prevent future outbreaks
of disease. This report summarizes the guidelines established during this meeting.
Surveillance
Because of bird migration patterns, enhanced surveillance is a priority in those
states already affected or having a potential for being affected, including areas from
Massachusetts to Texas along the Atlantic and Gulf coasts*. Active surveillance activi-
ties should be implemented through the winter in southern states where mosquito
activity continues throughout the year, or implemented early in the spring in northern
states where mosquito activity ceased with the onset of cold weather. Surveillance
activities that should be emphasized in the catchment area include the following:
1. Active bird surveillance to detect the presence of and to monitor WN virus
activity in both wild and sentinel bird populations (4 ). In particular, surveil-
lance for dead crows may be a sensitive means to detect the presence of WN
virus in an area.
2. Active mosquito surveillance to detect and monitor WN virus activity in mos-
quito populations and to help identify potential vectors (4 ).
U.S. DEPARTMENT OF HEALTH & HUMAN SERVICES
25 Guidelines for Surveillance,Prevention, and Control of WestNile Virus Infection — United States
28 Accutane®
-Exposed Pregnancies —California, 1999
31 Update: Raccoon Rabies Epizootic —United States and Canada, 1999
35 Recommended ChildhoodImmunization Schedule — United States, 2000
47 Notice to Readers
January 21, 2000 / Vol. 49 / No. 2
*Alabama, Connecticut, Delaware, District of Columbia, Florida, Georgia, Louisiana, Maine,Maryland, Massachusetts, North Carolina, New Jersey, New York, New York City, Pennsylvania,Rhode Island, South Carolina, Texas, and Virginia.
3. Enhanced passive veterinary surveillance by general alerts to veterinarians
for reporting neurologic illness in animals, with emphasis on horses as a
backup system to monitor the extent of WN virus transmission outside the
bird-mosquito cycle.
4. Enhanced passive human surveillance by general alerts to health-care provid-
ers to report viral encephalitis and, if resources permit, aseptic meningitis in
humans.
Laboratory Diagnosis
Diagnosis of WN or other virus infections requires specialized laboratory diagnostic
tests (4 ). Surveillance activities require the availability of laboratories that can provide
the following minimal laboratory diagnostic support:
1. Serology. Using CDC and USDA protocols and reagents, the IgM and IgG en-
zyme-linked immunosorbent assays (ELISAs) for WN virus should be estab-
lished in all state public health and veterinary laboratories to provide initial
testing for human and animal specimens (5 ). State health, veterinary, and
reference laboratories with biosafety level 3 facilities should have the capabil-
ity to conduct neutralization tests to identify specific flavivirus antibodies.
2. Virus isolation and detection. Regional state public health laboratories and
reference laboratories with biosafety level 3 facilities should have virus isola-
tion and identification capabilities. Selected other laboratories also should
have reverse transcriptase polymerase chain reaction (RT-PCR) capability to
detect viral RNA (5–7 ). Antigen-capture ELISAs to detect WN and other
arboviruses in mosquito pools should be developed and made available to
state and local laboratories. Regional state public health and reference labo-
ratories should have the capability to use immunohistochemistry to detect
virus in autopsy tissues.
Prevention and Control
Mosquito control is the most effective way to prevent transmission of WN and other
arboviruses to humans and other animals, or to control an ongoing outbreak (4 ).
Mosquito-control methods should include the following:
1. Mosquito abatement districts. The most effective and economical way to
control mosquitoes is by larval source reduction through locally funded
abatement programs that monitor mosquito populations and initiate control
before disease transmission occurs. These programs also can be used as the
first line emergency response for mosquito control if disease is detected in
humans or domestic animals.
2. Public outreach. Public education about vectorborne diseases, particularly
about modes of transmission and means of preventing or reducing risk for
exposure, is a critical component of a prevention and control program.
Public Health Infrastructure
Effective surveillance, prevention, and control of vectorborne diseases, including
WN virus, require designated resources in local and state health departments. Few
state and local health departments have trained personnel or the resources to address
adequately vectorborne diseases. At a minimum, each state health department should
have functional arbovirus surveillance and response capability, including entomology
26 MMWR January 21, 2000
West Nile Virus Infection — Continued
and laboratory support. Geographic location and risk for WN transmission will deter-
mine the extent of a state’s capability to handle arboviral diseases.
Interjurisdictional Data Sharing
WN fever is a zoonosis that affects numerous animal species, including humans.
Effective surveillance and response will require coordination and data exchange
between federal, state, and local agencies including departments of health, agricul-
ture, and wildlife. A system of secure e-mail list servers and/or World-Wide Web sites
will be necessary to facilitate the rapid and efficient exchange of data and other infor-
mation between authorized users.
Research Priorities
Targets of applied research include understanding how and why the 1999 WN virus
epidemic occurred, the public health and animal health implications of this introduc-
tion to the Western Hemisphere, and developing effective prevention strategies. High-
priority research topics include defining current and future geographic distribution;
bird migration as a mechanism of virus dispersal; vector relations and range; verte-
brate host relations and range; virus persistence mechanisms; mosquito biology and
behavior; mosquito control methods; mosquito surveillance methods; developing and
evaluating disease prevention strategies; improving laboratory diagnostic tests; clini-
cal spectrum of WN virus illness and long-term prognosis in humans; determining risk
factors in enzootic areas; viral pathogenesis; genetic relations and the molecular basis
of virulence; WN virus vaccine development for animals and humans; antiviral ther-
apy for flaviviruses; and economic impact of the northeastern outbreak.Reported by: Animal, Plant, and Health Inspection Svc, US Department of Agriculture. Div ofVector-Borne Infectious Diseases, National Center for Infectious Diseases, CDC.
Editorial Note: The 1999 WN virus epidemic in the New York City (NYC) metropolitan
area resulted in 61 human cases (55 confirmed and six probable), including seven
deaths (1–3 ). Exotic zoo birds, American crows, and horses also were affected and
had high death rates. In addition to NYC, epidemic/epizootic transmission was
detected in surrounding New York counties. Emergency surveillance programs
detected epizootic transmission in New Jersey and Connecticut but no cases in
humans.
The surveillance and laboratory efforts required from NYC, surrounding counties,
and adjacent states consumed considerable resources and demonstrated a need to
enhance state and local health department programs to combat vectorborne infec-
tious diseases. In December 1999, CDC announced the availability of fiscal year 2000
supplemental funds to support WN virus surveillance, prevention, and control pro-
jects. The 19 state and local health departments eligible to apply for these funds rep-
resent those areas where WN virus transmission already has occurred or where
transmission would be more likely to occur based on bird migration patterns.
The focus of these cooperative agreements enables state and local health depart-
ments to increase surveillance activities and enhance laboratory capacity for detecting
WN and other arboviruses. In the initial year, surveillance activities will be focused to
determine whether WN virus survived the winter and, if so, to ascertain its geographic
distribution along the Atlantic and Gulf coasts.
References1. CDC. Outbreak of West Nile-like viral encephalitis—New York, 1999. MMWR 1999;48:845–9.
Vol. 49 / No. 2 MMWR 27
West Nile Virus Infection — Continued
2. CDC. Update: West Nile-like viral encephalitis—New York, 1999. MMWR 1999;48:890–2.
3. CDC. Update: West Nile virus encephalitis—New York, 1999. MMWR 1999;48:944–6,955.
4. CDC. Guidelines for arbovirus surveillance in the United States. Fort Collins, Colorado: US
Department of Health and Human Services, Public Health Service, CDC, 1993.
5. Lanciotti RS, Roehrig JT, Deubel V, et al. Origin of the West Nile virus responsible for an out-
break of encephalitis in the northeastern United States. Science 1999;286:2333–7.
6. Anderson JF, Andreadis TG, Vossbrinck CR, et al. Isolation of West Nile virus from mosquitoes,
crows, and a Cooper’s Hawk in Connecticut. Science 1999;286:2331–3.
7. Jia XY, Briese T, Jordan I, et al. Genetic analysis of West Nile New York 1999 encephalitis virus
[Letter]. Lancet 1999;354:1971–2.
West Nile Virus Infection — Continued
Accutane®
-Exposed Pregnancies — California, 1999
Accutane-Exposed Pregnancies — ContinuedAccutane®* (Roche Laboratories, Nutley, New Jersey), known by the generic name
“isotretinoin,” is a prescription oral medication approved by the Food and Drug
Administration (FDA) to treat severe, recalcitrant nodular acne (1 ). It is also a known
human teratogen that can cause multiple major malformations. Embryopathy associ-
ated with the mother’s exposure to isotretinoin during the first trimester of pregnancy
includes craniofacial, cardiac, thymic, and central nervous system malformations
(2,3 ). In response to FDA recommendations (4 ), the manufacturer began a preg-
nancy-prevention program (PPP) in 1988 that included educational materials for phy-
sicians and patients and offered women reimbursement for contraceptive counseling
by a physician. The PPP coordinators asked reproductive-aged women being treated
with isotretinoin to enroll voluntarily in the Boston University Accutane Survey
(BUAS) (5 ). The total number of reproductive-aged women taking isotretinoin in the
United States is unknown; however, 454,273 women enrolled in the BUAS from 1989
to October 1999. BUAS has estimated that 38%–40% of reproductive-aged women tak-
ing isotretinoin chose to enroll in the survey (BUAS, unpublished data, 1999).
Although isotretinoin is contraindicated in pregnancy and has a package label warn-
ing users to avoid pregnancy while taking it, exposed pregnancies occur (5–7 ).
Approximately 900 pregnancies occurred among BUAS enrollees during 1989–1998
(BUAS, unpublished data, 1999). Roche Laboratories began direct-to-consumer print
advertisements in 1996, added television and radio advertisements to selected cities
in 1997, and expanded the campaign to the entire United States in 1998.
During March 1999, CDC interviewed women who had had recent isotretinoin-
exposed pregnancies. The objective of the study was to draw attention to the contin-
ued occurrence of isotretinoin-exposed pregnancies 11 years after the inception of the
PPP and to learn more about why these exposed pregnancies happened. California
was selected as the study site because of its large population and the availability of
referrals from the California Teratogen Information Service and Clinical Research
Center (CTIS). This report summarizes the results of the study, which suggest that
some isotretinoin-exposed pregnancies can be prevented. The case reports describe
the experiences of three study respondents.
*Use of trade names and commercial sources is for identification only and does not implyendorsement by CDC or the U.S. Department of Health and Human Services.
28 MMWR January 21, 2000
West Nile Virus Infection — Continued
Summary of Interviews
Eligible women resided in California, used isotretinoin while pregnant, had their last
menstrual period after January 1, 1997, and reported their pregnancy to the BUAS or
to the CTIS. Twenty-three women met these criteria; 14 consented to be interviewed.
The nine eligible women who did not respond or declined to participate were enrolled
in the BUAS. Two of the 14 respondents had pregnancies reported to both the BUAS
and the CTIS. Nine respondents were interviewed in person and five by telephone.
The interview included questions on indications for and use of isotretinoin, contracep-
tive history, pregnancy history, procedures used in the initial prescription of isotreti-
noin, and recall of advertisements for prescription acne medication.
The 14 respondents were aged 15–39 years at the time of the exposed pregnancy
(median age: 25.5 years); 10 (71%) were aged 21–39 years. Eight (57%) reported hav-
ing at least one instance of sexual intercourse without using contraception at the time
of the exposed pregnancy; 13 (93%) did not use two forms of contraception as recom-
mended in the PPP procedures. Ten had pregnancy tests before starting isotretinoin;
however, three whose pregnancy test results were negative were pregnant when they
began taking isotretinoin. Two respondents reported that their exposed pregnancies
occurred while using leftover isotretinoin from earlier prescriptions, and one received
and filled the isotretinoin prescription in Mexico.
Seven (50%) respondents reported viewing an advertisement for prescription acne
treatment before taking isotretinoin. Four of the seven reported that the advertise-
ment contributed to their decision to seek acne treatment and to ask their physician
about isotretinoin. Four live-born infants with no major malformations resulted from
these 14 pregnancies. One live-born infant had major malformations. The other preg-
nancy outcomes were four spontaneous abortions and five induced abortions. No
information was available on the presence of malformations in the aborted fetuses.
Although all 14 respondents knew that isotretinoin should not be used during preg-
nancy, none reported seeing all components of the PPP, and four had not seen any
component other than the information available on the isotretinoin packet. None of
the women reported being referred for contraceptive counseling or being told that
they would not have to pay for the counseling.
Case Reports
Case 1. After taking isotretinoin for 1 month, a 25-year-old woman was notified by
her dermatologist that her pregnancy test was positive, despite negative results on a
pregnancy test before beginning isotretinoin. She had been using two forms of con-
traception but did not wait for menstruation before starting isotretinoin therapy as
recommended by the PPP. Her infant was born with multiple anomalies including
complex congenital heart disease consisting of double outlet right ventricle with
dextrocardia and aortic atresia, hydrocephalus, and facial dysmorphism. After exten-
sive medical treatment and cardiac surgery, the infant died at age 9 weeks.
Case 2. A 35-year-old woman who had been taking isotretinoin for approximately
6 months tested positive on a home pregnancy test. She was 12 weeks pregnant when
she discontinued isotretinoin use. Since 1989, she had had three isotretinoin-exposed
pregnancies; only the third pregnancy resulted in a live birth. The first course of
isotretinoin was prescribed by a dermatologist; she obtained the other prescriptions
Vol. 49 / No. 2 MMWR 29
Accutane-Exposed Pregnancies — Continued
from a friend who was a health-care worker. The outcome of the third exposed preg-
nancy was a full-term infant with no apparent malformations.
Case 3. A 35-year-old woman who was using an intrauterine device tested positive
on a home pregnancy test. She had been taking isotretinoin for approximately 3 years
before this pregnancy and had taken two doses of isotretinoin since her last menstrual
period. She did not have acne. She took isotretinoin for approximately 1 week each
month before menstruation to prevent oily skin. She was a health-care provider and
received the prescription from a colleague who did not ask about or recommend con-
traception. She elected to terminate the pregnancy because of the exposure.Reported by: CD Chambers, MPH, KL Jones, MD, Dept of Pediatrics, Div of Dysmorphology andTeratology, Univ of California, San Diego, La Jolla; EJ Lammer, MD, Children’s Hospital,Oakland, California. CM Van Bennekom, MPH, AA Mitchell, MD, Slone Epidemiology Unit,Boston Univ, Boston, Massachusetts. Birth Defects and Pediatric Genetics Br, Div of BirthDefects, Child Development, and Disability and Health (proposed), National Center for Environ-mental Health, CDC.
Editorial Note: These cases identified challenges to preventing isotretinoin-exposed
pregnancies; 13 of the 14 respondents did not use two forms of effective contracep-
tion, and eight had used no contraception when the exposed pregnancy occurred. The
study also illustrated problems with acquiring a prescription outside a clinical setting,
using leftover medication, purchasing the medication outside the United States, fail-
ing to perform pregnancy testing before therapy, and failing to wait 3 days after men-
struation before beginning treatment (5,7 ).
Although the 14 respondents did not represent all women taking isotretinoin or all
women with isotretinoin-exposed pregnancies, they were similar to others enrolled in
the BUAS (e.g., the average age of the respondents was similar to the women enrolled
in the BUAS [median: 26 years]) (5 ); however, respondents included more women
aged >30 years than in previous studies of isotretinoin-exposed pregnancies (6,7 ).
Seventy-one percent had some type of pregnancy test before starting isotretinoin,
which is similar to the 60% reported for all women enrolled in the BUAS (5 ). The
highest percentage of pregnancies in the BUAS occurred among women using oral
contraceptives (5 ); nevertheless, more than half the 14 respondents reported at least
one instance of sexual intercourse when contraception was not used, indicating that
failure to use contraception may be as important as contraceptive failure.
The warning label on isotretinoin packaging states that it should not be used by
women of childbearing potential unless the patient meets such conditions as having
“severe, disfiguring nodular acne that is recalcitrant to standard therapies” (1 ). At
least half of the 14 respondents reported that they did not meet this definition. Recent
reports suggest that some dermatologists view isotretinoin as an effective method for
treating conditions other than cystic acne (8,9 ). More widespread use of isotretinoin
may result in more isotretinoin-exposed pregnancies.
The findings in this study are subject to at least two limitations. First, these cases
were a convenience sample of 14 women from California, and they may not represent
all isotretinoin-exposed pregnancies. Second, the findings cannot be generalized to
evaluate the overall effectiveness of the PPP or other prevention programs.
Despite the increased demand that may be generated by Accutane advertising (10 ),
physicians should limit use of the drug in women of childbearing potential to those
who meet the criteria on the package insert. When isotretinoin treatment is necessary,
physicians should provide precautions, contraindications, and all PPP elements; care
30 MMWR January 21, 2000
Accutane-Exposed Pregnancies — Continued
should be taken by women and their physicians to ensure that contraceptive recom-
mendations are understood and followed. In addition, women of childbearing poten-
tial should not use isotretinoin unless they are under the care of a physician familiar
with isotretinoin use.
References1. Medical Economics Company. Physicians’ desk reference. 53rd edition. Montvale, New Jersey:
Medical Economics Company, 1999.2. Lammer EJ, Chen DT, Hoar RM, et al. Retinoic acid embryopathy. N Engl J Med 1985;313:
837–41.3. CDC. Birth defects caused by isotretinoin—New Jersey. MMWR 1988;37:171–2,177.
4. Dermatologic Drugs Advisory Committee. Open public hearings on NDA 18-662 Accutane(isotretinoin capsules) [Transcript]. Rockville, Maryland: US Department of Health and HumanServices, Food and Drug Administration, Center for Drug Evaluation and Research, 1988.
5. Mitchell AA, Van Bennekom CM, Louik C. A pregnancy-prevention program in women of child-bearing age receiving isotretinoin. N Engl J Med 1995;333:101–6.
6. Pastuszak A, Koren G, Rieder MJ. Use of the retinoid pregnancy prevention program in Canada:patterns of contraception use in women treated with isotretinoin and etretinate. Reprod Toxicol1994;8:63–8.
7. Atanackovic G, Koren G. Fetal exposure to oral isotretinoin: failure to comply with the preg-nancy prevention program. CMAJ 1999;160:1719–20.
8. Cunliffe WJ, van de Kerkhof PCM, Caputo R, et al. Roaccutane treatment guidelines: resultsof an international survey. Dermatology 1997;194:351–7.
9. Newton JN. How cost effective is oral isotretinoin? Dermatology 1997;195:S10–S14.
10. Hollon MF. Direct-to-consumer marketing of prescription drugs: creating consumer demand.JAMA 1999;281:382–4.
Accutane-Exposed Pregnancies — Continued
Update: Raccoon Rabies Epizootic — United States and Canada, 1999
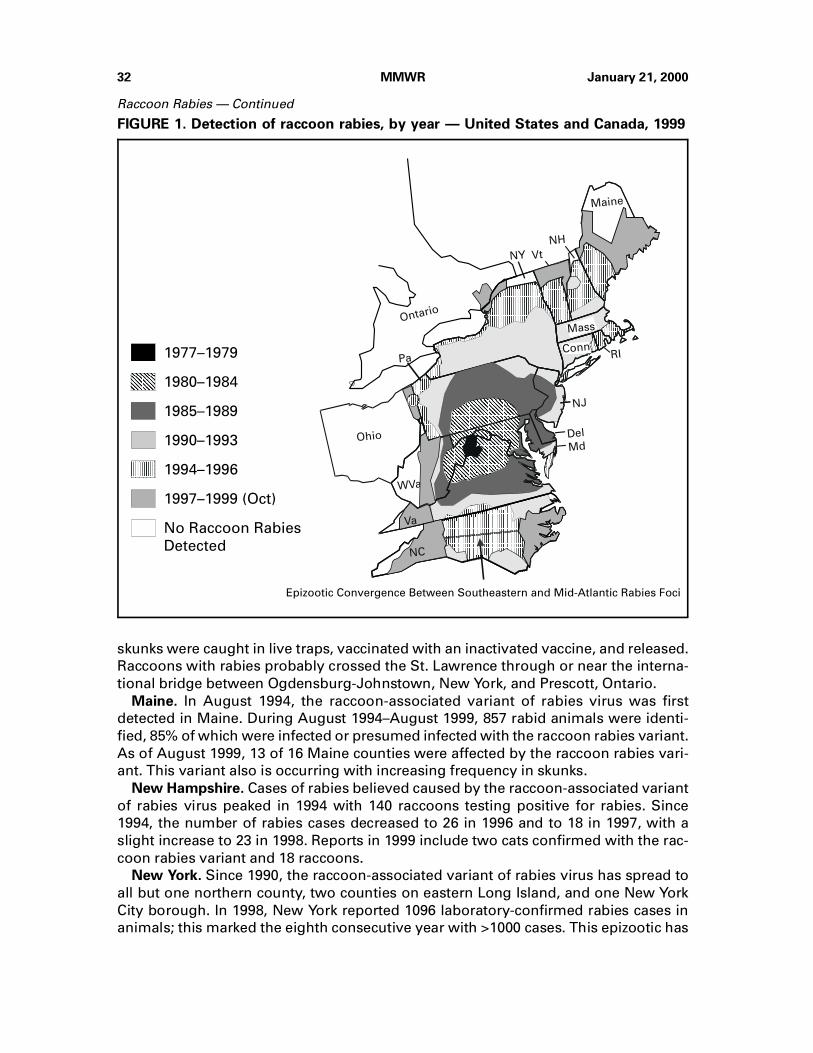
Raccoon Rabies — ContinuedIn 1977, an outbreak of raccoon rabies was detected in an area on the West Virginia-
Virginia border (1 ). Since then, the area affected by this distinct variant of rabies virus
associated with raccoons has spread to Ohio in the west and New York, Pennsylvania,
Vermont, New Hampshire, and Maine in the north (Figure 1). In addition, the once
separate epizootics of rabies among raccoons in the southeastern and mid-Atlantic
states converged in North Carolina. In July 1999, the raccoon rabies virus variant was
reported from Ontario, Canada, on the New York border. This report describes the
spread of this epizootic of raccoon rabies through mid-Atlantic and northeastern
states and into Canada.
Canada. On July 14, 1999, the first case of rabies caused by the raccoon-associated
variant was diagnosed in a raccoon across the St. Lawrence River from Ogdensburg,
New York, in a village northwest of Prescott, Ontario. A second case was identified on
July 26, 9 miles west of the first case. A third case was diagnosed on September 17,
approximately 9 miles north of the other two cases. The Ontario Ministry of Natural
Resources (OMNR) has been conducting trap-vaccinate-release programs for several
years at the major border crossings in the St. Lawrence and Niagara areas to build
defensive zones of vaccinated raccoons to minimize the spread of epizootic rabies.
These first cases occurred outside the vaccinated zone. A total of 880 raccoons,
220 striped skunks, and one red fox, captured within a 3-mile radius of each of the first
two cases, were negative for rabies by immunofluorescence test (OMNR, unpublished
data, 2000). In approximately 3 miles around the point-control area, raccoons and
Vol. 49 / No. 2 MMWR 31
Accutane-Exposed Pregnancies — Continued
skunks were caught in live traps, vaccinated with an inactivated vaccine, and released.
Raccoons with rabies probably crossed the St. Lawrence through or near the interna-
tional bridge between Ogdensburg-Johnstown, New York, and Prescott, Ontario.
Maine. In August 1994, the raccoon-associated variant of rabies virus was first
detected in Maine. During August 1994–August 1999, 857 rabid animals were identi-
fied, 85% of which were infected or presumed infected with the raccoon rabies variant.
As of August 1999, 13 of 16 Maine counties were affected by the raccoon rabies vari-
ant. This variant also is occurring with increasing frequency in skunks.
New Hampshire. Cases of rabies believed caused by the raccoon-associated variant
of rabies virus peaked in 1994 with 140 raccoons testing positive for rabies. Since
1994, the number of rabies cases decreased to 26 in 1996 and to 18 in 1997, with a
slight increase to 23 in 1998. Reports in 1999 include two cats confirmed with the rac-
coon rabies variant and 18 raccoons.
New York. Since 1990, the raccoon-associated variant of rabies virus has spread to
all but one northern county, two counties on eastern Long Island, and one New York
City borough. In 1998, New York reported 1096 laboratory-confirmed rabies cases in
animals; this marked the eighth consecutive year with >1000 cases. This epizootic has
Pa
WVa
NY Vt
NH
Maine
MdDel
NJ
RI
Ohio
Mass
Conn
Ontario
NC
Va
Epizootic Convergence Between Southeastern and Mid-Atlantic Rabies Foci
1977–1979
1980–1984
1985–1989
1990–1993
1994–1996
1997–1999 (Oct)
No Raccoon Rabies
Detected
FIGURE 1. Detection of raccoon rabies, by year — United States and Canada, 1999
32 MMWR January 21, 2000
Raccoon Rabies — Continued
been associated with raccoon rabies in domestic and wild animals, including one
black bear and 31 white-tailed deer.
North Carolina. The raccoon rabies epizootic continues to spread to the east and
west and affects >80% of North Carolina counties. Rabies has been found in western
North Carolina in Watauga County, approximately 6 miles from the Tennessee border.
No cases of rabies among raccoons have been reported from neighboring Tennessee
counties.
Ohio. In early 1997, rabies among raccoons was first reported from northeastern
Ohio. By the end of 1997, three counties bordering Pennsylvania reported 62 rabid
animals, including 59 raccoons. Within 2 months of confirmation of the outbreak, the
Ohio Department of Health (ODH), with support from CDC and the U.S. Department of
Agriculture, implemented an oral rabies vaccination (ORV) program in counties along
the Pennsylvania border. In May and September 1997 and in April and October 1998,
ORV treatment was delivered. In May and September 1999, ODH distributed 1,459,442
vaccine-laden baits for animals; the treatment area covered 4037 square miles. After
implementing ORV, reported cases of animals infected with the raccoon-associated
rabies variant decreased to 26 (20 raccoons) in 1998. As of November 11, five raccoons
and a chipmunk infected with the raccoon-associated rabies variant have been
reported in 1999.
Vermont. The raccoon-associated variant of rabies virus was first identified in
Vermont in 1994. By 1998, the epizootic had progressed into the north central counties
of the state. An ORV campaign along the Canadian border initiated in 1997 appears to
have decreased the reported number of rabies cases in that region, and no rabies has
been reported associated with this variant across the Canadian border.
Virginia. In 1978, raccoon rabies was first identified in Virginia in a county bordering
the West Virginia county that initially reported the new outbreak in 1977. Counties in
southwestern Virginia continue to be affected by raccoon rabies. In 1998 and 1999,
cases have been reported as far west as Russell and Washington counties.
West Virginia. Raccoon rabies became established in eastern West Virginia in
approximately 1977. The Appalachian Mountains presented a barrier to the westward
spread of the raccoon-associated rabies variant; however, in 1997, a rabid raccoon
was found in Ritchie County, one county east of the Ohio River. In 1999, 23 rabid
raccoons were identified from Monongalia and Marion counties on the northwestern
border.Reported by: AI Wandeler, PhD, Center of Expertise for Rabies, Animal Diseases ResearchInstitute, Canadian Food Inspection Agency; RC Rosatte, Rabies Unit, Wildlife Research Section,Ontario Ministry of Natural Resources. D Williams, TK Lee, DrPH, KF Gensheimer, MD, StateEpidemiologist, Maine Dept of Human Svcs. JT Montero, MD, Bur of Communicable DiseaseControl, New Hampshire Dept of Health and Human Svcs. CV Trimarchi, DL Morse, MD, MEidson, DVM, PF Smith, MD, State Epidemiologist, New York State Dept of Health. JL Hunter,DVM, North Carolina Dept of Health and Human Services. KA Smith, DVM, Ohio Dept of Health.RH Johnson, DVM, Vermont Dept of Health. SR Jenkins, VMD, Virginia Dept of Health. CBerryman, DVM, Div of Surveillance and Disease Control, West Virginia Dept of Health andHuman Resources. Viral and Rickettsial Zoonoses Br, Div of Viral and Rickettsial Diseases,National Center for Infectious Diseases; and an EIS Officer, CDC.
Editorial Note: Raccoons have accounted for the largest percentage of animal rabies
cases reported to CDC since 1990. In 1998, 44% of all rabies cases among animals
in the United States occurred among raccoons. From 1990 to 1998, 35,264 cases of
Vol. 49 / No. 2 MMWR 33
Raccoon Rabies — Continued
raccoon rabies were reported in the United States. Of those 35,033 (99.3%) occurred in
eastern states where raccoon rabies is enzootic.
Since the start of the mid-Atlantic epizootic of rabies involving the raccoon-associ-
ated variant of rabies virus, the epizootic front has progressed at approximately 18–
24 miles each year (2–4 ). The progress of the epizootic appears most rapid in
preferred raccoon habitats; however, major physiographic barriers, such as rivers and
mountain ranges, can impede the epizootic advance (3–5 ). Although the Appalachian
Mountains slowed the westward progression of the epizootic for more than a decade,
counties in western Virginia and western North Carolina are reporting raccoon rabies
cases. The threat of rabies introduction into counties in eastern Ohio soon may
include much of the border with West Virginia in addition to the border with Pennsyl-
vania. Once raccoon rabies becomes established in the Ohio River valley, few physio-
graphic barriers remain to prevent its spread throughout the midwestern United
States.
In the northern United States, the raccoon-associated variant of rabies virus has
crossed the St. Lawrence River and reached Canada. As of January 2000, eight cases
of raccoon rabies have been found in Ontario (RC Rosatte, OMNR, personal communi-
cation, 2000). Whether Canadian attempts at outbreak intervention (6 ) involving local
raccoon population control and establishing an immune barrier are successful will
require ongoing active surveillance. However, incursions of infected raccoons into
Canada from other sites along the U.S. border where rabies is endemic will continue
to occur unless control efforts on both sides of the border are effective.
Although human rabies is rare in the United States and Canada, the costs associ-
ated with rabies prevention are substantial (2,7 ). Where epizootics of raccoon rabies
have occurred, the number of costly human postexposure treatments has increased
dramatically (8 ). Although ORV immune barriers to prevent epizootic spread of wild-
life rabies exist in several states, their maintenance requires substantial annual expen-
ditures (9 ). Even when economic arguments for the use of wildlife rabies control in
certain circumstances exist, active intervention to control wildlife rabies and public
support for these activities in the United States are limited. The usefulness of ORV
showed that targeting raccoon habitats with ORV increased vaccination rates to 63%,
which was sufficient to halt the spread of rabies in free-ranging raccoons (10 ). How-
ever, ORV or other methods for eliminating or reducing rabies cases among raccoons
after the disease has become endemic are generally unproven and need further
assessment. In addition to educational initiatives and effective public health surveil-
lance, prevention of human and domestic animal rabies primarily relies on the public
to keep pets vaccinated and to reduce the number of stray animals.
References1. Jenkins SR, Perry BD, Winkler WG. Ecology and epidemiology of raccoon rabies. Rev Infect
Dis 1998;10(suppl)4:S620–S625.2. Rupprecht CE, Smith JS. Raccoon rabies: the re-emergence of an epizootic in a densely popu-
lated area. Semin Virol 1994;5:155–64.3. Wilson ML, Bretsky PM, Cooper GH, et al. Emergence of raccoon rabies in Connecticut, 1991–
1994: spatial and temporal characteristics of animal infection and human contact. Am J TropMed Hyg 1997;57:457–63.
4. Moore DA. Spatial diffusion of raccoon rabies in Pennsylvania. Prev Vet Med 1999;40:19–32.
5. Carey AB, Giles RH, McLean RG. The landscape epidemiology of rabies in Virginia. Am JTrop Med Hyg 1978;27:573–80.
34 MMWR January 21, 2000
Raccoon Rabies — Continued
6. Rosatte RC, Howard DR, Campbell JB, MacInnes CD. Intramuscular vaccination of skunks andraccoons against rabies. J Wildl Dis 1990;26:225–30.
7. Fishbein DB, Arcangeli S. Rabies prevention in primary care: a four-step approach. PostgradMed 1987;82:83–90,93–5.
8. CDC. Update: raccoon rabies epizootic—United States, 1996. MMWR 1997;45:1116–20.
9. Meltzer MI, Rupprecht CE. A review of the economics of the prevention and control of rabies.Part 2: rabies in dogs, livestock and wildlife. Pharmacoeconomics 1998;13:481–98.
10. Robbins AH, Borden MD, Windmiller BS, et al. Prevention of the spread of rabies to wildlifeby oral vaccination of raccoons in Massachusetts. JAVMA 1998;213:1407–12.
Raccoon Rabies — Continued
Notice to Readers
Notices to Readers — Continued
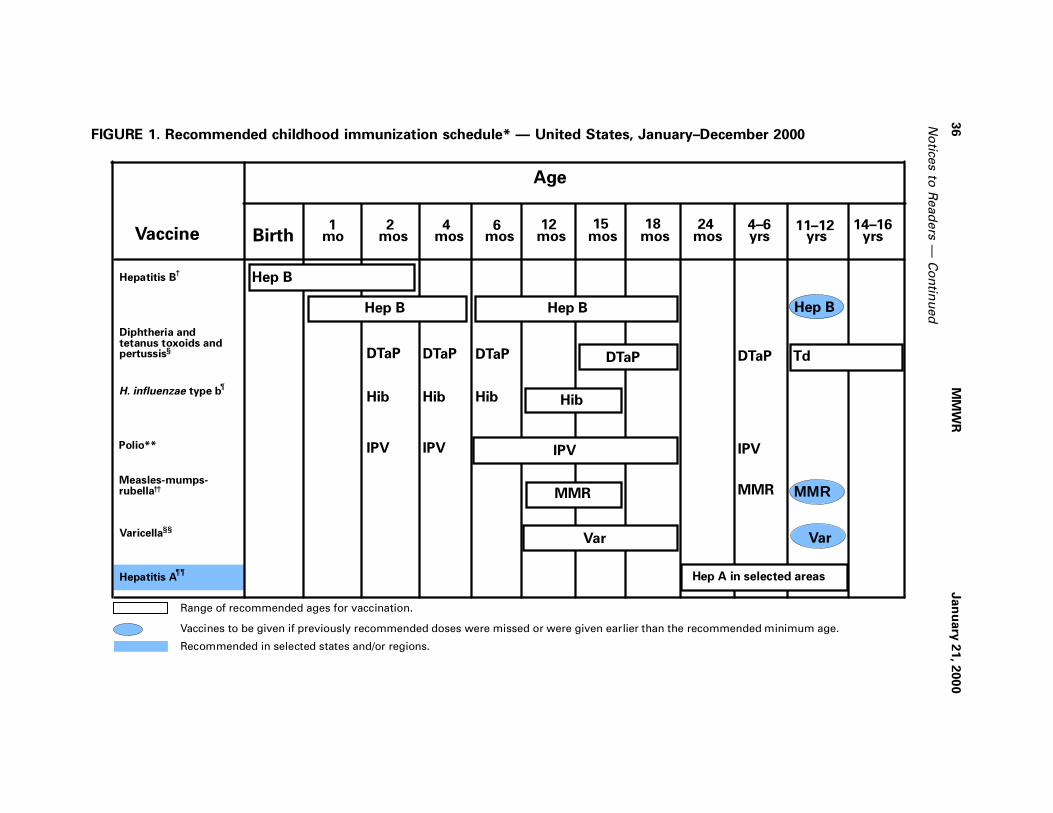
Recommended Childhood Immunization Schedule —United States, 2000
Each year, CDC’s Advisory Committee on Immunization Practices (ACIP) reviews the
recommended childhood immunization schedule to ensure it remains current with
changes in manufacturers’ vaccine formulations, revisions in recommendations for
the use of licensed vaccines, and recommendations for newly licensed vaccines. This
report presents the recommended childhood immunization schedule for 2000
(Figure 1) and explains the changes that have occurred since January 1999.
Since the publication of the immunization schedule in January 1999 (1 ), ACIP, the
American Academy of Family Physicians, and the American Academy of Pediatrics
have recommended removal of rotavirus vaccine from the schedule, endorsed an
all-inactivated poliovirus vaccine (IPV) schedule for polio vaccination, recommended
exclusive use of acellular pertussis vaccines for all doses of the pertussis vaccine
series, and added hepatitis A vaccine (Hep A) to the schedule to reflect its recom-
mended use in selected geographic areas (2 ). Detailed recommendations for using
vaccines are available from the manufacturers’ package inserts, ACIP statements on
specific vaccines, and the 1997 Red Book (3 ). ACIP statements for each recommended
childhood vaccine can be viewed, downloaded, and printed at CDC’s National Immu-
nization Program World-Wide Web site, http://www.cdc.gov/nip/publications/
acip-list.htm.
Removal of Rotavirus Vaccine from the Schedule
On October 22, 1999, ACIP recommended that Rotashield®* (rhesus rotavirus
vaccine-tetravalent [RRV-TV]) (Wyeth Laboratories, Inc., Marietta, Pennsylvania), the
only U.S. licensed rotavirus vaccine, no longer be used in the United States (4 ). The
decision was based on the results of an expedited review of scientific data presented
to ACIP by CDC. Data from the review indicated a strong association between RRV-TV
and intussusception among infants 1–2 weeks following vaccination. Vaccine use was
suspended in July pending the ACIP data review. Parents should be reassured that
children who received the rotavirus vaccine before July are not at increased risk for
intussusception now. The manufacturer withdrew the vaccine from the market in
October.
*Use of trade names and commercial sources is for identification only and does not constituteor imply endorsement by CDC or the U.S. Department of Health and Human Services.
Vol. 49 / No. 2 MMWR 35
Raccoon Rabies — Continued
No
tices to
Read
ers
— C
on
tinu
ed
36
MM
WR
Jan
uary
21, 2
00
0
MMR
Var
BirthVaccine4
mos6
mos18
mos4–6yrs
11–12yrs
14–16yrs
1mo
12mos
TdDTaP DTaPDTaP
Diphtheria and tetanus toxoids and pertussis
Hib Hib Hib HibH. influenzae type b
Hep B
Hep BHepatitis B†
IPV IPVIPVIPVPolio**
MMRMeasles-mumps- rubella MMR
Varicella Var
††
2mos
§§
DTaP
Hep B
DTaP
¶
Hepatitis A Hep A in selected areas¶¶
24mos
Hep B
Age
Range of recommended ages for vaccination.
Vaccines to be given if previously recommended doses were missed or were given earlier than the recommended minimum age.
Recommended in selected states and/or regions.
mos15
§
FIGURE 1. Recommended childhood immunization schedule* — United States, January–December 2000
No
tices to
Read
ers
— C
on
tinu
ed
Vo
l. 49 / N
o. 2
MM
WR
37
On October 22, 1999, the Advisory Committee on Immunization Practices (ACIP) recommended that Rotashield®
(rhesus rotavirus vaccine-tetravalent [RRV-TV]),the only U.S.-licensed rotavirus vaccine, no longer be used in the United States (MMWR, Vol. 48, No. 43, November 5, 1999). Parents should be reassuredthat children who received rotavirus vaccine before July 1999 are not now at increased risk for intussusception.
* This schedule indicates the recommended ages for routine administration of licensed childhood vaccines as of November 1, 1999. Any dose not givenat the recommended age should be given as a “catch-up” vaccination at any subsequent visit when indicated and feasible. Additional vaccines may belicensed and recommended during the year. Licensed combination vaccines may be used whenever any components of the combination are indicatedand the vaccine’s other components are not contraindicated. Providers should consult the manufacturers’ package inserts for detailed recommendations.
†Infants born to hepatitis B surface antigen (HBsAg)-negative mothers should receive the first dose of hepatitis B vaccine (Hep B) by age 2 months. Thesecond dose should be administered at least 1 month after the first dose. The third dose should be administered at least 4 months after the first doseand at least 2 months after the second dose, but not before age 6 months. Infants born to HBsAg-positive mothers should receive Hep B and 0.5 mLhepatitis B immune globulin (HBIG) within 12 hours of birth at separate sites. The second dose is recommended at age 1–2 months and the third doseat age 6 months. Infants born to mothers whose HBsAg status is unknown should receive Hep B within 12 hours of birth. Maternal blood should bedrawn at delivery to determine the mother’s HBsAg status; if the HBsAg test is positive, the infant should receive HBIG as soon as possible (no laterthan age 1 week). All children and adolescents (through age 18 years) who have not been vaccinated against hepatitis B may begin the series duringany visit. Providers should make special efforts to vaccinate children who were born in or whose parents were born in areas of the world where hepatitisB virus infection is moderately or highly endemic.
§The fourth dose of diphtheria and tetanus toxoids and acellular pertussis vaccine (DTaP) can be administered as early as age 12 months, provided6 months have elapsed since the third dose and the child is unlikely to return at age 15–18 months. Tetanus and diphtheria toxoids (Td) is recommendedat age 11–12 years if at least 5 years have elapsed since the last dose of diphtheria and tetanus toxoids and pertussis vaccine (DTP), DTaP, or diphtheriaand tetanus toxoids (DT). Subsequent routine Td boosters are recommended every 10 years.
¶Three Haemophilus influenzae type b (Hib) conjugate vaccines are licensed for infant use. If Hib conjugate vaccine (PRP-OMP) (PedvaxHIB
® or ComVax
®
[Merck]) is administered at ages 2 months and 4 months, a dose at age 6 months is not required. Because clinical studies in infants have demonstratedthat using some combination products may induce a lower immune response to the Hib vaccine component, DTaP/Hib combination products shouldnot be used for primary vaccination in infants at ages 2, 4, or 6 months unless approved by the Food and Drug Administration for these ages.
** To eliminate the risk for vaccine-associated paralytic poliomyelitis (VAPP), an all-inactivated poliovirus vaccine (IPV) schedule is now recommended forroutine childhood polio vaccination in the United States. All children should receive four doses of IPV: at age 2 months, age 4 months, between ages6 and 18 months, and between ages 4 and 6 years. Oral poliovirus vaccine (OPV) (if available) may be used only for the following special circumstances:1) mass vaccination campaigns to control outbreaks of paralytic polio; 2) unvaccinated children who will be traveling in <4 weeks to areas where poliois endemic or epidemic; and 3) children of parents who do not accept the recommended number of vaccine injections. Children of parents who do notaccept the recommended number of vaccine injections may receive OPV only for the third or fourth dose or both; in this situation, health-care providersshould administer OPV only after discussing the risk for VAPP with parents or caregivers. During the transition to an all-IPV schedule, recommendationsfor the use of remaining OPV supplies in physicians’ offices and clinics have been issued by the American Academy of Pediatrics (Pediatrics, Vol. 104,No. 6, December 1999).
††The second dose of measles, mumps, and rubella vaccine (MMR) is recommended routinely at age 4–6 years but may be administered during any visit,provided at least 4 weeks have elapsed since receipt of the first dose and that both doses are administered beginning at or after age 12 months. Thosewho previously have not received the second dose should complete the schedule no later than the routine visit to a health-care provider at age 11–12 years.
§§Varicella (Var) vaccine is recommended at any visit on or after the first birthday for susceptible children, i.e., those who lack a reliable history of chickenpox(as judged by a health-care provider) and who have not been vaccinated. Susceptible persons aged ≥13 years should receive two doses given at least4 weeks apart.
¶¶Hepatitis A vaccine (Hep A) is recommended for use in selected states and regions. Information is available from local public health authorities andMMWR, Vol. 48, No. RR-12, October 1, 1999.
Use of trade names and commercial sources is for identification only and does not constitute or imply endorsement by CDC or the U.S. Department of Healthand Human Services.
Source: Advisory Committee on Immunization Practices (ACIP), American Academy of Family Physicians (AAFP), and American Academy of Pediatrics (AAP).
Inactivated Poliovirus Vaccine for All Four Doses
As the global eradication of poliomyelitis continues, the risk for importation of wild-
type poliovirus into the United States decreases dramatically. To eliminate the risk for
vaccine-associated paralytic poliomyelitis (VAPP), an all-IPV schedule is recom-
mended for routine childhood vaccination in the United States (5 ). All children should
receive four doses of IPV: at age 2 months, age 4 months, between ages 6 and
18 months, and between ages 4 and 6 years. Oral poliovirus vaccine (OPV), if avail-
able, may be used only for the following special circumstances:
1. Mass vaccination campaigns to control outbreaks of paralytic polio.
2. Unvaccinated children who will be traveling within 4 weeks to areas where
polio is endemic or epidemic.
3. Children of parents who do not accept the recommended number of vaccine
injections; these children may receive OPV only for the third or fourth dose or
both. In this situation, health-care providers should administer OPV only after
discussing the risk for VAPP with parents or caregivers.
OPV supplies are expected to be very limited in the United States after inventories
are depleted. ACIP reaffirms its support for the global eradication initiative and use of
OPV as the vaccine of choice to eradicate polio where it is endemic.
Acellular Pertussis Vaccine
ACIP recommends exclusive use of acellular pertussis vaccines for all doses of the
pertussis vaccine series. The fourth dose may be administered as early as age
12 months, provided 6 months have elapsed since the third dose and the child is
unlikely to return at 15–18 months.
Hepatitis A
Hepatitis A vaccine (Hep A) is listed on the schedule for the first time because it is
recommended for routine use in some states and regions. Its appearance on the
schedule alerts providers to consult with their local public health authority to learn the
current recommendations for hepatitis A vaccination in their community. Additional
information on the use of Hep A can be found in recently published guidelines (2 ).
Hepatitis B
Special considerations apply in the selection of hepatitis B vaccine products for the
dose administered at birth (6 ).
Vaccine Information Statements
The National Childhood Vaccine Injury Act requires that all health-care providers,
whether public or private, give to parents or patients copies of Vaccine Information
Statements before administering each dose of the vaccines listed in this schedule
(except Hep A). Vaccine Information Statements, developed by CDC, can be obtained
from state health departments and CDC’s World-Wide Web site, http://www.cdc.gov/
nip/publications/VIS. Instructions on use of the Vaccine Information Statements are
available from CDC’s website or the December 17, 1999, Federal Register (64 FR
70914).
References1. CDC. Recommended childhood immunization schedule—United States, 1999. MMWR 1999;
48:12–6.
(Continued on page 47)
38 MMWR January 21, 2000
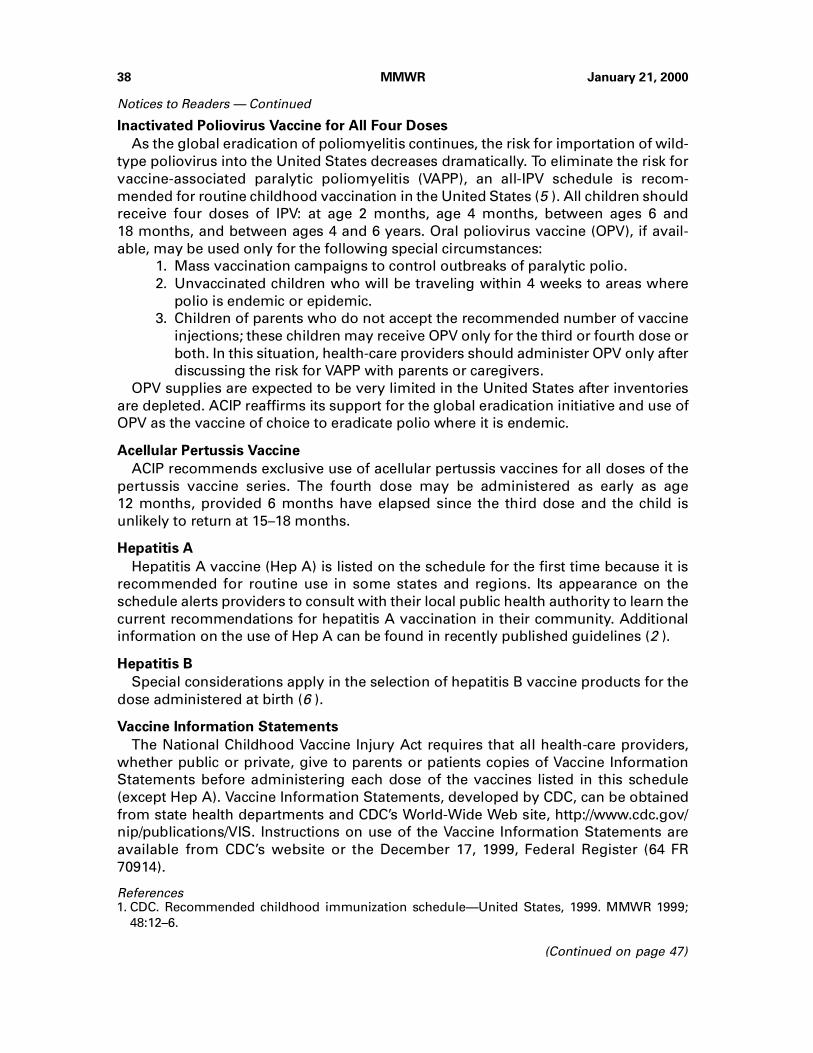
Notices to Readers — Continued
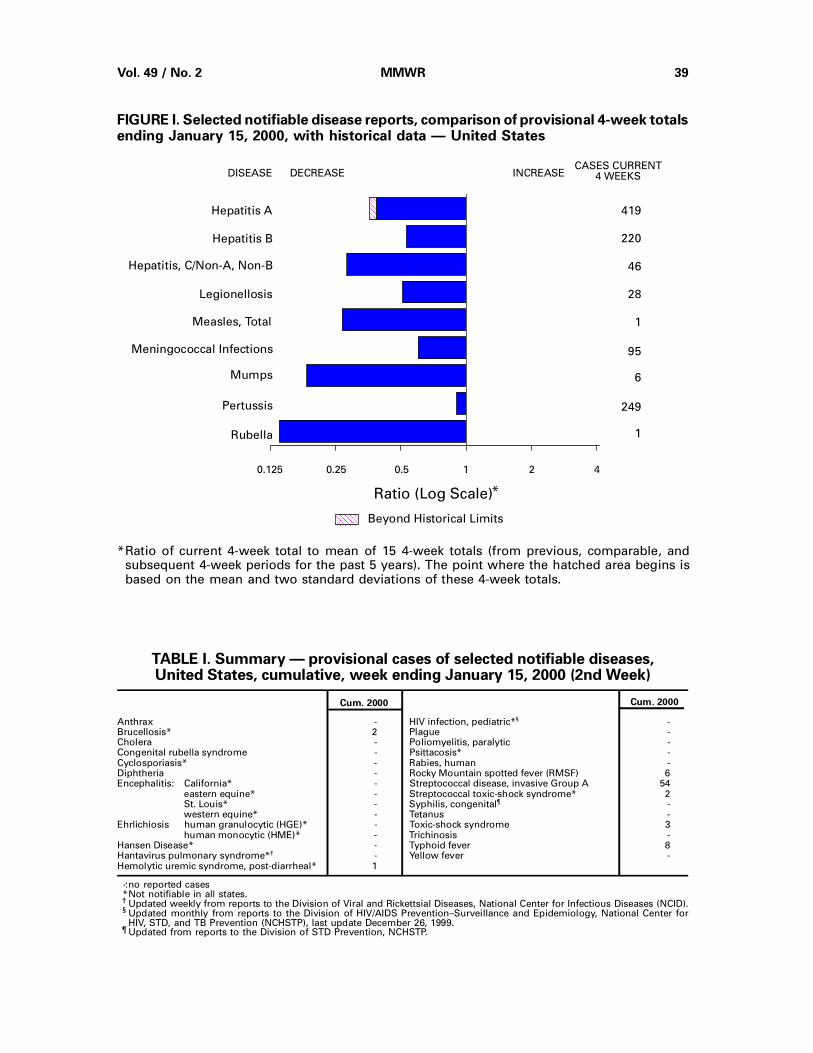
FIGURE I. Selected notifiable disease reports, comparison of provisional 4-week totalsending January 15, 2000, with historical data — United States
Anthrax - HIV infection, pediatric*§ -Brucellosis* 2 Plague -Cholera - Poliomyelitis, paralytic -Congenital rubella syndrome - Psittacosis* -Cyclosporiasis* - Rabies, human -Diphtheria - Rocky Mountain spotted fever (RMSF) 6Encephalitis: California* - Streptococcal disease, invasive Group A 54
eastern equine* - Streptococcal toxic-shock syndrome* 2St. Louis* - Syphilis, congenital¶ -western equine* - Tetanus -
Ehrlichiosis human granulocytic (HGE)* - Toxic-shock syndrome 3human monocytic (HME)* - Trichinosis -
Hansen Disease* - Typhoid fever 8Hantavirus pulmonary syndrome*† - Yellow fever -Hemolytic uremic syndrome, post-diarrheal* 1
Cum. 2000Cum. 2000
TABLE I. Summary — provisional cases of selected notifiable diseases,United States, cumulative, week ending January 15, 2000 (2nd Week)
-: no reported cases *Not notifiable in all states. † Updated weekly from reports to the Division of Viral and Rickettsial Diseases, National Center for Infectious Diseases (NCID). § Updated monthly from reports to the Division of HIV/AIDS Prevention–Surveillance and Epidemiology, National Center for
HIV, STD, and TB Prevention (NCHSTP), last update December 26, 1999. ¶ Updated from reports to the Division of STD Prevention, NCHSTP.
DISEASE DECREASE INCREASECASES CURRENT
4 WEEKS
Ratio (Log Scale)*
AAAAAAAAAAAA
AAAAAA
Beyond Historical Limits
4210.50.250.125
419
220
46
28
1
95
6
249
1
Hepatitis A
Hepatitis B
Hepatitis, C/Non-A, Non-B
Legionellosis
Measles, Total
Mumps
Pertussis
Rubella
Meningococcal Infections
AAAAAAAAAAAAAAAAAA
*Ratio of current 4-week total to mean of 15 4-week totals (from previous, comparable, andsubsequent 4-week periods for the past 5 years). The point where the hatched area begins isbased on the mean and two standard deviations of these 4-week totals.
Vol. 49 / No. 2 MMWR 39
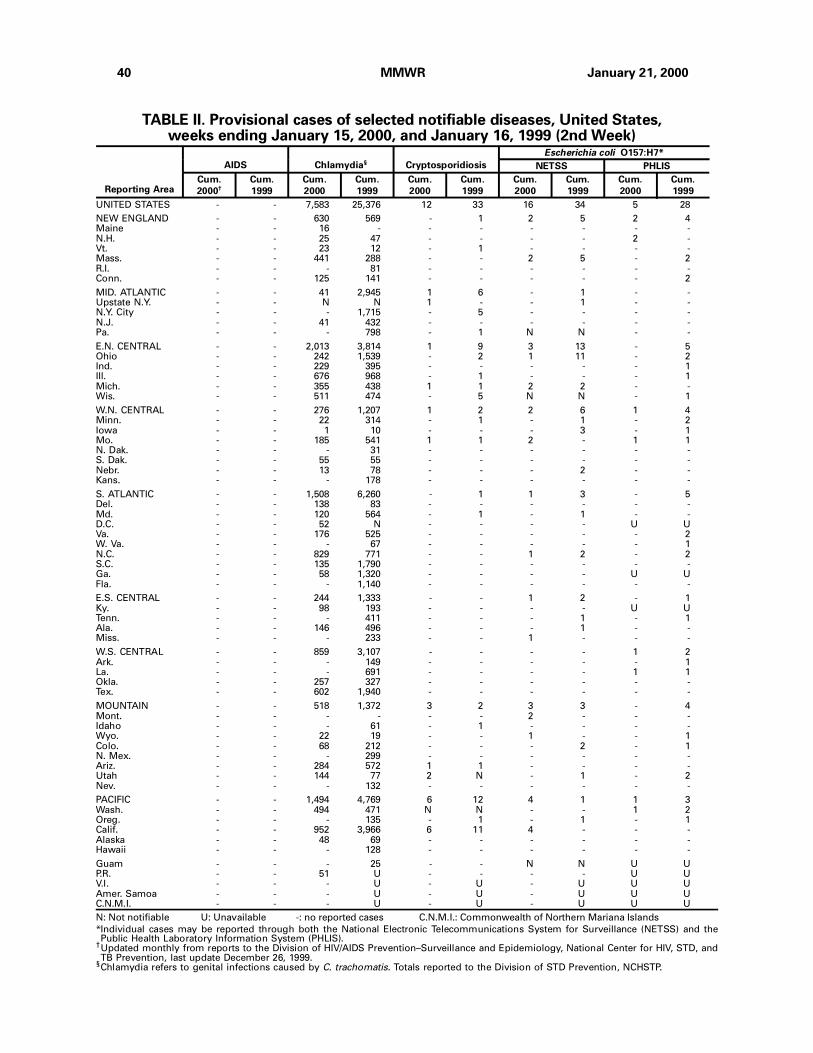
TABLE II. Provisional cases of selected notifiable diseases, United States,weeks ending January 15, 2000, and January 16, 1999 (2nd Week)
UNITED STATES - - 7,583 25,376 12 33 16 34 5 28
NEW ENGLAND - - 630 569 - 1 2 5 2 4Maine - - 16 - - - - - - -N.H. - - 25 47 - - - - 2 -Vt. - - 23 12 - 1 - - - -Mass. - - 441 288 - - 2 5 - 2R.I. - - - 81 - - - - - -Conn. - - 125 141 - - - - - 2
MID. ATLANTIC - - 41 2,945 1 6 - 1 - -Upstate N.Y. - - N N 1 - - 1 - -N.Y. City - - - 1,715 - 5 - - - -N.J. - - 41 432 - - - - - -Pa. - - - 798 - 1 N N - -
E.N. CENTRAL - - 2,013 3,814 1 9 3 13 - 5Ohio - - 242 1,539 - 2 1 11 - 2Ind. - - 229 395 - - - - - 1Ill. - - 676 968 - 1 - - - 1Mich. - - 355 438 1 1 2 2 - -Wis. - - 511 474 - 5 N N - 1
W.N. CENTRAL - - 276 1,207 1 2 2 6 1 4Minn. - - 22 314 - 1 - 1 - 2Iowa - - 1 10 - - - 3 - 1Mo. - - 185 541 1 1 2 - 1 1N. Dak. - - - 31 - - - - - -S. Dak. - - 55 55 - - - - - -Nebr. - - 13 78 - - - 2 - -Kans. - - - 178 - - - - - -
S. ATLANTIC - - 1,508 6,260 - 1 1 3 - 5Del. - - 138 83 - - - - - -Md. - - 120 564 - 1 - 1 - -D.C. - - 52 N - - - - U UVa. - - 176 525 - - - - - 2W. Va. - - - 67 - - - - - 1N.C. - - 829 771 - - 1 2 - 2S.C. - - 135 1,790 - - - - - -Ga. - - 58 1,320 - - - - U UFla. - - - 1,140 - - - - - -
E.S. CENTRAL - - 244 1,333 - - 1 2 - 1Ky. - - 98 193 - - - - U UTenn. - - - 411 - - - 1 - 1Ala. - - 146 496 - - - 1 - -Miss. - - - 233 - - 1 - - -
W.S. CENTRAL - - 859 3,107 - - - - 1 2Ark. - - - 149 - - - - - 1La. - - - 691 - - - - 1 1Okla. - - 257 327 - - - - - -Tex. - - 602 1,940 - - - - - -
MOUNTAIN - - 518 1,372 3 2 3 3 - 4Mont. - - - - - - 2 - - -Idaho - - - 61 - 1 - - - -Wyo. - - 22 19 - - 1 - - 1Colo. - - 68 212 - - - 2 - 1N. Mex. - - - 299 - - - - - -Ariz. - - 284 572 1 1 - - - -Utah - - 144 77 2 N - 1 - 2Nev. - - - 132 - - - - - -
PACIFIC - - 1,494 4,769 6 12 4 1 1 3Wash. - - 494 471 N N - - 1 2Oreg. - - - 135 - 1 - 1 - 1Calif. - - 952 3,966 6 11 4 - - -Alaska - - 48 69 - - - - - -Hawaii - - - 128 - - - - - -
Guam - - - 25 - - N N U UP.R. - - 51 U - - - - U UV.I. - - - U - U - U U UAmer. Samoa - - - U - U - U U UC.N.M.I. - - - U - U - U U U
N: Not notifiable U: Unavailable -: no reported cases C.N.M.I.: Commonwealth of Northern Mariana Islands
*Individual cases may be reported through both the National Electronic Telecommunications System for Surveillance (NETSS) and thePublic Health Laboratory Information System (PHLIS).
†Updated monthly from reports to the Division of HIV/AIDS Prevention–Surveillance and Epidemiology, National Center for HIV, STD, andTB Prevention, last update December 26, 1999.
§Chlamydia refers to genital infections caused by C. trachomatis. Totals reported to the Division of STD Prevention, NCHSTP.
Reporting Area
AIDS Chlamydia§ Cryptosporidiosis
Escherichia coli O157:H7*
NETSS PHLIS
Cum.
2000†
Cum.
1999
Cum.
2000
Cum.
1999
Cum.
2000
Cum.
1999
Cum.
2000
Cum.
1999
Cum.
2000
Cum.
1999
40 MMWR January 21, 2000
TABLE II. (Cont’d.) Provisional cases of selected notifiable diseases, United States,weeks ending January 15, 2000, and January 16, 1999 (2nd Week)
UNITED STATES 4,117 13,984 36 94 12 25 5 133
NEW ENGLAND 176 229 - - 2 2 - 19Maine - - - - 2 - - -N.H. 2 1 - - - - - -Vt. 1 3 - - - 1 - -Mass. 119 116 - - - 1 - 19R.I. - 22 - - - - - -Conn. 54 87 - - - - - -
MID. ATLANTIC 48 1,731 - 2 - 7 2 79Upstate N.Y. 37 61 - - - - 1 -N.Y. City - 877 - - - 2 - 4N.J. 11 343 - - - 2 - 45Pa. - 450 - 2 - 3 1 30
E.N. CENTRAL 1,248 2,122 11 50 4 10 - 5Ohio 104 576 - - 4 3 - 3Ind. 168 245 - - - - - -Ill. 326 765 - 1 - - - -Mich. 341 270 11 26 - 5 - -Wis. 309 266 - 23 - 2 U 2
W.N. CENTRAL 112 580 5 11 1 - - 1Minn. 16 131 - - - - - -Iowa 4 5 - - - - - -Mo. 87 331 5 11 1 - - -N. Dak. - 3 - - - - - -S. Dak. 4 8 - - - - - -Nebr. 1 34 - - - - - -Kans. - 68 - - - - - 1
S. ATLANTIC 1,446 4,493 1 4 3 2 2 22Del. 76 58 - - - 1 - 1Md. 69 796 - 3 2 - 2 18D.C. 67 127 - - - - - -Va. 212 653 - - - - - -W. Va. - 38 - - N N - -N.C. 851 705 1 1 1 1 - 3S.C. 110 654 - - - - - -Ga. 61 596 - - - - - -Fla. - 866 - - - - - -
E.S. CENTRAL 200 1,257 8 5 - 1 - 2Ky. 62 144 - - - 1 - -Tenn. - 318 - 2 - - - -Ala. 138 491 - 1 - - - 2Miss. - 304 8 2 - - - -
W.S. CENTRAL 378 2,085 - - - - - -Ark. - 68 - - - - - -La. - 697 - - - - - -Okla. 115 182 - - - - - -Tex. 263 1,138 - - - - - -
MOUNTAIN 197 398 4 7 - - - -Mont. - - - - - - - -Idaho - 5 - 1 - - - -Wyo. 1 1 4 2 - - - -Colo. 102 54 - 1 - - - -N. Mex. - 62 - 3 - - - -Ariz. 75 218 - - - - - -Utah 19 9 - - - - - -Nev. - 49 - - - - - -
PACIFIC 312 1,089 7 15 2 3 1 5Wash. 94 76 - - - - - -Oreg. - 26 - - N N - -Calif. 211 955 7 15 2 3 1 5Alaska 7 11 - - - - - -Hawaii - 21 - - - - N N
Guam - 3 - - - - - -P.R. 17 10 - - - - N NV.I. - U - U - U - UAmer. Samoa - U - U - U - UC.N.M.I. - U - U - U - U
N: Not notifiable U: Unavailable -: no reported cases
Reporting Area
Gonorrhea
Hepatitis
C/NA,NB Legionellosis
Lyme
Disease
Cum.
2000
Cum.
1999
Cum.
2000
Cum.
1999
Cum.
2000
Cum.
1999
Cum.
2000
Cum.
1999
Vol. 49 / No. 2 MMWR 41
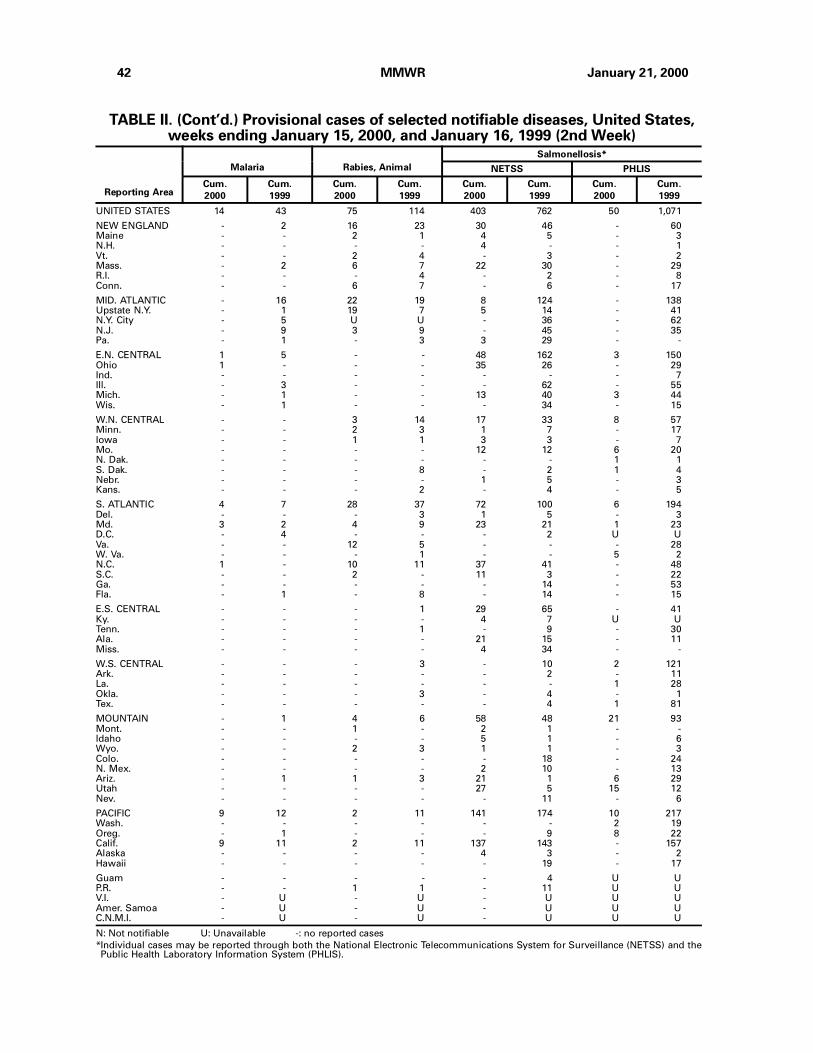
TABLE II. (Cont’d.) Provisional cases of selected notifiable diseases, United States,weeks ending January 15, 2000, and January 16, 1999 (2nd Week)
UNITED STATES 14 43 75 114 403 762 50 1,071
NEW ENGLAND - 2 16 23 30 46 - 60Maine - - 2 1 4 5 - 3N.H. - - - - 4 - - 1Vt. - - 2 4 - 3 - 2Mass. - 2 6 7 22 30 - 29R.I. - - - 4 - 2 - 8Conn. - - 6 7 - 6 - 17
MID. ATLANTIC - 16 22 19 8 124 - 138Upstate N.Y. - 1 19 7 5 14 - 41N.Y. City - 5 U U - 36 - 62N.J. - 9 3 9 - 45 - 35Pa. - 1 - 3 3 29 - -
E.N. CENTRAL 1 5 - - 48 162 3 150Ohio 1 - - - 35 26 - 29Ind. - - - - - - - 7Ill. - 3 - - - 62 - 55Mich. - 1 - - 13 40 3 44Wis. - 1 - - - 34 - 15
W.N. CENTRAL - - 3 14 17 33 8 57Minn. - - 2 3 1 7 - 17Iowa - - 1 1 3 3 - 7Mo. - - - - 12 12 6 20N. Dak. - - - - - - 1 1S. Dak. - - - 8 - 2 1 4Nebr. - - - - 1 5 - 3Kans. - - - 2 - 4 - 5
S. ATLANTIC 4 7 28 37 72 100 6 194Del. - - - 3 1 5 - 3Md. 3 2 4 9 23 21 1 23D.C. - 4 - - - 2 U UVa. - - 12 5 - - - 28W. Va. - - - 1 - - 5 2N.C. 1 - 10 11 37 41 - 48S.C. - - 2 - 11 3 - 22Ga. - - - - - 14 - 53Fla. - 1 - 8 - 14 - 15
E.S. CENTRAL - - - 1 29 65 - 41Ky. - - - - 4 7 U UTenn. - - - 1 - 9 - 30Ala. - - - - 21 15 - 11Miss. - - - - 4 34 - -
W.S. CENTRAL - - - 3 - 10 2 121Ark. - - - - - 2 - 11La. - - - - - - 1 28Okla. - - - 3 - 4 - 1Tex. - - - - - 4 1 81
MOUNTAIN - 1 4 6 58 48 21 93Mont. - - 1 - 2 1 - -Idaho - - - - 5 1 - 6Wyo. - - 2 3 1 1 - 3Colo. - - - - - 18 - 24N. Mex. - - - - 2 10 - 13Ariz. - 1 1 3 21 1 6 29Utah - - - - 27 5 15 12Nev. - - - - - 11 - 6
PACIFIC 9 12 2 11 141 174 10 217Wash. - - - - - - 2 19Oreg. - 1 - - - 9 8 22Calif. 9 11 2 11 137 143 - 157Alaska - - - - 4 3 - 2Hawaii - - - - - 19 - 17
Guam - - - - - 4 U UP.R. - - 1 1 - 11 U UV.I. - U - U - U U UAmer. Samoa - U - U - U U UC.N.M.I. - U - U - U U U
N: Not notifiable U: Unavailable -: no reported cases
*Individual cases may be reported through both the National Electronic Telecommunications System for Surveillance (NETSS) and thePublic Health Laboratory Information System (PHLIS).
Reporting Area
Malaria Rabies, Animal
Salmonellosis*
NETSS PHLIS
Cum.
2000
Cum.
1999
Cum.
2000
Cum.
1999
Cum.
2000
Cum.
1999
Cum.
2000
Cum.
1999
42 MMWR January 21, 2000
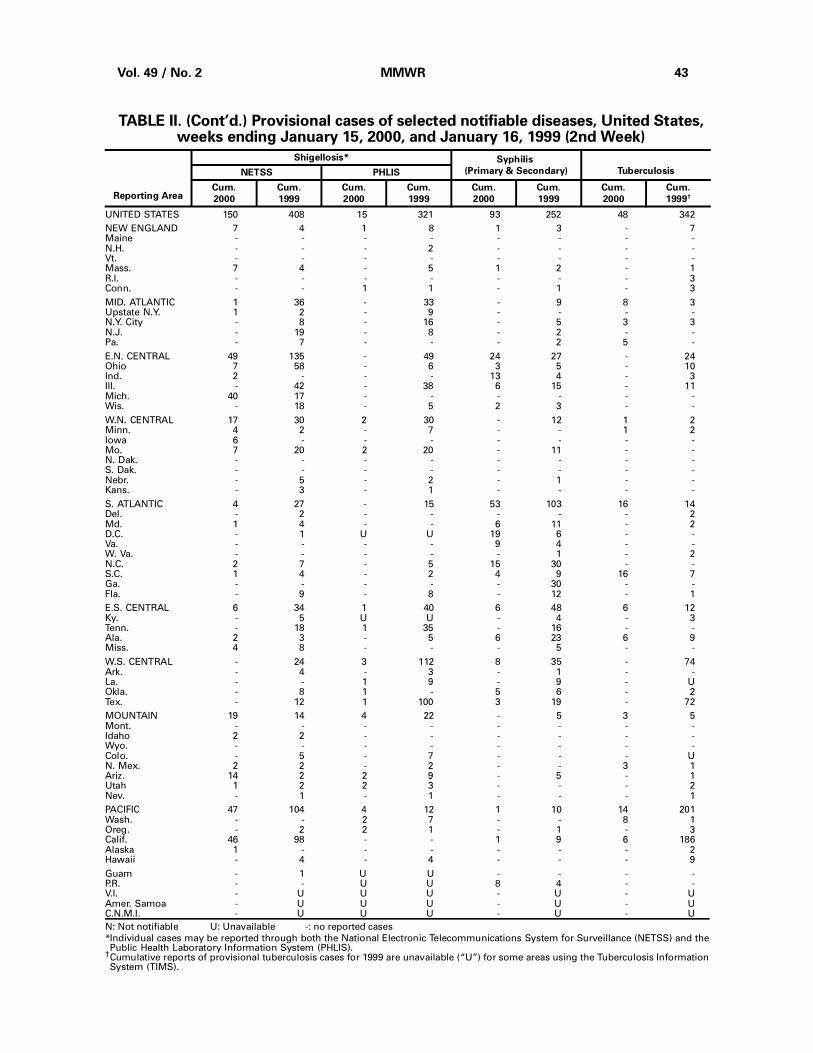
TABLE II. (Cont’d.) Provisional cases of selected notifiable diseases, United States,weeks ending January 15, 2000, and January 16, 1999 (2nd Week)
UNITED STATES 150 408 15 321 93 252 48 342
NEW ENGLAND 7 4 1 8 1 3 - 7Maine - - - - - - - -N.H. - - - 2 - - - -Vt. - - - - - - - -Mass. 7 4 - 5 1 2 - 1R.I. - - - - - - - 3Conn. - - 1 1 - 1 - 3
MID. ATLANTIC 1 36 - 33 - 9 8 3Upstate N.Y. 1 2 - 9 - - - -N.Y. City - 8 - 16 - 5 3 3N.J. - 19 - 8 - 2 - -Pa. - 7 - - - 2 5 -
E.N. CENTRAL 49 135 - 49 24 27 - 24Ohio 7 58 - 6 3 5 - 10Ind. 2 - - - 13 4 - 3Ill. - 42 - 38 6 15 - 11Mich. 40 17 - - - - - -Wis. - 18 - 5 2 3 - -
W.N. CENTRAL 17 30 2 30 - 12 1 2Minn. 4 2 - 7 - - 1 2Iowa 6 - - - - - - -Mo. 7 20 2 20 - 11 - -N. Dak. - - - - - - - -S. Dak. - - - - - - - -Nebr. - 5 - 2 - 1 - -Kans. - 3 - 1 - - - -
S. ATLANTIC 4 27 - 15 53 103 16 14Del. - 2 - - - - - 2Md. 1 4 - - 6 11 - 2D.C. - 1 U U 19 6 - -Va. - - - - 9 4 - -W. Va. - - - - - 1 - 2N.C. 2 7 - 5 15 30 - -S.C. 1 4 - 2 4 9 16 7Ga. - - - - - 30 - -Fla. - 9 - 8 - 12 - 1
E.S. CENTRAL 6 34 1 40 6 48 6 12Ky. - 5 U U - 4 - 3Tenn. - 18 1 35 - 16 - -Ala. 2 3 - 5 6 23 6 9Miss. 4 8 - - - 5 - -
W.S. CENTRAL - 24 3 112 8 35 - 74Ark. - 4 - 3 - 1 - -La. - - 1 9 - 9 - UOkla. - 8 1 - 5 6 - 2Tex. - 12 1 100 3 19 - 72
MOUNTAIN 19 14 4 22 - 5 3 5Mont. - - - - - - - -Idaho 2 2 - - - - - -Wyo. - - - - - - - -Colo. - 5 - 7 - - - UN. Mex. 2 2 - 2 - - 3 1Ariz. 14 2 2 9 - 5 - 1Utah 1 2 2 3 - - - 2Nev. - 1 - 1 - - - 1
PACIFIC 47 104 4 12 1 10 14 201Wash. - - 2 7 - - 8 1Oreg. - 2 2 1 - 1 - 3Calif. 46 98 - - 1 9 6 186Alaska 1 - - - - - - 2Hawaii - 4 - 4 - - - 9
Guam - 1 U U - - - -P.R. - - U U 8 4 - -V.I. - U U U - U - UAmer. Samoa - U U U - U - UC.N.M.I. - U U U - U - U
N: Not notifiable U: Unavailable -: no reported cases
*Individual cases may be reported through both the National Electronic Telecommunications System for Surveillance (NETSS) and thePublic Health Laboratory Information System (PHLIS).
†Cumulative reports of provisional tuberculosis cases for 1999 are unavailable (“U”) for some areas using the Tuberculosis InformationSystem (TIMS).
Reporting Area
Shigellosis* Syphilis
(Primary & Secondary) TuberculosisNETSS PHLIS
Cum.
2000
Cum.
1999
Cum.
2000
Cum.
1999
Cum.
2000
Cum.
1999
Cum.
2000
Cum.
1999†
Vol. 49 / No. 2 MMWR 43
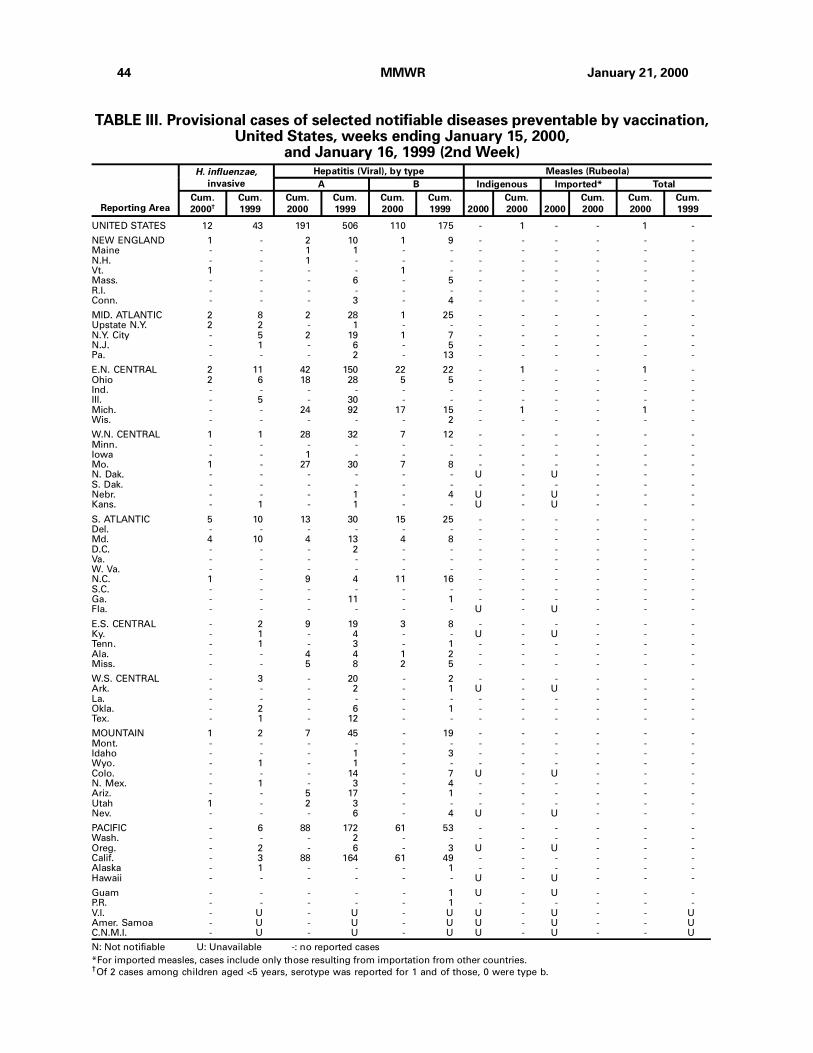
TABLE III. Provisional cases of selected notifiable diseases preventable by vaccination,United States, weeks ending January 15, 2000,
and January 16, 1999 (2nd Week)
UNITED STATES 12 43 191 506 110 175 - 1 - - 1 -
NEW ENGLAND 1 - 2 10 1 9 - - - - - -Maine - - 1 1 - - - - - - - -N.H. - - 1 - - - - - - - - -Vt. 1 - - - 1 - - - - - - -Mass. - - - 6 - 5 - - - - - -R.I. - - - - - - - - - - - -Conn. - - - 3 - 4 - - - - - -
MID. ATLANTIC 2 8 2 28 1 25 - - - - - -Upstate N.Y. 2 2 - 1 - - - - - - - -N.Y. City - 5 2 19 1 7 - - - - - -N.J. - 1 - 6 - 5 - - - - - -Pa. - - - 2 - 13 - - - - - -
E.N. CENTRAL 2 11 42 150 22 22 - 1 - - 1 -Ohio 2 6 18 28 5 5 - - - - - -Ind. - - - - - - - - - - - -Ill. - 5 - 30 - - - - - - - -Mich. - - 24 92 17 15 - 1 - - 1 -Wis. - - - - - 2 - - - - - -
W.N. CENTRAL 1 1 28 32 7 12 - - - - - -Minn. - - - - - - - - - - - -Iowa - - 1 - - - - - - - - -Mo. 1 - 27 30 7 8 - - - - - -N. Dak. - - - - - - U - U - - -S. Dak. - - - - - - - - - - - -Nebr. - - - 1 - 4 U - U - - -Kans. - 1 - 1 - - U - U - - -
S. ATLANTIC 5 10 13 30 15 25 - - - - - -Del. - - - - - - - - - - - -Md. 4 10 4 13 4 8 - - - - - -D.C. - - - 2 - - - - - - - -Va. - - - - - - - - - - - -W. Va. - - - - - - - - - - - -N.C. 1 - 9 4 11 16 - - - - - -S.C. - - - - - - - - - - - -Ga. - - - 11 - 1 - - - - - -Fla. - - - - - - U - U - - -
E.S. CENTRAL - 2 9 19 3 8 - - - - - -Ky. - 1 - 4 - - U - U - - -Tenn. - 1 - 3 - 1 - - - - - -Ala. - - 4 4 1 2 - - - - - -Miss. - - 5 8 2 5 - - - - - -
W.S. CENTRAL - 3 - 20 - 2 - - - - - -Ark. - - - 2 - 1 U - U - - -La. - - - - - - - - - - - -Okla. - 2 - 6 - 1 - - - - - -Tex. - 1 - 12 - - - - - - - -
MOUNTAIN 1 2 7 45 - 19 - - - - - -Mont. - - - - - - - - - - - -Idaho - - - 1 - 3 - - - - - -Wyo. - 1 - 1 - - - - - - - -Colo. - - - 14 - 7 U - U - - -N. Mex. - 1 - 3 - 4 - - - - - -Ariz. - - 5 17 - 1 - - - - - -Utah 1 - 2 3 - - - - - - - -Nev. - - - 6 - 4 U - U - - -
PACIFIC - 6 88 172 61 53 - - - - - -Wash. - - - 2 - - - - - - - -Oreg. - 2 - 6 - 3 U - U - - -Calif. - 3 88 164 61 49 - - - - - -Alaska - 1 - - - 1 - - - - - -Hawaii - - - - - - U - U - - -
Guam - - - - - 1 U - U - - -P.R. - - - - - 1 - - - - - -V.I. - U - U - U U - U - - UAmer. Samoa - U - U - U U - U - - UC.N.M.I. - U - U - U U - U - - U
N: Not notifiable U: Unavailable -: no reported cases
*For imported measles, cases include only those resulting from importation from other countries.†Of 2 cases among children aged <5 years, serotype was reported for 1 and of those, 0 were type b.
Reporting Area
H. influenzae,
invasive
Hepatitis (Viral), by type Measles (Rubeola)
A B Indigenous Imported* Total
Cum.
2000†
Cum.
1999
Cum.
2000
Cum.
1999
Cum.
2000
Cum.
1999 2000
Cum.
2000 2000
Cum.
2000
Cum.
2000
Cum.
1999
44 MMWR January 21, 2000
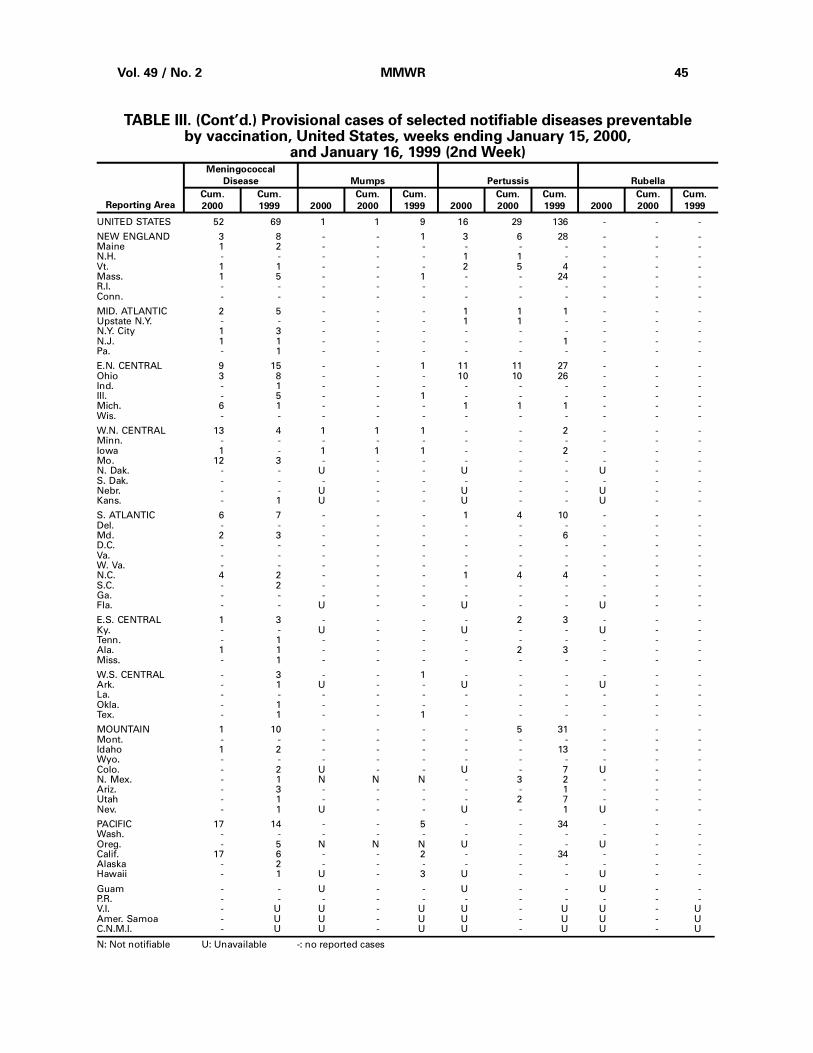
UNITED STATES 52 69 1 1 9 16 29 136 - - -
NEW ENGLAND 3 8 - - 1 3 6 28 - - -Maine 1 2 - - - - - - - - -N.H. - - - - - 1 1 - - - -Vt. 1 1 - - - 2 5 4 - - -Mass. 1 5 - - 1 - - 24 - - -R.I. - - - - - - - - - - -Conn. - - - - - - - - - - -
MID. ATLANTIC 2 5 - - - 1 1 1 - - -Upstate N.Y. - - - - - 1 1 - - - -N.Y. City 1 3 - - - - - - - - -N.J. 1 1 - - - - - 1 - - -Pa. - 1 - - - - - - - - -
E.N. CENTRAL 9 15 - - 1 11 11 27 - - -Ohio 3 8 - - - 10 10 26 - - -Ind. - 1 - - - - - - - - -Ill. - 5 - - 1 - - - - - -Mich. 6 1 - - - 1 1 1 - - -Wis. - - - - - - - - - - -
W.N. CENTRAL 13 4 1 1 1 - - 2 - - -Minn. - - - - - - - - - - -Iowa 1 - 1 1 1 - - 2 - - -Mo. 12 3 - - - - - - - - -N. Dak. - - U - - U - - U - -S. Dak. - - - - - - - - - - -Nebr. - - U - - U - - U - -Kans. - 1 U - - U - - U - -
S. ATLANTIC 6 7 - - - 1 4 10 - - -Del. - - - - - - - - - - -Md. 2 3 - - - - - 6 - - -D.C. - - - - - - - - - - -Va. - - - - - - - - - - -W. Va. - - - - - - - - - - -N.C. 4 2 - - - 1 4 4 - - -S.C. - 2 - - - - - - - - -Ga. - - - - - - - - - - -Fla. - - U - - U - - U - -
E.S. CENTRAL 1 3 - - - - 2 3 - - -Ky. - - U - - U - - U - -Tenn. - 1 - - - - - - - - -Ala. 1 1 - - - - 2 3 - - -Miss. - 1 - - - - - - - - -
W.S. CENTRAL - 3 - - 1 - - - - - -Ark. - 1 U - - U - - U - -La. - - - - - - - - - - -Okla. - 1 - - - - - - - - -Tex. - 1 - - 1 - - - - - -
MOUNTAIN 1 10 - - - - 5 31 - - -Mont. - - - - - - - - - - -Idaho 1 2 - - - - - 13 - - -Wyo. - - - - - - - - - - -Colo. - 2 U - - U - 7 U - -N. Mex. - 1 N N N - 3 2 - - -Ariz. - 3 - - - - - 1 - - -Utah - 1 - - - - 2 7 - - -Nev. - 1 U - - U - 1 U - -
PACIFIC 17 14 - - 5 - - 34 - - -Wash. - - - - - - - - - - -Oreg. - 5 N N N U - - U - -Calif. 17 6 - - 2 - - 34 - - -Alaska - 2 - - - - - - - - -Hawaii - 1 U - 3 U - - U - -
Guam - - U - - U - - U - -P.R. - - - - - - - - - - -V.I. - U U - U U - U U - UAmer. Samoa - U U - U U - U U - UC.N.M.I. - U U - U U - U U - U
N: Not notifiable U: Unavailable -: no reported cases
TABLE III. (Cont’d.) Provisional cases of selected notifiable diseases preventableby vaccination, United States, weeks ending January 15, 2000,
and January 16, 1999 (2nd Week)
Reporting Area
Meningococcal
Disease Mumps Pertussis Rubella
Cum.
2000
Cum.
1999 2000
Cum.
2000
Cum.
1999 2000
Cum.
2000
Cum.
1999 2000
Cum.
2000
Cum.
1999
Vol. 49 / No. 2 MMWR 45
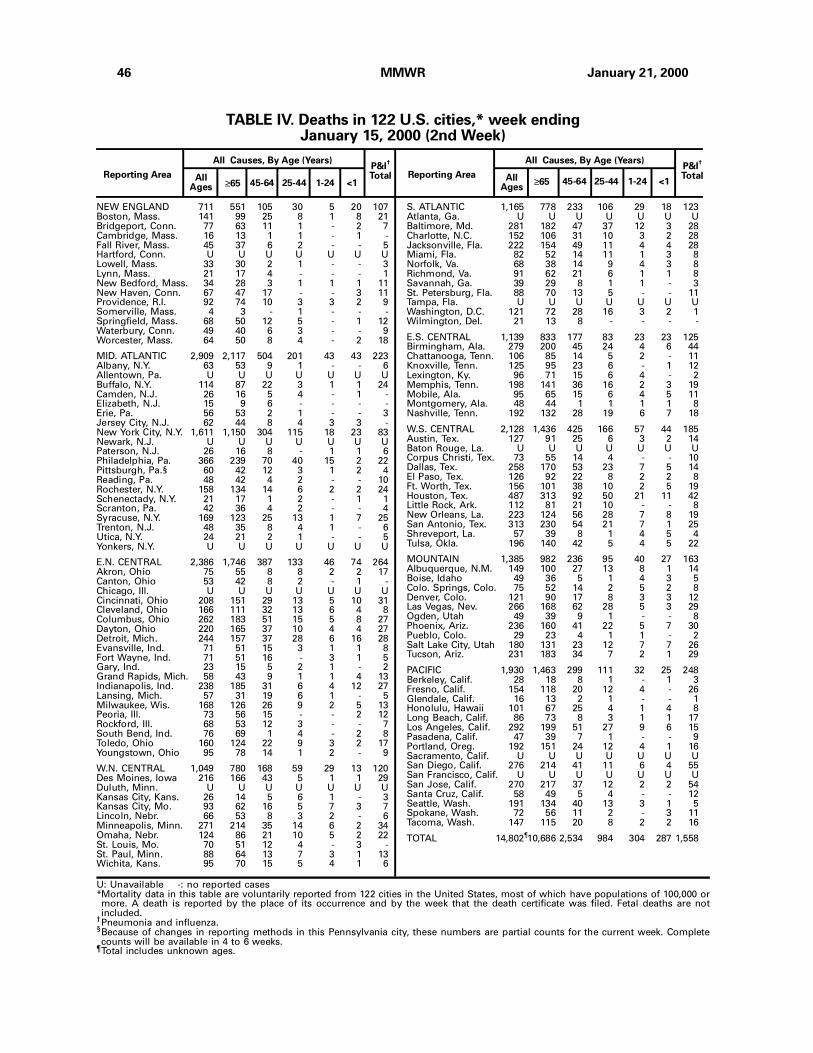
NEW ENGLAND 711 551 105 30 5 20 107Boston, Mass. 141 99 25 8 1 8 21Bridgeport, Conn. 77 63 11 1 - 2 7Cambridge, Mass. 16 13 1 1 - 1 -Fall River, Mass. 45 37 6 2 - - 5Hartford, Conn. U U U U U U ULowell, Mass. 33 30 2 1 - - 3Lynn, Mass. 21 17 4 - - - 1New Bedford, Mass. 34 28 3 1 1 1 11New Haven, Conn. 67 47 17 - - 3 11Providence, R.I. 92 74 10 3 3 2 9Somerville, Mass. 4 3 - 1 - - -Springfield, Mass. 68 50 12 5 - 1 12Waterbury, Conn. 49 40 6 3 - - 9Worcester, Mass. 64 50 8 4 - 2 18
MID. ATLANTIC 2,909 2,117 504 201 43 43 223Albany, N.Y. 63 53 9 1 - - 6Allentown, Pa. U U U U U U UBuffalo, N.Y. 114 87 22 3 1 1 24Camden, N.J. 26 16 5 4 - 1 -Elizabeth, N.J. 15 9 6 - - - -Erie, Pa. 56 53 2 1 - - 3Jersey City, N.J. 62 44 8 4 3 3 -New York City, N.Y. 1,611 1,150 304 115 18 23 83Newark, N.J. U U U U U U UPaterson, N.J. 26 16 8 - 1 1 6Philadelphia, Pa. 366 239 70 40 15 2 22Pittsburgh, Pa.§ 60 42 12 3 1 2 4Reading, Pa. 48 42 4 2 - - 10Rochester, N.Y. 158 134 14 6 2 2 24Schenectady, N.Y. 21 17 1 2 - 1 1Scranton, Pa. 42 36 4 2 - - 4Syracuse, N.Y. 169 123 25 13 1 7 25Trenton, N.J. 48 35 8 4 1 - 6Utica, N.Y. 24 21 2 1 - - 5Yonkers, N.Y. U U U U U U U
E.N. CENTRAL 2,386 1,746 387 133 46 74 264Akron, Ohio 75 55 8 8 2 2 17Canton, Ohio 53 42 8 2 - 1 -Chicago, Ill. U U U U U U UCincinnati, Ohio 208 151 29 13 5 10 31Cleveland, Ohio 166 111 32 13 6 4 8Columbus, Ohio 262 183 51 15 5 8 27Dayton, Ohio 220 165 37 10 4 4 27Detroit, Mich. 244 157 37 28 6 16 28Evansville, Ind. 71 51 15 3 1 1 8Fort Wayne, Ind. 71 51 16 - 3 1 5Gary, Ind. 23 15 5 2 1 - 2Grand Rapids, Mich. 58 43 9 1 1 4 13Indianapolis, Ind. 238 185 31 6 4 12 27Lansing, Mich. 57 31 19 6 1 - 5Milwaukee, Wis. 168 126 26 9 2 5 13Peoria, Ill. 73 56 15 - - 2 12Rockford, Ill. 68 53 12 3 - - 7South Bend, Ind. 76 69 1 4 - 2 8Toledo, Ohio 160 124 22 9 3 2 17Youngstown, Ohio 95 78 14 1 2 - 9
W.N. CENTRAL 1,049 780 168 59 29 13 120Des Moines, Iowa 216 166 43 5 1 1 29Duluth, Minn. U U U U U U UKansas City, Kans. 26 14 5 6 1 - 3Kansas City, Mo. 93 62 16 5 7 3 7Lincoln, Nebr. 66 53 8 3 2 - 6Minneapolis, Minn. 271 214 35 14 6 2 34Omaha, Nebr. 124 86 21 10 5 2 22St. Louis, Mo. 70 51 12 4 - 3 -St. Paul, Minn. 88 64 13 7 3 1 13Wichita, Kans. 95 70 15 5 4 1 6
S. ATLANTIC 1,165 778 233 106 29 18 123Atlanta, Ga. U U U U U U UBaltimore, Md. 281 182 47 37 12 3 28Charlotte, N.C. 152 106 31 10 3 2 28Jacksonville, Fla. 222 154 49 11 4 4 28Miami, Fla. 82 52 14 11 1 3 8Norfolk, Va. 68 38 14 9 4 3 8Richmond, Va. 91 62 21 6 1 1 8Savannah, Ga. 39 29 8 1 1 - 3St. Petersburg, Fla. 88 70 13 5 - - 11Tampa, Fla. U U U U U U UWashington, D.C. 121 72 28 16 3 2 1Wilmington, Del. 21 13 8 - - - -
E.S. CENTRAL 1,139 833 177 83 23 23 125Birmingham, Ala. 279 200 45 24 4 6 44Chattanooga, Tenn. 106 85 14 5 2 - 11Knoxville, Tenn. 125 95 23 6 - 1 12Lexington, Ky. 96 71 15 6 4 - 2Memphis, Tenn. 198 141 36 16 2 3 19Mobile, Ala. 95 65 15 6 4 5 11Montgomery, Ala. 48 44 1 1 1 1 8Nashville, Tenn. 192 132 28 19 6 7 18
W.S. CENTRAL 2,128 1,436 425 166 57 44 185Austin, Tex. 127 91 25 6 3 2 14Baton Rouge, La. U U U U U U UCorpus Christi, Tex. 73 55 14 4 - - 10Dallas, Tex. 258 170 53 23 7 5 14El Paso, Tex. 126 92 22 8 2 2 8Ft. Worth, Tex. 156 101 38 10 2 5 19Houston, Tex. 487 313 92 50 21 11 42Little Rock, Ark. 112 81 21 10 - - 8New Orleans, La. 223 124 56 28 7 8 19San Antonio, Tex. 313 230 54 21 7 1 25Shreveport, La. 57 39 8 1 4 5 4Tulsa, Okla. 196 140 42 5 4 5 22
MOUNTAIN 1,385 982 236 95 40 27 163Albuquerque, N.M. 149 100 27 13 8 1 14Boise, Idaho 49 36 5 1 4 3 5Colo. Springs, Colo. 75 52 14 2 5 2 8Denver, Colo. 121 90 17 8 3 3 12Las Vegas, Nev. 266 168 62 28 5 3 29Ogden, Utah 49 39 9 1 - - 8Phoenix, Ariz. 236 160 41 22 5 7 30Pueblo, Colo. 29 23 4 1 1 - 2Salt Lake City, Utah 180 131 23 12 7 7 26Tucson, Ariz. 231 183 34 7 2 1 29
PACIFIC 1,930 1,463 299 111 32 25 248Berkeley, Calif. 28 18 8 1 - 1 3Fresno, Calif. 154 118 20 12 4 - 26Glendale, Calif. 16 13 2 1 - - 1Honolulu, Hawaii 101 67 25 4 1 4 8Long Beach, Calif. 86 73 8 3 1 1 17Los Angeles, Calif. 292 199 51 27 9 6 15Pasadena, Calif. 47 39 7 1 - - 9Portland, Oreg. 192 151 24 12 4 1 16Sacramento, Calif. U U U U U U USan Diego, Calif. 276 214 41 11 6 4 55San Francisco, Calif. U U U U U U USan Jose, Calif. 270 217 37 12 2 2 54Santa Cruz, Calif. 58 49 5 4 - - 12Seattle, Wash. 191 134 40 13 3 1 5Spokane, Wash. 72 56 11 2 - 3 11Tacoma, Wash. 147 115 20 8 2 2 16
TOTAL 14,802¶10,686 2,534 984 304 287 1,558
Reporting Area≥65 45-64 25-44 1-24 <1
P&I†
TotalAllAges
All Causes, By Age (Years)
Reporting AreaP&I
†
TotalAllAges
All Causes, By Age (Years)
≥65 45-64 25-44 1-24 <1
U: Unavailable -: no reported cases*Mortality data in this table are voluntarily reported from 122 cities in the United States, most of which have populations of 100,000 ormore. A death is reported by the place of its occurrence and by the week that the death certificate was filed. Fetal deaths are notincluded.
†Pneumonia and influenza.§Because of changes in reporting methods in this Pennsylvania city, these numbers are partial counts for the current week. Completecounts will be available in 4 to 6 weeks.
¶Total includes unknown ages.
TABLE IV. Deaths in 122 U.S. cities,* week endingJanuary 15, 2000 (2nd Week)
46 MMWR January 21, 2000
2. CDC. Prevention of hepatitis A through active or passive immunization: recommendations of
the Advisory Committee on Immunization Practices (ACIP). MMWR 1999;48(no. RR-12).
3. American Academy of Pediatrics. Active and passive immunization. In: Peter G, ed. 1997 Red
book: report of the Committee on Infectious Diseases. 24th ed. Elk Grove Village, Illinois:
American Academy of Pediatrics 1997:1–71.
4. CDC. Withdrawal of rotavirus vaccine recommendation. MMWR 1999;48:1007.
5. CDC. Recommendations of the Advisory Committee on Immunization Practices: revised
recommendations for routine poliomyelitis vaccination. MMWR 1999;48:590.
6. CDC. Recommendations regarding the use of vaccines that contain thimerosal as a preserv-
ative. MMWR 1999;48:996–8.
Notices to Readers — Continued
Notice to Readers
Conference on Vaccine Research
The Third Annual Conference on Vaccine Research: Basic Science—Product
Development—Clinical and Field Studies will be held April 30–May 2, 2000, in Wash-
ington, D.C. This conference is sponsored by the National Foundation for Infectious
Diseases (NFID) in collaboration with CDC, the National Institute of Allergy and Infec-
tious Diseases, the International Society for Vaccines, the Center for Biologics Evalu-
ation and Research of the Food and Drug Administration, the World Health
Organization, the Albert B. Sabin Vaccine Institute at Georgetown University, and the
U.S. Department of Agriculture. The meeting covers scientific data and issues from
the disciplines involved in the research and development of vaccines and associated
technologies for the control of human and veterinary diseases through vaccination.
The deadline for submitting abstracts for oral and poster presentations is January
28, 2000. Program announcements and forms for abstract submission, registration,
and hotel reservations are available from Kip Kantelo, NFID, Suite 750, 4733 Bethesda
Ave., Bethesda, MD 20814-5228; telephone (301) 656-0003, ext. 19; fax (301) 907-0878;
e-mail [email protected]; World-Wide Web site http://www.nfid.org/conferences/.*
*References to sites of non-CDC organizations on the Internet are provided as a service toMMWR readers and do not constitute or imply endorsement of these organizations or theirprograms by CDC or the U.S. Department of Health and Human Services. CDC is not respon-sible for the content of pages found at these sites.
Contributors to the Production of the MMWR (Weekly)Weekly Notifiable Disease Morbidity Data and 122 Cities Mortality Data
Samuel L. Groseclose, D.V.M., M.P.H.
State Support Team Robert Fagan Jose Aponte Paul Gangarosa, M.P.H. Gerald Jones David Nitschke Carol A. Worsham
CDC Operations Team Carol M. Knowles Deborah A. Adams Willie J. Anderson Patsy A. Hall Kathryn Snavely Sara Zywicki
Vol. 49 / No. 2 MMWR 47
Notices to Readers — Continued
The Morbidity and Mortality Weekly Report (MMWR) Series is prepared by the Centers for Disease Controland Prevention (CDC) and is available free of charge in electronic format and on a paid subscription basisfor paper copy. To receive an electronic copy on Friday of each week, send an e-mail message [email protected]. The body content should read SUBscribe mmwr-toc. Electronic copy also isavailable from CDC’s World-Wide Web server at http://www.cdc.gov/ or from CDC’s file transfer protocolserver at ftp.cdc.gov. To subscribe for paper copy, contact Superintendent of Documents, U.S. GovernmentPrinting Office, Washington, DC 20402; telephone (202) 512-1800.
Data in the weekly MMWR are provisional, based on weekly reports to CDC by state health departments.The reporting week concludes at close of business on Friday; compiled data on a national basis are officiallyreleased to the public on the following Friday. Address inquiries about the MMWR Series, including materialto be considered for publication, to: Editor, MMWR Series, Mailstop C-08, CDC, 1600 Clifton Rd., N.E., Atlanta,GA 30333; telephone (888) 232-3228.
All material in the MMWR Series is in the public domain and may be used and reprinted withoutpermission; citation as to source, however, is appreciated.
Director, Centers for Disease Controland Prevention Jeffrey P. Koplan, M.D., M.P.H.
Acting Deputy Director for Scienceand Public Health, Centers forDisease Control and Prevention Lynne S. Wilcox, M.D., M.P.H.
Acting Director,Epidemiology Program Office Barbara R. Holloway, M.P.H.
Editor, MMWR Series John W. Ward, M.D.
Managing Editor,MMWR (weekly) Karen L. Foster, M.A.
Writers-Editors,MMWR (weekly) Jill Crane David C. Johnson Teresa F. Rutledge Caran R. Wilbanks
Desktop Publishing Lynda G. Cupell Morie M. Higgins
✩U.S. Government Printing Office: 2000-533-206/08048 Region IV
48 MMWR January 21, 2000
![Why should you worry about West Nile virus? Nile/CA_DHS_Brochures_Fightbite_2006[1].pdfWhy should you worry about West Nile virus? West Nile virus can make you and your family sick](https://img.pdfslide.net/doc/110x75/5e521b1bd9158f7e6c2e8af4/why-should-you-worry-about-west-nile-virus-nilecadhsbrochuresfightbite20061pdf.jpg)