Embed Size (px)
Citation preview
Guidelines on pollution control in heritage buildings
2443 1
Guidelines on pollution control in heritage buildings
Re:Source
The Council for Museums, Archives and Libraries University College London
Emcel Filters Ltd Horniman Museum and Gardens
The Manchester Museum Museum of London
Victoria & Albert Museum Department of the Environment, Transport and the Regions
in association with Museum Practice
Guidelines on pollution control in heritage buildings
2443 2
Authors
Nigel Blades, Bartlett School of Graduate Studies, University College London
Tadj Oreszczyn, Bartlett School of Graduate Studies, University College London
Bill Bordass, William Bordass Associates
May Cassar, Re:Source the Council for Museums, Archives and Libraries
Acknowledgements
The authors would like to thank the Department of Environment, Transport and the Regions,
Emcel Filters Ltd and the Horniman Museum for funding and the partners for their excellent
collaboration in the project, which has contributed greatly to this document. The project
benefited from the support and comments of a group of peer reviewers and delegates at a
workshop organised to discuss the project results. Through their input the research results
have been set in the broader contexts of conservation and building pollution control.
In particular, we would like to acknowledge the following individuals:
Partners:
Barry Kemp, Sue Smith, David Spraget and John Saunders, Emcel Filters Ltd
Louise Bacon, Horniman Museum and Gardens
Andrew Calver and Helen Ganiaris, Museum of London
Velson Horie, The Manchester Museum
Jonathan Ashley-Smith and Graham Martin, Victoria & Albert Museum
Mervyn Jones, FBE Management Ltd
Alan Young and Ben Croxford, Bartlett School of Graduate Studies
Peer Reviewers
Susan Bradley, British Museum.
Peter Brimblecombe, University of East Anglia.
Simon Cane, The Museum of Science and Industry in Manchester.
Michael Carver, SVM plc.
Birthe Christensen, Royal Pavilion, Brighton.
Mark Facer, Ove Arup & Partners.
Brian Ford, Brian Ford Associates.
Max Fordham, Max Fordham & Partners.
Christopher Kitching Royal Commission on Historical Manuscripts.
Cathy Proudlove, Castle Museum, Norwich.
Chris Twinn, Ove Arup & Partners.
Peter Winsor, Museums & Galleries Commission.
Workshop Delegates:
Linda Bullock, National Trust
Helen Dalton, Leicester Museum
Laura Drysdale, Museums & Galleries Commission
Len Eldridge, Queen’s Gallery
Peter Eley, Architect
Ray French, Tate Gallery
Francis Halahan, Halahan & Associates
Tony Heath, Andrew Reid & Partners
Guidelines on pollution control in heritage buildings
2443 3
David Hill, South West Museums Council
David Howell, Historic Royal Palaces
Casimir Iwaszkiewicz, Construction Resources
Cathy Jenkins, Department of the Environment, Transport and the Regions
Derek Johnson, DLM
Alan Jones, The British Library
Sonia Jones, Council for Museums in Wales
Jack Lambert, Jack Lambert & Associates
Stephen Macey, Buro Happold
John Morris, Yorkshire & Humberside Museums Council
Jon Old, Tyne & Wear Museum
Jane Robinson, SMC
Amber Rowe, English Heritage,
David Waterhouse, Oscar Faber
Robert Wilmot, Historic Scotland
Picture Credits: Victoria & Albert Museum Picture Library, Museum of London Picture
Library.
This guide is based on the best available knowledge at the time of publication. However, the
authors and publisher cannot accept responsibility for any loss arising from actions or
decisions based upon information contained in this publication.
CONTENTS
1. INTRODUCTION............................................................................................................... 6
2. WHICH ARE THE DAMAGING POLLUTANTS AND WHERE DO THEY COME
FROM? .................................................................................................................................... 6
3. A COLLECTIONS-CENTRED METHODOLOGY FOR DEALING WITH POLLUTION
ISSUES IN HERITAGE BUILDINGS.................................................................................. 14
4. METHODOLOGY STAGE 1: RISK ASSESSMENT...................................................... 17
5. METHODOLOGY STAGE 2: OBTAINING POLLUTION DATA ............................... 25
6. METHODOLOGY STAGE 3: CHOOSING AN APPROPRIATE SOLUTION.............. 28
6.1 STRATEGY 1 PASSIVE POLLUTION CONTROL WITH NATURAL
VENTILATION................................................................................................................. 30
6.2 STRATEGY 2. PORTABLE OR TEMPORARY FILTRATION UNITS.............. 31
6.3 STRATEGY 3. LOCAL GALLERY FILTRATION............................................... 32
6.4 STRATEGY 4. INTELLIGENT CONTROL OF VENTILATION......................... 33
6.5 STRATEGY 5. FULL AIR-CONDITIONING WITH CARBON FILTRATION ... 33
7. WORKED EXAMPLES OF THE METHODOLOGY .................................................... 36
8. CHECKLIST..................................................................................................................... 38
9. REFERENCES ................................................................................................................. 38
10. SOURCES OF FURTHER INFORMATION ................................................................. 41
Guidelines on pollution control in heritage buildings
2443 4
Foreword
Bruce Sharpe
Sustainable construction champion, DETR Construction Directorate
The Government expects the construction industry to contribute to the more sustainable
development of our society. This means that the industry has to deliver buildings and
structures which provide greater satisfaction, well-being and value to clients and users, while
at the same time reducing the consumption of carbon-based energy and natural resources. To
help, DETR sponsors an extensive research and innovation portfolio, intended to develop
new, and exploit existing, knowledge.
This document is an output from one of our recent collaborative projects, Energy Efficient
Pollution Control in Museums and Galleries, which involved a group of strong and
committed partners. The project combined high-quality research, collaboration between
designers, building services professionals and end-users, with effective management and a
clear output. It is an excellent exemplar of how the three strands of sustainable development –
social, economic and environmental – fit together. Using the guidelines in the document will
improve indoor air quality, energy efficiency and the use of resources within buildings
devoted to our cultural heritage. And they will enhance quality of life generally because they
demonstrate that a sustainable balance between access and preservation can be achieved.
Furthermore, this research is capable of wider exploitation. It tells us more about the
deposition of pollutants and the impact of ventilation rates on indoor air quality. There is
plenty here to interest the wider construction and building management communities. I
commend it to you.
Preface
May Cassar,
Project Manager for `Energy Efficient Pollution Control in Museums and Galleries’
These guidelines are intended to address the concerns of managers and designers of museums,
galleries, libraries and archives over indoor air quality. These concerns are often due to
ignorance of the extent to which urban pollution is a problem to collections in buildings.
While science is still mapping out the full extent of this problem and its impact on heritage
materials, this publication based on sound scientific building research is a pragmatic decision-
making guide to dealing with pollution in buildings now. The information is presented in
different forms: in boxes and tables, and as text, graphs and illustrations. This should enable a
range of readers to tackle issues of varying complexity. Pollution as any other environmental
problem is a shared responsibility. The research, carried out by a team of university
researchers, industry and end-users, has produced a publication that will be of use to building
designers, building services engineers and heritage managers. If you find these guidelines
useful, please let others – and us – know about it. You will find contact details on the back
cover. The wider this information is disseminated, the greater will be its benefit.

Guidelines on pollution control in heritage buildings
2443 5
SCOPE
These guidelines are written from a UK perspective, but are applicable to other countries with
a temperate climate and similar pollution problems. Sections 1-5 of the guidelines provide
background information from the scientific and conservation literature. Sections 6-8 are
based on the above project results, with the emphasis on control of pollutants with outdoor
sources. Some background information is provided on control of pollutants generated in
showcases and enclosures, but the reader is advised to consult other publications in this area,
beginning with those listed in Sections 9 and 10.
Guidelines on pollution control in heritage buildings
2443 6
1. INTRODUCTION
Air pollution can attack heritage materials. Museums, galleries, libraries and archives are all
at risk. Deterioration is usually slow and progressive: prolonged exposure can cause severe
damage to a wide range of objects.
Different materials are susceptible to different pollutants, so organisations will face their own
set of pollution-related issues. These guidelines are intended to help:
• Museums, galleries, archives and libraries in making a rational assessment of the risks of
pollution damage to their collections.
• Architects, building services engineers and others designing and installing pollution
control measures.
The guidelines are not prescriptive. Instead they propose a step by step method to define
problems and to develop and achieve appropriate solutions. It has three main stages:
STAGE 1 Consider the types of heritage materials, and the pollutants . See Section 4.
STAGE 2 Assess the pollution characteristics of the microenvironment of objects, the
individual room or gallery; the building as a whole; and finally the external
environment. See Section 5.
STAGE 3 Determine the action required. See Section 6.
If hazards are identified, you may need to test for certain pollutants and to measure their
concentrations. To determine the risk and to reach an appropriate solution you will need to
compare pollution levels with published standards and damage threshold levels, where these
are available. However, the current state of knowledge on acceptable levels is incomplete.
The main focus of this document is on the control of gaseous pollutants in typical UK
buildings. Other issues are only touched upon as they are covered in detail elsewhere (see
Sections 9 and 10). These include:
• Ventilation for human health and comfort.
• The control of particles.
• Location of air inlets.
• Detailed design of ventilation systems.
• Choice of filter materials.
2. WHICH ARE THE DAMAGING POLLUTANTS AND WHERE DO
THEY COME FROM?
Indoor pollutants have two principal origins:
• Outdoor pollutants, which are brought into the building by ventilation.
• Pollutants generated within the building, and needing removal, usually by ventilation,
though chemical absorption is also possible.
Sources of indoor pollution include human and animal metabolism, combustion, cooking,
introduced materials and chemicals, and not least outgassing from the buildings materials
and contents, including items in the collection and their display and storage cases.
Guidelines on pollution control in heritage buildings
2443 7
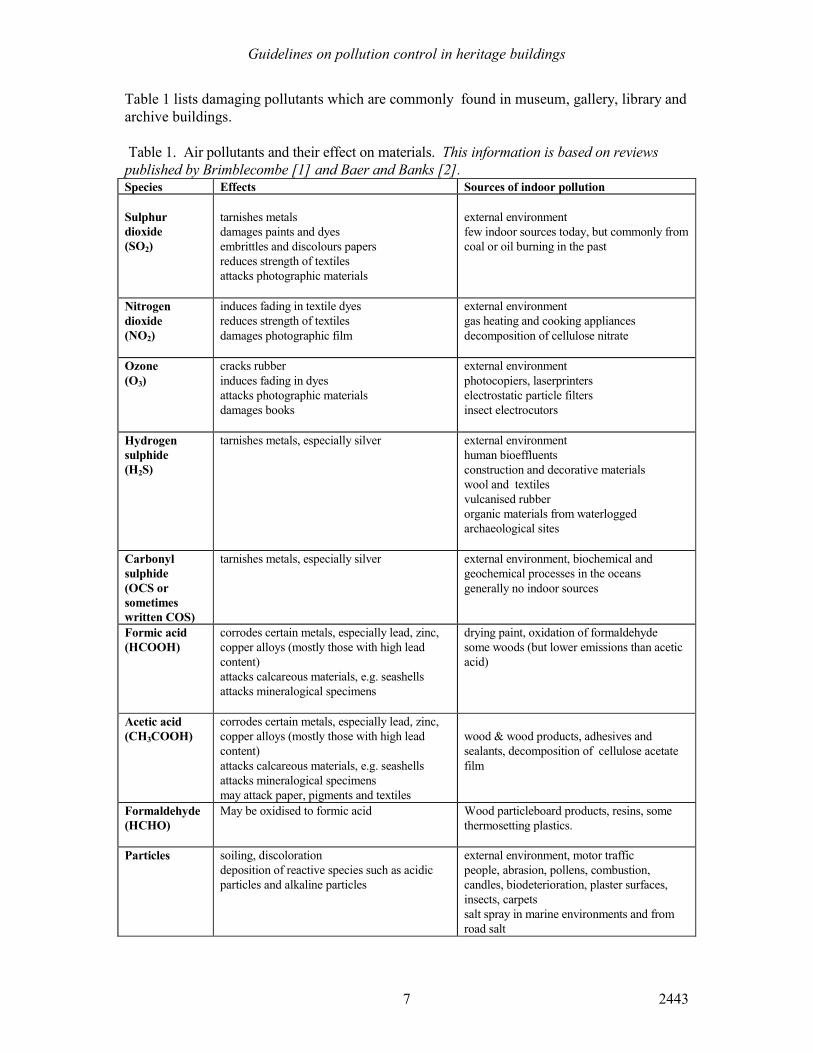
Table 1 lists damaging pollutants which are commonly found in museum, gallery, library and
archive buildings.
Table 1. Air pollutants and their effect on materials. This information is based on reviews
published by Brimblecombe [1] and Baer and Banks [2]. Species Effects Sources of indoor pollution
Sulphur
dioxide
(SO2)
tarnishes metals
damages paints and dyes
embrittles and discolours papers
reduces strength of textiles
attacks photographic materials
external environment
few indoor sources today, but commonly from
coal or oil burning in the past
Nitrogen
dioxide
(NO2)
induces fading in textile dyes
reduces strength of textiles
damages photographic film
external environment
gas heating and cooking appliances
decomposition of cellulose nitrate
Ozone
(O3)
cracks rubber
induces fading in dyes
attacks photographic materials
damages books
external environment
photocopiers, laserprinters
electrostatic particle filters
insect electrocutors
Hydrogen
sulphide
(H2S)
tarnishes metals, especially silver external environment
human bioeffluents
construction and decorative materials
wool and textiles
vulcanised rubber
organic materials from waterlogged
archaeological sites
Carbonyl
sulphide
(OCS or
sometimes
written COS)
tarnishes metals, especially silver external environment, biochemical and
geochemical processes in the oceans
generally no indoor sources
Formic acid
(HCOOH)
corrodes certain metals, especially lead, zinc,
copper alloys (mostly those with high lead
content)
attacks calcareous materials, e.g. seashells
attacks mineralogical specimens
drying paint, oxidation of formaldehyde
some woods (but lower emissions than acetic
acid)
Acetic acid
(CH3COOH)
corrodes certain metals, especially lead, zinc,
copper alloys (mostly those with high lead
content)
attacks calcareous materials, e.g. seashells
attacks mineralogical specimens
may attack paper, pigments and textiles
wood & wood products, adhesives and
sealants, decomposition of cellulose acetate
film
Formaldehyde
(HCHO)
May be oxidised to formic acid Wood particleboard products, resins, some
thermosetting plastics.
Particles soiling, discoloration
deposition of reactive species such as acidic
particles and alkaline particles
external environment, motor traffic
people, abrasion, pollens, combustion,
candles, biodeterioration, plaster surfaces,
insects, carpets
salt spray in marine environments and from
road salt
Guidelines on pollution control in heritage buildings
2443 8
Pollutants mainly from outdoors
Nitrogen dioxide, sulphur dioxide, ozone, hydrogen sulphide and carbonyl sulphide are the
main damage-causing gases present outdoors. They come mainly from fuel burning in
transport, buildings and industry. The sulphides are also generated by biological processes,
principally in the oceans and through the decay of organic matter. Much of the nitrogen
dioxide and ozone is not formed directly, but in secondary reactions involving the action of
sunlight on pollutants emitted largely from motor vehicles.
Some of these pollutants also have indoor sources: nitrogen dioxide from gas stoves, and
hydrogen sulphide as a bioeffluent from people and from some interior decorative materials
and museum objects themselves, e.g zoological specimens and organic archaeological
material, especially from waterlogged sites. Ozone can also be given off by photocopiers and
laserprinters, particularly older models.
Outdoor pollution also includes small particles: dust and aerosols, which can remain
suspended in the air for long periods. The most damaging tend to be small, black, sticky, acid
particles from the incomplete combustion of oil, particularly in diesel engines.
Pollutants mainly generated indoors
The organic compounds acetic acid, formic acid and formaldehyde tend to be the most
common and damaging, causing corrosion of metals and calcareous materials, and sometimes
attacking pigments, paper and textiles. These are often referred to as carbonyl compounds
because their molecules all contain the carbonyl C=O bond structure and have similar types of
reaction with objects. (Carbonyl sulphide is not usually grouped with these compounds, and
is considered a sulphide in terms of it reaction with objects, e.g. tarnish of silver).
- Acetic acid is given off by wood, wood products and certain adhesives and
- sealants.
- Formic acid is emitted from some woods and when oil-based paint dries.
- Formaldehyde is emitted chiefly from glues and binders in particleboard
- and composite materials.
All these materials are frequently used in the construction and fitting out of museums,
galleries, archives and libraries. Usually but not always, galleries and storerooms have
sufficient ventilation to keep carbonyl concentrations at low levels in the rooms themselves.
The big problems tend to arise in closed storage containers and display cases, where
carbonyls from their construction materials, finishes, adhesives or contents can build up in
concentration.
Know Your Enemy
Before choosing a pollution control strategy one must assess the pollutants likely to affect
items in the collection, where they will come from, and how they can be controlled. For
instance, full air conditioning with carbon filtration will produce clean gallery air but will do
nothing to help the lead object corroding in acetic acid vapour from its wooden showcase.
Know What is Not Your Enemy
Guidelines on pollution control in heritage buildings
2443 9
All the pollutants mentioned above have damaged objects in some way. Many other air
pollutants, e.g. carbon dioxide, carbon monoxide, chlorofluorocarbons (CFCs) and volatile
organic compounds (VOCs) have a high media profile because of their effect on health or on
the environment, but do not normally damage heritage materials.
How do you reduce pollutant levels?
The main methods are outlined below. Details are discussed in later sections.
For pollutants brought in from outdoors:
- Many surfaces in a building themselves adsorb pollutants. This often
- makes indoor concentrations of outdoor pollutants significantly lower than
- those outside, particularly in naturally-ventilated buildings.
- Reduce natural and mechanical ventilation rates (but not below the
- appropriate levels for health, safety and comfort),
- Incorporate filters in the air handling plant that can absorb designated
- pollutants.
Note that many filters used are not good at trapping the very small dust particles which can
stick to surfaces.
For pollutants generated indoors:
• Carefully specify building materials, furnishings and finishes for minimum emissions.
• Extract air from polluting activities (e.g. cookers, copiers, laboratories) at source.
• Add chemically adsorbent materials, normally in recirculatory air cleaners, but also in
surface finishes.
• Increase ventilation rates (but levels of outdoor pollutants may then increase).
• Control ventilation rates in accordance with monitored pollutant concentrations.
BOX 1. QUANTIFYING POLLUTANT LEVELS The concentration units used for air pollution are either the part per billion (ppb) or the microgram per cubic metre (µg/m
3). They have different meanings, but are often used
interchangeably and can readily be converted from one to another. The part per billion is a measure of the volume fraction of pollutant gas in air, i.e. what proportion of a given air volume is made up of pollutant gas. This fraction is directly proportional to the number of pollutant molecules present in the air. Thus 1 ppb means that 1 pollutant gas molecule is present for every billion (1 000 000 000) air molecules. This may seem like a tiny fraction, but it should be remembered that 1 m
3 of air contains over 10
25
molecules, so 1 ppb means that over 1016 pollutant molecules are present. The part per
million (ppm) and part per trillion (ppt) are used to express pollutant concentration on a similar basis. One ppm is 1 part in 1 000 000 and 1 ppt is 1 part in 1 000 000 000 000. 1 ppm = 1000 ppb 1 ppb = 1000 ppt The microgram per cubic metre (µg/m
3) expresses pollutant concentration as mass per
unit volume rather than as a volume fraction. This is most appropriate for particulate
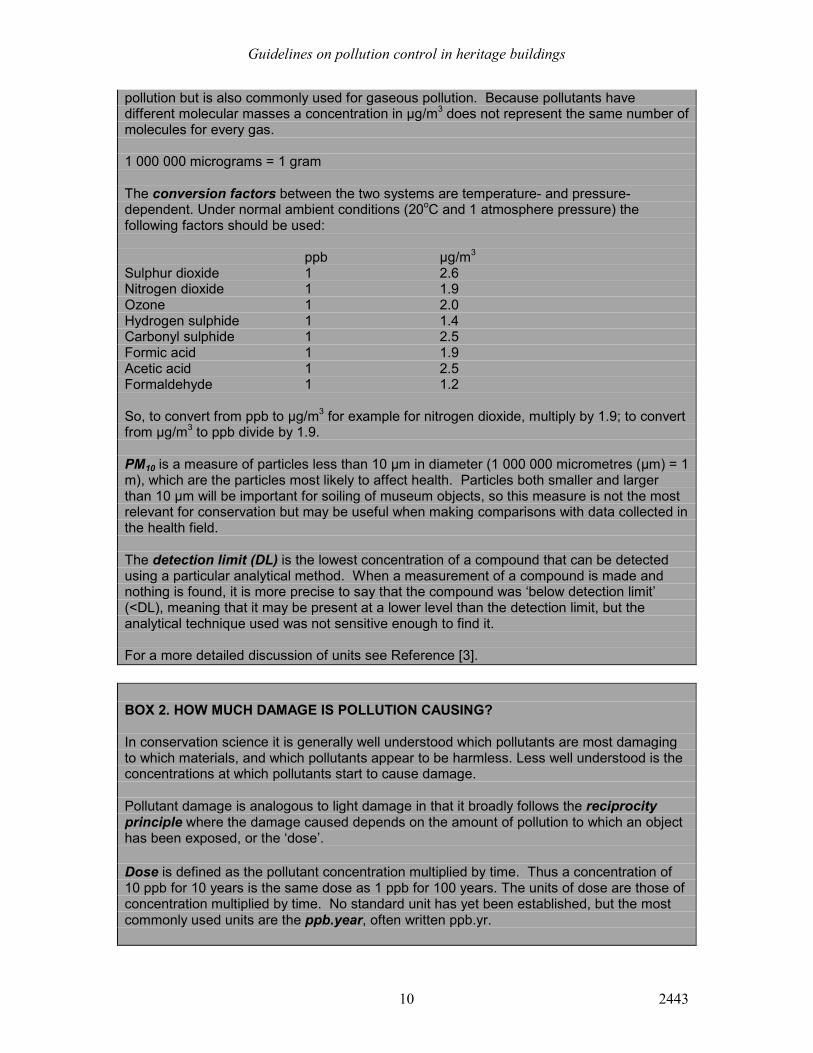
Guidelines on pollution control in heritage buildings
2443 10
pollution but is also commonly used for gaseous pollution. Because pollutants have different molecular masses a concentration in µg/m
3 does not represent the same number of
molecules for every gas. 1 000 000 micrograms = 1 gram
The conversion factors between the two systems are temperature- and pressure-dependent. Under normal ambient conditions (20
oC and 1 atmosphere pressure) the
following factors should be used: ppb µg/m
3
Sulphur dioxide 1 2.6 Nitrogen dioxide 1 1.9 Ozone 1 2.0 Hydrogen sulphide 1 1.4 Carbonyl sulphide 1 2.5 Formic acid 1 1.9 Acetic acid 1 2.5 Formaldehyde 1 1.2 So, to convert from ppb to µg/m
3 for example for nitrogen dioxide, multiply by 1.9; to convert
from µg/m3 to ppb divide by 1.9.
PM10 is a measure of particles less than 10 µm in diameter (1 000 000 micrometres (µm) = 1 m), which are the particles most likely to affect health. Particles both smaller and larger than 10 µm will be important for soiling of museum objects, so this measure is not the most relevant for conservation but may be useful when making comparisons with data collected in the health field. The detection limit (DL) is the lowest concentration of a compound that can be detected using a particular analytical method. When a measurement of a compound is made and nothing is found, it is more precise to say that the compound was ‘below detection limit’ (<DL), meaning that it may be present at a lower level than the detection limit, but the analytical technique used was not sensitive enough to find it. For a more detailed discussion of units see Reference [3].
BOX 2. HOW MUCH DAMAGE IS POLLUTION CAUSING? In conservation science it is generally well understood which pollutants are most damaging to which materials, and which pollutants appear to be harmless. Less well understood is the concentrations at which pollutants start to cause damage.
Pollutant damage is analogous to light damage in that it broadly follows the reciprocity principle where the damage caused depends on the amount of pollution to which an object has been exposed, or the ‘dose’.
Dose is defined as the pollutant concentration multiplied by time. Thus a concentration of 10 ppb for 10 years is the same dose as 1 ppb for 100 years. The units of dose are those of concentration multiplied by time. No standard unit has yet been established, but the most commonly used units are the ppb.year, often written ppb.yr.
Guidelines on pollution control in heritage buildings
2443 11
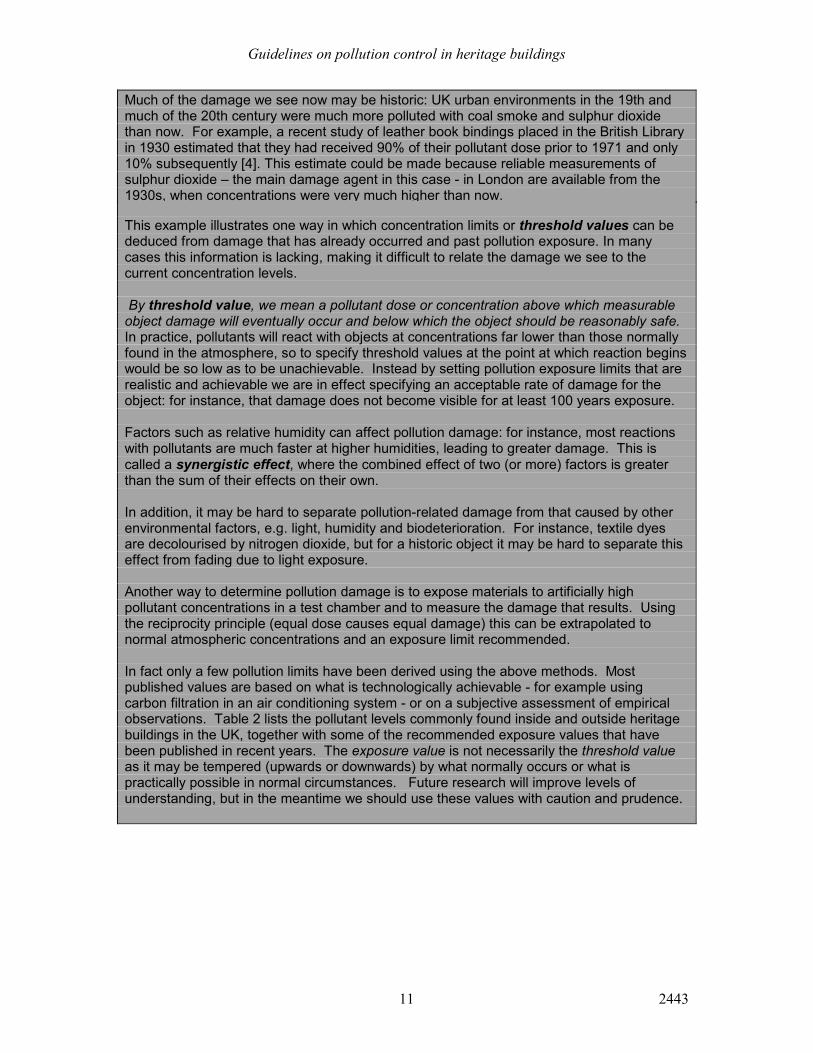
Much of the damage we see now may be historic: UK urban environments in the 19th and much of the 20th century were much more polluted with coal smoke and sulphur dioxide than now. For example, a recent study of leather book bindings placed in the British Library in 1930 estimated that they had received 90% of their pollutant dose prior to 1971 and only 10% subsequently [4]. This estimate could be made because reliable measurements of sulphur dioxide – the main damage agent in this case - in London are available from the 1930s, when concentrations were very much higher than now.
This example illustrates one way in which concentration limits or threshold values can be deduced from damage that has already occurred and past pollution exposure. In many cases this information is lacking, making it difficult to relate the damage we see to the current concentration levels.
By threshold value, we mean a pollutant dose or concentration above which measurable object damage will eventually occur and below which the object should be reasonably safe. In practice, pollutants will react with objects at concentrations far lower than those normally found in the atmosphere, so to specify threshold values at the point at which reaction begins would be so low as to be unachievable. Instead by setting pollution exposure limits that are realistic and achievable we are in effect specifying an acceptable rate of damage for the object: for instance, that damage does not become visible for at least 100 years exposure. Factors such as relative humidity can affect pollution damage: for instance, most reactions with pollutants are much faster at higher humidities, leading to greater damage. This is called a synergistic effect, where the combined effect of two (or more) factors is greater than the sum of their effects on their own. In addition, it may be hard to separate pollution-related damage from that caused by other environmental factors, e.g. light, humidity and biodeterioration. For instance, textile dyes are decolourised by nitrogen dioxide, but for a historic object it may be hard to separate this effect from fading due to light exposure. Another way to determine pollution damage is to expose materials to artificially high pollutant concentrations in a test chamber and to measure the damage that results. Using the reciprocity principle (equal dose causes equal damage) this can be extrapolated to normal atmospheric concentrations and an exposure limit recommended. In fact only a few pollution limits have been derived using the above methods. Most published values are based on what is technologically achievable - for example using carbon filtration in an air conditioning system - or on a subjective assessment of empirical observations. Table 2 lists the pollutant levels commonly found inside and outside heritage buildings in the UK, together with some of the recommended exposure values that have been published in recent years. The exposure value is not necessarily the threshold value as it may be tempered (upwards or downwards) by what normally occurs or what is practically possible in normal circumstances. Future research will improve levels of understanding, but in the meantime we should use these values with caution and prudence.
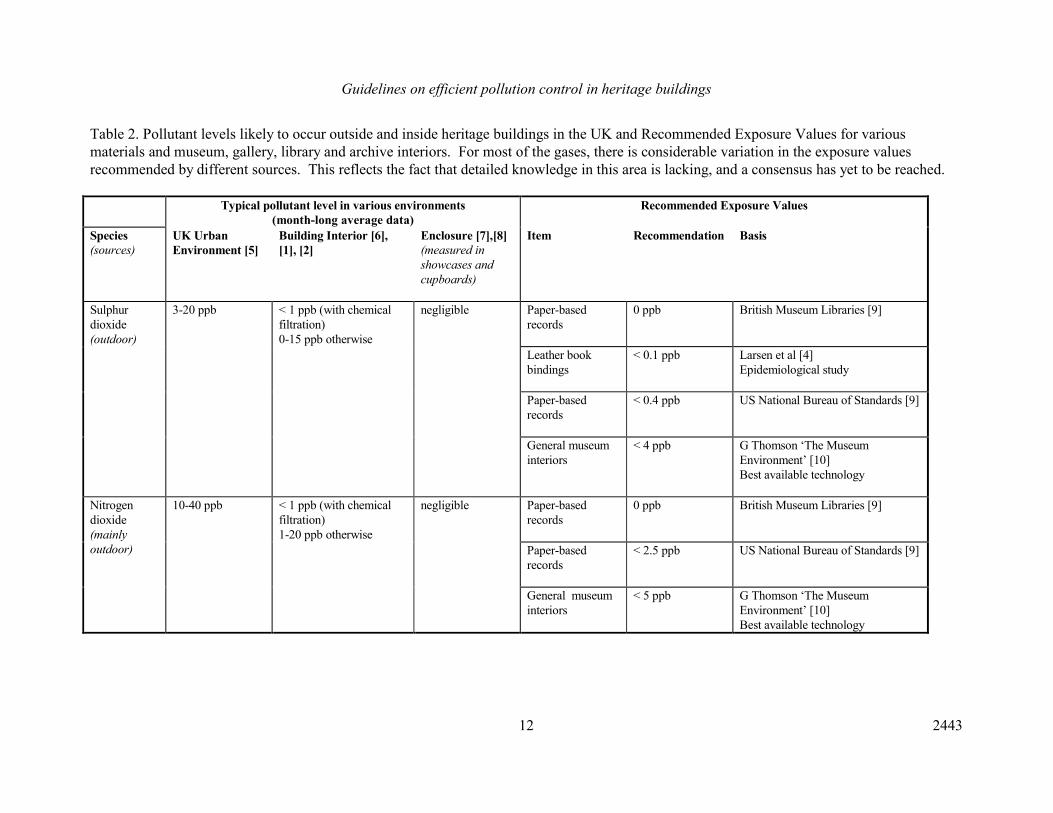
Guidelines on efficient pollution control in heritage buildings
2443 12
Table 2. Pollutant levels likely to occur outside and inside heritage buildings in the UK and Recommended Exposure Values for various
materials and museum, gallery, library and archive interiors. For most of the gases, there is considerable variation in the exposure values
recommended by different sources. This reflects the fact that detailed knowledge in this area is lacking, and a consensus has yet to be reached.
Typical pollutant level in various environments
(month-long average data)
Recommended Exposure Values
Species
(sources)
UK Urban
Environment [5]
Building Interior [6],
[1], [2]
Enclosure [7],[8]
(measured in
showcases and
cupboards)
Item Recommendation Basis
Paper-based
records
0 ppb
British Museum Libraries [9]
Leather book
bindings
< 0.1 ppb
Larsen et al [4]
Epidemiological study
Paper-based
records
< 0.4 ppb
US National Bureau of Standards [9]
Sulphur
dioxide
(outdoor)
3-20 ppb < 1 ppb (with chemical
filtration)
0-15 ppb otherwise
negligible
General museum
interiors
< 4 ppb G Thomson ‘The Museum
Environment’ [10]
Best available technology
Paper-based
records
0 ppb
British Museum Libraries [9]
Paper-based
records
< 2.5 ppb
US National Bureau of Standards [9]
Nitrogen
dioxide
(mainly
outdoor)
10-40 ppb < 1 ppb (with chemical
filtration)
1-20 ppb otherwise
negligible
General museum
interiors
< 5 ppb
G Thomson ‘The Museum
Environment’ [10]
Best available technology
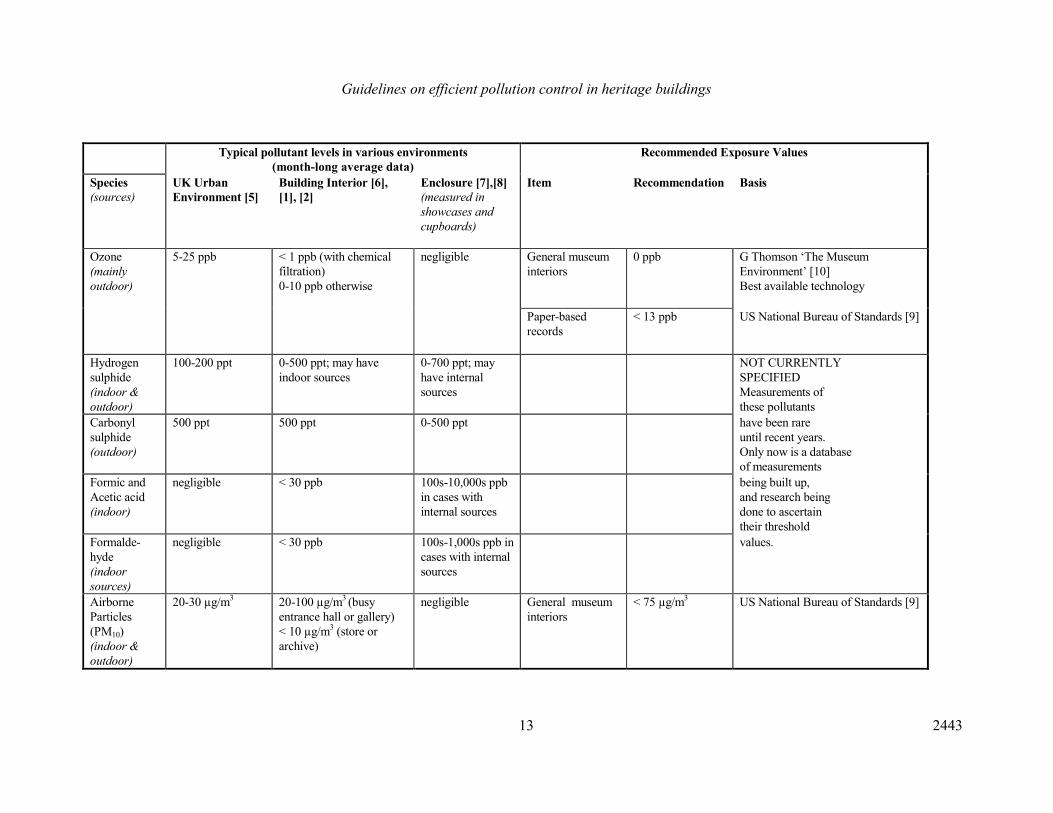
Guidelines on efficient pollution control in heritage buildings
2443 13
Typical pollutant levels in various environments
(month-long average data)
Recommended Exposure Values
Species
(sources)
UK Urban
Environment [5]
Building Interior [6],
[1], [2]
Enclosure [7],[8]
(measured in
showcases and
cupboards)
Item Recommendation Basis
General museum
interiors
0 ppb G Thomson ‘The Museum
Environment’ [10]
Best available technology
Ozone
(mainly
outdoor)
5-25 ppb < 1 ppb (with chemical
filtration)
0-10 ppb otherwise
negligible
Paper-based
records
< 13 ppb US National Bureau of Standards [9]
Hydrogen
sulphide
(indoor &
outdoor)
100-200 ppt 0-500 ppt; may have
indoor sources
0-700 ppt; may
have internal
sources
NOT CURRENTLY
SPECIFIED
Measurements of
these pollutants
Carbonyl
sulphide
(outdoor)
500 ppt 500 ppt 0-500 ppt have been rare
until recent years.
Only now is a database
of measurements
Formic and
Acetic acid
(indoor)
negligible < 30 ppb 100s-10,000s ppb
in cases with
internal sources
being built up,
and research being
done to ascertain
their threshold
Formalde-
hyde
(indoor
sources)
negligible < 30 ppb 100s-1,000s ppb in
cases with internal
sources
values.
Airborne
Particles
(PM10)
(indoor &
outdoor)
20-30 µg/m3 20-100 µg/m
3 (busy
entrance hall or gallery)
< 10 µg/m3 (store or
archive)
negligible General museum
interiors
< 75 µg/m3 US National Bureau of Standards [9]
Guidelines on efficient pollution control in heritage buildings
2443 14
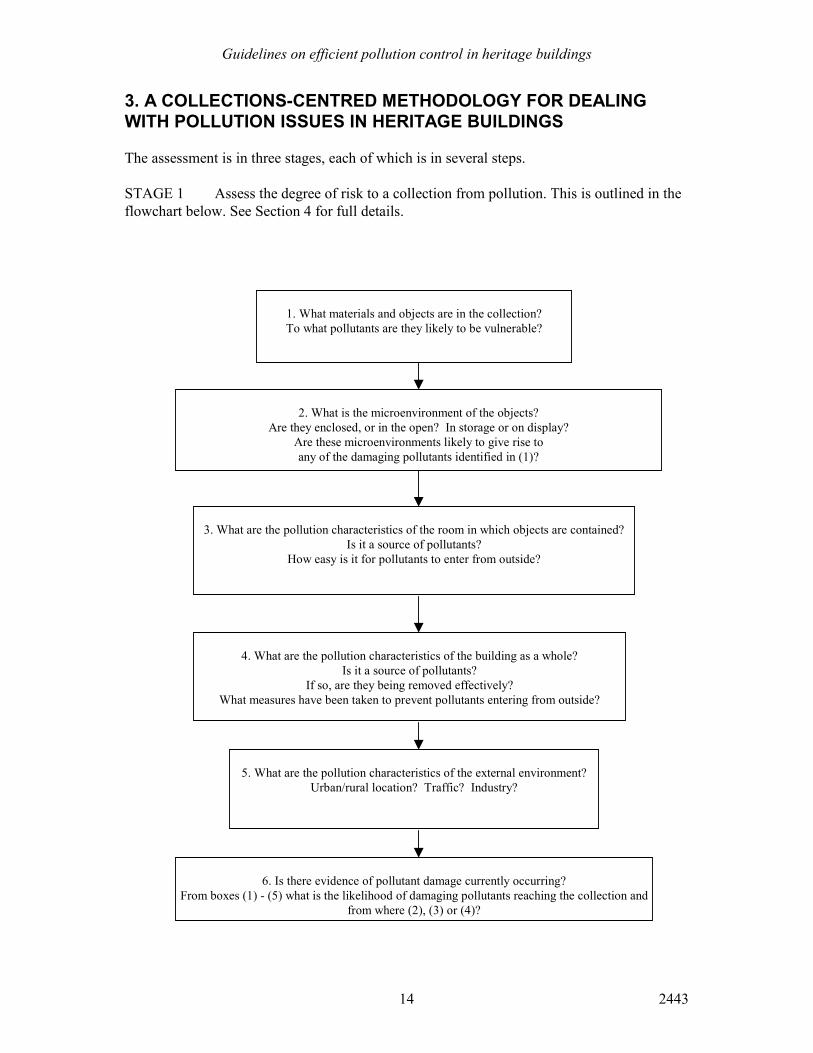
3. A COLLECTIONS-CENTRED METHODOLOGY FOR DEALING
WITH POLLUTION ISSUES IN HERITAGE BUILDINGS
The assessment is in three stages, each of which is in several steps.
STAGE 1 Assess the degree of risk to a collection from pollution. This is outlined in the
flowchart below. See Section 4 for full details.
1. What materials and objects are in the collection?
To what pollutants are they likely to be vulnerable?
2. What is the microenvironment of the objects?
Are they enclosed, or in the open? In storage or on display?
Are these microenvironments likely to give rise to
any of the damaging pollutants identified in (1)?
3. What are the pollution characteristics of the room in which objects are contained?
Is it a source of pollutants?
How easy is it for pollutants to enter from outside?
4. What are the pollution characteristics of the building as a whole?
Is it a source of pollutants?
If so, are they being removed effectively?
What measures have been taken to prevent pollutants entering from outside?
5. What are the pollution characteristics of the external environment?
Urban/rural location? Traffic? Industry?
6. Is there evidence of pollutant damage currently occurring?
From boxes (1) - (5) what is the likelihood of damaging pollutants reaching the collection and
from where (2), (3) or (4)?
Guidelines on efficient pollution control in heritage buildings
2443 15
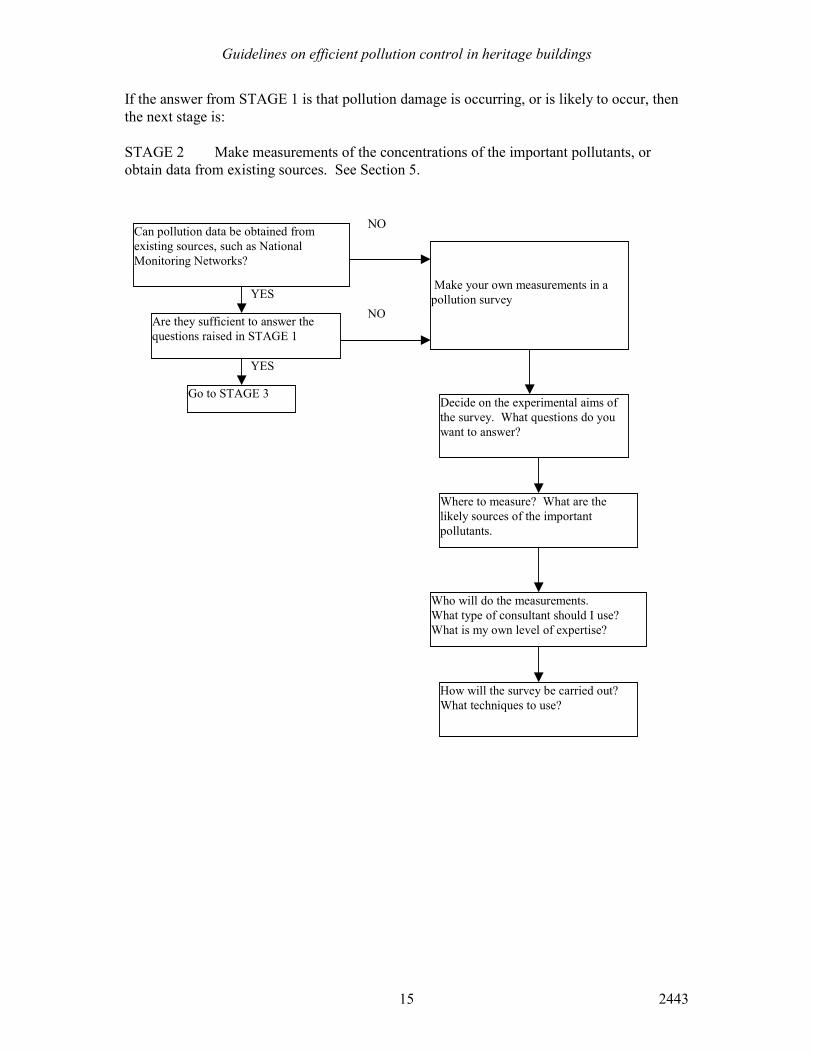
If the answer from STAGE 1 is that pollution damage is occurring, or is likely to occur, then
the next stage is:
STAGE 2 Make measurements of the concentrations of the important pollutants, or
obtain data from existing sources. See Section 5.
Can pollution data be obtained from
existing sources, such as National
Monitoring Networks?
YES
NOAre they sufficient to answer the
questions raised in STAGE 1
YES
Go to STAGE 3
Make your own measurements in a
pollution survey
Decide on the experimental aims of
the survey. What questions do you
want to answer?
Where to measure? What are the
likely sources of the important
pollutants.
Who will do the measurements.
What type of consultant should I use?
What is my own level of expertise?
How will the survey be carried out?
What techniques to use?
NO
Guidelines on efficient pollution control in heritage buildings
2443 16
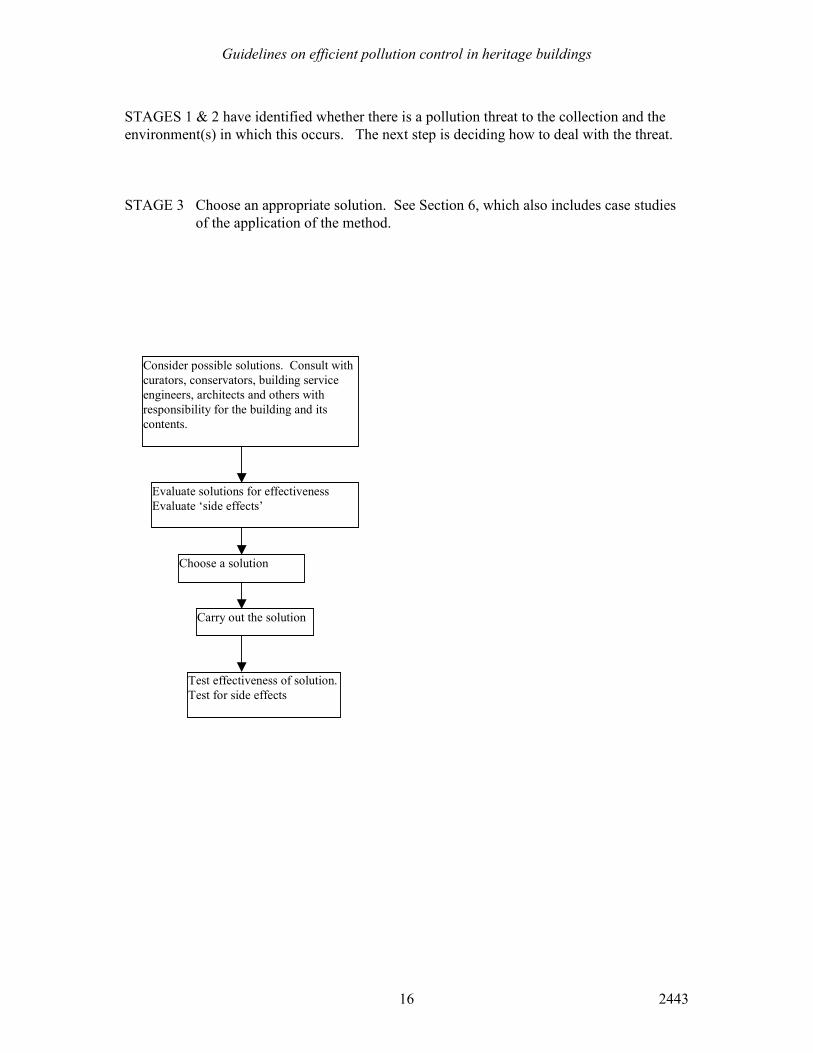
STAGES 1 & 2 have identified whether there is a pollution threat to the collection and the
environment(s) in which this occurs. The next step is deciding how to deal with the threat.
STAGE 3 Choose an appropriate solution. See Section 6, which also includes case studies
of the application of the method.
Consider possible solutions. Consult with
curators, conservators, building service
engineers, architects and others with
responsibility for the building and its
contents.
Evaluate solutions for effectiveness
Evaluate ‘side effects’
Choose a solution
Carry out the solution
Test effectiveness of solution.
Test for side effects
Guidelines on efficient pollution control in heritage buildings
2443 17
4. METHODOLOGY STAGE 1: RISK ASSESSMENT
The risk assessment needs to consider:
• the types of object and materials in the collection and the pollutants that might affect them
• whether there is evidence of current damage
• the existing storage or display conditions, e.g. temperature and relative humidity, light
levels, particulate and gaseous pollution, biodeterioration;
• the nature of the building in which they are housed; its environmental control systems; and
shelving, container, case or cupboard materials; and
• the local outdoor environment and the pollutants likely to be present.
You should start by considering the problem from the collection’s point of view, working out
from:
• the types of object and the pollution hazards to the materials they contain; to
• the immediate microenvironment of the objects; to
• the environment in the surrounding room; to
• the building as a whole; and lastly to
• the external environment.
This may seem obvious, but museums, galleries, libraries and archives often seem to start at
the other end: they embark on measuring pollutant levels in the building without thinking
what is most likely to threaten objects in their collection. The outcome may ultimately be the
same, but the process can cost a lot more time and money. Consultants may analyse for
irrelevant compounds, or look in the wrong places.
The elements of the risk assessment:
4.1 Step 1. Identify material or object types and the associated pollution hazards
Table 3 will help you to identify which materials in your collection are potentially at risk, the
damage which may occur, and the pollutants which are often involved. For the likely sources
of these pollutants, see Table 1.
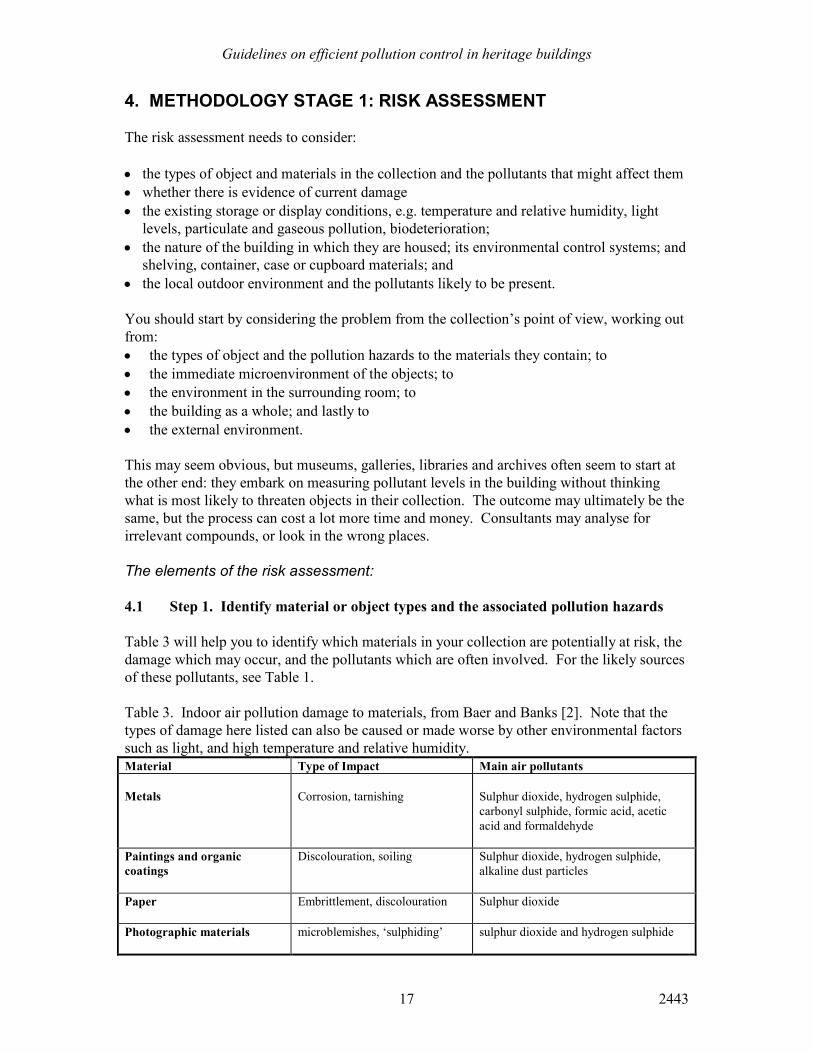
Table 3. Indoor air pollution damage to materials, from Baer and Banks [2]. Note that the
types of damage here listed can also be caused or made worse by other environmental factors
such as light, and high temperature and relative humidity.
Material Type of Impact Main air pollutants
Metals
Corrosion, tarnishing
Sulphur dioxide, hydrogen sulphide,
carbonyl sulphide, formic acid, acetic
acid and formaldehyde
Paintings and organic
coatings
Discolouration, soiling Sulphur dioxide, hydrogen sulphide,
alkaline dust particles
Paper Embrittlement, discolouration Sulphur dioxide
Photographic materials microblemishes, ‘sulphiding’ sulphur dioxide and hydrogen sulphide
Guidelines on efficient pollution control in heritage buildings
2443 18
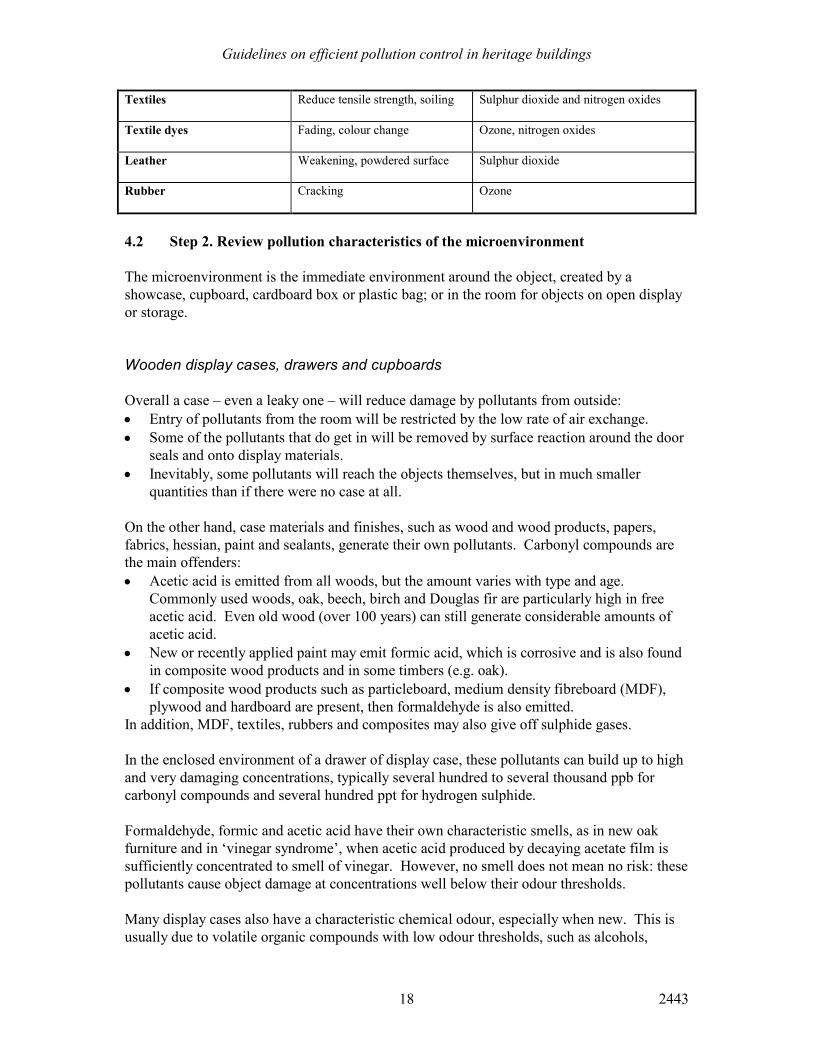
Textiles Reduce tensile strength, soiling Sulphur dioxide and nitrogen oxides
Textile dyes Fading, colour change Ozone, nitrogen oxides
Leather Weakening, powdered surface Sulphur dioxide
Rubber Cracking Ozone
4.2 Step 2. Review pollution characteristics of the microenvironment
The microenvironment is the immediate environment around the object, created by a
showcase, cupboard, cardboard box or plastic bag; or in the room for objects on open display
or storage.
Wooden display cases, drawers and cupboards
Overall a case – even a leaky one – will reduce damage by pollutants from outside:
• Entry of pollutants from the room will be restricted by the low rate of air exchange.
• Some of the pollutants that do get in will be removed by surface reaction around the door
seals and onto display materials.
• Inevitably, some pollutants will reach the objects themselves, but in much smaller
quantities than if there were no case at all.
On the other hand, case materials and finishes, such as wood and wood products, papers,
fabrics, hessian, paint and sealants, generate their own pollutants. Carbonyl compounds are
the main offenders:
• Acetic acid is emitted from all woods, but the amount varies with type and age.
Commonly used woods, oak, beech, birch and Douglas fir are particularly high in free
acetic acid. Even old wood (over 100 years) can still generate considerable amounts of
acetic acid.
• New or recently applied paint may emit formic acid, which is corrosive and is also found
in composite wood products and in some timbers (e.g. oak).
• If composite wood products such as particleboard, medium density fibreboard (MDF),
plywood and hardboard are present, then formaldehyde is also emitted.
In addition, MDF, textiles, rubbers and composites may also give off sulphide gases.
In the enclosed environment of a drawer of display case, these pollutants can build up to high
and very damaging concentrations, typically several hundred to several thousand ppb for
carbonyl compounds and several hundred ppt for hydrogen sulphide.
Formaldehyde, formic and acetic acid have their own characteristic smells, as in new oak
furniture and in ‘vinegar syndrome’, when acetic acid produced by decaying acetate film is
sufficiently concentrated to smell of vinegar. However, no smell does not mean no risk: these
pollutants cause object damage at concentrations well below their odour thresholds.
Many display cases also have a characteristic chemical odour, especially when new. This is
usually due to volatile organic compounds with low odour thresholds, such as alcohols,
Guidelines on efficient pollution control in heritage buildings
2443 19
esters, ketones and aromatics, used in the manufacture and finishing of the case. These
compounds do not react with most objects, so smell does not necessarily indicate a pollution
problem.
Metal and glass cases
Metal and glass do not emit pollutants, and cases of these materials are usually, but not
always, designed to seal tightly, keeping out external pollution. However, the metal and glass
surfaces will be less able to adsorb the external pollution that does get in.
While metal and glass cases are themselves inert, they may contain polluting materials, e.g.
back and baseboards of wood or MDF, display and backing materials, sealants used for glass-
glass and glass-metal joins, and museum objects. In a well-sealed case, this may lead to high
concentrations of carbonyl and sulphide compounds, similar to those in wooden cases.
Plastic bags and boxes
Thermoplastic bags and boxes - if well sealed - can work well in excluding external
pollutants. They may emit some organic compounds, but these are seldom harmful as they do
not normally include the organic acids or formaldehyde (but PVC may contain free
hydrochloric acid). However, reference [11] describes how a plastic box used to store wood
adsorbed acetic acid vapours, and caused corrosion when it was re-used to store lead objects.
Hence boxes and bags used to store vulnerable metals, shells etc. should either be new or
have previously only contained inert materials. Take care also if putting composite items
(e.g. wood and metal) in such sealed containers, emissions from one component will not be
able to disperse and may damage another.
Cardboard storage boxes
Cardboard is a good absorber of external air pollutants, but a cardboard box is not air tight.
Cardboard may also be acidic and emit organic acid vapours. Ensure that acid-free archival
quality boxes are specified for vulnerable materials.
4.3 Step 3. Review pollution characteristics of rooms and galleries
The design of a building and the materials used in construction and finishing can greatly
affect the indoor concentrations of both externally and internally generated pollutants.
• Materials and finishes can add pollutants, outgassing in the same way materials in
enclosed cases, see Section 4.2. The consequences are usually less severe, because:
- rooms have a much higher air volume in relation to their enclosing surfaced
area than a cabinet or drawer,
- air change rates are also much higher, even in most well-sealed rooms.
However problems have been known, for example, in buildings which contain a lot of
oak or plywood, for example in flooring, panelling and structural elements.
• Interior surfaces can also remove pollutants. Chemicals that damage objects are by
definition reactive, so they also react with interior surfaces. This “pollutant removal by
surface deposition” is an important mechanism by which the indoor concentrations of
outdoor pollutants can be reduced without recourse to air conditioning and carbon
filtration; and has been found to be effective in many naturally-ventilated buildings.
Guidelines on efficient pollution control in heritage buildings
2443 20
HOW MUCH CAN SURFACE DEPOSITION REDUCE POLLUTANT LEVELS?
This depends on:
• The ventilation rate – the lower the rate the less mass of pollutants will be brought in and
the more chance they will have to be adsorbed.
• The chemistry of the gases. Pollutant-surface reactivity generally decreases in the order:
ozone, sulphur dioxide, nitrogen dioxide, hydrogen sulphide, carbonyls.
• The nature of the surfaces. In general:
- Metal and glass are relatively unreactive.
- Plaster, porous brick, tile, wood and carpet are more reactive and more
effective at removing pollutants such as nitrogen dioxide, sulphur dioxide and
ozone.
- Paints tend to be in the middle of the scale, with porous and alkaline paints
more reactive, and impermeable and gloss paints less reactive.
• The surface area. The larger this is in relation to the volume of the room, the more the
chance that the pollutant will be adsorbed.
Pollutant entering a room will deposit onto all available surfaces, so the amount that reaches
object surfaces can be reduced by ensuring that room surfaces are large in area and made of
reactive materials, such as concrete, brick, stone, plaster and wood, preferably with no or
porous surface finishes. The process of deposition may cause some deterioration of these
‘sacrificial’ surfaces. However, this has been going on since air pollution first became a
problem and seldom has gaseous pollution damage been identified to wall and flooring
materials in normal use and with normal cleaning and maintenance cycles. On the other
hand, culturally significant surfaces of buildings which need to remain untouched are just as
susceptible to pollution hazards as movable heritage.
BOX 3. SURFACE DEPOSITION - POLLUTANT REMOVAL BY THE BUILDING FABRIC For highly reactive pollutants such as sulphur dioxide, ozone and to a lesser extent nitrogen dioxide, the concentration in a building is normally lower than outside, even when no filtration is installed. Similarly, concentrations of these pollutants inside cases and cupboards are lower than those in the rooms themselves. This is because when these pollutants come into contact with surfaces such as floors, walls and ceilings they react and are converted into inert forms. How effective this process is at removing pollutants from the air can be modelled in a mathematical mass balance equation: I/O = ach / (Vdep (S/V) + ach) [12] where I = indoor concentration O = outdoor concentration ach = air exchange rate (hr
–1)
Vdep = deposition velocity of the pollutant gas (m hr–1)
S = surface area of interior (m2)
V = interior volume (m3)
Guidelines on efficient pollution control in heritage buildings
2443 21
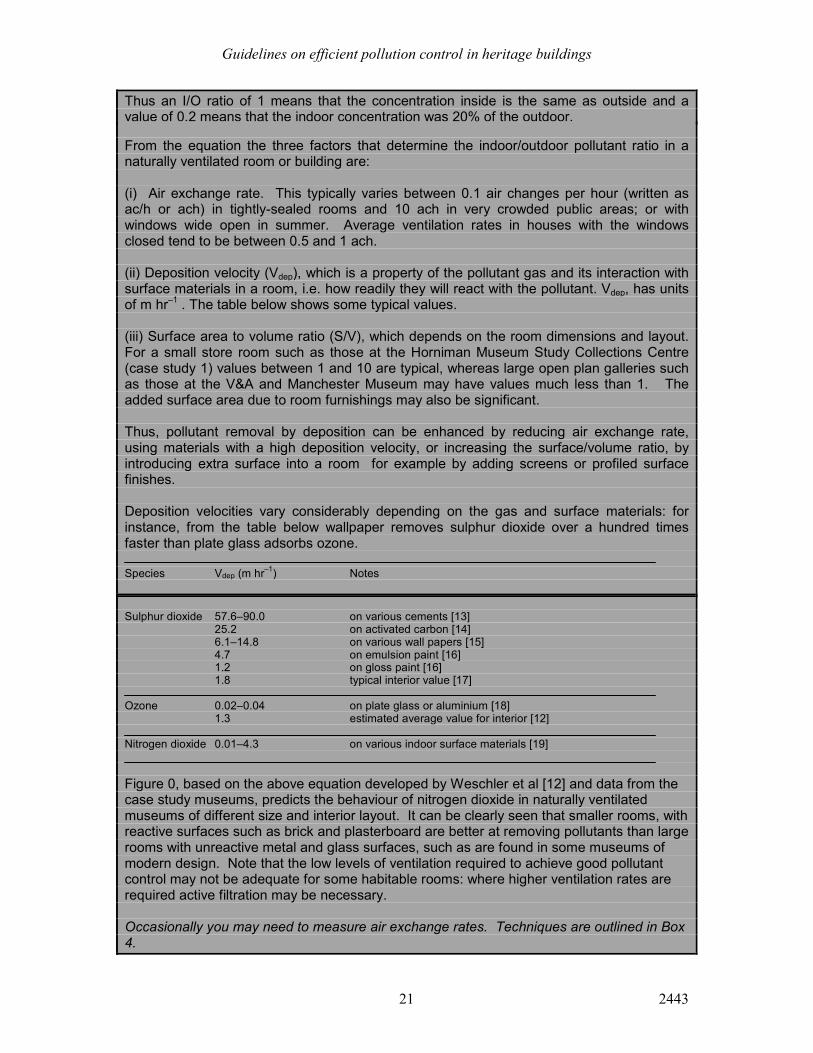
Thus an I/O ratio of 1 means that the concentration inside is the same as outside and a value of 0.2 means that the indoor concentration was 20% of the outdoor. From the equation the three factors that determine the indoor/outdoor pollutant ratio in a naturally ventilated room or building are: (i) Air exchange rate. This typically varies between 0.1 air changes per hour (written as ac/h or ach) in tightly-sealed rooms and 10 ach in very crowded public areas; or with windows wide open in summer. Average ventilation rates in houses with the windows closed tend to be between 0.5 and 1 ach. (ii) Deposition velocity (Vdep), which is a property of the pollutant gas and its interaction with surface materials in a room, i.e. how readily they will react with the pollutant. Vdep, has units of m hr
–1 . The table below shows some typical values.
(iii) Surface area to volume ratio (S/V), which depends on the room dimensions and layout. For a small store room such as those at the Horniman Museum Study Collections Centre (case study 1) values between 1 and 10 are typical, whereas large open plan galleries such as those at the V&A and Manchester Museum may have values much less than 1. The added surface area due to room furnishings may also be significant. Thus, pollutant removal by deposition can be enhanced by reducing air exchange rate, using materials with a high deposition velocity, or increasing the surface/volume ratio, by introducing extra surface into a room for example by adding screens or profiled surface finishes. Deposition velocities vary considerably depending on the gas and surface materials: for instance, from the table below wallpaper removes sulphur dioxide over a hundred times faster than plate glass adsorbs ozone. Species Vdep (m hr
–1) Notes
Sulphur dioxide 57.6–90.0 on various cements [13] 25.2 on activated carbon [14] 6.1–14.8 on various wall papers [15] 4.7 on emulsion paint [16] 1.2 on gloss paint [16]
1.8 typical interior value [17] Ozone 0.02–0.04 on plate glass or aluminium [18] 1.3 estimated average value for interior [12] Nitrogen dioxide 0.01–4.3 on various indoor surface materials [19]
Figure 0, based on the above equation developed by Weschler et al [12] and data from the case study museums, predicts the behaviour of nitrogen dioxide in naturally ventilated museums of different size and interior layout. It can be clearly seen that smaller rooms, with reactive surfaces such as brick and plasterboard are better at removing pollutants than large rooms with unreactive metal and glass surfaces, such as are found in some museums of modern design. Note that the low levels of ventilation required to achieve good pollutant control may not be adequate for some habitable rooms: where higher ventilation rates are required active filtration may be necessary. Occasionally you may need to measure air exchange rates. Techniques are outlined in Box 4.
Guidelines on efficient pollution control in heritage buildings
2443 22
The air exchange or ‘fresh air’ ventilation rate is an important parameter in determining the
pollution concentration within a building. Three factors determine the air exchange rate of a
building:
1. Air Infiltration. This is uncontrolled leakage of air through cracks and small openings
(e.g. for services such as water, gas and electricity) in the building fabric.
2. Controlled natural ventilation, by opening windows and doors and stacks.
3. Mechanical ventilation, through the use of fans to blow air into and around a building.
The air exchange between inside and outside (i.e. the ‘fresh air exchange rate’) may only be a
small proportion of the air being circulated around the building.
BOX 4. MEASURING AIR EXCHANGE RATES
Often you will not need to measure air exchange rates to come up with a pollution control strategy. However, sometimes there will be concerns that there is not enough ventilation. Conversely, the fabric of many buildings – both new and old – can be leaky and let in too much outside air – typically at joints between construction materials, around the outsides as well as the insides of window and door frames, and through cracks, holes and cable, pipe and duct runs. These are not always easily spotted, although the use of smoke pencils can be very useful. There are two main methods of measuring air exchange rates. Both are usually undertaken by specialists.
• TRACER GAS METHODS These can determine the air exchange in both naturally and mechanically ventilated buildings.
1. Passive method. Two sets of tubes are put in the space and opened – one set (the emitters) give out a small quantity of a chemical, usually an inert perfluorocarbon, the others (diffusion samplers) absorb it. A few weeks later, the absorber tubes are sealed and sent away for analysis. The amount of chemical absorbed is a function of the volume of the room, the number of emitters, and the average air exchange rate during the exposure period.
2. Active method. A gas such as sulphur hexafluoride, is released into the room to be measured and allowed to mix thoroughly with the air. Its concentration is then measured over a period of several hours. How quickly this decays is a function of the air exchange rate
• THE PRESSURE TEST METHOD This only determines the leakiness of the construction, i.e. the air infiltration, and as such is only suitable for naturally ventilated buildings. The space is pressurised by a fan and the air flow through the fan measured. From the relationship between pressure and air flow volume, the air leakage rate can be deduced. The pressures involved are very, very small: they will not blow windows out or pictures off the wall, as some people fear!
- For individual rooms or domestic-scale buildings, a small unit which can be inserted into a door opening (“a blower door”) is used. - For large buildings, a fan towed by a vehicle which also provides its power is used.
Sometimes, a building’s own ventilation plant can be used to provide the pressure, but in practice independent, calibrated equipment normally proves more reliable and cost-effective. Pressure tests can be combined with small (e.g. smoke pencil) and large-scale smoke tests to determine the air leakage paths.
Guidelines on efficient pollution control in heritage buildings
2443 23
Note the air exchange rate between inside and outside will vary with time in most buildings. In naturally ventilated buildings door and window opening may increase in summer. Air infiltration will increase during windy episodes or when it is very cold outside. In mechanically ventilated buildings most of the air may be recirculated when they are unoccupied. For more information on measuring air exchange rates see reference [20].
[Picture 1. Ventilation Measurement at the Manchester Museum…]
MAXIMISING THE EFFECTIVENESS OF SURFACE DEPOSITION
To achieve the greatest reductions in the levels of pollutants from outdoors:
• Reduce the rate at which polluted outside air enters the building, for example by
improving fabric airtightness, sealing doors and windows, and examining mechanical
ventilation rates.
• Have a large surface area. Hence small rooms, or larger ones with many screens or
partitions will adsorb more pollutants than those that are open-plan.
• Choose adsorbent surfaces, and do not paint over those which are already absorbent..
In stores and archives occupied by small numbers of people, minimising ventilation rates can
be an effective strategy, as is shown by some of the case studies in Section 6.
DON’T OVERDO IT!
Although there is often the opportunity to reduce unnecessary ventilation and the associated
transfer of outdoor pollutants, there still needs to be adequate ventilation for visitors and staff
and to remove internally generated pollutants (see Section 6.4). If ventilation rates become
too low, internally generated tarnish-causing gases such as hydrogen sulphide can
occasionally become a problem. Other internally generated pollutants such as carbonyls
seldom attain damaging concentrations in rooms and galleries, unless totally inappropriate
building materials have been used. If you do reduce room ventilation rates, it is therefore
important to check the resultant levels of critical pollutants to be sure that there have been no
unintended consequences.
4.4 Step 4. Review pollution geography within the building
It is important to consider how pollutants are distributed about the whole building, not just
the display and store rooms. In particular:
• Are pollutants being generated in public, office and ancillary areas which subsequently
migrate into display and storage areas. In particular:
- Nitrogen dioxide emitted by cooking appliances, which should not be
located in or near the collections space and preferably be equipped with air
extraction to outdoors.
- Combustion fumes from unflued or open-flued heating appliances.
- Moisture and other chemicals emitted by cooking, cleaning and
conservation laboratory activities.
- Ozone may also be emitted by photocopiers and laser printers, which also
need care in siting and ventilation. The manufacturer’s specification may give
Guidelines on efficient pollution control in heritage buildings
2443 24
information on ozone emission, which is likely to be a greater problem with older
equipment.
• Ventilation and air-conditioning systems can be effective at providing filtered air and
removing polluted air, but they may also introduce unwanted pollution:
- From outside. This can be exacerbated if air intakes are poorly-located, for
example at low level beside a busy road, rather than at higher level at the back of
a building; or just from windows being opened or air infiltrating in the wrong
places.
- By short-circuiting or recirculation between mechanical extract outlets,
flue terminals etc. and “fresh air” intakes.
- By poor maintenance of plant and their distribution ductwork, for example
filter failure, or an accumulation of dust, pollutants and biological activity
internally.
- By aerosols generated by humidifiers and spray washers, which can be
carried in the airstream and cause their own pollution problems. There are also
reported instances of the hygroscopic lithium bromide from desiccant
dehumidifiers being carried over and causing corrosion of metals: inert desiccants
are preferable.
Check how all the plant is configured and where all intakes and exhausts are located.
• The building’s internal layout can also help to isolate storage and display areas from
pollutants. For example, surface deposition in corridors and public areas can significantly
reduce outdoor pollutant levels in inner rooms, as discussed in Section 6.
4.5 Step 5. Assess pollution characteristics of external environments
The main sources of outdoor pollution in urban areas are transport, industry and to a lesser
extent buildings.
SULPHUR DIOXIDE
This comes chiefly from burning fossil fuels - particularly coal - in industry, power stations
and for heating. With coal’s decline in the UK, sulphur dioxide levels have fallen
dramatically (figure 1 is for central London, data for other UK towns and cities are similar).
This is very welcome, as sulphur dioxide has probably caused more damage to cultural
property than any other single pollutant. However, it is still important to consider the need to
control it, especially if sensitive objects are on open display.
NITROGEN DIOXIDE
Oxides of nitrogen (NOx) originate mainly from motor vehicles, but also from combustion in
boilers, cookers and industrial processes. Some nitrogen dioxide is emitted directly, and
more is created – particularly on sunny days - when other NOxs react with air in the presence
of sunlight. A declining trend in NOx emissions from UK industry has coincided with
increased emissions from road transport. Consequently UK urban background nitrogen
dioxide concentrations have been fairly steady over the last 30 years (figure 1 is for central
London, data for other UK towns and cities are similar). However, busy urban streets have
particularly high concentrations of this pollutant; and this has implications for the location of
air intakes in mechanically controlled buildings, and ventilation strategies in older and
historic buildings.
Guidelines on efficient pollution control in heritage buildings
2443 25
OZONE
Outside, this is principally formed by a reaction involving volatile organic compounds from
petroleum fuel and nitrogen dioxide from motor exhausts. These pollutants are chiefly
generated in urban areas and react together in the presence of strong sunlight. Since the
reaction is quite slow, maximum ozone pollution is often found well away from where the
primary pollutants were first emitted, and often in rural locations. In recent decades, urban
ozone concentrations have not varied much (figure 2 is for central London, data for other UK
towns and cities are similar), but there has been an increase in concentrations in rural sites,
particularly those in the south and east of the UK, where hours of sunshine tend to be longest.
SULPHIDE GASES
Hydrogen sulphide and carbonyl sulphide originate from natural biological and geochemical
processes that can take place well away from urban areas, so they tend to be present at very
low background concentrations everywhere. In urban areas, hydrogen sulphide is also
emitted by motor vehicles with catalytic converters, particularly when new or when cold in
the first five minutes or so of a drive. Hydrogen sulphide is also emitted by some industrial
and combustion processes.
4.6 Step 6. Is damage occurring or likely to occur?
Evaluation of steps 1 to 5 should enable you to assess where there is the possibility of damage
occurring and to what objects. It is important to think specifically about pollution problems
and to identify interactions between pollutant and objects that are likely to occur. If there is
already evidence of pollution damage in a collection then this usually indicates what is the
most pressing priority. An assessment must be made of the degree of risk posed from
pollutants overall and this compared with other damage factors such as temperature, relative
humidity, light and biodeterioration, so that resources can be allocated sensibly. Reference
[21] discusses how this might be done.
5 METHODOLGY STAGE 2: OBTAINING POLLUTION DATA
For externally-generated pollutants, a considerable amount of data can be obtained from
government monitoring networks, so you may not need to make your own measurements. For
pollutants with mainly internal sources, you will often have to measure concentrations.
Data normally available free of charge
The UK national monitoring network is run by AEA Harwell on behalf of the Department,
Environment, Transport and Regions. Many local authorities also carry out their own
monitoring. Although they only measure pollutants which have health effects, these include
important ones for heritage materials, especially nitrogen dioxide, sulphur dioxide and ozone.
The UK National Network covers the entire country at intervals of a few kilometres. Data are
collected at 15 minute intervals and are freely available through the Internet [5]. Sometimes,
these published external levels may themselves furnish enough information to assess the
Guidelines on efficient pollution control in heritage buildings
2443 26
pollutant risk to a collection. For instance, in areas of low concentrations the risk will be
small and the threat of damage from outdoor pollution could be ranked below other
environmental factors. However, you must take care to match the proximity and type of
monitoring site with that of the museum, archive or library site. For example, nitrogen
dioxide concentrations at the kerbside can be much higher than even a few metres away [3],
so data from an urban background site may underestimate the pollution directly outside a
museum on a busy street.
Preparing for a pollution survey
Where significant risks are identified you may need to investigate further. Measurements can
be used to determine the ‘pollution geography’ of the building, and to answer questions like:
• How well does the building fabric exclude externally-generated pollutants?
• Are there are any internal sources?
• Is there a gradient of pollution within the building?
• What side of the building is the most/least polluted? This is useful in deciding from
where to ventilate the building.
If you decide to carry out a survey of the pollutants in and around a building, you need to plan
to ensure that measurements answer the right questions. In doing so, consider the points A,
B, C and D below.
A. Define the aims of the survey.
Starting from a collection’s needs:
• To what pollutants is the collection susceptible?
• Is it on display or in storage?
• In what environments are these likely to occur?
• Are any modifications or improvements to the building being planned or in progress?
• Can the survey be designed to test where modifications would be most effective, e.g.
- Which galleries may need better environmental control;
- In a renovation programme, which display cases should we replace first?
B. Choose the sample sites.
• What information is needed to meet the aims and answer the questions considered in A?
• How many external sites are appropriate?
• What type of sampling do we want? See Box 5 for an outline of the techniques widely
used.
• For which gases?
C. Who will do the work?
Several UK universities (see list at the end of this document) specialise in the study of
pollutants in heritage buildings. They will be able to advise on both measurement and data
interpretation. Organisations with little expertise in the preventive conservation field will
benefit from this level of advice. Alternatively, an organisation with in-house expertise
Guidelines on efficient pollution control in heritage buildings
2443 27
capable of planning a survey and interpreting the results may require a measurement-only
contractor.
WARNING: some consultants do not specialise in pollution damage to cultural heritage.
Those whose expertise is in the health or environment field may not always be able to offer
appropriate advice to heritage organisations. Sometimes they may also be unable to monitor
down to the low concentrations that are critical for some pollutants in conservation.
D. How will the survey be carried out?
The number of sites to be monitored depends on the aims of the survey and the size of the
building. Monitoring should be for the pollutants that the previous steps have shown to be the
greatest hazards at these locations. In the case of externally generated pollutants this should
include at least two, preferably three, external sites on different sides of the building so that
the external pollution can be fully characterised. Inside the building, the monitoring sites
should include corridors and entrance halls as well as the collections space, to assess the
pollution geography. If passive diffusion tubes are used (see Box 5), their measurements are
only approximate: it is therefore recommended that they are exposed in duplicate or triplicate
at each position and the average taken to obtain the most reliable result.
BOX 5. TECHNIQUES OF POLLUTION MEASUREMENT There are two distinct approaches: active and passive sampling.
ACTIVE SAMPLING This uses a pump to draw air through a collection or measurement device, which may even give an instantaneous reading. Current equipment that can measure down to the low concentrations of interest to conservation is often bulky, expensive (thousands of pounds at 2000 prices), needs mains electricity and is inconvenient for monitoring simultaneously at many locations inside and outside a building. Active sampling over a short time period can give a valuable snapshot. In addition, a series of readings can show, for example, daily cycles in pollutant concentrations: this can help identify pollutant sources. However, such spot checks may not reflect long-term exposure conditions. To do this, regular measurements must be taken either manually or automatically, and this can be expensive.
PASSIVE SAMPLING Here there is no pump. Instead, air is allowed to diffuse slowly down a small tube or onto a badge. A chemical inside the device, specific to the pollutant of interest, then reacts with it. Subsequent laboratory analysis reveals the amount of pollutant which has reacted over the exposure period, which is typically between a few days and a few weeks. After analysis, each sampler provides a single value which represents the average concentration to which it was exposed. Peaks and troughs and cycles in concentration that occur over the sampling period are not recorded. The slow, progressive way in which the sampler takes up pollutant mirrors the way objects react with pollutants and therefore gives a more realistic estimate of the long-term exposure of objects to air pollution. Diffusion samplers are small and unobtrusive, making them easy to deploy in rooms and cases. The cost of individual samplers is low (£4-8 as a contract service at 2000 prices) so monitoring can be carried out fairly cheaply. By deploying many samplers throughout a building at the same time (externally, in various rooms, in some display cases, etc) one can determine the ‘pollution geography’ of the site.
Guidelines on efficient pollution control in heritage buildings
2443 28
The advantages of passive sampling have made it the method of first choice for most pollution measurements in heritage buildings. Validated methods are available for most of the gases of interest to museums, galleries, libraries and archives [22-25].
[Picture 2. Instrumental monitoring equipment…]
[Picture 3. Diffusion tubes…]
6. METHODOLOGY STAGE 3: CHOOSING AN APPROPRIATE
SOLUTION
The results of a survey will inform the decision on what needs to be done to control pollution.
It is vital to choose appropriate solutions, which will vary for different locations and objects.
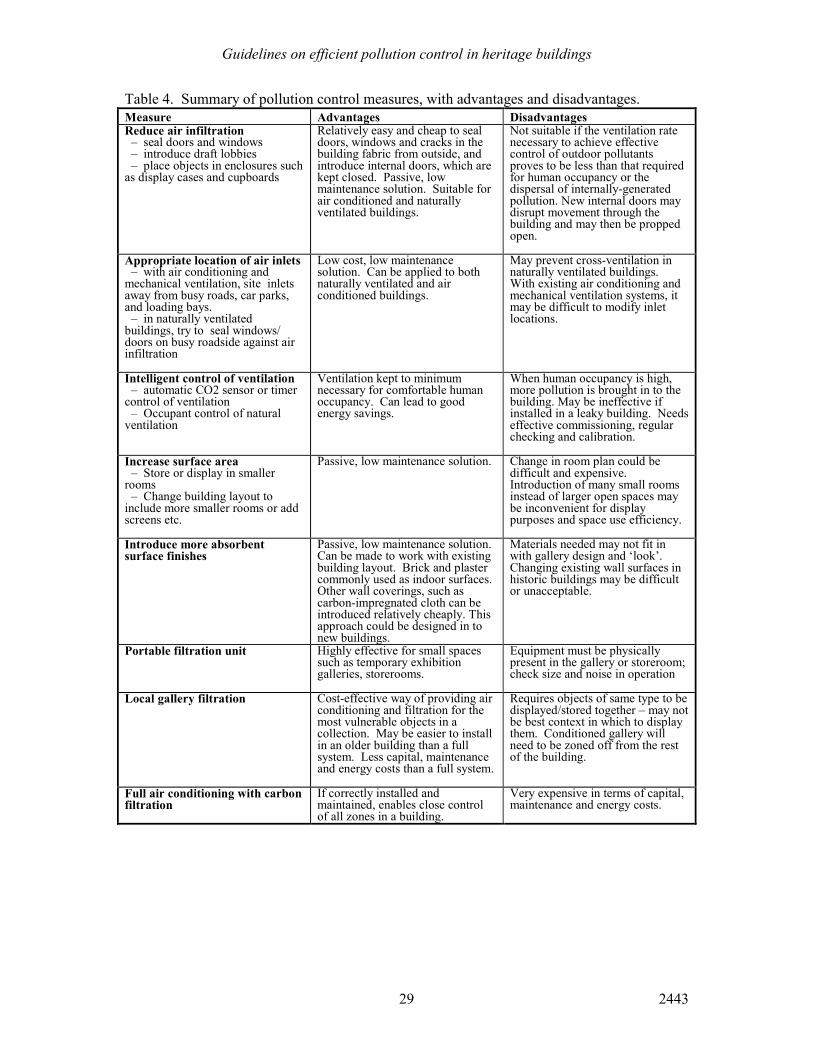
Table 4 summarises the various measures which can be adopted for control of gaseous
pollution. The list is not exhaustive, for example it does not specifically include normal good
practice items for building professionals (e.g. air extraction at source from polluting
activities); or predominantly curatorial activities like the control of pollutants generated inside
display cases. This issue is outside the scope of this document and the reader should consult
references [8, 26-31] for further information. The measures are presented, in ascending order
of the level of control, complexity and expense. In practice, measures are often combined, so
we illustrate their application by using case studies of different strategies, again in ascending
order of complexity and cost.
When choosing a solution it is important to consult with all those it is likely to affect. This
may include curators, conservators, archivists, building service engineers and architects.
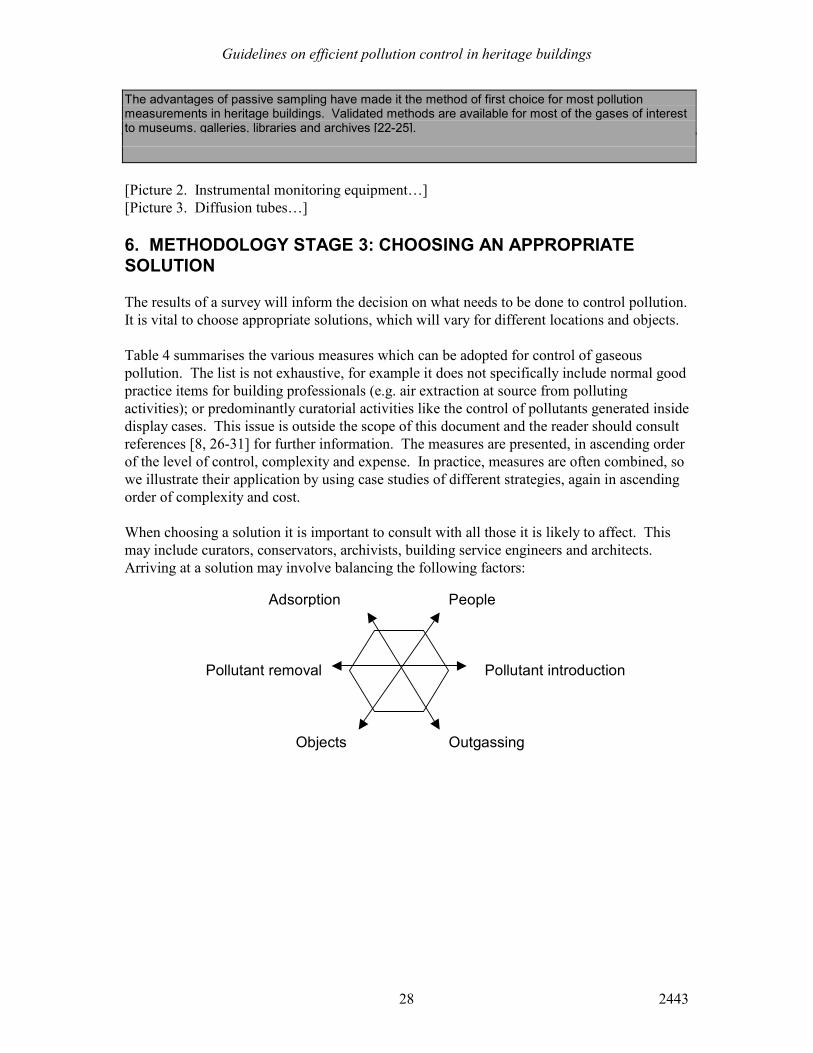
Arriving at a solution may involve balancing the following factors:
People Adsorption
Pollutant removal Pollutant introduction
Objects Outgassing
Guidelines on efficient pollution control in heritage buildings
2443 29
Table 4. Summary of pollution control measures, with advantages and disadvantages.
Measure Advantages Disadvantages Reduce air infiltration – seal doors and windows – introduce draft lobbies – place objects in enclosures such as display cases and cupboards
Relatively easy and cheap to seal doors, windows and cracks in the building fabric from outside, and introduce internal doors, which are kept closed. Passive, low maintenance solution. Suitable for air conditioned and naturally ventilated buildings.
Not suitable if the ventilation rate necessary to achieve effective control of outdoor pollutants proves to be less than that required for human occupancy or the dispersal of internally-generated pollution. New internal doors may disrupt movement through the building and may then be propped open.
Appropriate location of air inlets – with air conditioning and mechanical ventilation, site inlets away from busy roads, car parks, and loading bays. – in naturally ventilated buildings, try to seal windows/ doors on busy roadside against air infiltration
Low cost, low maintenance solution. Can be applied to both naturally ventilated and air conditioned buildings.
May prevent cross-ventilation in naturally ventilated buildings. With existing air conditioning and mechanical ventilation systems, it may be difficult to modify inlet locations.
Intelligent control of ventilation – automatic CO2 sensor or timer control of ventilation – Occupant control of natural ventilation
Ventilation kept to minimum necessary for comfortable human occupancy. Can lead to good energy savings.
When human occupancy is high, more pollution is brought in to the building. May be ineffective if installed in a leaky building. Needs effective commissioning, regular checking and calibration.
Increase surface area – Store or display in smaller rooms – Change building layout to include more smaller rooms or add screens etc.
Passive, low maintenance solution. Change in room plan could be difficult and expensive. Introduction of many small rooms instead of larger open spaces may be inconvenient for display purposes and space use efficiency.
Introduce more absorbent surface finishes
Passive, low maintenance solution. Can be made to work with existing building layout. Brick and plaster commonly used as indoor surfaces. Other wall coverings, such as carbon-impregnated cloth can be introduced relatively cheaply. This approach could be designed in to new buildings.
Materials needed may not fit in with gallery design and ‘look’. Changing existing wall surfaces in historic buildings may be difficult or unacceptable.
Portable filtration unit Highly effective for small spaces such as temporary exhibition galleries, storerooms.
Equipment must be physically present in the gallery or storeroom; check size and noise in operation
Local gallery filtration Cost-effective way of providing air conditioning and filtration for the most vulnerable objects in a collection. May be easier to install in an older building than a full system. Less capital, maintenance and energy costs than a full system.
Requires objects of same type to be displayed/stored together – may not be best context in which to display them. Conditioned gallery will need to be zoned off from the rest of the building.
Full air conditioning with carbon filtration
If correctly installed and maintained, enables close control of all zones in a building.
Very expensive in terms of capital, maintenance and energy costs.
Guidelines on efficient pollution control in heritage buildings
2443 30
6.1 STRATEGY 1 PASSIVE POLLUTION CONTROL AND NATURAL
VENTILATION
The natural process of deposition onto surfaces (see Section 4.3) can be utilised to reduce
pollutant concentrations inside rooms and whole buildings. Under ideal conditions, the
resulting levels can be comparable to those with full air conditioning and carbon filtration.
As discussed in section 4.3, the following measures will enhance passive pollution control.
1. Additional surface area can be introduced.
2. The reactivity of existing surfaces could be increased using different decorative
finishes. In principle, adsorbent surfaces could also be used to control internally
generated pollutants such as carbonyls and hydrogen sulphide. However, these gases
are not as reactive as the externally generated pollutants, and would need specific
materials to trap them, e.g. activated carbon for carbonyl compounds and zinc oxide,
for hydrogen sulphide.
3. There may be scope to reduce the ventilation rate by sealing holes, cracks, windows
and doors; and fitting external lobby doors and extra interior doors. The limiting
factor with this approach is the provision of sufficient fresh air for the comfort of the
building occupants. In storerooms and archives with little or no occupancy,
ventilation can be at a very low level, provided moisture and indoor pollution are still
controlled. However, this would not be possible in a well-visited gallery during the
occupied period.
4. Putting objects in display cases will greatly reduce the amount of outdoor pollution
that reaches them, but may increase their exposure to damaging internally generated
pollutants, such as the carbonyls.
Box 6. Case Study 1: Passive pollution control at the Horniman Museum The Horniman’s Study Collections Centre is a converted Victorian School in part of South-East London with considerable industrial and traffic pollution. The building has a cellular room layout with many interior doors. The internal surfaces are mostly wood and painted brick and plaster. The store rooms were quite densely packed with objects in cardboard boxes, plastic bags or covered in sheeting. In the study, the outside air ventilation rate was substantially reduced by sealing windows with mastic and fitting lobbies to all exterior doors. This gave it close to optimal characteristics for pollution control by passive deposition: low occupancy, low ventilation rate, high surface:volume ratio, and relatively highly adsorbent surfaces. Pollution measurements in winter and summer revealed very low nitrogen dioxide concentrations in the storerooms, with sulphur dioxide below the detection limit. The rooms at the core of the building had the lowest pollution concentrations because the air getting into them had followed a tortuous path from the outside, with much opportunity for pollutant deposition. Figure 3 confirms the progressive decrease in nitrogen dioxide concentration, going from the exterior environment to the entrance lobby, interior corridor and storeroom. Concentrations of nitrogen dioxide, sulphur dioxide and ozone in the storerooms were as low as those achieved in the air conditioned fully-filtered museums, demonstrating the how effective passive measures can be, particularly in stores and archives with small rooms and low ventilation rates. NOTE: the ventilation rate in these stores averaged 0.3-0.4 air changes per hour. This is satisfactory for domestic levels of occupancy, but not of course for situations in which there are large numbers of staff or visitors [32].
Guidelines on efficient pollution control in heritage buildings
2443 31
[Picture 4. Horniman Museum Study Collections Centre, taken from the roadside]
[Picture 5. Exterior door lobbies]
Box 7. Case Study 2: Passive pollution control at the Manchester Museum Mummy Store The Mummy Store is a ground-floor room in a late 19
th century university building. The interior
surfaces are a mixture of painted brick and plaster, metal and linoleum. Inside the store an recirculatory air conditioning unit maintains close control over temperature and relative humidity; but has no fresh air supply and no pollution filtration, either gaseous or particulate. Natural ventilation was the only way in which outside air could enter the store. In the study, all the windows were sealed up. So was the entrance door, which leads to a corridor and almost immediately to outside. Good pollution control by passive means was evident (see figure 4), with a measured concentration of nitrogen dioxide in winter and summer of about 1 ppb, compared with an outdoor concentration of around 20 ppb. The air exchange rate was 0.2 ach, a very low value achieved only by an excellent level of sealing.
[Picture 6. Manchester Museum]
BOX 8. POTENTIAL UK SAVINGS POTENTIAL ADOPTING PASSIVE POLLUTION CONTROL MEASURES WHERE APPROPRIATE Energy consumption by UK museums costs about £140 million per year and is responsible for producing about 1.7 million tonnes of CO2 [33]. 43% of these museums have some mechanical form of environmental control (including air conditioning) and consume, on average, twice as much energy as comparable naturally-ventilated museums. Air conditioning itself accounts for 12% of UK museums’ total energy consumption, costing about £17 million per year. Say one-fifth of these museums have air conditioning installed principally to control air pollution, a change to passive methods of control could save £3.4 million in energy costs and cut CO2 emissions by 41,000 tonnes per year. The savings in libraries and archives are comparable. There is particular scope for savings in new-build or refurbishment projects, in which air conditioning is often specified because it is thought by designers or their clients to be the only means of providing satisfactory protection from air pollution.
6.2 STRATEGY 2. PORTABLE OR TEMPORARY FILTRATION UNITS
Portable filtration can produce as clean an environment as permanently installed equipment,
provided the space to be controlled is not too large or too leaky. Such units are useful for
temporary exhibitions, for instance to meet the conditions demanded for loan of material.
The equipment must be physically present in the gallery or storeroom, although it can be
made quite small and quiet in operation. They can also help to ‘mop up’ pollutants from
newly refurbished spaces or newly installed display cases.
Box 9. Case Study 3: A Portable Filtration Unit at the Horniman Museum, London The fumigation room in the Horniman Museum Study Collections Centre has a leaky metal roller-shutter door to enable large objects to be brought in. This room was the most polluted in the building, with significant concentrations of nitrogen dioxide and some sulphur dioxide. A portable recirculatory carbon filter unit, manufactured by Emcel Filters Ltd was installed and the pollution levels monitored over several weeks, with the unit operating at different filtration flow rates. The unit was highly effective at reducing all the main pollutants down to low concentration, or below detection limit (<DL). Figure 5 shows the nitrogen dioxide concentrations in the Storeroom before and after the filter was installed. The vertical axis shows internal concentration compared to average external concentration (I/O ratio).
[Picture 7. Portable filtration unit…]
Guidelines on efficient pollution control in heritage buildings
2443 32
6.3 STRATEGY 3. LOCAL GALLERY FILTRATION
A cost-effective pollution control solution is to group all vulnerable objects together in one or
more galleries with local recirculatory filtration or air conditioning. This has the obvious
advantage of requiring smaller plant with lower capital, maintenance and energy costs. This
solution is often adopted in older buildings, where it is difficult to install extensive plant and
ductwork without causing expensive and unacceptable disruption to the building fabric.
The main disadvantage is the constraint on the display of a collection. Objects of similar
material (e.g. tapestries or watercolours) have to be located together, while it may be more
meaningful to display them in other contexts. Care should also be taken to ensure that
vulnerable objects stored or displayed together do not damage one another, for instance by the
spread of insect pests. Close-fitting closed doors to contain pollution-controlled galleries may
also interrupt freedom of movement through a building; but if propped open the benefits will
be undermined.
Box 10. Case Study 4: Victoria & Albert Museum, London Gallery 94 (the Devonshire Hunting Room) is fully air conditioned with filtration for both particles and gaseous pollutants. The plant is mounted on the roof, with only a short run of ductwork to the room below. The gallery is sealed off from the rest of the naturally ventilated museum by pairs of doors at the three entry points. Pollution measurements in summer and winter (figure 6) showed a similar pattern to the fully air conditioned Museum of London (see case study 6), with sulphur dioxide undetected and nitrogen dioxide at a very low level. The efficacy of filtration was tested by removing the carbon filters. Nitrogen dioxide then approached the very high outdoor levels; and were slightly above those in the adjacent naturally ventilated gallery, in which a lower air change rate provided more opportunity for pollutant removal by deposition. Sulphur dioxide was also detected: this was not found in the Museum of London, even with the filters removed. This was probably because the short run of duct work here did not provide as much opportunity for removal by deposition as the much longer ducts at the Museum of London.
[Picture 8. V&A Exterior]
[Picture 9. V&A Gallery 94]
Box 11. Case Study 5: Theatre Museum, Covent Garden, London The Theatre Museum is air conditioned with four separate systems, each serving different zones. The Picture Gallery zone has particle but not gaseous filtration; the other three zones have both. Figure 6 shows high nitrogen dioxide concentrations in the unfiltered Picture Gallery, similar to those at the V&A Gallery 94 when the filters were removed. The connecting corridor from the Picture Gallery to the other zones, including the Archive Store had separating glass doors that were normally left open for ease of access. The nitrogen dioxide concentrations measured in the Archive Store were much higher than normal for a filtered zone, due to the entry of unfiltered air via the corridor from the Picture Gallery. Consequently the purpose of having carbon filtration in this, and the other zones was being undermined. This highlights the need, not only to install appropriate control measures but to ensure that they are correctly managed, operated and maintained by staff.
Guidelines on efficient pollution control in heritage buildings
2443 33
6.4 STRATEGY 4. INTELLIGENT CONTROL OF VENTILATION
Selecting the appropriate rate of outside air ventilation is a balance between:
• increasing the rate to disperse internally generated pollutants (and heat in naturally
ventilated buildings); and
• reducing the rate to prevent introducing too much polluted air into the building.
There is also a need to avoid unnecessary ventilation in order to minimise a building’s fuel
and maintenance bills.
In most buildings the minimum ventilation rate is set to disperse the odour and moisture
generated by the building occupants (CIBSE recommend 8 litres of outside air per second per
person [32]). Most heritage buildings have a highly variable occupancy rate and so it is
efficient to vary the ventilation rate appropriately.
In naturally ventilated buildings this is often achieved by air infiltration plus manual control
of windows and doors. In mechanically ventilated buildings with regular occupancy, a simple
time switch may be appropriate, turning the mechanical ventilation on when the building is
occupied. In galleries with highly variable occupancy (i.e. only a few visitors during opening
hours, but larger numbers such as school parties at unpredictable times) – or where the
ventilation needs to recirculate constantly in order to maintain temperature, humidity and air
quality conditions - a more sophisticated system using carbon dioxide sensors and variable
speed fans may be appropriate. If this approach is adopted, care should be taken to ensure that
it does not lead to large fluctuations in temperature and relative humidity. Note, carbon
dioxide sensors typically cost about £600 and require regular calibration, so they are most
appropriate for the larger systems and spaces.
Humans breathe out carbon dioxide (CO2) and are the main source of added CO2 in most
heritage buildings. Therefore, the concentration of CO2 is a measure of the ventilation rate
required per person. At steady state, a concentration of 1000 ppm is equivalent to
approximately 8 l/s/person; but in intermittently-occupied buildings of large volumes, peaks
and troughs will level out, making it often necessary to supply this amount of air
instantaneously. A CO2 sensor can be used to avoid over-ventilation. In terms of pollution
control this means that the amount of outside air - and hence external pollution bought in -
can be reduced at times of low occupancy, and taken down to a minimal level when the
building is closed. This can result in only one third of the polluted outside air being bought
into the building.
6.5 STRATEGY 5. FULL AIR-CONDITIONING WITH CARBON FILTRATION
This - the most costly method of pollution control - was once thought to be the ideal solution
for museum climate control. However, current conservation thinking has moved away from
recommending tight control of relative humidity and temperature in rooms - at least for
museums and galleries - as conditions can often be kept within acceptable limits by natural
ventilation.
Box 12
Guidelines on efficient pollution control in heritage buildings
2443 34
BS5454 Recommendations for the storage and exhibition of archival documents [34] specifies tight control of relative humidity and temperature. However, there is evidence that even the requirements of BS5454 can sometimes be met using passive natural ventilation techniques, as at the York Minster Library Archives (refurbished 1998) and the newly built Jersey Archive Store (opened 2000, see Twinn [35] for an explanation of the building design). If acceptable environmental control can be achieved with natural ventilation, then it is possible that pollutants too can be controlled using passive techniques, as outlined above.
With full air conditioning, all display (and possibly some storage areas) are provided with
conditioned and filtered air from one or more central plants. Note that most fully air
conditioned buildings do not have carbon filtration, but are designed primarily to provide
comfort cooling. Carbon filtration is a feature of systems designed for specialist applications,
of which museums, galleries and archives are one example. Therefore do not assume that
because your building has air conditioning it is necessarily carbon filtered.
Full air conditioning is best designed at the same time as the building, and is most common in
museums built or refurbished in the last 30 years. Inserting a full system in older buildings
can be problematic owing to space requirements for plant and ductwork and the impact it has
on a historic fabric. The average energy cost of an air-conditioned museum is twice that of a
naturally ventilated one per unit of floor area. Maintenance costs can also be high. Over its
lifetime the energy and maintenance costs of an air conditioning system far exceed its capital
costs [33].
A typical fully-filtered installation has several banks of filters, to remove both particulate and
gaseous pollution. First there are coarse particle filters, then secondary particle filters which
remove finer material (and protect any carbon filters from particle clogging). Thirdly, carbon
filters to remove gaseous pollution (some older setups may instead use an alkaline wash to
clean the air). The carbon is often treated with a metal impregnation, such as copper or
manganese to catalyse the chemical breakdown of the trapped pollutants. This prevents the
re-emission of trapped gases which could otherwise occur from a saturated filter.
In urban areas, particle filters may need renewing three or four times a year. Carbon filters
usually last much longer, typically for four years in urban areas and more elsewhere.
Towards the end of their life they become progressively less effective rather than fail
suddenly. The cost of replacing carbon filters serving a central plant supplying an entire
museum could be £6–10 per m2 of treated gallery floor area (2000 prices).
The lifetime of carbon filters depends on the amount of pollution they are required to remove.
One way of extending filter life is to minimise the fresh air ventilation rate by using a high
proportion of recirculated air. This reduces the amount of highly polluted air that is brought
in from outside and hence the amount of pollution the filters have to remove, because
recirculated air has already been filtered. Recirculating air can also minimise the energy costs
of conditioning the air. Of course, sufficient fresh air must be introduced for the comfort of
the occupants, but this can be ensured by the use of carbon dioxide sensors (see Section 6.4).
For gaseous filtration to be effective it is important to ensure that all the air coming into the
building passes through the carbon filters. Air leaks around the filters and infiltration through
the building fabric itself will undermine the effectiveness of gaseous filtration. Although
infiltration can be partially remedied by positive pressurisation, this can make it difficult to
open doors in galleries.
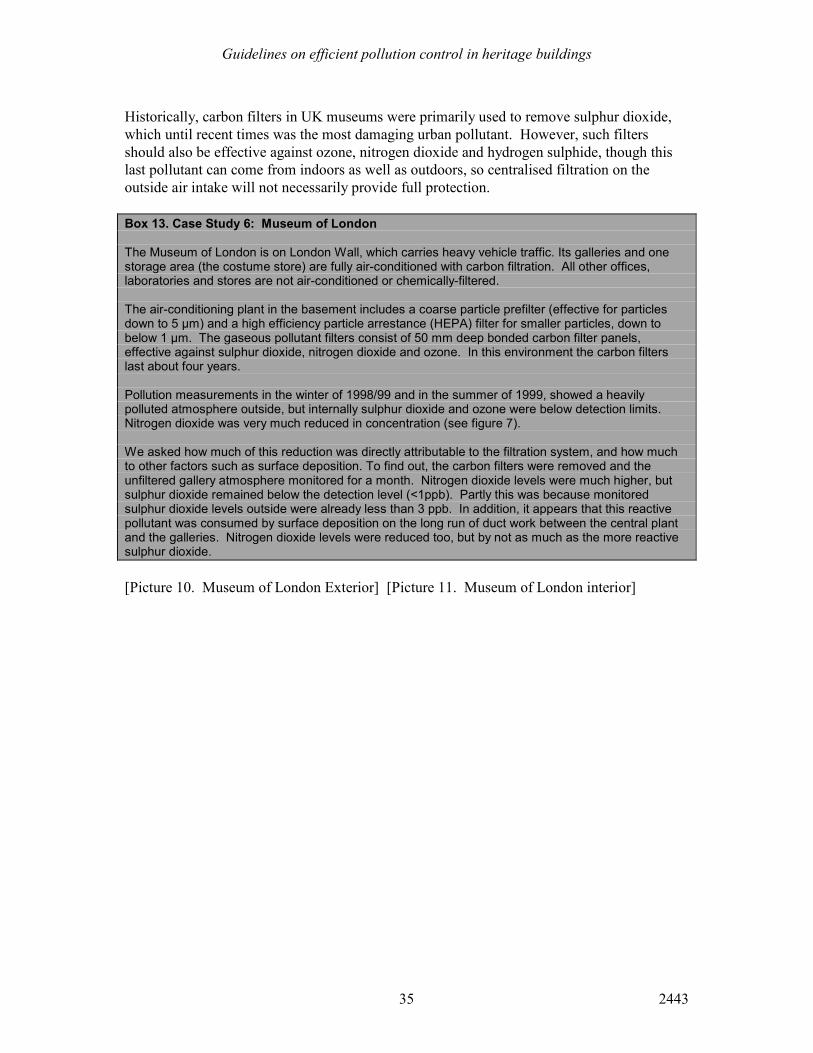
Guidelines on efficient pollution control in heritage buildings
2443 35
Historically, carbon filters in UK museums were primarily used to remove sulphur dioxide,
which until recent times was the most damaging urban pollutant. However, such filters
should also be effective against ozone, nitrogen dioxide and hydrogen sulphide, though this
last pollutant can come from indoors as well as outdoors, so centralised filtration on the
outside air intake will not necessarily provide full protection.
Box 13. Case Study 6: Museum of London The Museum of London is on London Wall, which carries heavy vehicle traffic. Its galleries and one storage area (the costume store) are fully air-conditioned with carbon filtration. All other offices, laboratories and stores are not air-conditioned or chemically-filtered. The air-conditioning plant in the basement includes a coarse particle prefilter (effective for particles down to 5 µm) and a high efficiency particle arrestance (HEPA) filter for smaller particles, down to below 1 µm. The gaseous pollutant filters consist of 50 mm deep bonded carbon filter panels, effective against sulphur dioxide, nitrogen dioxide and ozone. In this environment the carbon filters last about four years. Pollution measurements in the winter of 1998/99 and in the summer of 1999, showed a heavily polluted atmosphere outside, but internally sulphur dioxide and ozone were below detection limits. Nitrogen dioxide was very much reduced in concentration (see figure 7). We asked how much of this reduction was directly attributable to the filtration system, and how much to other factors such as surface deposition. To find out, the carbon filters were removed and the unfiltered gallery atmosphere monitored for a month. Nitrogen dioxide levels were much higher, but sulphur dioxide remained below the detection level (<1ppb). Partly this was because monitored sulphur dioxide levels outside were already less than 3 ppb. In addition, it appears that this reactive pollutant was consumed by surface deposition on the long run of duct work between the central plant and the galleries. Nitrogen dioxide levels were reduced too, but by not as much as the more reactive sulphur dioxide.
[Picture 10. Museum of London Exterior] [Picture 11. Museum of London interior]
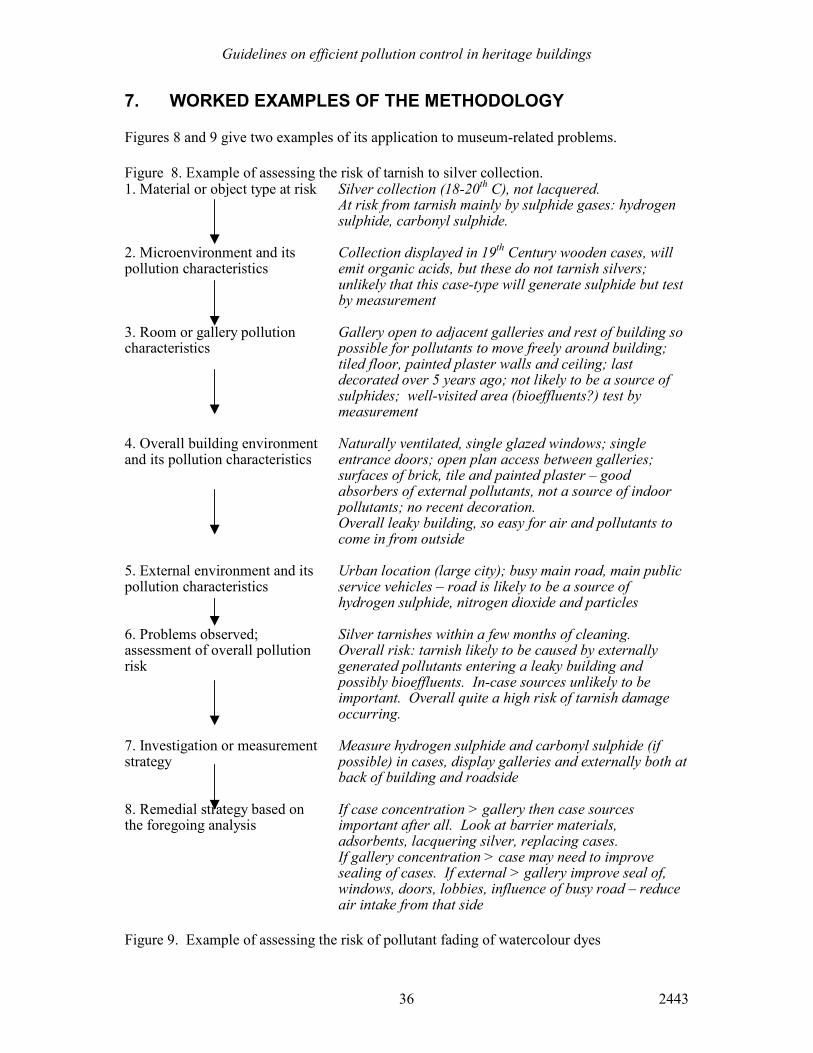
Guidelines on efficient pollution control in heritage buildings
2443 36
7. WORKED EXAMPLES OF THE METHODOLOGY
Figures 8 and 9 give two examples of its application to museum-related problems.
Figure 8. Example of assessing the risk of tarnish to silver collection. 1. Material or object type at risk
Silver collection (18-20th C), not lacquered.
At risk from tarnish mainly by sulphide gases: hydrogen sulphide, carbonyl sulphide.
2. Microenvironment and its pollution characteristics
Collection displayed in 19th Century wooden cases, will
emit organic acids, but these do not tarnish silvers; unlikely that this case-type will generate sulphide but test by measurement
3. Room or gallery pollution characteristics
Gallery open to adjacent galleries and rest of building so possible for pollutants to move freely around building; tiled floor, painted plaster walls and ceiling; last decorated over 5 years ago; not likely to be a source of sulphides; well-visited area (bioeffluents?) test by measurement
4. Overall building environment and its pollution characteristics
Naturally ventilated, single glazed windows; single entrance doors; open plan access between galleries; surfaces of brick, tile and painted plaster – good absorbers of external pollutants, not a source of indoor pollutants; no recent decoration. Overall leaky building, so easy for air and pollutants to come in from outside
5. External environment and its pollution characteristics
Urban location (large city); busy main road, main public service vehicles – road is likely to be a source of hydrogen sulphide, nitrogen dioxide and particles
6. Problems observed; assessment of overall pollution risk
Silver tarnishes within a few months of cleaning. Overall risk: tarnish likely to be caused by externally generated pollutants entering a leaky building and possibly bioeffluents. In-case sources unlikely to be important. Overall quite a high risk of tarnish damage occurring.
7. Investigation or measurement strategy
Measure hydrogen sulphide and carbonyl sulphide (if possible) in cases, display galleries and externally both at back of building and roadside
8. Remedial strategy based on the foregoing analysis
If case concentration > gallery then case sources important after all. Look at barrier materials, adsorbents, lacquering silver, replacing cases. If gallery concentration > case may need to improve sealing of cases. If external > gallery improve seal of, windows, doors, lobbies, influence of busy road – reduce air intake from that side
Figure 9. Example of assessing the risk of pollutant fading of watercolour dyes
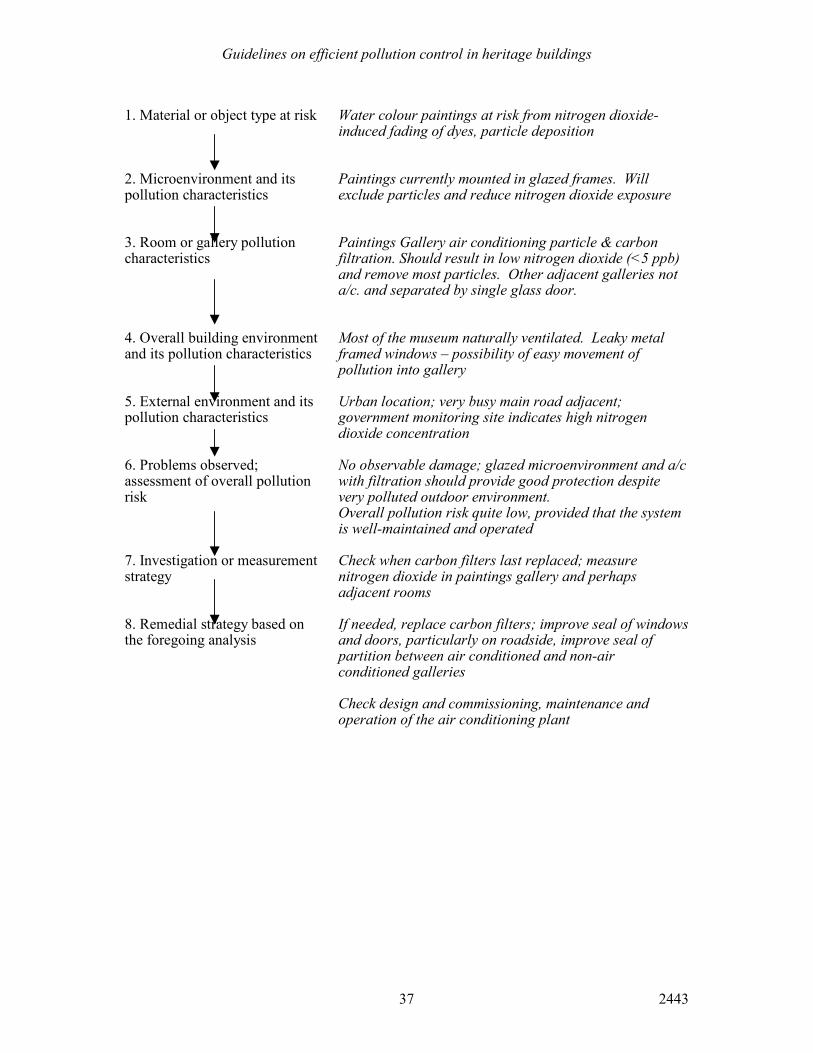
Guidelines on efficient pollution control in heritage buildings
2443 37
1. Material or object type at risk
Water colour paintings at risk from nitrogen dioxide-induced fading of dyes, particle deposition
2. Microenvironment and its pollution characteristics
Paintings currently mounted in glazed frames. Will exclude particles and reduce nitrogen dioxide exposure
3. Room or gallery pollution characteristics
Paintings Gallery air conditioning particle & carbon filtration. Should result in low nitrogen dioxide (<5 ppb) and remove most particles. Other adjacent galleries not a/c. and separated by single glass door.
4. Overall building environment and its pollution characteristics
Most of the museum naturally ventilated. Leaky metal framed windows – possibility of easy movement of pollution into gallery
5. External environment and its pollution characteristics
Urban location; very busy main road adjacent; government monitoring site indicates high nitrogen dioxide concentration
6. Problems observed; assessment of overall pollution risk
No observable damage; glazed microenvironment and a/c with filtration should provide good protection despite very polluted outdoor environment. Overall pollution risk quite low, provided that the system is well-maintained and operated
7. Investigation or measurement strategy
Check when carbon filters last replaced; measure nitrogen dioxide in paintings gallery and perhaps adjacent rooms
8. Remedial strategy based on the foregoing analysis
If needed, replace carbon filters; improve seal of windows and doors, particularly on roadside, improve seal of partition between air conditioned and non-air conditioned galleries Check design and commissioning, maintenance and operation of the air conditioning plant
Guidelines on efficient pollution control in heritage buildings
2443 38
8. CHECKLIST
In summary, by proceeding methodically a rational solution to the problem of pollution can
be arrived at:
� Think specifically about the pollution threat to a collection.
� What pollutants interact with what materials?
� How well is the collection protected by its current environment?
� Effect of showcases, cupboards, building layout, building services?
� Will objects themselves emit pollutants that damage other objects?
� From an evaluation of the above, what risk is pollution likely to represent?
� If it is likely that there is a significant risk:
� Obtain pollution data –outdoor data from monitoring networks
� Make or commission pollution measurements (choose appropriate consultant)
� Consult with curators, conservators, archivists, building service engineers and architects
� Select an appropriate solution
� Consider less complicated and less expensive solutions first
� Do not attempt solutions which you will not be able to maintain in the long term
9. REFERENCES
[1] Brimblecombe, P. (1990) The composition of museum atmospheres. Atmospheric
Environment 24B (1): 1-8.
[2] Baer, N. S. and Banks, P. N. (1985) Indoor air pollution: Effects on cultural and historical
materials. The International Journal of Museum Management and Curatorship 4: 9-20.
[3] Colls, J. (1997) Air Pollution - An Introduction, 1st ed. E&FN Spon, London.
[4] Larsen, R (ed) (1996) Deterioration and Conservation of Vegetable Tanned Leather,
Protection and conservation of European cultural heritage, Research Report No 6.
[5] UK National Air Quality Information Archive:
http://www.aeat.co.uk/netcen/airqual/index.html.
[6] Energy Efficient Pollution Control in Museums and Galleries Milestone 6. Closing
Report. Department of the Environment, Transport and the Regions Partners in Technology
Research Project 39/3/471, Contract Code cc1717. Unpublished, but available from the
Bartlett School of Graduate Studies.
[7] Grzywacz, C. M. and Tennent, N. H. (1994) Pollution monitoring in storage and display
cabinets: carbonyl pollution in relation to artefact deterioration. In IIC Preprints of the
Contributions to the Ottawa Congress, 12-16 September 1994, Preventive Conservation
Practice, Theory and Research. Edited by Roy, A. and Smith, P. pp. 164-170. IIC, London.
Guidelines on efficient pollution control in heritage buildings
2443 39
[8] Watts, S. F. (1999) Hydrogen sulphide levels in museums: what do they mean? Indoor Air
Pollution: Detection and Prevention, Amsterdam 26-27 August 1999, Edited by Brokerhof,
AW and Gibson, LT. Available at: http://hjem.get2net.dk/ryhl/iap1999/1999_contents.htm.
[9] National Bureau of Standards (1983) Air quality criteria for storage of paper-based
archival records, NBSIR 83-2795, National Bureau of Standards, Washington DC.
[10] Thomson, G. (1986) The Museum Environment, 2nd ed. Butterworths, London.
[11] Fenn, J. (1995) Secret sabotage: reassessing the role of museum plastics display and
storage. In: Resins Ancient and Modern. Preprints of the SSCR's 2nd Resins Conference
held at the Department of Zoology, University of Aberdeen 13-14 September 1995. Edited by
Wright, M. M. and Townsend, J. H. pp. 38-41. Scottish Society for Conservation and
Restoration, Edinburgh.
[12] Weschler CJ, Shields HC and Naik DV (1989) Indoor ozone exposures, Journal of the Air
Pollution Control Association, 39, 1562-1568.
[13] Judeikis, HS and Stewart TB (1976) Laboratory measurement of sulphur dioxide
deposition velocities on selected building materials and soils, Atmospheric Environment, 10,
769-776.
[14] Payrissat M and Beilke S (1975) Laboratory measurements of the uptake of sulphur
dioxide by different European soils, Atmospheric Environment, 9, 211-217.
[15] Spedding DJ and Rowlands RP (1970) Sorption of sulphur dioxide by indoor surfaces - I.
Wallpapers, Journal of Applied Chemistry, 20, 143-146.
[16] Walsh, M., Black, A., Morgan, A. and Crenshaw, G. H. (1977) Sorption of SO2 by
typical indoor surfaces including wool carpets, wallpaper and paints. Atmospheric
Environment 11, 1107-1111.
[17] Graedel, T. E. (1992) Corrosion mechanisms for silver exposed to the atmosphere.
Journal of the Electrochemical Society 139 (7): 1963-1970.
[18] Sabersky RH, Sinema DA and Shair FH (1973) Concentrations, decay rates, and removal
of ozone and their relation to establishing clean indoor air, Environmental Science and
Technology, 7 (4), 347-353.
[19] Nazaroff WW and Cass GR (1986) Mathematical modelling of chemically reactive
pollutants in indoor air, Environmental Science and Technology, 20 (9), 924-934.
[20] Liddament MW (1996) A Guide to Energy Efficient Ventilation, Coventry: The Air
Infiltration and Ventilation Centre.
[21] Ashley-Smith, J. (1999) Risk assessment for object conservation, 1st ed. Butterworth-
Heinemann, Oxford.
Guidelines on efficient pollution control in heritage buildings
2443 40
[22] Shooter D (1993) Nitrogen dioxide and its determination in the atmosphere, Journal of
Chemical Education, 70 (5), A133-A140.
[23] Hargreaves KJ, Atkins DHF and Bennett SL (1991) The measurement of sulphur dioxide in
the outdoor environment using passive diffusion tube samplers: a first report, AERE R12569.
[24] Shooter D, Watts SF and Hayes AJ (1995) A passive sampler for hydrogen sulphide,
Environmental Monitoring and Assessment, 38, 11-23.
[25] Gibson LT, Cooksey BG, Littlejohn D and Tennent NH (1997) A diffusion tube sampler
for the determination of acetic acid and formic acid vapours in museum cabinets, Analytica
Chimica Acta, 34, 11-19.
[26] Eremin, K. and Wilthew, P. (1996) The effectiveness of barrier materials in reducing
emissions of organic gases from fibreboard: results of preliminary tests. In: ICOM Committee
for Conservation 11th Triennial Meeting Edinburgh, Scotland, 1-6 September 1996, Vol. 1.
Edited by Bridgland, J. pp. 27-35. James & James, London.
[27] Grzywacz, C and Tennent, N (1997) The threat of organic carbonyl pollutants to
museum collections. In: European Cultural Heritage Newsletter on Research, vol. 10, June.
European Commission, Brussels, pp. 98-104.
[28] Tétrault, J. (1994) Display materials: the good, the bad and the ugly. In: Exhibition and
Conservation - Preprints of the conference held at the Royal College of Physicians. Edited by
Sarge, J. pp. 79-87. Scottish Society for Conservation Research, Edinburgh.
[29] Thickett, D., Bradley, S. and Lee, L. (1998) Assessment of risks to metal artefacts posed
by volatile carbonyl pollutants. In: Postprints of Metal '98, ICOM, 26-29 May 1998.
[30] Thickett, D (1998) Sealing of MDF to prevent corrosive emissions. The Conservator,
22, 49-56.
[31] Ganiaris, H and Sully, D (1998) Showcase construction: materials and methods used at
the Museum of London. The Conservator, 22, 57-67.
[32] CIBSE (1999) Guide A: Environmental Design. Chartered Institution of Building
Services Engineers, London.
[33] Oreszczyn, T., Mullany, T. and Ni Riain, C. (1994) A survey of energy use in museums
and galleries. In Museums Environment Energy, 1st ed. Edited by Cassar, M. p. 130. HMSO,
London.
[34] BS5454:2000 Recommendations for the storage and exhibition of archival documents.
British Standards Institution, London.
[35] Twinn, C. D. A. (1997) Passive control of relative humidity to ± 5%. In: CIBSE
National Conference Alexandra Palace, London, 5-7- October 1997, Vol. 2. pp. 77-89.
Chartered Institution of Building Services Engineers, London.
Guidelines on efficient pollution control in heritage buildings
2443 41
10. SOURCES OF FURTHER INFORMATION
Other Publications:
Appelbaum, B. (1991) Guide to environmental protection of collections, 1st ed. Sound View
Press, Connecticut.
1999 ASHRAE Handbook (1999) Heating, Ventilating and Air Conditioning Applications.
Chapter 20 “Museums, Libraries and Archives” and Chapter 44 “Control of gaseous indoor
air contaminants”. American Society of Heating, Refrigerating and Air Conditioning
Engineers, Atlanta.
Brimblecombe, P. (1986) Air Composition and Chemistry, 1st ed. Cambridge University
Press, Cambridge.
BSRIA (1998) Ventilation control and traffic pollution, Technical Note TN 5/98. The
Building Services Research and Information Association, Bracknell.
CIBSE (1999) Minimising pollution at air intakes. CIBSE Technical Memoranda
TM21:1999. Chartered Institution of Building Services Engineers, London.
CIBSE (2000) Guide to ownership, operation and maintenance of building services,
Chartered Institution of Building Services Engineers, London.
CIBSE (2000) Testing buildings for air leakage, Technical Memorandum No 23, Chartered
Institution of Building Services Engineers, London.
CIBSE (2000) Ductwork management, Technical Memorandum No 26, Chartered Institution
of Building Services Engineers, London.
Lull, W. P. and Banks, P. N. (1995) Conservation environment guidelines for libraries and
archives, 1st ed. Canadian Council of Archives, Ottawa.
Nazaroff, W. W., Ligocki, M. P., Salmon, L. G., Cass, G. R., Fall, T., Jones, M. C., Liu, H. I.
H. and Ma, T. (1993) Airborne Particles in Museums, Research in Conservation 6. Getty
Conservation Institute, Los Angeles.
Pike, P. (1997) Application Guide AG 8/97 Air Filters. Building Services Research and
Information Association, Bracknell.
Organisations
The UK National Museums and Galleries, English Heritage and the National Trust have
specialists who can advise on pollution related issues.
Some UK-based pollution consultants with experience in the cultural heritage field:
Guidelines on efficient pollution control in heritage buildings
2443 42
AEA Technology Environment, Culham, Abingdon, Oxfordshire OX14 3DB. Tel 01235
463391, fax 01235 463050, email [email protected].
Dr Nigel Blades/Prof Tadj Oreszczyn, The Bartlett Graduate School, University College
London, Gower Street, London WC1E 6BT. Tel 020 7679 5965/5906, fax 020 7916 3892,
email [email protected] or [email protected].
Dr Lorraine Gibson, Department of Pure and Applied Chemistry, University of Strathclyde,
Glasgow G1 1XL. Tel 0141 548 2019, fax 0141 548 4822, email
Gradko International Ltd, St Martin’s House, 77 Wales Street, Winchester SO23 0RH. Tel
01962 860331, fax 01962 841339, email [email protected].
Dr Simon Watts, School of Biological and Molecular Sciences, Oxford Brookes University,
Headington, Oxford OX3 0BP. Tel 01865 483613, fax 01865 483242, email
Illustration Captions
Graphs
Figure 0. Effect of air exchange rate on indoor/outdoor nitrogen dioxide ratio for different
museum building configurations predicted using steady state model.
Figure 1. Central London sulphur dioxide and nitrogen dioxide trends
(source: UK National Air Quality Archive).
Figure 2. Central London Ozone Trends (source: UK National Air Quality Archive).
Figure 3. Winter and Summer Nitrogen Dioxide at the Horniman Museum Study Collections
Centre.
Figure 4. Winter and Summer Nitrogen Dioxide at The Manchester Museum.
Figure 5. Indoor/outdoor pollutant ratios in the Horniman Museum Study Collections Centre
fumigation room before and after installation of the portable filtration unit.
Figure 6. Nitrogen Dioxide Concentrations at the V&A Gallery 94 and
Theatre Museum Picture Gallery.
Figure 7. Nitrogen Dioxide Concentrations at the Museum of London.
Pictures:
(Numbers on yellow spots)
Guidelines on efficient pollution control in heritage buildings
2443 43
1. Ventilation measurement at the Manchester Museum Mummy Store. A Blower Door
consisting of a fan and an air-tight curtain is fixed in the doorway so that the room can be
pressurised and depressurised and its ventilation rate determined.
2. Instrumental monitoring equipment for sulphur dioxide and nitrogen oxides, deployed in a
museum store.
3. Diffusion tubes can be discretely deployed in museum interiors.
4. The Horniman Museum Study Collections Centre (building in the centre background with
white-painted sealed panels in place of windows).
5. At the Horniman Museum Study Collections Centre the exterior doors have been fitted
with lobbies to help exclude pollution.
6. The Manchester Museum is on a main road close to the centre of Manchester.
7. Portable filtration unit in the Horniman Museum Study Collections Centre Fumigation
Room.
8. The Victoria & Albert Museum is located on the busy Cromwell Road.
9. The Victoria & Albert Museum Gallery 94 (Devonshire Hunting Room)
10. The Museum of London
11. The Museum of London Medieval Gallery, showing the open-plan interior of the
Museum.
Picture Credits: Victoria & Albert Museum Picture Library, Museum of London Picture
Library.
Total text = 15,400 words approx.
Guidelines on efficient pollution control in heritage buildings
2443 44
Text for back page/cover
Cost: £15
Additional copies of these Guidelines are available from: The Secretary, Bartlett School of
Graduate Studies, (Torrington Place Site), University College London, Gower Street, London
WC1E 6BT, UK.
ISBN No.
© N. Blades, T. Oreszczyn, W. Bordass and M. Cassar. November 2000. Except for the
quotation of short passages for the purpose of criticism or review no part of this publication
may be reproduced, stored in a retrieval system, or transmitted in any form or by any means,
electronic, mechanical, photocopying, recording or otherwise without the prior permission of
the publisher.