Embed Size (px)
Citation preview
21 February 2020 H1FY20 INTERIM FINANCIAL RESULTS Infigen (ASX: IFN) today released its financial results for the half year ended 31 December 2019. Financial performance:
• Renewable Energy Generation sold of 1,071GWh, up 17% vs H1FY19 (‘pcp’).
• Net Revenue of $134.3m, up 13% on pcp.
• Contracted Revenue of $116.3m, up 23% on pcp.
• Underlying EBITDA of $98.2m, up 11% on pcp.
• NPAT of $26.2m, up 24% on pcp.
• H1FY20 distribution of 1 cent per security will be paid on 27 March 2020 to holders of record on 31 December 2019.
Strategic delivery:
• The addition of physical firming plant enabled Infigen to increase electricity contracting, providing higher levels of revenue reliability and continued improvement in quality of earnings.
• H1FY20 reflected the first full reporting period which included Infigen’s ownership of Smithfield OCGT. The asset performed in line with expectations, generating 15GWh, reflecting a 3% capacity factor. Fixed and variable operating costs are also performing in line with the guidance provided to the market at acquisition.
• In Q2FY20, Infigen’s SA Battery (25MW / 52MWh) made its first revenue contribution. To date, the asset has performed above expectations. During the islanding of the SA market in February 2020, additional battery revenues broadly offset the economic impact of the curtailed production at the Lake Bonney wind farms due to AEMO constraints.
• On 1 January 2020, Infigen’s electricity only Power Purchase Agreement over the 21MW Toora Wind Farm commenced. The diversification of Infigen’s renewable energy portfolio in Victoria supports additional Commercial and Industrial customer contracting, in line with Infigen’s Capital Lite growth strategy.
Sustainability performance:
• As advised at the AGM in November, in October 2019 Infigen recorded its first Lost Time Injury in 27 months. The operator has returned to work.
• In H1FY20 Infigen conducted an employee engagement pulse survey. It showed an Employee Net Promoter Score of +55, alongside Job Satisfaction of 83% and Current Motivation of 86%, with 92% participation rate in the survey.
• In line with Infigen’s target of achieving carbon neutrality by FY25, and leading Australia to a clean energy future, Infigen will be voluntarily abating 20% of its FY20 carbon emissions at an estimated cost of $0.1m. The cost estimate reflects the fact that more than 95% of Infigen’s generation is expected to be from renewable sources.
Outlook:
• Infigen reiterates its FY20 outlook, as released to the market at the FY19 Full Year Results.
• Minor adjustments to the FY20 outlook include an improved electricity sales mix, in particular, a higher contribution from Commercial and Industrial customers, with an equivalent decline in anticipated Merchant revenues. As a result, 81% of Infigen’s expected renewable energy generation and 100% of its expected LGCs are now contracted for FY20.
• The capital expenditure outlook for FY20 has been slightly lowered reflecting deferred timing of payments relating the South Australia Gas Turbine (SAGT) relocation. The overall budget ($55m) and relocation timeline remain unchanged. In line with prior disclosures, the SAGT lease is expected to commence in May 2020.
• As indicated in the FY19 Full Year Results Presentation and reiterated at the AGM in November 2019, Infigen’s FY20 Net Revenue is expected to be weighted towards H1FY20. Historically, Infigen’s renewable energy generation is materially biased towards the first half of the financial year. In FY20,
2
two other factors amplify the weighting towards the first half; namely: (1) the first half of FY20 benefited from higher priced CY19 LGC contracts; and (2) a more subdued outlook for wholesale electricity prices in the second half.
• In line with prior disclosures, operating cashflow will be weighted towards H2FY20, reflecting cash settlement of LGC sales. In early February 2020, over 90% of Infigen’s LGC inventory achieved cash settlement in line with contract terms.
Infigen’s Managing Director and Chief Executive Officer, Ross Rolfe, AO, said: “It is pleasing to see predictablility and stability in our financial and operating performance during the first half of FY20. We also continued to make significant progress increasing our contracted position and diversifying our customer base. Going forward we remain focused on maintaining high levels of customer contracting and delivering growth through procuring supply from an incremental 600-700MW of renewable energy capacity. While ongoing policy discontinuity creates an uncertain environment for agreeing Power Purchase Agreements, we remain confident in our ability to secure the 600-700MW of contracted capacity over the next two to three years. We also reiterate that our financial performance is in line with our prior FY20 outlook, including the weighting of financial outcomes to the first half.” Infigen will host a conference call for investors and analysts at 10am today, 21 February 2020. A link to the webcast is available below:
https://www.infigenenergy.com/investors/publications/financial-results/fy20-interim-results/ ENDS For further information please contact:
Peter Campbell General Manager, Investor Relations [email protected] +61 2 8031 9970
About Infigen
Infigen is leading Australia’s transition to a clean energy future. Infigen generates and sources renewable energy, increases the value of intermittent renewables by firming, and provides customers with clean, reliable and competitively priced energy solutions. Infigen generates renewable energy from its owned wind farms in New South Wales (NSW), South Australia (SA) and Western Australia (WA). Infigen also sources renewable energy from third party renewable projects under its ‘Capital Lite’ strategy. Infigen increases the value of intermittent renewables by firming them from its Smithfield OCGT Facility in Western Sydney, NSW, and its 25MW/52MWh Battery at Lake Bonney, SA. Infigen’s energy retailing licences are held in the National Electricity Market (NEM) regions of Queensland, New South Wales (including the Australian Capital Territory), Victoria and South Australia. Infigen is a proud and active supporter of the communities in which it operates. For further information, please visit: www.infigenenergy.com
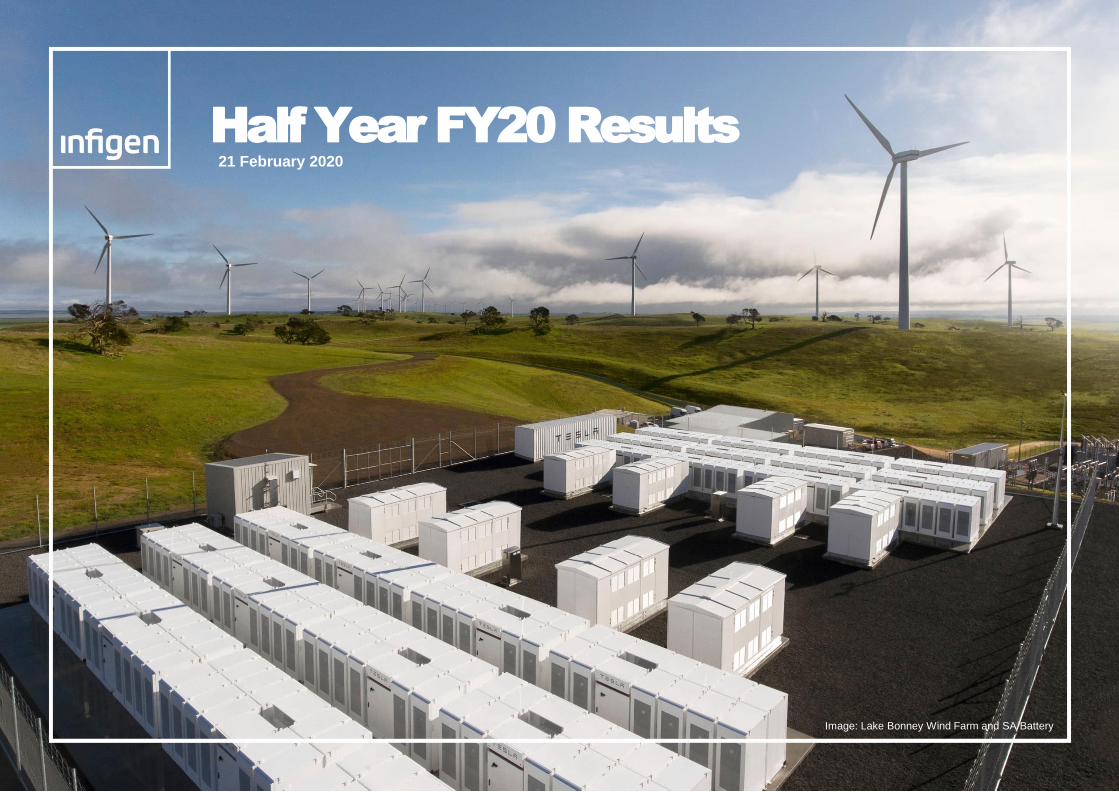
Half Year FY20 Results
Image: Lake Bonney Wind Farm and SA Battery
21 February 2020
2
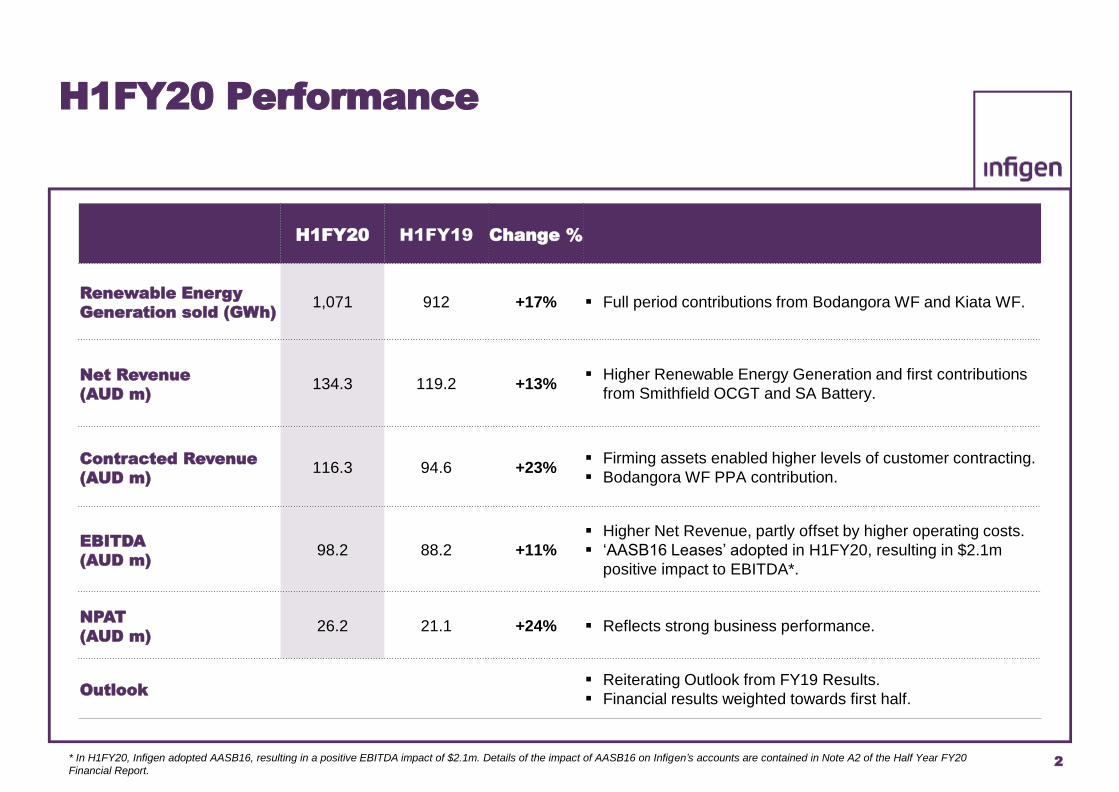
H1FY20 Performance
H1FY20 H1FY19 Change %
Renewable Energy
Generation sold (GWh)1,071 912 +17% ▪ Full period contributions from Bodangora WF and Kiata WF.
Net Revenue
(AUD m)134.3 119.2 +13%
▪ Higher Renewable Energy Generation and first contributions
from Smithfield OCGT and SA Battery.
Contracted Revenue
(AUD m)116.3 94.6 +23%
▪ Firming assets enabled higher levels of customer contracting.
▪ Bodangora WF PPA contribution.
EBITDA
(AUD m)98.2 88.2 +11%
▪ Higher Net Revenue, partly offset by higher operating costs.
▪ ‘AASB16 Leases’ adopted in H1FY20, resulting in $2.1m
positive impact to EBITDA*.
NPAT
(AUD m)26.2 21.1 +24% ▪ Reflects strong business performance.
Outlook▪ Reiterating Outlook from FY19 Results.
▪ Financial results weighted towards first half.
* In H1FY20, Infigen adopted AASB16, resulting in a positive EBITDA impact of $2.1m. Details of the impact of AASB16 on Infigen’s accounts are contained in Note A2 of the Half Year FY20
Financial Report.
3
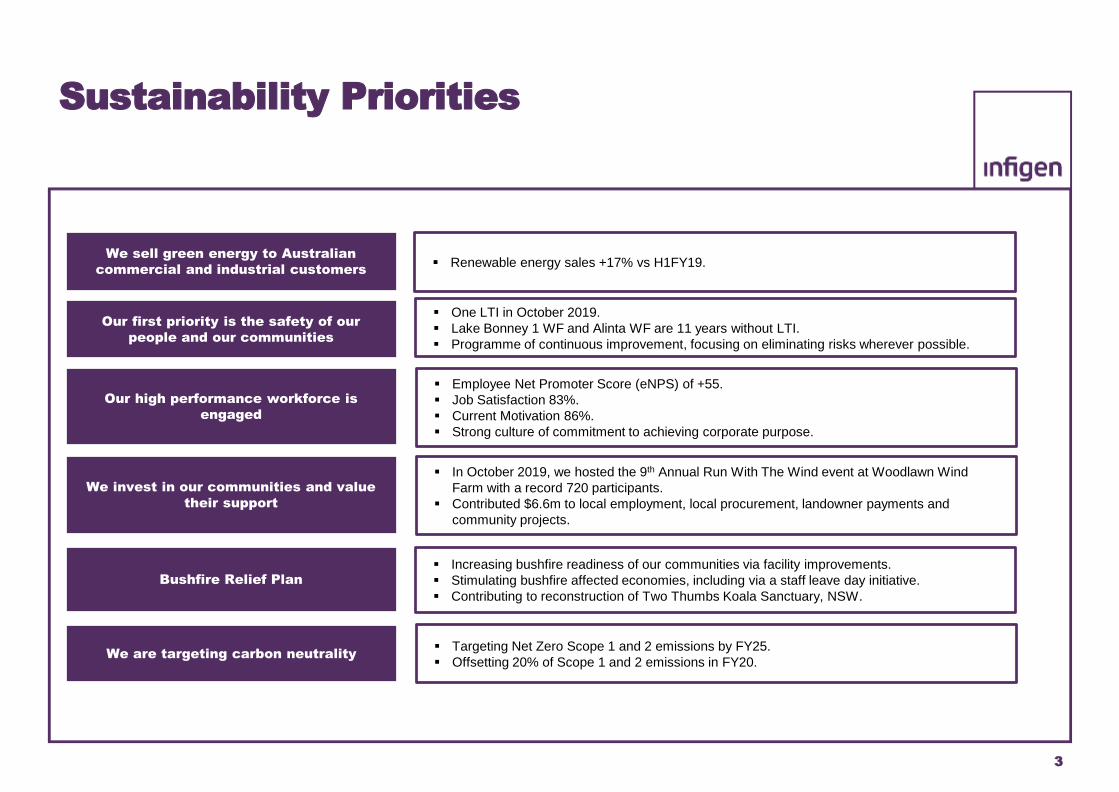
Sustainability Priorities
Our first priority is the safety of our
people and our communities
Our high performance workforce is
engaged
We invest in our communities and value
their support
We are targeting carbon neutrality
We sell green energy to Australian
commercial and industrial customers
▪ One LTI in October 2019.
▪ Lake Bonney 1 WF and Alinta WF are 11 years without LTI.
▪ Programme of continuous improvement, focusing on eliminating risks wherever possible.
▪ Employee Net Promoter Score (eNPS) of +55.
▪ Job Satisfaction 83%.
▪ Current Motivation 86%.
▪ Strong culture of commitment to achieving corporate purpose.
▪ In October 2019, we hosted the 9th Annual Run With The Wind event at Woodlawn Wind
Farm with a record 720 participants.
▪ Contributed $6.6m to local employment, local procurement, landowner payments and
community projects.
▪ Targeting Net Zero Scope 1 and 2 emissions by FY25.
▪ Offsetting 20% of Scope 1 and 2 emissions in FY20.
▪ Renewable energy sales +17% vs H1FY19.
Bushfire Relief Plan▪ Increasing bushfire readiness of our communities via facility improvements.
▪ Stimulating bushfire affected economies, including via a staff leave day initiative.
▪ Contributing to reconstruction of Two Thumbs Koala Sanctuary, NSW.
4
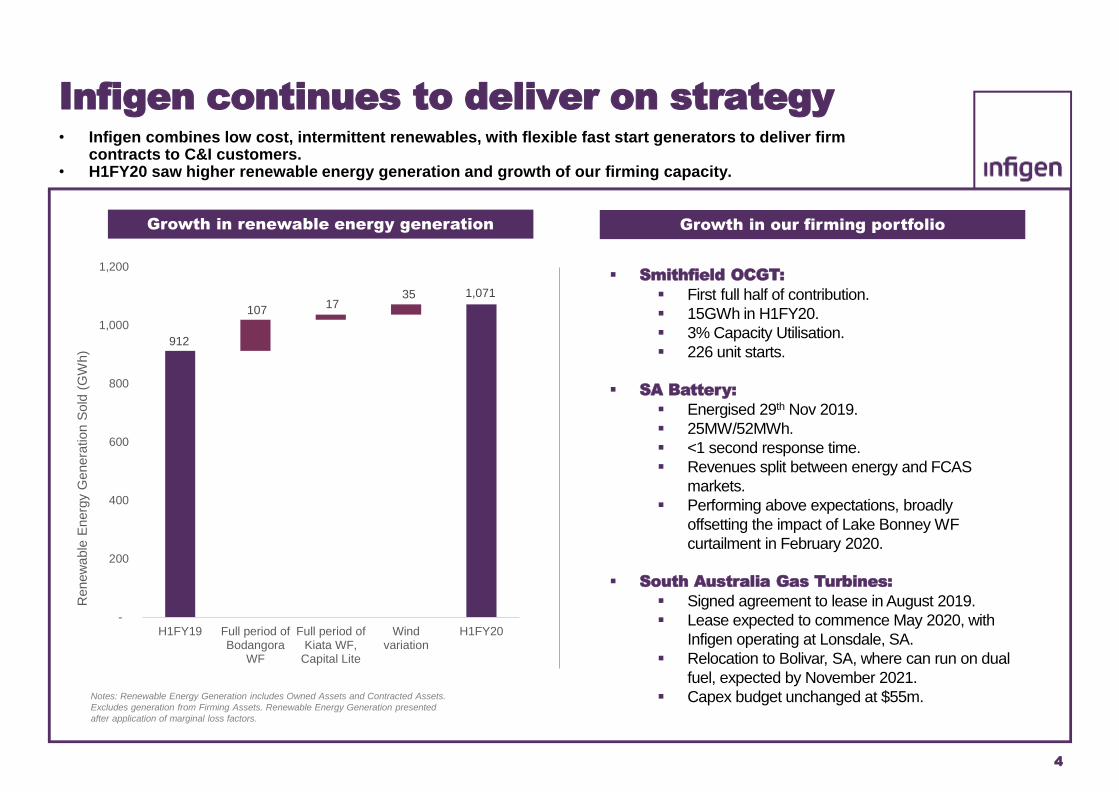
Infigen continues to deliver on strategy• Infigen combines low cost, intermittent renewables, with flexible fast start generators to deliver firm
contracts to C&I customers.• H1FY20 saw higher renewable energy generation and growth of our firming capacity.
Notes: Renewable Energy Generation includes Owned Assets and Contracted Assets.
Excludes generation from Firming Assets. Renewable Energy Generation presented
after application of marginal loss factors.
912
1,071
107 17
35
-
200
400
600
800
1,000
1,200
H1FY19 Full period ofBodangora
WF
Full period ofKiata WF,
Capital Lite
Windvariation
H1FY20
Renew
able
Energ
y G
enera
tion S
old
(G
Wh)
Growth in our firming portfolio
▪ Smithfield OCGT:
▪ First full half of contribution.
▪ 15GWh in H1FY20.
▪ 3% Capacity Utilisation.
▪ 226 unit starts.
▪ SA Battery:
▪ Energised 29th Nov 2019.
▪ 25MW/52MWh.
▪ <1 second response time.
▪ Revenues split between energy and FCAS
markets.
▪ Performing above expectations, broadly
offsetting the impact of Lake Bonney WF
curtailment in February 2020.
▪ South Australia Gas Turbines:
▪ Signed agreement to lease in August 2019.
▪ Lease expected to commence May 2020, with
Infigen operating at Lonsdale, SA.
▪ Relocation to Bolivar, SA, where can run on dual
fuel, expected by November 2021.
▪ Capex budget unchanged at $55m.
Growth in renewable energy generation
5
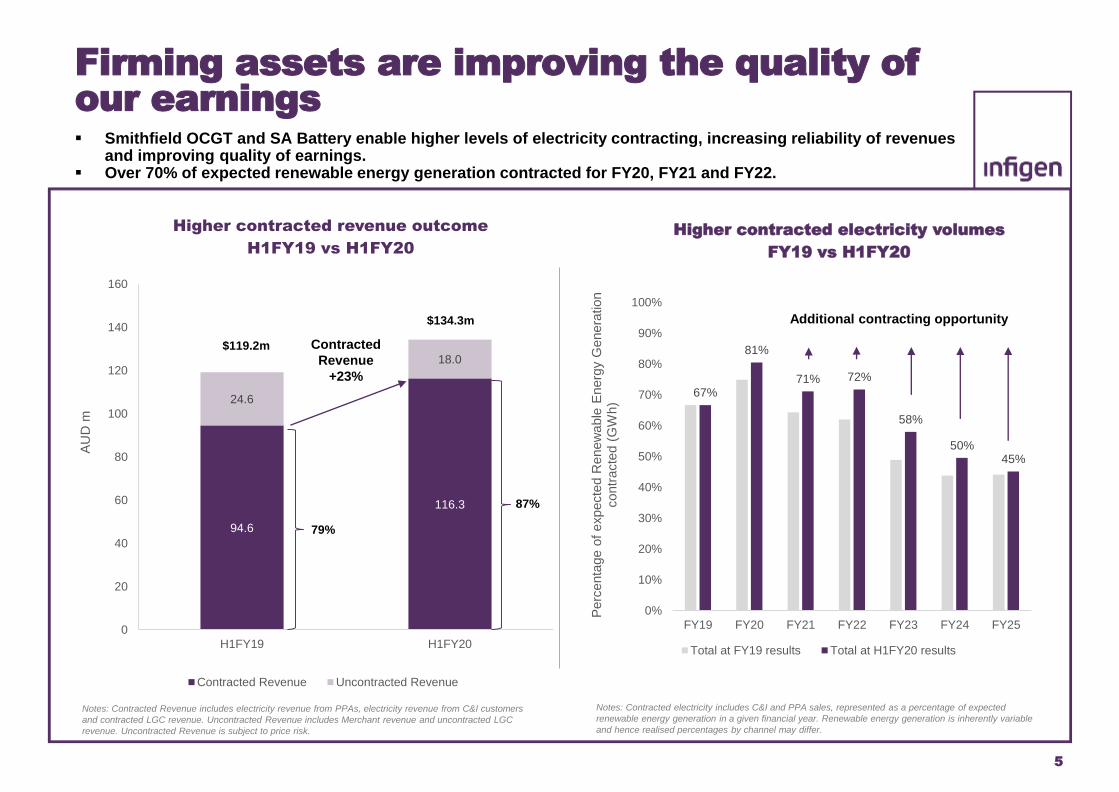
94.6
116.3
24.6
18.0
0
20
40
60
80
100
120
140
160
H1FY19 H1FY20
AU
D m
Higher contracted revenue outcome
H1FY19 vs H1FY20
Contracted Revenue Uncontracted Revenue
Notes: Contracted Revenue includes electricity revenue from PPAs, electricity revenue from C&I customers
and contracted LGC revenue. Uncontracted Revenue includes Merchant revenue and uncontracted LGC
revenue. Uncontracted Revenue is subject to price risk.
Contracted
Revenue
+23%
$119.2m
$134.3m
Firming assets are improving the quality of our earnings▪ Smithfield OCGT and SA Battery enable higher levels of electricity contracting, increasing reliability of revenues
and improving quality of earnings.▪ Over 70% of expected renewable energy generation contracted for FY20, FY21 and FY22.
Notes: Contracted electricity includes C&I and PPA sales, represented as a percentage of expected
renewable energy generation in a given financial year. Renewable energy generation is inherently variable
and hence realised percentages by channel may differ.
67%
81%
71% 72%
58%
50%45%
0%
10%
20%
30%
40%
50%
60%
70%
80%
90%
100%
FY19 FY20 FY21 FY22 FY23 FY24 FY25
Perc
enta
ge o
f expecte
d R
enew
able
Energ
y G
enera
tion
contr
acte
d (
GW
h)
Higher contracted electricity volumes
FY19 vs H1FY20
Total at FY19 results Total at H1FY20 results
Additional contracting opportunity
87%
79%
6
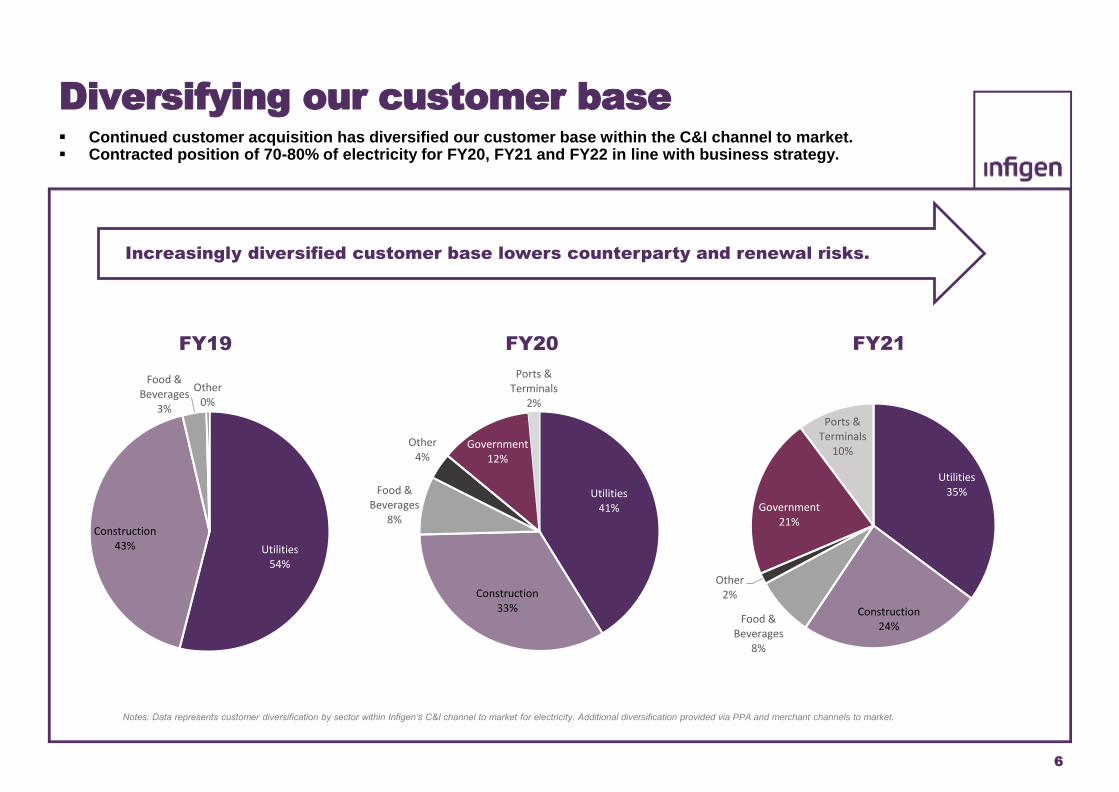
Diversifying our customer base▪ Continued customer acquisition has diversified our customer base within the C&I channel to market. ▪ Contracted position of 70-80% of electricity for FY20, FY21 and FY22 in line with business strategy.
Utilities54%
Construction43%
Food & Beverages
3%
Other0%
FY19
Utilities41%
Construction33%
Food & Beverages
8%
Other4%
Government12%
Ports & Terminals
2%
FY20
Utilities35%
Construction24%
Food & Beverages
8%
Other2%
Government21%
Ports & Terminals
10%
FY21
Increasingly diversified customer base lowers counterparty and renewal risks.
Notes: Data represents customer diversification by sector within Infigen’s C&I channel to market for electricity. Additional diversification provided via PPA and merchant channels to market.
7
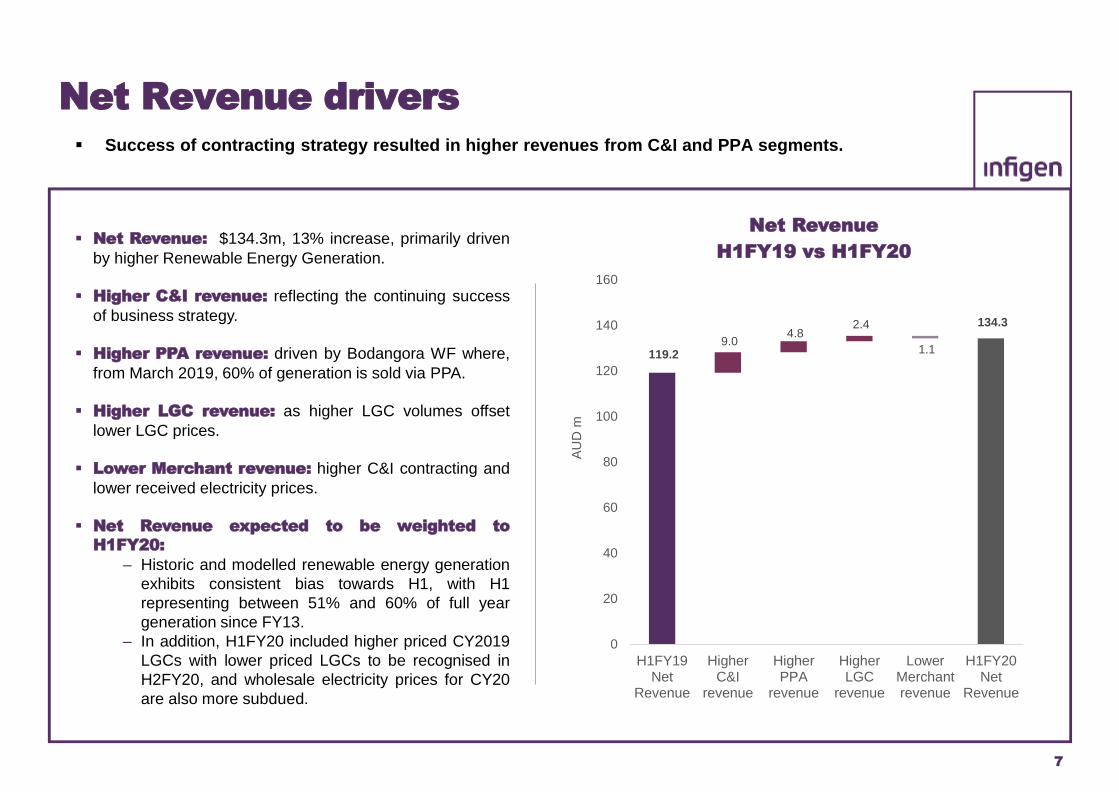
Net Revenue drivers
▪ Net Revenue: $134.3m, 13% increase, primarily driven
by higher Renewable Energy Generation.
▪ Higher C&I revenue: reflecting the continuing success
of business strategy.
▪ Higher PPA revenue: driven by Bodangora WF where,
from March 2019, 60% of generation is sold via PPA.
▪ Higher LGC revenue: as higher LGC volumes offset
lower LGC prices.
▪ Lower Merchant revenue: higher C&I contracting and
lower received electricity prices.
▪ Net Revenue expected to be weighted to
H1FY20:
– Historic and modelled renewable energy generation
exhibits consistent bias towards H1, with H1
representing between 51% and 60% of full year
generation since FY13.
– In addition, H1FY20 included higher priced CY2019
LGCs with lower priced LGCs to be recognised in
H2FY20, and wholesale electricity prices for CY20
are also more subdued.
▪ Success of contracting strategy resulted in higher revenues from C&I and PPA segments.
119.2
134.3
9.0 4.8
2.4
1.1
0
20
40
60
80
100
120
140
160
H1FY19Net
Revenue
HigherC&I
revenue
HigherPPA
revenue
HigherLGC
revenue
LowerMerchantrevenue
H1FY20Net
Revenue
AU
D m
Net Revenue
H1FY19 vs H1FY20
8
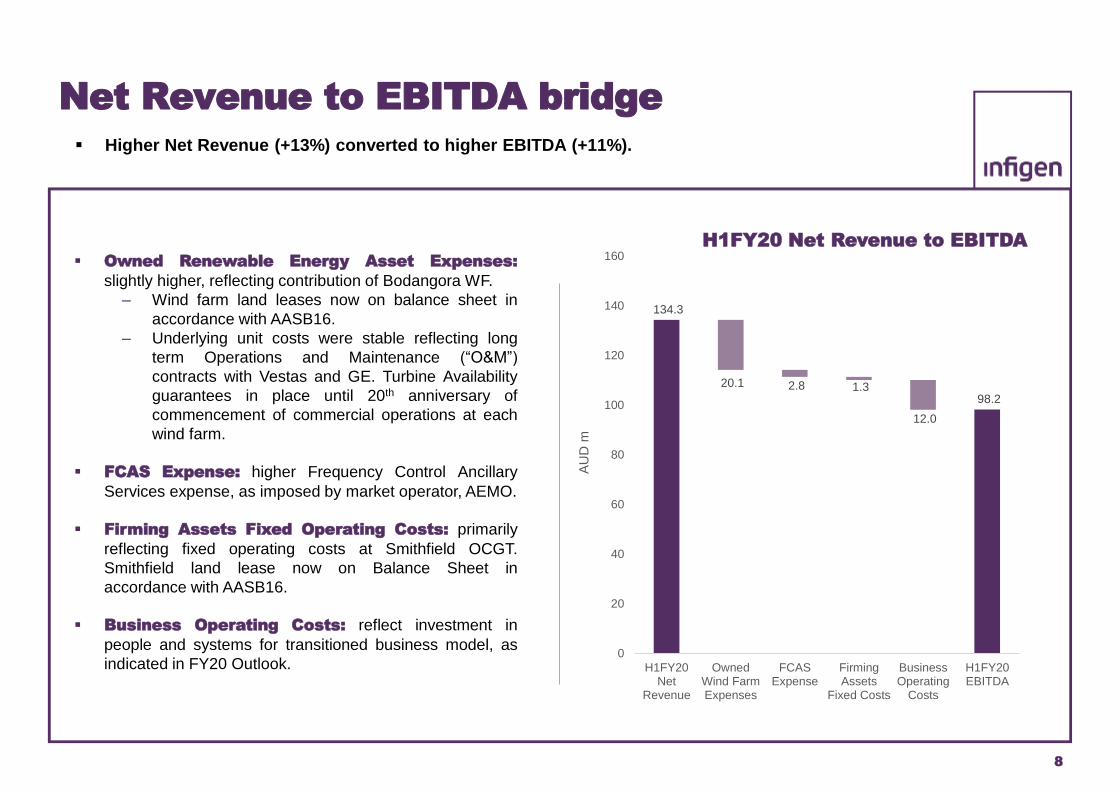
Net Revenue to EBITDA bridge
▪ Owned Renewable Energy Asset Expenses:
slightly higher, reflecting contribution of Bodangora WF.
‒ Wind farm land leases now on balance sheet in
accordance with AASB16.
‒ Underlying unit costs were stable reflecting long
term Operations and Maintenance (“O&M”)
contracts with Vestas and GE. Turbine Availability
guarantees in place until 20th anniversary of
commencement of commercial operations at each
wind farm.
▪ FCAS Expense: higher Frequency Control Ancillary
Services expense, as imposed by market operator, AEMO.
▪ Firming Assets Fixed Operating Costs: primarily
reflecting fixed operating costs at Smithfield OCGT.
Smithfield land lease now on Balance Sheet in
accordance with AASB16.
▪ Business Operating Costs: reflect investment in
people and systems for transitioned business model, as
indicated in FY20 Outlook.
▪ Higher Net Revenue (+13%) converted to higher EBITDA (+11%).
134.3
98.2
20.1 2.8 1.3
12.0
0
20
40
60
80
100
120
140
160
H1FY20Net
Revenue
OwnedWind FarmExpenses
FCASExpense
FirmingAssets
Fixed Costs
BusinessOperating
Costs
H1FY20EBITDA
AU
D m
H1FY20 Net Revenue to EBITDA
9
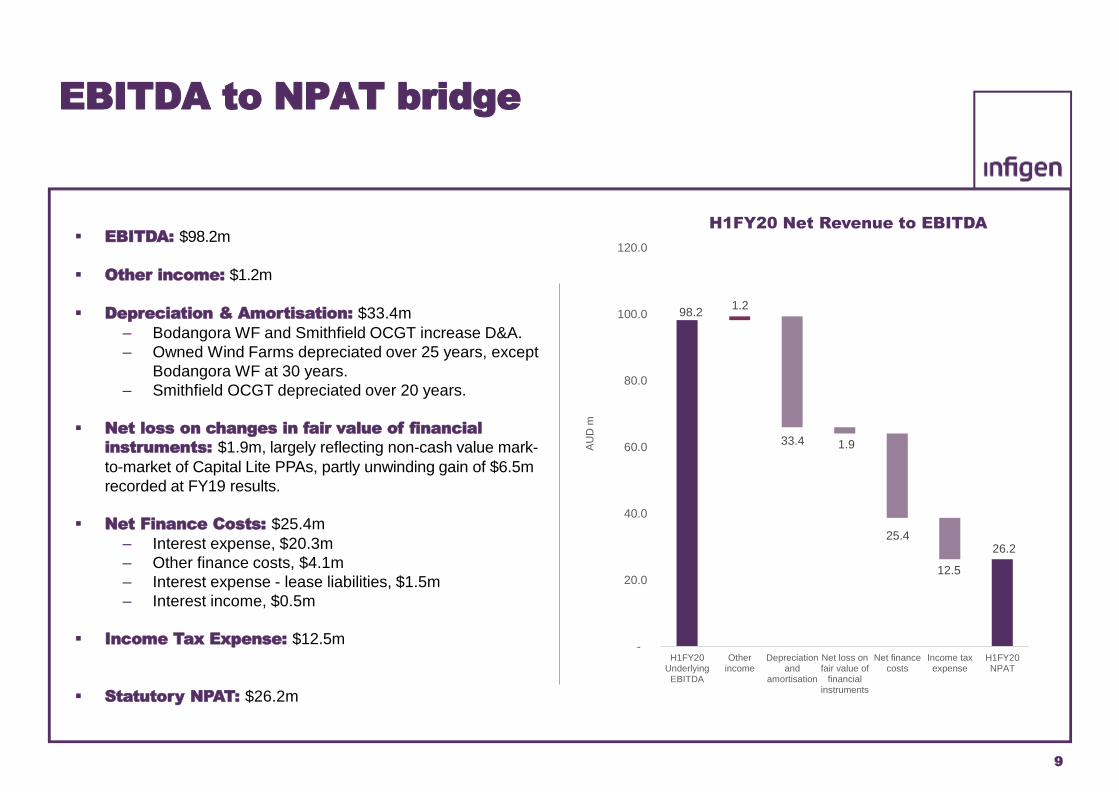
EBITDA to NPAT bridge
▪ EBITDA: $98.2m
▪ Other income: $1.2m
▪ Depreciation & Amortisation: $33.4m
‒ Bodangora WF and Smithfield OCGT increase D&A.
‒ Owned Wind Farms depreciated over 25 years, except
Bodangora WF at 30 years.
‒ Smithfield OCGT depreciated over 20 years.
▪ Net loss on changes in fair value of financial
instruments: $1.9m, largely reflecting non-cash value mark-
to-market of Capital Lite PPAs, partly unwinding gain of $6.5m
recorded at FY19 results.
▪ Net Finance Costs: $25.4m
‒ Interest expense, $20.3m
‒ Other finance costs, $4.1m
‒ Interest expense - lease liabilities, $1.5m
‒ Interest income, $0.5m
▪ Income Tax Expense: $12.5m
▪ Statutory NPAT: $26.2m
98.2
26.2
1.2
33.4 1.9
25.4
12.5
-
20.0
40.0
60.0
80.0
100.0
120.0
H1FY20Underlying
EBITDA
Otherincome
Depreciationand
amortisation
Net loss onfair value of
financialinstruments
Net financecosts
Income taxexpense
H1FY20NPAT
AU
D m
H1FY20 Net Revenue to EBITDA
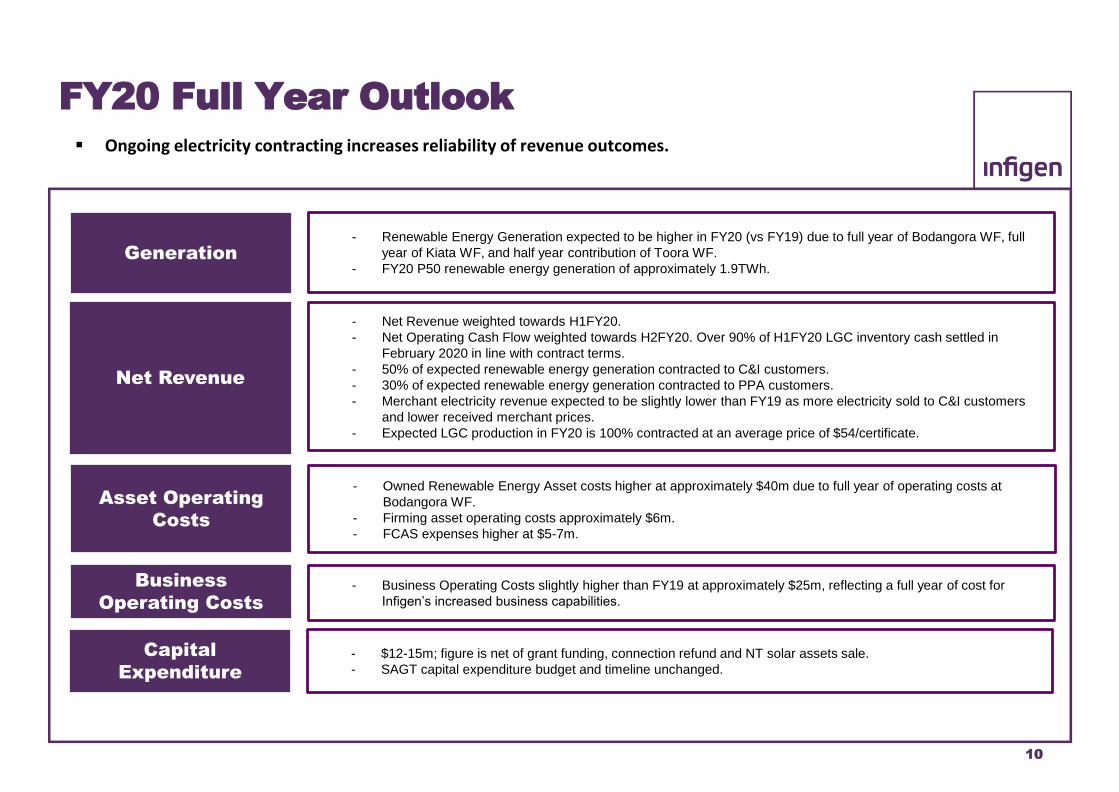
FY20 Full Year Outlook
Net Revenue
- Net Revenue weighted towards H1FY20.
- Net Operating Cash Flow weighted towards H2FY20. Over 90% of H1FY20 LGC inventory cash settled in
February 2020 in line with contract terms.
- 50% of expected renewable energy generation contracted to C&I customers.
- 30% of expected renewable energy generation contracted to PPA customers.
- Merchant electricity revenue expected to be slightly lower than FY19 as more electricity sold to C&I customers
and lower received merchant prices.
- Expected LGC production in FY20 is 100% contracted at an average price of $54/certificate.
Asset Operating
Costs
- Owned Renewable Energy Asset costs higher at approximately $40m due to full year of operating costs at
Bodangora WF.
- Firming asset operating costs approximately $6m.
- FCAS expenses higher at $5-7m.
Capital
Expenditure- $12-15m; figure is net of grant funding, connection refund and NT solar assets sale.
- SAGT capital expenditure budget and timeline unchanged.
Business
Operating Costs- Business Operating Costs slightly higher than FY19 at approximately $25m, reflecting a full year of cost for
Infigen’s increased business capabilities.
Generation- Renewable Energy Generation expected to be higher in FY20 (vs FY19) due to full year of Bodangora WF, full
year of Kiata WF, and half year contribution of Toora WF.
- FY20 P50 renewable energy generation of approximately 1.9TWh.
▪ Ongoing electricity contracting increases reliability of revenue outcomes.
10
11
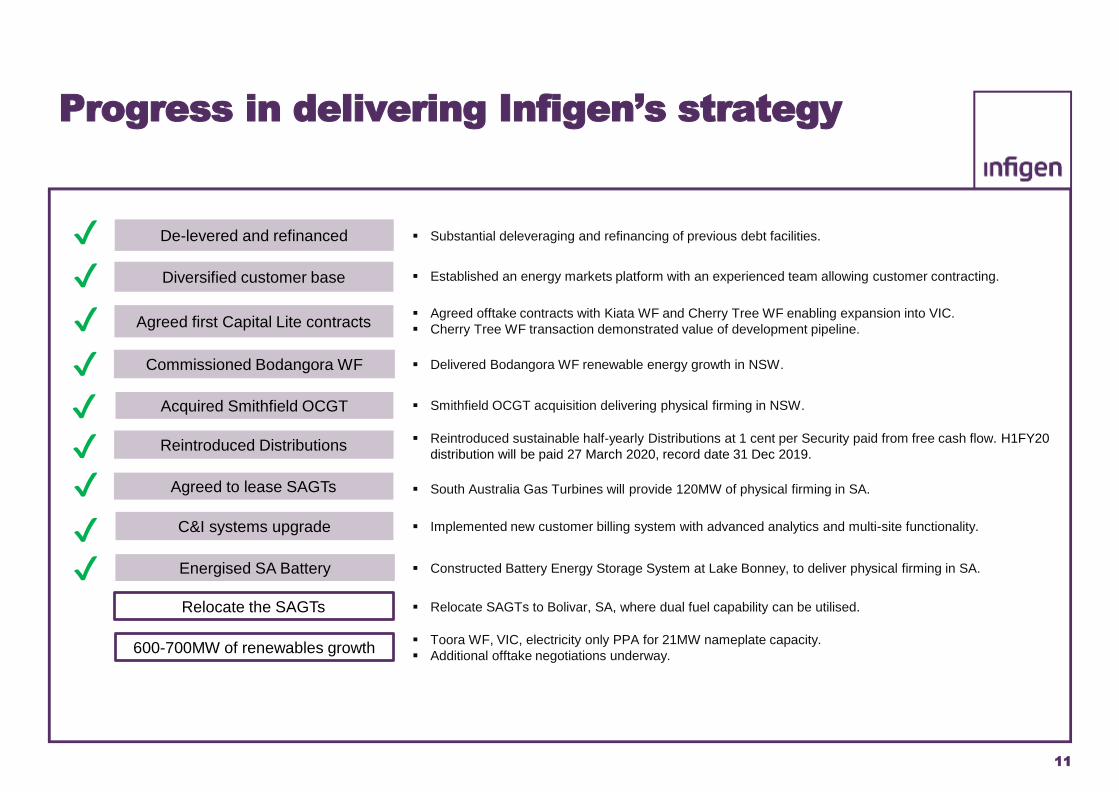
Progress in delivering Infigen’s strategy
▪ Substantial deleveraging and refinancing of previous debt facilities.
▪ Delivered Bodangora WF renewable energy growth in NSW.
▪ Agreed offtake contracts with Kiata WF and Cherry Tree WF enabling expansion into VIC.
▪ Cherry Tree WF transaction demonstrated value of development pipeline.
▪ Reintroduced sustainable half-yearly Distributions at 1 cent per Security paid from free cash flow. H1FY20
distribution will be paid 27 March 2020, record date 31 Dec 2019.
✔
▪ Smithfield OCGT acquisition delivering physical firming in NSW.
De-levered and refinanced
Agreed first Capital Lite contracts
Commissioned Bodangora WF
Energised SA Battery
Acquired Smithfield OCGT
Reintroduced Distributions
▪ Constructed Battery Energy Storage System at Lake Bonney, to deliver physical firming in SA.
▪ South Australia Gas Turbines will provide 120MW of physical firming in SA.Agreed to lease SAGTs
Diversified customer base ▪ Established an energy markets platform with an experienced team allowing customer contracting.
✔
✔
✔
✔
✔
✔
C&I systems upgrade✔ ▪ Implemented new customer billing system with advanced analytics and multi-site functionality.
✔
Relocate the SAGTs ▪ Relocate SAGTs to Bolivar, SA, where dual fuel capability can be utilised.
600-700MW of renewables growth▪ Toora WF, VIC, electricity only PPA for 21MW nameplate capacity.
▪ Additional offtake negotiations underway.
12
0 GWh
500 GWh
1000 GWh
1500 GWh
2000 GWh
2500 GWh
3000 GWh
3500 GWh
4000 GWh
4500 GWh
FY17 FY18 FY19 FY20 FY21 FY22 FY23 FY24 FY25
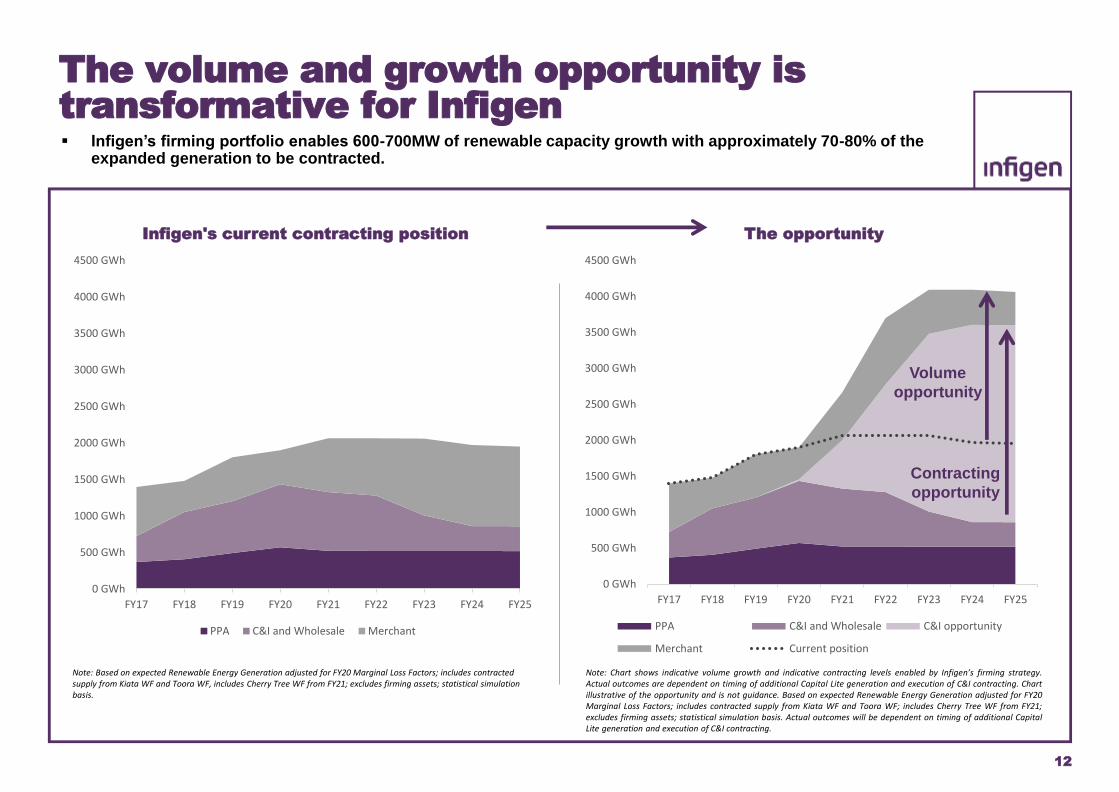
The opportunity
PPA C&I and Wholesale C&I opportunity
Merchant Current position
The volume and growth opportunity is transformative for Infigen
Volume
opportunity
Contracting
opportunity
▪ Infigen’s firming portfolio enables 600-700MW of renewable capacity growth with approximately 70-80% of the expanded generation to be contracted.
Note: Based on expected Renewable Energy Generation adjusted for FY20 Marginal Loss Factors; includes contracted supply from Kiata WF and Toora WF, includes Cherry Tree WF from FY21; excludes firming assets; statistical simulation basis.
Note: Chart shows indicative volume growth and indicative contracting levels enabled by Infigen’s firming strategy.Actual outcomes are dependent on timing of additional Capital Lite generation and execution of C&I contracting. Chartillustrative of the opportunity and is not guidance. Based on expected Renewable Energy Generation adjusted for FY20Marginal Loss Factors; includes contracted supply from Kiata WF and Toora WF; includes Cherry Tree WF from FY21;excludes firming assets; statistical simulation basis. Actual outcomes will be dependent on timing of additional CapitalLite generation and execution of C&I contracting.
0 GWh
500 GWh
1000 GWh
1500 GWh
2000 GWh
2500 GWh
3000 GWh
3500 GWh
4000 GWh
4500 GWh
FY17 FY18 FY19 FY20 FY21 FY22 FY23 FY24 FY25
Infigen's current contracting position
PPA C&I and Wholesale Merchant
13
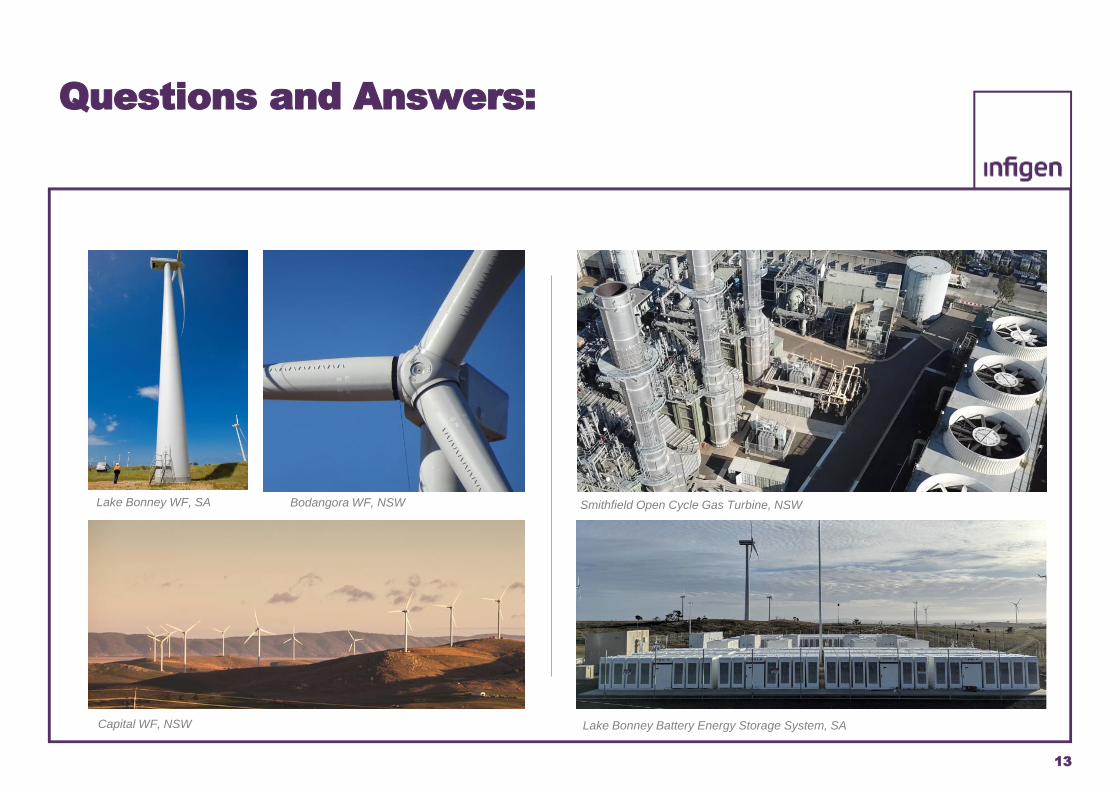
Questions and Answers:
Lake Bonney WF, SA
Capital WF, NSW
Bodangora WF, NSW Smithfield Open Cycle Gas Turbine, NSW
Lake Bonney Battery Energy Storage System, SA
Financial Appendix
Image: Capital Wind Farm, NSW
14
15
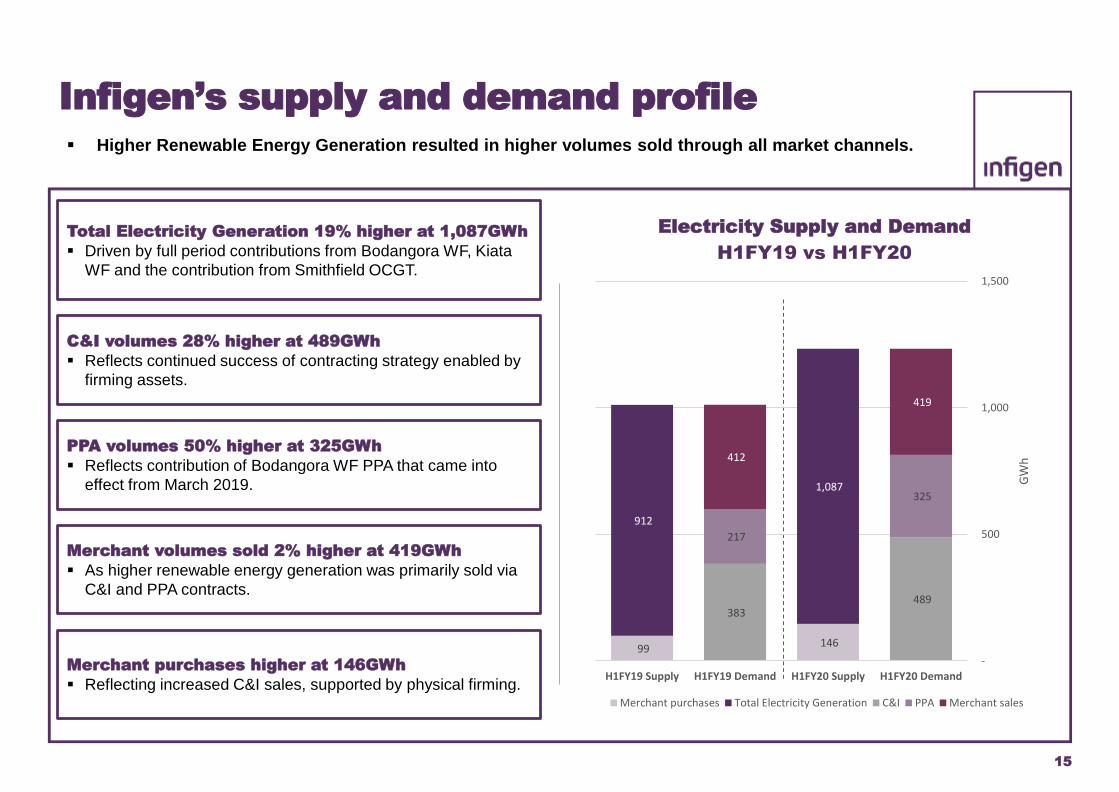
Infigen’s supply and demand profile
Total Electricity Generation 19% higher at 1,087GWh
▪ Driven by full period contributions from Bodangora WF, Kiata
WF and the contribution from Smithfield OCGT.
Merchant purchases higher at 146GWh
▪ Reflecting increased C&I sales, supported by physical firming.
C&I volumes 28% higher at 489GWh
▪ Reflects continued success of contracting strategy enabled by
firming assets.
PPA volumes 50% higher at 325GWh
▪ Reflects contribution of Bodangora WF PPA that came into
effect from March 2019.
Merchant volumes sold 2% higher at 419GWh
▪ As higher renewable energy generation was primarily sold via
C&I and PPA contracts.
▪ Higher Renewable Energy Generation resulted in higher volumes sold through all market channels.
99 146
912
1,087
383 489
217
325
412
419
-
500
1,000
1,500
H1FY19 Supply H1FY19 Demand H1FY20 Supply H1FY20 Demand
GW
h
Electricity Supply and Demand
H1FY19 vs H1FY20
Merchant purchases Total Electricity Generation C&I PPA Merchant sales
16
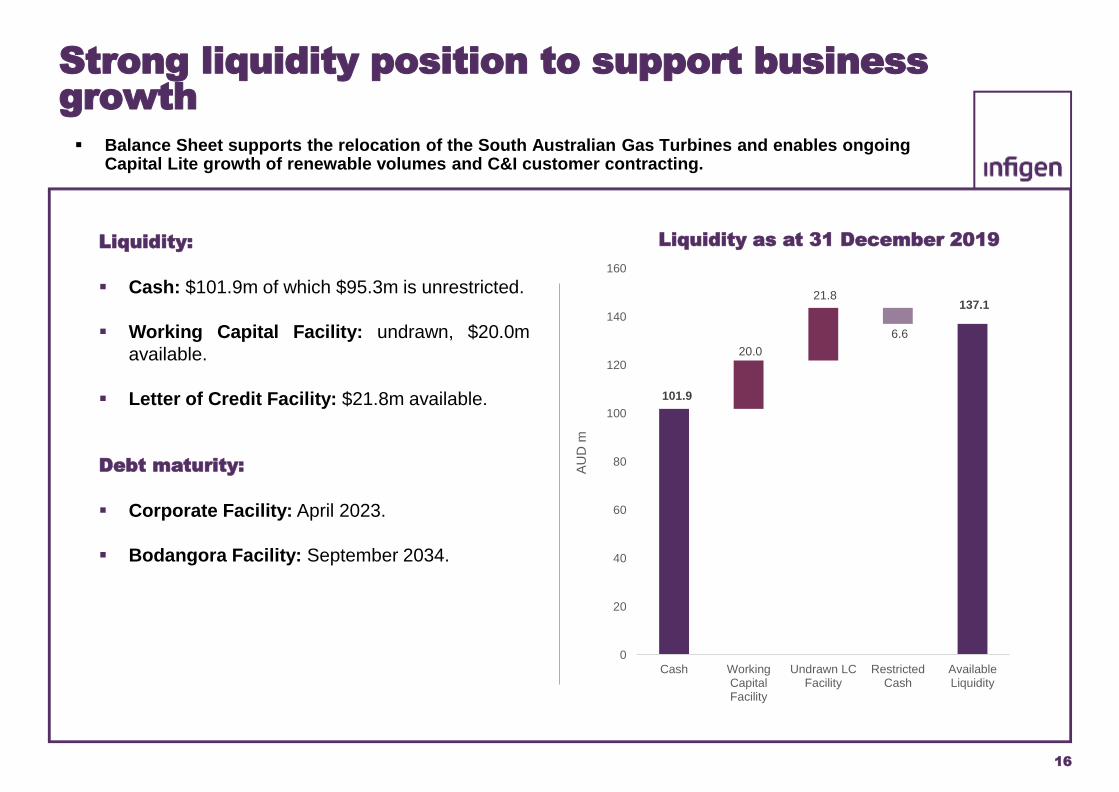
Strong liquidity position to support business growth
Liquidity:
▪ Cash: $101.9m of which $95.3m is unrestricted.
▪ Working Capital Facility: undrawn, $20.0m
available.
▪ Letter of Credit Facility: $21.8m available.
Debt maturity:
▪ Corporate Facility: April 2023.
▪ Bodangora Facility: September 2034.
▪ Balance Sheet supports the relocation of the South Australian Gas Turbines and enables ongoing Capital Lite growth of renewable volumes and C&I customer contracting.
101.9
137.1
20.0
21.8
6.6
0
20
40
60
80
100
120
140
160
Cash WorkingCapitalFacility
Undrawn LCFacility
RestrictedCash
AvailableLiquidity
AU
D m
Liquidity as at 31 December 2019
17
Net Revenue composition
Electricity sales to C&I customers
▪ C&I contract revenue reflects actual usage of each customer and
the terms of the contract.
▪ Prices reflect market conditions at time of contract and the
commercial terms and conditions agreed with the customer.
▪ Prices are influenced by a range of factors including: wholesale
market conditions at time of contract; contract tenors; cost to serve
customer; customer load profiles; region in NEM; treatment of
inflation; counterparty credit quality; time of day pricing and
demand response or high price event clauses.
▪ Channel also includes Wholesale contracts.
Electricity sales to PPA customers
▪ Infigen receives a fixed price for run of plant production. Infigen
therefore has volume risk, but not price risk.
▪ Infigen has two run of plant PPAs: Alinta WF, expiring 2026;
Bodangora WF (60%), expiring 2030.
▪ Infigen’s PPA sales generally have inflation escalators.
Contracted LGC sales
▪ As at 30 December 2019, Infigen’s expected LGC production
(including Contracted Assets) is contracted at: 100% at $54
(FY20), 79% at $41 (FY21), 67% at $26 (FY22), 33% at $35
(FY23) and 21% at $50 (FY24). Note, small variations in contract
prices may occur based on Infigen’s actual, vs expected, LGC
production and embedded put/call options within contracts.
Contracted Revenue Uncontracted Revenue
Merchant revenue
▪ Sales to spot electricity markets, noting impact of Dispatch
Weighted Average pricing (DWA). This occurs when Infigen’s
electricity generation is greater than C&I and PPA customer
contract requirements.
▪ Electricity purchases from the spot market.
▪ Smithfield OCGT revenue from cap sales and pool sales, net of
short run marginal cost and net of cap payouts.
▪ SA Battery revenue from regulation FCAS, contingency FCAS and
energy arbitrage.
▪ Financial firming positions such as FCAS hedges and cap payouts.
Uncontracted LGC sales
▪ LGCs that are not allocated for delivery under a contract are
marked to the spot market at each reporting period.
▪ Note: LGC inventory on Balance Sheet may include both contracted
and uncontracted LGCs.
18
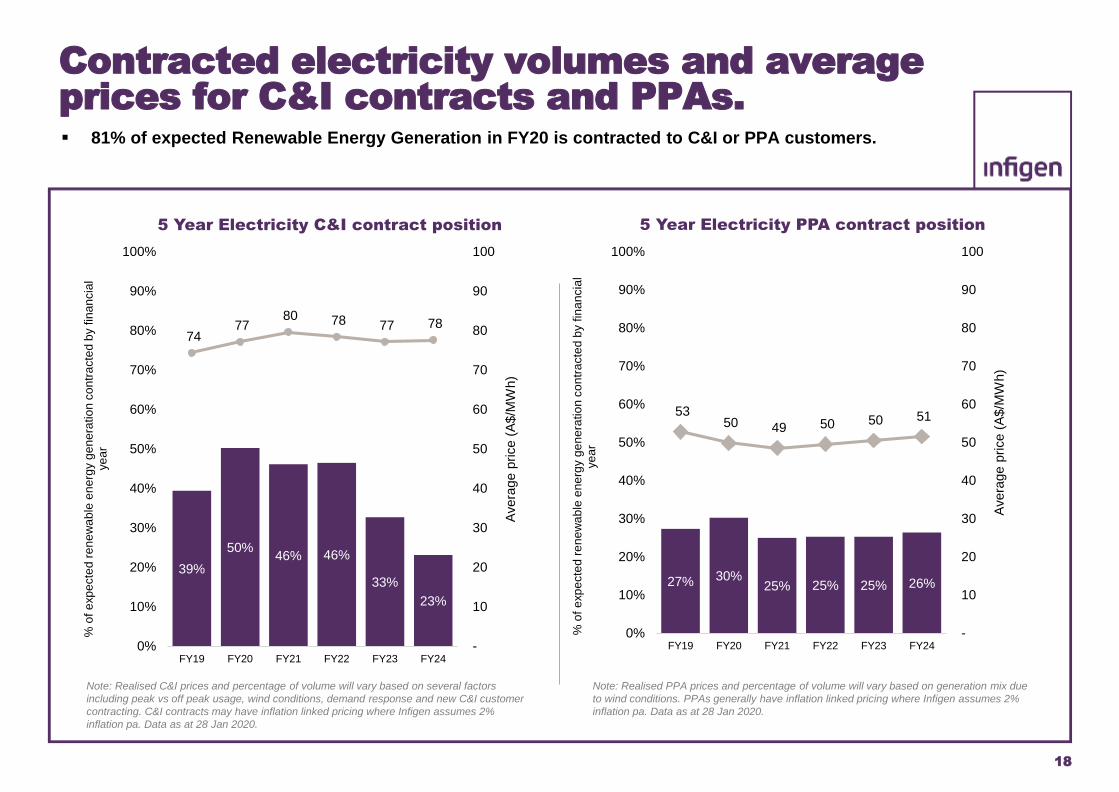
Contracted electricity volumes and average prices for C&I contracts and PPAs.▪ 81% of expected Renewable Energy Generation in FY20 is contracted to C&I or PPA customers.
Note: Realised C&I prices and percentage of volume will vary based on several factors
including peak vs off peak usage, wind conditions, demand response and new C&I customer
contracting. C&I contracts may have inflation linked pricing where Infigen assumes 2%
inflation pa. Data as at 28 Jan 2020.
Note: Realised PPA prices and percentage of volume will vary based on generation mix due
to wind conditions. PPAs generally have inflation linked pricing where Infigen assumes 2%
inflation pa. Data as at 28 Jan 2020.
27% 30%25% 25% 25% 26%
53 50 49 50 50 51
-
10
20
30
40
50
60
70
80
90
100
0%
10%
20%
30%
40%
50%
60%
70%
80%
90%
100%
FY19 FY20 FY21 FY22 FY23 FY24
Avera
ge p
rice (
A$/M
Wh)
% o
f e
xp
ecte
d r
en
ew
ab
le e
ne
rgy g
en
era
tio
n c
on
tra
cte
d b
y f
ina
ncia
l ye
ar
5 Year Electricity PPA contract position
39%
50%46% 46%
33%
23%
74 77
80 78 77 78
-
10
20
30
40
50
60
70
80
90
100
0%
10%
20%
30%
40%
50%
60%
70%
80%
90%
100%
FY19 FY20 FY21 FY22 FY23 FY24
Avera
ge p
rice (
A$/M
Wh)
% o
f e
xp
ecte
d r
en
ew
ab
le e
ne
rgy g
en
era
tio
n c
on
tra
cte
d b
y f
ina
ncia
l ye
ar
5 Year Electricity C&I contract position
19
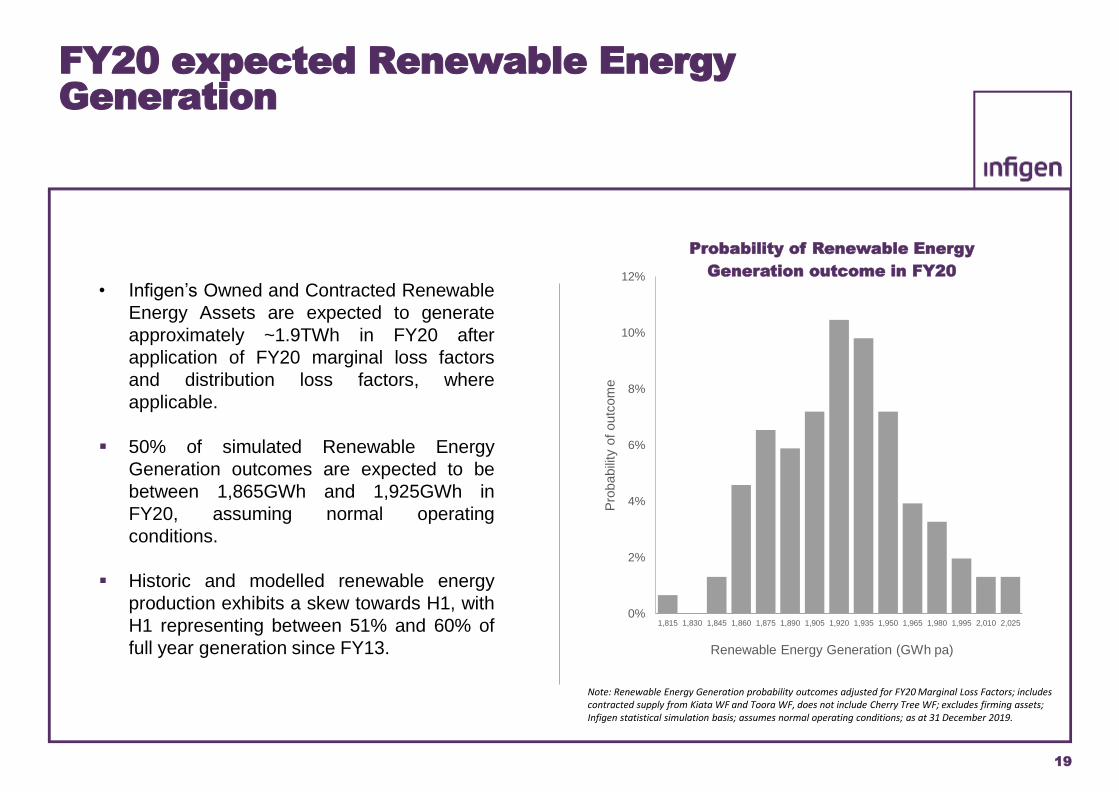
FY20 expected Renewable Energy Generation
• Infigen’s Owned and Contracted Renewable
Energy Assets are expected to generate
approximately ~1.9TWh in FY20 after
application of FY20 marginal loss factors
and distribution loss factors, where
applicable.
▪ 50% of simulated Renewable Energy
Generation outcomes are expected to be
between 1,865GWh and 1,925GWh in
FY20, assuming normal operating
conditions.
▪ Historic and modelled renewable energy
production exhibits a skew towards H1, with
H1 representing between 51% and 60% of
full year generation since FY13.
Note: Renewable Energy Generation probability outcomes adjusted for FY20 Marginal Loss Factors; includes contracted supply from Kiata WF and Toora WF, does not include Cherry Tree WF; excludes firming assets; Infigen statistical simulation basis; assumes normal operating conditions; as at 31 December 2019.
0%
2%
4%
6%
8%
10%
12%
1,815 1,830 1,845 1,860 1,875 1,890 1,905 1,920 1,935 1,950 1,965 1,980 1,995 2,010 2,025
Pro
babili
ty o
f outc
om
e
Renewable Energy Generation (GWh pa)
Probability of Renewable Energy
Generation outcome in FY20
Energy Markets
Appendix
Image: Alinta Wind Farm, WA 20
21
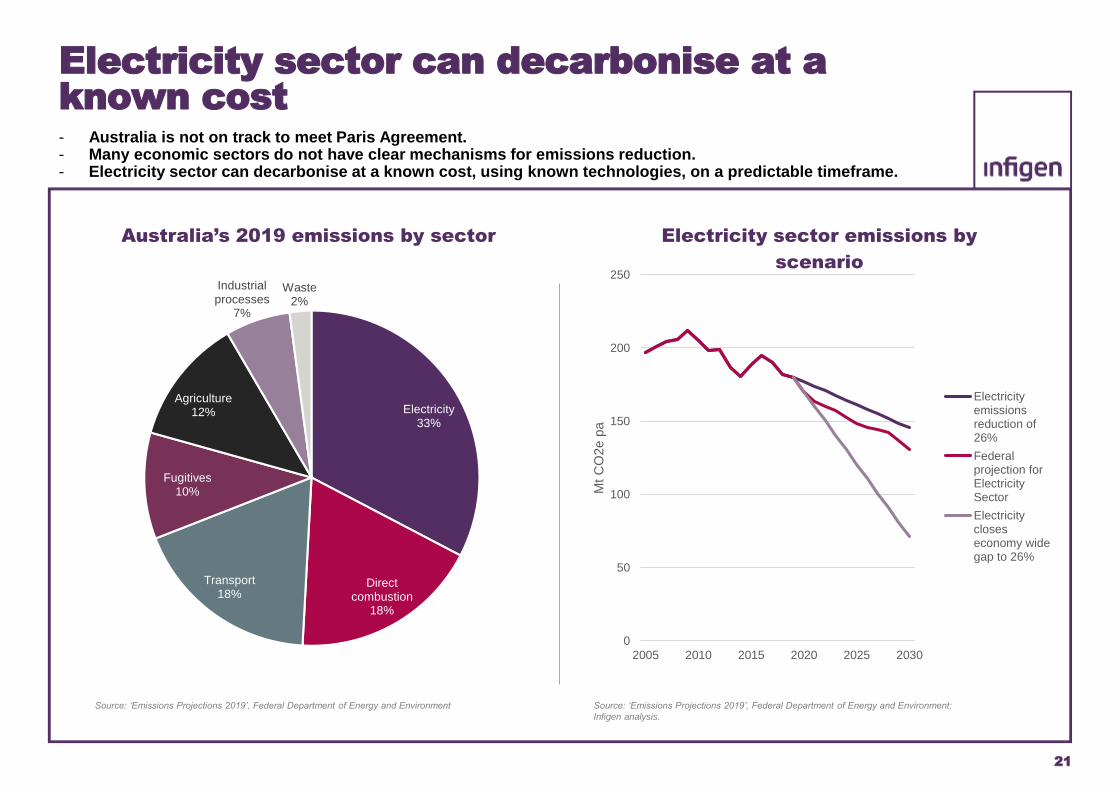
Electricity sector can decarbonise at a known cost- Australia is not on track to meet Paris Agreement.- Many economic sectors do not have clear mechanisms for emissions reduction.- Electricity sector can decarbonise at a known cost, using known technologies, on a predictable timeframe.
0
50
100
150
200
250
2005 2010 2015 2020 2025 2030
Mt
CO
2e p
a
Electricity sector emissions by
scenario
Electricityemissionsreduction of26%
Federalprojection forElectricitySector
Electricitycloseseconomy widegap to 26%
Electricity33%
Direct combustion
18%
Transport18%
Fugitives10%
Agriculture12%
Industrial processes
7%
Waste2%
Australia’s 2019 emissions by sector
Source: ‘Emissions Projections 2019’, Federal Department of Energy and Environment Source: ‘Emissions Projections 2019’, Federal Department of Energy and Environment;
Infigen analysis.
22
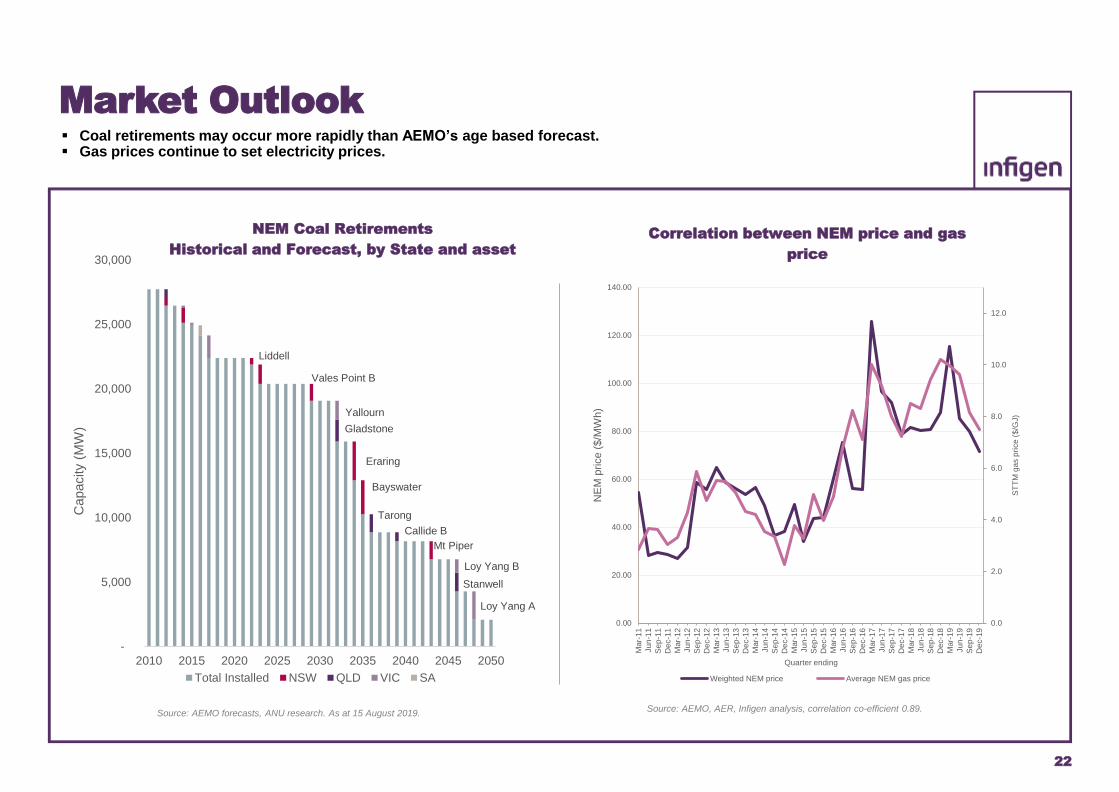
▪ Coal retirements may occur more rapidly than AEMO’s age based forecast.▪ Gas prices continue to set electricity prices.
Source: AEMO forecasts, ANU research. As at 15 August 2019.
Market Outlook
Liddell
Vales Point B
Eraring
Bayswater
Mt Piper
Gladstone
Tarong
Callide B
Stanwell
Yallourn
Loy Yang B
Loy Yang A
-
5,000
10,000
15,000
20,000
25,000
30,000
2010 2015 2020 2025 2030 2035 2040 2045 2050
Capacity
(MW
)
NEM Coal Retirements
Historical and Forecast, by State and asset
Total Installed NSW QLD VIC SA
Source: AEMO, AER, Infigen analysis, correlation co-efficient 0.89.
0.0
2.0
4.0
6.0
8.0
10.0
12.0
0.00
20.00
40.00
60.00
80.00
100.00
120.00
140.00
Mar-
11
Ju
n-1
1
Se
p-1
1
Dec-1
1
Mar-
12
Ju
n-1
2
Se
p-1
2
Dec-1
2
Mar-
13
Ju
n-1
3
Se
p-1
3
Dec-1
3
Mar-
14
Ju
n-1
4
Se
p-1
4
Dec-1
4
Mar-
15
Ju
n-1
5
Se
p-1
5
Dec-1
5
Mar-
16
Ju
n-1
6
Se
p-1
6
Dec-1
6
Mar-
17
Ju
n-1
7
Se
p-1
7
Dec-1
7
Mar-
18
Ju
n-1
8
Se
p-1
8
Dec-1
8
Mar-
19
Ju
n-1
9
Se
p-1
9
Dec-1
9
ST
TM
ga
s p
rice
($
/GJ)
NE
M p
rice (
$/M
Wh)
Quarter ending
Correlation between NEM price and gas
price
Weighted NEM price Average NEM gas price
Summary
financial
accounts
Image: Smithfield OCGT, NSW
23
24
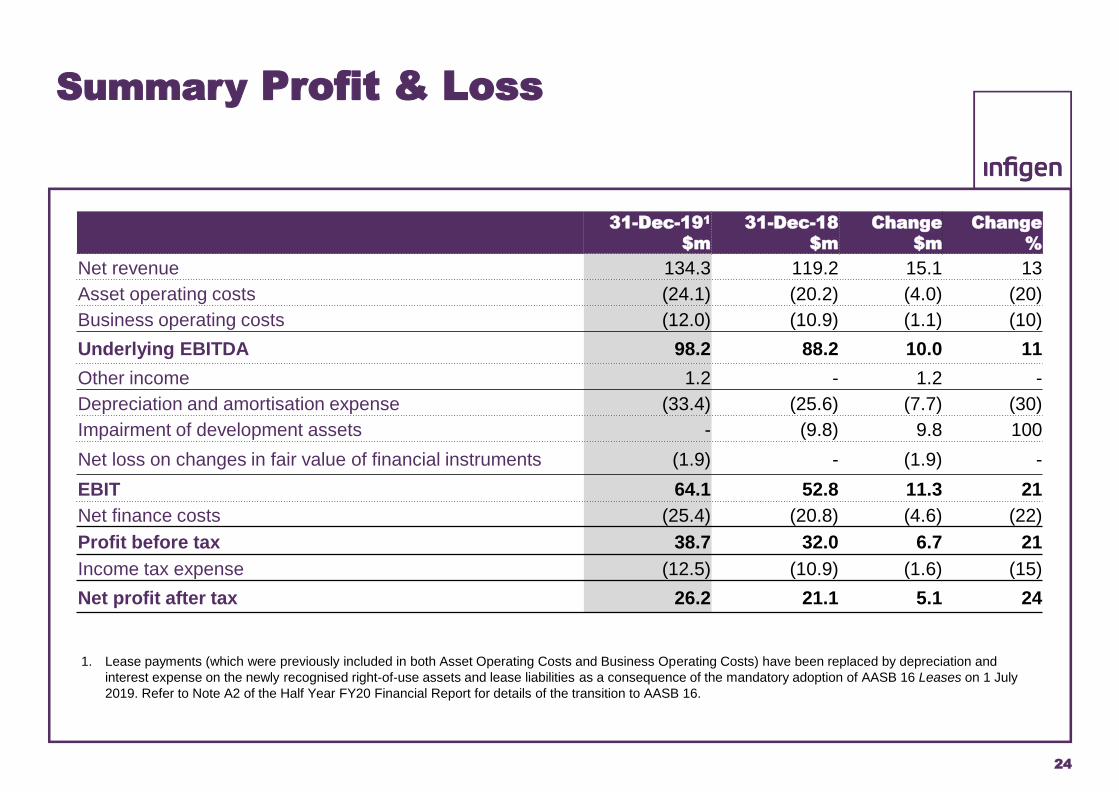
Summary Profit & Loss
31-Dec-191
$m
31-Dec-18
$m
Change
$m
Change
%
Net revenue 134.3 119.2 15.1 13
Asset operating costs (24.1) (20.2) (4.0) (20)
Business operating costs (12.0) (10.9) (1.1) (10)
Underlying EBITDA 98.2 88.2 10.0 11
Other income 1.2 - 1.2 -
Depreciation and amortisation expense (33.4) (25.6) (7.7) (30)
Impairment of development assets - (9.8) 9.8 100
Net loss on changes in fair value of financial instruments (1.9) - (1.9) -
EBIT 64.1 52.8 11.3 21
Net finance costs (25.4) (20.8) (4.6) (22)
Profit before tax 38.7 32.0 6.7 21
Income tax expense (12.5) (10.9) (1.6) (15)
Net profit after tax 26.2 21.1 5.1 24
1. Lease payments (which were previously included in both Asset Operating Costs and Business Operating Costs) have been replaced by depreciation and
interest expense on the newly recognised right-of-use assets and lease liabilities as a consequence of the mandatory adoption of AASB 16 Leases on 1 July
2019. Refer to Note A2 of the Half Year FY20 Financial Report for details of the transition to AASB 16.
25
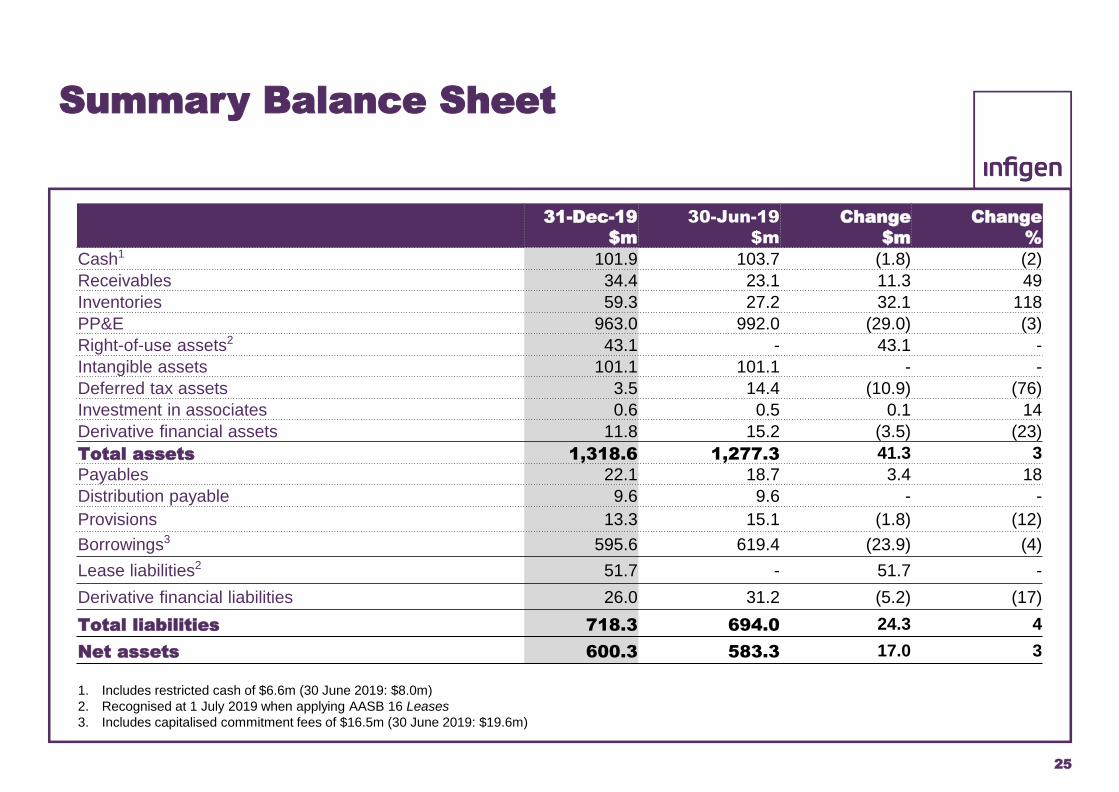
Summary Balance Sheet
31-Dec-19
$m
30-Jun-19
$m
Change
$m
Change
%
Cash1 101.9 103.7 (1.8) (2)
Receivables 34.4 23.1 11.3 49
Inventories 59.3 27.2 32.1 118
PP&E 963.0 992.0 (29.0) (3)
Right-of-use assets2 43.1 - 43.1 -
Intangible assets 101.1 101.1 - -
Deferred tax assets 3.5 14.4 (10.9) (76)
Investment in associates 0.6 0.5 0.1 14
Derivative financial assets 11.8 15.2 (3.5) (23)
Total assets 1,318.6 1,277.3 41.3 3
Payables 22.1 18.7 3.4 18
Distribution payable 9.6 9.6 - -
Provisions 13.3 15.1 (1.8) (12)
Borrowings3 595.6 619.4 (23.9) (4)
Lease liabilities2 51.7 - 51.7 -
Derivative financial liabilities 26.0 31.2 (5.2) (17)
Total liabilities 718.3 694.0 24.3 4
Net assets 600.3 583.3 17.0 3
1. Includes restricted cash of $6.6m (30 June 2019: $8.0m)
2. Recognised at 1 July 2019 when applying AASB 16 Leases
3. Includes capitalised commitment fees of $16.5m (30 June 2019: $19.6m)
26
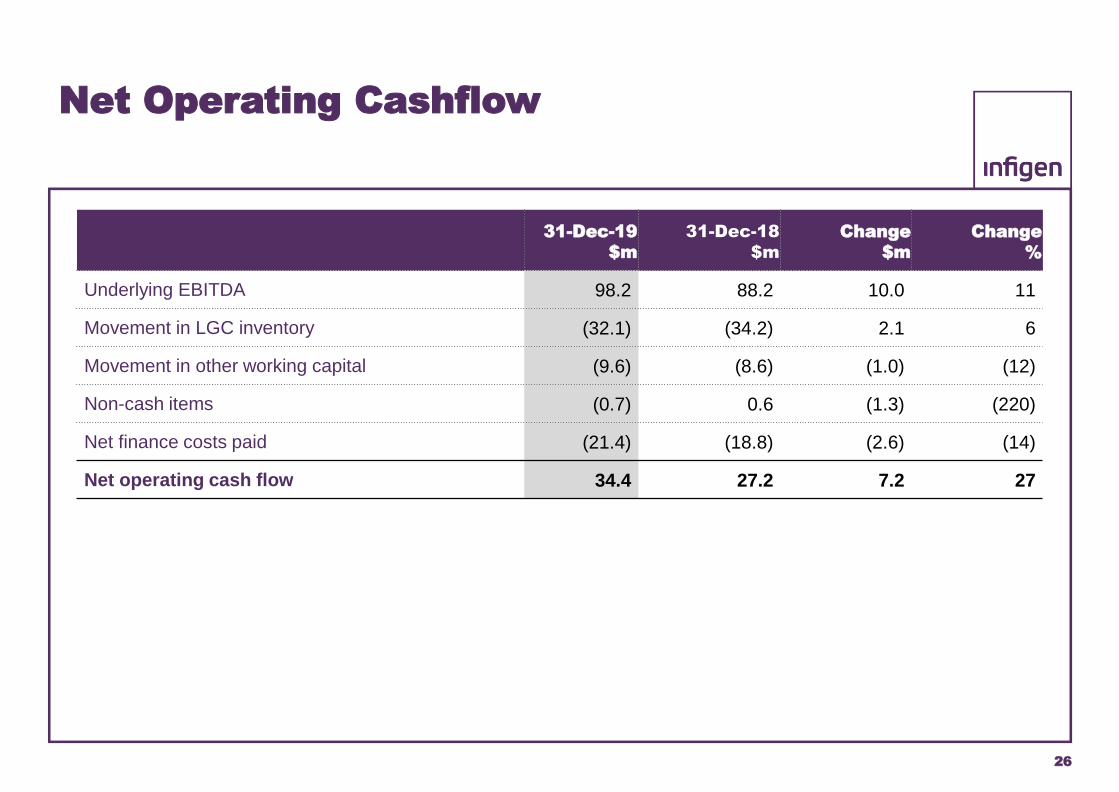
Net Operating Cashflow
31-Dec-19
$m
31-Dec-18
$m
Change
$m
Change
%
Underlying EBITDA 98.2 88.2 10.0 11
Movement in LGC inventory (32.1) (34.2) 2.1 6
Movement in other working capital (9.6) (8.6) (1.0) (12)
Non-cash items (0.7) 0.6 (1.3) (220)
Net finance costs paid (21.4) (18.8) (2.6) (14)
Net operating cash flow 34.4 27.2 7.2 27
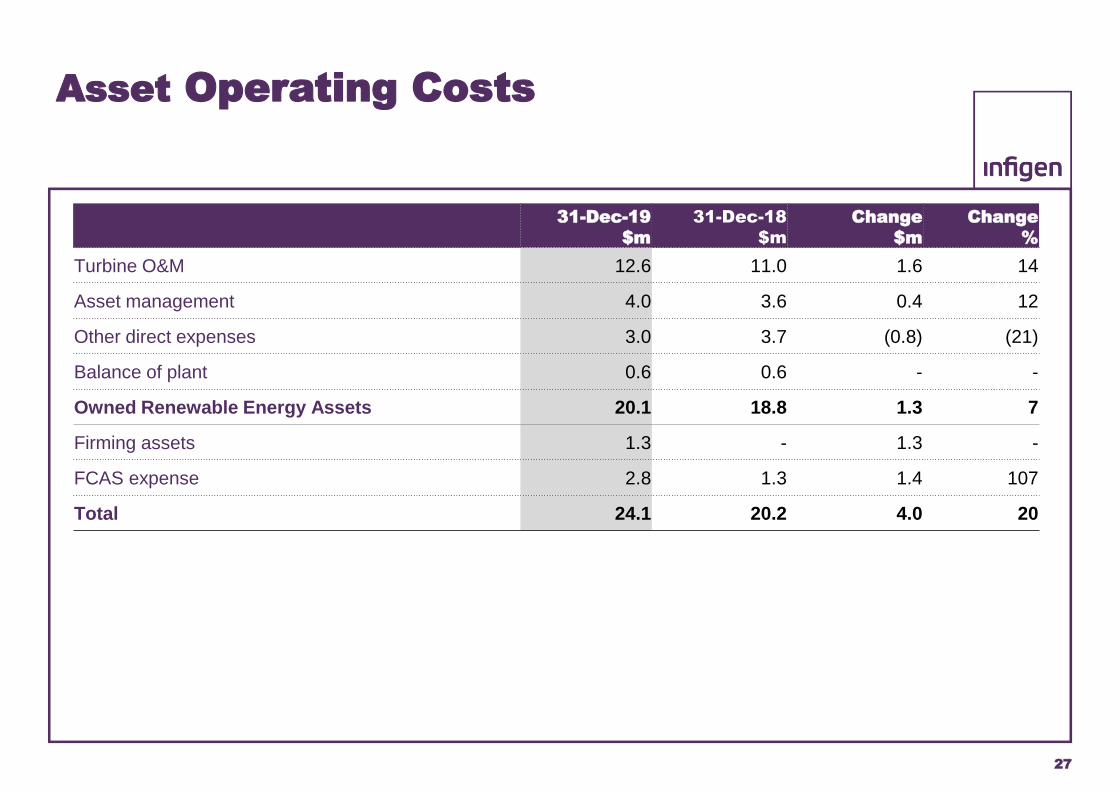
27
Asset Operating Costs
31-Dec-19
$m
31-Dec-18
$m
Change
$m
Change
%
Turbine O&M 12.6 11.0 1.6 14
Asset management 4.0 3.6 0.4 12
Other direct expenses 3.0 3.7 (0.8) (21)
Balance of plant 0.6 0.6 - -
Owned Renewable Energy Assets 20.1 18.8 1.3 7
Firming assets 1.3 - 1.3 -
FCAS expense 2.8 1.3 1.4 107
Total 24.1 20.2 4.0 20
About Infigen
Image: Alinta Wind Farm, WA 28
29
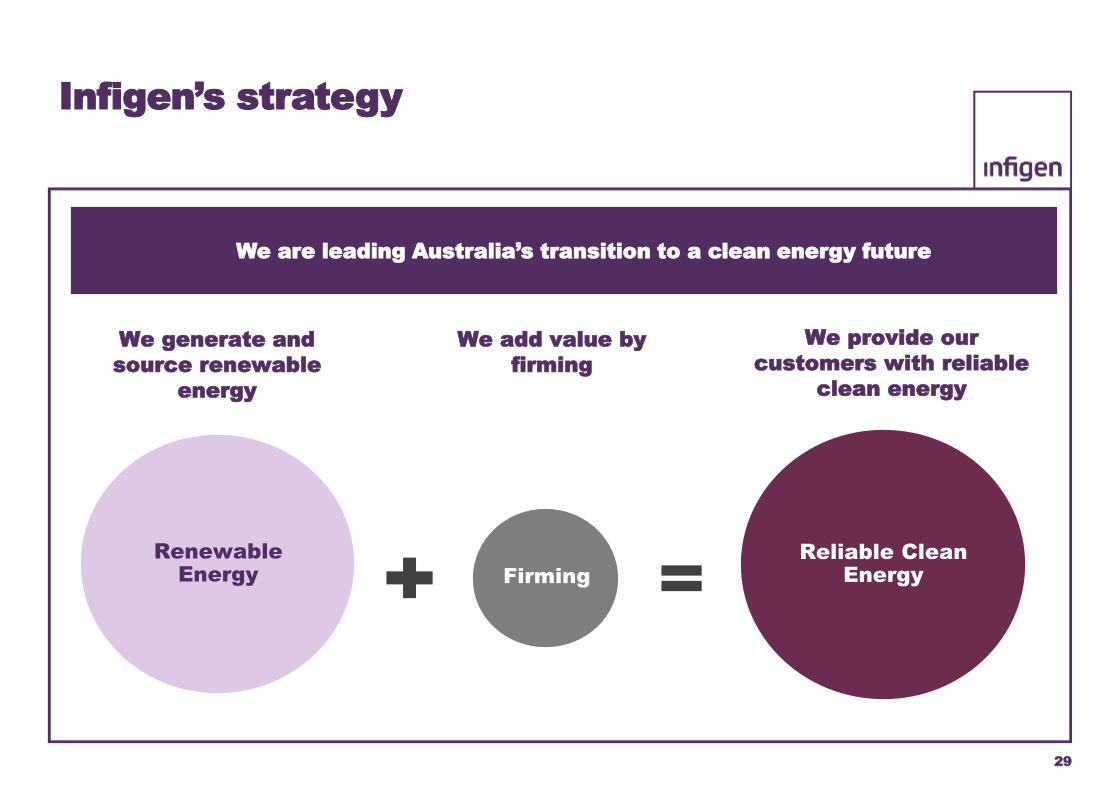
Renewable Energy Firming
Reliable Clean Energy
We generate and
source renewable
energy
We add value by
firming
We provide our
customers with reliable
clean energy
We are leading Australia’s transition to a clean energy future
Infigen’s strategy

30
Infigen’s Assets
Renewable Energy Assets
▪ 7 owned wind farms with
670MW capacity.
▪ 3 contracted wind farms with
110MW capacity once Cherry
Tree WF is completed.
▪ Development portfolio across
Australia.
Firming Assets
▪ Smithfield OCGT, a 123MW
fast-start generator in NSW.
▪ SA Battery, 25MW/52MWh
firming capacity in SA.
▪ South Australian Gas Turbines,
120MW fast start capacity, lease
begins May 2020.
Commercial and Industrial customers
▪ Serving our customers well is critical to our
success.
▪ We provide our C&I customers with reliable and
competitively priced clean energy.
31
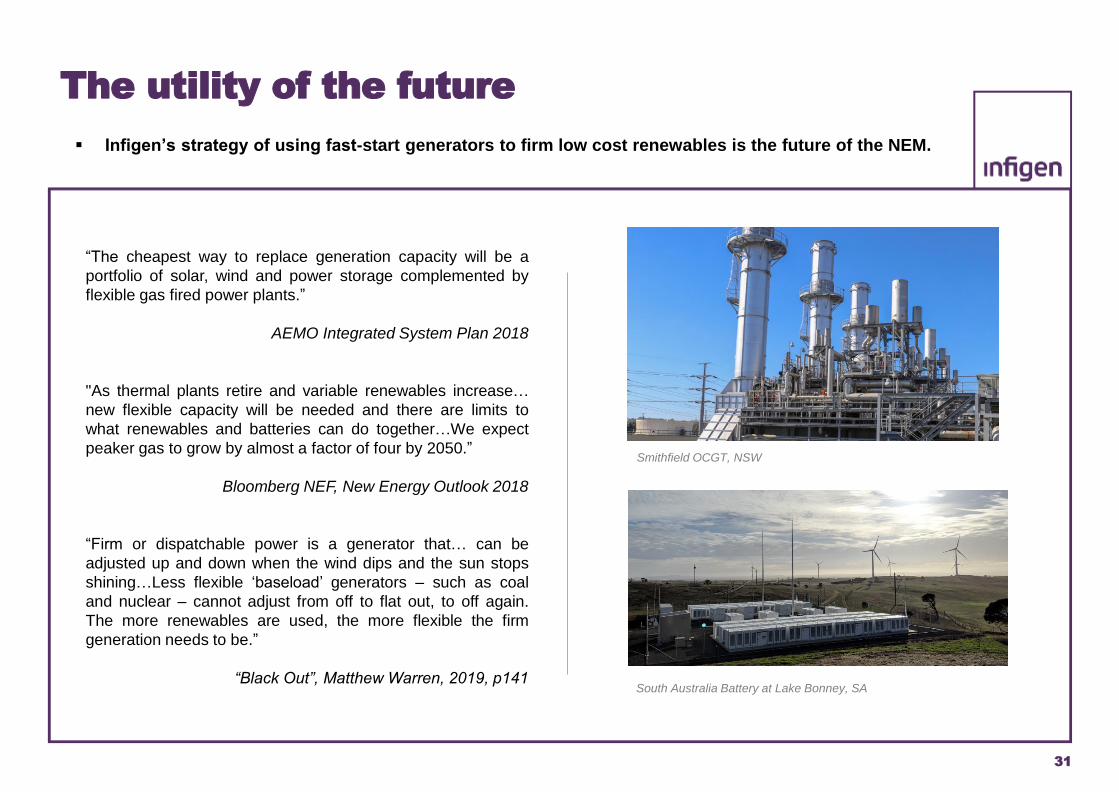
“The cheapest way to replace generation capacity will be a
portfolio of solar, wind and power storage complemented by
flexible gas fired power plants.”
AEMO Integrated System Plan 2018
"As thermal plants retire and variable renewables increase…
new flexible capacity will be needed and there are limits to
what renewables and batteries can do together…We expect
peaker gas to grow by almost a factor of four by 2050.”
Bloomberg NEF, New Energy Outlook 2018
“Firm or dispatchable power is a generator that… can be
adjusted up and down when the wind dips and the sun stops
shining…Less flexible ‘baseload’ generators – such as coal
and nuclear – cannot adjust from off to flat out, to off again.
The more renewables are used, the more flexible the firm
generation needs to be.”
“Black Out”, Matthew Warren, 2019, p141South Australia Battery at Lake Bonney, SA
Smithfield OCGT, NSW
The utility of the future
▪ Infigen’s strategy of using fast-start generators to firm low cost renewables is the future of the NEM.
32
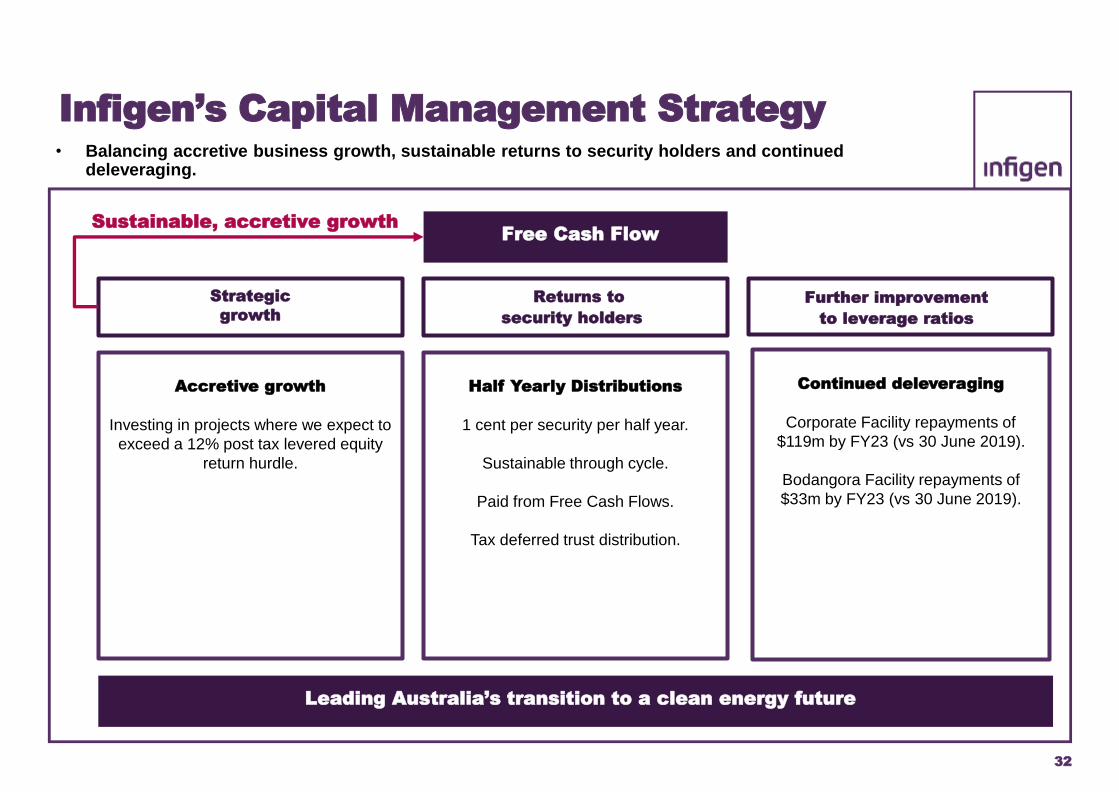
Infigen’s Capital Management Strategy
Free Cash FlowSustainable, accretive growth
Strategic
growthReturns to
security holders
Further improvement
to leverage ratios
Half Yearly Distributions
1 cent per security per half year.
Sustainable through cycle.
Paid from Free Cash Flows.
Tax deferred trust distribution.
Continued deleveraging
Corporate Facility repayments of
$119m by FY23 (vs 30 June 2019).
Bodangora Facility repayments of
$33m by FY23 (vs 30 June 2019).
Leading Australia’s transition to a clean energy future
• Balancing accretive business growth, sustainable returns to security holders and continued deleveraging.
Accretive growth
Investing in projects where we expect to
exceed a 12% post tax levered equity
return hurdle.
33
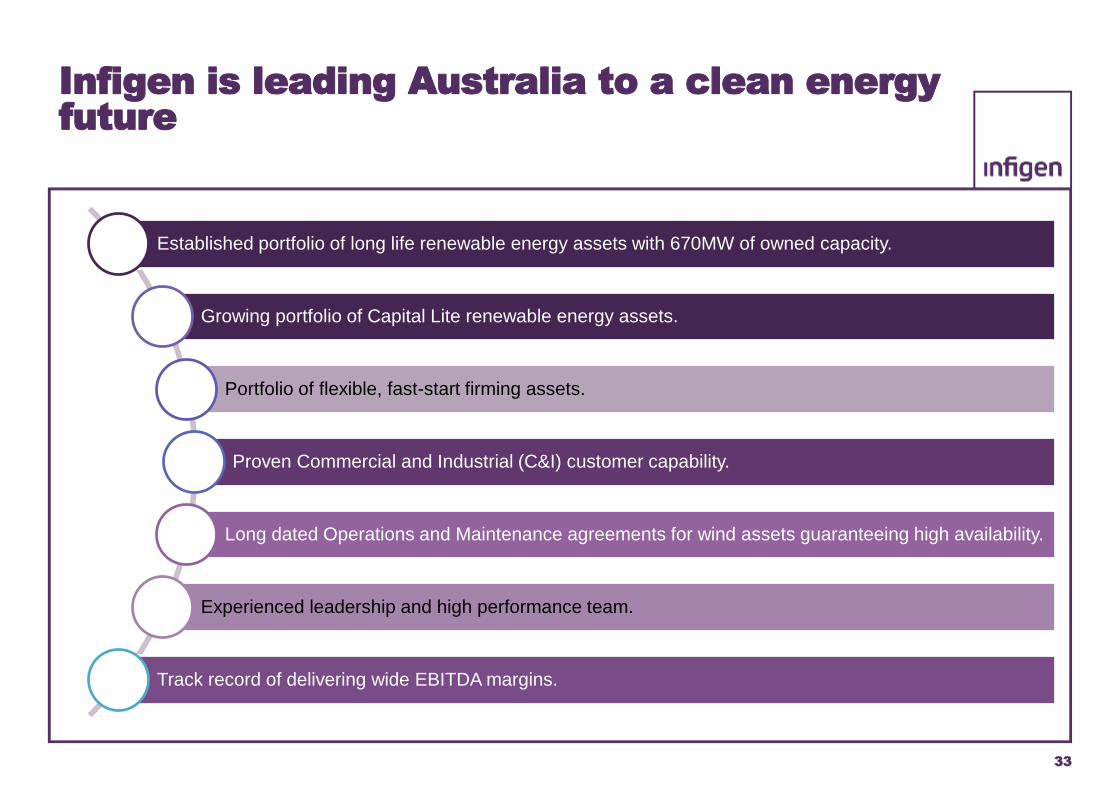
Infigen is leading Australia to a clean energy future
Established portfolio of long life renewable energy assets with 670MW of owned capacity.
Growing portfolio of Capital Lite renewable energy assets.
Portfolio of flexible, fast-start firming assets.
Proven Commercial and Industrial (C&I) customer capability.
Long dated Operations and Maintenance agreements for wind assets guaranteeing high availability.
Experienced leadership and high performance team.
Track record of delivering wide EBITDA margins.
34
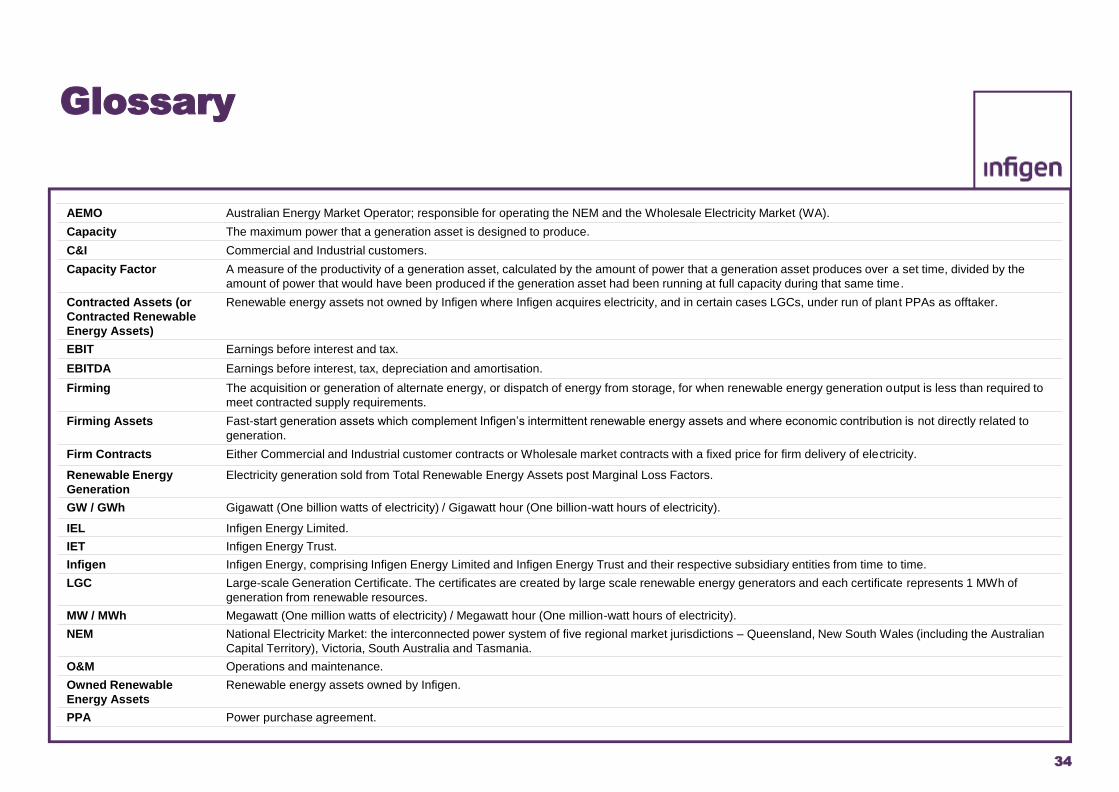
Glossary
AEMO Australian Energy Market Operator; responsible for operating the NEM and the Wholesale Electricity Market (WA).
Capacity The maximum power that a generation asset is designed to produce.
C&I Commercial and Industrial customers.
Capacity Factor A measure of the productivity of a generation asset, calculated by the amount of power that a generation asset produces over a set time, divided by the
amount of power that would have been produced if the generation asset had been running at full capacity during that same time.
Contracted Assets (or
Contracted Renewable
Energy Assets)
Renewable energy assets not owned by Infigen where Infigen acquires electricity, and in certain cases LGCs, under run of plant PPAs as offtaker.
EBIT Earnings before interest and tax.
EBITDA Earnings before interest, tax, depreciation and amortisation.
Firming The acquisition or generation of alternate energy, or dispatch of energy from storage, for when renewable energy generation output is less than required to
meet contracted supply requirements.
Firming Assets Fast-start generation assets which complement Infigen’s intermittent renewable energy assets and where economic contribution is not directly related to
generation.
Firm Contracts Either Commercial and Industrial customer contracts or Wholesale market contracts with a fixed price for firm delivery of electricity.
Renewable Energy
Generation
Electricity generation sold from Total Renewable Energy Assets post Marginal Loss Factors.
GW / GWh Gigawatt (One billion watts of electricity) / Gigawatt hour (One billion-watt hours of electricity).
IEL Infigen Energy Limited.
IET Infigen Energy Trust.
Infigen Infigen Energy, comprising Infigen Energy Limited and Infigen Energy Trust and their respective subsidiary entities from time to time.
LGC Large-scale Generation Certificate. The certificates are created by large scale renewable energy generators and each certificate represents 1 MWh of
generation from renewable resources.
MW / MWh Megawatt (One million watts of electricity) / Megawatt hour (One million-watt hours of electricity).
NEM National Electricity Market: the interconnected power system of five regional market jurisdictions – Queensland, New South Wales (including the Australian
Capital Territory), Victoria, South Australia and Tasmania.
O&M Operations and maintenance.
Owned Renewable
Energy Assets
Renewable energy assets owned by Infigen.
PPA Power purchase agreement.
35
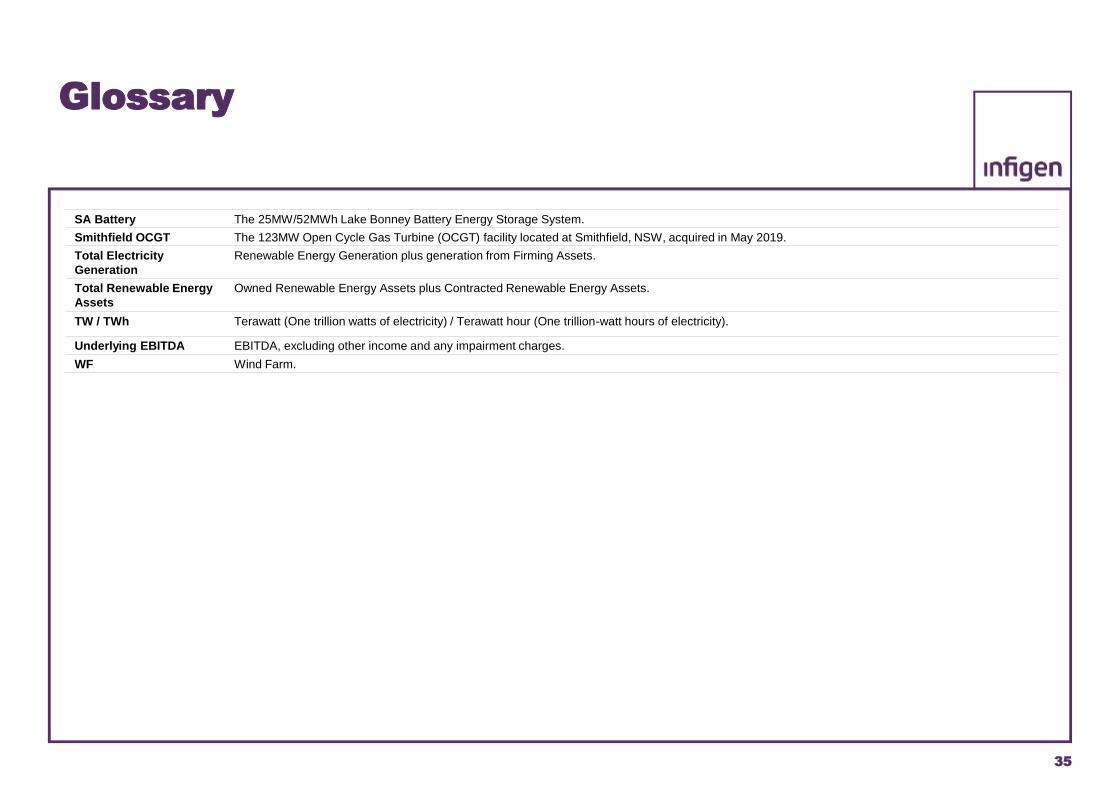
Glossary
SA Battery The 25MW/52MWh Lake Bonney Battery Energy Storage System.
Smithfield OCGT The 123MW Open Cycle Gas Turbine (OCGT) facility located at Smithfield, NSW, acquired in May 2019.
Total Electricity
Generation
Renewable Energy Generation plus generation from Firming Assets.
Total Renewable Energy
Assets
Owned Renewable Energy Assets plus Contracted Renewable Energy Assets.
TW / TWh Terawatt (One trillion watts of electricity) / Terawatt hour (One trillion-watt hours of electricity).
Underlying EBITDA EBITDA, excluding other income and any impairment charges.
WF Wind Farm.
36
Disclaimer
This publication is issued by Infigen Energy Limited (“IEL”) and Infigen Energy Trust (“IET”), with Infigen Energy RE Limited (“IERL”) as responsible entity of IET (collectively
“Infigen”). Infigen and its related entities, directors, officers and employees (collectively “Infigen Entities”) do not accept, and expressly disclaim, any liability whatsoever (including
for negligence) for any loss howsoever arising from any use of this publication or its contents. This publication is not intended to constitute legal, tax or accounting advice or
opinion.
No representation or warranty, expressed or implied, is made as to the accuracy, completeness or thoroughness of the content of this publication. The recipient should consult
with its own legal, tax or accounting advisers as to the accuracy and application of the information contained herein and should conduct its own due diligence and other
enquiries in relation to such information.
The information in this presentation has not been independently verified by the Infigen Entities. The Infigen Entities disclaim any responsibility for any errors or omissions in
such information, including the financial calculations, projections and forecasts. No representation or warranty is made by or on behalf of the Infigen Entities that any projection,
forecast, calculation, forward-looking statement, assumption or estimate contained in this presentation should or will be achieved. None of the Infigen Entities guarantee the
performance of Infigen, the repayment of capital or a particular rate of return on Infigen stapledsecurities.
IEL is not licensed to provide financial product advice. This publication is for general information only and does not constitute financial product advice, including personal
financial product advice, or an offer, invitation or recommendation in respect of securities, by IEL or any other Infigen Entities. Please note that, in providing this presentation,
the Infigen Entities have not considered the objectives, financial position or needs of the recipient. The recipient should obtain and rely on its own professional advice from its
tax, legal, accounting and other professional advisers in respect of the recipient’s objectives, financial position orneeds.
This presentation does not carry any right of publication. Neither this presentation nor any of its contents may be reproduced or used for any other purpose without the prior
written consent of the InfigenEntities.
IMPORTANT NOTICE
Nothing in this presentation should be construed as either an offer to sell or a solicitation of an offer to buy Infigen securities in the United States or any other jurisdiction.
Securities may not be offered or sold in the United States or to, or for the account or benefit of, US persons (as such term is defined in Regulation S under the US Securities
Act of 1933) unless they are registered under the Securities Act or exempt from registration.