Embed Size (px)
Citation preview
9 June 2011
Halfords Group plc Preliminary Results 2010/2011
A solid performance in a challenging environment Halfords Group plc, the UK’s leading retailer of automotive and leisure products and leading operator in garage servicing and auto repair, announces its Preliminary Results for the year to 1 April 2011. Group Financial Summary
FY 2011 FY 2010 %
Group Revenue £869.7m £831.6m +4.6%
Underlying Operating Profit1 £128.1m £119.7m +7.0%
Underlying Profit Before Tax1 £125.6m £117.1m +7.2%
Underlying Basic EPS1 43.2p 39.7p +8.8%
Statutory Profit Before Tax £118.1m £109.7m +7.7%
Statutory Basic EPS 40.7p 36.8p +10.6%
Net Debt £103.2m £155.5m -33.6%
Total Dividend 22.0p 20.0p +10.0% 1
Before non-recurring items. Financial highlights
Group revenue up 4.6%, following the first full year of the Autocentres integration
Underlying profit before tax up 7.2% driven by improved gross margin and strong cost control
Underlying earnings per share up 8.8% at 43.2p (FY10 39.7p)
Total dividend up 10% to 22.0p (FY10 20.0p).
Continued strong cash generation with net debt down £52.3m to £103.2m
£75m share buyback programme underway; c.£20.7m of cash returned to date Business Highlights
Resilient performance in Car Maintenance across the year
Strong growth in wefit jobs, a record 1.91m jobs during year
Significant growth in Halfords.com, now 9% of retail sales
Autocentres rebranded and relaunched with positive sales uplift
Substantial infrastructure progress through colleague scheduling and new DC
Completed exit from Central Europe to focus on UK/ROI opportunities Current Trading Within Retail the sales momentum in our leisure category developed during Q4 continued into FY12. Like-for-like (LfL) sales for the 9 weeks to 3 June were up 0.8%, driven by a strong performance in Leisure, up 11.1% LfL, offset by declines in Car Enhancement (-10.6%) and Car Maintenance (-3.0%). The timing of Easter benefited Retail sales over this period by c.1.5% LfL.
Autocentres sales were up 1.2% LfL over the same 9 week period driven by our marketing campaign that has increased consumer awareness and an improving trend in fleet. David Wild, Chief Executive, commented on the results: “This has been a challenging year for customers. Nonetheless we have increased profits through a clear focus on costs and margins. The Group has also made significant operational progress through the successful completion of change initiatives, including reconfiguration of the Group’s warehouses and distribution network, remodelling staffing structures and the rebranding and relaunch of our Autocentres business. Although these initiatives were achieved at some impact on sales during the transition period, they have enhanced customer service, reduced costs and provide a strong platform for our next phase of growth.
We are pleased with the positive trend in early weeks’ sales that benefited from good weather and the late Easter. While the tough trading environment is likely to continue, we seek to build on this momentum through our clear strategy that delivers value for customers by a combination of great prices, expert service and innovative products with appropriate margin investment. Our plans are supported by the launch of our new campaign “that’s helpful that’s halfords” which reinforces our unique service proposition. The strength of our cash generation and our balance sheet means that we can pay material dividends, return capital to our shareholders and retain flexibility. The Group’s progress reflects the continued hard work and contribution made by all colleagues. I would
like to thank them for their continued efforts.”
Notes: 1. Non-recurring costs for 2011 represent a provision of £7.5m in respect of potential liabilities
arising from lease guarantees provided by Halfords (prior to July 1989) to landlords who leased properties to Payless DIY (now part of Focus DIY). For 2010 the non-recurring charge relates to the exit costs associated with the closure of the Group's Central European operations.
2. Like-for-like sales represent revenues from stores trading for greater than 365 days. Where appropriate, revenues denominated in foreign currencies have been translated at constant rates of exchange.
Enquiries: Analysts: Halfords Group plc Andrew Findlay, Finance Director +44 (0) 1527 513047 Louise Richardson, Investor Relations +44 (0) 7843 367134 (on the day) +44 (0) 1527 513113 (thereafter) Media: Maitland Neil Bennett +44 (0) 207 379 5151 Richard Farnsworth +44 (0) 207 379 5151 Results presentation A presentation for analysts and investors will be held, today, 9 June 2011, at 9.30 a.m. at The City Presentation Centre, 4 Chiswell Street, London EC1Y 4UP. An audio recording of the presentation will be available on the corporate website later today. An interview with David Wild will be available on the Halfords corporate website later today and can be viewed by clicking on the following http://www.halfordscompany.com/hal/pr/video. Forthcoming Newsflow Halfords Group will provide a trading update on 21st July for the first quarter that will cover the 13 weeks to 1st July. Notes to Editors: www.halfords.co.uk www.halfordscompany.co.uk www.halfordsautocentres.co.uk Halfords Group plc
The Group is the UK’s leading retailer of automotive, leisure and cycling products and through Halfords Autocentres also the UK’s leading independent car servicing and repair operator. Halfords customers shop at 466 stores in the UK and Republic of Ireland and at halfords.com for pick-up at their local store or direct home delivery. Halfords Autocentres now operates from 242
sites nationally and offers motorists dealership quality MOTs, repairs and car servicing at affordable prices. Halfords employs approximately 11,000 staff and sells over 14,000 different product lines with significant ranges in car parts, cycles, in-car technology, child seats, roof boxes, outdoor leisure and camping equipment. Halfords own brands include the in-store Bikehut department, for cycles and cycling accessories, Apollo and Carrera cycles and exclusive UK distribution rights of the premium ranged Boardman cycles and accessories. In outdoor leisure, we sell a premium range of camping equipment, branded URBAN Escape. Halfords offers customers expert advice and a fitting service called "wefit" for car parts, child seats, satellite navigation and in-car entertainment systems, and a “werepair” service for cycles.
Cautionary Statement This report contains certain forward-looking statements with respect to the financial condition, results of operations, and businesses of Halfords Group plc. These statements and forecasts involve risk, uncertainty and assumptions because they relate to events and depend upon circumstances that will occur in the future. There are a number of factors that could cause actual results or developments to differ materially from those expressed or implied by these forward-looking statements. These forward-looking statements are made only as at the date of this announcement. Nothing in this announcement should be construed as a profit forecast. Except as required by law, Halfords Group plc has no obligation to update the forward-looking statements or to correct any inaccuracies therein.
CHAIRMAN’S STATEMENT
Financial year 2011 has seen an extended period of economic uncertainty and a fragile consumer market, a new Government in May 2010, an austerity budget in June and an increase in VAT to 20% in January 2011. Recognising this backdrop, management has focused on strengthening the core Halfords Retail division and on delivering its development plan for the recently acquired Autocentres business.
In Retail, revenue was down 5.2%, reflecting the tough trading environment, but operating profit rose by 1.5% (excluding Central Europe) due to both a margin expansion and costs being tightly managed. A number of significant change initiatives including the reconfiguration of the Group's warehouse and distribution network and the remodelling of staffing structures began to bear fruit, albeit after some disruption during the year, and the closure of our Central European operations was completed as scheduled. Our Autocentres business contributed £7 million operating profit in its first full year and, although below our initial target, we are pleased with this investment.
As a result, growth in both underlying profit before tax of 7.2% and in earnings per share of 8.8% was achieved. Importantly, cash generation was robust as is the Group’s financial position. This has enabled the Board to recommend a final dividend of 14 pence per share resulting in a total of 22 pence for the year, an increase of 10% over the dividend of 20 pence paid last year. The strength of the Group’s cash flows and financial position will enable the Board to ensure that shareholders continue to enjoy an attractive dividend distribution in the years ahead.
In November 2010, we secured a four year £300m revolving credit facility. This provides the Group with sufficient headroom and undrawn financing facilities to service its operating activities, working capital and on-going capital investment. In addition, in April 2011 we commenced a £75m share buyback programme. This reflects the Board’s policy of maintaining an efficient capital structure.
Halfords Retail maintains market-leading positions across a unique blend of product categories that are made available to customers via a truly national 466 store network and a highly responsive multichannel offer. To complement the product offer, store colleagues are charged with providing expert customer advice and delivering a suite of value-for-money wefit services. Dedication to this high service mantra for our customers is sacrosanct and non-negotiable.
Having acquired Nationwide Autocentres in February 2010, we embarked upon a re-branding of the entire network. This was concluded in March 2011 and was heralded by the launch of a new radio advertising campaign and revamped website. Since then, the boost in revenues has been most encouraging. The plan remains to open some 30 stores in FY12.
As the Group entrenches its reputation as the UK’s natural destination for “Life on the move”, products and services, we launched a consolidated national advertising campaign “that’s helpful that’s halfords”. The objective is to reinforce the service proposition that Halfords offers to its customers through a simple message.
At a time when the environment has been difficult for customers, David Wild, our Chief Executive Officer, and his experienced executive team have managed the business with vigour. They have adopted a trading strategy that offers great value, expert services and many new products, including the re-launch of our entire Premium Cycle range and the re-branding of the Halfords Autocentres, whilst maintaining a clear focus on cost control across the Group.
This year we welcomed to the Board, Claudia Arney, who provides the Board with broad multichannel experience, David Adams, with deep experience in retail and finance and who now chairs the Audit Committee, and Andrew Findlay as Finance Director with strong retail and finance credentials, latterly with Marks & Spencer. Nigel Wilson has stepped down from the board after seven years having been Audit Committee Chairman and latterly our SID. Nick Wharton, our previous Finance Director also left the board after four years as a director with Halfords. We wish them both well and thank them for their dedicated service.
The Board has endeavoured to provide strong entrepreneurial leadership and governance. We have met on a number of occasions outside the scheduled nine meeting calendar as the need arose to consider new opportunities and challenges. Each member is actively engaged in interacting frequently with the management and my key role as Chairman is to provide an open and challenging environment on the Board. Given the recent changes to the board, we decided to postpone our annual board review until late in the year to give the new members the opportunity to settle in to Halfords. We then undertook a more personalised Board evaluation process than in the past, the learning’s of which will be adopted in the year ahead.
On behalf of the Board, I would like to thank the 9,300 loyal and dedicated Halfords colleagues in the store network, head office and distribution centres who have responded so positively to the needs of our customers and to the many initiatives implemented this year. And also thanks to the 1,700 Autocentre staff who have performed so well in their first year as Halfords colleagues.
Since the beginning of the 2012 financial year, the underlying UK consumer environment has remained difficult though the unusually warm weather and proximity of numerous bank holidays in April resulted in a surge in retail spending. This was particularly evident in our Cycling and Travel Solutions categories on the back of an improving trend in the last quarter of FY11. Within Autocentres, the customer response to the re-branding has been heartening and the long-term growth opportunity of this business remains compelling. We have, however, drawn up our plans for the year ahead on the assumption of a challenging environment for the remainder of the year and will continue to pursue a strategy that further strengthens Halfords’ unique market-leading product, multichannel and service propositions.
Dennis Millard Chairman 8 June 2011
CHIEF EXECUTIVE’S REPORT Introduction The UK and ROI retail sector is going through one of the toughest times for many years. A combination of low economic growth, higher taxes and successive increases in VAT to 20% have reduced disposable income while higher raw material and fuel costs have put pressure on input prices.
Halfords’ response has been to do what we do best – to offer great value to our customers through the quality and price of our products and the expertise and service of our colleagues. In our Retail business we have also built sales through Halfords.com, made progress with our store portfolio refresh programme and significantly extended our wefit services. We have done this whilst managing costs sensibly and investing for the future. Our Autocentres business, acquired in February 2010, was rebranded during the year and is now positioned to leverage the Halfords brand in the automotive aftercare sector.
We completed the closure of our operations in Central Europe to focus on UK growth opportunities in the near term. Review of Trading In what has been a difficult trading year the Group generated a 7.2% increase in underlying PBT and continued cash generation for shareholders through good cost management and margin control with free cash flow of £54.7m, after paying dividends of £46.2m.
Group sales were £869.7m up 4.6% overall. This reflected the acquisition of our Autocentres business, which added £98.1m of sales to our Retail sales of £771.6m.
Within Retail, sales across the year on a like-for-like basis (“LfL”) averaged -5.5% as customers responded to the more challenging economic conditions. Our sales performance was also affected by some one-off factors like supply issues from the Far East following the Chinese New Year, reduced availability during the commissioning of our new Distribution Centre and the product balance in our bike range.
Car Maintenance had a solid performance growing by +0.6% LfL and a raise in market share. We saw strong sales during December’s severe winter weather when products like anti-freeze, de-icer and scrapers sold in record volumes.
Our wefit service has seen another year of strong growth. We now fit 23.5% of the bulbs, blades and batteries we sell, as more customers look to Halfords for expert help with basic car maintenance.
Car Enhancement suffered from the continued market contraction of Sat Nav and Audio. Halfords consistently gained share in a declining Sat Nav market across the year. Audio gained market share in the last three months, through better deals with branded suppliers and a focus on accessory sales.
In Leisure we again saw increases in the sales of tents and camping equipment and increased market share. Cycle sales were less buoyant, due in part to the range issues in the Spring/Summer and winter snow, that slowed sales pre-Christmas.
Halfords.com business has grown strongly across the year. Sales have increased by 36.4% and now represent 9.2% of total Retail sales. We have invested in better technology, site information and deals.
Sales at our Autocentres business were also affected by economic conditions and sales decreased by 0.6% LfL as drivers cut back on mileage and deferred some repair work. We also decided to delay our marketing spend until the completion of rebranding and refurbishment of the whole Autocentres estate so that we could advertise on a National basis. Since the relaunch of
the centres and a new Autocentres Website we have seen encouraging signs of increased customer awareness and sales.
Operational progress
While the sales performance has been challenging, this year has been a period of significant operational progress for the Group. Our major initiatives have enhanced customer service, reduced costs and established a solid platform for future growth.
We successfully reconfigured our distribution network with a new Distribution Centre at Coventry, equipped with state of the art logistics technology. Following some initial disruption, the new DC is now running smoothly and was a major contributor to the excellent availability of winter products in our stores pre-Christmas. The second element of our revised logistics network is our Redditch warehouse dedicated to cycles.
We also reorganised our store staff structure and rostering schedule and strengthened store management. This makes more staff available to serve customers during peak periods, provides a clearer career path for colleagues and brings savings in our overall cost of labour.
New Brand Campaign Our plans for the year ahead are supported by the launch of our new brand campaign “that’s helpful that’s halfords”. This reinforces our unique service proposition, demonstrates how we understand our customer’s needs and can help them live life on the move. These initiatives give us the potential to trade more strongly in the year ahead. RETAIL Our consistent strategy continues to provide a roadmap for the development of our retail business. Whilst the economic environment will remain tough in the year ahead, we remain confident that our leading positions in strong markets, and the continued development of our multichannel offer will continue to provide good opportunities for future growth, backed by active gross margin management and tight cost control. Our ongoing focus is to offer great value to our customers through the quality and price of our products and the expertise and service of our colleagues.
We will: 1. Extend our range and service advantage 2. Invest in our store portfolio 3. Continue to focus on cost control 4. Leverage the Halfords brand in multichannel
1. EXTENDING OUR RANGE AND SERVICE
Range Halfords Retail maintains market-leading positions across a unique blend of categories with ranges of unrivalled breadth and depth. Our scale provides a unique ability to develop and source high quality, own brand alternatives to branded ranges. These offer customers real value through innovative, high specification products at great prices and create a competitive advantage for Halfords. This programme complements the close association and exclusivity we have with many leading global manufacturers’ brands.
Halfords Apollo is the nation’s leading bike brand and this year we completely relaunched the range with 16 new models with stronger designs and a focus on the trend towards hybrid bikes for adults. In our Travel Solutions ranges we successfully launched a new exclusive brand of child seats called Pampero and a re-designed range of Exodus roof boxes. We developed and extended our camping range and were particularly successful with our Halfords and Urban
Escape branded tent packs. Meanwhile in Car Entertainment we were first movers in the development of a digital radio offering through the introduction of our new own brand Sonichi units. Looking to the year ahead, our focus on product innovation continues. We have launched a 2011 range of Boardman cycles, designed exclusively for Halfords in the UK by former Olympic Champion Chris Boardman. This completely new range of 17 models has already been widely acclaimed for its leading designs, construction and price competitiveness and is endorsed by world famous riders like Alistair Brownlee, the reigning World Triathlon champion. Halfords also has an exclusive arrangement to sell Voodoo bikes in the UK, designed by Joe Murray, the award- winning American mountain biker. This range offers a premium product to the serious mountain bike rider and we have introduced a new range for this year. Most of the bikes that we sell we also build for our customers. This year we are extending our range to include our Trax brand that is sold boxed for self assembly. This quality bike will be available at entry-level prices and gives Halfords a competitive offer against supermarkets and other non-specialist outlets. These innovations mean that Halfords is uniquely positioned to compete strongly at all levels of the cycle market from entry level boxed bikes to premium cycles for the competitive rider.
Extending our Service The expert knowledge, advice and service of our in-store colleagues are at the heart of the Halfords customer offer. They sell and fit many of our products and this differentiates Halfords from our competition, acts as a barrier to market entry and generates attractive levels of return. We build, 95% of the bikes we sell and all new bikes come with the offer of a free six-week first service. Sales of our Bike Care Plan, which provides repairs free of labour charges, increased by over 28.3% during the year and have contributed to a 16.3% increase in our service sales revenue. All product categories include a core service element; for instance, more than 2,000 colleagues are professionally trained and accredited by RoSPA to fit child seats to cars. The foundation of our fitting proposition though is wefit, the on-demand fitting of Car Bulbs, Windscreen Blades and Batteries, (3Bs), by our trained in-store colleagues. During the year some 1.91m wefit jobs were completed and 23.5% of all 3Bs we sold, we also fitted.
Our strategy is to grow awareness of our fitting capability and to continue to invest in technical and skills training of colleagues so that we can further increase fitting levels. We have set stretching targets for the year ahead to increase awareness, uptake and revenue from our service offer. Our colleagues, in all areas of our business, are of paramount importance to the provision of both our services and our helpfulness to customers. Their passion and abilities are central to the delivery of our strategic objectives and we are extremely proud of their commitment and enthusiasm. 2. INVESTING IN STORE PORTFOLIO The location, assortment and layout of the Halfords Retail store estate is a key element of our customer proposition. With 466 stores trading throughout the UK and Ireland our scale supports our position as the store of first choice. 90% of our customers live within a 20-minute journey of one of our stores. We have refurbished 26 stores with plans for 50 more in the next twelve months. The sales uplifts are encouraging and represent a good return on the invested capital. In London we are exploring new formats, reflecting the shortage of suitable superstore opportunities.
3. ONGOING FOCUS ON COST CONTROL We are committed to an on-going focus on cost control. This ensures efficient use of resources, the correct operating base for the prevailing economic environment and the headroom to fund strategic investments in future growth. Our three major initiatives this year included the reconfiguration of our distribution network, the review of our store labour structure and favourable negotiations with landlords. We have a flexible sourcing policy and work closely with suppliers around the globe to ensure we achieve the most competitive product costs. Our sourcing team based in Asia control all aspects of the supply chain to eliminate unnecessary costs in transport, shipping and stock holding. Looking to the year ahead, payroll, energy and occupancy costs are expected to increase the underlying cost base by around 2.5%. Planned investments in incentives and IT infrastructure will add a further 1.5%. Product cost pressures are increasing, but our market leading positions and sourcing options provide some flexibility. 4. LEVERAGING THE HALFORDS BRAND IN MULTICHANNEL Online sales have grown rapidly during the year by 36.4%, well ahead of the industry average of 19.9%. Online sales currently represent approximately 9.2% of Halfords Retail sales.
We have made enhancing our online offer and further extending our multichannel presence an investment priority. In line with market trends, we continue to increase the amount of advertising dedicated to this medium. This year customers have also added 26,000 ratings and reviews, which together with our “Ask and Answer” facility allows customers to tap into the expertise and experience of other users.
In addition to extending the site functionality, we have increased the range of products we offer online. Much of the additional inventory is managed in partnership with 3
rd party suppliers; this
reduces stock costs and obsolescence risk.
Our strategy is to seamlessly integrate halfords.com and our store operations. Our product mix lends itself to this strategy, as customers often want further advice, or a demonstration and fitting. Our online ordering service offers customers the option of direct delivery or to reserve and collect items at their local store. 85% of online transactions are collected in store. This ability to add further expert advice and service to our online mix gives Halfords a differentiated offer and a competitive advantage.
AUTOCENTRES
This has been a year of significant progress and integration since we acquired the business in February 2010. We carried out detailed customer research on how to apply the Halfords brand into the auto servicing market and then rebranded and refurbished the whole estate of 240 service centres as Halfords Autocentres in a rolling programme across the year.
Since rebranding was completed we have been actively promoting Halfords Autocentres through a national radio campaign and online marketing with encouraging results.
Halfords Autocentres is an excellent complement to Halfords Retail, building on our growing car parts and wefit service business. Car aftercare is a large and highly attractive market with a value of £9bn. Capacity is shrinking as the number of independent garages declines leading to increasing demand from motorists for a reliable, quality independent operator.
The long-term growth opportunity of this business remains compelling given the market size, its fragmentation, the strength of the Halfords Autocentres proposition and the potential to leverage the Halfords brand. During the year we also opened 16 new centres, 30 new centres are targeted in FY12 and in the medium term we believe there is an opportunity to open up to 600 centres
nationally. Further growth opportunities exist from fleet customers and accelerating tyre sales. Benefits of the operational gearing of the Autocentres business are expected as sales improve, supported by cost and purchasing synergies.
Summary and outlook Halfords retains clear leadership in its core retail markets of cycling and car maintenance. We are a resilient business with an excellent brand and have adapted to the changing needs of our customers by creating innovative, quality products at great prices supported by the expertise and service of colleagues.
We believe Halfords unique, market-leading positions provide strong potential for us to consolidate further the fragmented markets in which we operate. Our Autocentres business gives us a market leading position in a large and unconsolidated market and opens another exciting avenue of growth for Halfords.
We expect the consumer environment to remain challenging, but we have demonstrated that our business can make good progress in these conditions. Our market leading positions, ongoing actions to reduce costs and strong cash flow characteristics provide a solid platform for medium term growth through our core strategic growth initiatives.
Through this focus on creating value for our customers and active management of the business, the Board believes the Group is well positioned for the year ahead. This has been a demanding year for the business and our colleagues have risen to the challenges of the year with energy and determination. It is a pleasure to lead such a great team of people and I would like to thank them for their adaptability and hard work in the tough environment in which we currently operate. David Wild Chief Executive Officer 8 June 2011
FINANCE DIRECTOR’S REPORT Halfords Group plc (“the Group” or “Group”) All references to Group represent the consolidation of the Halfords (“Halfords Retail”/”Retail”) and Halfords Autocentres (“Halfords Autocentres”/”Autocentres”) trading entities. The Halfords Group operates through two reportable segments or strategic business units – “Retail” and “Car Servicing” in the United Kingdom (UK) and the Republic of Ireland (ROI).
Financial results The 2011 accounting period represents trading for the 52 weeks to 1 April 2011. The comparative 2010 period represented the 52 weeks to 2 April 2010 for Halfords Retail, and the 44 days post acquisition period for Halfords Autocentres. Group revenue in 2011 was £869.7m, comprising Retail revenue of £771.6m and Autocentres revenue of £98.1m. This compares to 2010 Group revenue of £831.6m (Retail £818.1m; Autocentres £13.5m). Group gross profit at £485.0m (2010: £452.7m) represented 55.8% of revenue (2010: 54.4%) reflecting an uplift in Retail of 17 basis points (“bps”) and a full year of ownership of the Autocentres business which generated 66.3% gross margin. Total operating costs before non-recurring items increased to £356.9m (2010: £333.0m) of which Retail represented £296.7m (2010: £324.4m) and Autocentres £58.0m (2010: £8.3m). Central unallocated expenses of £2.2m (2010: £0.3m) represent the amortisation charge in respect of intangible assets from the acquisition of Nationwide Autocentres in February 2010, which arise on consolidation of the Group results. A non-recurring expense of £7.5m was provided in the year. This expense relates to the creation of a provision for the potential liabilities arising from lease guarantees provided by Halfords prior to July 1989. An estimate of the potential liability relating to these guarantees was previously disclosed as a contingent liability in the interim financial statements. The guarantees were provide to landlords of properties leased by Payless DIY (now part of Focus DIY) when both Halfords and Payless DIY were under the ownership of the Ward White Group. Focus DIY entered into administration in May 2011. Non-recurring expenses of £7.4m were incurred in 2010 relating to the closure of the Group’s seven-store pilot within Central Europe. Underlying profit before tax and non-recurring items was up 7.2% to £125.6m (2010: £117.1m). Profit before tax after non-recurring items was up 7.7% to £118.1m (2010: £109.7m). Halfords Retail Before non-recurring costs £m 2011 2010 UK/ROI Central Total UK/ROI Central Total Europe Europe Sales 769.7 1.9 771.6 812.2 5.9 818.1 Gross Profit 419.9 0.1 420.0 441.7 2.1 443.8 Costs (296.2) (0.5) (296.7) (319.8) (4.6) (324.4) Operating Profit 123.7 (0.4) 123.3 121.9 (2.5) 119.4
Revenue for the UK/ROI business of £769.7m reflected a total sales decline of 5.2%, with a like for like sales decline of 5.5%, partially offset by £1.2m of revenue from new space. The negative impact of Easter timing on 2011 sales was around 0.6%. By category, Car Maintenance revenues were up 0.2%, whilst the more discretionary categories of Car Enhancement and Leisure were down -12.7% and -3.5% respectively. The relative split of revenues between Car Maintenance, Car Enhancement and Leisure categories was 31.4%: 28.4%: 40.2% (2010: 29.6%: 30.7%: 39.7%).
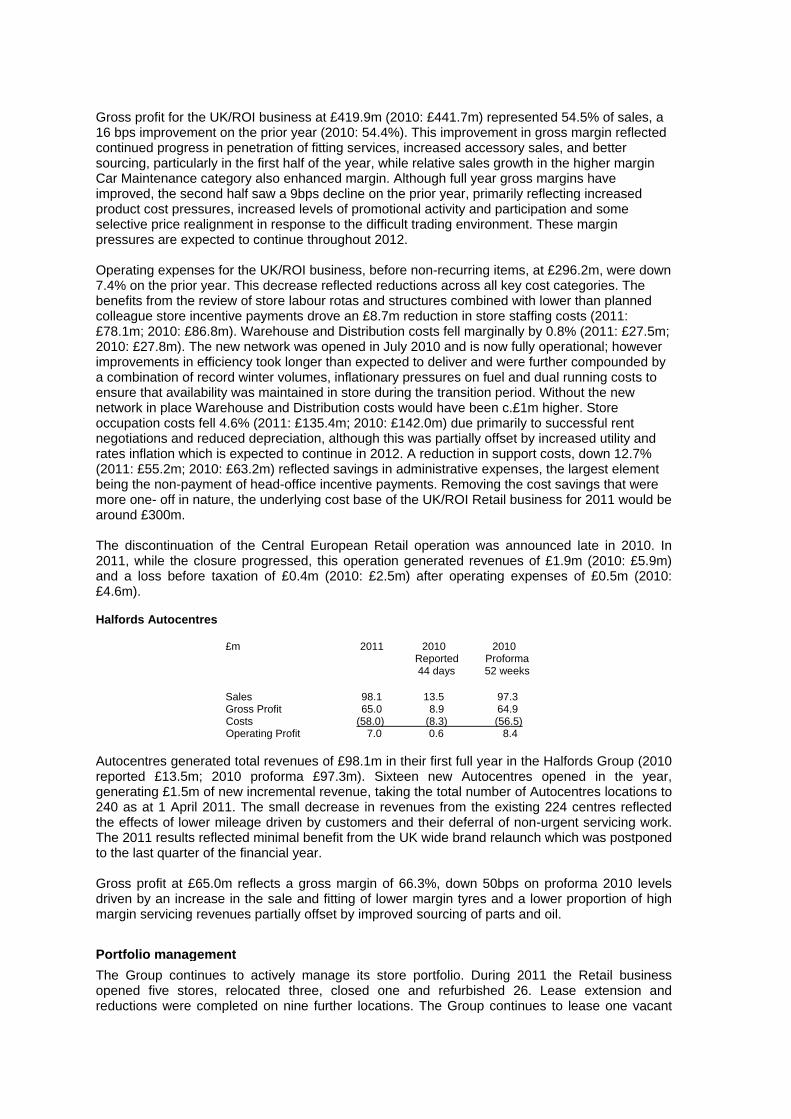
Gross profit for the UK/ROI business at £419.9m (2010: £441.7m) represented 54.5% of sales, a 16 bps improvement on the prior year (2010: 54.4%). This improvement in gross margin reflected continued progress in penetration of fitting services, increased accessory sales, and better sourcing, particularly in the first half of the year, while relative sales growth in the higher margin Car Maintenance category also enhanced margin. Although full year gross margins have improved, the second half saw a 9bps decline on the prior year, primarily reflecting increased product cost pressures, increased levels of promotional activity and participation and some selective price realignment in response to the difficult trading environment. These margin pressures are expected to continue throughout 2012. Operating expenses for the UK/ROI business, before non-recurring items, at £296.2m, were down 7.4% on the prior year. This decrease reflected reductions across all key cost categories. The benefits from the review of store labour rotas and structures combined with lower than planned colleague store incentive payments drove an £8.7m reduction in store staffing costs (2011: £78.1m; 2010: £86.8m). Warehouse and Distribution costs fell marginally by 0.8% (2011: £27.5m; 2010: £27.8m). The new network was opened in July 2010 and is now fully operational; however improvements in efficiency took longer than expected to deliver and were further compounded by a combination of record winter volumes, inflationary pressures on fuel and dual running costs to ensure that availability was maintained in store during the transition period. Without the new network in place Warehouse and Distribution costs would have been c.£1m higher. Store occupation costs fell 4.6% (2011: £135.4m; 2010: £142.0m) due primarily to successful rent negotiations and reduced depreciation, although this was partially offset by increased utility and rates inflation which is expected to continue in 2012. A reduction in support costs, down 12.7% (2011: £55.2m; 2010: £63.2m) reflected savings in administrative expenses, the largest element being the non-payment of head-office incentive payments. Removing the cost savings that were more one- off in nature, the underlying cost base of the UK/ROI Retail business for 2011 would be around £300m. The discontinuation of the Central European Retail operation was announced late in 2010. In 2011, while the closure progressed, this operation generated revenues of £1.9m (2010: £5.9m) and a loss before taxation of £0.4m (2010: £2.5m) after operating expenses of £0.5m (2010: £4.6m). Halfords Autocentres £m 2011 2010 2010 Reported Proforma 44 days 52 weeks
Sales 98.1 13.5 97.3 Gross Profit 65.0 8.9 64.9 Costs (58.0) (8.3) (56.5) Operating Profit 7.0 0.6 8.4
Autocentres generated total revenues of £98.1m in their first full year in the Halfords Group (2010 reported £13.5m; 2010 proforma £97.3m). Sixteen new Autocentres opened in the year, generating £1.5m of new incremental revenue, taking the total number of Autocentres locations to 240 as at 1 April 2011. The small decrease in revenues from the existing 224 centres reflected the effects of lower mileage driven by customers and their deferral of non-urgent servicing work. The 2011 results reflected minimal benefit from the UK wide brand relaunch which was postponed to the last quarter of the financial year. Gross profit at £65.0m reflects a gross margin of 66.3%, down 50bps on proforma 2010 levels driven by an increase in the sale and fitting of lower margin tyres and a lower proportion of high margin servicing revenues partially offset by improved sourcing of parts and oil.
The Group continues to actively manage its store portfolio. During 2011 the Retail business opened five stores, relocated three, closed one and refurbished 26. Lease extension and reductions were completed on nine further locations. The Group continues to lease one vacant
Portfolio management
property which is being actively marketed. Within Autocentres, 16 new centres were opened and two centres were relocated in the period.
With the exception of nine long leasehold and two freehold properties within Autocentres, the Group’s operating sites are occupied under operating leases, the majority of which are on standard lease terms, typically with a 5 to 15-year term at inception. The Group has a total commitment under non-cancellable operating leases of £737.9m (2010: £811.5m). Finance expense Net finance expense was £2.5m (2010: £2.6m). The lower expense in the period included £0.9m of interest income relating to the settlement of amounts due from HMRC, and 4.5 months of interest expense and charges under the new revolving credit facility in place since 12 November 2010. Average net bank borrowings were marginally higher than last year reflecting the acquisition of Nationwide close to the prior year end. The costs of forward exchange contracts were £0.3m higher than last year. Taxation The taxation charge on profit for the financial year was £32.6m (2010: £32.7m), including a £2.1m credit (2010: £1.4m) in respect of the tax on non-recurring items, and represents a full year effective tax rate of 27.6% (2010: 29.8%). The effective tax rate of 27.6% differs from the UK corporation tax rate (28%) principally due to the non-deductibility of depreciation charged on capital expenditure and the reassessment of anticipated future tax deductions from employee share schemes offset by a reassessment of historic tax provisions required against tax uncertainties. Earnings per share (“EPS”) Basic EPS before non-recurring items was 43.2 pence (2010: 39.7 pence), an 8.8% increase on the prior year. Basic EPS for the period was 40.7 pence (2010: 36.8 pence), a 10.6% increase. Dividend The Board is recommending a final dividend of 14 pence per share (2010: 14 pence), which, in addition to the interim dividend of 8 pence per share (2010: 6 pence), generates a total dividend of 22 pence, an increase of 10% on 2010 (20 pence). In line with the Board’s intention, communicated in November 2010, to increase over time the proportion of the full year dividend represented by the interim dividend to approximately 40%, the split of the total dividend between interim and final dividend has moved to 36:64 in 2011 from 30:70 in 2010. Given Halfords strong cash generative characteristics the Board will maintain a progressive dividend policy whilst targeting dividend cover of broadly 2 times earnings over the medium term. Subject to shareholder approval at the Annual General Meeting the final dividend will be paid on 5 August 2011 to shareholders on the register at the close of business on 1 July 2011. Capital expenditure Capital investment in the period totalled £22.8m (2010: £20.4m) comprising £16.6m in Retail and £6.2m in Autocentres. Consistent with prior periods, management have continued to adopt a prudent approach with regard to capital investment. During 2011 the Group invested £14.6m in its property portfolio (2010: £7.4m), including £8.4m within Retail and £6.2m to drive the Autocentres roll out plan and the rebranding of the Autocentres sites under the Halfords banner. Systems to support the Retail business and its online customer proposition attracted £1.3m of investment. This is an increasing area of focus within the business and investment in business systems and the web proposition will continue into 2012. The completion of the National Distribution Centre project in 2011 resulted in £3.4m of capital expenditure during the year.
Operating leases
Inventories Group stock inventory held at 1 April 2011 was £147.6m (2 April 2010: £138.5m), up 6.6% on the prior year. Lower cycle sales over the Christmas period, a late Easter in 2011, earlier stock fulfilment to avoid prior year stock outs as a result of Chinese New Year and stock build in advance of Spring and Summer 2011 product launches to ensure enhanced store availability, contributed to this increase. The management of inventory remains a key area of focus for the Retail business while the Autocentres business model is such that only small levels of inventory are held within the centres with most parts being acquired on an as-needed basis. Cash flow and borrowings The Group has continued its strong track record of cash generation. Net cash generated from operating activities in 2011 was £118.4m (2010: £148.1m). Free cash flow of £54.7m is after taking into account taxation, dividends, shares issues, capital expenditure and net finance costs. Total net bank debt at 1 April 2011 was £91.4m (2 April 2010: £143.5m) while further borrowings of £11.8m (2010: £12.0m) in respect of the Head Office finance lease resulted in Group net debt at 1 April 2011 of £103.2m (2 April 2010: £155.5m). At this level, net debt to EBITDA (Earnings before non-recurring items, finance expense, depreciation and amortisation) was 0.7 times (2 April 2010 1.0 times).
On 5 November 2010 the Group signed a new revolving credit facility agreement (the new facility) amounting to £300m. The new facility replaced the Group’s existing facilities and runs until 12 November 2014 extendable by a further year to 12 November 2015. Associated refinancing costs incurred totalled £3.6m, which will be amortised over the 4-year life of the new facility. The Board is committed to continued investment in the growth of the business, both through organic development and other business development opportunities as they might arise. The new facility gives the enlarged Group the appropriate level of committed financing for its working capital needs. Following a review by the Board of the Group’s capital structure and cash generation capabilities, with effect from 7
April 2011 the Group commenced a share buyback programme, with the
intention to return up to £75m of cash to shareholders over the following 12 months. Since the financial year end, approximately £20.7 million of buyback has taken place via the purchase of 5.3 million shares. Andrew Findlay Group Finance Director 8 June 2011
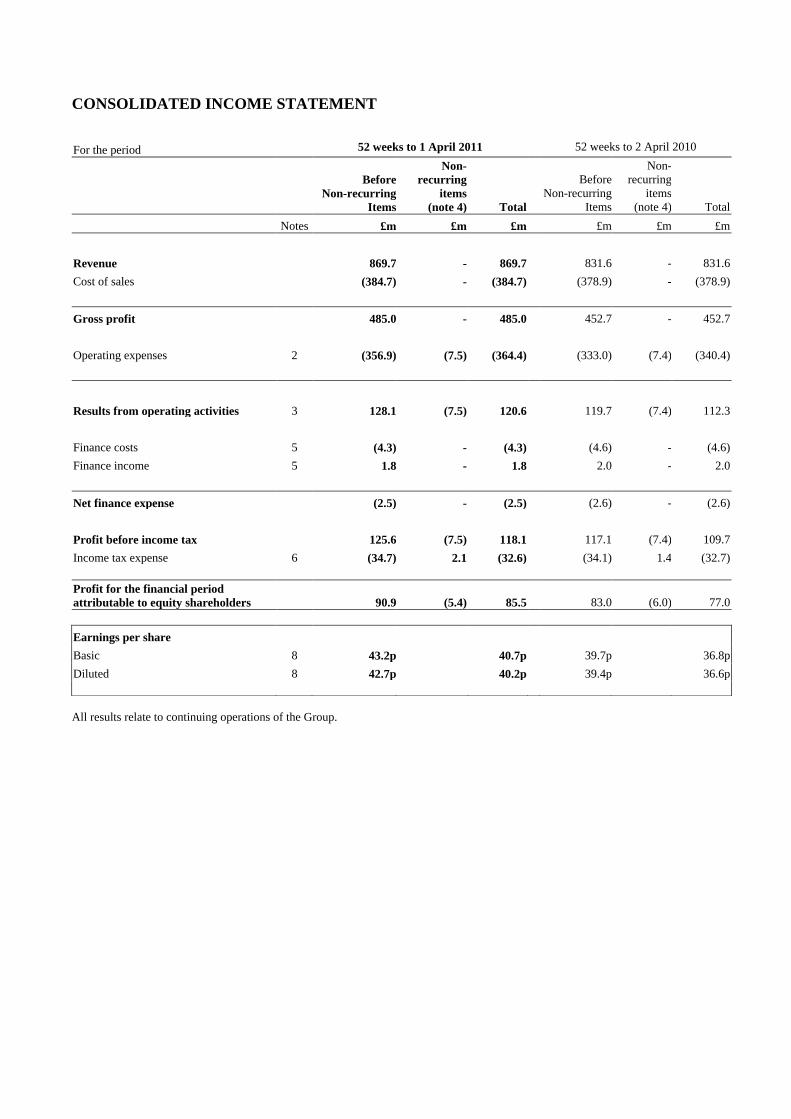
CONSOLIDATED INCOME STATEMENT
All results relate to continuing operations of the Group.
For the period 52 weeks to 1 April 2011 52 weeks to 2 April 2010
Before
Non-recurring
Items
Non-
recurring
items
(note 4) Total
Before
Non-recurring
Items
Non-
recurring
items
(note 4) Total
Notes £m £m £m £m £m £m
Revenue 869.7 - 869.7 831.6 - 831.6
Cost of sales (384.7) - (384.7) (378.9) - (378.9)
Gross profit 485.0 - 485.0 452.7 - 452.7
Operating expenses 2 (356.9) (7.5) (364.4) (333.0) (7.4) (340.4)
Results from operating activities 3 128.1 (7.5) 120.6 119.7 (7.4) 112.3
Finance costs 5 (4.3) - (4.3) (4.6) - (4.6)
Finance income 5 1.8 - 1.8 2.0 - 2.0
Net finance expense (2.5) - (2.5) (2.6) - (2.6)
Profit before income tax 125.6 (7.5) 118.1 117.1 (7.4) 109.7
Income tax expense 6 (34.7) 2.1 (32.6) (34.1) 1.4 (32.7)
Profit for the financial period
attributable to equity shareholders 90.9 (5.4) 85.5 83.0 (6.0) 77.0
Earnings per share
Basic 8 43.2p 40.7p 39.7p 36.8p
Diluted 8 42.7p 40.2p 39.4p 36.6p
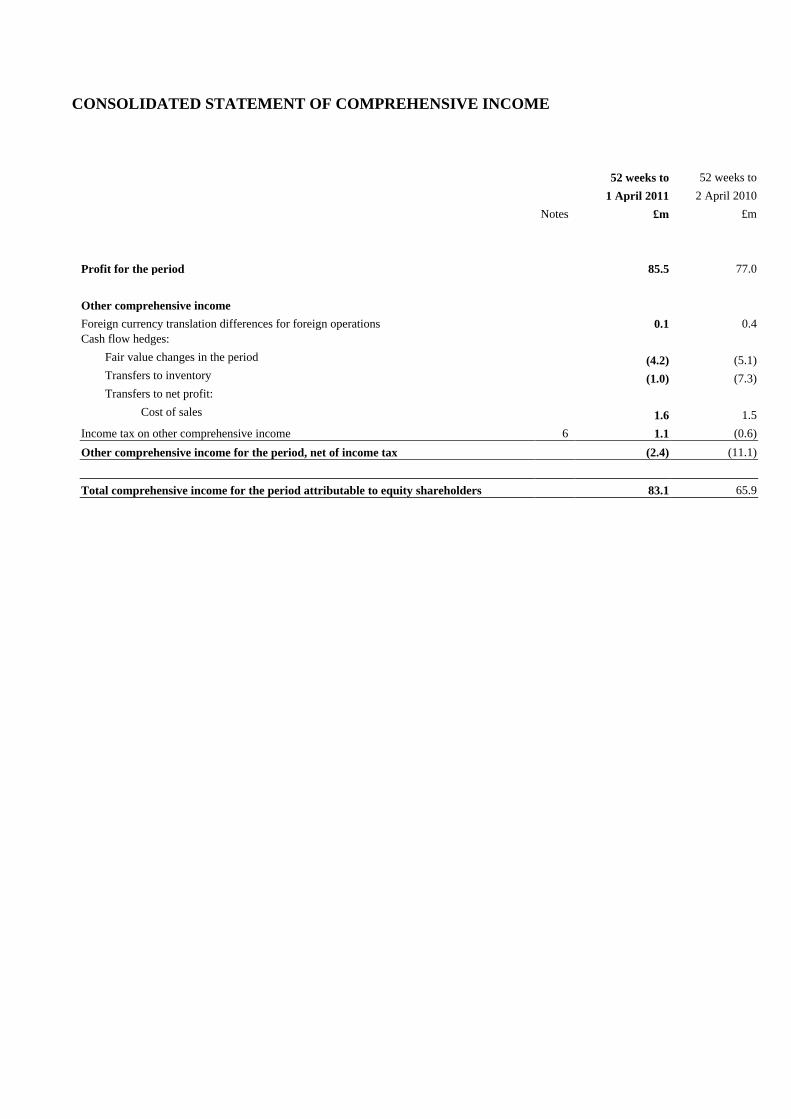
CONSOLIDATED STATEMENT OF COMPREHENSIVE INCOME
52 weeks to 52 weeks to
1 April 2011 2 April 2010
Notes £m £m
Profit for the period 85.5 77.0
Other comprehensive income
Foreign currency translation differences for foreign operations 0.1 0.4
Cash flow hedges:
Fair value changes in the period (4.2) (5.1)
Transfers to inventory (1.0) (7.3)
Transfers to net profit:
Cost of sales 1.6 1.5
Income tax on other comprehensive income 6 1.1 (0.6)
Other comprehensive income for the period, net of income tax (2.4) (11.1)
Total comprehensive income for the period attributable to equity shareholders 83.1 65.9
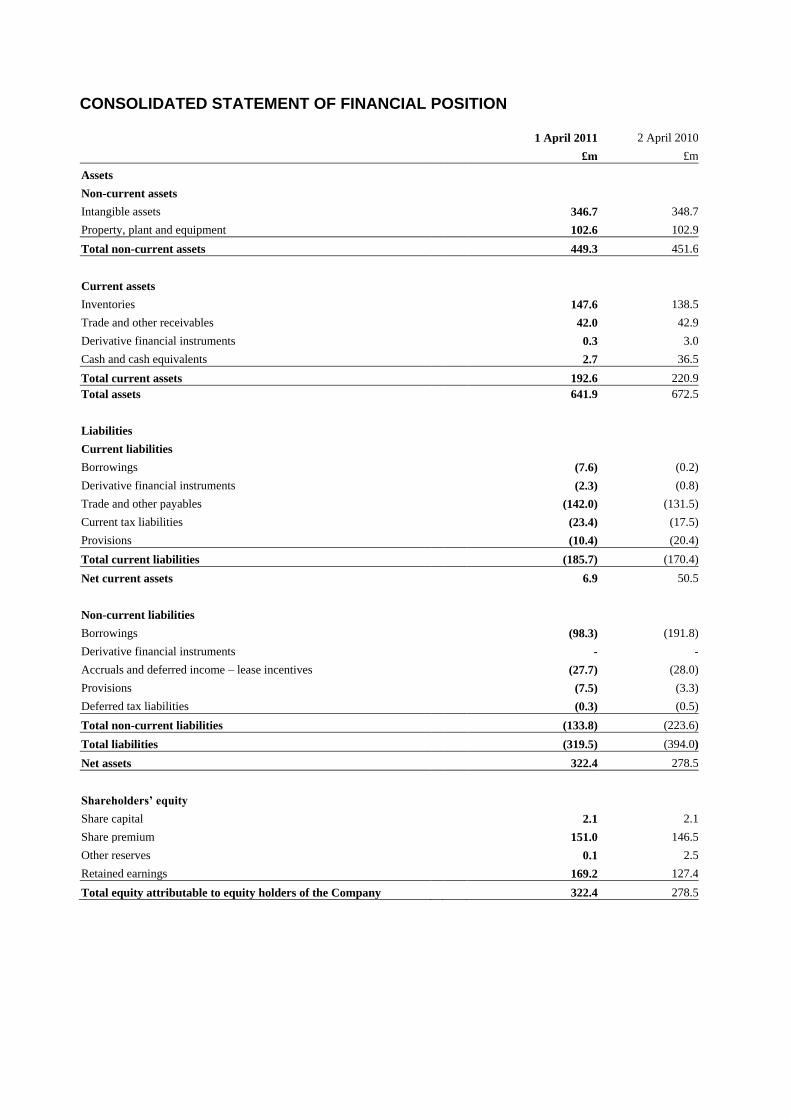
CONSOLIDATED STATEMENT OF FINANCIAL POSITION
1 April 2011 2 April 2010
£m £m
Assets
Non-current assets
Intangible assets 346.7 348.7
Property, plant and equipment 102.6 102.9
Total non-current assets 449.3 451.6
Current assets
Inventories 147.6 138.5
Trade and other receivables 42.0 42.9
Derivative financial instruments 0.3 3.0
Cash and cash equivalents 2.7 36.5
Total current assets 192.6 220.9
Total assets 641.9 672.5
Liabilities
Current liabilities
Borrowings (7.6) (0.2)
Derivative financial instruments (2.3) (0.8)
Trade and other payables (142.0) (131.5)
Current tax liabilities (23.4) (17.5)
Provisions (10.4) (20.4)
Total current liabilities (185.7) (170.4)
Net current assets 6.9 50.5
Non-current liabilities
Borrowings (98.3) (191.8)
Derivative financial instruments - -
Accruals and deferred income – lease incentives (27.7) (28.0)
Provisions (7.5) (3.3)
Deferred tax liabilities (0.3) (0.5)
Total non-current liabilities (133.8) (223.6)
Total liabilities (319.5) (394.0)
Net assets 322.4 278.5
Shareholders’ equity
Share capital 2.1 2.1
Share premium 151.0 146.5
Other reserves 0.1 2.5
Retained earnings 169.2 127.4
Total equity attributable to equity holders of the Company 322.4 278.5
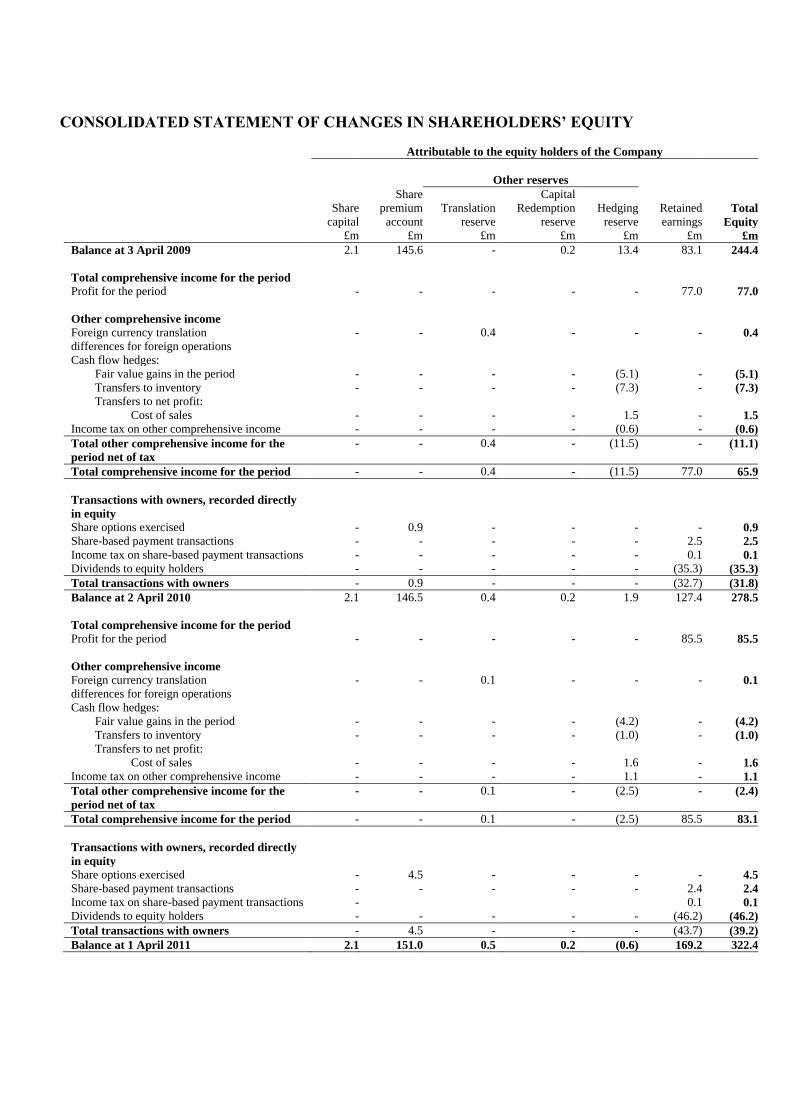
CONSOLIDATED STATEMENT OF CHANGES IN SHAREHOLDERS’ EQUITY
Attributable to the equity holders of the Company
Other reserves
Share Capital
Share
capital
premium
account
Translation
reserve
Redemption
reserve
Hedging
reserve
Retained
earnings Total
Equity
£m £m £m £m £m £m £m
Balance at 3 April 2009 2.1 145.6 - 0.2 13.4 83.1 244.4
Total comprehensive income for the period
Profit for the period - - - - - 77.0 77.0
Other comprehensive income
Foreign currency translation
differences for foreign operations
- - 0.4 - - - 0.4
Cash flow hedges:
Fair value gains in the period - - - - (5.1) - (5.1)
Transfers to inventory - - - - (7.3) - (7.3)
Transfers to net profit:
Cost of sales - - - - 1.5 - 1.5
Income tax on other comprehensive income - - - - (0.6) - (0.6)
Total other comprehensive income for the
period net of tax
- - 0.4 - (11.5) - (11.1)
Total comprehensive income for the period - - 0.4 - (11.5) 77.0 65.9
Transactions with owners, recorded directly
in equity
Share options exercised - 0.9 - - - - 0.9
Share-based payment transactions - - - - - 2.5 2.5
Income tax on share-based payment transactions - - - - - 0.1 0.1
Dividends to equity holders - - - - - (35.3) (35.3)
Total transactions with owners - 0.9 - - - (32.7) (31.8)
Balance at 2 April 2010 2.1 146.5 0.4 0.2 1.9 127.4 278.5
Total comprehensive income for the period
Profit for the period - - - - - 85.5 85.5
Other comprehensive income
Foreign currency translation
differences for foreign operations
- - 0.1 - - - 0.1
Cash flow hedges:
Fair value gains in the period - - - - (4.2) - (4.2)
Transfers to inventory - - - - (1.0) - (1.0)
Transfers to net profit:
Cost of sales - - - - 1.6 - 1.6
Income tax on other comprehensive income - - - - 1.1 - 1.1
Total other comprehensive income for the
period net of tax
- - 0.1 - (2.5) - (2.4)
Total comprehensive income for the period - - 0.1 - (2.5) 85.5 83.1
Transactions with owners, recorded directly
in equity
Share options exercised - 4.5 - - - - 4.5
Share-based payment transactions - - - - - 2.4 2.4
Income tax on share-based payment transactions - 0.1 0.1
Dividends to equity holders - - - - - (46.2) (46.2)
Total transactions with owners - 4.5 - - - (43.7) (39.2)
Balance at 1 April 2011 2.1 151.0 0.5 0.2 (0.6) 169.2 322.4
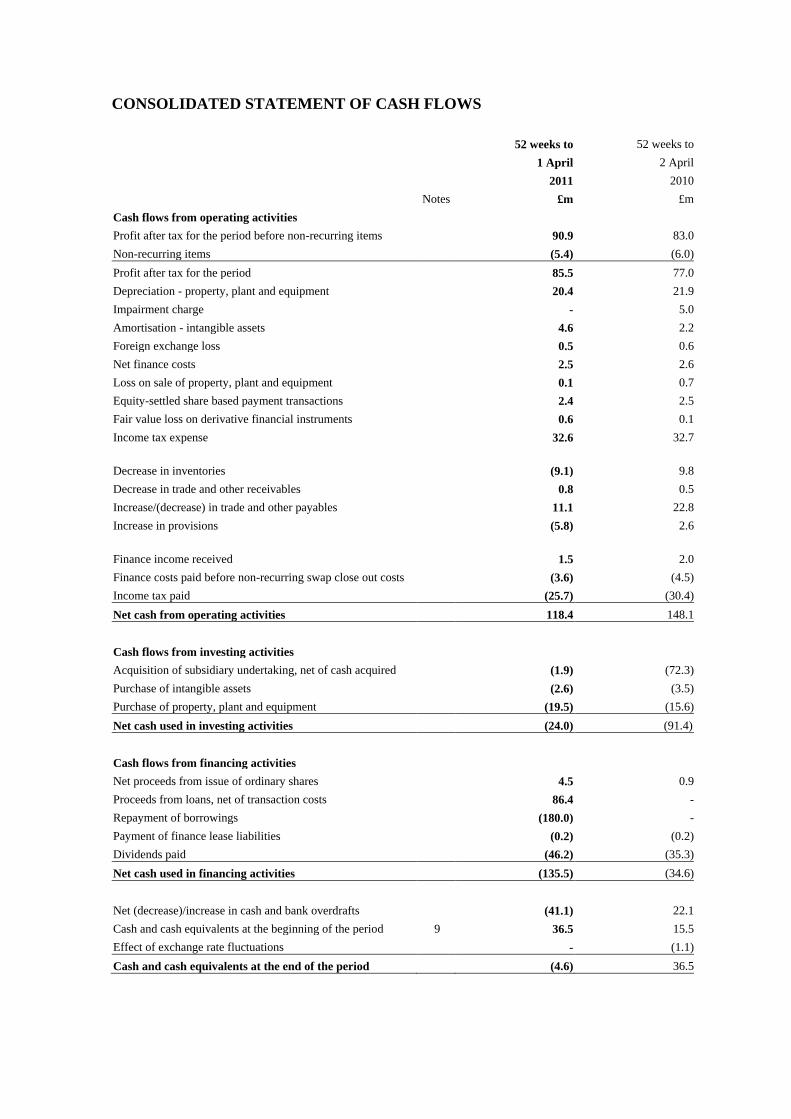
CONSOLIDATED STATEMENT OF CASH FLOWS
52 weeks to 52 weeks to
1 April 2 April
2011 2010
Notes £m £m
Cash flows from operating activities
Profit after tax for the period before non-recurring items 90.9 83.0
Non-recurring items (5.4) (6.0)
Profit after tax for the period 85.5 77.0
Depreciation - property, plant and equipment 20.4 21.9
Impairment charge - 5.0
Amortisation - intangible assets 4.6 2.2
Foreign exchange loss 0.5 0.6
Net finance costs 2.5 2.6
Loss on sale of property, plant and equipment 0.1 0.7
Equity-settled share based payment transactions 2.4 2.5
Fair value loss on derivative financial instruments 0.6 0.1
Income tax expense 32.6 32.7
Decrease in inventories (9.1) 9.8
Decrease in trade and other receivables 0.8 0.5
Increase/(decrease) in trade and other payables 11.1 22.8
Increase in provisions (5.8) 2.6
Finance income received 1.5 2.0
Finance costs paid before non-recurring swap close out costs (3.6) (4.5)
Income tax paid (25.7) (30.4)
Net cash from operating activities 118.4 148.1
Cash flows from investing activities
Acquisition of subsidiary undertaking, net of cash acquired (1.9) (72.3)
Purchase of intangible assets (2.6) (3.5)
Purchase of property, plant and equipment (19.5) (15.6)
Net cash used in investing activities (24.0) (91.4)
Cash flows from financing activities
Net proceeds from issue of ordinary shares 4.5 0.9
Proceeds from loans, net of transaction costs 86.4 -
Repayment of borrowings (180.0) -
Payment of finance lease liabilities (0.2) (0.2)
Dividends paid (46.2) (35.3)
Net cash used in financing activities (135.5) (34.6)
Net (decrease)/increase in cash and bank overdrafts (41.1) 22.1
Cash and cash equivalents at the beginning of the period 9 36.5 15.5
Effect of exchange rate fluctuations - (1.1)
Cash and cash equivalents at the end of the period (4.6) 36.5
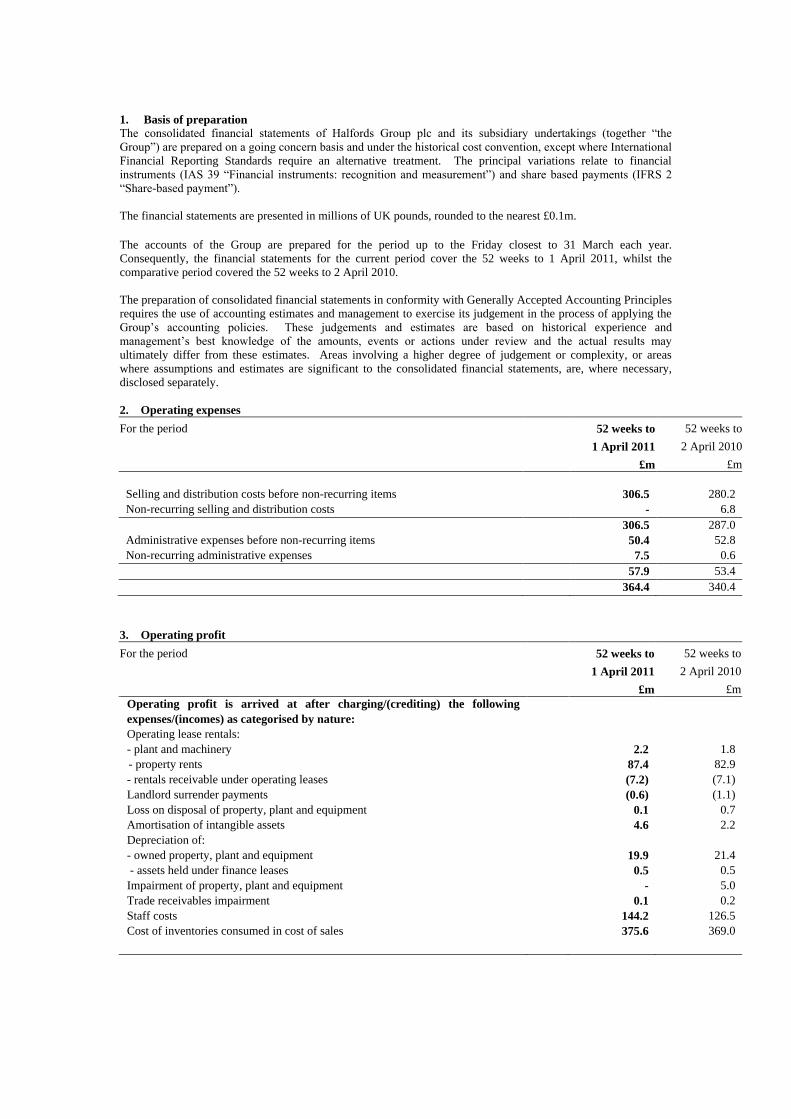
1. Basis of preparation
The consolidated financial statements of Halfords Group plc and its subsidiary undertakings (together “the
Group”) are prepared on a going concern basis and under the historical cost convention, except where International
Financial Reporting Standards require an alternative treatment. The principal variations relate to financial
instruments (IAS 39 “Financial instruments: recognition and measurement”) and share based payments (IFRS 2
“Share-based payment”).
The financial statements are presented in millions of UK pounds, rounded to the nearest £0.1m.
The accounts of the Group are prepared for the period up to the Friday closest to 31 March each year.
Consequently, the financial statements for the current period cover the 52 weeks to 1 April 2011, whilst the
comparative period covered the 52 weeks to 2 April 2010.
The preparation of consolidated financial statements in conformity with Generally Accepted Accounting Principles
requires the use of accounting estimates and management to exercise its judgement in the process of applying the
Group’s accounting policies. These judgements and estimates are based on historical experience and
management’s best knowledge of the amounts, events or actions under review and the actual results may
ultimately differ from these estimates. Areas involving a higher degree of judgement or complexity, or areas
where assumptions and estimates are significant to the consolidated financial statements, are, where necessary,
disclosed separately.
2. Operating expenses
For the period 52 weeks to 52 weeks to
1 April 2011 2 April 2010
£m £m
Selling and distribution costs before non-recurring items 306.5 280.2
Non-recurring selling and distribution costs - 6.8
306.5 287.0
Administrative expenses before non-recurring items 50.4 52.8
Non-recurring administrative expenses 7.5 0.6
57.9 53.4
364.4 340.4
3. Operating profit
For the period 52 weeks to 52 weeks to
1 April 2011 2 April 2010
£m £m
Operating profit is arrived at after charging/(crediting) the following
expenses/(incomes) as categorised by nature:
Operating lease rentals:
- plant and machinery 2.2 1.8
- property rents 87.4 82.9
- rentals receivable under operating leases (7.2) (7.1)
Landlord surrender payments (0.6) (1.1)
Loss on disposal of property, plant and equipment 0.1 0.7
Amortisation of intangible assets 4.6 2.2
Depreciation of:
- owned property, plant and equipment 19.9 21.4
- assets held under finance leases 0.5 0.5
Impairment of property, plant and equipment - 5.0
Trade receivables impairment 0.1 0.2
Staff costs 144.2 126.5
Cost of inventories consumed in cost of sales 375.6 369.0
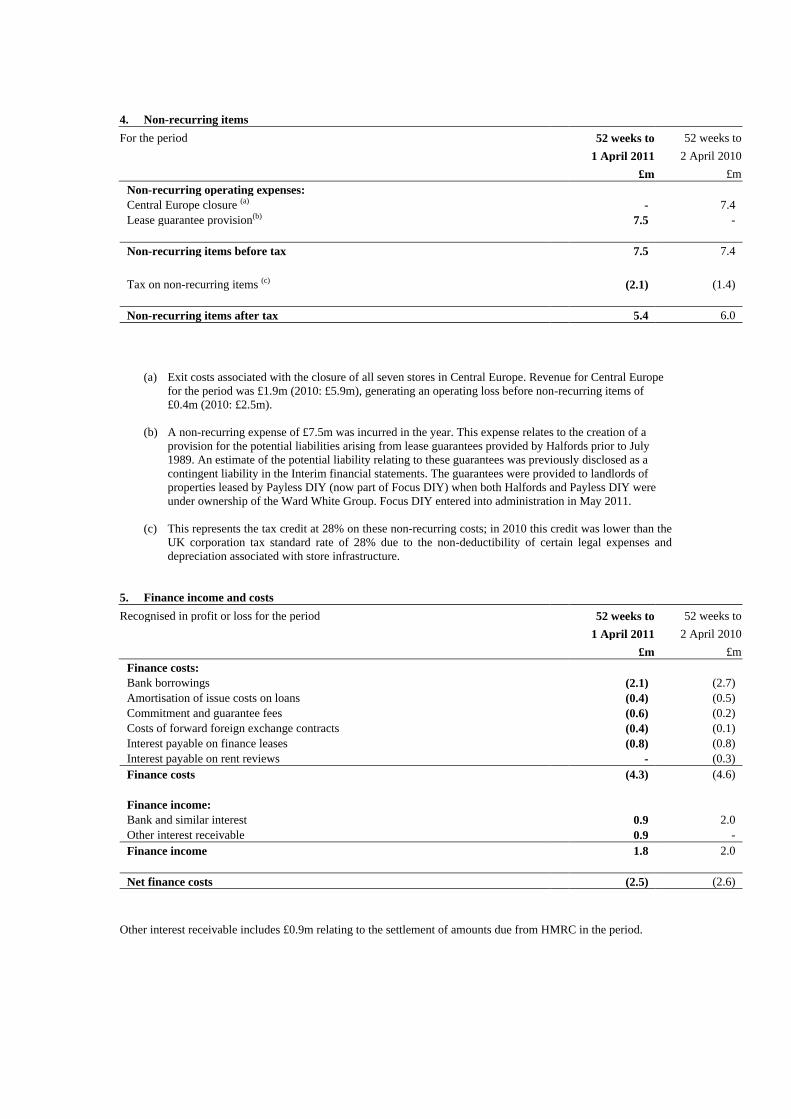
4. Non-recurring items
For the period 52 weeks to 52 weeks to
1 April 2011 2 April 2010
£m £m
Non-recurring operating expenses:
Central Europe closure (a) - 7.4
Lease guarantee provision(b) 7.5 -
Non-recurring items before tax 7.5 7.4
Tax on non-recurring items (c) (2.1) (1.4)
Non-recurring items after tax 5.4 6.0
(a) Exit costs associated with the closure of all seven stores in Central Europe. Revenue for Central Europe
for the period was £1.9m (2010: £5.9m), generating an operating loss before non-recurring items of
£0.4m (2010: £2.5m).
(b) A non-recurring expense of £7.5m was incurred in the year. This expense relates to the creation of a
provision for the potential liabilities arising from lease guarantees provided by Halfords prior to July
1989. An estimate of the potential liability relating to these guarantees was previously disclosed as a
contingent liability in the Interim financial statements. The guarantees were provided to landlords of
properties leased by Payless DIY (now part of Focus DIY) when both Halfords and Payless DIY were
under ownership of the Ward White Group. Focus DIY entered into administration in May 2011.
(c) This represents the tax credit at 28% on these non-recurring costs; in 2010 this credit was lower than the
UK corporation tax standard rate of 28% due to the non-deductibility of certain legal expenses and
depreciation associated with store infrastructure.
5. Finance income and costs
Recognised in profit or loss for the period 52 weeks to 52 weeks to
1 April 2011 2 April 2010
£m £m
Finance costs:
Bank borrowings (2.1) (2.7)
Amortisation of issue costs on loans (0.4) (0.5)
Commitment and guarantee fees (0.6) (0.2)
Costs of forward foreign exchange contracts (0.4) (0.1)
Interest payable on finance leases (0.8) (0.8)
Interest payable on rent reviews - (0.3)
Finance costs (4.3) (4.6)
Finance income:
Bank and similar interest 0.9 2.0
Other interest receivable 0.9 -
Finance income 1.8 2.0
Net finance costs (2.5) (2.6)
Other interest receivable includes £0.9m relating to the settlement of amounts due from HMRC in the period.
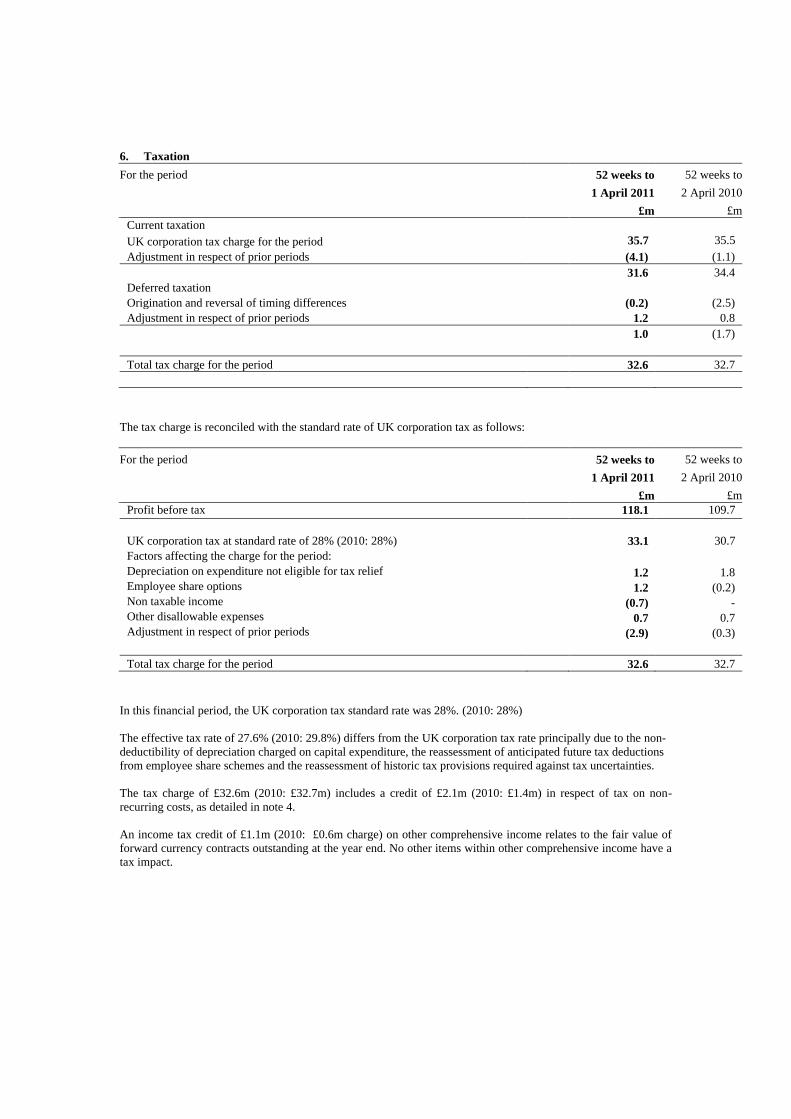
6. Taxation
For the period 52 weeks to 52 weeks to
1 April 2011 2 April 2010
£m £m
Current taxation
UK corporation tax charge for the period 35.7 35.5
Adjustment in respect of prior periods (4.1) (1.1)
31.6 34.4
Deferred taxation
Origination and reversal of timing differences (0.2) (2.5)
Adjustment in respect of prior periods 1.2 0.8
1.0 (1.7)
Total tax charge for the period 32.6 32.7
The tax charge is reconciled with the standard rate of UK corporation tax as follows:
For the period 52 weeks to 52 weeks to
1 April 2011 2 April 2010
£m £m
Profit before tax 118.1 109.7
UK corporation tax at standard rate of 28% (2010: 28%) 33.1 30.7
Factors affecting the charge for the period:
Depreciation on expenditure not eligible for tax relief 1.2 1.8
Employee share options 1.2 (0.2)
Non taxable income (0.7) -
Other disallowable expenses 0.7 0.7
Adjustment in respect of prior periods (2.9) (0.3)
Total tax charge for the period 32.6 32.7
In this financial period, the UK corporation tax standard rate was 28%. (2010: 28%)
The effective tax rate of 27.6% (2010: 29.8%) differs from the UK corporation tax rate principally due to the non-
deductibility of depreciation charged on capital expenditure, the reassessment of anticipated future tax deductions
from employee share schemes and the reassessment of historic tax provisions required against tax uncertainties.
The tax charge of £32.6m (2010: £32.7m) includes a credit of £2.1m (2010: £1.4m) in respect of tax on non-
recurring costs, as detailed in note 4.
An income tax credit of £1.1m (2010: £0.6m charge) on other comprehensive income relates to the fair value of
forward currency contracts outstanding at the year end. No other items within other comprehensive income have a
tax impact.
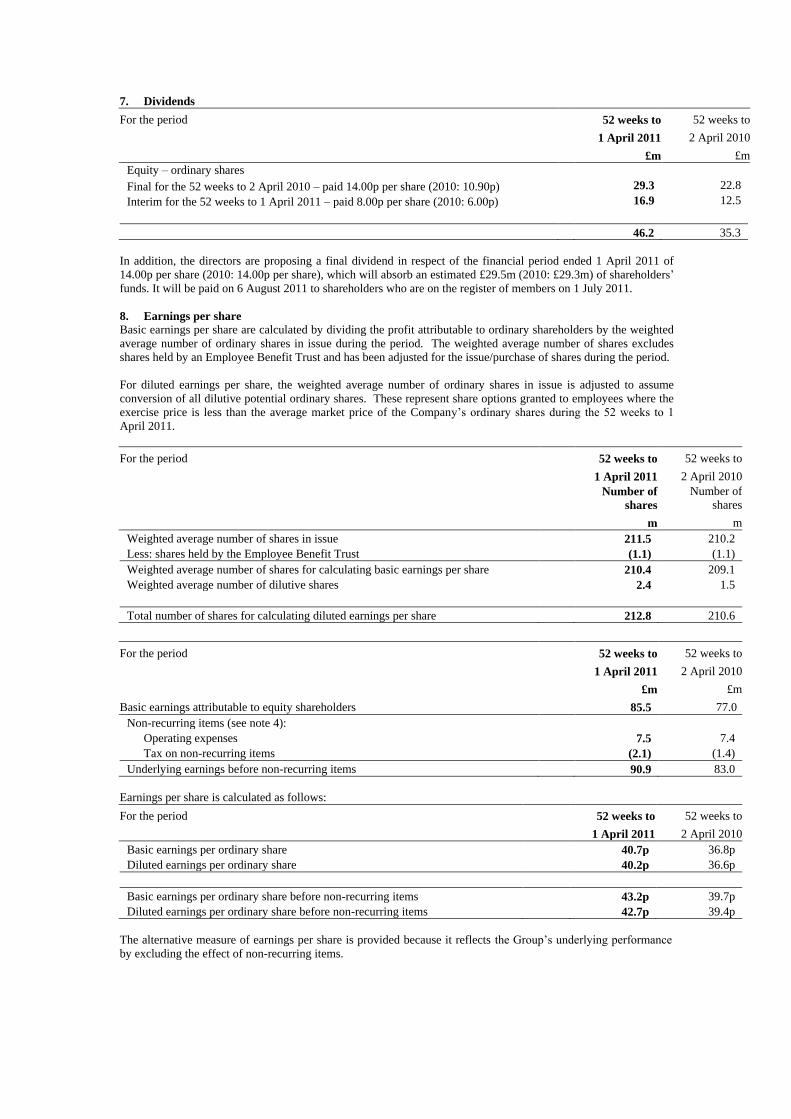
7. Dividends
For the period 52 weeks to 52 weeks to
1 April 2011 2 April 2010
£m £m
Equity – ordinary shares
Final for the 52 weeks to 2 April 2010 – paid 14.00p per share (2010: 10.90p) 29.3 22.8
Interim for the 52 weeks to 1 April 2011 – paid 8.00p per share (2010: 6.00p) 16.9 12.5
46.2 35.3
In addition, the directors are proposing a final dividend in respect of the financial period ended 1 April 2011 of
14.00p per share (2010: 14.00p per share), which will absorb an estimated £29.5m (2010: £29.3m) of shareholders’
funds. It will be paid on 6 August 2011 to shareholders who are on the register of members on 1 July 2011.
8. Earnings per share
Basic earnings per share are calculated by dividing the profit attributable to ordinary shareholders by the weighted
average number of ordinary shares in issue during the period. The weighted average number of shares excludes
shares held by an Employee Benefit Trust and has been adjusted for the issue/purchase of shares during the period.
For diluted earnings per share, the weighted average number of ordinary shares in issue is adjusted to assume
conversion of all dilutive potential ordinary shares. These represent share options granted to employees where the
exercise price is less than the average market price of the Company’s ordinary shares during the 52 weeks to 1
April 2011.
For the period 52 weeks to 52 weeks to
1 April 2011 2 April 2010
Number of
shares
Number of
shares
m m
Weighted average number of shares in issue 211.5 210.2
Less: shares held by the Employee Benefit Trust (1.1) (1.1)
Weighted average number of shares for calculating basic earnings per share 210.4 209.1
Weighted average number of dilutive shares 2.4 1.5
Total number of shares for calculating diluted earnings per share 212.8 210.6
For the period 52 weeks to 52 weeks to
1 April 2011 2 April 2010
£m £m
Basic earnings attributable to equity shareholders 85.5 77.0
Non-recurring items (see note 4):
Operating expenses 7.5 7.4
Tax on non-recurring items (2.1) (1.4)
Underlying earnings before non-recurring items 90.9 83.0
Earnings per share is calculated as follows:
For the period 52 weeks to 52 weeks to
1 April 2011 2 April 2010
Basic earnings per ordinary share 40.7p 36.8p
Diluted earnings per ordinary share 40.2p 36.6p
Basic earnings per ordinary share before non-recurring items 43.2p 39.7p
Diluted earnings per ordinary share before non-recurring items 42.7p 39.4p
The alternative measure of earnings per share is provided because it reflects the Group’s underlying performance
by excluding the effect of non-recurring items.
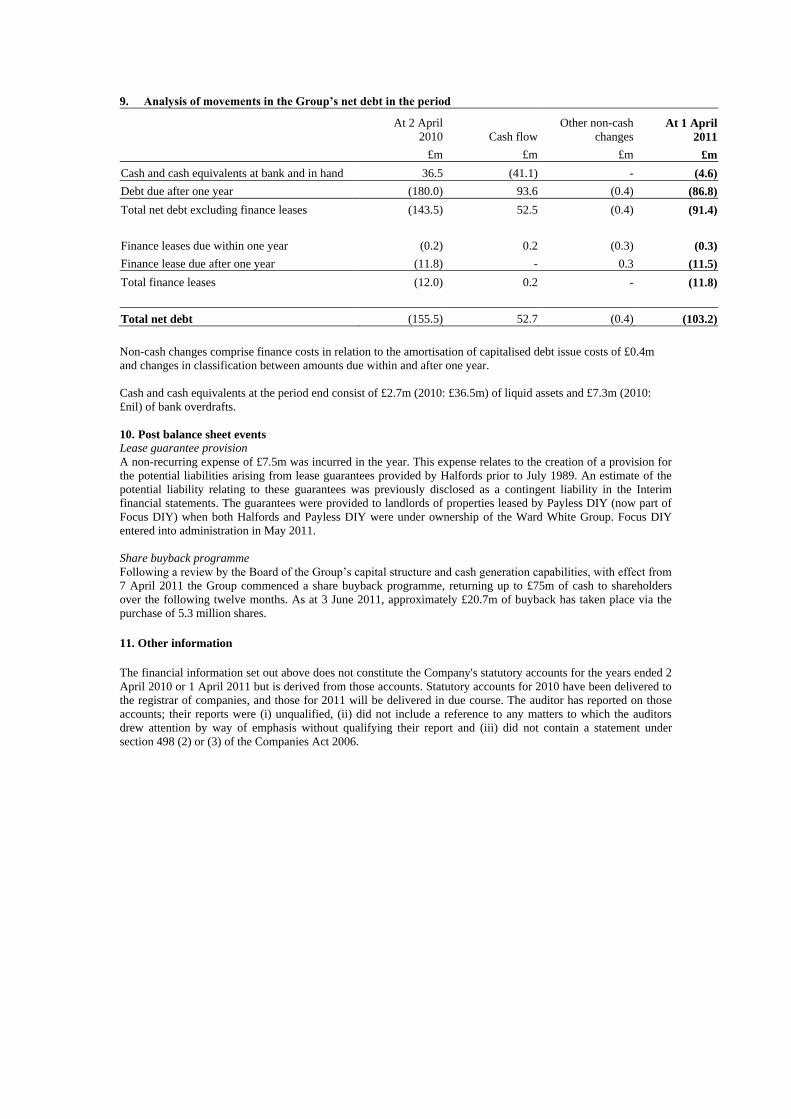
9. Analysis of movements in the Group’s net debt in the period
At 2 April
2010 Cash flow
Other non-cash
changes At 1 April
2011
£m £m £m £m
Cash and cash equivalents at bank and in hand 36.5 (41.1) - (4.6)
Debt due after one year (180.0) 93.6 (0.4) (86.8)
Total net debt excluding finance leases (143.5) 52.5 (0.4) (91.4)
Finance leases due within one year (0.2) 0.2 (0.3) (0.3)
Finance lease due after one year (11.8) - 0.3 (11.5)
Total finance leases (12.0) 0.2 - (11.8)
Total net debt (155.5) 52.7 (0.4) (103.2)
Non-cash changes comprise finance costs in relation to the amortisation of capitalised debt issue costs of £0.4m
and changes in classification between amounts due within and after one year.
Cash and cash equivalents at the period end consist of £2.7m (2010: £36.5m) of liquid assets and £7.3m (2010:
£nil) of bank overdrafts.
10. Post balance sheet events
Lease guarantee provision
A non-recurring expense of £7.5m was incurred in the year. This expense relates to the creation of a provision for
the potential liabilities arising from lease guarantees provided by Halfords prior to July 1989. An estimate of the
potential liability relating to these guarantees was previously disclosed as a contingent liability in the Interim
financial statements. The guarantees were provided to landlords of properties leased by Payless DIY (now part of
Focus DIY) when both Halfords and Payless DIY were under ownership of the Ward White Group. Focus DIY
entered into administration in May 2011.
Share buyback programme
Following a review by the Board of the Group’s capital structure and cash generation capabilities, with effect from
7 April 2011 the Group commenced a share buyback programme, returning up to £75m of cash to shareholders
over the following twelve months. As at 3 June 2011, approximately £20.7m of buyback has taken place via the
purchase of 5.3 million shares.
11. Other information
The financial information set out above does not constitute the Company's statutory accounts for the years ended 2
April 2010 or 1 April 2011 but is derived from those accounts. Statutory accounts for 2010 have been delivered to
the registrar of companies, and those for 2011 will be delivered in due course. The auditor has reported on those
accounts; their reports were (i) unqualified, (ii) did not include a reference to any matters to which the auditors
drew attention by way of emphasis without qualifying their report and (iii) did not contain a statement under
section 498 (2) or (3) of the Companies Act 2006.