Embed Size (px)
Citation preview
ACM Reference FormatChu, H., Chang, C., Lee, R., Mitra, N. 2013. Halftone QR Codes. ACM Trans. Graph. 32, 6, Article 217 (November 2013), 8 pages. DOI = 10.1145/2508363.2508408 http://doi.acm.org/10.1145/2508363.2508408.
Copyright NoticePermission to make digital or hard copies of all or part of this work for personal or classroom use is granted without fee provided that copies are not made or distributed for profi t or commercial advantage and that copies bear this notice and the full citation on the fi rst page. Copyrights for components of this work owned by others than ACM must be honored. Abstracting with credit is permitted. To copy otherwise, or republish, to post on servers or to redistribute to lists, requires prior specifi c permission and/or a fee. Request permis-sions from [email protected] © ACM 0730-0301/13/11-ART217 $15.00.DOI: http://doi.acm.org/10.1145/2508363.2508408
Halftone QR Codes
Hung-Kuo Chu1 Chia-Sheng Chang1 Ruen-Rone Lee1 Niloy J. Mitra2
1National Tsing Hua University 2University College London
Figure 1: Three halftone QR codes generated by our method. By using a new representation model that minimally binds to the appearanceof QR code, our approach is able to combine halftone images with ordinary QR codes without compromising its readability.
Abstract
QR code is a popular form of barcode pattern that is ubiquitouslyused to tag information to products or for linking advertisements.While, on one hand, it is essential to keep the patterns machine-readable; on the other hand, even small changes to the patterns caneasily render them unreadable. Hence, in absence of any compu-tational support, such QR codes appear as random collections ofblack/white modules, and are often visually unpleasant. We pro-pose an approach to produce high quality visual QR codes, whichwe call halftone QR codes, that are still machine-readable. First, webuild a pattern readability function wherein we learn a probabilitydistribution of what modules can be replaced by which other mod-ules. Then, given a text tag, we express the input image in termsof the learned dictionary to encode the source text. We demonstratethat our approach produces high quality results on a range of inputsand under different distortion effects.
CR Categories: I.4.9 [Image Processing and Computer Vision]:Applications;
Keywords: Non-Photorealistic Rendering, Halftone, QR code
Links: DL PDF WEB VIDEO CODE
1 Introduction
Quick Response Code, abbreviated as QR code R©, is a two-dimensional matrix encoding consisting of black and white squares,called modules, forming a machine-readable barcode to tag infor-mation onto products. Originally designed by Denso Wave for theautomotive industry, QR code has quickly been adapted as a fastand effective way to embed digital content and is extensively usedin diverse fields including manufacturing, marketing, etc. While be-ing an excellent machine readable format, visually QR code re-mains a clutter of black and white squares that can easily disruptthe aesthetic appeal of its parent product.
Since QR codes often take up a non-negligible display area, thereis a growing demand for producing visually appealing QR codes.Such codes that incorporate high-level visual features such as col-ors, letters, illustrations, or logos are referred to as visual QR codes.However, creating a visually interesting QR code without compro-mising its readability is non-trivial. The key challenge arises dueto the lack of proper understanding or analytical formulations cap-turing the stability (i.e., validity) of QR codes under variationsin lighting, camera specifications, and even perturbations to theQR codes [DENSO WAVE 2003; Winter 2011]. Patented and ill-documented algorithms employed for reading QR codes cause fur-ther difficulties. Consequently, existing approaches are mostly adhoc and often end up favoring readability at the cost of sacrificingvisual quality.
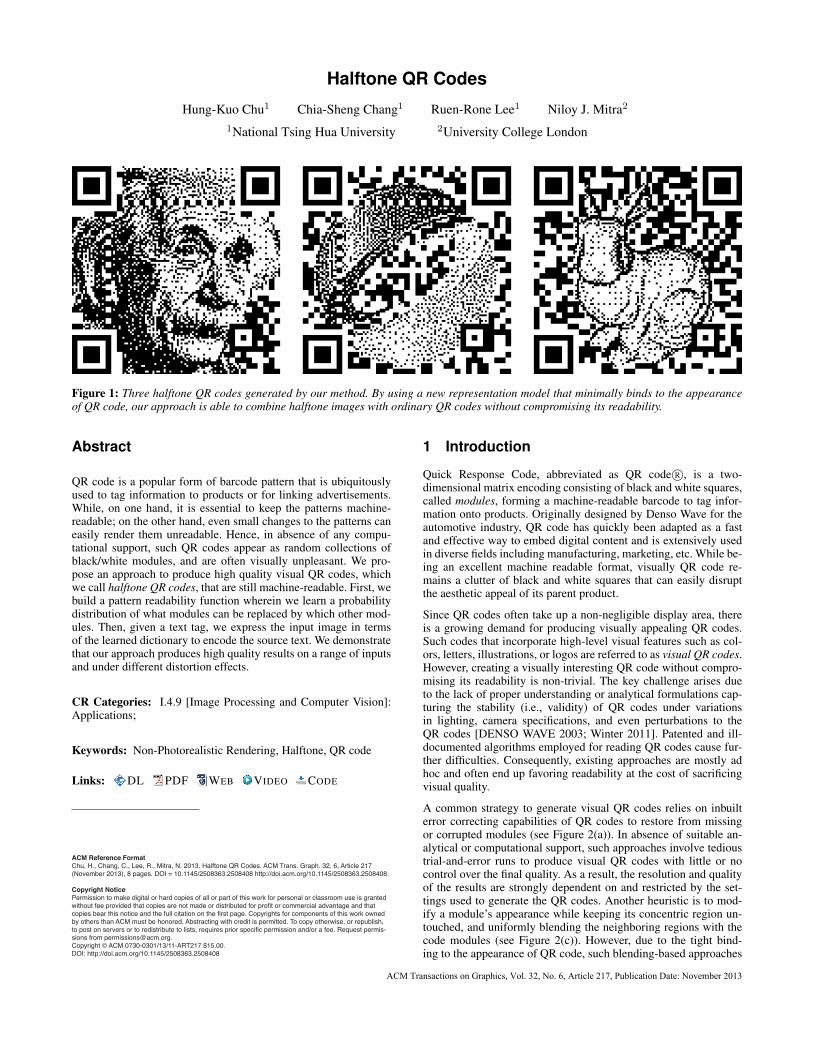
A common strategy to generate visual QR codes relies on inbuilterror correcting capabilities of QR codes to restore from missingor corrupted modules (see Figure 2(a)). In absence of suitable an-alytical or computational support, such approaches involve tedioustrial-and-error runs to produce visual QR codes with little or nocontrol over the final quality. As a result, the resolution and qualityof the results are strongly dependent on and restricted by the set-tings used to generate the QR codes. Another heuristic is to mod-ify a module’s appearance while keeping its concentric region un-touched, and uniformly blending the neighboring regions with thecode modules (see Figure 2(c)). However, due to the tight bind-ing to the appearance of QR code, such blending-based approaches
ACM Transactions on Graphics, Vol. 32, No. 6, Article 217, Publication Date: November 2013
(a) (b) (c) (d) (e)
Figure 2: Various visual QR codes generated by: (a) Unitag [Laporte 2012], (b) QArt [Cox 2012], (c) Visualead [Peled 2012], and (d) ourmethod. (e) our result shows even better visual quality of embedded image as viewed from a distance (using 3X zoom out in this case).
typically suffer from artifacts like corruption of salient image fea-tures and large variations in output quality for the same image withdifferent QR codes (see supplementary video). Such methods offerlittle user control and at best produce mediocre results.
In this paper, we present an automatic algorithm to create a newtype of visual QR code, called halftone QR code, that combineshalftone images with QR codes (see Figure 1 and Figure 2(d)). Toeliminate the aforementioned problems, the key insight is a rep-resentation model that minimally binds to original modules and isflexible to adapt to target halftone images. In our approach, we sub-divide each module into 3 × 3 submodules and bind the module’scolor to the center submodule, which leaves the remaining eightsubmodules free to independently change their appearance. We usethis flexibility to characterize the appearance of modules using a setof binary patterns. In addition, we evaluate the pattern reliability ofeach binary pattern that represents a probability of retaining mod-ule’s readability when it is replaced by the pattern. Specifically, weestimate the probability by learning from a database of syntheticQR codes that is automatically generated using binary patterns anda barcode reader is employed to statistically evaluate pattern’s relia-bility. Finally, to generate halftone QR codes, we introduce a noveloptimization method to compute and assign a binary pattern to eachmodule by balancing two competing terms, reliability and regular-ization, corresponding to preferring the assignment of high relia-bility patterns and regularizing the appearance of modules towardstarget halftone images, respectively. (Please refer to the project pageto create your own halftone QR codes for non-commercial use.)
Although our algorithm runs automatically, we also provide toolsto locally adjust the visual quality of the resultant QR codes. Weextensively tested our method on a variety of inputs and also man-ually scanned the resultant QR codes using a smartphone with pop-ular barcode readers to validate the reliability and the readability ofthe generated halftone QR codes.
Contributions. Our main contributions include:
• proposing a new type of visual QR code, halftone QR code,and an automatic algorithm to produce such codes at control-lable level of readability;
• encoding module’s appearance using a set of binary patternsthat are minimally bound to modules and flexible to adapt tohalftone images;
• characterizing pattern reliability that is evaluated by an au-tomatic procedure, which computes statistics of a barcodereader reading a database of synthetic QR codes; and
• a pattern assignment optimization method that maximizes thereadability based on pattern reliability and regularizes themodule appearance via halftone image.
2 Related Work
The widespread use of QR codes motivates a vast creation of eye-catching visual QR codes. Most of the visual QR codes are creativeartworks made by skilled artists or design experts. There is a website, QR code R©Artist [D’Haem 2010], that keeps track of newsand related resources about creative QR code artworks, and a plen-tiful art gallery could be found in a flickr QR code art group [flickr2009]. Owing to the commercial value behind such visually ap-pealing QR codes, most resources for creating artistic QR codesare proprietary and only a few online tutorials [Chan 2011; Scheib2010] are available. Commonly used strategies by artists to cus-tomize a QR code include adding colors to modules, rounding thehard edges, and embedding a small image in a QR code that relieson inbuilt error correction capacity of QR code to restore from miss-ing modules (see Figure 2(a)). These attempts generally require atrial-and-error style process to manually refine their works followedby a readability verification process as evidenced in online customQR code design tools [Laporte 2012].
Cox [2012] proposed a complicated algorithm to embed a binaryimage into a QR code during the data encoding stage of generat-ing the code. He carefully investigated the internal structure of QRcode and the logic behind data encoding, and designed an algorithmto encode image content as redundant numeric strings appendedto the original data as shown in Figure 2(b). However, this tech-nique works only for URL type data string and the quality of em-bedded image is limited by the length of encoded URL. Similarly,Duda [?] attempted to embed halftone images into QR codes usinga constrained coding technique. While a sophisticated analysis offreedom bits is proposed for embedding image pixels, it currentlyworks for images of monotonic shapes and produces mediocre re-sults. An application of extending to delicate halftone images is notaddressed.
Our work bears some resemblance to two proprietary techniquesdeveloped by Visualead [Peled 2012] and LogoQ [A T Communi-cations Co. 2007]. Both approaches adopt a similar idea to auto-matically blend the input image with the QR code modules. Specif-ically, they keep a concentric region of modules untouched and uni-formly blend the neighboring regions with image content in a man-ner that preserves the original contrast between modules (see Fig-ure 2(c)). While their approaches produce colorful and attractive vi-sual QR codes, the tight binding between the image and appearanceof QR code causes the artifacts like corruption at salient image fea-tures and large variations in output quality for the same image withdifferent QR codes (see supplementary video). All the existing ap-proaches offer little user control, and the quality of visual QR codesis strongly dependent on either the settings or the appearance ofQR codes. Moreover, the visual quality and clarity of their resultsdrop dramatically as viewed from a distance (see Figure 2(e)). Inthis paper, we propose an automatic algorithm to generate halftone
217:2 • H.-K. Chu et al.
ACM Transactions on Graphics, Vol. 32, No. 6, Article 217, Publication Date: November 2013
Object
Result
QR Code Module Subdivision
Pattern Reliability
Pattern Assignment
Pair-wise Similarity Matrix
Pattern
Patte
rn
PatternRe
liabi
lity
………
Imp. MapHalftone
+
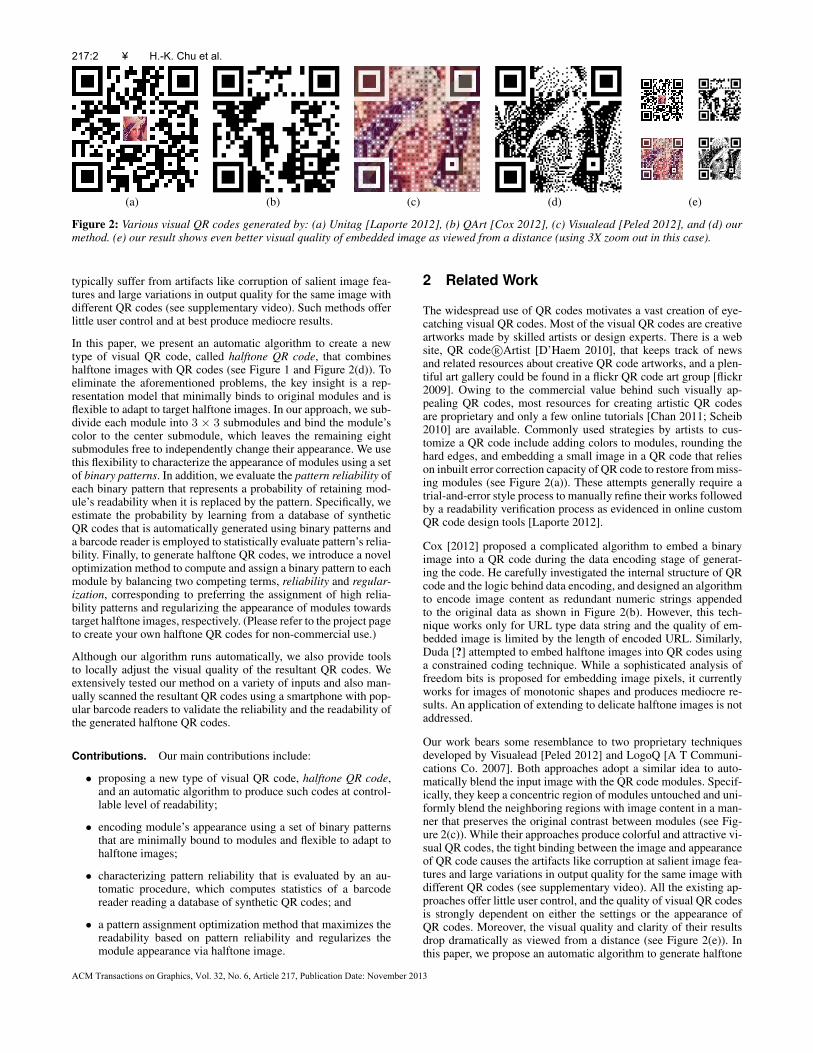
Figure 3: System overview.
QR codes at controllable level of readability. Our approach largelylooses the binding between the QR code and halftone image, thusresults in high quality visual QR codes which are resistant to thevariation of QR codes.
Computer aided design of recreational arts has been extensivelystudied in various contexts including emerging images [?], shadowart [Mitra and Pauly 2009], camouflage images [Chu et al. 2010],pixel art [Kopf and Lischinski 2011], etc. Further, collage art [Galet al. 2007; Huang et al. 2011] and text art [Xu et al. 2010; Ma-harik et al. 2011] that aim at optimizing the assemblage to retainlocal element characteristics while approximating a global shape,are relevant to our work. However, instead of maintaining shapeand identifiability of local elements, our goal is to retain readabilityof the QR codes. This is a much stricter constraint.
3 Overview
Figure 3 provides a workflow of our halftone QR code synthesis.First, we generate a QR code using a data encoding library [Ken-taro 2006] that adheres to ISO standard [ISO/IEC 18004 2006]. Thesetting used to generate a QR code consists of three parameters:data string, symbol version∗, and error correction level. While thedata string represents the encoded information that determines theappearance of QR code, symbol version and error correction levelcontrol the size and error correction capacity of QR code, respec-tively. The QR code modules are black or white squares, and can beclassified into two categories according to their functionality. Thefirst category contains data modules, which are modules that rep-resent input data or error correction codes; while, the second cate-gory are modules that are used to improve the reading performance(e.g., for alignment, rectification, etc.). Because the readability ofQR code is very sensitive to the correctness of modules in the sec-ond category, our algorithm leaves these modules untouched andonly manipulates the data modules. We recommend readers to referto the QR code ISO standard [ISO/IEC 18004 2006] and the officialweb site [DENSO WAVE 2003] for technical details regarding QRcode generation.
∗There are 40 symbol versions, from 21 × 21 modules (version 1) to177× 177 modules (version 40) with each higher version adds additional 4modules per side.
A key component in generating halftone QR code is a represen-tation model that minimally binds to the original module, and yetis flexible to adapt target halftone image. To this end, we propose amodel that subdivides each module into 3×3 submodules and bindsmodule’s color to the center submodule, while leaving remainingeight submodules free to independently change their appearance.By rendering a subdivided module as a binary image of 3 × 3 pix-els, we obtain a set of 512 binary patterns (or simply patterns here-after), which is used to characterize the appearance of modules. Foreach pattern, we introduce a novel term pattern reliability, whichis modeled as a probability that a module’s readability is not com-promised by a pattern substitution, and is evaluated through a largedatabase of synthetic QR codes. Note that in absence of any analyticfunction quantifying readability of QR code under variations, pat-tern reliability characterizes the preference among patterns towardscontrollable levels of readability.
We formulate the synthesis of halftone QR codes as an optimizationthat assigns patterns to modules by computing an objective functioncomprising two terms, reliability and regularization. While relia-bility prefers selection of high reliability patterns in order to maxi-mize the readability of modules; regularization aims to control theappearance of modules via the target halftone image using a sim-ilarity distance metric. We introduce a single control parameter tobalance these two terms and solve the pattern assignment using agraph cut formulation.
4 Algorithm
Given an object image and its desired size, position, and orientationin the QR code, our system automatically converts the object im-age to a halftone image If using the method of Chang et al. [2009],and applies an image filter [Kyprianidis and Dollner 2008] to gen-erate an importance map Im of object image (see Figure 3). Theimportance map highlights salient image features and is later usedto guide the QR code generation.
Pattern assignment optimization. We denote those data mod-ules covered by the object image asM = {mi = (Imi , c
mi , wi)|i =
1, . . . n} where, Imi is a local 3× 3 image patch from If ; cmi is thecolor of module; wi represents the importance weight calculated
Halftone QR Codes • 217:3
ACM Transactions on Graphics, Vol. 32, No. 6, Article 217, Publication Date: November 2013
0
0.1
0.2
0.3
0.4
0.5
0.6
0.7
0.8
0.9
5K 55K 105K 155K 205K 255K 305K 355K 405K 455K 505K 555K 605K
Patt
ern
relia
bilit
y va
riatio
n
# of synthetic QR codes
(a) (b) (c)
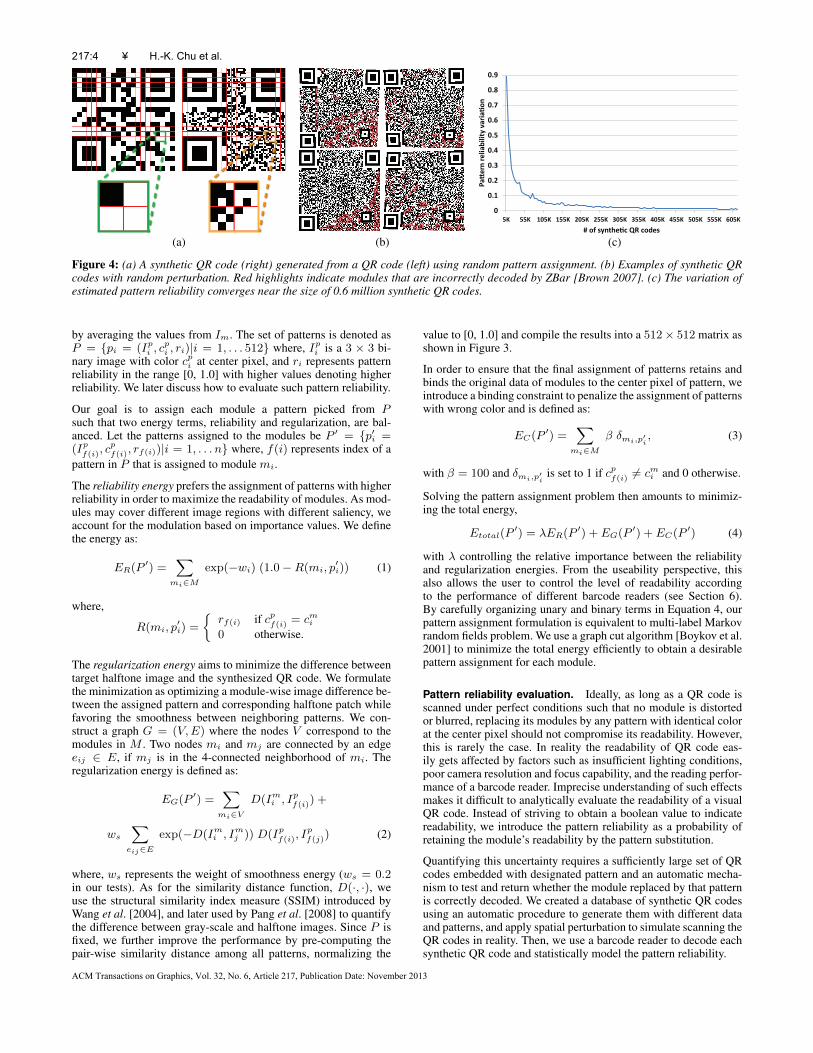
Figure 4: (a) A synthetic QR code (right) generated from a QR code (left) using random pattern assignment. (b) Examples of synthetic QRcodes with random perturbation. Red highlights indicate modules that are incorrectly decoded by ZBar [Brown 2007]. (c) The variation ofestimated pattern reliability converges near the size of 0.6 million synthetic QR codes.
by averaging the values from Im. The set of patterns is denoted asP = {pi = (Ipi , c
pi , ri)|i = 1, . . . 512} where, Ipi is a 3 × 3 bi-
nary image with color cpi at center pixel, and ri represents patternreliability in the range [0, 1.0] with higher values denoting higherreliability. We later discuss how to evaluate such pattern reliability.
Our goal is to assign each module a pattern picked from Psuch that two energy terms, reliability and regularization, are bal-anced. Let the patterns assigned to the modules be P ′ = {p′i =(Ipf(i), c
pf(i), rf(i))|i = 1, . . . n} where, f(i) represents index of a
pattern in P that is assigned to module mi.
The reliability energy prefers the assignment of patterns with higherreliability in order to maximize the readability of modules. As mod-ules may cover different image regions with different saliency, weaccount for the modulation based on importance values. We definethe energy as:
ER(P′) =
∑mi∈M
exp(−wi) (1.0−R(mi, p′i)) (1)
where,
R(mi, p′i) =
{rf(i) if cpf(i) = cmi0 otherwise.
The regularization energy aims to minimize the difference betweentarget halftone image and the synthesized QR code. We formulatethe minimization as optimizing a module-wise image difference be-tween the assigned pattern and corresponding halftone patch whilefavoring the smoothness between neighboring patterns. We con-struct a graph G = (V,E) where the nodes V correspond to themodules in M . Two nodes mi and mj are connected by an edgeeij ∈ E, if mj is in the 4-connected neighborhood of mi. Theregularization energy is defined as:
EG(P′) =
∑mi∈V
D(Imi , Ipf(i)) +
ws
∑eij∈E
exp(−D(Imi , Imj )) D(Ipf(i), I
pf(j)) (2)
where, ws represents the weight of smoothness energy (ws = 0.2in our tests). As for the similarity distance function, D(·, ·), weuse the structural similarity index measure (SSIM) introduced byWang et al. [2004], and later used by Pang et al. [2008] to quantifythe difference between gray-scale and halftone images. Since P isfixed, we further improve the performance by pre-computing thepair-wise similarity distance among all patterns, normalizing the
value to [0, 1.0] and compile the results into a 512× 512 matrix asshown in Figure 3.
In order to ensure that the final assignment of patterns retains andbinds the original data of modules to the center pixel of pattern, weintroduce a binding constraint to penalize the assignment of patternswith wrong color and is defined as:
EC(P′) =
∑mi∈M
β δmi,p′i, (3)
with β = 100 and δmi,p′i
is set to 1 if cpf(i) 6= cmi and 0 otherwise.
Solving the pattern assignment problem then amounts to minimiz-ing the total energy,
Etotal(P′) = λER(P
′) + EG(P′) + EC(P
′) (4)
with λ controlling the relative importance between the reliabilityand regularization energies. From the useability perspective, thisalso allows the user to control the level of readability accordingto the performance of different barcode readers (see Section 6).By carefully organizing unary and binary terms in Equation 4, ourpattern assignment formulation is equivalent to multi-label Markovrandom fields problem. We use a graph cut algorithm [Boykov et al.2001] to minimize the total energy efficiently to obtain a desirablepattern assignment for each module.
Pattern reliability evaluation. Ideally, as long as a QR code isscanned under perfect conditions such that no module is distortedor blurred, replacing its modules by any pattern with identical colorat the center pixel should not compromise its readability. However,this is rarely the case. In reality the readability of QR code eas-ily gets affected by factors such as insufficient lighting conditions,poor camera resolution and focus capability, and the reading perfor-mance of a barcode reader. Imprecise understanding of such effectsmakes it difficult to analytically evaluate the readability of a visualQR code. Instead of striving to obtain a boolean value to indicatereadability, we introduce the pattern reliability as a probability ofretaining the module’s readability by the pattern substitution.
Quantifying this uncertainty requires a sufficiently large set of QRcodes embedded with designated pattern and an automatic mecha-nism to test and return whether the module replaced by that patternis correctly decoded. We created a database of synthetic QR codesusing an automatic procedure to generate them with different dataand patterns, and apply spatial perturbation to simulate scanning theQR codes in reality. Then, we use a barcode reader to decode eachsynthetic QR code and statistically model the pattern reliability.
217:4 • H.-K. Chu et al.
ACM Transactions on Graphics, Vol. 32, No. 6, Article 217, Publication Date: November 2013
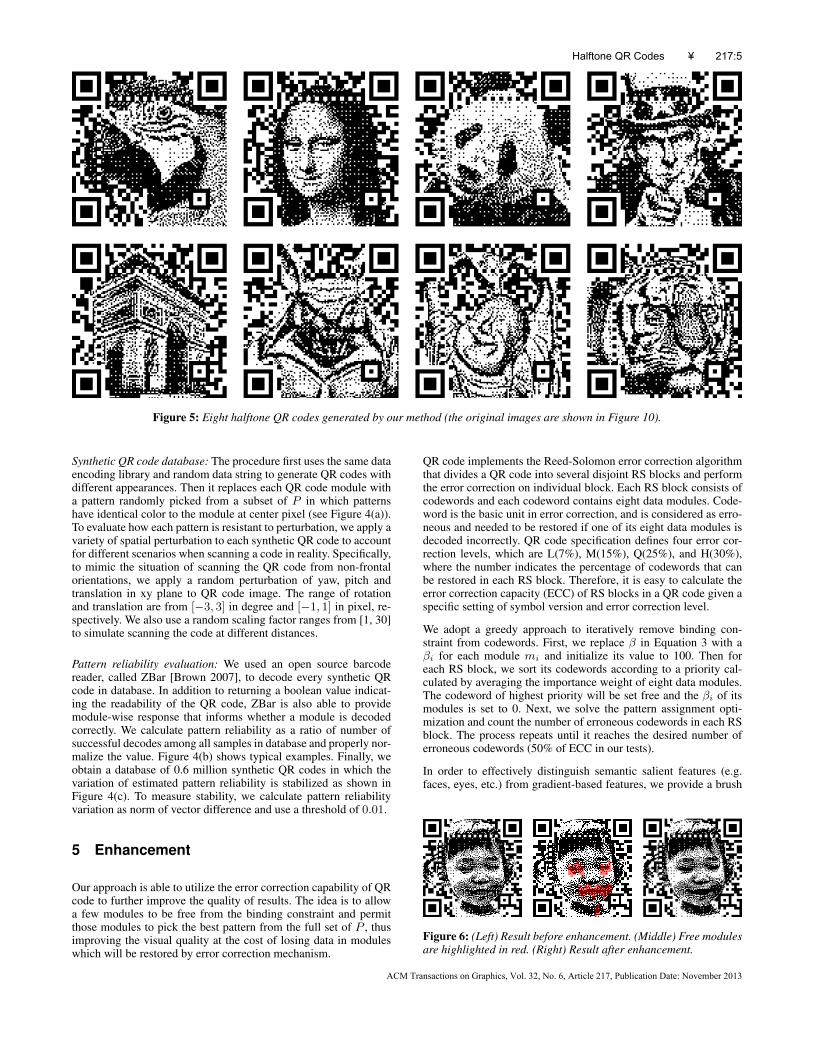
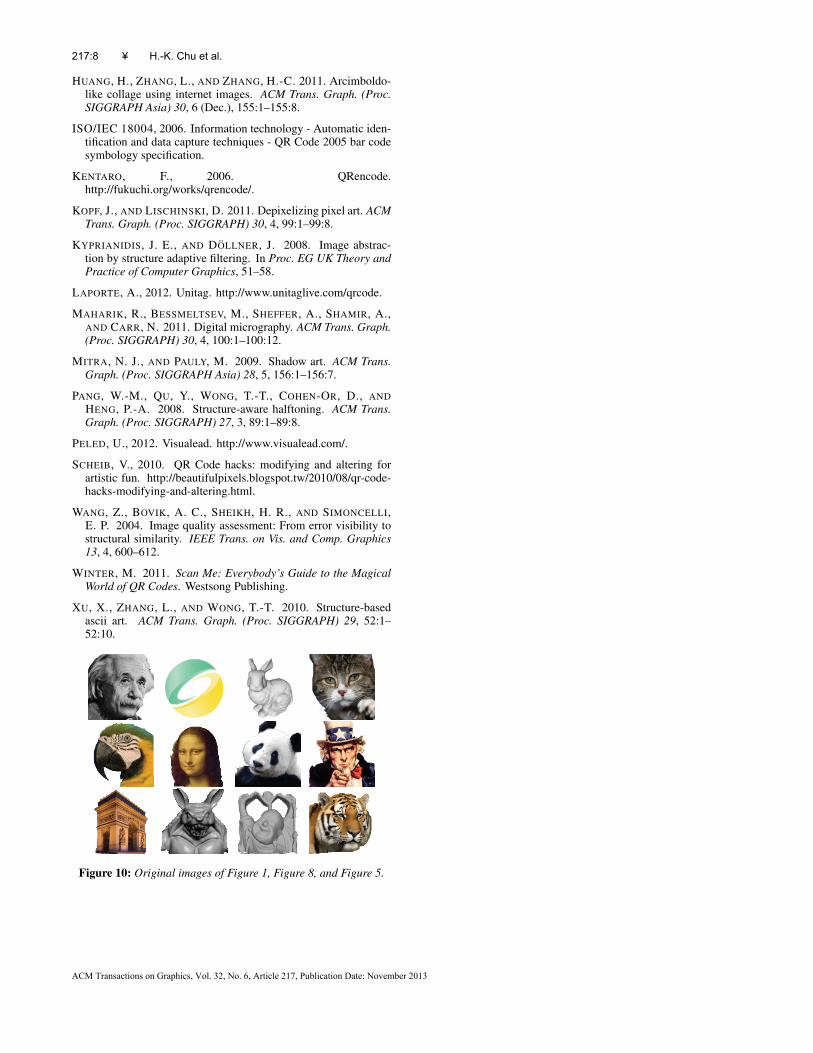
Figure 5: Eight halftone QR codes generated by our method (the original images are shown in Figure 10).
Synthetic QR code database: The procedure first uses the same dataencoding library and random data string to generate QR codes withdifferent appearances. Then it replaces each QR code module witha pattern randomly picked from a subset of P in which patternshave identical color to the module at center pixel (see Figure 4(a)).To evaluate how each pattern is resistant to perturbation, we apply avariety of spatial perturbation to each synthetic QR code to accountfor different scenarios when scanning a code in reality. Specifically,to mimic the situation of scanning the QR code from non-frontalorientations, we apply a random perturbation of yaw, pitch andtranslation in xy plane to QR code image. The range of rotationand translation are from [−3, 3] in degree and [−1, 1] in pixel, re-spectively. We also use a random scaling factor ranges from [1, 30]to simulate scanning the code at different distances.
Pattern reliability evaluation: We used an open source barcodereader, called ZBar [Brown 2007], to decode every synthetic QRcode in database. In addition to returning a boolean value indicat-ing the readability of the QR code, ZBar is also able to providemodule-wise response that informs whether a module is decodedcorrectly. We calculate pattern reliability as a ratio of number ofsuccessful decodes among all samples in database and properly nor-malize the value. Figure 4(b) shows typical examples. Finally, weobtain a database of 0.6 million synthetic QR codes in which thevariation of estimated pattern reliability is stabilized as shown inFigure 4(c). To measure stability, we calculate pattern reliabilityvariation as norm of vector difference and use a threshold of 0.01.
5 Enhancement
Our approach is able to utilize the error correction capability of QRcode to further improve the quality of results. The idea is to allowa few modules to be free from the binding constraint and permitthose modules to pick the best pattern from the full set of P , thusimproving the visual quality at the cost of losing data in moduleswhich will be restored by error correction mechanism.
QR code implements the Reed-Solomon error correction algorithmthat divides a QR code into several disjoint RS blocks and performthe error correction on individual block. Each RS block consists ofcodewords and each codeword contains eight data modules. Code-word is the basic unit in error correction, and is considered as erro-neous and needed to be restored if one of its eight data modules isdecoded incorrectly. QR code specification defines four error cor-rection levels, which are L(7%), M(15%), Q(25%), and H(30%),where the number indicates the percentage of codewords that canbe restored in each RS block. Therefore, it is easy to calculate theerror correction capacity (ECC) of RS blocks in a QR code given aspecific setting of symbol version and error correction level.
We adopt a greedy approach to iteratively remove binding con-straint from codewords. First, we replace β in Equation 3 with aβi for each module mi and initialize its value to 100. Then foreach RS block, we sort its codewords according to a priority cal-culated by averaging the importance weight of eight data modules.The codeword of highest priority will be set free and the βi of itsmodules is set to 0. Next, we solve the pattern assignment opti-mization and count the number of erroneous codewords in each RSblock. The process repeats until it reaches the desired number oferroneous codewords (50% of ECC in our tests).
In order to effectively distinguish semantic salient features (e.g.faces, eyes, etc.) from gradient-based features, we provide a brush
Figure 6: (Left) Result before enhancement. (Middle) Free modulesare highlighted in red. (Right) Result after enhancement.
Halftone QR Codes • 217:5
ACM Transactions on Graphics, Vol. 32, No. 6, Article 217, Publication Date: November 2013
Halftone QR Code Original QR Code
0%10%20%30%40%50%60%70%80%90%
100%
[ 0.0-0.25] (0.25-0.5] (0.5-0.75] (0.75-1.0]
succ
ess r
ate
(a) pattern reliability
QuickMark I-Nigma BeeTag NeoReader
70%
87%95%
0%10%20%30%40%50%60%70%80%90%
100%
0.0 0.3 0.6
(b) λ
0%10%20%30%40%50%60%70%80%90%
100%
10 20 30 40 50 60 70 80 90 100
(c) noise amount (%)
0%10%20%30%40%50%60%70%80%90%
100%
0.5 1 1.5 2 3 4 5 6
(d) blur radius (pixel)
0%10%20%30%40%50%60%70%80%90%
100%
10 20 30 40 50 60 75
(e) viewing angle (degree)
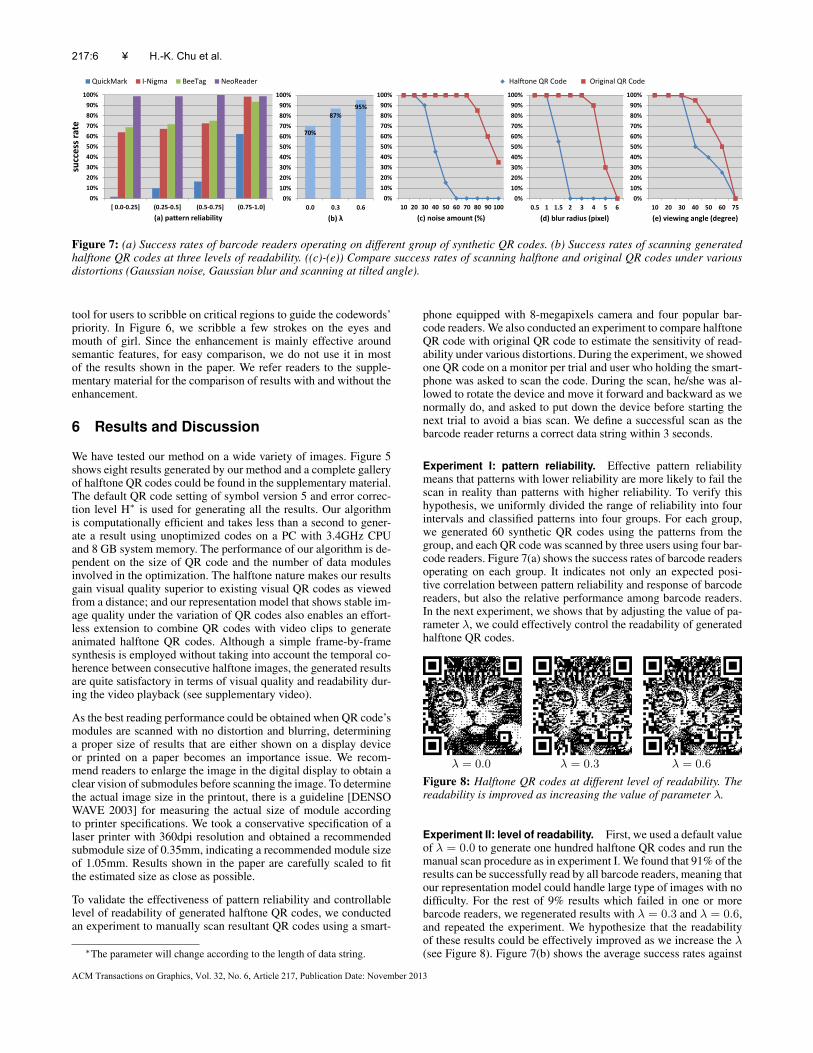
Figure 7: (a) Success rates of barcode readers operating on different group of synthetic QR codes. (b) Success rates of scanning generatedhalftone QR codes at three levels of readability. ((c)-(e)) Compare success rates of scanning halftone and original QR codes under variousdistortions (Gaussian noise, Gaussian blur and scanning at tilted angle).
tool for users to scribble on critical regions to guide the codewords’priority. In Figure 6, we scribble a few strokes on the eyes andmouth of girl. Since the enhancement is mainly effective aroundsemantic features, for easy comparison, we do not use it in mostof the results shown in the paper. We refer readers to the supple-mentary material for the comparison of results with and without theenhancement.
6 Results and Discussion
We have tested our method on a wide variety of images. Figure 5shows eight results generated by our method and a complete galleryof halftone QR codes could be found in the supplementary material.The default QR code setting of symbol version 5 and error correc-tion level H∗ is used for generating all the results. Our algorithmis computationally efficient and takes less than a second to gener-ate a result using unoptimized codes on a PC with 3.4GHz CPUand 8 GB system memory. The performance of our algorithm is de-pendent on the size of QR code and the number of data modulesinvolved in the optimization. The halftone nature makes our resultsgain visual quality superior to existing visual QR codes as viewedfrom a distance; and our representation model that shows stable im-age quality under the variation of QR codes also enables an effort-less extension to combine QR codes with video clips to generateanimated halftone QR codes. Although a simple frame-by-framesynthesis is employed without taking into account the temporal co-herence between consecutive halftone images, the generated resultsare quite satisfactory in terms of visual quality and readability dur-ing the video playback (see supplementary video).
As the best reading performance could be obtained when QR code’smodules are scanned with no distortion and blurring, determininga proper size of results that are either shown on a display deviceor printed on a paper becomes an importance issue. We recom-mend readers to enlarge the image in the digital display to obtain aclear vision of submodules before scanning the image. To determinethe actual image size in the printout, there is a guideline [DENSOWAVE 2003] for measuring the actual size of module accordingto printer specifications. We took a conservative specification of alaser printer with 360dpi resolution and obtained a recommendedsubmodule size of 0.35mm, indicating a recommended module sizeof 1.05mm. Results shown in the paper are carefully scaled to fitthe estimated size as close as possible.
To validate the effectiveness of pattern reliability and controllablelevel of readability of generated halftone QR codes, we conductedan experiment to manually scan resultant QR codes using a smart-
∗The parameter will change according to the length of data string.
phone equipped with 8-megapixels camera and four popular bar-code readers. We also conducted an experiment to compare halftoneQR code with original QR code to estimate the sensitivity of read-ability under various distortions. During the experiment, we showedone QR code on a monitor per trial and user who holding the smart-phone was asked to scan the code. During the scan, he/she was al-lowed to rotate the device and move it forward and backward as wenormally do, and asked to put down the device before starting thenext trial to avoid a bias scan. We define a successful scan as thebarcode reader returns a correct data string within 3 seconds.
Experiment I: pattern reliability. Effective pattern reliabilitymeans that patterns with lower reliability are more likely to fail thescan in reality than patterns with higher reliability. To verify thishypothesis, we uniformly divided the range of reliability into fourintervals and classified patterns into four groups. For each group,we generated 60 synthetic QR codes using the patterns from thegroup, and each QR code was scanned by three users using four bar-code readers. Figure 7(a) shows the success rates of barcode readersoperating on each group. It indicates not only an expected posi-tive correlation between pattern reliability and response of barcodereaders, but also the relative performance among barcode readers.In the next experiment, we shows that by adjusting the value of pa-rameter λ, we could effectively control the readability of generatedhalftone QR codes.
λ = 0.0 λ = 0.3 λ = 0.6
Figure 8: Halftone QR codes at different level of readability. Thereadability is improved as increasing the value of parameter λ.
Experiment II: level of readability. First, we used a default valueof λ = 0.0 to generate one hundred halftone QR codes and run themanual scan procedure as in experiment I. We found that 91% of theresults can be successfully read by all barcode readers, meaning thatour representation model could handle large type of images with nodifficulty. For the rest of 9% results which failed in one or morebarcode readers, we regenerated results with λ = 0.3 and λ = 0.6,and repeated the experiment. We hypothesize that the readabilityof these results could be effectively improved as we increase the λ(see Figure 8). Figure 7(b) shows the average success rates against
217:6 • H.-K. Chu et al.
ACM Transactions on Graphics, Vol. 32, No. 6, Article 217, Publication Date: November 2013
different λ values, and a single factor ANOVA analysis with α =0.05 is used to verify our hypothesis (p-values < 0.01).
Experiment III: sensitivity of readability. To compare the per-formance of halftone QR code with original QR code, we randomlyselected 5 out of 91% successful results and corresponding originalQR codes, then separately applied to images Gaussian noise withvarious amounts from 10% to 100%, Gaussian blur with kernel ra-dius from 0.5 to 6 pixels, and scanned the code at tilted angle from10 to 75 degrees. Each QR code was scanned by three users usingfour barcode readers. As shown in Figure 7((c)-(e)), the halftoneQR codes stop being functional under excessive setting of Gaussiannoise (40%), Gaussian blur (2 pixels) and viewing angle (40 de-grees), while the original QR codes crash at Gaussian noise (80%),Gaussian blur (6 pixels) and viewing angle (60 degrees). In fact,this tradeoff allows our algorithm to create visual QR codes.
Limitations. The visual quality of our results is restricted by theemployed halftoning technique which might produce low qualityimages due to the low image resolution and contrast. For instance,QR codes of symbol version 1 and 2 will render to images of size63× 63 and 75× 75 pixels, respectively, and both are too small toproduce satisfactory halftone results as shown in Figure 9. Althoughwe could use a sophisticated subdivision model such as 5× 5 to in-crease the image resolution, it will exponentially increase the num-ber of binary patterns as well and makes pattern reliability evalu-ation and pattern assignment optimization intractable. Besides, thereadability of our results is inherently sensitive to blurred imagecaused by image downsampling. The center pixel of pattern whichcarries the original data module is easily polluted and damaged byits neighboring pixels.
Figure 9: Limitation: Visual quality of our result degrades as thesymbol version of QR code decreases from 3(left) to 1(right).
7 Conclusion and Future Work
Creating visually attractive QR codes has received a growing de-mand in diverse fields especially in marketing and advertising. Themain challenge lies in how to incorporate high-level visual features(e.g. colors, letters, illustrations, logos, etc.) with ordinary QR codewithout compromising its readability. We presented an automaticalgorithm to create a new type of visual QR code, called halftoneQR code, at a controllable level of readability. There are two ma-jor components in our approach. One is a representation model thatminimally binds to the original QR codes and is flexible to adaptto target halftone images; and the other is an introduction of pat-tern reliability which enables the control over level of readability.We proposed a systematic approach to automatically build a largedatabase of synthetic QR codes and used it to statistically model thepattern reliability. Finally, we tested our approach using a wide va-riety of images and conducted an experiment of manually scanningthe resultant QR codes to validate the effectiveness of our approach.In addition to generating valid halftone QR codes, we also believethat our synthetic database is a potential benchmark tool for evalu-
ating the performance of various barcode readers.
Several interesting future works are worth exploring. First, usinga color halftone image instead of a binary one would be an inter-esting extension to produce more attractive visual QR codes. Thismight be done by using a modified similarity distance metric whichaccounts for color difference and introducing additional term to pre-serve the original contrast between adjacent modules. In the appli-cation of animated halftone QR codes, we currently do not take intoaccount the temporal coherence, resulting in the flickering artifacts.However, we realized the factor that not every frame needed to bereadable during the animation, thus enabling the flexibility to incor-porate temporal coherence at the cost of losing readability at someframes. Understanding a proper time interval of dropped readabil-ity without hurting user’s feeling regarding to readability, and pre-serving temporal coherence between halftone images are challeng-ing problems which we would like to investigate in the near future.Lastly, our approach might benefit other types of two-dimensionalbarcodes as well, enabling the incorporation of halftone images thatproduces visually appealing barcodes.
Acknowledgements. We are grateful to the anonymous review-ers for their comments and suggestions; Jr-Iang Chiou for generat-ing the results; all the participants of the user study for their timeof scanning QR codes; and Gerardo Figueroa for video narration.We are thankful to Luis Sousa for granting permission to use thepanda photo. The Cat and Arc de Triomphe are image courtesy ofDavid Corby and Benh LIEU SONG, respectively. The project wassupported in part by the National Science Council of Taiwan (NSC-102-2221-E-007-055-MY3 and NSC-102-2220-E-007-023), Min-istry of Economic Affairs of Taiwan (MOEA-102-EC-17-A-02-S1-202), an Adobe research gift and an UCL impact award.
References
A T COMMUNICATIONS CO., L., 2007. LogoQnet.http://logoq.net/.
BOYKOV, Y., VEKSLER, O., AND ZABIH, R. 2001. Fast approx-imate energy minimization via graph cuts. IEEE Trans. PatternAnal. Mach. Intell. 23, 11, 1222–1239.
BROWN, J., 2007. Zbar bar code reader.http://zbar.sourceforge.net/.
CHAN, H., 2011. HOW TO: Make Your QR Codes More Beautiful.http://mashable.com/2011/04/18/qr-code-design-tips/.
CHANG, J., ALAIN, B., AND OSTROMOUKHOV, V. 2009.Structure-aware error diffusion. ACM Trans. Graph. (Proc. SIG-GRAPH Asia) 28, 5, 162:1–162:8.
CHU, H.-K., HSU, W.-H., MITRA, N. J., COHEN-OR, D.,WONG, T.-T., AND LEE, T.-Y. 2010. Camouflage images. ACMTrans. Graph. (Proc. SIGGRAPH) 29, 51:1–51:8.
COX, R., 2012. QArt Codes. http://research.swtch.com/qart.
DENSO WAVE, 2003. QR code.com. http://www.qrcode.com/en/.
D’HAEM, J., 2010. QR Code R©Artist. http://www.qrcartist.com/.
FLICKR, 2009. QR code Art. http://www.flickr.com/groups/qr-art/.
GAL, R., SORKINE, O., POPA, T., SHEFFER, A., AND COHEN-OR, D. 2007. 3D collage: Expressive non-realistic modeling. InProc. of NPAR, ACM, 14.
Halftone QR Codes • 217:7
ACM Transactions on Graphics, Vol. 32, No. 6, Article 217, Publication Date: November 2013
HUANG, H., ZHANG, L., AND ZHANG, H.-C. 2011. Arcimboldo-like collage using internet images. ACM Trans. Graph. (Proc.SIGGRAPH Asia) 30, 6 (Dec.), 155:1–155:8.
ISO/IEC 18004, 2006. Information technology - Automatic iden-tification and data capture techniques - QR Code 2005 bar codesymbology specification.
KENTARO, F., 2006. QRencode.http://fukuchi.org/works/qrencode/.
KOPF, J., AND LISCHINSKI, D. 2011. Depixelizing pixel art. ACMTrans. Graph. (Proc. SIGGRAPH) 30, 4, 99:1–99:8.
KYPRIANIDIS, J. E., AND DOLLNER, J. 2008. Image abstrac-tion by structure adaptive filtering. In Proc. EG UK Theory andPractice of Computer Graphics, 51–58.
LAPORTE, A., 2012. Unitag. http://www.unitaglive.com/qrcode.
MAHARIK, R., BESSMELTSEV, M., SHEFFER, A., SHAMIR, A.,AND CARR, N. 2011. Digital micrography. ACM Trans. Graph.(Proc. SIGGRAPH) 30, 4, 100:1–100:12.
MITRA, N. J., AND PAULY, M. 2009. Shadow art. ACM Trans.Graph. (Proc. SIGGRAPH Asia) 28, 5, 156:1–156:7.
PANG, W.-M., QU, Y., WONG, T.-T., COHEN-OR, D., ANDHENG, P.-A. 2008. Structure-aware halftoning. ACM Trans.Graph. (Proc. SIGGRAPH) 27, 3, 89:1–89:8.
PELED, U., 2012. Visualead. http://www.visualead.com/.
SCHEIB, V., 2010. QR Code hacks: modifying and altering forartistic fun. http://beautifulpixels.blogspot.tw/2010/08/qr-code-hacks-modifying-and-altering.html.
WANG, Z., BOVIK, A. C., SHEIKH, H. R., AND SIMONCELLI,E. P. 2004. Image quality assessment: From error visibility tostructural similarity. IEEE Trans. on Vis. and Comp. Graphics13, 4, 600–612.
WINTER, M. 2011. Scan Me: Everybody’s Guide to the MagicalWorld of QR Codes. Westsong Publishing.
XU, X., ZHANG, L., AND WONG, T.-T. 2010. Structure-basedascii art. ACM Trans. Graph. (Proc. SIGGRAPH) 29, 52:1–52:10.
Figure 10: Original images of Figure 1, Figure 8, and Figure 5.
217:8 • H.-K. Chu et al.
ACM Transactions on Graphics, Vol. 32, No. 6, Article 217, Publication Date: November 2013


![fo|qr vkos'k ,oa fo|qr {ks=k€¦ · ekWM~;wy - 5 fo|qr vkos'k ,oa fo|qr {ks=k fo|qr ,oa pqEcdRo fVIif.k;k¡ 2 HkkSfrdh zoS|qr f}èkzqo] f}èkzqo&vk?kw.kZ vkSj f}èkqzo osQ fo|qr](https://img.pdfslide.net/doc/110x75/601db649fe63d00cb5115118/foqr-vkosk-oa-foqr-ksk-ekwmwy-5-foqr-vkosk-oa-foqr-ksk-foqr-oa.jpg)