Embed Size (px)
DESCRIPTION
Halo Report
Citation preview
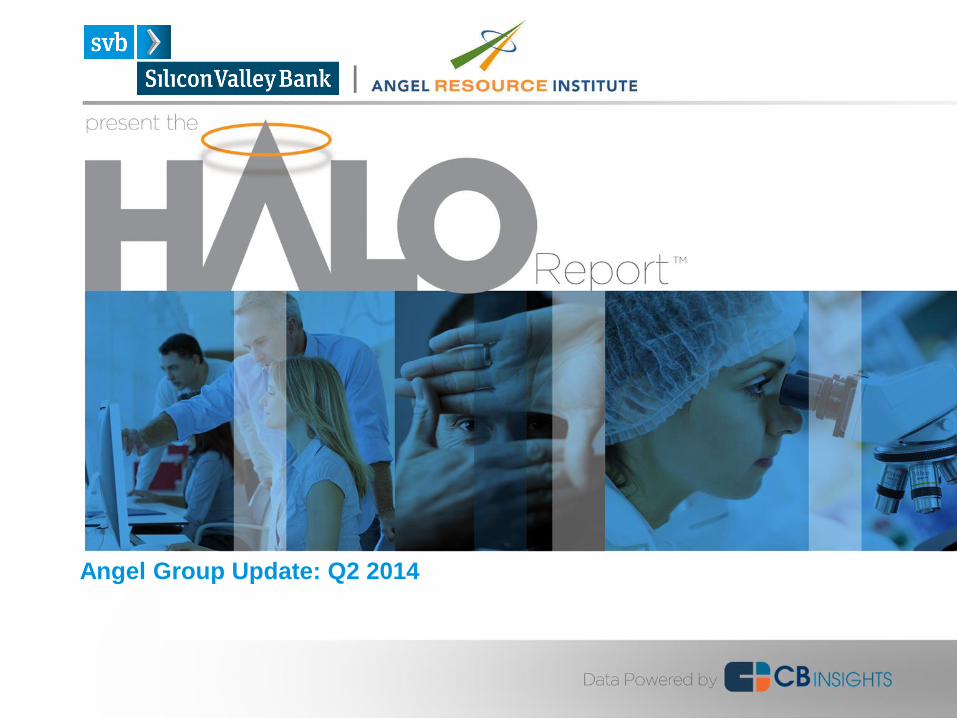
Angel Group Update: Q2 2014
Table of Contents
Q2 2014 Highlights p. 3
National Trends p. 5
Most Active Angels p.11
Regional Trends p.13
Sector Trends p.18
About the Halo Report p.21
2

Q2 2014 Highlights
3
Angel Group Update: Halo Report Q2 2014
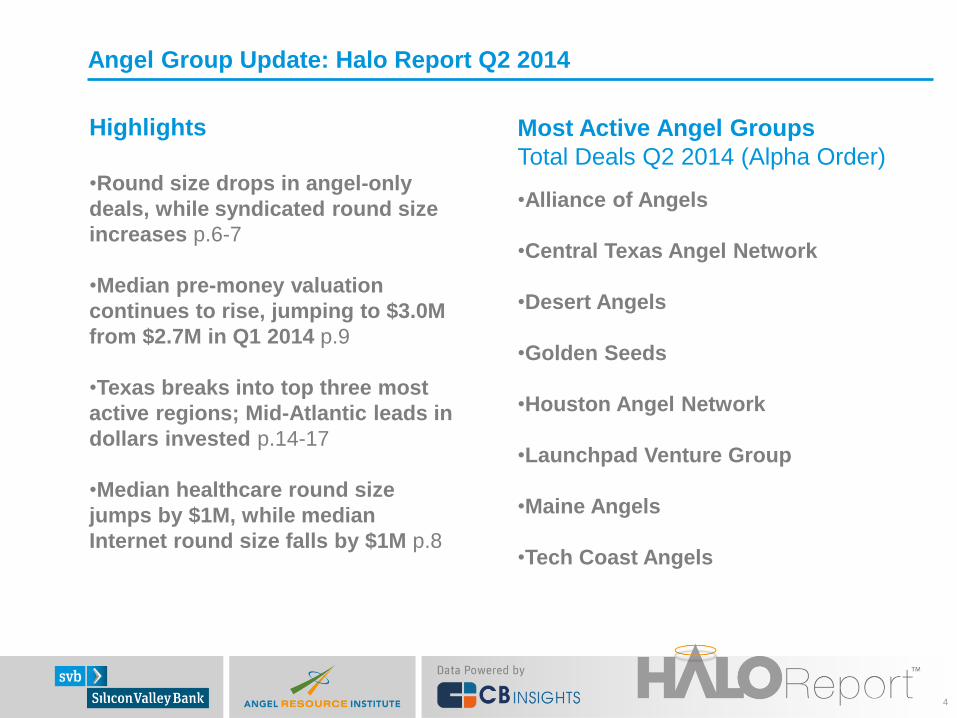
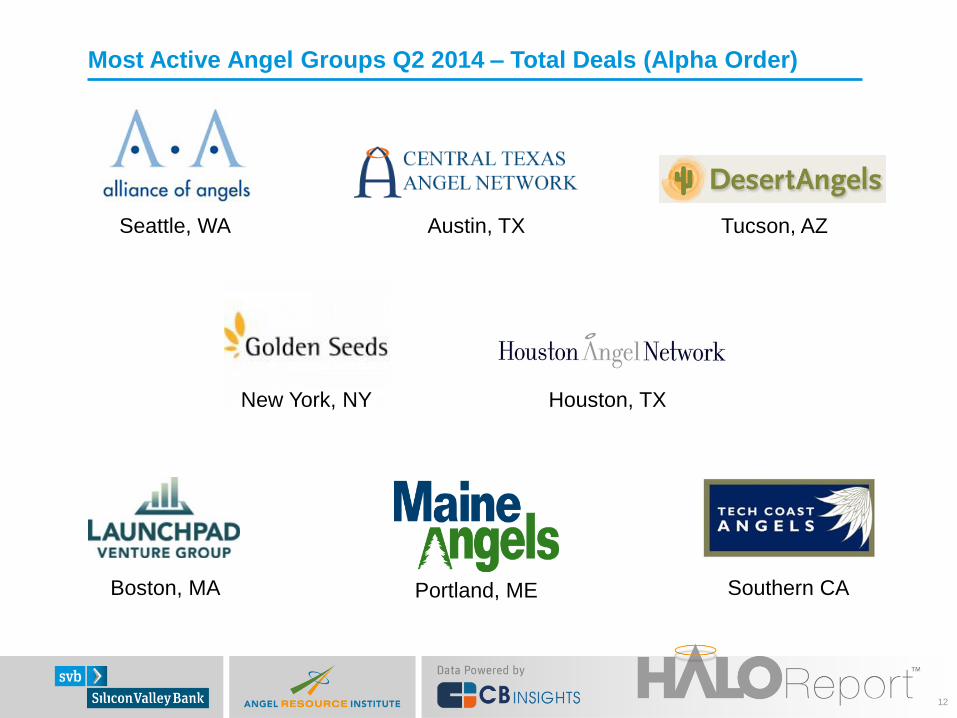
Most Active Angel Groups
Total Deals Q2 2014 (Alpha Order)
•Alliance of Angels
•Central Texas Angel Network
•Desert Angels
•Golden Seeds
•Houston Angel Network
•Launchpad Venture Group
•Maine Angels
•Tech Coast Angels
Highlights
•Round size drops in angel-only
deals, while syndicated round size
increases p.6-7
•Median pre-money valuation
continues to rise, jumping to $3.0M
from $2.7M in Q1 2014 p.9
•Texas breaks into top three most
active regions; Mid-Atlantic leads in
dollars invested p.14-17
•Median healthcare round size
jumps by $1M, while median
Internet round size falls by $1M p.8
4
National Trends
5
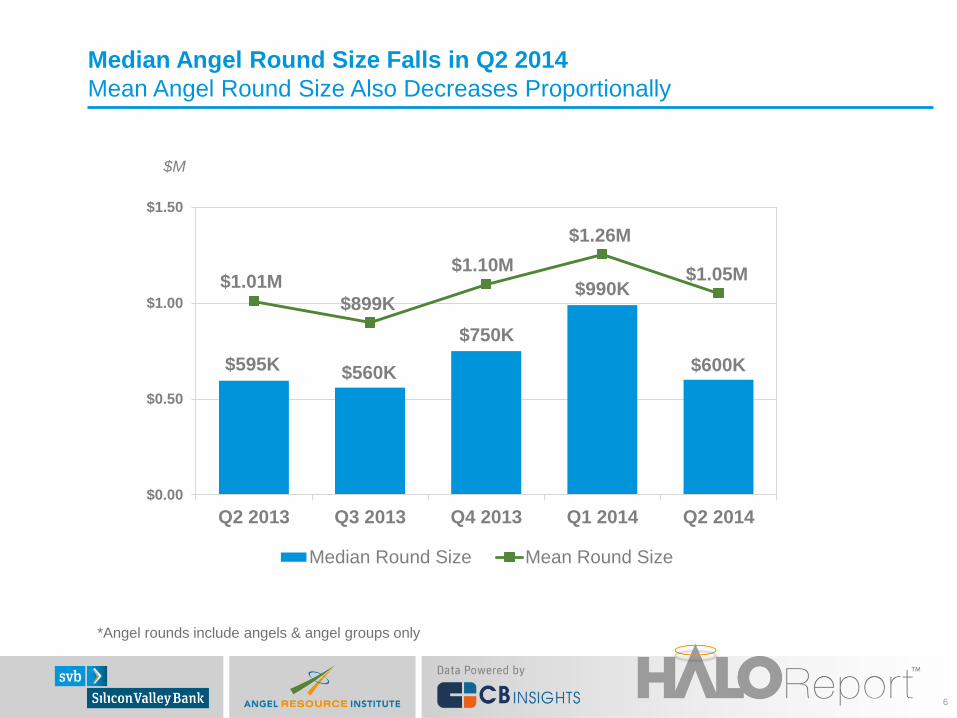
Median Angel Round Size Falls in Q2 2014
Mean Angel Round Size Also Decreases Proportionally
$0.00
$0.50
$1.00
$1.50
Q2 2013 Q3 2013 Q4 2013 Q1 2014 Q2 2014
Median Round Size Mean Round Size
6
*Angel rounds include angels & angel groups only
$1.01M
$899K
$1.10M
$1.26M
$1.05M
$595K $560K
$750K
$990K
$600K
$M
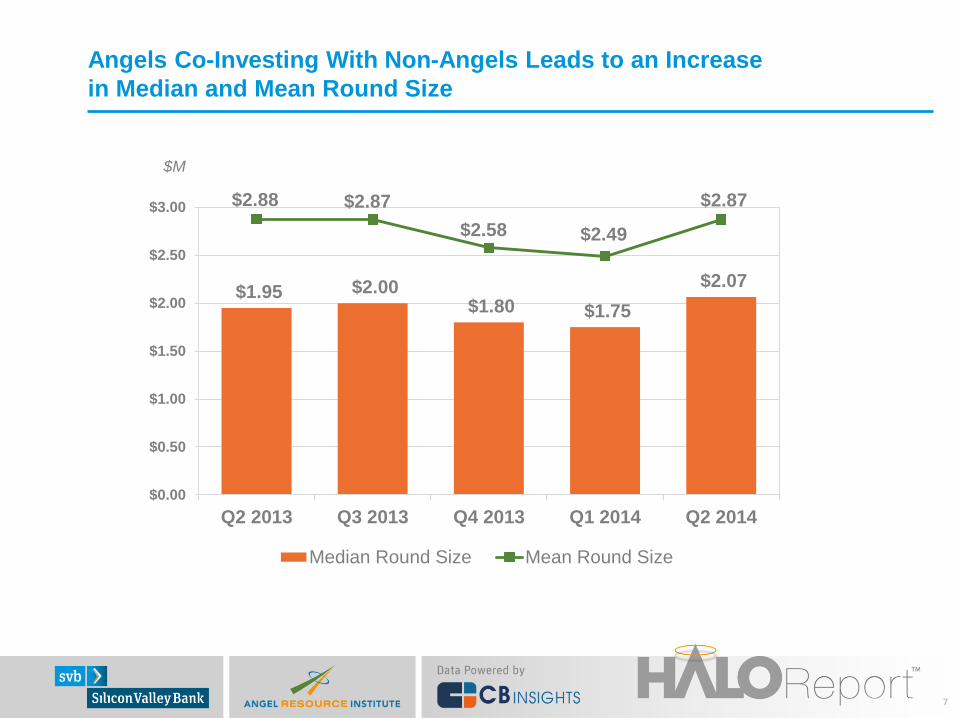
Angels Co-Investing With Non-Angels Leads to an Increase
in Median and Mean Round Size
$1.95 $2.00 $1.80 $1.75
$2.07
$2.88 $2.87
$2.58 $2.49
$2.87
$0.00
$0.50
$1.00
$1.50
$2.00
$2.50
$3.00
Q2 2013 Q3 2013 Q4 2013 Q1 2014 Q2 2014
Median Round Size Mean Round Size
7
$M
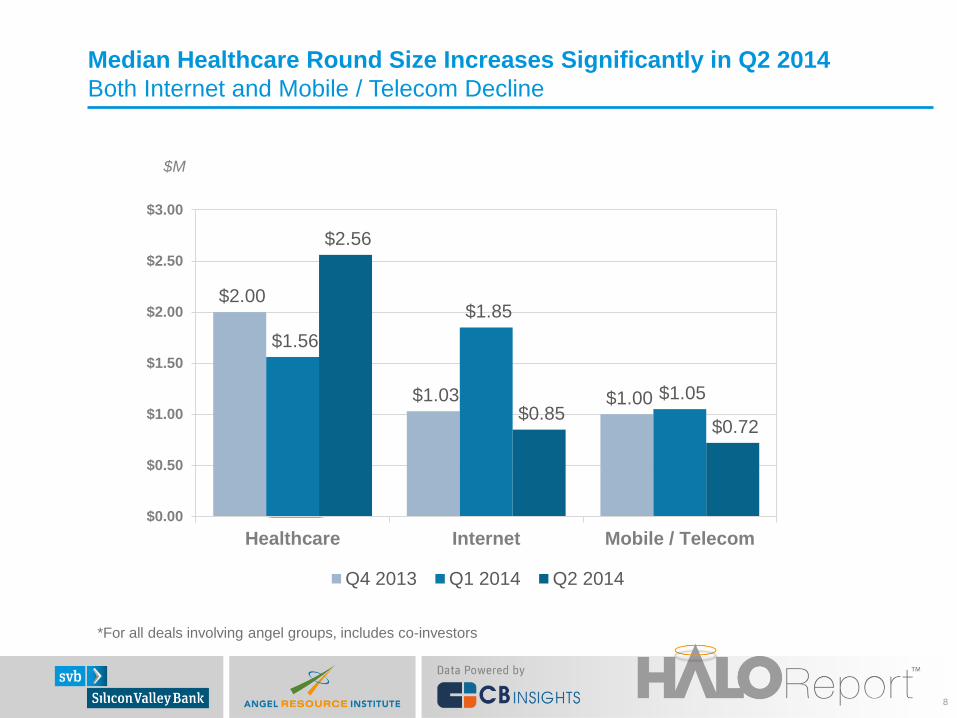
Median Healthcare Round Size Increases Significantly in Q2 2014
Both Internet and Mobile / Telecom Decline
$2.00
$1.03 $1.00
$1.56
$1.85
$1.05
$2.56
$0.85 $0.72
$0.00
$0.50
$1.00
$1.50
$2.00
$2.50
$3.00
Healthcare Internet Mobile / Telecom
Q4 2013 Q1 2014 Q2 2014
8
*For all deals involving angel groups, includes co-investors
$M
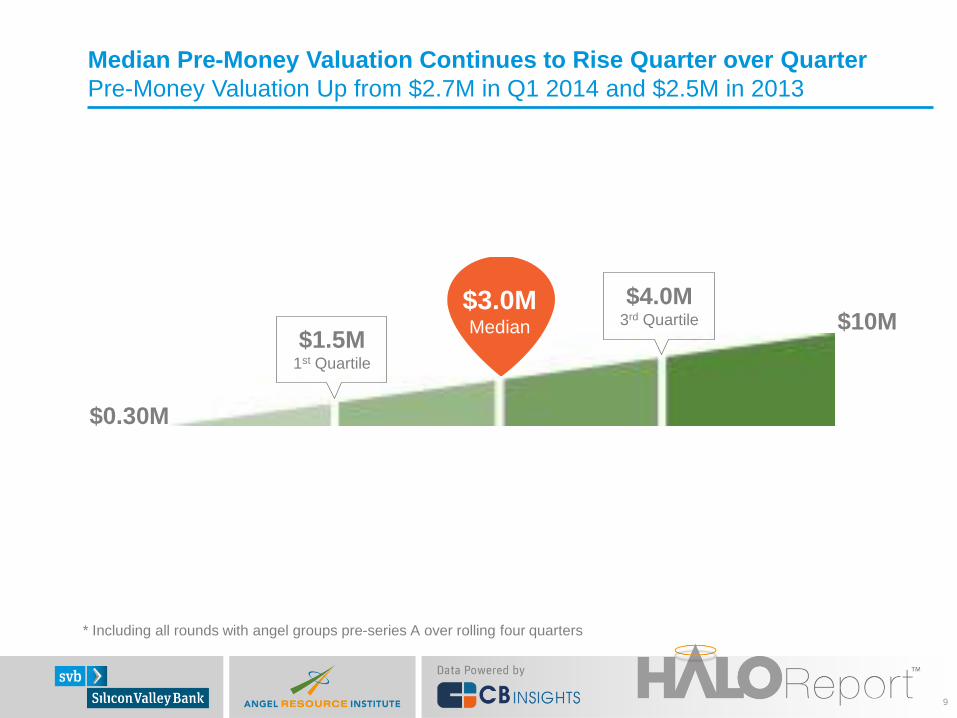
Median Pre-Money Valuation Continues to Rise Quarter over Quarter
Pre-Money Valuation Up from $2.7M in Q1 2014 and $2.5M in 2013
9
$3.0M Median
$1.5M 1st Quartile
$4.0M 3rd Quartile
$0.30M
$10M
* Including all rounds with angel groups pre-series A over rolling four quarters
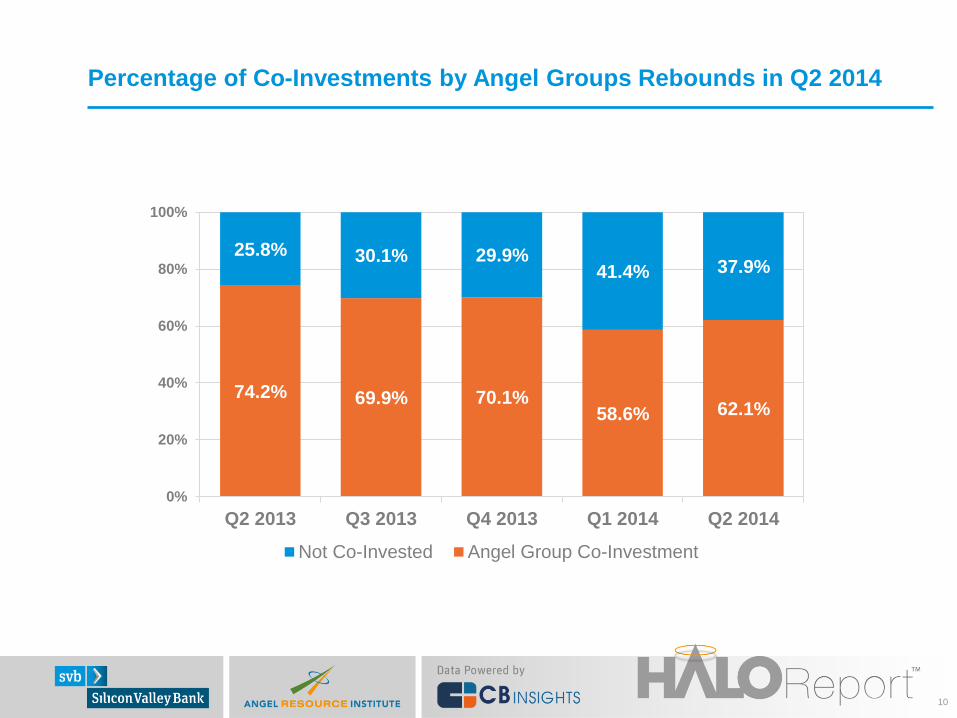
74.2% 69.9% 70.1% 58.6% 62.1%
25.8% 30.1% 29.9% 41.4% 37.9%
0%
20%
40%
60%
80%
100%
Q2 2013 Q3 2013 Q4 2013 Q1 2014 Q2 2014
Not Co-Invested Angel Group Co-Investment
10
Percentage of Co-Investments by Angel Groups Rebounds in Q2 2014
Active Angel Groups
11
Most Active Angel Groups Q2 2014 – Total Deals (Alpha Order)
12
Southern CA
Houston, TX
Boston, MA
Austin, TX Tucson, AZ Seattle, WA
New York, NY
Portland, ME

Regional Trends
13
14
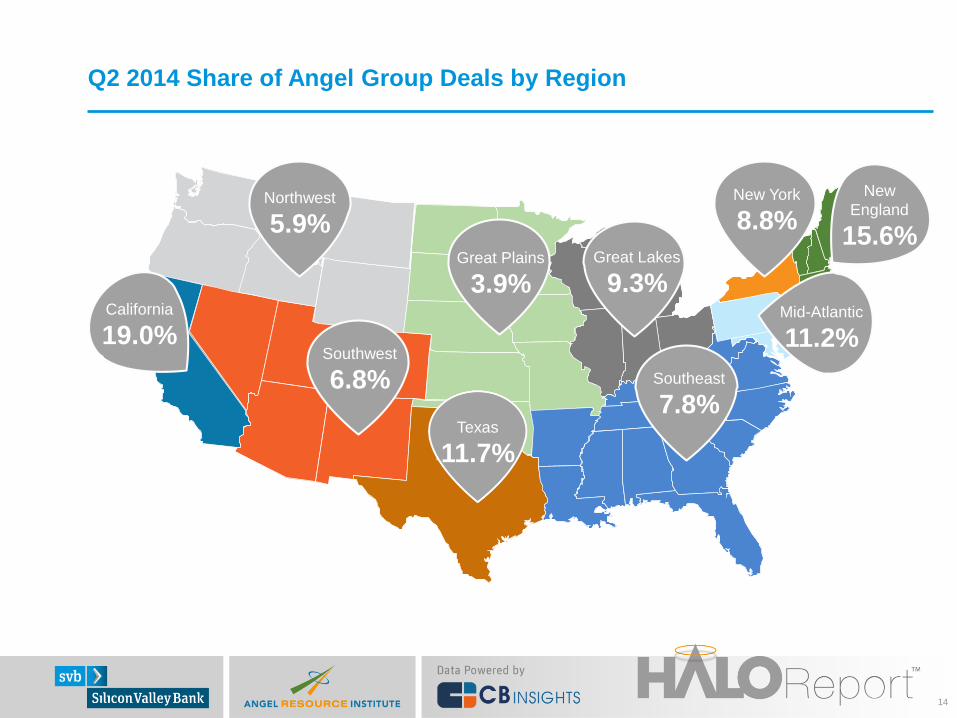
California
19.0%
Northwest
5.9%
Southwest
6.8%
Great Plains
3.9% Great Lakes
9.3%
Southeast
7.8%
Mid-Atlantic
11.2%
New
England
15.6%
New York
8.8%
Texas
11.0% Texas
11.7%
Q2 2014 Share of Angel Group Deals by Region
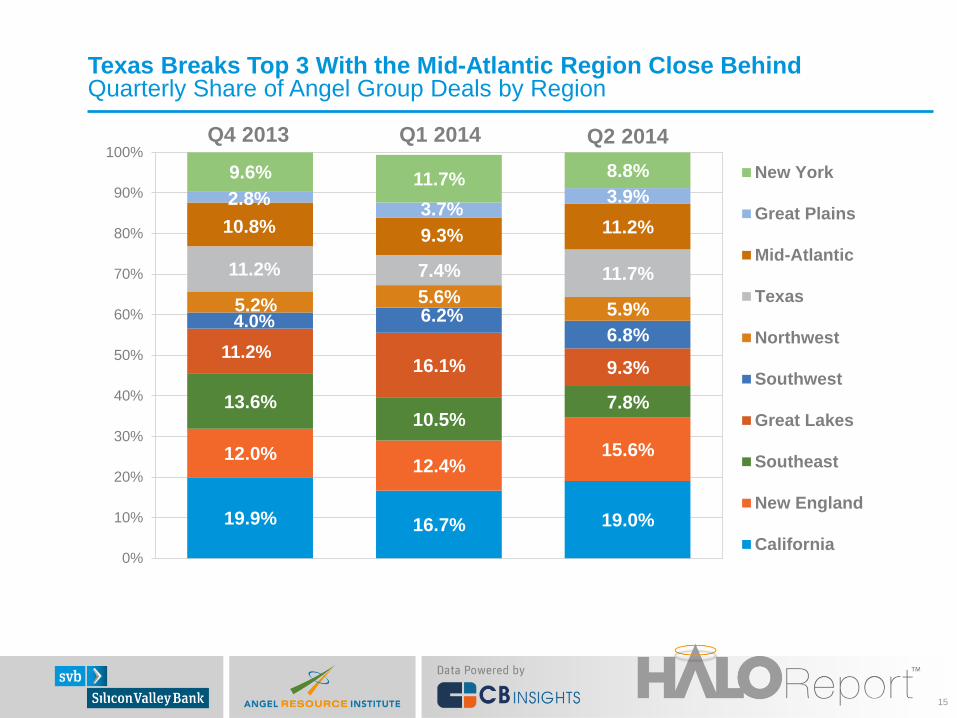
Texas Breaks Top 3 With the Mid-Atlantic Region Close Behind Quarterly Share of Angel Group Deals by Region
19.9% 16.7% 19.0%
12.0% 12.4%
15.6%
13.6% 10.5%
7.8%
11.2% 16.1% 9.3%
4.0% 6.2% 6.8%
5.2% 5.6% 5.9%
11.2% 7.4% 11.7%
9.3% 11.2%
2.8% 3.7%
3.9%
9.6% 11.7% 8.8%
0%
10%
20%
30%
40%
50%
60%
70%
80%
90%
100%
New York
Great Plains
Mid-Atlantic
Texas
Northwest
Southwest
Great Lakes
Southeast
New England
California
15
Q1 2014 Q4 2013 Q2 2014
10.8%
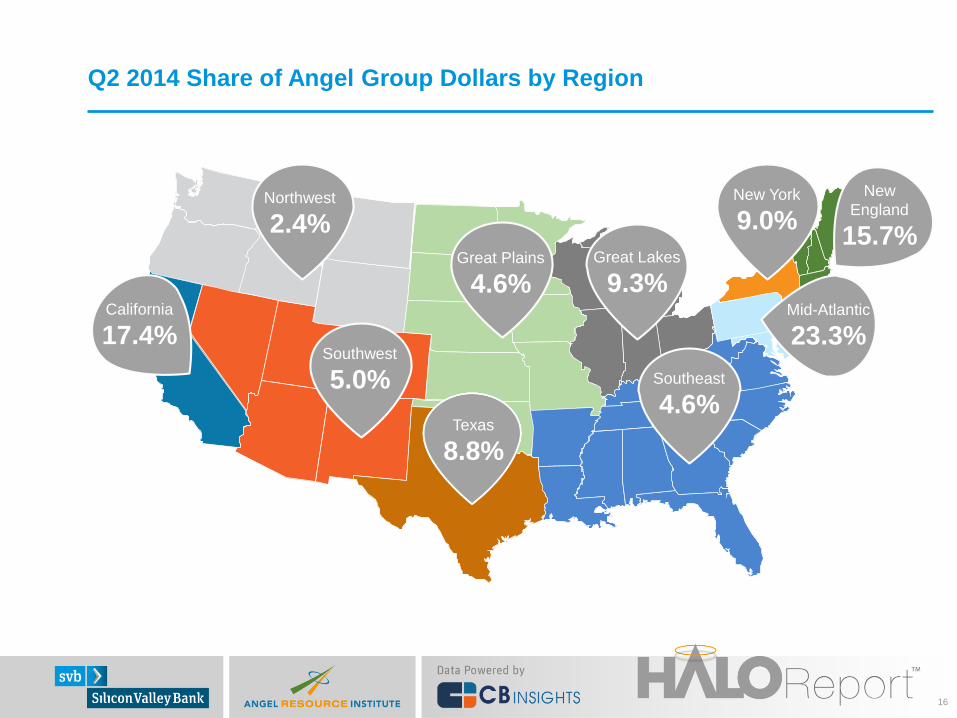
16
California
17.4%
Northwest
2.4%
Southwest
5.0%
Great Plains
4.6% Great Lakes
9.3%
Southeast
4.6%
Mid-Atlantic
23.3%
New
England
15.7%
New York
9.0%
Texas
6.1%
Texas
8.8%
Q2 2014 Share of Angel Group Dollars by Region
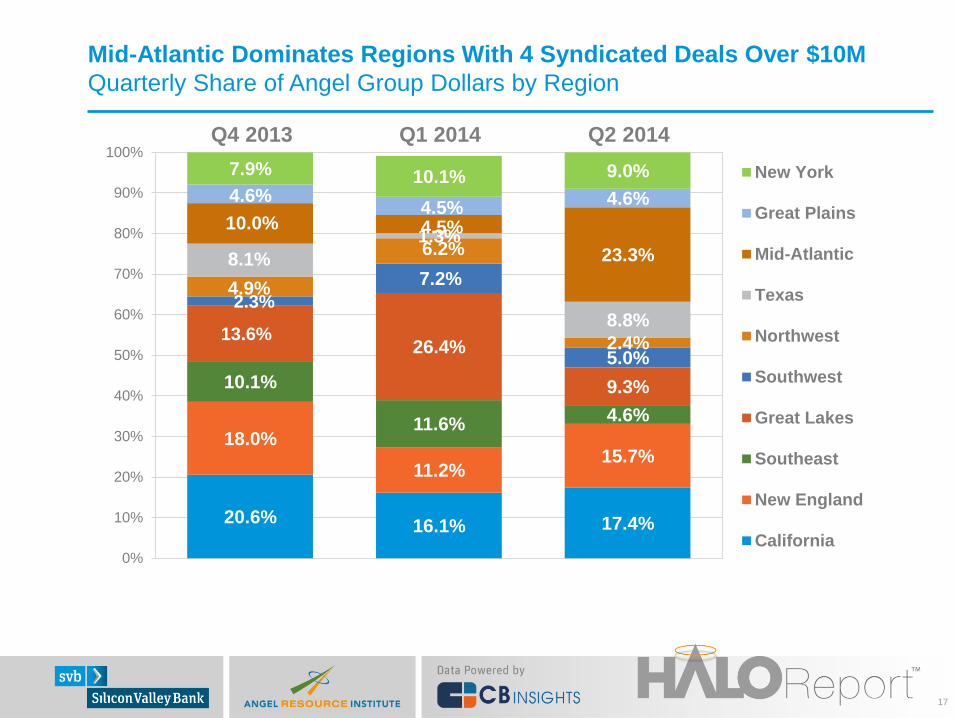
20.6% 16.1% 17.4%
18.0%
11.2% 15.7%
10.1%
11.6% 4.6%
13.6% 26.4%
9.3%
2.3%
7.2%
5.0%
4.9%
6.2%
2.4%
8.1%
1.3%
8.8%
4.5%
23.3%
4.6% 4.5%
4.6%
7.9% 10.1% 9.0%
0%
10%
20%
30%
40%
50%
60%
70%
80%
90%
100%
New York
Great Plains
Mid-Atlantic
Texas
Northwest
Southwest
Great Lakes
Southeast
New England
California
10.0%
17
Q1 2014 Q4 2013 Q2 2014
Mid-Atlantic Dominates Regions With 4 Syndicated Deals Over $10M
Quarterly Share of Angel Group Dollars by Region
Sector Trends
18
39.8% 38.9% 40.3%
18.7% 19.8% 18.5%
16.7% 14.8% 11.2%
2.8% 1.9% 4.9%
4.4% 5.6% 4.9%
4.4% 3.1% 4.9%
1.2% 3.1% 3.9%
12.0% 13.0% 11.7%
0%
10%
20%
30%
40%
50%
60%
70%
80%
90%
100%
Other
Food & Beverages
Consumer Products &Services
Industrial
Software
Mobile & Telecom
Healthcare
Internet
19
Q1 2014 Q4 2013 Q2 2014
Healthcare & Internet Remain Stable While Mobile Down Slightly
Quarterly Share of Angel Group Deals by Sector
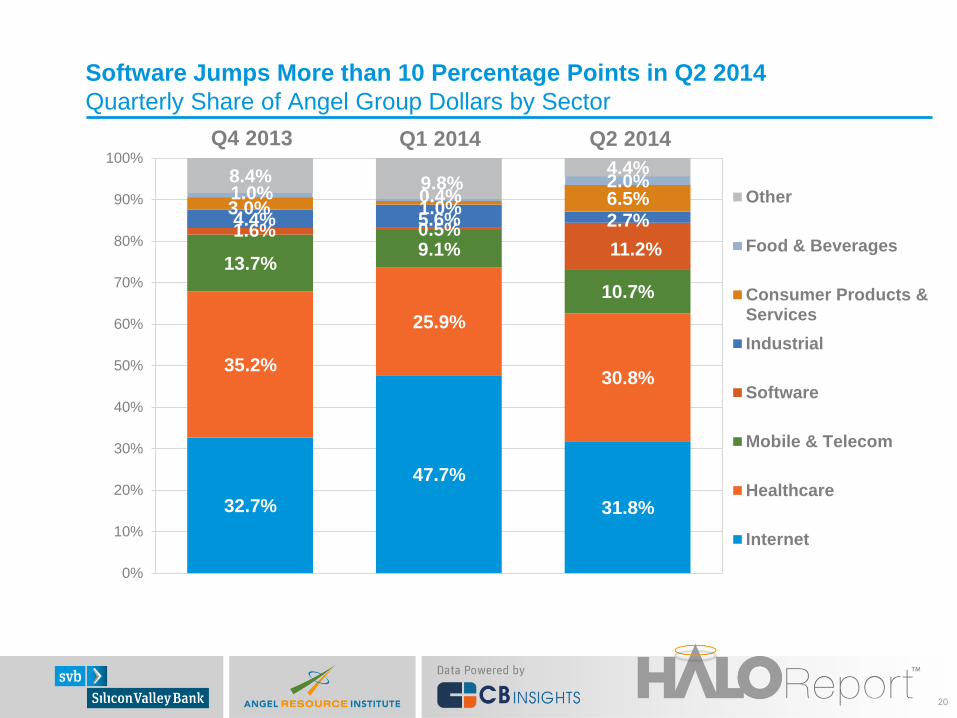
32.7%
47.7%
31.8%
35.2%
25.9%
30.8%
13.7% 9.1%
10.7%
1.6% 0.5% 11.2%
4.4% 5.6% 2.7% 3.0%
6.5% 1.0% 2.0% 8.4% 9.8% 4.4%
0%
10%
20%
30%
40%
50%
60%
70%
80%
90%
100%
Other
Food & Beverages
Consumer Products &Services
Industrial
Software
Mobile & Telecom
Healthcare
Internet
0.4% 1.0%
20
Software Jumps More than 10 Percentage Points in Q2 2014
Quarterly Share of Angel Group Dollars by Sector
Q1 2014 Q4 2013 Q2 2014
About the Halo Report™
21
What is the Halo Report™?
Angel Group Investment Trends: The Angel Resource Institute, Silicon Valley Bank and
CB Insights set out to raise awareness of early stage investment activities by angel
investment groups. The Halo Report is the result. The research series highlights angel
investment activity and trends in North America and provides much sought after data that
has not been previously available to entrepreneurs or early stage investors.
The Halo Report includes aggregate analysis of investment activity by angels and angel
groups and highlights trends in round sizes, location and industry preferences. The data is
collected via survey and aggregation of public data using CB Insights innovative data
analyses.
Get Involved: Angel groups and individual angel investors interested in including their data
in the Halo Report should contact JJ Knight, Halo Report Coordinator: 910-523-5503 and
22
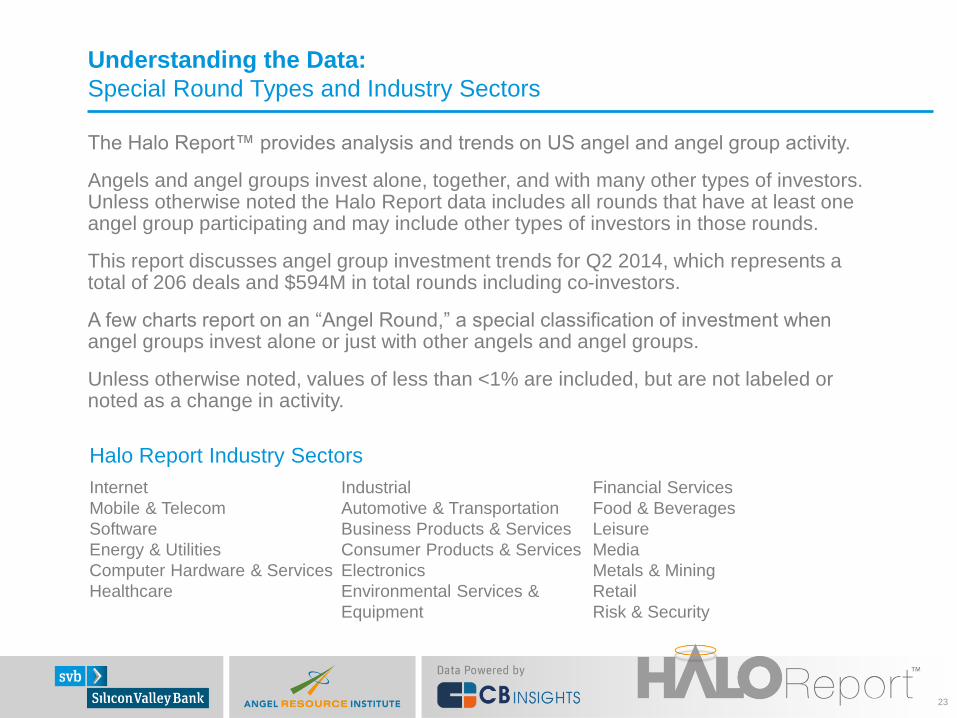
Understanding the Data:
Special Round Types and Industry Sectors
The Halo Report™ provides analysis and trends on US angel and angel group activity.
Angels and angel groups invest alone, together, and with many other types of investors. Unless otherwise noted the Halo Report data includes all rounds that have at least one angel group participating and may include other types of investors in those rounds.
This report discusses angel group investment trends for Q2 2014, which represents a total of 206 deals and $594M in total rounds including co-investors.
A few charts report on an “Angel Round,” a special classification of investment when angel groups invest alone or just with other angels and angel groups.
Unless otherwise noted, values of less than <1% are included, but are not labeled or noted as a change in activity.
23
Internet
Mobile & Telecom
Software
Energy & Utilities
Computer Hardware & Services
Healthcare
Industrial
Automotive & Transportation
Business Products & Services
Consumer Products & Services
Electronics
Environmental Services &
Equipment
Financial Services
Food & Beverages
Leisure
Media
Metals & Mining
Retail
Risk & Security
Halo Report Industry Sectors
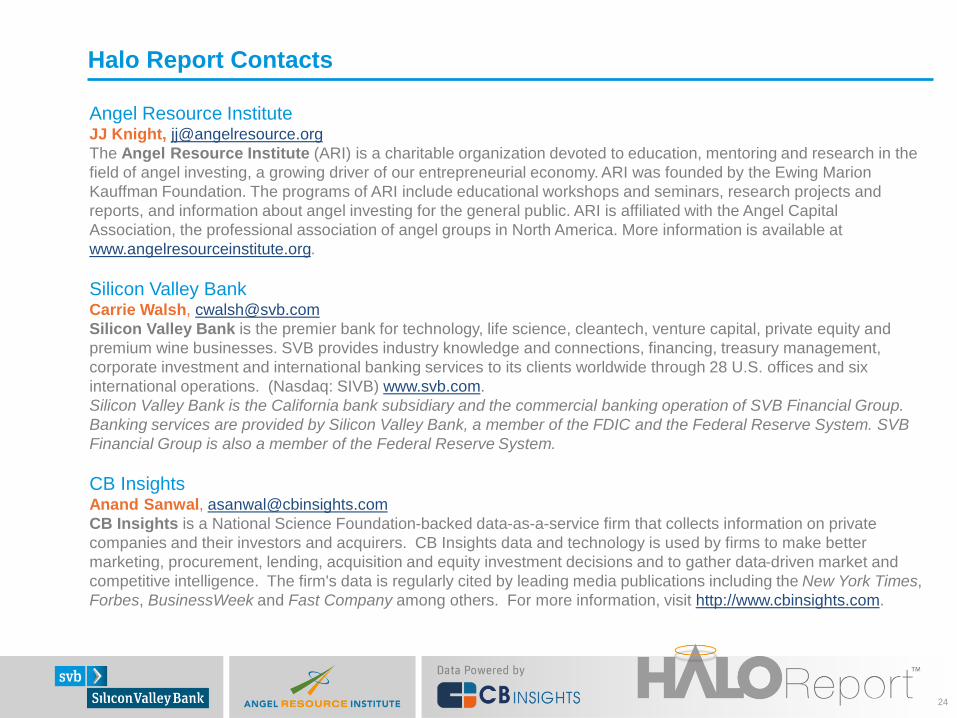
Angel Resource Institute JJ Knight, [email protected]
The Angel Resource Institute (ARI) is a charitable organization devoted to education, mentoring and research in the
field of angel investing, a growing driver of our entrepreneurial economy. ARI was founded by the Ewing Marion
Kauffman Foundation. The programs of ARI include educational workshops and seminars, research projects and
reports, and information about angel investing for the general public. ARI is affiliated with the Angel Capital
Association, the professional association of angel groups in North America. More information is available at
www.angelresourceinstitute.org.
Silicon Valley Bank Carrie Walsh, [email protected]
Silicon Valley Bank is the premier bank for technology, life science, cleantech, venture capital, private equity and
premium wine businesses. SVB provides industry knowledge and connections, financing, treasury management,
corporate investment and international banking services to its clients worldwide through 28 U.S. offices and six
international operations. (Nasdaq: SIVB) www.svb.com.
Silicon Valley Bank is the California bank subsidiary and the commercial banking operation of SVB Financial Group.
Banking services are provided by Silicon Valley Bank, a member of the FDIC and the Federal Reserve System. SVB
Financial Group is also a member of the Federal Reserve System.
CB Insights Anand Sanwal, [email protected]
CB Insights is a National Science Foundation-backed data-as-a-service firm that collects information on private
companies and their investors and acquirers. CB Insights data and technology is used by firms to make better
marketing, procurement, lending, acquisition and equity investment decisions and to gather data-driven market and
competitive intelligence. The firm's data is regularly cited by leading media publications including the New York Times,
Forbes, BusinessWeek and Fast Company among others. For more information, visit http://www.cbinsights.com.
Halo Report Contacts
24
Angel Resource Institute and Silicon Valley Bank co-produce the Halo Report™ with data powered by CB Insights.
Angel Resource Institute and CB Insights are independent third parties and are not affiliates of Silicon Valley Bank.
This material, including without limitation to the statistical information herein, is provided for informational purposes only. The
information should not be viewed as tax, investment, legal or other advice nor is it to be relied on in making an investment or
other decision. You should obtain relevant and specific professional advice before making any investment decision. Nothing
relating to the material should be construed as a solicitation, offer or recommendation to acquire or dispose of any investment
or to engage in any other transaction.
©2014 SVB Financial Group. All rights reserved. SVB, SVB Financial Group, and Silicon Valley Bank are registered
trademarks.
25