Embed Size (px)
Citation preview
Han: Data Cubes 1
Data Warehouses and Data Cubes
Han Textbook Chapter2 Will not say much about data warehouses
but will give a brief introduction to the multi-dimensional data model and data cubes in this lecture.
Distinguished Speaker Friday 11a in 232 PGH (http://www.cs.uh.edu/docs/cosc/seminars/2010/11.05-srivastava.pdf )!!!
Han: Data Cubes 2
What is Data Warehouse?
Defined in many different ways, but not rigorously. A decision support database that is maintained
separately from the organization’s operational database
Support information processing by providing a solid platform of consolidated, historical data for analysis.
“A data warehouse is a subject-oriented, integrated, time-variant, and nonvolatile collection of data in support of management’s decision-making process.”—W. H. Inmon
Data warehousing: The process of constructing and using data
warehouses
Han: Data Cubes 3
Data Warehouse Usage
Three kinds of data warehouse applications Information processing
supports querying, basic statistical analysis, and reporting using crosstabs, tables, charts and graphs
Analytical processing and Interactive Analysis multidimensional analysis of data warehouse data supports basic OLAP operations, slice-dice, drilling,
pivoting Data mining
knowledge discovery from hidden patterns supports associations, constructing analytical models,
performing classification and prediction, and presenting the mining results using visualization tools.
Differences among the three tasks
Han: Data Cubes 4
Data Warehouse vs. Heterogeneous DBMS
Traditional heterogeneous DB integration: Build wrappers/mediators on top of heterogeneous databases Query driven approach
When a query is posed to a client site, a meta-dictionary is used to translate the query into queries appropriate for individual heterogeneous sites involved, and the results are integrated into a global answer set
Complex information filtering, compete for resources
Data warehouse: update-driven, high performance Information from heterogeneous sources is integrated in
advance and stored in warehouses for direct query and analysis
Han: Data Cubes 5
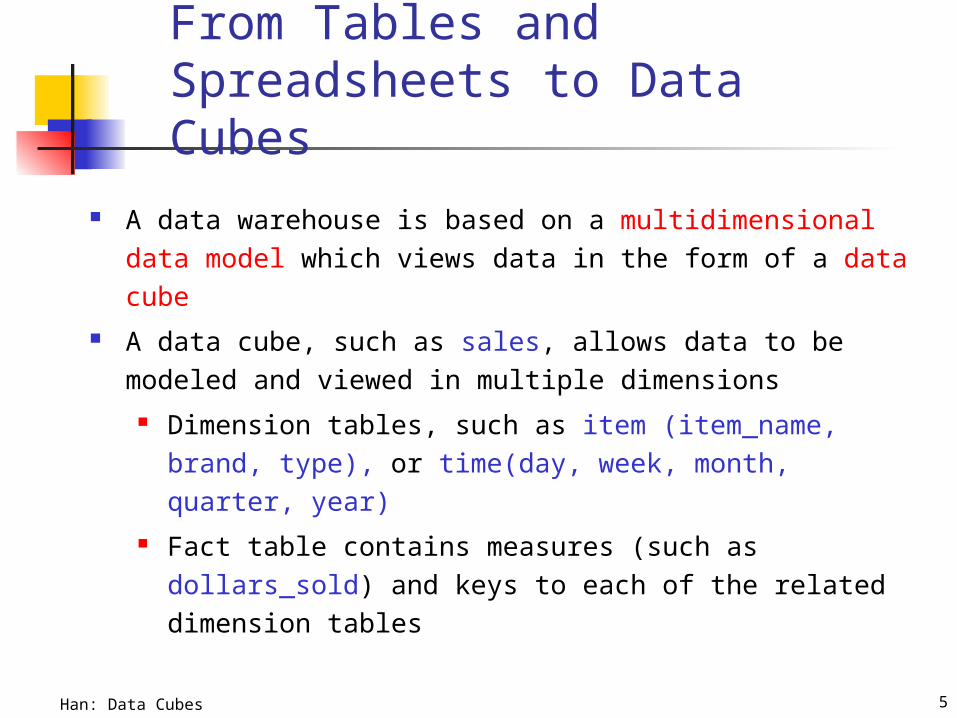
From Tables and Spreadsheets to Data Cubes
A data warehouse is based on a multidimensional data model which views data in the form of a data cube
A data cube, such as sales, allows data to be modeled and viewed in multiple dimensions
Dimension tables, such as item (item_name, brand, type), or time(day, week, month, quarter, year)
Fact table contains measures (such as dollars_sold) and keys to each of the related dimension tables
Han: Data Cubes 6
Data Cube Terminology
A data cube supports viewing/modelling of a variable (a set of variables) of interest. Measures are used to report the values of the particular variable with respect to a given set of dimensions.
A fact table stores measures as well as keys representing relationships to various dimensions.
Dimensions are perspectives with respect to which an organization wants to keep record.
A star schema defines a fact table and its associated dimensions.
Han: Data Cubes 7
Conceptual Modeling of Data Warehouses
Modeling data warehouses: dimensions & measures Star schema: A fact table in the middle connected
to a set of dimension tables Snowflake schema: A refinement of star schema
where some dimensional hierarchy is normalized
into a set of smaller dimension tables, forming a
shape similar to snowflake Fact constellations: Multiple fact tables share
dimension tables, viewed as a collection of stars,
therefore called galaxy schema or fact constellation
Han: Data Cubes 8
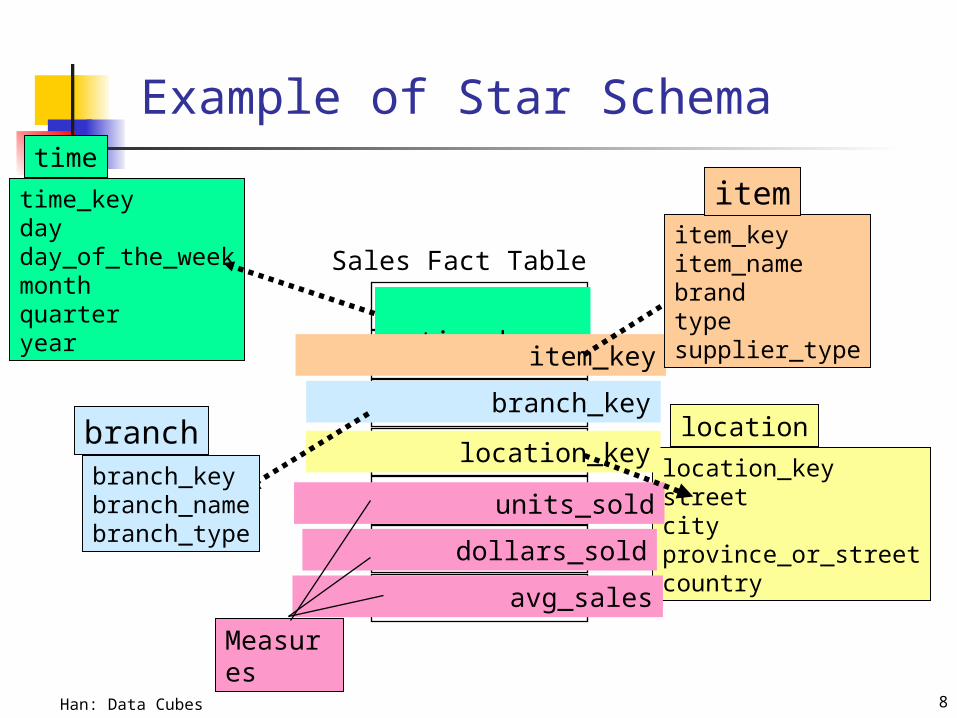
Example of Star Schema
time_keydayday_of_the_weekmonthquarteryear
time
location_keystreetcityprovince_or_streetcountry
location
Sales Fact Table
time_key
item_key
branch_key
location_key
units_sold
dollars_sold
avg_sales
Measures
item_keyitem_namebrandtypesupplier_type
item
branch_keybranch_namebranch_type
branch
Han: Data Cubes 9
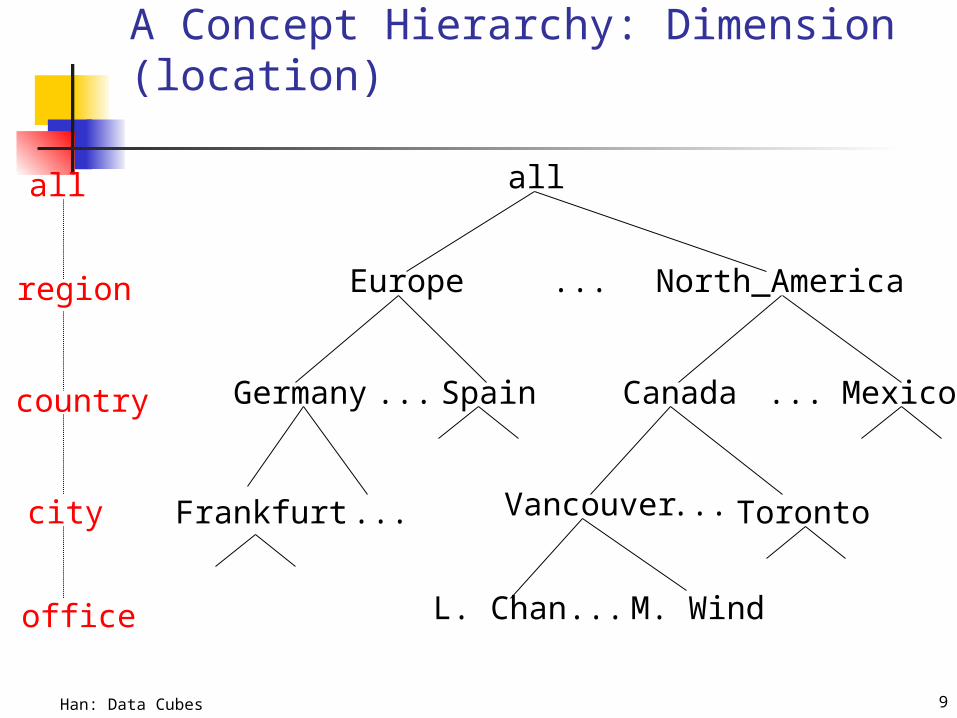
A Concept Hierarchy: Dimension (location)
all
Europe North_America
MexicoCanadaSpainGermany
Vancouver
M. WindL. Chan
...
......
... ...
...
all
region
office
country
TorontoFrankfurtcity
Han: Data Cubes 10
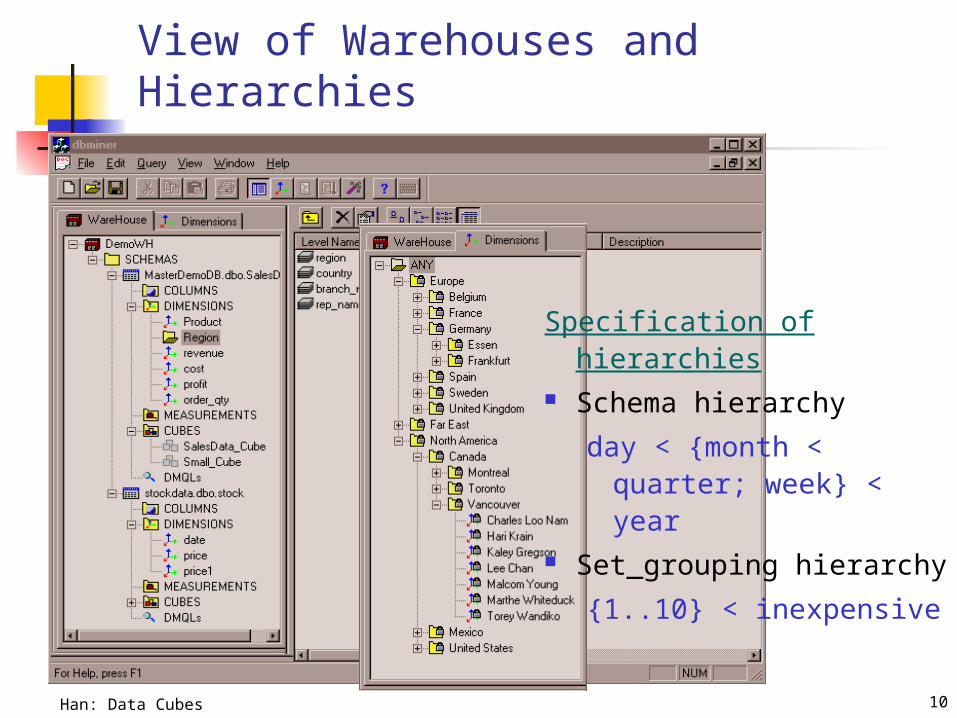
View of Warehouses and Hierarchies
Specification of hierarchies Schema hierarchy
day < {month < quarter; week} < year
Set_grouping hierarchy
{1..10} < inexpensive
Han: Data Cubes 11
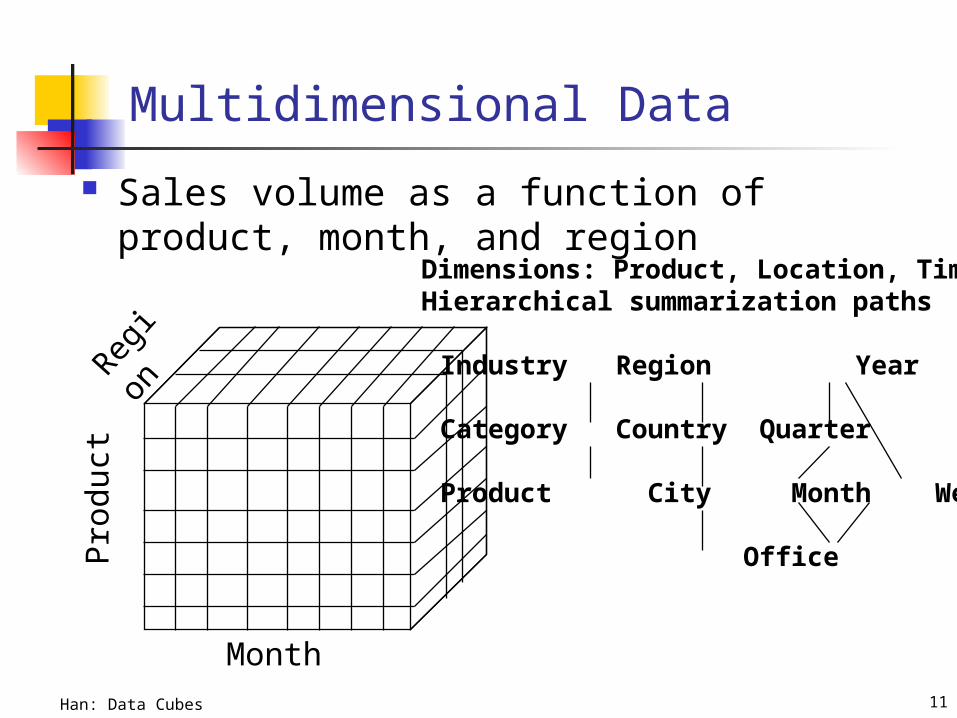
Multidimensional Data
Sales volume as a function of product, month, and region
Pro
duct
Regio
n
Month
Dimensions: Product, Location, TimeHierarchical summarization paths
Industry Region Year
Category Country Quarter
Product City Month Week
Office Day
Han: Data Cubes 12
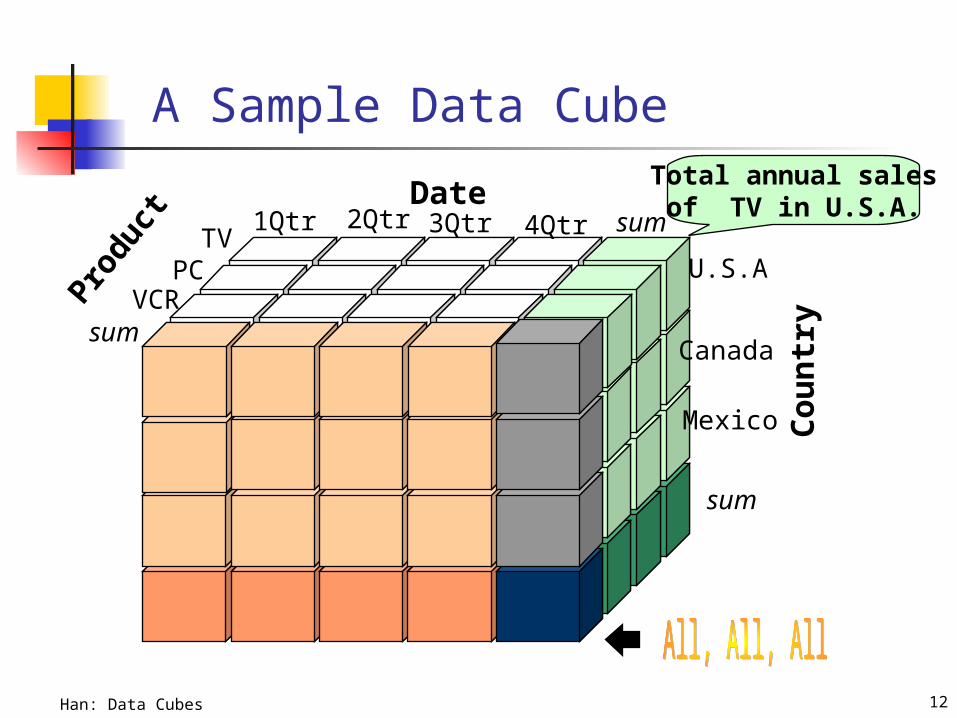
A Sample Data CubeTotal annual salesof TV in U.S.A.Date
Produ
ct
Cou
ntr
ysum
sum TV
VCRPC
1Qtr 2Qtr 3Qtr 4Qtr
U.S.A
Canada
Mexico
sum
Han: Data Cubes 13
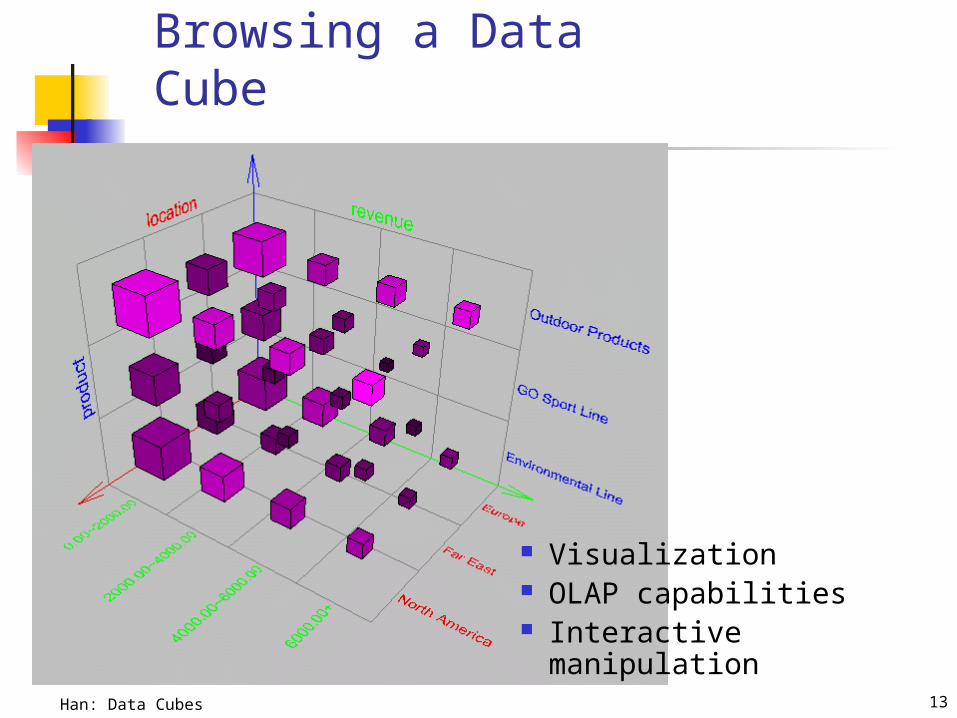
Browsing a Data Cube
Visualization OLAP capabilities Interactive manipulation
Han: Data Cubes 14
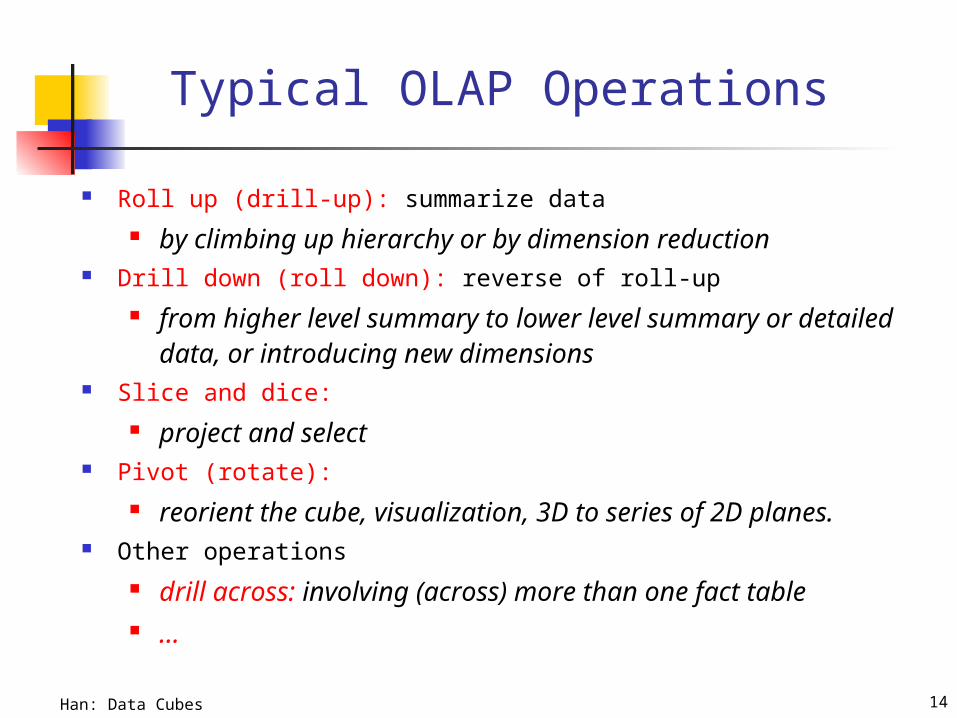
Typical OLAP Operations
Roll up (drill-up): summarize data by climbing up hierarchy or by dimension reduction
Drill down (roll down): reverse of roll-up from higher level summary to lower level summary or
detailed data, or introducing new dimensions Slice and dice:
project and select Pivot (rotate):
reorient the cube, visualization, 3D to series of 2D planes.
Other operations drill across: involving (across) more than one fact table …
Han: Data Cubes 15
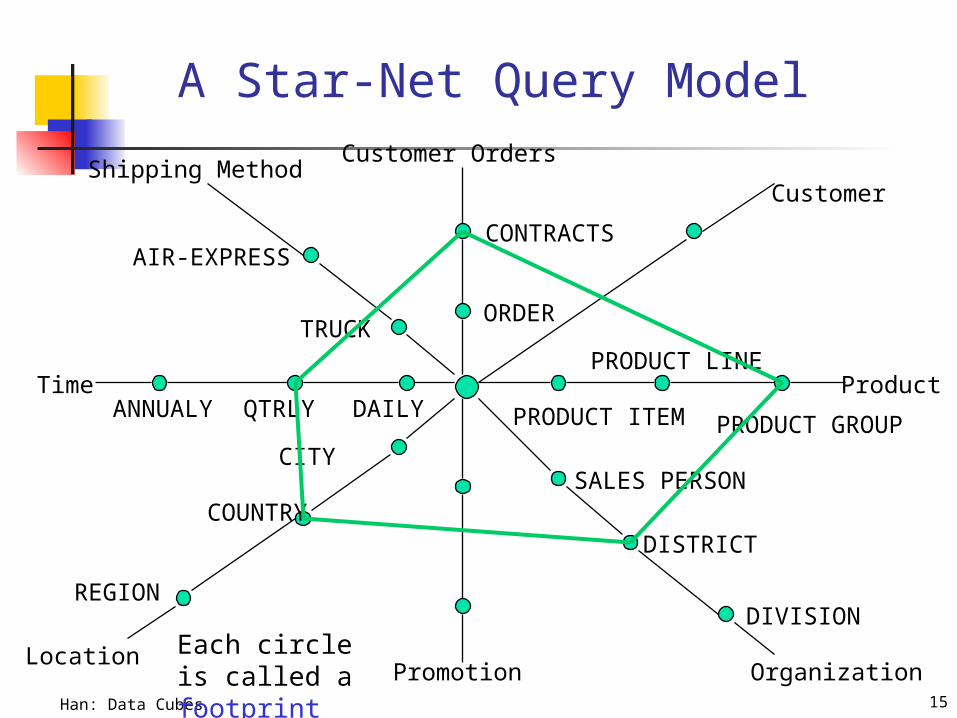
A Star-Net Query Model
Shipping Method
AIR-EXPRESS
TRUCKORDER
Customer Orders
CONTRACTS
Customer
Product
PRODUCT GROUP
PRODUCT LINE
PRODUCT ITEM
SALES PERSON
DISTRICT
DIVISION
OrganizationPromotion
CITY
COUNTRY
REGION
Location
DAILYQTRLYANNUALYTime
Each circle is called a footprint
Han: Data Cubes 16
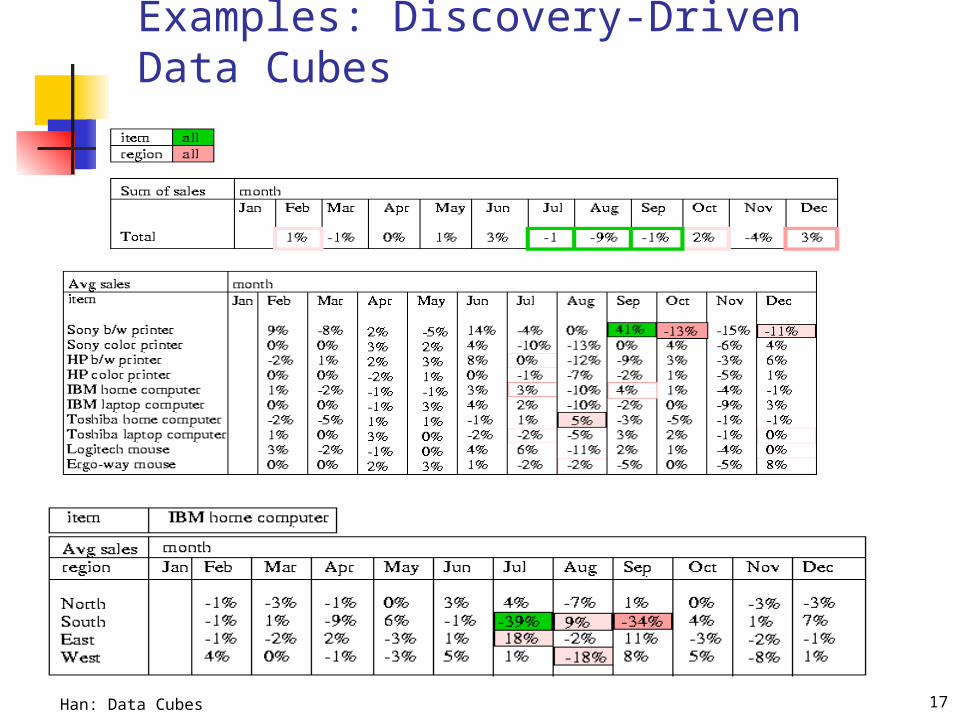
Discovery-Driven Exploration of Data Cubes
Hypothesis-driven: exploration by user, huge search space
Discovery-driven (Sarawagi et al.’98)
pre-compute measures indicating exceptions, guide user
in the data analysis, at all levels of aggregation
Exception: significantly different from the value
anticipated, based on a statistical model
Visual cues such as background color are used to reflect
the degree of exception of each cell
Computation of exception indicator (modeling fitting and
computing SelfExp, InExp, and PathExp values) can be
overlapped with cube construction
Han: Data Cubes 17
Examples: Discovery-Driven Data Cubes
Han: Data Cubes 18
Software to Work with Data Cubes
http://www.bi-verdict.com/ http://www.bi-verdict.com/fileadmin/Free
Analyses/Comment_OLAP_revival.htm
Han: Data Cubes 19
Summary
Data warehouse A subject-oriented, integrated, time-variant, and
nonvolatile collection of data in support of management’s decision-making process
A multi-dimensional model of a data warehouse
Star schema, snowflake schema, fact constellations A data cube allows to view measures with respect to
a given set of dimensions
OLAP operations: drilling, rolling, slicing, dicing and pivoting
Han: Data Cubes 20
References (I) S. Agarwal, R. Agrawal, P. M. Deshpande, A. Gupta, J. F. Naughton, R. Ramakrishnan, and S.
Sarawagi. On the computation of multidimensional aggregates. In Proc. 1996 Int. Conf. Very Large Data Bases, 506-521, Bombay, India, Sept. 1996.
D. Agrawal, A. E. Abbadi, A. Singh, and T. Yurek. Efficient view maintenance in data warehouses. In Proc. 1997 ACM-SIGMOD Int. Conf. Management of Data, 417-427, Tucson, Arizona, May 1997.
R. Agrawal, J. Gehrke, D. Gunopulos, and P. Raghavan. Automatic subspace clustering of high dimensional data for data mining applications. In Proc. 1998 ACM-SIGMOD Int. Conf. Management of Data, 94-105, Seattle, Washington, June 1998.
R. Agrawal, A. Gupta, and S. Sarawagi. Modeling multidimensional databases. In Proc. 1997 Int. Conf. Data Engineering, 232-243, Birmingham, England, April 1997.
K. Beyer and R. Ramakrishnan. Bottom-Up Computation of Sparse and Iceberg CUBEs. In Proc. 1999 ACM-SIGMOD Int. Conf. Management of Data (SIGMOD'99), 359-370, Philadelphia, PA, June 1999.
S. Chaudhuri and U. Dayal. An overview of data warehousing and OLAP technology. ACM SIGMOD Record, 26:65-74, 1997.
OLAP council. MDAPI specification version 2.0. In http://www.olapcouncil.org/research/apily.htm, 1998.
J. Gray, S. Chaudhuri, A. Bosworth, A. Layman, D. Reichart, M. Venkatrao, F. Pellow, and H. Pirahesh. Data cube: A relational aggregation operator generalizing group-by, cross-tab and sub-totals. Data Mining and Knowledge Discovery, 1:29-54, 1997.
Han: Data Cubes 21
References (II)
V. Harinarayan, A. Rajaraman, and J. D. Ullman. Implementing data cubes efficiently. In Proc. 1996 ACM-SIGMOD Int. Conf. Management of Data, pages 205-216, Montreal, Canada, June 1996.
Microsoft. OLEDB for OLAP programmer's reference version 1.0. In http://www.microsoft.com/data/oledb/olap, 1998.
K. Ross and D. Srivastava. Fast computation of sparse datacubes. In Proc. 1997 Int.
Conf. Very Large Data Bases, 116-125, Athens, Greece, Aug. 1997. K. A. Ross, D. Srivastava, and D. Chatziantoniou. Complex aggregation at multiple
granularities. In Proc. Int. Conf. of Extending Database Technology (EDBT'98), 263-277, Valencia, Spain, March 1998.
S. Sarawagi, R. Agrawal, and N. Megiddo. Discovery-driven exploration of OLAP data cubes. In Proc. Int. Conf. of Extending Database Technology (EDBT'98), pages 168-182, Valencia, Spain, March 1998.
E. Thomsen. OLAP Solutions: Building Multidimensional Information Systems. John Wiley & Sons, 1997.
Y. Zhao, P. M. Deshpande, and J. F. Naughton. An array-based algorithm for simultaneous multidimensional aggregates. In Proc. 1997 ACM-SIGMOD Int. Conf. Management of Data, 159-170, Tucson, Arizona, May 1997.