Embed Size (px)
Citation preview
Gel-Handbook, Part 2 (Edition 17, January 2012) - 1 – Industrial Power, Application Engineering Copyright – All Rights Reserved
Handbook for Stationary Gel-VRLA Batteries Part 2: Installation, Commissioning and Operation
Gel-Handbook, Part 2 (Edition 17, January 2012) - 2 – Industrial Power, Application Engineering Copyright – All Rights Reserved
Contents 1. Transport, Delivery and Stock Receipt ............................................... 4
1.1 Land-Carriage of Vented and VRLA Batteries.................................... 4 1.2 Sea Transport of Vented Batteries ..................................................... 4 1.3 Sea Transport of VRLA Batteries ....................................................... 5 1.4 Air Transport of Unfilled Vented Lead-Acid Batteries ......................... 5 1.5 Air Transport of Filled Vented Lead-Acid Batteries............................. 5 1.6 Air Transport of VRLA Batteries ......................................................... 5 1.7 Abbreviations ..................................................................................... 6 1.8 Delivery and Stock Receipt ................................................................ 6
2. Safety .................................................................................................... 7 3. Storage .................................................................................................. 8
3.1 Preconditions and Preparations ......................................................... 8 3.2 Storage Conditions............................................................................. 8 3.3 Storage Time ..................................................................................... 9 3.4 Measures during Storage or Taking out of Operation....................... 11
4. Assembly and Installation ................................................................. 12 4.1 Battery Rooms, Ventilation and General Requirements ................... 12
4.1.1 Temperature............................................................................... 12 4.1.2 Room Dimensions and Floor Composition.................................. 12 4.1.3 Ventilation................................................................................... 13
4.1.3.1 Ventilation Requirements ...................................................... 14 4.1.3.2 Close Vicinity to the Battery .................................................. 15 4.1.3.3 Central Degassing................................................................. 17
4.1.4 Electrical Requirements (Protection, Insulation, Resistance etc.)20 4.1.5 Installation (Racks, Cabinets) ..................................................... 20
4.2 Preparations..................................................................................... 21 4.3 Actual Assembly .............................................................................. 22 4.4 Parallel Arrangements...................................................................... 22 4.5 Installation Positions for Gel-Cells and -Blocks ................................ 24
5. Commissioning ................................................................................... 25 6. Operation ............................................................................................ 26
6.1 Float Voltage and Float Current ....................................................... 26 6.2 Superimposed AC Ripple................................................................. 28 6.3 Float Voltage Deviation .................................................................... 30 6.4 Charging Times................................................................................ 36 6.5 Efficiency of Re-Charging................................................................. 39
6.5.1 Ah-Efficiency .............................................................................. 39 6.5.2 Wh-Efficiency.............................................................................. 39
6.6 Equalizing Charge............................................................................ 40 6.7 Discharge, Capacity Tests ............................................................... 41
Gel-Handbook, Part 2 (Edition 17, January 2012) - 3 – Industrial Power, Application Engineering Copyright – All Rights Reserved
6.7.1 General Items............................................................................. 41 6.7.2 Capacity Tests............................................................................ 41
6.8 Cyclical Operation............................................................................ 44 6.8.1 General Items............................................................................. 44 6.8.2 Special Considerations about Gel-Solar-Batteries ...................... 49
6.9 Internal Resistance Ri ...................................................................... 52 6.10 Influence of Temperature ............................................................... 53 6.11 Maintenance and Checks............................................................... 59
6.11.1 General Items and Checks acc. to Operating Instructions ........ 59 6.11.2 Battery Testers and Battery Monitoring..................................... 60 6.11.3 Cleaning of Batteries ................................................................ 62
7. Recycling, Reprocessing ................................................................... 62 8. List of References .............................................................................. 62 Appendix: Available Capacity vs. Charging Time .................................... 65
Gel-Handbook, Part 2 (Edition 17, January 2012) - 4 – Industrial Power, Application Engineering Copyright – All Rights Reserved
1. Transport, Delivery and Stock Receipt
1.1 Land-Carriage of Vented and VRLA Batteries
Cells / blocks must be transported in an upright position. Batteries without any visible damage are not defined as dangerous goods under the regulations for transport of dangerous goods by road (ADR) or by railway (RID). The must be protected against short circuits, slipping, falling down or damaging. Cells / blocks may be stacked on pallets on a suitable way and if secured (ADR and RID, special provision 598). It is prohibited to staple pallets. No dangerous traces of acid shall be found on the exteriors of the packaging unit. Cells / blocks whose containers leak or are damaged must be packed and transported as class 8 dangerous goods under UN no. 2794.
1.2 Sea Transport of Vented Batteries
Vented cells / blocks, filled with acid, must be packed and transported as dangerous goods acc. to IMDG. Classification:
UN-no.: 2794 Class: 8
The transport in wooden crates or on pallets is permitted if the following additional regulations are observed: • Cells / blocks must be transported in upright position, must not show
signs of damages, must be protected against short circuits, slipping, falling down or damaging.
• It is prohibited to staple cells. • Blocks can be stapled secured by isolating intermediate layers if the
poles are not loaded by the above lying units. • It is prohibited to staple pallets.
Gel-Handbook, Part 2 (Edition 17, January 2012) - 5 – Industrial Power, Application Engineering Copyright – All Rights Reserved
• Electrolyte must not escape from the cell / the block being in a declination of 45 degree.
1.3 Sea Transport of VRLA Batteries
The following exemplary mentioned lines of products*) are not classified as dangerous goods acc. to IMDG because they fulfill also the IATA-clause A 67: Sonnenschein GF-Y, GF-V, A200, A400, A500, A600, A600 SOLAR,
A700, dryfit military, SOLAR and SOLAR BLOCK Absolyte Element (former: Champion) Marathon Sprinter Powerfit
*) Certificates on request 1.4 Air Transport of Unfilled Vented Lead-Acid Batteries
There are no restrictions for the transport.
1.5 Air Transport of Filled Vented Lead-Acid Batteries
Filled and charged vented batteries are dangerous goods with regard to air transport and can be jet by freight planes only. Hereby, the IATA packaging regulation 800 must be observed. In case of air transport, batteries which are part of any equipment must be disconnected at their terminals, and the terminals must be protected against short-circuits. This is in order to avoid the risk of any incidents like fire etc.
1.6 Air Transport of VRLA Batteries
The following exemplary mentioned lines of products*) are not classified as dangerous goods acc. to the IATA-clause A 67:
Gel-Handbook, Part 2 (Edition 17, January 2012) - 6 – Industrial Power, Application Engineering Copyright – All Rights Reserved
Sonnenschein GF-Y, GF-V, A200, A400, A500, A600, A600 SOLAR, A700, Military Batteries, SOLAR and SOLAR BLOCK
Absolyte Element (former: Champion) Marathon Sprinter Powerfit
*) Certificates on request
In case of air transport, batteries which are part of any equipment must be disconnected at their terminals, and the terminals must be protected against short-circuits. This is in order to avoid the risk of any incidents like fire etc. 1.7 Abbreviations
ADR: The European Agreement Concerning the International Carriage of Dangerous Goods by Road (covering most of Europe).
RID: Regulations concerning the International Carriage of Dangerous Goods by Rail (covering most of Europe, parts of North Africa and the Middle East).
IMDG: The International Maritime Dangerous Goods Code. IATA: The International Air Transportation Association (worldwide). ICAO: Civil Aviation Organization’s Technical Instructions for the Safe
Transport of Dangerous Goods by Air. 1.8 Delivery and Stock Receipt • GNB Industrial Power’s valve regulated batteries are delivered from our
factories, logistic centers or via our distributors. • The delivery items can be identified either by the number and type of
cells / blocks or by referring to a battery drawing. • Check the package or pallet for integrity. • Do not stack one pallet above the other. • Heed handling instructions stated on the packages.
Gel-Handbook, Part 2 (Edition 17, January 2012) - 7 – Industrial Power, Application Engineering Copyright – All Rights Reserved
• During transportation take all precaution to avoid breaking those products which are considered to be „fragile“ and have been identified as such.
• GNB Industrial Power chooses for all products a package suitable for
the kind of dispatch. If any damage is observed during unloading the goods, the carrier should be notified within 48 hours.
• Parcels are insured up to the delivery address acc. to the order, if this is
agreed by the sales contract. 2. Safety For any operation on the batteries, from storage to recycling, the following safety rules should be observed: • Read the installation instructions and operating instructions thoroughly. • No smoking. • Always wear protective rubber gloves, glasses and clothing (incl. safety
shoes). • Even when disconnected, a battery remains charged. The metallic parts
of a battery are electrically active. • Always use isolated tools. • Never place tools on the batteries (in particular, metallic parts can be
dangerous). • Check torques in case of unsecured screw connections of inter-cell and
inter-block connectors (see appendix 2). • Never pull up or lift cells / blocks at the terminals. • Avoid impacts or abrupt loads. • Never use synthetic clothes or sponges to clean the cells / blocks, but
water only (wet clothes) without additives [1].
Gel-Handbook, Part 2 (Edition 17, January 2012) - 8 – Industrial Power, Application Engineering Copyright – All Rights Reserved
• Avoid electrostatic charges and discharges/sparks.
A500, < 25 Ah only 3. Storage In the users interest the storage time should be as short as possible. 3.1 Preconditions and Preparations
Remove and avoid, respectively, contaminations on surfaces, dust etc.. The storage location should fulfill the following preconditions: • Protect the cells / blocks from harsh weather, moisture and flooding. • Protect the cells / blocks from direct or indirect sun radiation • The storage area and ambient, respectively, must be clean, dry, frost-
free (see also chapter 3.2) and well looked after. • Cells / blocks must be protected from short-circuits by metallic parts or
conductive contaminations. • Cells / blocks must be protected from dropping objects, from falling
down and falling over. 3.2 Storage Conditions • The temperature has an impact on the self-discharge rate of cells and
blocks (see fig. 1 and 2). • Storage on a pallet wrapped in plastic material is permitted, in principle.
However, it is not recommended in rooms where the temperature fluctuates significantly, or if high relative humidity can cause
Gel-Handbook, Part 2 (Edition 17, January 2012) - 9 – Industrial Power, Application Engineering Copyright – All Rights Reserved
condensation under the plastic cover. With time, this condensation can cause a whitish hydration on the poles and lead to high self-discharge by leakage current. As an exception fully charged lead-acid batteries can be stored also at temperatures below zero if dry surface of cells or blocks is guaranteed and if condensation or dew effects or similar cannot occur.
• Stacking of pallets is not permitted. • Avoid storing of unpacked cells / blocks on sharp-edged supports. • It is recommended to realize the same storage conditions within a batch,
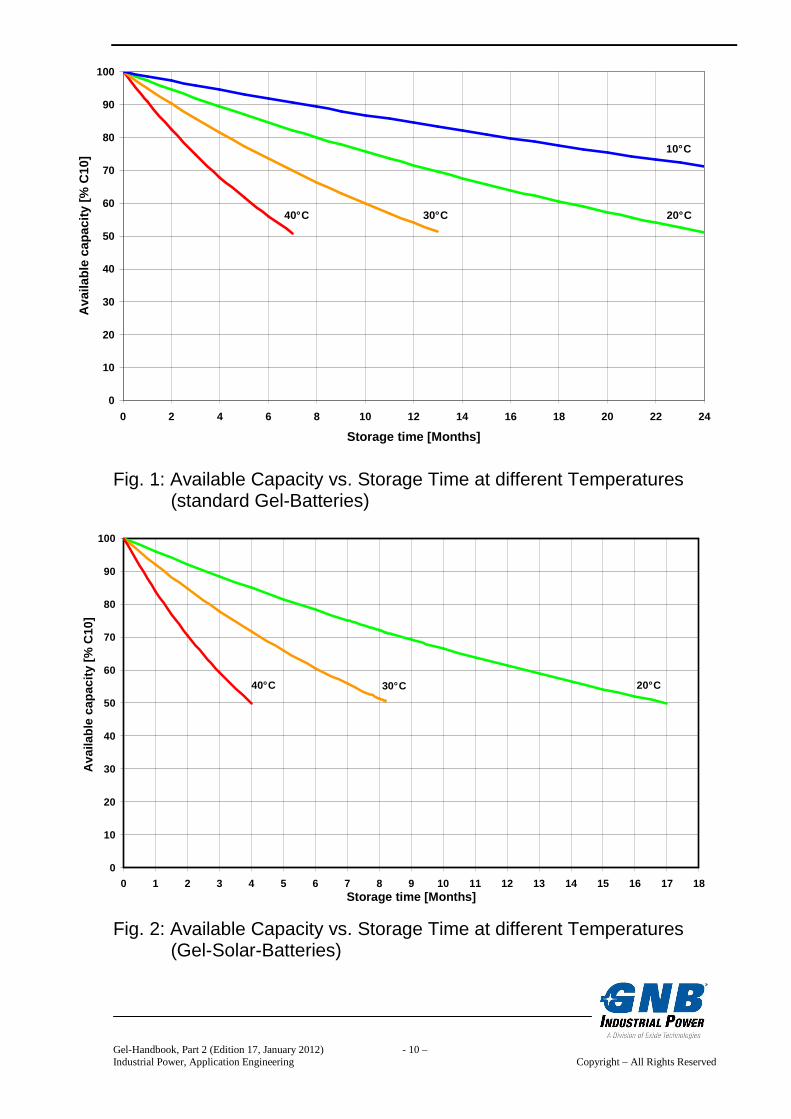
pallet or room. 3.3 Storage Time The maximum storage time at ≤ 20 °C is
24 months for standard Gel-batteries (fig. 1) and 17 months for Gel-solar-batteries (fig. 2).
The shorter storage time of solar-batteries is due to a small amount of phosphoric acid added to the electrolyte. Phosphoric acid increases the number of cycles but increases the self-discharge rate slightly. Higher temperatures cause higher self-discharge and shorter storage time between re-charging operations.
Gel-Handbook, Part 2 (Edition 17, January 2012) - 10 – Industrial Power, Application Engineering Copyright – All Rights Reserved
Fig. 1: Available Capacity vs. Storage Time at different Temperatures (standard Gel-Batteries) Fig. 2: Available Capacity vs. Storage Time at different Temperatures (Gel-Solar-Batteries)
0
10
20
30
40
50
60
70
80
90
100
0 2 4 6 8 10 12 14 16 18 20 22 24
Storage time [Months]
Ava
ilabl
e ca
paci
ty [%
C10
]
10° C
20° C30° C40° C
0
10
20
30
40
50
60
70
80
90
100
0 1 2 3 4 5 6 7 8 9 10 11 12 13 14 15 16 17 18Storage time [Months]
Ava
ilabl
e ca
paci
ty [%
C10
]
40° C 30° C 20° C
Gel-Handbook, Part 2 (Edition 17, January 2012) - 11 – Industrial Power, Application Engineering Copyright – All Rights Reserved
3.4 Measures during Storage or Taking out of Operation • Appropriate inventory turnover based on a FIFO-method (“First In – First
Out”) avoids over-storage. • The following measures go also for cells / blocks taken out of operation
temporary. • If cells / blocks must be cleaned, never use solvents, but water (wet
clothes) without additives [1]. • For extended storage periods it is recommended to check the open-
circuit voltage (OCV) in the following intervals:
- storage at 20 °C: after a storage period of 12 mont hs, then every 3 months afterwards,
- storage at 30 °C: after a storage period of 6 month s, then every 2 months afterwards.
Refreshing charging is necessary if the measured OCV is < 2.07 Vpc (guide value).
• Refreshing charging: IU-charging (constant current / constant voltage-
charging) at temperatures between 15 and 35 °C:
Voltage [Vpc] Current [A] Max. charging time [h]
2.40 unlimited 48
Table 1: Charge voltage and charging time • Alternatively to regular refreshing charges, float charge operation acc. to
chapter 6.1 can be applied in case of temporary taking out of operation.
Gel-Handbook, Part 2 (Edition 17, January 2012) - 12 – Industrial Power, Application Engineering Copyright – All Rights Reserved
4. Assembly and Installation 4.1 Battery Rooms, Ventilation and General Requirements General: This is a guideline only and consists of excerpts from national and international standards and guidelines. See EN 50272-2 [2] for detailed information. Also, follow up installation instructions and operating instructions. 4.1.1 Temperature The battery room temperature should be between + 10 °C and + 30 °C. Optimal temperature is the nominal temperature 20 °C. The maximum temperature difference between cells or blocks, respectively, within a string must not exceed 5 degree C (5 Kelvin). 4.1.2 Room Dimensions and Floor Composition
Battery rooms’ height shall be at least 2 m above the operating floors. Floors shall be reasonable level and able to support the battery weight. The floor surface must be electrolyte resistant for usage of vented batteries. This precaution is not necessary for valve regulated batteries. Notice: Electrolyte resistant floor surface is not necessary in case of vented batteries, if they are placed in trays. Those trays must hold at least the amount of electrolyte of one cell or block. From EN 50272-2 [2]: “…The floor area for a person standing within arm’s reach of the battery (see note 2) shall be electrostatic dissipative in order to prevent electrostatic charge generation. The resistance to a groundable point measured according to IEC 61340-4-1 shall be less than 10 MΩ. Conversely the floor must offer sufficient resistance R for personnel safety. Therefore the resistance of the floor to a groundable point when measured in accordance with IEC 61340-4-1 shall be for battery nominal voltage ≤ 500 V: 50 kΩ ≤ R ≤ 10 MΩ for battery nominal voltage > 500 V: 100 kΩ ≤ R ≤ 10 MΩ Note 1:
Gel-Handbook, Part 2 (Edition 17, January 2012) - 13 – Industrial Power, Application Engineering Copyright – All Rights Reserved
To make the first part of the requirement effective, the personnel shall wear anti-static footwear when carrying out maintenance work on the battery. The footwear shall comply with EN 345.
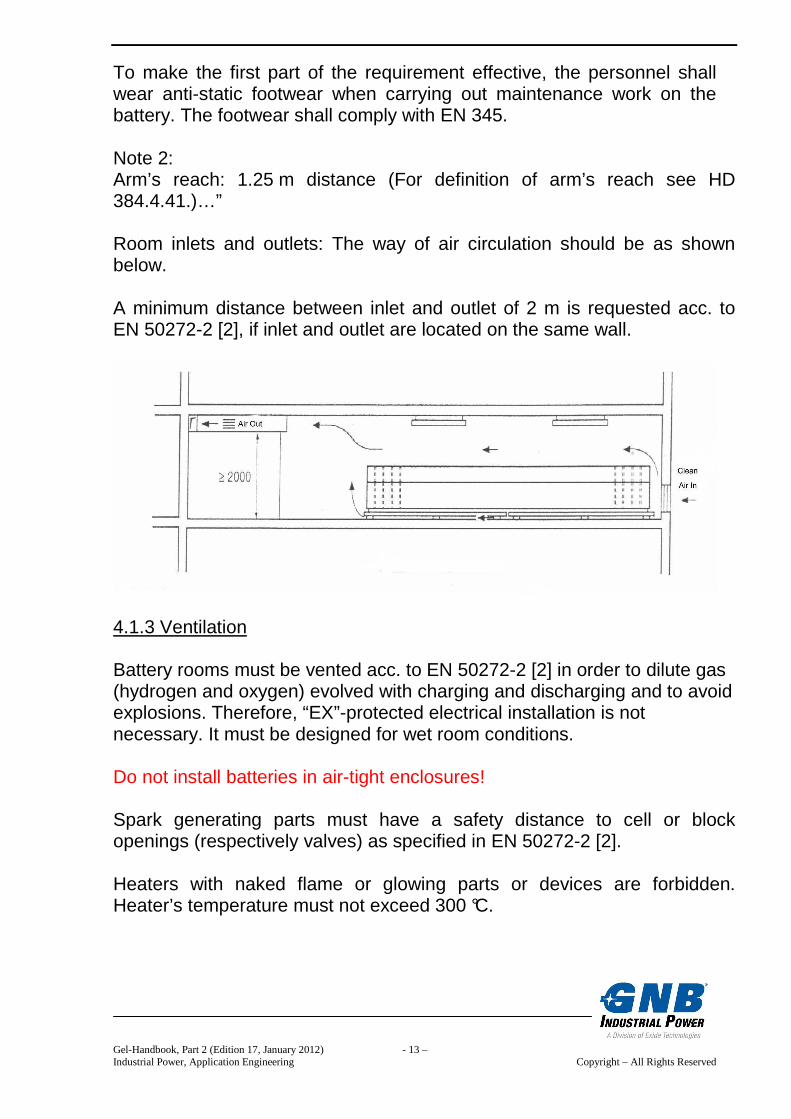
Note 2: Arm’s reach: 1.25 m distance (For definition of arm’s reach see HD 384.4.41.)…” Room inlets and outlets: The way of air circulation should be as shown below. A minimum distance between inlet and outlet of 2 m is requested acc. to EN 50272-2 [2], if inlet and outlet are located on the same wall.
4.1.3 Ventilation Battery rooms must be vented acc. to EN 50272-2 [2] in order to dilute gas (hydrogen and oxygen) evolved with charging and discharging and to avoid explosions. Therefore, “EX”-protected electrical installation is not necessary. It must be designed for wet room conditions. Do not install batteries in air-tight enclosures! Spark generating parts must have a safety distance to cell or block openings (respectively valves) as specified in EN 50272-2 [2]. Heaters with naked flame or glowing parts or devices are forbidden. Heater’s temperature must not exceed 300 °C.
Gel-Handbook, Part 2 (Edition 17, January 2012) - 14 – Industrial Power, Application Engineering Copyright – All Rights Reserved
Hand lamps are only allowed with switches and protective glass according to protection class II and protection class IP 54. 4.1.3.1 Ventilation Requirements
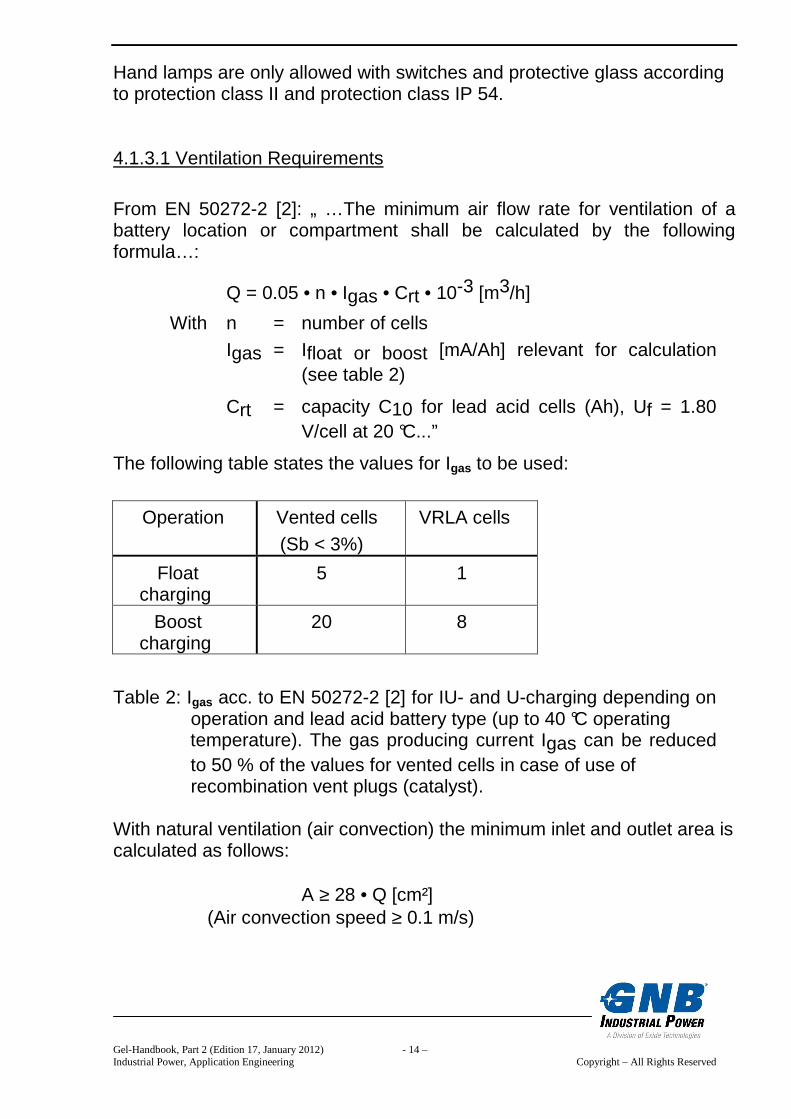
From EN 50272-2 [2]: „ …The minimum air flow rate for ventilation of a battery location or compartment shall be calculated by the following formula…:
Q = 0.05 • n • Igas • Crt • 10-3 [m3/h]
With n = number of cells Igas = Ifloat or boost [mA/Ah] relevant for calculation
(see table 2)
Crt = capacity C10 for lead acid cells (Ah), Uf = 1.80 V/cell at 20 °C...”
The following table states the values for Igas to be used:
Operation Vented cells (Sb < 3%)
VRLA cells
Float charging
5 1
Boost charging
20 8
Table 2: Igas acc. to EN 50272-2 [2] for IU- and U-charging depending on operation and lead acid battery type (up to 40 °C operating temperature). The gas producing current Igas can be reduced to 50 % of the values for vented cells in case of use of recombination vent plugs (catalyst). With natural ventilation (air convection) the minimum inlet and outlet area is calculated as follows:
A ≥ 28 • Q [cm²] (Air convection speed ≥ 0.1 m/s)
Gel-Handbook, Part 2 (Edition 17, January 2012) - 15 – Industrial Power, Application Engineering Copyright – All Rights Reserved
Example 1: Given: 220 V battery, 110 cells, C10 = 400 Ah, vented type, Antimony (Sb) < 3 % (LA) in float service. Calculation of fresh air necessary:
Q = 0.05 • n • Igas • Crt • 10-3 [m3/h] With n = 110 Igas = 5 (see table 2)
Crt = 400
Q = 11 m3/h A ≥ 308 cm2 Example 2: Same battery as in example 1, but VRLA-type. Igas = 1 to be used (instead of 5).
Q = 2.2 m3/h A ≥ 62 cm2
Note: A calculation program is available on request. 4.1.3.2 Close Vicinity to the Battery From EN 50272-2 [2]: „…In the close vicinity of the battery the dilution of explosive gases is not always secured. Therefore a safety distance extending through air must be observed within which sparking or glowing devices (max. surface temperature 300 °C) are prohi bited. The dispersion of explosive gas depends on the gas release rate and the ventilation close to the source of release. For calculation of the safety distance d from the source of release the following formula applies assuming a hemispherical dispersal of gas... Note:
Gel-Handbook, Part 2 (Edition 17, January 2012) - 16 – Industrial Power, Application Engineering Copyright – All Rights Reserved
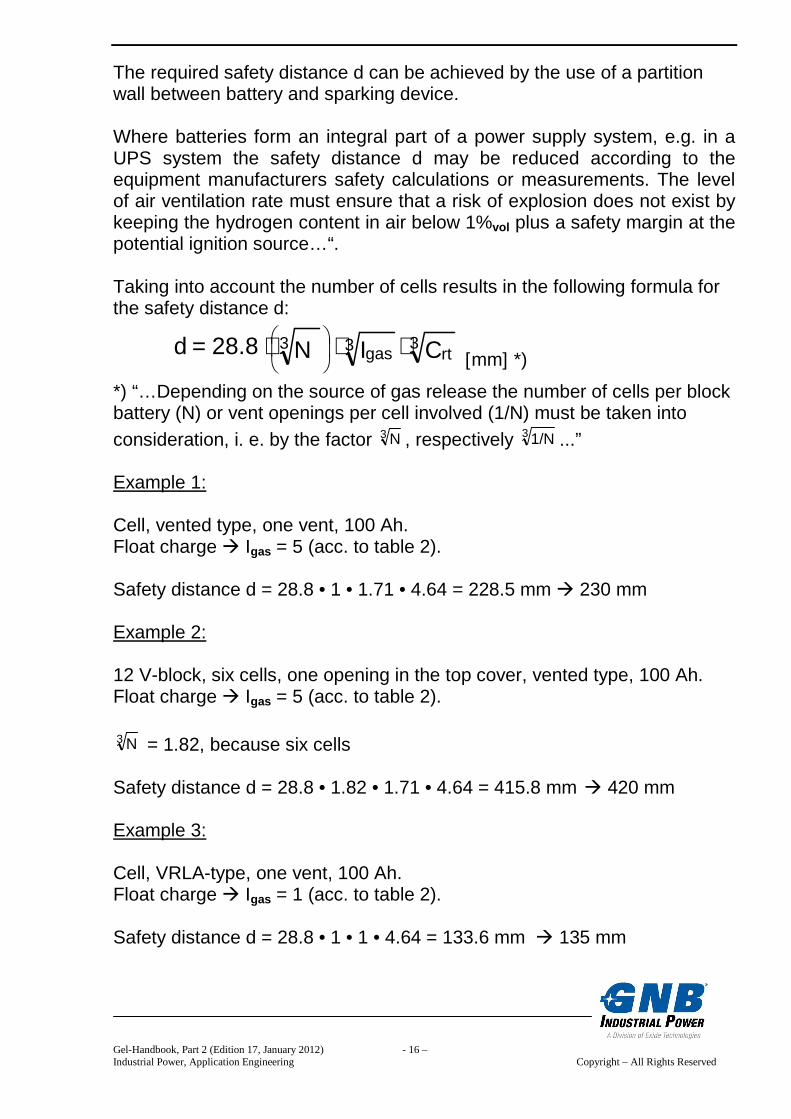
The required safety distance d can be achieved by the use of a partition wall between battery and sparking device. Where batteries form an integral part of a power supply system, e.g. in a UPS system the safety distance d may be reduced according to the equipment manufacturers safety calculations or measurements. The level of air ventilation rate must ensure that a risk of explosion does not exist by keeping the hydrogen content in air below 1%vol plus a safety margin at the potential ignition source…“. Taking into account the number of cells results in the following formula for the safety distance d:
3rt3 gas
3 CIN28.8d ⋅⋅⋅=
[mm] *)
*) “…Depending on the source of gas release the number of cells per block battery (N) or vent openings per cell involved (1/N) must be taken into consideration, i. e. by the factor 3 N , respectively 3 1/N ...” Example 1: Cell, vented type, one vent, 100 Ah. Float charge Igas = 5 (acc. to table 2). Safety distance d = 28.8 • 1 • 1.71 • 4.64 = 228.5 mm 230 mm Example 2: 12 V-block, six cells, one opening in the top cover, vented type, 100 Ah. Float charge Igas = 5 (acc. to table 2). 3 N = 1.82, because six cells Safety distance d = 28.8 • 1.82 • 1.71 • 4.64 = 415.8 mm 420 mm Example 3: Cell, VRLA-type, one vent, 100 Ah. Float charge Igas = 1 (acc. to table 2). Safety distance d = 28.8 • 1 • 1 • 4.64 = 133.6 mm 135 mm
Gel-Handbook, Part 2 (Edition 17, January 2012) - 17 – Industrial Power, Application Engineering Copyright – All Rights Reserved
Example 4: Cell, vented type, one vent, 1500 Ah. Boost charge Igas = 20 (acc. to table 2) Safety distance d = 28.8 • 1 • 2.71 • 11.45 = 893.6 mm 895 mm Example 5: Cell, vented type, three vents, 3000 Ah. Boost charge Igas = 20 (acc. to table 2) 3 1/N = 0.69 because three vents per cell Safety distance d = 28.8 • 0.69 • 2.71 • 14.42 = 776.6 mm 780 mm 4.1.3.3 Central Degassing The ventilation of battery rooms and cabinets, respectively, must be carried out acc. to EN 50272-2 [2] always. Battery rooms are to be considered as safe from explosions, when by natural or technical ventilation the concentration of hydrogen is kept below 4% in air. This standard contains also notes and calculations regarding safety distance of battery openings (valves) to potential sources of sparks as stated above. Central degassing is a possibility for the equipment manufacturer to draw off gas. Its purpose is to reduce the safety distance to potential sources of ignition. It doesn’t reduce the general ventilation requirements acc. to the above mentioned standard. Even if the gas releasing the vents will be conducted through the tube system outside, hydrogen diffuses also through the battery container and through the tube wall and would be accumulated without proper ventilation. Only block batteries equipped by a tube junction for central degassing must be used for this application. The installation of the central degassing must be carried out in acc. with the equivalent installation instructions. During each battery service also the central degassing must be checked (tightness of tubes, laying in the direction of the electrical circuit, drawing-off the end of the tube to the outside).
Gel-Handbook, Part 2 (Edition 17, January 2012) - 18 – Industrial Power, Application Engineering Copyright – All Rights Reserved
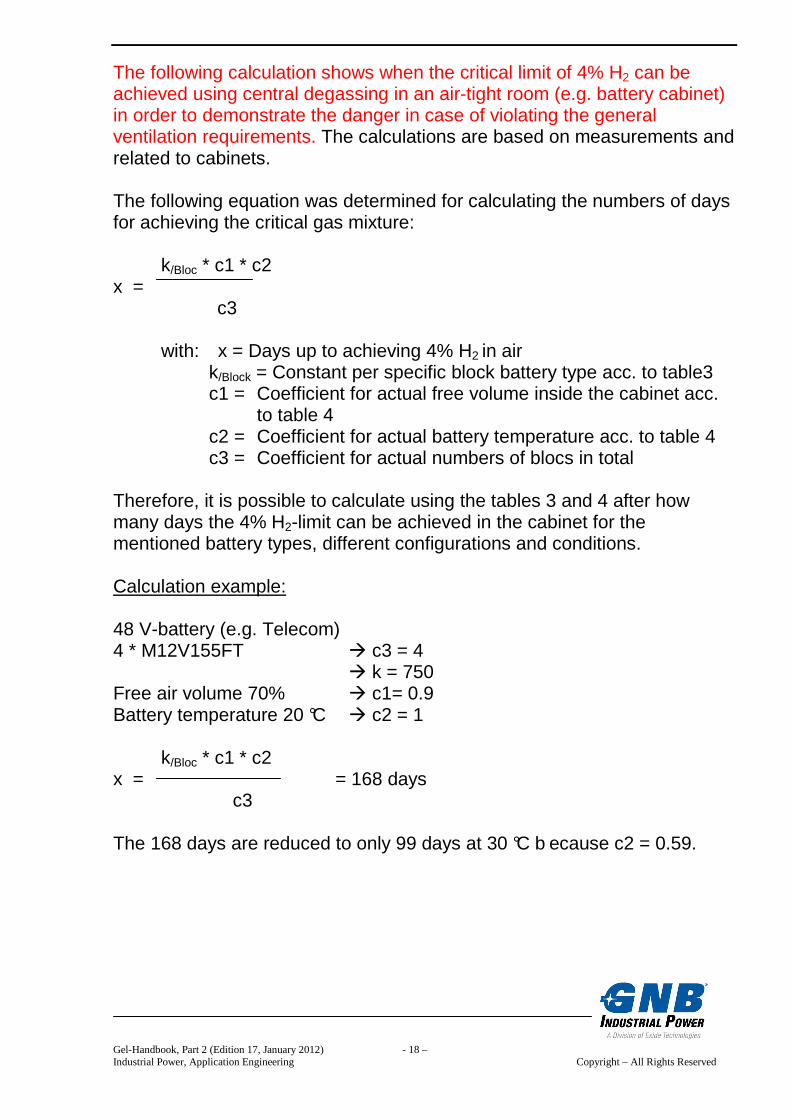
The following calculation shows when the critical limit of 4% H2 can be achieved using central degassing in an air-tight room (e.g. battery cabinet) in order to demonstrate the danger in case of violating the general ventilation requirements. The calculations are based on measurements and related to cabinets. The following equation was determined for calculating the numbers of days for achieving the critical gas mixture:
k/Bloc * c1 * c2 x = c3
with: x = Days up to achieving 4% H2 in air k/Block = Constant per specific block battery type acc. to table3 c1 = Coefficient for actual free volume inside the cabinet acc.
to table 4 c2 = Coefficient for actual battery temperature acc. to table 4 c3 = Coefficient for actual numbers of blocs in total
Therefore, it is possible to calculate using the tables 3 and 4 after how many days the 4% H2-limit can be achieved in the cabinet for the mentioned battery types, different configurations and conditions. Calculation example: 48 V-battery (e.g. Telecom) 4 * M12V155FT c3 = 4
k = 750 Free air volume 70% c1= 0.9 Battery temperature 20 °C c2 = 1
k/Bloc * c1 * c2 x = = 168 days c3 The 168 days are reduced to only 99 days at 30 °C b ecause c2 = 0.59.
Gel-Handbook, Part 2 (Edition 17, January 2012) - 19 – Industrial Power, Application Engineering Copyright – All Rights Reserved
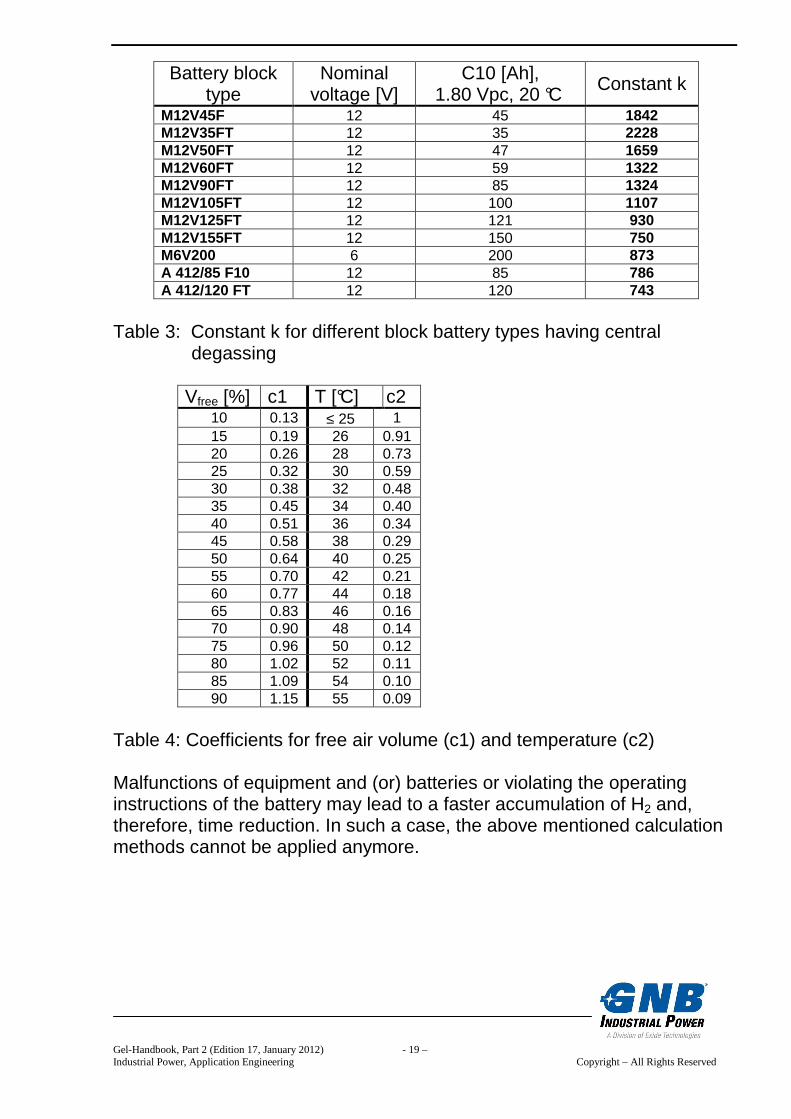
Battery block type
Nominal voltage [V]
C10 [Ah], 1.80 Vpc, 20 °C Constant k
M12V45F 12 45 1842 M12V35FT 12 35 2228 M12V50FT 12 47 1659 M12V60FT 12 59 1322 M12V90FT 12 85 1324 M12V105FT 12 100 1107 M12V125FT 12 121 930 M12V155FT 12 150 750 M6V200 6 200 873 A 412/85 F10 12 85 786 A 412/120 FT 12 120 743
Table 3: Constant k for different block battery types having central
degassing
Vfree [%] c1 T [°C] c2 10 0.13 ≤ 25 1 15 0.19 26 0.91 20 0.26 28 0.73 25 0.32 30 0.59 30 0.38 32 0.48 35 0.45 34 0.40 40 0.51 36 0.34 45 0.58 38 0.29 50 0.64 40 0.25 55 0.70 42 0.21 60 0.77 44 0.18 65 0.83 46 0.16 70 0.90 48 0.14 75 0.96 50 0.12 80 1.02 52 0.11 85 1.09 54 0.10 90 1.15 55 0.09
Table 4: Coefficients for free air volume (c1) and temperature (c2) Malfunctions of equipment and (or) batteries or violating the operating instructions of the battery may lead to a faster accumulation of H2 and, therefore, time reduction. In such a case, the above mentioned calculation methods cannot be applied anymore.
Gel-Handbook, Part 2 (Edition 17, January 2012) - 20 – Industrial Power, Application Engineering Copyright – All Rights Reserved
4.1.4 Electrical Requirements (Protection, Insulation, Resistance etc.) To prevent a build-up of static electricity when handling batteries, material of clothing, safety boots and gloves are required to have a surface resistance of ≤ 108 Ω, and an insulation resistance of ≥ 105 Ω. From EN 50272-2 [2]: “…The minimum insulation resistance between the battery’s circuit and other local conductive parts should be more than 100 Ω per Volt (of battery nominal voltage) corresponding to a leakage current < 10 mA… Note: The battery system should be isolated from the fixed installation before this test is carried out. Before carrying out any test check for hazardous voltage between the battery and the associated rack or enclosure….” In case of battery systems with > DC 120 V nominal voltage battery racks or cabinets made from metal shall either be connected to the protective conductor (grounding) or insulated from the battery and the place of installation (chapter 5.2 in EN 50272-2 [2]). This insulation must withstand 4000 V AC for one minute. Note: Protection against both direct and indirect contact shall only be used for Battery installations with nominal voltages up to DC 120 V. In these cases the requirements for metal battery stands and cabinets specified in chapter 5.2 of EN 50272-2 [2] do not apply. Touch protection must be provided for all active parts at voltages > 60 V DC with insulation, covers or shrouds and distance. 4.1.5 Installation (Racks, Cabinets) Batteries shall be installed in clean, dry locations. Batteries must be secured against dropping objects and protected from dust. The course width between battery rows is equal to 1.5 times the cell depth (replacement) but minimum 600 mm (acc. to EN 50272-2 [2]). The minimum distance for > 120 V between active parts is 1.5 m or insulation, insulated cover etc.
Gel-Handbook, Part 2 (Edition 17, January 2012) - 21 – Industrial Power, Application Engineering Copyright – All Rights Reserved
The recommended minimum distance between cells or blocks (of VRLA type) is 10 mm. At least 5mm are requested acc. to EN 50272-2 [2] (at the largest dimension). Thus, in order to allow heat dissipation. Racks and cabinets shall have a distance of at least 100 mm to the wall for a better placement of connections and better access for cleaning. Batteries must allow service with normal insulated tools (acc. to EN 50272-2 [2]). Batteries with a nominal voltage ≥≥≥≥ 75 V requires an EC-declaration of conformity from the installer of the battery in accordance with the low-voltage directive 2006/95/EC (replaces 73/23/EEC). The declaration of conformity confirms that the installation of the battery was carried out in acc. with the applicable standards and that the CE-symbol was fixed at the battery. The installer of the battery system is responsible for the declaration and fixing the CE-symbol. See [3] for more information. 4.2 Preparations • Measure the open circuit voltage (OCV) at each cell / block. The OCV-
values should be ≥ 2.07 Vpc (guide value). During the measurements attention shall be paid to the correct polarity (possible wrong assembly inside).
• If drawings were supplied by GNB Industrial Power, they must be kept
during the assembly. • The racks or cabinets should provide adequate ventilation above and
below to allow the heat produced by the batteries and their charging system to escape. The distance between cells or blocks shall be approx. 10 mm, but at least 5 mm. See appendix 2 and standard EN 50272-2 [2].
• The grounding of racks or cabinets should be carried out in acc. with EN 50272-2 [2].
Gel-Handbook, Part 2 (Edition 17, January 2012) - 22 – Industrial Power, Application Engineering Copyright – All Rights Reserved
4.3 Actual Assembly • Use insulated tools for the assembly. Wear rubber gloves, protective
glasses and protective clothing (incl. safety shoes). Remove metallic objects like watches and jewelry (see also chapter 2.).
• The installation must be carried out only with the supplied original
accessories, e.g. connectors, or with accessories recommended by GNB Industrial Power. The same goes for spare parts in case of later repairs.
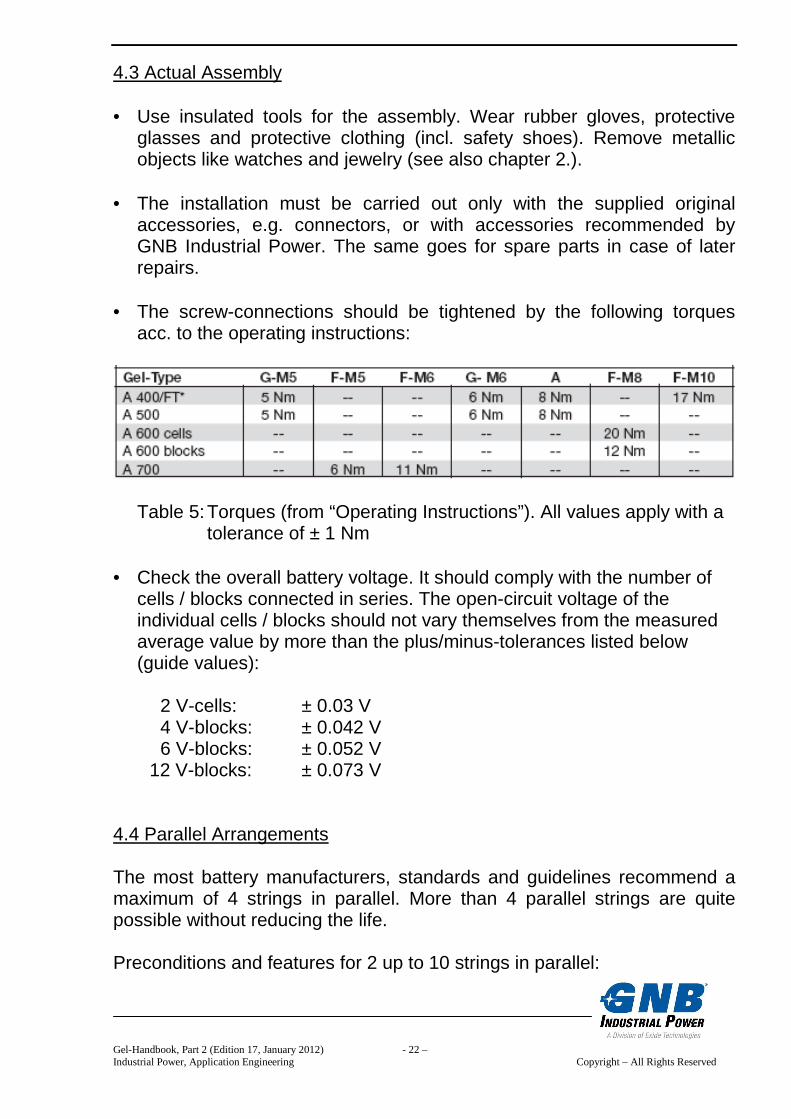
• The screw-connections should be tightened by the following torques
acc. to the operating instructions:
Table 5: Torques (from “Operating Instructions”). All values apply with a tolerance of ± 1 Nm
• Check the overall battery voltage. It should comply with the number of
cells / blocks connected in series. The open-circuit voltage of the individual cells / blocks should not vary themselves from the measured average value by more than the plus/minus-tolerances listed below (guide values):
2 V-cells: ± 0.03 V 4 V-blocks: ± 0.042 V 6 V-blocks: ± 0.052 V
12 V-blocks: ± 0.073 V
4.4 Parallel Arrangements The most battery manufacturers, standards and guidelines recommend a maximum of 4 strings in parallel. More than 4 parallel strings are quite possible without reducing the life. Preconditions and features for 2 up to 10 strings in parallel:
Gel-Handbook, Part 2 (Edition 17, January 2012) - 23 – Industrial Power, Application Engineering Copyright – All Rights Reserved
• The connector cables for positive and negative terminals of each battery string must have the same length.
• It is a must to have a circuit breaker for each string or, at least, for every
two strings. • The strings must have the same temperature. Parallel connection of strings with different capacities as well as different age is possible. The current during both, discharge and re-charging, will be split acc. to the capacity or age, respectively. For more information, see [4]. Also different lead-acid battery models or types of different technology (vented, valve-regulated) can be connected in parallel as long as the requested charging voltage (Vpc) per string acc. to the operating instructions is fulfilled. If these requirements are fulfilled paralleling of up to 10 strings is possible. All battery performance data have to be applied to the end terminal of each string. Always connect the individual series strings first. Check that the different strings have the same state of charge, means similar open circuit voltages. After that, connect the strings in parallel.
Gel-Handbook, Part 2 (Edition 17, January 2012) - 24 – Industrial Power, Application Engineering Copyright – All Rights Reserved
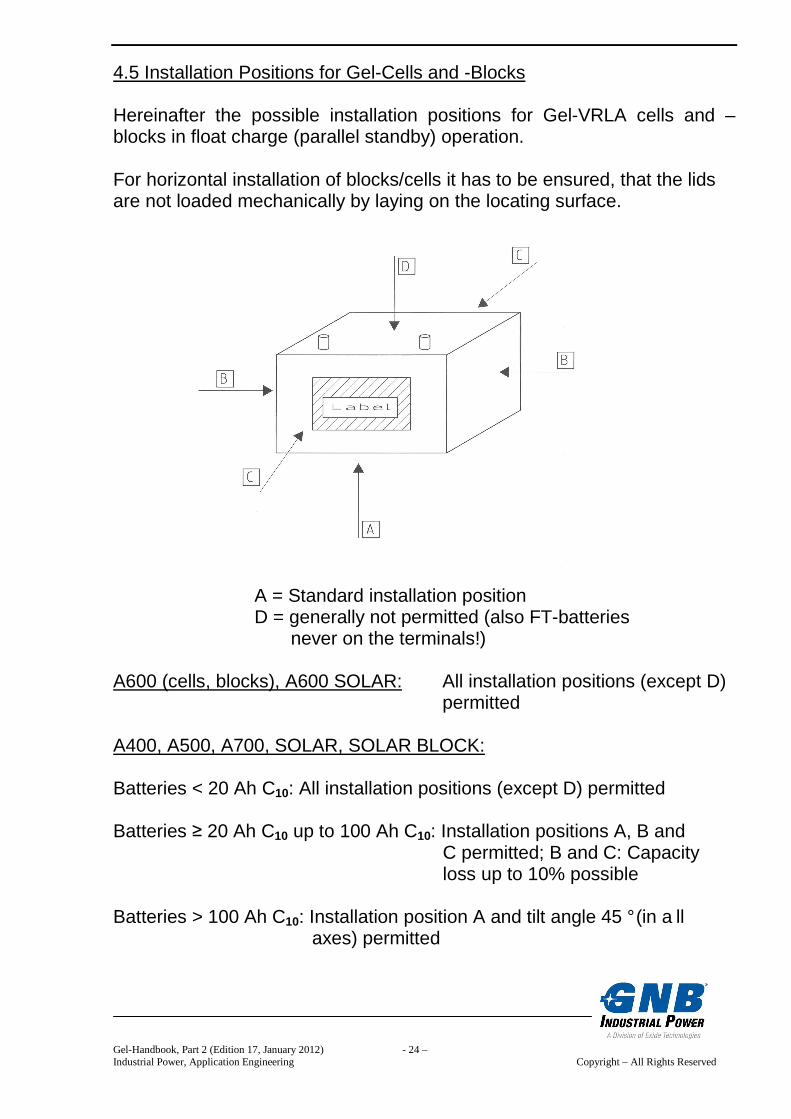
4.5 Installation Positions for Gel-Cells and -Blocks Hereinafter the possible installation positions for Gel-VRLA cells and –blocks in float charge (parallel standby) operation. For horizontal installation of blocks/cells it has to be ensured, that the lids are not loaded mechanically by laying on the locating surface.
A = Standard installation position D = generally not permitted (also FT-batteries
never on the terminals!) A600 (cells, blocks), A600 SOLAR: All installation positions (except D)
permitted A400, A500, A700, SOLAR, SOLAR BLOCK: Batteries < 20 Ah C10: All installation positions (except D) permitted Batteries ≥ 20 Ah C10 up to 100 Ah C10: Installation positions A, B and
C permitted; B and C: Capacity loss up to 10% possible
Batteries > 100 Ah C10: Installation position A and tilt angle 45 ° (in a ll
axes) permitted
Gel-Handbook, Part 2 (Edition 17, January 2012) - 25 – Industrial Power, Application Engineering Copyright – All Rights Reserved
5. Commissioning • For float charge applications, commissioning after a storage period or
assembly in accordance with the conditions specified above, commissioning consists merely of connecting the battery to its charging system.
• The charge voltage should be adjusted in accordance with the
specifications as described in chapter 6.1. • The safety systems: Fuses, circuit breakers and insulation monitoring
shall be all tested independently. • If a capacity test is requested, for instance, for an acceptance test on
site, make sure the battery is fully charged. For this, the following IU-charge methods can be applied: Option 1: Float charge ≥ 72 hours. Option 2: 2.40 Vpc ≥ 16 hours (max. 48 hours) followed by float
charge ≥ 8 hours. The current available for charging can be unlimited up to achieving the constant voltage level (guide values: 10 A and 35 A per 100 Ah nominal capacity).
Gel-Handbook, Part 2 (Edition 17, January 2012) - 26 – Industrial Power, Application Engineering Copyright – All Rights Reserved
6. Operation 6.1 Float Voltage and Float Current • A temperature related adjustment of the charge voltage within the
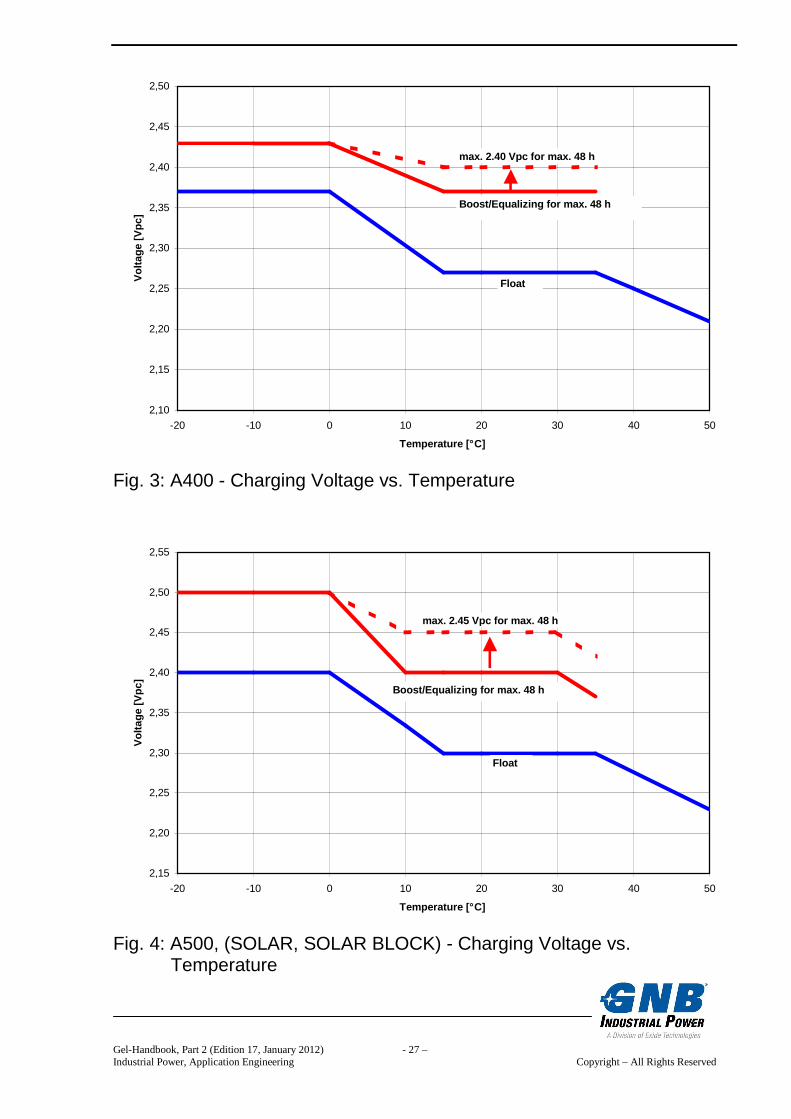
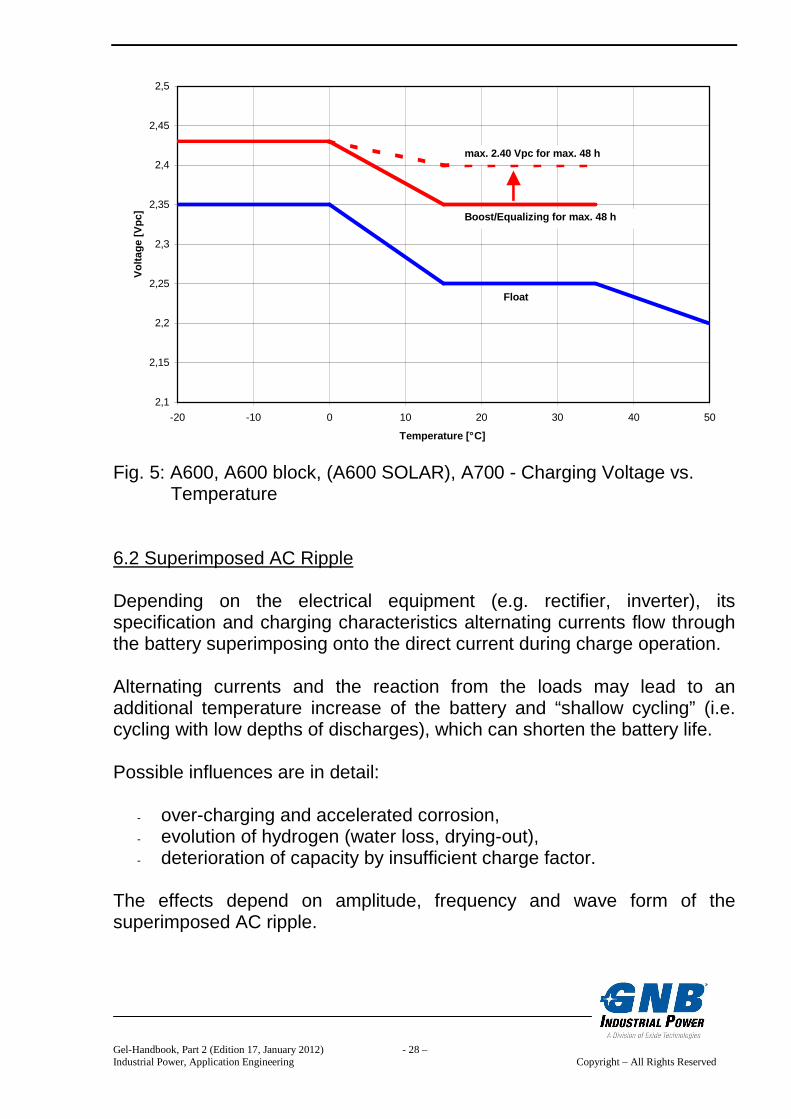
operating temperature of 15 °C to 35 °C is not allo wed. If the operating temperature is permanently outside this range, the charge voltage has to be adjusted as shown in figures 3, 4 and 5.
Gel-solar-batteries: See also chapter 6.8.2
The float charge voltage should be set as follows. Hereby, the Volts per cell multiplied by the number of cells must be measured at the end terminals of the battery:
2.25 Vpc for A600, A600 block, A600 SOLAR and A700 2.27 Vpc for A400 2.30 Vpc for A500, SOLAR and SOLAR BLOCK All charging (float, boost, equalizing) must be carried out according to an IU-characteristic with limit values: I-phase: ± 2%; U-phase: ± 1%. These limits are acc. to the standard DIN 41773, part 1 [5]. The charge voltage shall be set or corrected, respectively, to the values mentioned above.
• In the case of installation in cabinets or in trays, the representative
ambient temperature measurement is achieved at a height of 1/3. The sensor should be placed in the center of this level.
• The location of battery temperature sensors depends on the probes.
The measurement shall be carried out either at the negative terminals (pointed metallic probes or probes with loop-shape) or on the plastic housing (flat probes to be placed on top or on one side in the center).
• As a clue about the fully charged state the following rough formula can
be used: The battery is fully charged if the residual charge current does not change anymore during three hours.
Gel-Handbook, Part 2 (Edition 17, January 2012) - 27 – Industrial Power, Application Engineering Copyright – All Rights Reserved
2,10
2,15
2,20
2,25
2,30
2,35
2,40
2,45
2,50
-20 -10 0 10 20 30 40 50
Temperature [° C]
Vol
tage
[Vpc
]
Boost/Equalizing for max. 48 h
max. 2.40 Vpc for max. 48 h
Float
Fig. 3: A400 - Charging Voltage vs. Temperature
2,15
2,20
2,25
2,30
2,35
2,40
2,45
2,50
2,55
-20 -10 0 10 20 30 40 50
Temperature [° C]
Vol
tage
[Vpc
]
Boost/Equalizing for max. 48 h
max. 2.45 Vpc for max. 48 h
Float
Fig. 4: A500, (SOLAR, SOLAR BLOCK) - Charging Voltage vs. Temperature
Gel-Handbook, Part 2 (Edition 17, January 2012) - 28 – Industrial Power, Application Engineering Copyright – All Rights Reserved
2,1
2,15
2,2
2,25
2,3
2,35
2,4
2,45
2,5
-20 -10 0 10 20 30 40 50
Temperature [° C]
Vol
tage
[Vpc
]
max. 2.40 Vpc for max. 48 h
Boost/Equalizing for max. 48 h
Float
Fig. 5: A600, A600 block, (A600 SOLAR), A700 - Charging Voltage vs. Temperature 6.2 Superimposed AC Ripple Depending on the electrical equipment (e.g. rectifier, inverter), its specification and charging characteristics alternating currents flow through the battery superimposing onto the direct current during charge operation. Alternating currents and the reaction from the loads may lead to an additional temperature increase of the battery and “shallow cycling” (i.e. cycling with low depths of discharges), which can shorten the battery life. Possible influences are in detail:
- over-charging and accelerated corrosion, - evolution of hydrogen (water loss, drying-out), - deterioration of capacity by insufficient charge factor.
The effects depend on amplitude, frequency and wave form of the superimposed AC ripple.
Gel-Handbook, Part 2 (Edition 17, January 2012) - 29 – Industrial Power, Application Engineering Copyright – All Rights Reserved
When recharging up to 2.4 Vpc the actual value of the alternating current is occasionally permitted up to 10 A (RMS = effective value) per 100 Ah nominal capacity. In a fully charged state during float charge or standby parallel operation the actual value of the alternating current shall be as low as possible but must not exceed 5 A (RMS) per 100 Ah nominal capacity (see also EN 50272-2 [2]). The information leaflet “Considerations on service life of stationary batteries” [6] demonstrates how critical the influence of the superimposed AC ripple is with regard to the different lead-acid battery systems “vented” and “VRLA”. Herein, different limits for the superimposed AC ripple (RMS-value) are recommended for float charge operation or standby parallel operation, respectively: Maximum 2 A per 100 Ah C10 for vented lead-acid batteries. Maximum 1 A per 100 Ah C10 for VRLA batteries. The following effects depend on the frequency. At > 30 Hz:
- no or negligible conversion of active material because too quick changes of direction of the current, but
- increase of battery temperature, - increased water loss, - accelerated corrosion.
At < 30 Hz:
- significant conversion of active material because slow changes of direction of the current and therefore
- lack of charge and - consumption by cycling.
Lack of charge can occur especially if the portion of negative half-waves exceeds the portion of positives, or if the shape of the wave is distorted toward higher amplitudes of the negative half-waves. Increasing the float voltage by approx. 0.01 up to 0.03 Vpc can help in those cases. But, this should be a temporary measure only. Highest matter of concern should be the exclusion of too high superimposed AC ripples by the appropriate design of the equipment from
Gel-Handbook, Part 2 (Edition 17, January 2012) - 30 – Industrial Power, Application Engineering Copyright – All Rights Reserved
the beginning, or the immediate detection of reasons for their occurrence (e.g. by a defective capacitor) later on and corrective actions. 6.3 Float Voltage Deviation
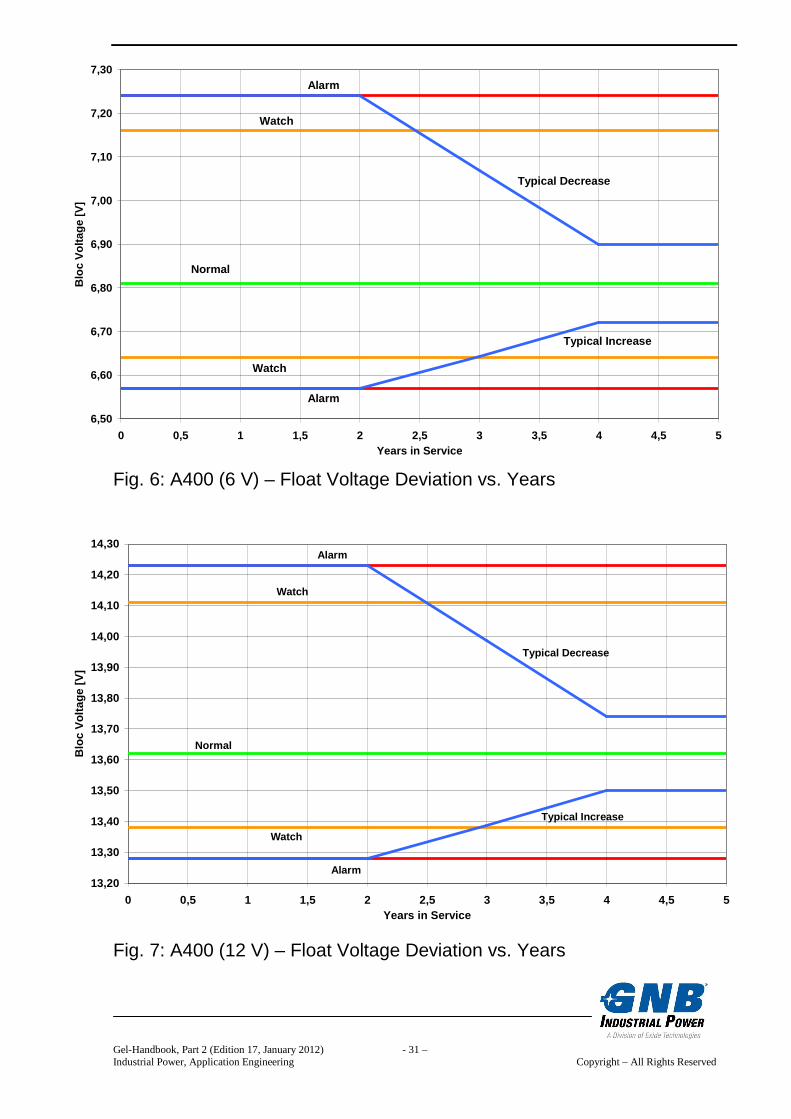
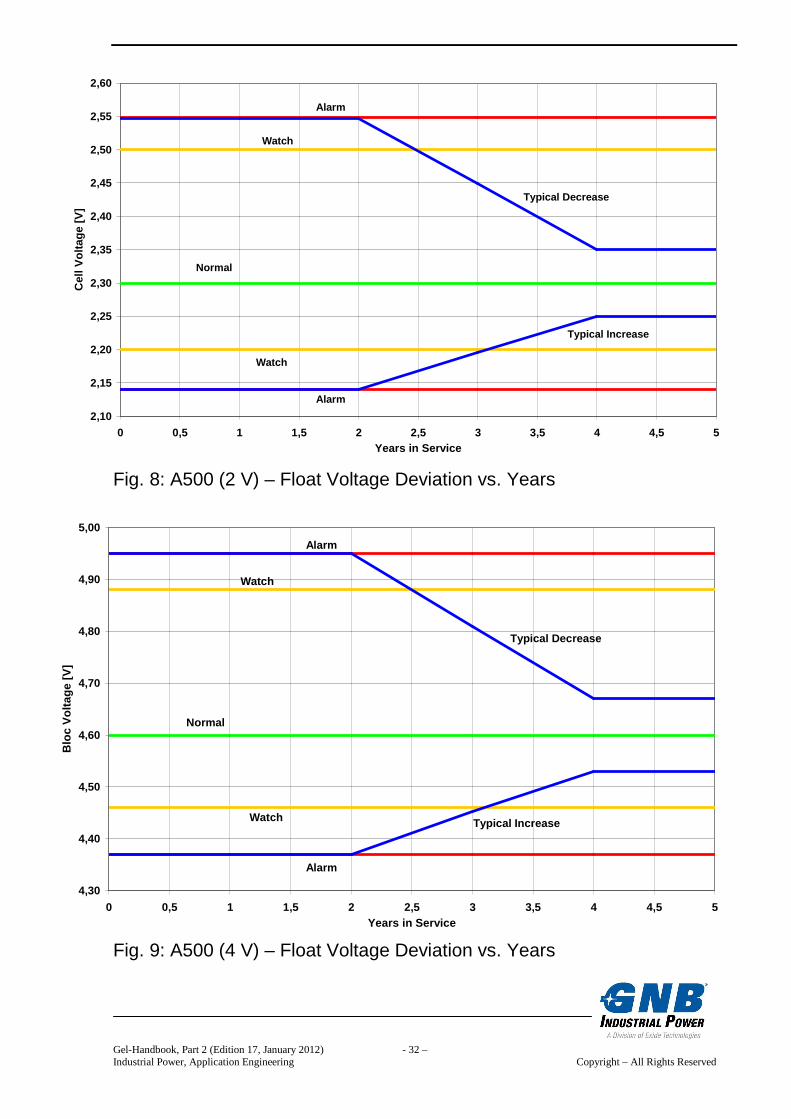
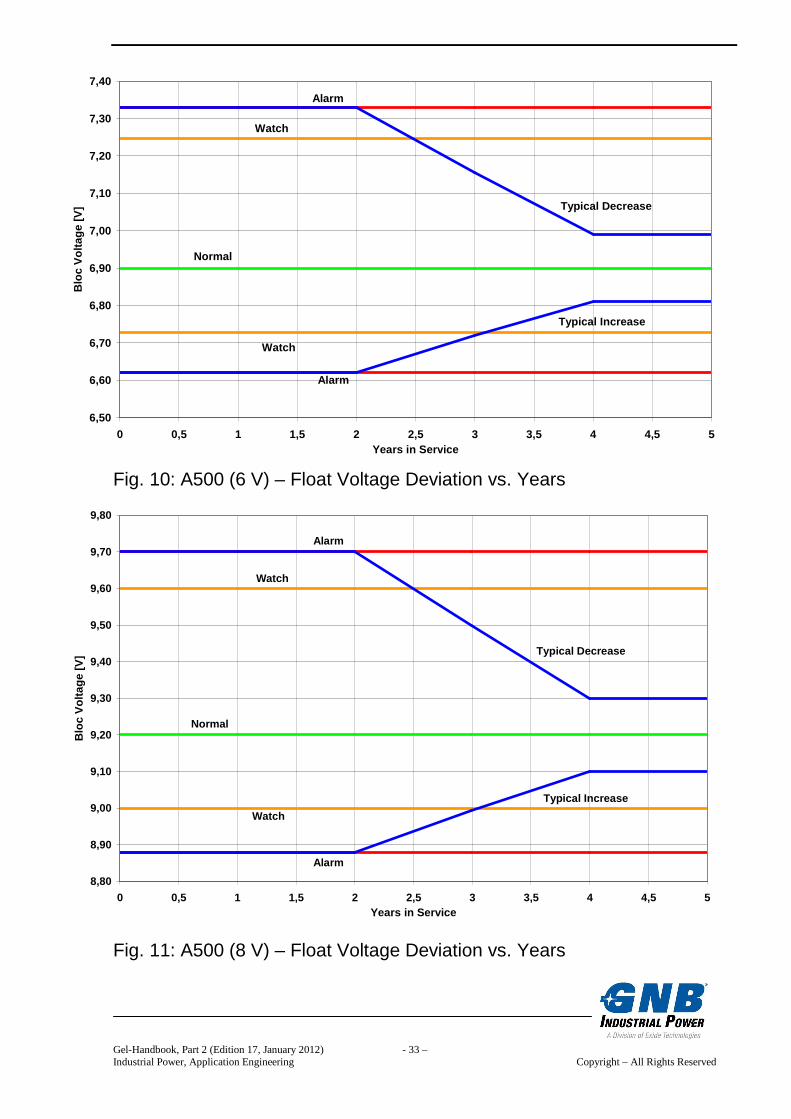
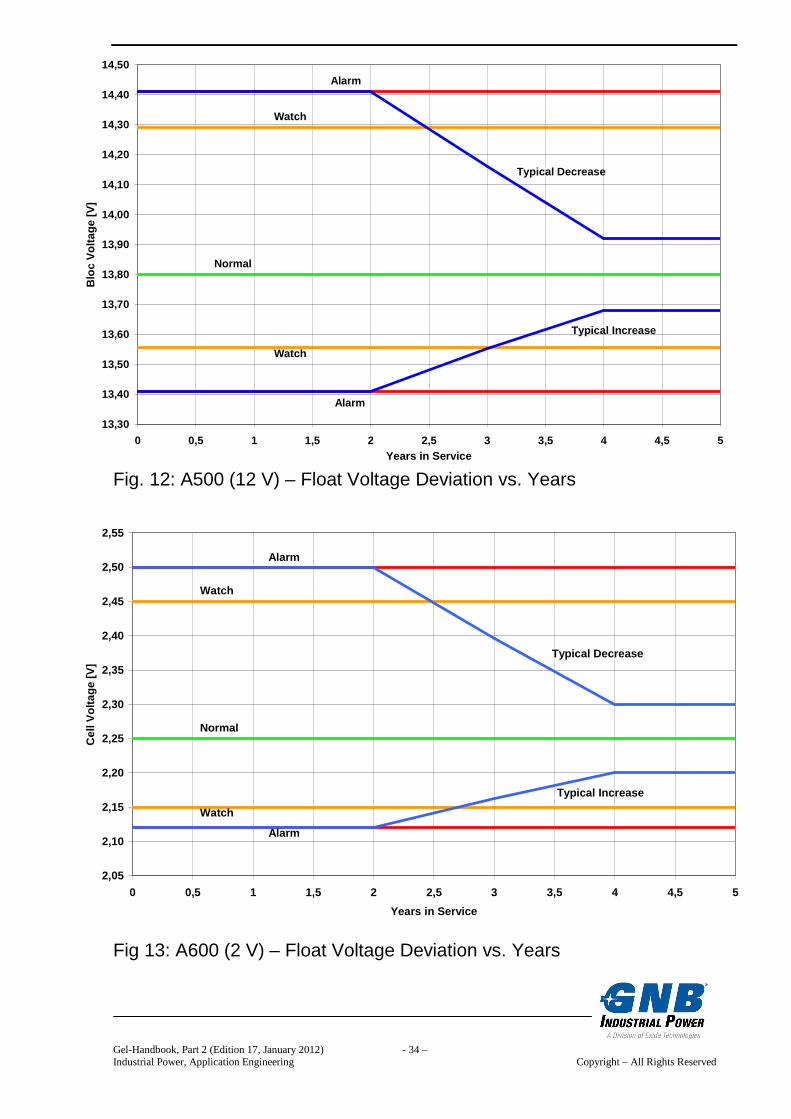
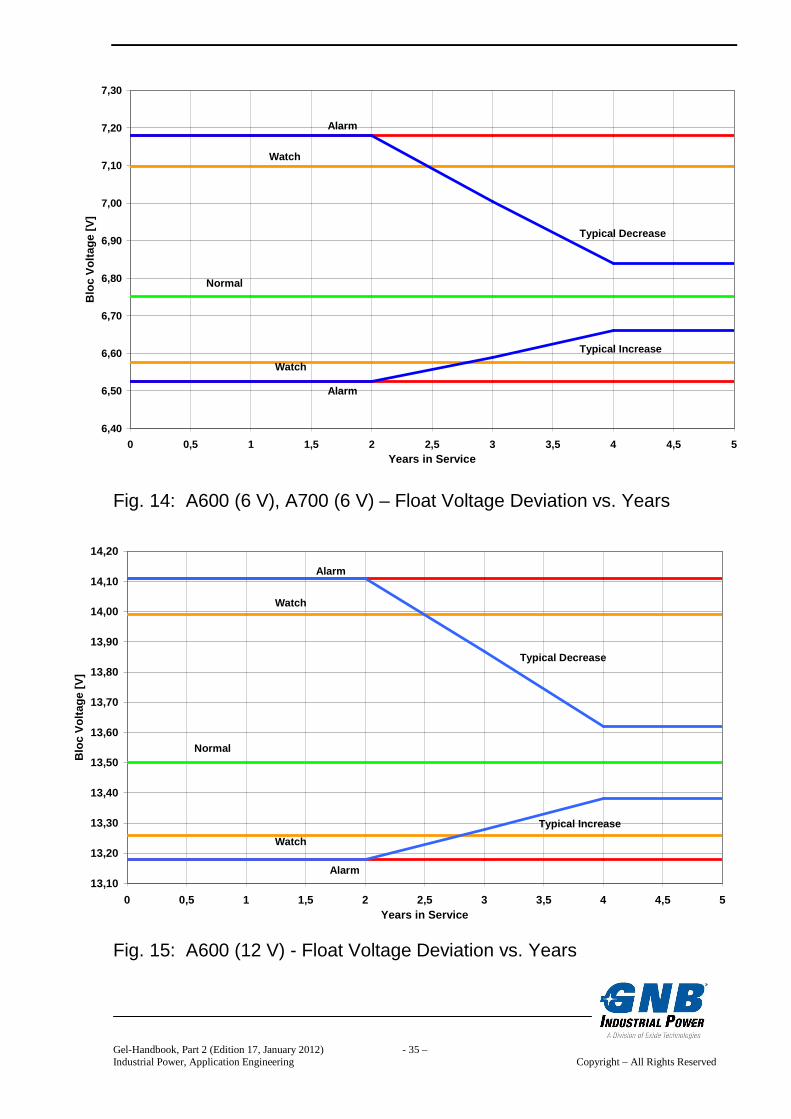
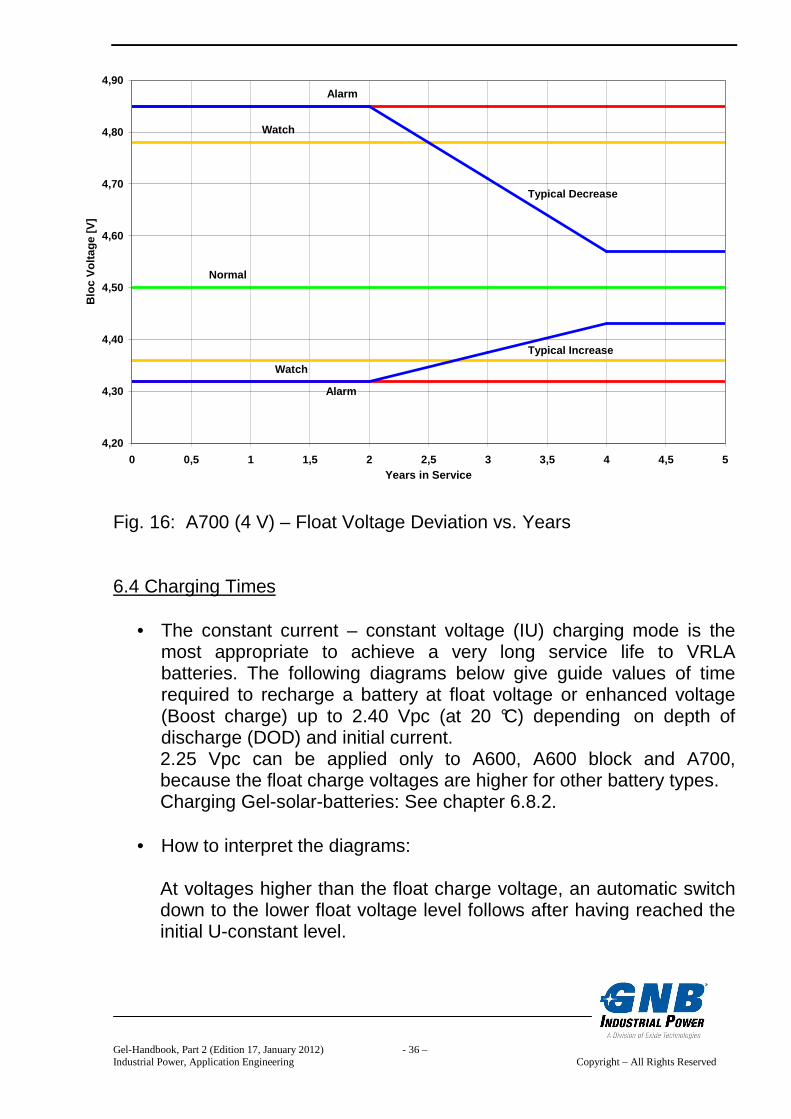
• The individual cell or block float voltages may deviate within a string from the average value set as shown in figures 6 to 16. The following table 6 gives an overview about all the battery types and their variations from the average value under float charge conditions acc. to 6.1.
2 V-cells 4 V-blocks 6 V-blocks 8 V-blocks 12 V-blocks A400 -- -- +0.35/-0.17 -- +0.49/-0.24 A500 +0.2/-0.1 +0.28/-0.14 +0.35/-0.17 +0.40/-0.20 +0.49/-0.24 A600 +0.2/-0.1 -- +0.35/-0.17 -- +0.49/-0.24 A700 -- +0.28/-0.14 +0.35/-0.17 -- -- Table 6: Permissible float voltage deviation from the settings acc. to 6.1. The values correspond to the criterion “Watch” in fig. 6 to 16. • This deviation is even stronger after the installation and within the first
two or three years of operation. It is due to different initial states of recombination and polarization within the cells. In the course of the years it comes to a restriction of the spreading range acc. to fig. 6 to 16 (“Typical increase”, “Typical decrease”, respectively). It is a normal effect and well described in [7].
Gel-Handbook, Part 2 (Edition 17, January 2012) - 31 – Industrial Power, Application Engineering Copyright – All Rights Reserved
Fig. 6: A400 (6 V) – Float Voltage Deviation vs. Years Fig. 7: A400 (12 V) – Float Voltage Deviation vs. Years
6,50
6,60
6,70
6,80
6,90
7,00
7,10
7,20
7,30
0 0,5 1 1,5 2 2,5 3 3,5 4 4,5 5Years in Service
Blo
c V
olta
ge [V
]Alarm
Alarm
Watch
Watch
Normal
Typical Decrease
Typical Increase
13,20
13,30
13,40
13,50
13,60
13,70
13,80
13,90
14,00
14,10
14,20
14,30
0 0,5 1 1,5 2 2,5 3 3,5 4 4,5 5Years in Service
Blo
c V
olta
ge [V
]
Alarm
Alarm
Watch
Watch
Normal
Typical Decrease
Typical Increase
Gel-Handbook, Part 2 (Edition 17, January 2012) - 32 – Industrial Power, Application Engineering Copyright – All Rights Reserved
2,10
2,15
2,20
2,25
2,30
2,35
2,40
2,45
2,50
2,55
2,60
0 0,5 1 1,5 2 2,5 3 3,5 4 4,5 5Years in Service
Cel
l Vol
tage
[V]
Alarm
Alarm
Watch
Watch
Normal
Typical Decrease
Typical Increase
4,30
4,40
4,50
4,60
4,70
4,80
4,90
5,00
0 0,5 1 1,5 2 2,5 3 3,5 4 4,5 5Years in Service
Blo
c V
olta
ge [V
]
Alarm
Alarm
Watch
Watch
Normal
Typical Decrease
Typical Increase
Fig. 8: A500 (2 V) – Float Voltage Deviation vs. Years Fig. 9: A500 (4 V) – Float Voltage Deviation vs. Years
Gel-Handbook, Part 2 (Edition 17, January 2012) - 33 – Industrial Power, Application Engineering Copyright – All Rights Reserved
8,80
8,90
9,00
9,10
9,20
9,30
9,40
9,50
9,60
9,70
9,80
0 0,5 1 1,5 2 2,5 3 3,5 4 4,5 5Years in Service
Blo
c V
olta
ge [V
]
Alarm
Alarm
Watch
Watch
Normal
Typical Decrease
Typical Increase
6,50
6,60
6,70
6,80
6,90
7,00
7,10
7,20
7,30
7,40
0 0,5 1 1,5 2 2,5 3 3,5 4 4,5 5Years in Service
Blo
c V
olta
ge [V
]
Alarm
Alarm
Watch
Watch
Normal
Typical Decrease
Typical Increase
Fig. 10: A500 (6 V) – Float Voltage Deviation vs. Years Fig. 11: A500 (8 V) – Float Voltage Deviation vs. Years
Gel-Handbook, Part 2 (Edition 17, January 2012) - 34 – Industrial Power, Application Engineering Copyright – All Rights Reserved
13,30
13,40
13,50
13,60
13,70
13,80
13,90
14,00
14,10
14,20
14,30
14,40
14,50
0 0,5 1 1,5 2 2,5 3 3,5 4 4,5 5Years in Service
Blo
c V
olta
ge [V
]Alarm
Alarm
Watch
Watch
Normal
Typical Decrease
Typical Increase
2,05
2,10
2,15
2,20
2,25
2,30
2,35
2,40
2,45
2,50
2,55
0 0,5 1 1,5 2 2,5 3 3,5 4 4,5 5
Years in Service
Cel
l Vol
tage
[V]
Alarm
Alarm
Watch
Watch
Normal
Typical Decrease
Typical Increase
Fig. 12: A500 (12 V) – Float Voltage Deviation vs. Years Fig 13: A600 (2 V) – Float Voltage Deviation vs. Years
Gel-Handbook, Part 2 (Edition 17, January 2012) - 35 – Industrial Power, Application Engineering Copyright – All Rights Reserved
6,40
6,50
6,60
6,70
6,80
6,90
7,00
7,10
7,20
7,30
0 0,5 1 1,5 2 2,5 3 3,5 4 4,5 5Years in Service
Blo
c V
olta
ge [V
]
Alarm
Alarm
Watch
Watch
Normal
Typical Decrease
Typical Increase
13,10
13,20
13,30
13,40
13,50
13,60
13,70
13,80
13,90
14,00
14,10
14,20
0 0,5 1 1,5 2 2,5 3 3,5 4 4,5 5Years in Service
Blo
c V
olta
ge [V
]
Alarm
Alarm
Watch
Watch
Normal
Typical Decrease
Typical Increase
Fig. 14: A600 (6 V), A700 (6 V) – Float Voltage Deviation vs. Years Fig. 15: A600 (12 V) - Float Voltage Deviation vs. Years
Gel-Handbook, Part 2 (Edition 17, January 2012) - 36 – Industrial Power, Application Engineering Copyright – All Rights Reserved
4,20
4,30
4,40
4,50
4,60
4,70
4,80
4,90
0 0,5 1 1,5 2 2,5 3 3,5 4 4,5 5Years in Service
Blo
c V
olta
ge [V
]Alarm
Alarm
Watch
Watch
Normal
Typical Decrease
Typical Increase
Fig. 16: A700 (4 V) – Float Voltage Deviation vs. Years 6.4 Charging Times
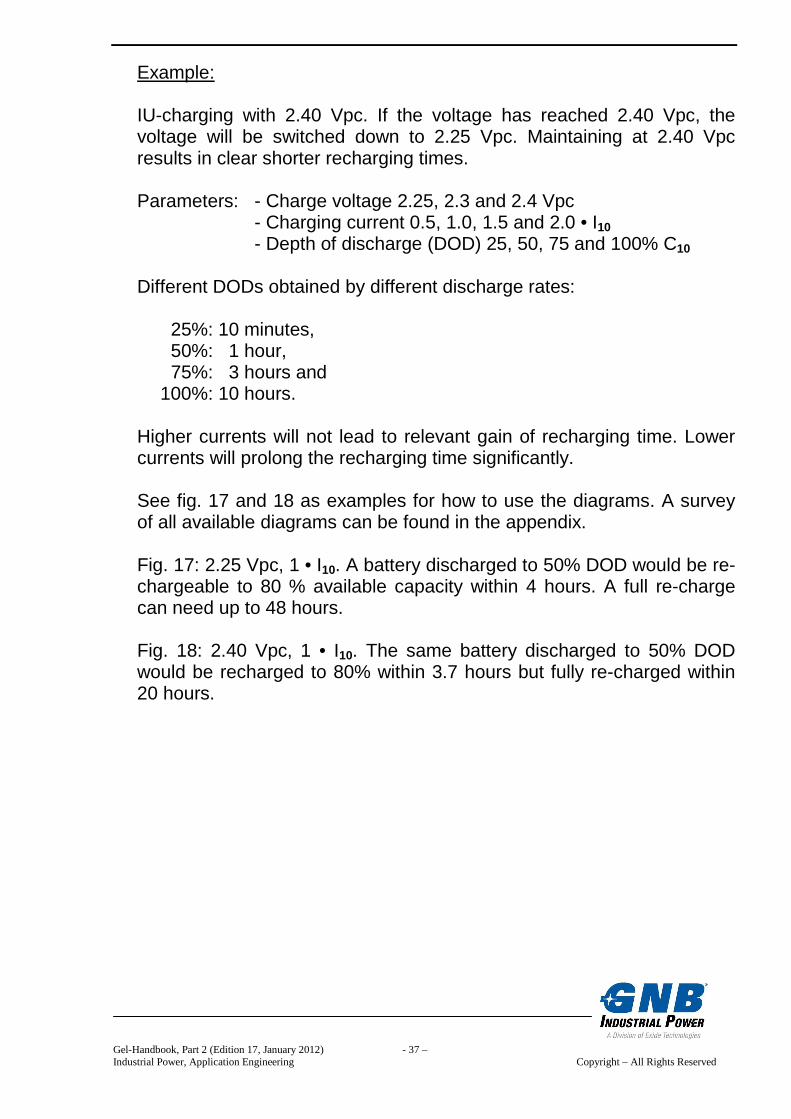
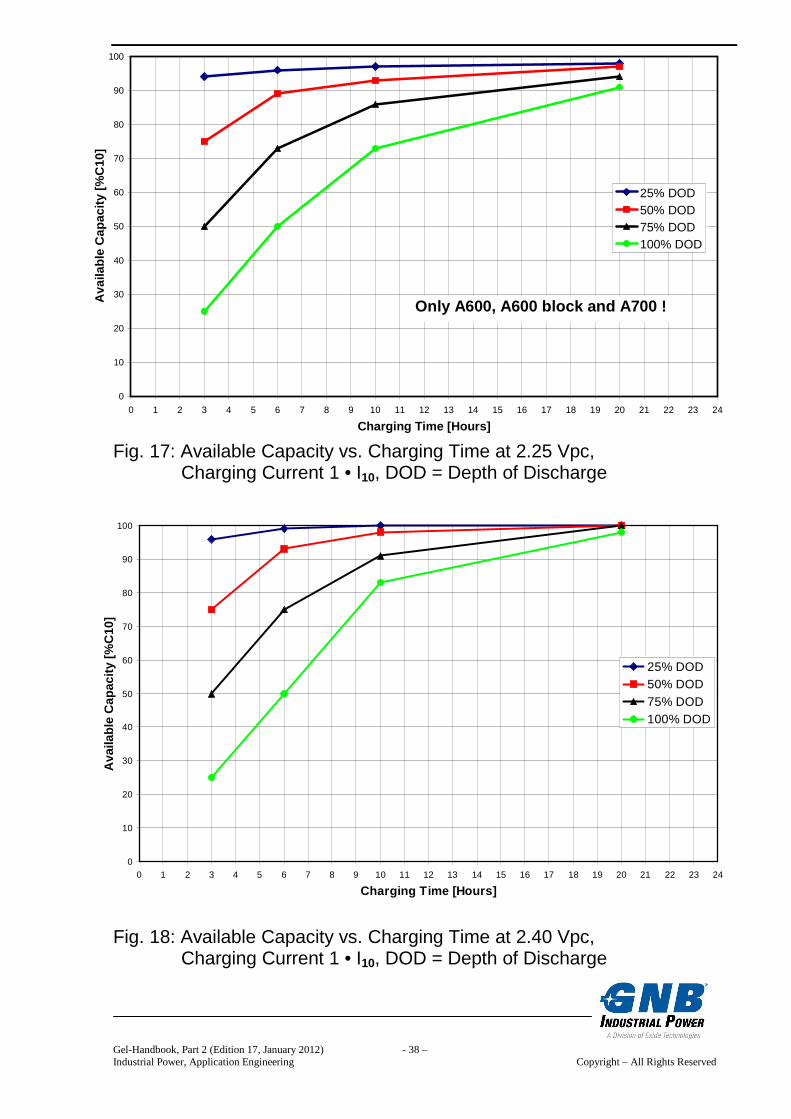
• The constant current – constant voltage (IU) charging mode is the most appropriate to achieve a very long service life to VRLA batteries. The following diagrams below give guide values of time required to recharge a battery at float voltage or enhanced voltage (Boost charge) up to 2.40 Vpc (at 20 °C) depending on depth of discharge (DOD) and initial current. 2.25 Vpc can be applied only to A600, A600 block and A700, because the float charge voltages are higher for other battery types. Charging Gel-solar-batteries: See chapter 6.8.2.
• How to interpret the diagrams:
At voltages higher than the float charge voltage, an automatic switch down to the lower float voltage level follows after having reached the initial U-constant level.
Gel-Handbook, Part 2 (Edition 17, January 2012) - 37 – Industrial Power, Application Engineering Copyright – All Rights Reserved
Example: IU-charging with 2.40 Vpc. If the voltage has reached 2.40 Vpc, the voltage will be switched down to 2.25 Vpc. Maintaining at 2.40 Vpc results in clear shorter recharging times. Parameters: - Charge voltage 2.25, 2.3 and 2.4 Vpc
- Charging current 0.5, 1.0, 1.5 and 2.0 • I10 - Depth of discharge (DOD) 25, 50, 75 and 100% C10
Different DODs obtained by different discharge rates:
25%: 10 minutes, 50%: 1 hour, 75%: 3 hours and 100%: 10 hours.
Higher currents will not lead to relevant gain of recharging time. Lower currents will prolong the recharging time significantly. See fig. 17 and 18 as examples for how to use the diagrams. A survey of all available diagrams can be found in the appendix.
Fig. 17: 2.25 Vpc, 1 • I10. A battery discharged to 50% DOD would be re-chargeable to 80 % available capacity within 4 hours. A full re-charge can need up to 48 hours. Fig. 18: 2.40 Vpc, 1 • I10. The same battery discharged to 50% DOD would be recharged to 80% within 3.7 hours but fully re-charged within 20 hours.
Gel-Handbook, Part 2 (Edition 17, January 2012) - 38 – Industrial Power, Application Engineering Copyright – All Rights Reserved
Fig. 17: Available Capacity vs. Charging Time at 2.25 Vpc, Charging Current 1 • I10, DOD = Depth of Discharge
Fig. 18: Available Capacity vs. Charging Time at 2.40 Vpc, Charging Current 1 • I10, DOD = Depth of Discharge
0
10
20
30
40
50
60
70
80
90
100
0 1 2 3 4 5 6 7 8 9 10 11 12 13 14 15 16 17 18 19 20 21 22 23 24
Charging Time [Hours]
Ava
ilabl
e C
apac
ity [%
C10
]
25% DOD50% DOD75% DOD100% DOD
Only A600, A600 block and A700 !
0
10
20
30
40
50
60
70
80
90
100
0 1 2 3 4 5 6 7 8 9 10 11 12 13 14 15 16 17 18 19 20 21 22 23 24
Charging Time [Hours]
Ava
ilabl
e C
apac
ity [%
C10
]
25% DOD50% DOD75% DOD100% DOD
Gel-Handbook, Part 2 (Edition 17, January 2012) - 39 – Industrial Power, Application Engineering Copyright – All Rights Reserved
6.5 Efficiency of Re-Charging 6.5.1 Ah-Efficiency Discharged Ah Definition: Ah-Efficiency = Re-charged Ah Reciprocal value = Charge coefficient (re-charged Ah/discharged Ah) Normal charge coefficients (pre-set charging time, for instance, 24 hours): 1.05 (discharge rate 10 hours) 1.10 (discharge rate 1 hour) 1.20 (discharge rate 10 minutes) Ah-efficiency = 1/1.05 …1/1.20 = 95%…83% Explanations: The necessary charge coefficient increases with increasing discharge rate (as the depth of discharge (DOD) decreases). Thus, because ohmic losses, heat generation by recombination etc. are relatively same for a given charging time. 6.5.2 Wh-Efficiency In addition to item “Ah-Efficiency”, average voltages during discharge and re-charging have to be taken into account. Discharged Ah • Average Voltage Discharge Definition: Wh-Efficiency = Re-charged Ah • Average Voltage Recharge Example: Discharge: Battery C10 = 100 Ah
10h discharge, rate: I10 discharged: C10 = 100 Ah (100% DOD)
Average voltage during C10-discharge: 2.0 Vpc
(estimated)
Gel-Handbook, Part 2 (Edition 17, January 2012) - 40 – Industrial Power, Application Engineering Copyright – All Rights Reserved
Recharging: IU-Charging 2.25 Vpc, 1• I10, Expected re-charging time (incl. charge coefficient 1.05): 32 hours Estimate for average voltage during re-charging: The voltage increases from 2.1 Vpc to 2.25 Vpc during 9 hours average 2.17 Vpc. The voltage is constant at 2.25 Vpc for (32-9) hours = 23 hours. Estimated average voltage during 32 hours: 2.23 Vpc 100 Ah • 2.0 Vpc Wh-efficiency = = 0.854 = 85 % 105 Ah • 2.23 Vpc 6.6 Equalizing Charge Because it is possible to exceed the permitted load voltages, appropriate measures must be taken, e.g. switch off the load. Equalizing charges are required after deep-discharges and/or inadequate charges or if the individual cell or block voltages are outside the specified range as shown in fig. 6 to 16. They have to be carried out as follows: Up to 48 hours at max. 2.40 Vpc. The charge current is unlimited up to achieving U-constant. The cell / block temperature must never exceed 45°C . If it does, stop charging or switch down to float charge to allow the temperature to decrease. Gel-solar-batteries with system voltages ≥ 48 V Every one to three months:
Method 1: IUI IUI-phase = up to voltage acc. to fig. 26 (chapter 6.8.2) at 20°C. U-phase = until switching at a current of 1.2 A/100 Ah to the second I-
phase. I-phase = 1.2 A/100 Ah for 4 hours.
Gel-Handbook, Part 2 (Edition 17, January 2012) - 41 – Industrial Power, Application Engineering Copyright – All Rights Reserved
Method 2: IUI (pulsation) I-phase = up to voltage acc. to fig. 26 (chapter 6.8.2) at 20°C U-phase = until switching at a current of 1.2 A/100 Ah to the second
I-phase (pulsed) I-phase = charging of 2 A/100 Ah for 4-6 hours where the pulses are
15 min. 2 A/100 Ah and 15 min. 0 A/100 Ah. 6.7 Discharge, Capacity Tests 6.7.1 General Items Even if Gel-VRLA batteries are deep-discharge resistant, their service life can be affected by too many and successive deep-discharges. Therefore:
• Discharge must not be continued below the final discharge voltage acc. to the equivalent discharge current.
• Deeper discharges must not be carried out unless specifically agreed
with GNB Industrial Power. • Recharge immediately following a full or partial discharge. 6.7.2 Capacity Tests • It must be guaranteed that the battery is fully charged before the
capacity test. Regarding batteries being in operation already, an equalizing charge must be carried out in case of any doubt.
• VRLA batteries are delivered always in fully charged state. But, new
installed VRLA batteries show a lack of capacity due to transport and storage. The degree of self-discharge depends on duration and ambient temperature. An estimate is possible roughly only by the rest voltage. Therefore, a specific refreshing charge is important in case of any acceptance tests at site immediately after the installation of a system (see for this “5. Commissioning”).
• If possible, the total battery voltage and the single voltages shall be
measured in both, float charge operation and open circuit.
Gel-Handbook, Part 2 (Edition 17, January 2012) - 42 – Industrial Power, Application Engineering Copyright – All Rights Reserved
• Capacity tests should be carried out acc. to IEC 60896-21 [8]. The voltage of the single cells or blocks shall be recorded automatically or measured by hand. In the last case, the values shall be recorded at least after 25 %, 50 % and 80 % of the expectable discharge time, and afterward in reasonable intervals so that the final discharge voltage can be included.
• The test shall be ended if one of the following criteria is fulfilled,
whichever comes first:
- The battery voltage has reached n • Uf [Vpc], with n = number of cells per string and Uf = final discharge voltage per cell.
Example: Uf = 1.75 Vpc, n = 24 cells, battery voltage = 24 cells • 1.75 Vpc = 42 V
- The weakest cell is fallen down to
Umin = final discharge voltage Uf [Vpc] – 0.2 V
Example: Final discharge voltage Uf = 1.75 Vpc. Therefore, the weakest cell may have: Umin = Uf – 0.2 V = 1.55 V.
Single cells and blocks must be handled from different points of view, because statistics plays a role in case of blocks. Therefore, the following baselines results for calculations:
Minimum permitted voltage (Umin ) per single cell: Umin = Uf [V/cell] – 0.2 V
Minimum permitted voltage (Umin ) per block: Umin = Uf [V/block] - √ n • 0.2 V
(Uf = final discharge voltage, n = number of cells)
Therefore, the following values result:
2 V 4 V 6 V 10 V 12 V - 0.2 - 0.28 - 0.35 - 0.45 - 0.49
Table 7: Voltage tolerances at the end of discharge
Gel-Handbook, Part 2 (Edition 17, January 2012) - 43 – Industrial Power, Application Engineering Copyright – All Rights Reserved
Example: 12 V-block battery Final discharge voltage Uf = 1.75 Vpc Final discharge voltage per block: Uf = 10.50 V Calculation: 10.50 V – 0.49 V = 10.01 V Minimum permitted voltage per block: Umin = 10.01 V
• The initial temperature is conclusive for the correction of the test result. It shall be between 18 and 27 °C acc. to IEC 60896- 21 [8] .
Proceeding:
The test results in a measured capacity
C [Ah] = I [A] • t [h]
Then, the temperature corrected capacity Ccorr. [Ah] results in
C
Ccorr. = with 1 + λ ( ϑ - 20)
temperature coefficient λ = 0.006 for tests of ≥ C3 or 0.01 for tests of < C3, respectively,
initial temperature ϑ in °C. • There are no regulations regarding the frequency of capacity tests to be
carried out. The user can decide as he wants. But, testing too frequently doesn’t make sense, because the result reflects only a momentary state of the battery anyway. Extreme testing could be equivalent to cycling.
Following an example for a conceivable proceeding in case of a OPzV-battery (service life 15 to 18 years at 20 °C):
first test after 1 or 2 years *); after that, every 3 to 5 years; annual as soon as the capacity begins to drop continuously.
*) Instead of the first test after 1 or 2 years it can be also the acceptance test after the commissioning
Gel-Handbook, Part 2 (Edition 17, January 2012) - 44 – Industrial Power, Application Engineering Copyright – All Rights Reserved
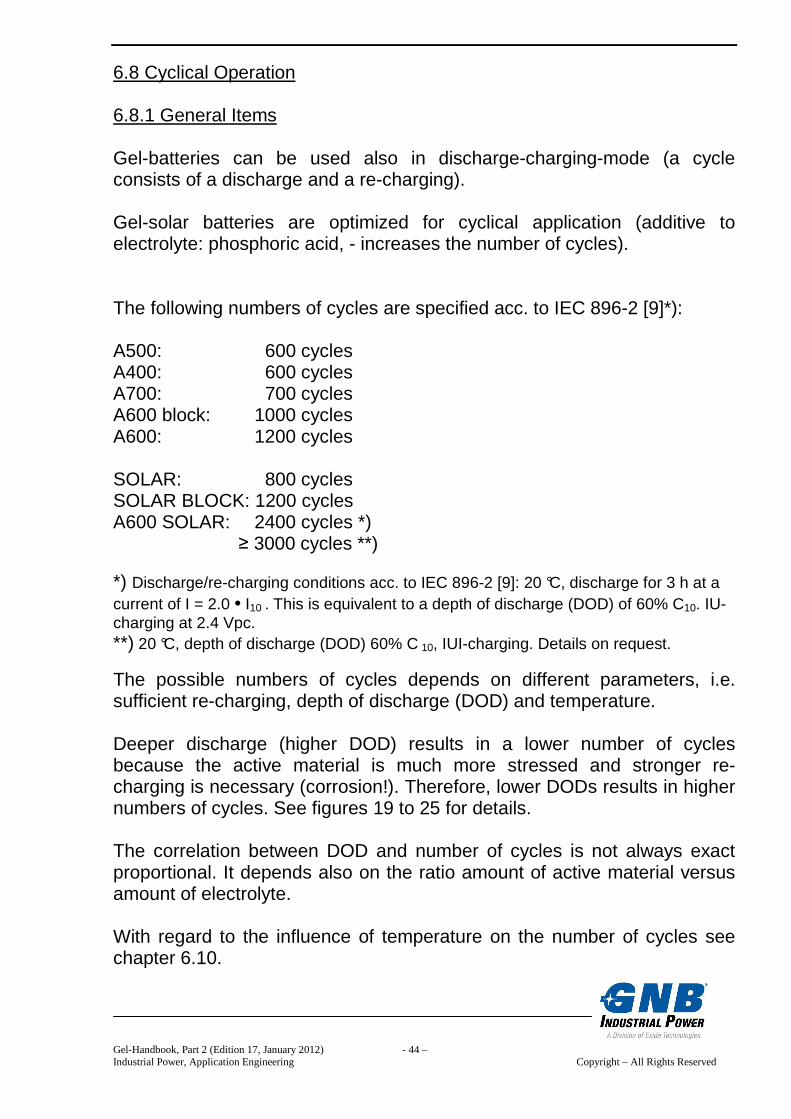
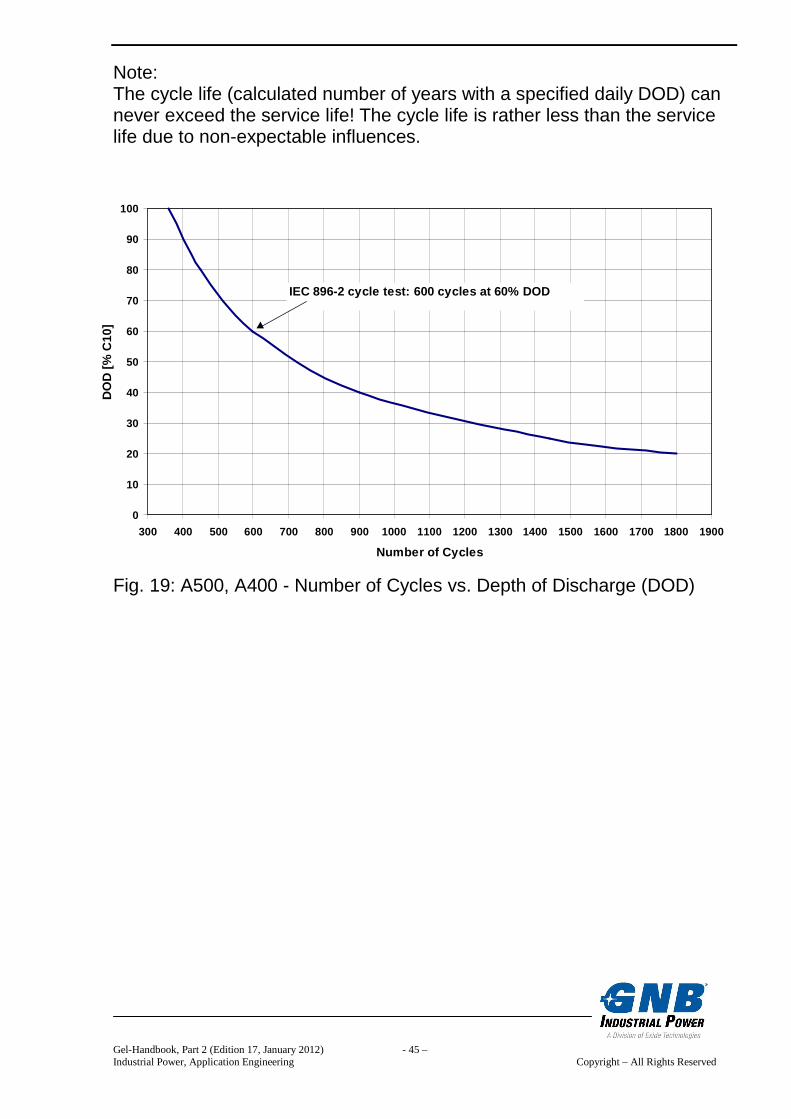
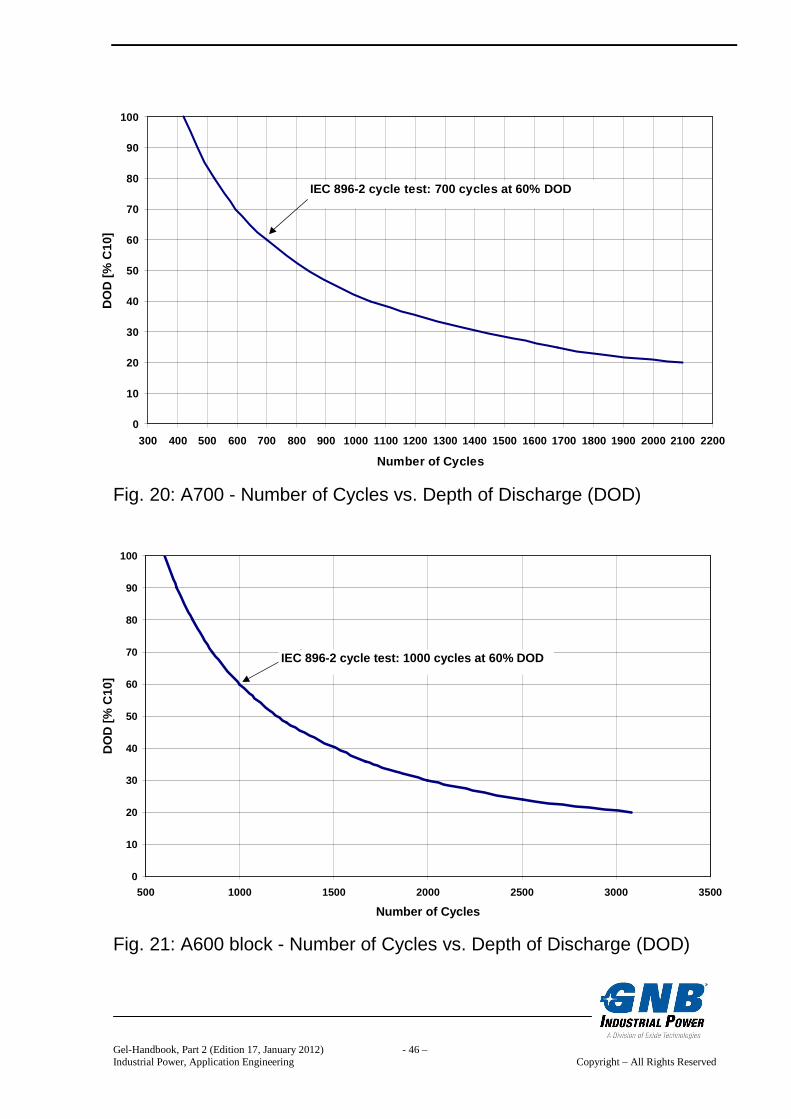
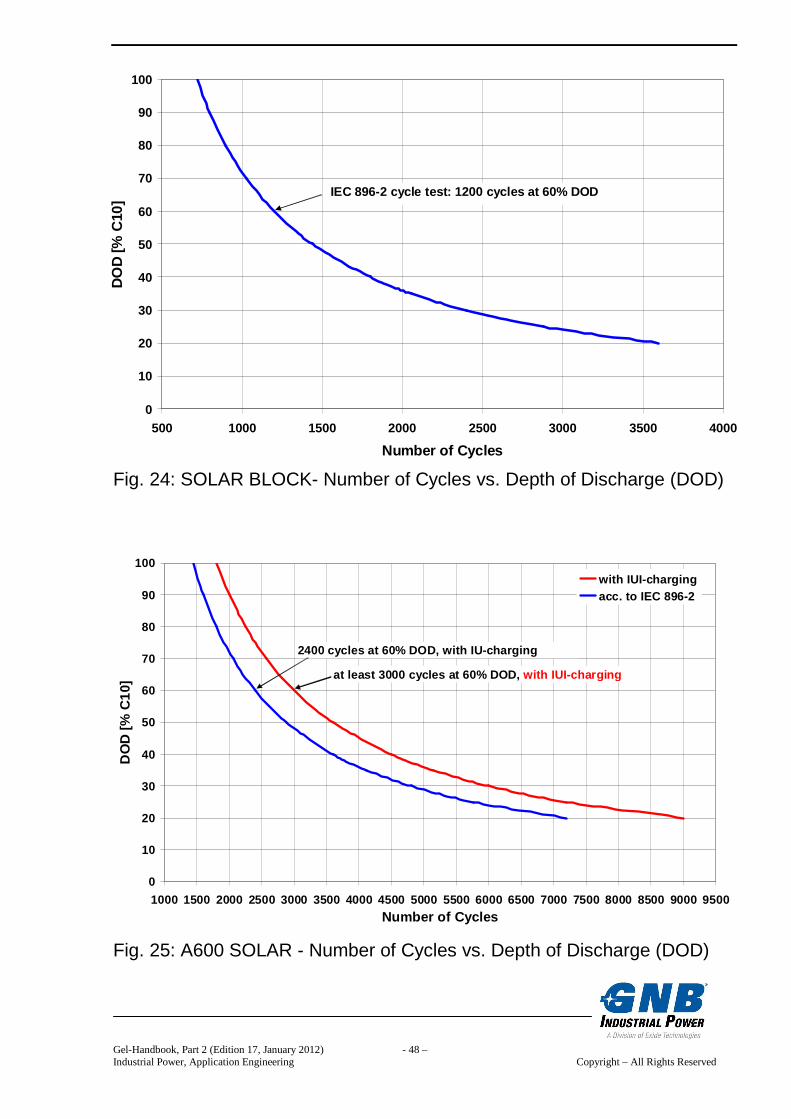
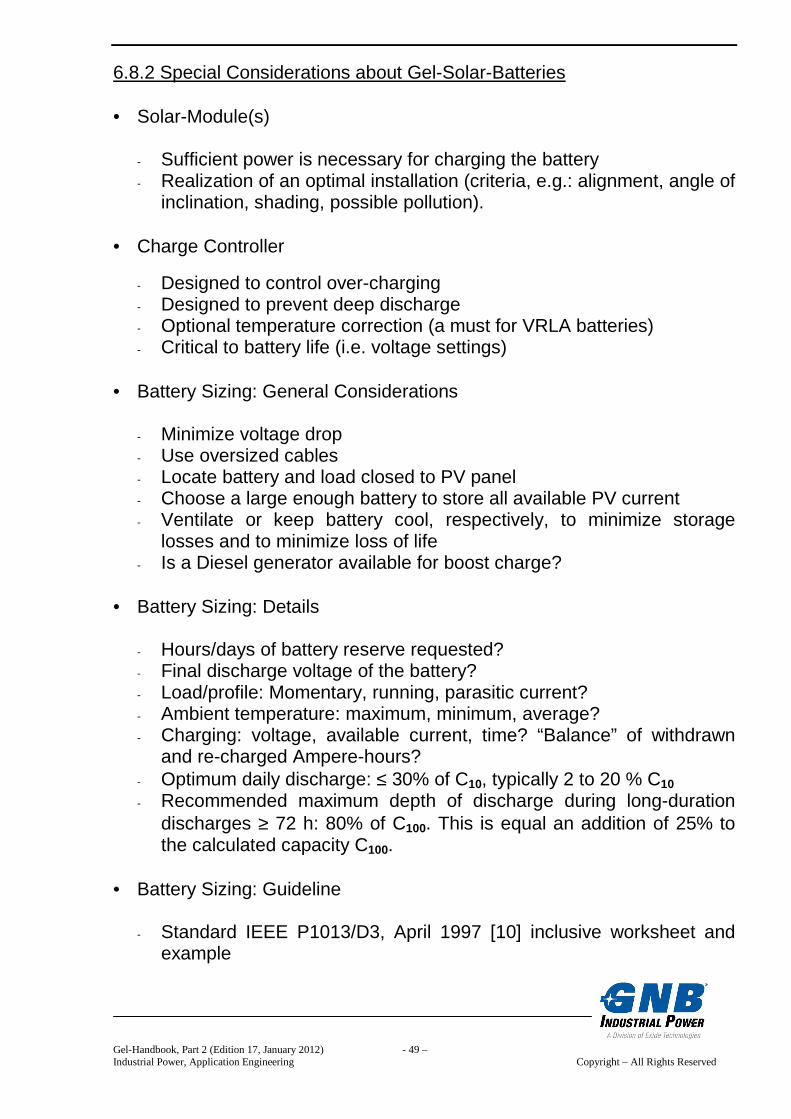
6.8 Cyclical Operation 6.8.1 General Items Gel-batteries can be used also in discharge-charging-mode (a cycle consists of a discharge and a re-charging). Gel-solar batteries are optimized for cyclical application (additive to electrolyte: phosphoric acid, - increases the number of cycles). The following numbers of cycles are specified acc. to IEC 896-2 [9]*): A500: 600 cycles A400: 600 cycles A700: 700 cycles A600 block: 1000 cycles A600: 1200 cycles SOLAR: 800 cycles SOLAR BLOCK: 1200 cycles A600 SOLAR: 2400 cycles *) ≥ 3000 cycles **) *) Discharge/re-charging conditions acc. to IEC 896-2 [9]: 20 °C, discharge for 3 h at a current of I = 2.0 • I10 . This is equivalent to a depth of discharge (DOD) of 60% C10. IU-charging at 2.4 Vpc. **) 20 °C, depth of discharge (DOD) 60% C 10, IUI-charging. Details on request.
The possible numbers of cycles depends on different parameters, i.e. sufficient re-charging, depth of discharge (DOD) and temperature. Deeper discharge (higher DOD) results in a lower number of cycles because the active material is much more stressed and stronger re-charging is necessary (corrosion!). Therefore, lower DODs results in higher numbers of cycles. See figures 19 to 25 for details. The correlation between DOD and number of cycles is not always exact proportional. It depends also on the ratio amount of active material versus amount of electrolyte. With regard to the influence of temperature on the number of cycles see chapter 6.10.
Gel-Handbook, Part 2 (Edition 17, January 2012) - 45 – Industrial Power, Application Engineering Copyright – All Rights Reserved
Note: The cycle life (calculated number of years with a specified daily DOD) can never exceed the service life! The cycle life is rather less than the service life due to non-expectable influences.
Fig. 19: A500, A400 - Number of Cycles vs. Depth of Discharge (DOD)
0
10
20
30
40
50
60
70
80
90
100
300 400 500 600 700 800 900 1000 1100 1200 1300 1400 1500 1600 1700 1800 1900
Number of Cycles
DO
D [%
C10
]
IEC 896-2 cycle test: 600 cycles at 60% DOD
Gel-Handbook, Part 2 (Edition 17, January 2012) - 46 – Industrial Power, Application Engineering Copyright – All Rights Reserved
0
10
20
30
40
50
60
70
80
90
100
500 1000 1500 2000 2500 3000 3500
Number of Cycles
DO
D [%
C10
]
IEC 896-2 cycle test: 1000 cycles at 60% DOD
Fig. 20: A700 - Number of Cycles vs. Depth of Discharge (DOD) Fig. 21: A600 block - Number of Cycles vs. Depth of Discharge (DOD)
0
10
20
30
40
50
60
70
80
90
100
300 400 500 600 700 800 900 1000 1100 1200 1300 1400 1500 1600 1700 1800 1900 2000 2100 2200
Number of Cycles
DO
D [%
C10
]
IEC 896-2 cycle test: 700 cycles at 60% DOD
Gel-Handbook, Part 2 (Edition 17, January 2012) - 47 – Industrial Power, Application Engineering Copyright – All Rights Reserved
Fig. 22: A600 - Number of Cycles vs. Depth of Discharge (DOD) Fig. 23: SOLAR - Number of Cycles vs. Depth of Discharge (DOD)
0
10
20
30
40
50
60
70
80
90
100
500 1000 1500 2000 2500 3000 3500 4000
Number of Cycles
DO
D [%
C10
]
IEC 896-2 cycle test: 1200 cycles at 60% DOD
0
10
20
30
40
50
60
70
80
90
100
400 600 800 1000 1200 1400 1600 1800 2000 2200 2400 2600
Number of Cycles
DO
D [%
C10
]
IEC 896-2 cycle test: 800 cycles at 60% DOD
Gel-Handbook, Part 2 (Edition 17, January 2012) - 48 – Industrial Power, Application Engineering Copyright – All Rights Reserved
0
10
20
30
40
50
60
70
80
90
100
500 1000 1500 2000 2500 3000 3500 4000
Number of Cycles
DO
D [%
C10
]
IEC 896-2 cycle test: 1200 cycles at 60% DOD
0
10
20
30
40
50
60
70
80
90
100
1000 1500 2000 2500 3000 3500 4000 4500 5000 5500 6000 6500 7000 7500 8000 8500 9000 9500
Number of Cycles
DO
D [%
C10
]
with IUI-chargingacc. to IEC 896-2
2400 cycles at 60% DOD, with IU-charging
at least 3000 cycles at 60% DOD, with IUI-charging
Fig. 24: SOLAR BLOCK- Number of Cycles vs. Depth of Discharge (DOD) Fig. 25: A600 SOLAR - Number of Cycles vs. Depth of Discharge (DOD)
Gel-Handbook, Part 2 (Edition 17, January 2012) - 49 – Industrial Power, Application Engineering Copyright – All Rights Reserved
6.8.2 Special Considerations about Gel-Solar-Batteries • Solar-Module(s)
- Sufficient power is necessary for charging the battery - Realization of an optimal installation (criteria, e.g.: alignment, angle of
inclination, shading, possible pollution). • Charge Controller
- Designed to control over-charging - Designed to prevent deep discharge - Optional temperature correction (a must for VRLA batteries) - Critical to battery life (i.e. voltage settings)
• Battery Sizing: General Considerations
- Minimize voltage drop - Use oversized cables - Locate battery and load closed to PV panel - Choose a large enough battery to store all available PV current - Ventilate or keep battery cool, respectively, to minimize storage
losses and to minimize loss of life - Is a Diesel generator available for boost charge?
• Battery Sizing: Details
- Hours/days of battery reserve requested? - Final discharge voltage of the battery? - Load/profile: Momentary, running, parasitic current? - Ambient temperature: maximum, minimum, average? - Charging: voltage, available current, time? “Balance” of withdrawn
and re-charged Ampere-hours? - Optimum daily discharge: ≤ 30% of C10, typically 2 to 20 % C10 - Recommended maximum depth of discharge during long-duration
discharges ≥ 72 h: 80% of C100. This is equal an addition of 25% to the calculated capacity C100.
• Battery Sizing: Guideline
- Standard IEEE P1013/D3, April 1997 [10] inclusive worksheet and example
Gel-Handbook, Part 2 (Edition 17, January 2012) - 50 – Industrial Power, Application Engineering Copyright – All Rights Reserved
• Battery Sizing: Summary
- System must be well designed. - System must fulfill the expectations throughout the year! - Right design of panel, charge controller and battery! - Load and sun light must be in equilibrium (how many hours/days in
summer/winter?) - Automotive batteries are not suitable for use in professional solar
systems. - The whole system with as less as possible maintenance, especially in
rural areas. • Temperature Difference
The battery installation shall be done on such a way that temperature differences between individual cells/blocks do not exceed 3 degree Celsius (Kelvin).
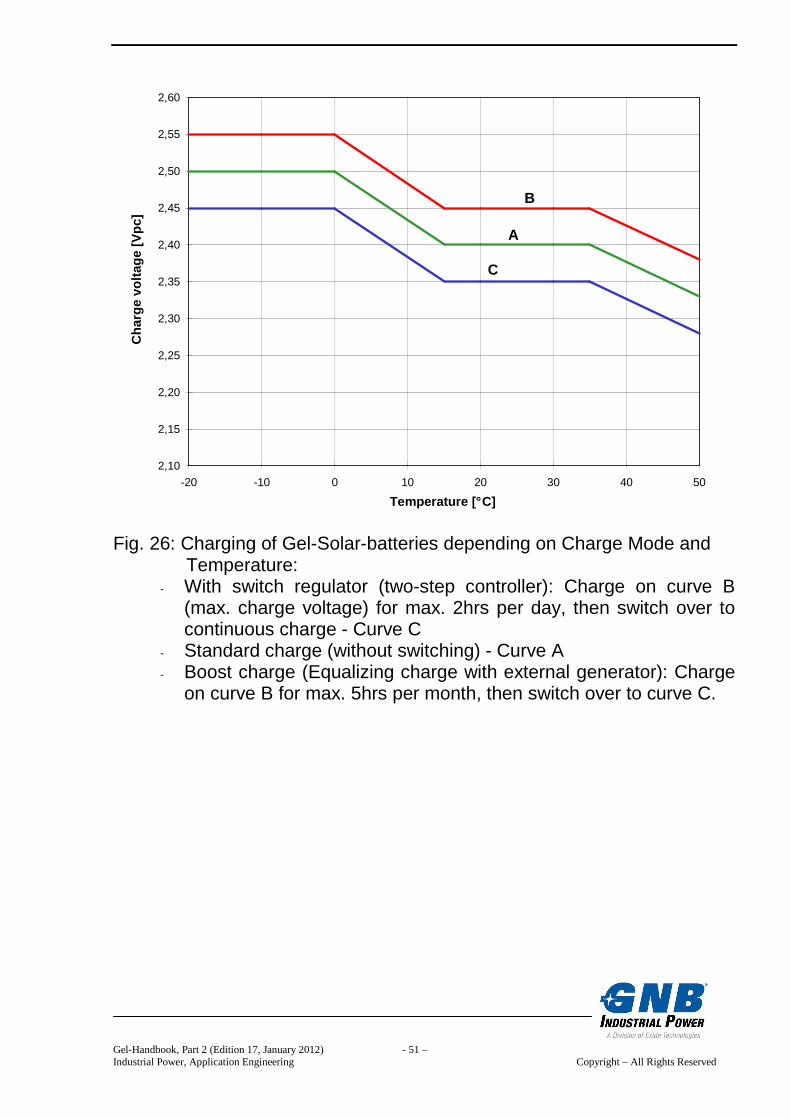
• Charging
The charging of Gel-solar-batteries shall be carried out acc. to fig. 26. A temperature related adjustment of the charge voltage within the operating temperature of 15 °C to 35 °C must not be applied. If the operating temperature is permanently outside this range, the charge voltage has to be adjusted as shown in fig. 26.
Solar batteries have to be operated also at States-of-Charge (SOC) less than 100% due to seasonal and other conditions, for instance (acc. IEC 61427 [11]):
Summer: 80 to 100% SOC, Winter: down to 20% SOC.
Therefore, equalizing charges should be given every 3 to 12 months depending on the actual SOC values over a longer period.
Gel-Handbook, Part 2 (Edition 17, January 2012) - 51 – Industrial Power, Application Engineering Copyright – All Rights Reserved
Fig. 26: Charging of Gel-Solar-batteries depending on Charge Mode and
Temperature: - With switch regulator (two-step controller): Charge on curve B
(max. charge voltage) for max. 2hrs per day, then switch over to continuous charge - Curve C
- Standard charge (without switching) - Curve A - Boost charge (Equalizing charge with external generator): Charge
on curve B for max. 5hrs per month, then switch over to curve C.
2,10
2,15
2,20
2,25
2,30
2,35
2,40
2,45
2,50
2,55
2,60
-20 -10 0 10 20 30 40 50
Temperature [° C]
Cha
rge
volta
ge [V
pc]
A
B
C
Gel-Handbook, Part 2 (Edition 17, January 2012) - 52 – Industrial Power, Application Engineering Copyright – All Rights Reserved
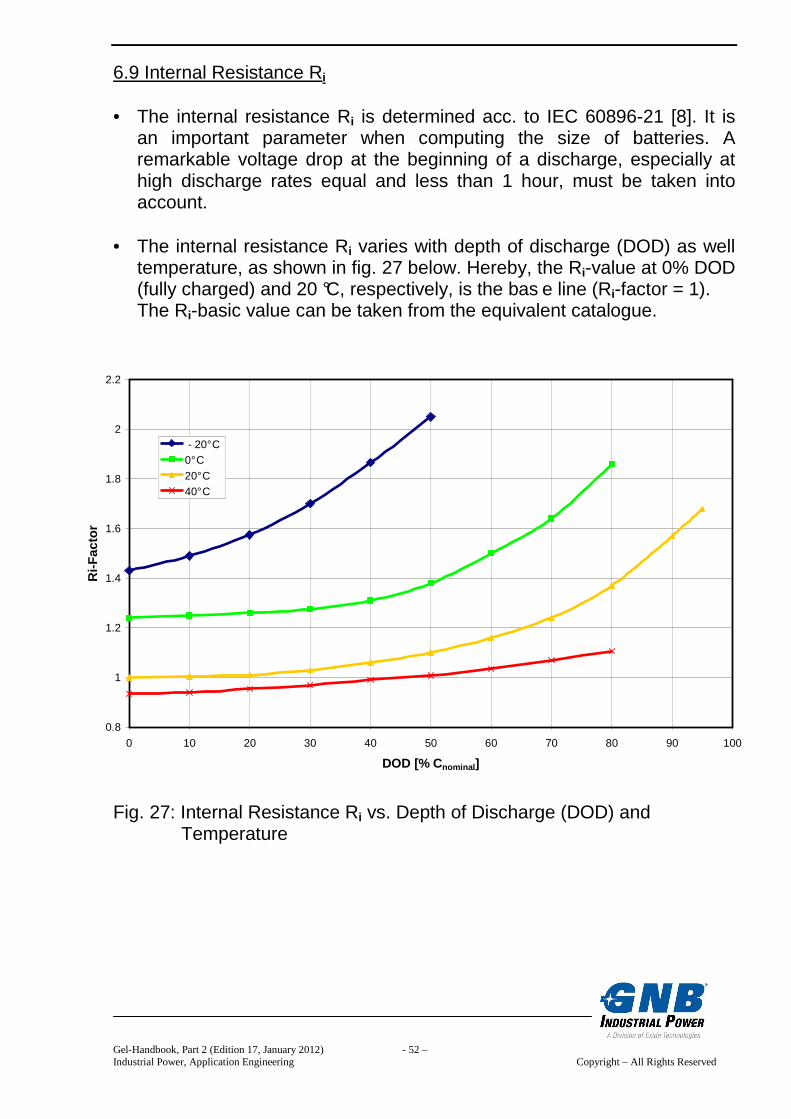
6.9 Internal Resistance Ri • The internal resistance Ri is determined acc. to IEC 60896-21 [8]. It is
an important parameter when computing the size of batteries. A remarkable voltage drop at the beginning of a discharge, especially at high discharge rates equal and less than 1 hour, must be taken into account.
• The internal resistance Ri varies with depth of discharge (DOD) as well
temperature, as shown in fig. 27 below. Hereby, the Ri-value at 0% DOD (fully charged) and 20 °C, respectively, is the bas e line (Ri-factor = 1). The Ri-basic value can be taken from the equivalent catalogue.
Fig. 27: Internal Resistance Ri vs. Depth of Discharge (DOD) and Temperature
0.8
1
1.2
1.4
1.6
1.8
2
2.2
0 10 20 30 40 50 60 70 80 90 100
DOD [% Cnominal ]
Ri-F
acto
r
- 20° C0° C20° C40° C
Gel-Handbook, Part 2 (Edition 17, January 2012) - 53 – Industrial Power, Application Engineering Copyright – All Rights Reserved
6.10 Influence of Temperature • The design of Gel-batteries allows the use in a wide temperature range
from – 40 °C to + 55 °C. • There is a risk at temperatures of approx. less than -15 °C regarding
freezing-in of the electrolyte depending on the depth of discharge and the withdrawn capacity, respectively.
• 20 °C is the nominal temperature and the optimal t emperature regarding
capacity and lifetime (= service life). Lower temperatures reduce the available capacity and prolong the re-charge time. Higher temperatures reduce the lifetime and number of cycles.
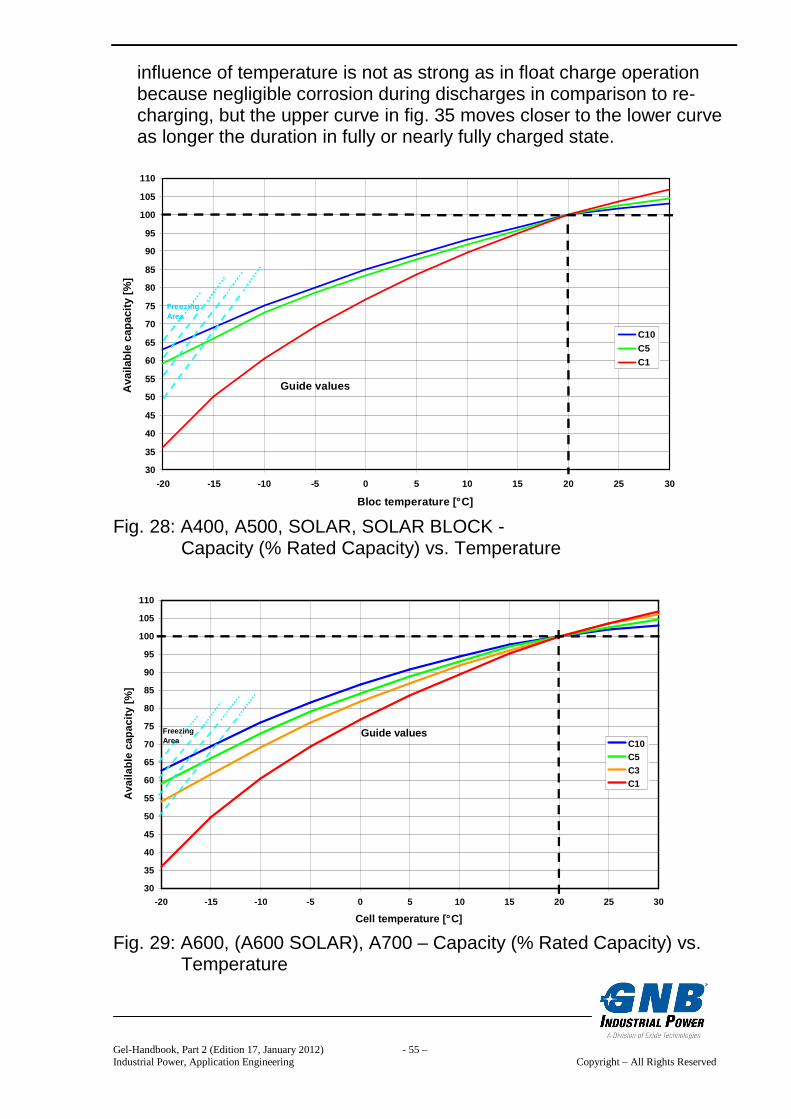
• The battery temperature influences the capacity as shown in fig. 28 and
29. • Common service life applied to the nominal capacity, 20 °C and with
occasional discharges:
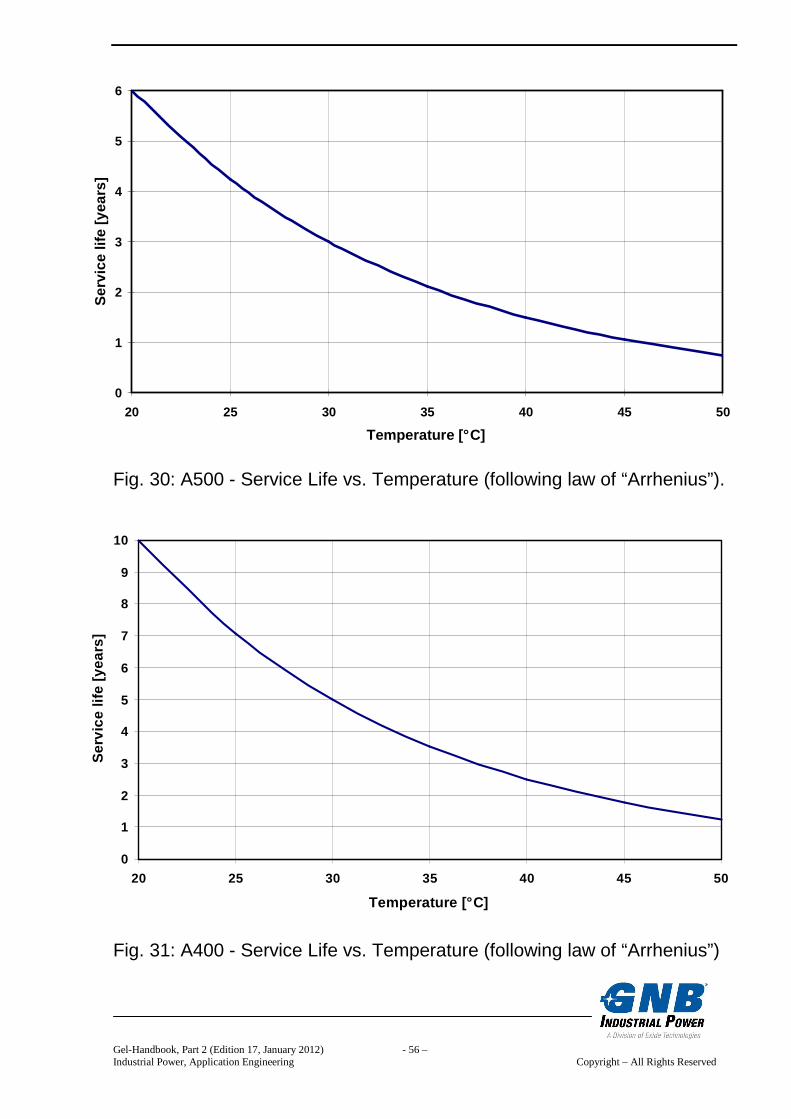
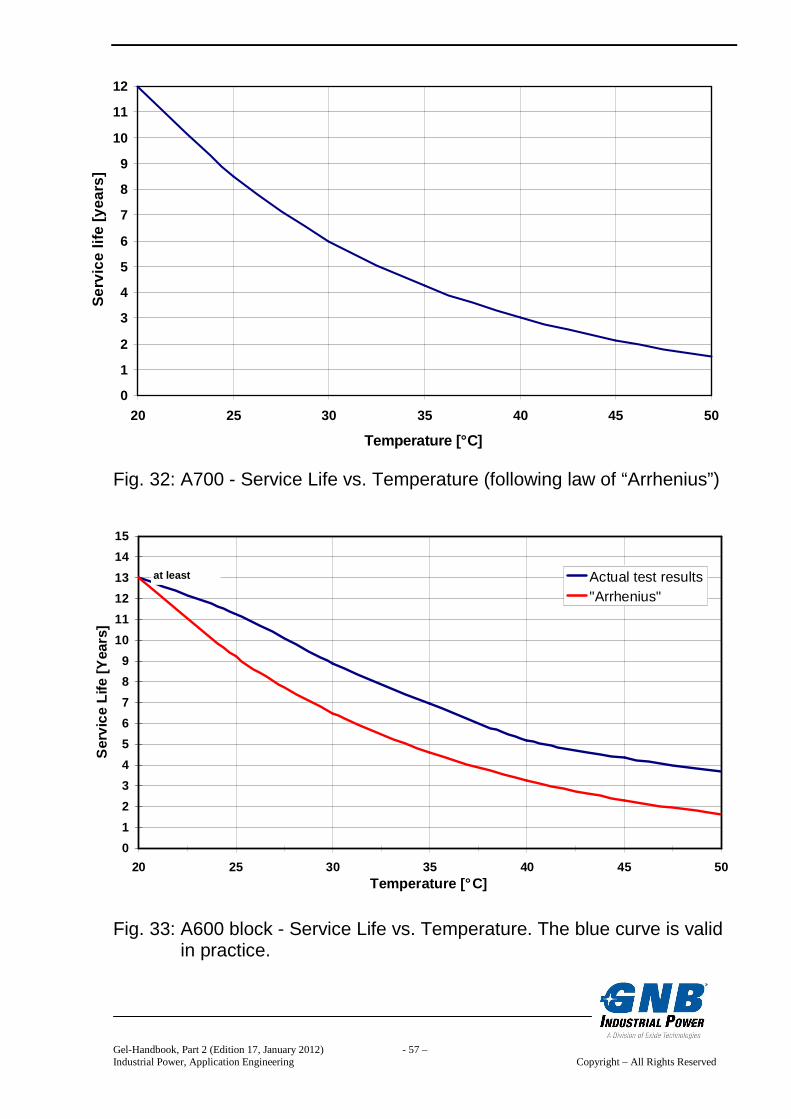
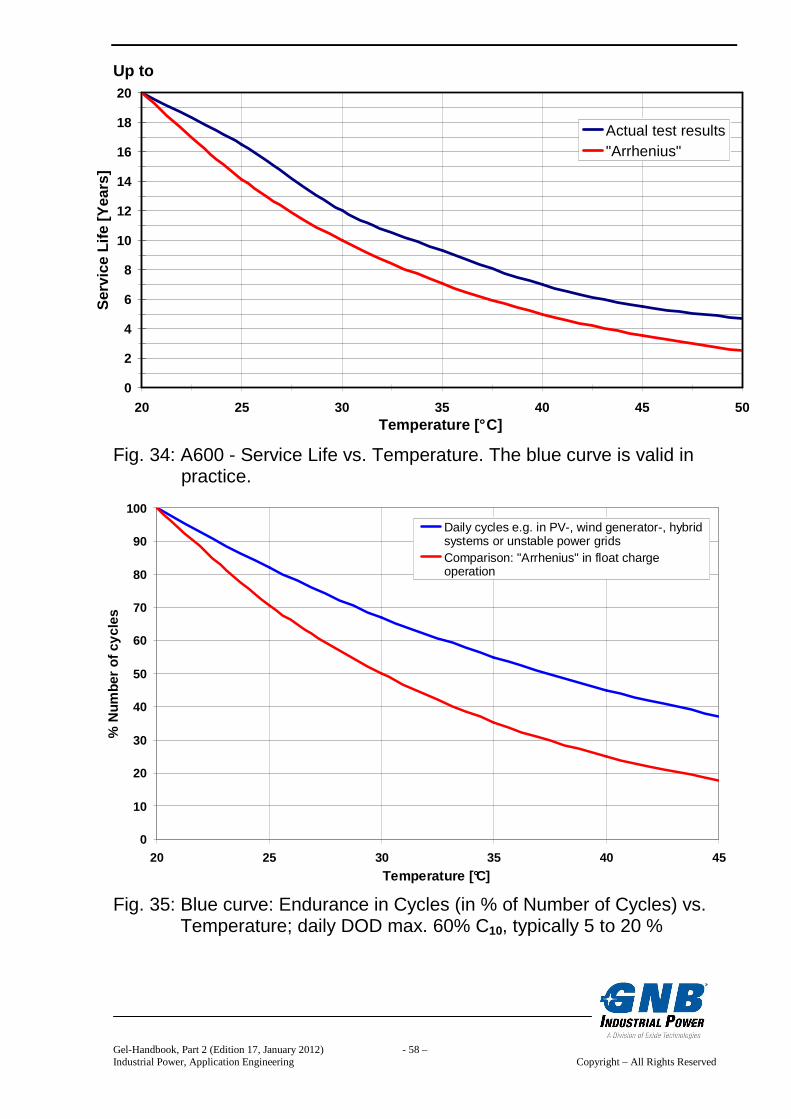
A500: > 6 years A400: > 10 years A700: 12 years A600 block: 13 to 15 years A600: up to 20 years
SOLAR: 5 to 6 years SOLAR BLOCK: 7 to 8 years A600 SOLAR: up to 15 years
in comparison to the determined design life applied to the nominal capacity and 20 °C:
A500: 7 years A400: 12 years A700: > 12 years A600 block: 15 years A600: 20 years SOLAR, SOLAR BLOCK and A600 SOLAR are designed for cyclical application only.
Gel-Handbook, Part 2 (Edition 17, January 2012) - 54 – Industrial Power, Application Engineering Copyright – All Rights Reserved
Even if Gel-solar-batteries are not optimized for standby application, they can be used for that too. The achievable service life is shorter than for standard Gel-batteries with equivalent design because phosphoric acid is added in order to increase the number of cycles. Phosphoric acid increases the corrosion rate and the self-discharge rate slightly.
• High temperatures affect batteries’ service life acc. to a common rough
formula (law of “Arrhenius”): The corrosion rate is doubled per 10 °C. Therefore, the lifetime will be halved per 10 °C increase. Example: 15 years at 20 °C becomes reduced to 7.5 y ears at 30 °C.
This is even valid for all batteries with positive grid plate design (A400, A500 and A700).
There is one exception where the influence doesn’t follow the law of “Arrhenius”, - that’s for A600 (cells and blocks) with positive tubular plates. The influence of temperature is less than for other batteries. For instance, an increase of 10 degrees from 20 to 30 °C will cause a life reduction of about 30% only instead of 50%.
Reasons:
- Casting of the positive spine frame on high-pressure die-casting
machines. Hereby, the injection pressure is 100 bar. That assures a very fine grain structure high resistant to the corrosion process.
- The active material, but also the corrosion layer is under high
pressure by the gauntlets avoiding a growth of corrosion layer as fast as in positive grid plate designs.
- The spines are covered by an approx. 3 mm layer of active material.
Therefore, the spines are not stressed by conversion of active material and electrolyte as much as in grid plates. The conversion occurs mainly in the outer parts of the tubular plates.
Fig. 30 to 34 show the dependency of the lifetime on the temperature for different lines of products. Fig. 35 is regarding the influence of temperature on the endurance in cycles (number of cycles). Daily cycles up to 60% DOD C10, typically 5 to 20 % are taken into account. The
Gel-Handbook, Part 2 (Edition 17, January 2012) - 55 – Industrial Power, Application Engineering Copyright – All Rights Reserved
influence of temperature is not as strong as in float charge operation because negligible corrosion during discharges in comparison to re-charging, but the upper curve in fig. 35 moves closer to the lower curve as longer the duration in fully or nearly fully charged state.
Fig. 28: A400, A500, SOLAR, SOLAR BLOCK - Capacity (% Rated Capacity) vs. Temperature
Fig. 29: A600, (A600 SOLAR), A700 – Capacity (% Rated Capacity) vs. Temperature
30
35
40
45
50
55
60
65
70
75
80
85
90
95
100
105
110
-20 -15 -10 -5 0 5 10 15 20 25 30
Cell temperature [° C]
Ava
ilabl
e ca
paci
ty [%
]
C10C5C3C1
Guide valuesFreezing Area
30
35
40
45
50
55
60
65
70
75
80
85
90
95
100
105
110
-20 -15 -10 -5 0 5 10 15 20 25 30
Bloc temperature [° C]
Ava
ilabl
e ca
paci
ty [%
]
C10
C5
C1
Guide values
Freezing Area
Gel-Handbook, Part 2 (Edition 17, January 2012) - 56 – Industrial Power, Application Engineering Copyright – All Rights Reserved
Fig. 30: A500 - Service Life vs. Temperature (following law of “Arrhenius”). Fig. 31: A400 - Service Life vs. Temperature (following law of “Arrhenius”)
0
1
2
3
4
5
6
20 25 30 35 40 45 50
Temperature [° C]
Ser
vice
life
[yea
rs]
0
1
2
3
4
5
6
7
8
9
10
20 25 30 35 40 45 50
Temperature [° C]
Ser
vice
life
[yea
rs]
Gel-Handbook, Part 2 (Edition 17, January 2012) - 57 – Industrial Power, Application Engineering Copyright – All Rights Reserved
Fig. 32: A700 - Service Life vs. Temperature (following law of “Arrhenius”)
Fig. 33: A600 block - Service Life vs. Temperature. The blue curve is valid in practice.
0
1
2
3
4
5
6
7
8
9
10
11
12
13
14
15
20 25 30 35 40 45 50Temperature [° C]
Ser
vice
Life
[Yea
rs]
Actual test results"Arrhenius"
at least
0
1
2
3
4
5
6
7
8
9
10
11
12
20 25 30 35 40 45 50
Temperature [° C]
Ser
vice
life
[yea
rs]
Gel-Handbook, Part 2 (Edition 17, January 2012) - 58 – Industrial Power, Application Engineering Copyright – All Rights Reserved
0
10
20
30
40
50
60
70
80
90
100
20 25 30 35 40 45
Temperature [°C]
% N
umbe
r of
cyc
les
Daily cycles e.g. in PV-, wind generator-, hybridsystems or unstable power grids Comparison: "Arrhenius" in float chargeoperation
0
2
4
6
8
10
12
14
16
18
20
20 25 30 35 40 45 50Temperature [° C]
Ser
vice
Life
[Yea
rs]
Actual test results"Arrhenius"
Up to Fig. 34: A600 - Service Life vs. Temperature. The blue curve is valid in practice.
Fig. 35: Blue curve: Endurance in Cycles (in % of Number of Cycles) vs. Temperature; daily DOD max. 60% C10, typically 5 to 20 %
Gel-Handbook, Part 2 (Edition 17, January 2012) - 59 – Industrial Power, Application Engineering Copyright – All Rights Reserved
6.11 Maintenance and Checks 6.11.1 General Items and Checks acc. to Operating Instructions • Periodic inspections and maintenance are necessary regarding:
- charge voltage and current settings, - the discharge conditions, - the temperature levels, - the storage conditions, - the cleanliness of the battery and equipment - and other conditions relevant to safety issues and battery’s service
life (battery room ventilation, for example).
• Periodic discharges can be used to assess the available operating endurance, to detect faulty cells / blocks and aging symptoms of the battery, in order to consider battery replacement in due time.
• VRLA batteries do not require topping-up water. That’s the reason why
they were called “maintenance-free”. Pressure valves are used for sealing and cannot be opened without destruction. Therefore, they are defined as “Valve-Regulated” lead-acid batteries (VRLA batteries).
• Even if VRLA batteries are called “maintenance-free” sometimes, they
need control (see operating instructions, appendix 2, for details): • Keep the battery clean and dry to avoid leakage currents. Plastic parts
of the battery, especially containers, must be cleaned with pure water without additives.
• At least every 6 months measure and record:
- Battery voltage - Voltage of several cells / blocks (approx. 20%) - Surface temperature of several cells / blocks - Battery- room temperature
• Annual measurement and recording:
- Battery voltage - Voltage of all cells / blocks - Surface temperature of all cells / blocks
Gel-Handbook, Part 2 (Edition 17, January 2012) - 60 – Industrial Power, Application Engineering Copyright – All Rights Reserved
- Battery- room temperature Annual visual checks: - Screw connections - Screw connections without locking devices have to be checked for
tightness. - Battery installation and arrangement - Ventilation
If the cell / block voltages differ from the average float charge voltage acc. to item 6.1 by more than a specified +/- tolerance as stated in fig. 6 to 16 or if the surface temperature difference between cells / blocks exceeds 5 K, the service agent should be contacted. Deviations of the battery voltage from the average value depending on the battery type and the number of cells have to be corrected (see chapter 6.1). 6.11.2 Battery Testers and Battery Monitoring Sometimes, other methods than capacity tests are offered for checking the state-of-health, state-of-charge or capacity of batteries. This equipment is based on any of the following ohmic methods: conductance, impedance, DC-resistance. So-called battery testers are portable. Any of ohmic methods as mentioned above can be included in battery monitoring systems. Hereby, monitoring means the system works on-line and is permanently connected to the battery. Either battery testers or monitoring system, the above mentioned ohmic methods can be used in order to follow up trending of data. But, they can never replace a standardized capacity test. Thus, because none of the above mentioned methods can supply absolute results. In fact, the results of measurements depend on the concrete method (frequency, amplitude etc.), the operator (battery testers!) and other parameters, i.e. temperature and location of probes on the cells or blocks. For more information, see also [12] and [13]. The following guideline can be used for the interpretation of impedance / conductance / resistance measurements:
Gel-Handbook, Part 2 (Edition 17, January 2012) - 61 – Industrial Power, Application Engineering Copyright – All Rights Reserved
• If impedance or conductance measurements are used for VRLA batteries it is recommended to install the battery and keep it for at least two days on float charge. After the two days and a maximum of seven days the first readings should be taken. These readings represent the initial impedance/conductance values for the blocks or cells.
• It is then recommended to take impedance/conductance readings every 6 or 12 months. If the application is considered as very critical in terms of reliability of power supply the readings can be taken more often.
• The interpretation of impedance/conductance values can not end with a
conclusion of full capacity, low capacity or no capacity. Therefore the following recommendations can be made:
- If impedance/conductance values of blocks or cells change more
than 35 % to negative direction*), compared to the initial value, a boost charge for 12 hours followed by 2 days on float charge is recommended firstly. The measurement must be repeated. If the values are not decreasing below the 35 % criteria, a capacity test should be carried out for the battery.
- If impedance/conductance values of blocks or cells measured have a
negative deviation*) of more than 35 %, compared to the average value (per battery), a boost charge for 12 hours followed by 2 days on float charge is recommended firstly. The measurement must be repeated. If the values are not decreasing below the 35 % criteria, a capacity test should be carried out for the battery.
- If no initial values are measured for a battery, only the second
method can be applied.
*) impedance to higher values and conductance to lower values All impedance/conductance measurements can be compared to each other only if the temperature does not differ more than +/- 2 °C. For favorable deviations (impedance lower or conductance higher) no activity is needed (unless it complies with low DC float voltage) because this changing is related to the normal capacity increase of batteries put in float charge operation.
Gel-Handbook, Part 2 (Edition 17, January 2012) - 62 – Industrial Power, Application Engineering Copyright – All Rights Reserved
If a cell or a block is changed based on impedance/conductance measurement and returned to the manufacturer for investigation it is strongly recommended to write the measured value with permanent ink on the cell or block. 6.11.3 Cleaning of Batteries
• The cell vents must not be opened. • It is allowed to clean the plastic parts of the battery, especially the cell
containers, by water respectively water-soaked clothes only without additives [1].
• After the cleaning, the battery surface has to be dried on a suitable way,
for instance, by compressed air or by clothes [1].
7. Recycling, Reprocessing
Lead-acid batteries are recoverable commercial ware. GNB Industrial Power’ factories recycle used lead and sees oneself as a part of the entire life cycle of a battery with regard to environmental protection. Contact your GNB Industrial Power representative. He will inform you about further details. This holds also for used cells / blocks. The transport of used accumulators is subject to special regulations. Therefore, it is recommended to order a company specialized in packaging and in making out of freight papers. Details about the transport of used accumulators can be found in the information leaflet of the ZVEI “Taking back of used industrial batteries acc. to the battery decree” [14]. 8. List of References [1] Information leaflet “Cleaning of Batteries” of the working group
“Industrial Batteries” in the ZVEI (Central Association of German Electrical and Electronic Manufacturers), Frankfurt/M., edition October 2006
Gel-Handbook, Part 2 (Edition 17, January 2012) - 63 – Industrial Power, Application Engineering Copyright – All Rights Reserved
[2] European standard EN 50272-2 “Safety requirements for secondary batteries and battery installations, Part 2: Stationary batteries”, June 2001
[3] Directive 2006/95/EC relating to electrical equipment designed for
use within certain voltage limits (so-called “Low Voltage Directive”), amended by the Directive 93/68/EEC, the so-called “CE marking Directive”
[4] B. A. Cole, R. J. Schmitt, J. Szymborski (GNB Technologies):
“Operational Characteristics of VRLA Batteries Configured in Parallel Strings”, proceedings INTELEC 1998
[5] German standard DIN 41774, part 1 “Semiconductor rectifier
equipment with IU-characteristic for the charging of lead-acid batteries – Guidelines”, edition February 1979 (this standard is available in German language only)
[6] Information leaflet “Considerations on service life of stationary
batteries” of the working group “Industrial Batteries” in the ZVEI (Central Association of German Electrical and Electronic Manufacturers), Frankfurt/M., edition August 2009
[7] F. Kramm, Dr. H. Niepraschk (Akkumulatorfabrik Sonnenschein
GmbH): “Phenomena of Recombination and Polarization for VRLA Batteries in Gel Technology”, proceedings INTELEC 1999
[8] International standard IEC 60896-21 “Stationary Lead-Acid Batteries,
Part 2: Valve Regulated Types, Section 1: Functional characteristics and methods of test”, first edition February 2004
[9] International standard IEC 896-2 “Stationary lead-acid batteries –
General requirements and methods of test – Part 2: Valve regulated types”, first edition November 1995
[10] International standard IEEE P1013/D3: “IEEE Recommended
Practice for Sizing Lead-Acid Batteries for Photovoltaic (PV) Systems”, draft April 1997
[11] International standard IEC 61427 “Secondary cells and batteries for
photovoltaic energy systems (PVES) - General requirements and methods of test”, second edition 2005-05
Gel-Handbook, Part 2 (Edition 17, January 2012) - 64 – Industrial Power, Application Engineering Copyright – All Rights Reserved
[12] B. A. Cole, R. J. Schmitt (GNB Technologies): “A Guideline for the Interpretation of Battery Diagnostic Readings in the Real World”, Battconn ’99
[13] PPT-Presentation “Monitoring” (GNB Industrial Power, GCS),
October 2002 [14] Information leaflet “Taking back of used industrial batteries acc. to the
battery decree” of the working group “Industrial Batteries” in the ZVEI (Central Association of German Electrical and Electronic Manufacturers), Frankfurt/M., edition July 2007 (available in German language only)
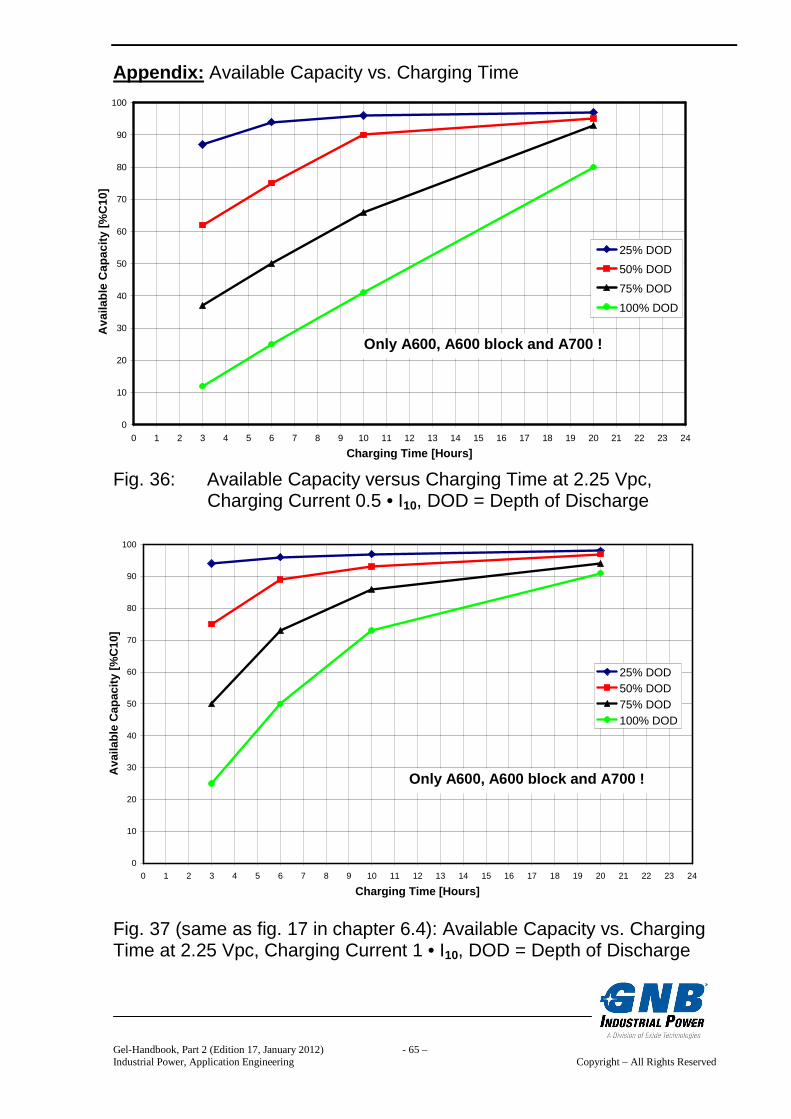
Gel-Handbook, Part 2 (Edition 17, January 2012) - 65 – Industrial Power, Application Engineering Copyright – All Rights Reserved
0
10
20
30
40
50
60
70
80
90
100
0 1 2 3 4 5 6 7 8 9 10 11 12 13 14 15 16 17 18 19 20 21 22 23 24
Charging Time [Hours]
Ava
ilabl
e C
apac
ity [%
C10
]
25% DOD
50% DOD
75% DOD
100% DOD
Only A600, A600 block and A700 !
Appendix: Available Capacity vs. Charging Time Fig. 36: Available Capacity versus Charging Time at 2.25 Vpc,
Charging Current 0.5 • I10, DOD = Depth of Discharge Fig. 37 (same as fig. 17 in chapter 6.4): Available Capacity vs. Charging Time at 2.25 Vpc, Charging Current 1 • I10, DOD = Depth of Discharge
0
10
20
30
40
50
60
70
80
90
100
0 1 2 3 4 5 6 7 8 9 10 11 12 13 14 15 16 17 18 19 20 21 22 23 24
Charging Time [Hours]
Ava
ilabl
e C
apac
ity [%
C10
]
25% DOD50% DOD75% DOD100% DOD
Only A600, A600 block and A700 !
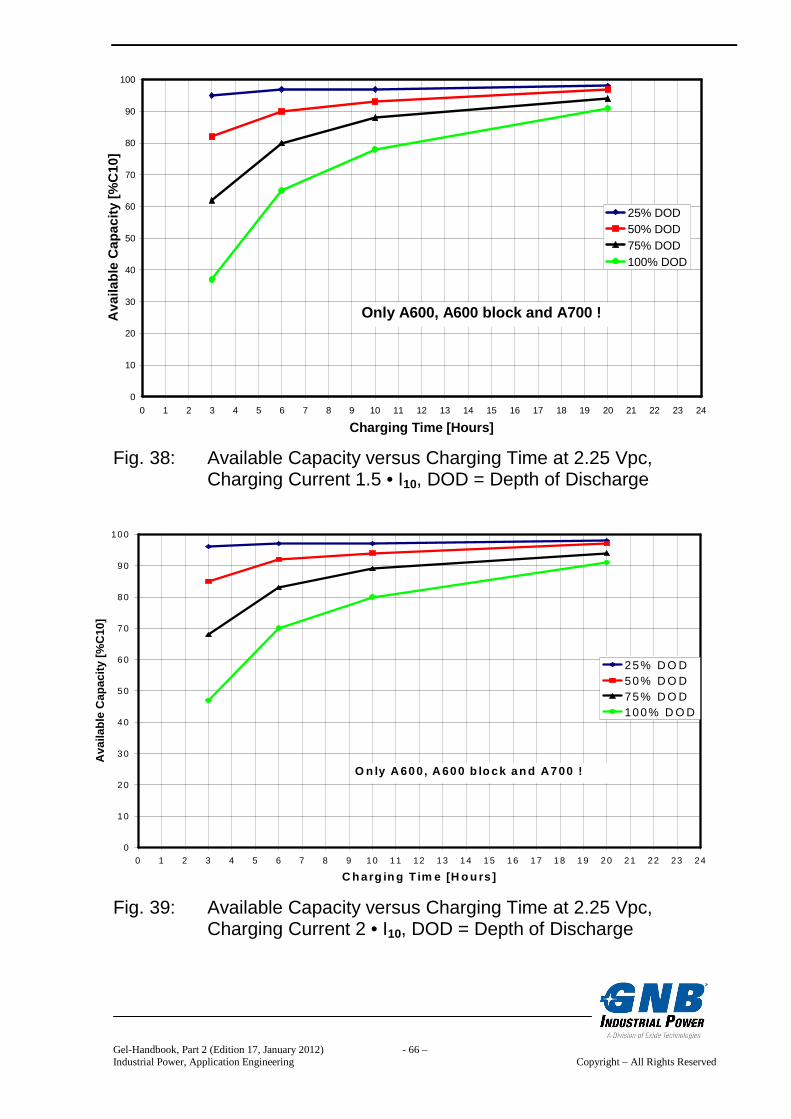
Gel-Handbook, Part 2 (Edition 17, January 2012) - 66 – Industrial Power, Application Engineering Copyright – All Rights Reserved
0
10
20
30
40
50
60
70
80
90
100
0 1 2 3 4 5 6 7 8 9 10 11 12 13 14 15 16 17 18 19 20 21 22 23 24
Charging Time [Hours]
Ava
ilabl
e C
apac
ity [%
C10
]
25% DOD50% DOD75% DOD100% DOD
Only A600, A600 block and A700 !
0
10
20
30
40
50
60
70
80
90
100
0 1 2 3 4 5 6 7 8 9 10 11 12 13 14 15 16 17 18 19 20 21 22 23 24
C h arg in g T im e [H o u rs ]
Ava
ilabl
e C
apac
ity [%
C10
]
25% D O D50% D O D75% D O D100% D O D
O n ly A 600, A 600 b lo ck an d A700 !
Fig. 38: Available Capacity versus Charging Time at 2.25 Vpc, Charging Current 1.5 • I10, DOD = Depth of Discharge Fig. 39: Available Capacity versus Charging Time at 2.25 Vpc, Charging Current 2 • I10, DOD = Depth of Discharge
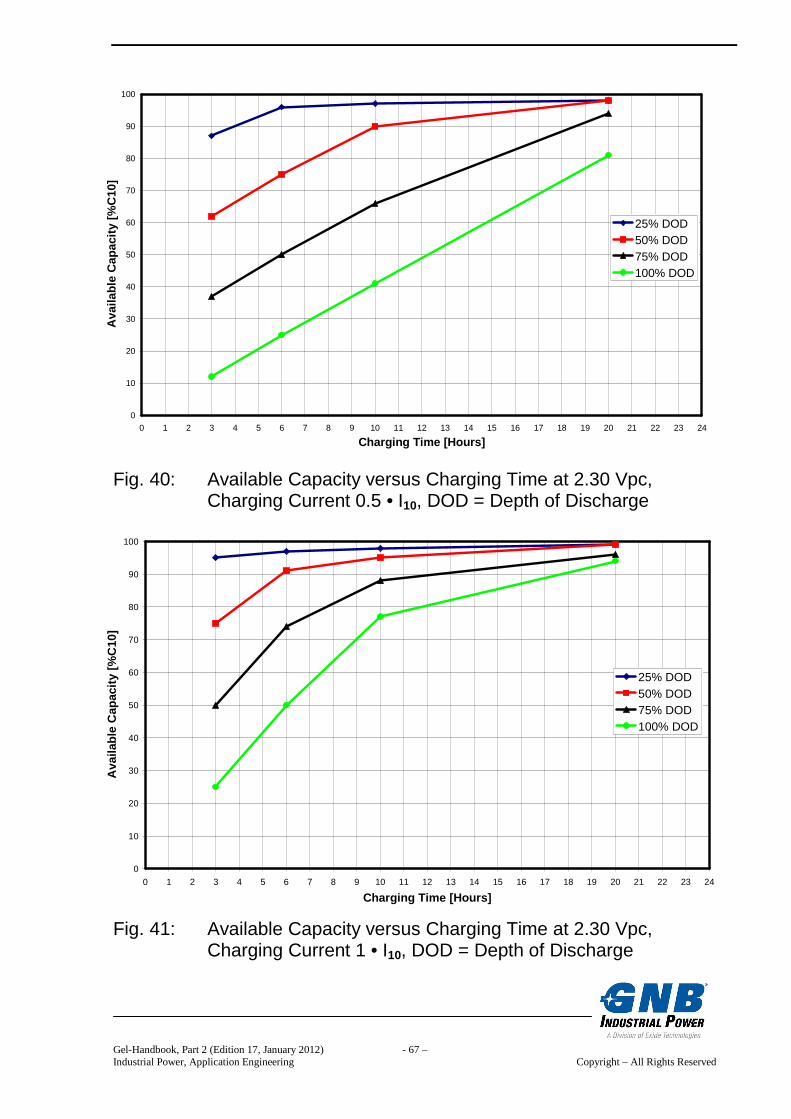
Gel-Handbook, Part 2 (Edition 17, January 2012) - 67 – Industrial Power, Application Engineering Copyright – All Rights Reserved
0
10
20
30
40
50
60
70
80
90
100
0 1 2 3 4 5 6 7 8 9 10 11 12 13 14 15 16 17 18 19 20 21 22 23 24
Charging Time [Hours]
Ava
ilabl
e C
apac
ity [%
C10
]
25% DOD50% DOD75% DOD100% DOD
0
10
20
30
40
50
60
70
80
90
100
0 1 2 3 4 5 6 7 8 9 10 11 12 13 14 15 16 17 18 19 20 21 22 23 24
Charging Time [Hours]
Ava
ilabl
e C
apac
ity [%
C10
]
25% DOD50% DOD75% DOD100% DOD
Fig. 40: Available Capacity versus Charging Time at 2.30 Vpc, Charging Current 0.5 • I10, DOD = Depth of Discharge Fig. 41: Available Capacity versus Charging Time at 2.30 Vpc, Charging Current 1 • I10, DOD = Depth of Discharge
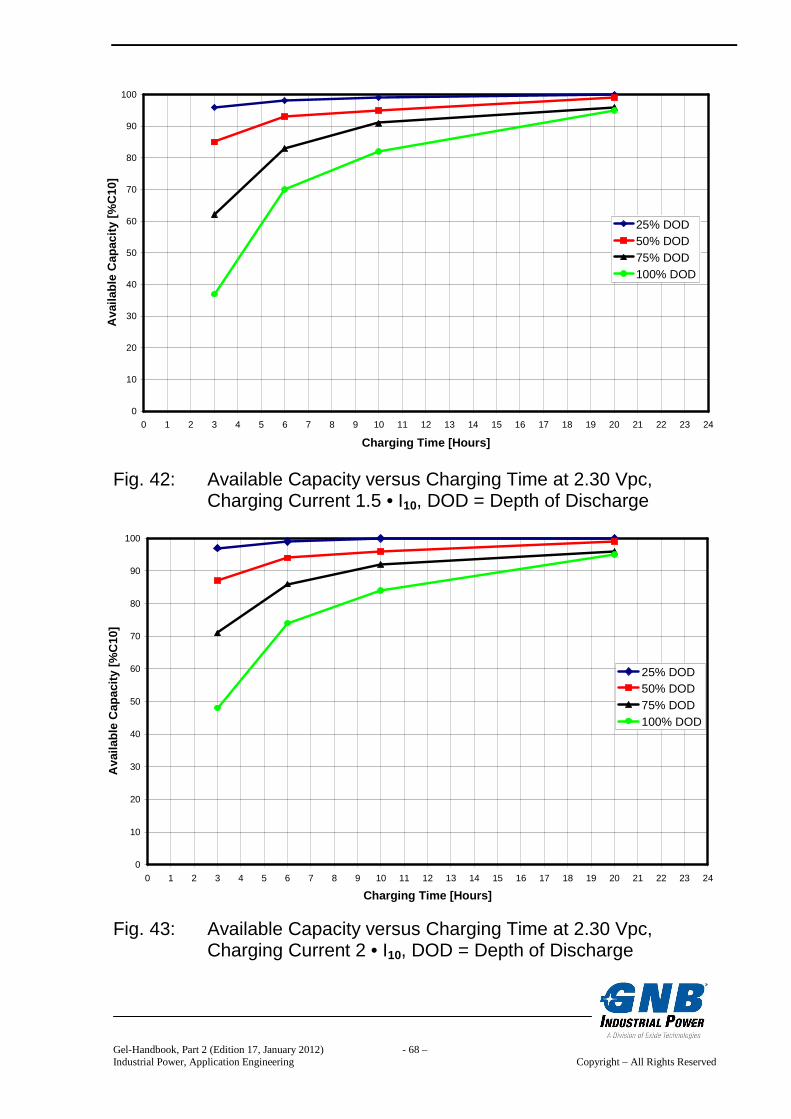
Gel-Handbook, Part 2 (Edition 17, January 2012) - 68 – Industrial Power, Application Engineering Copyright – All Rights Reserved
0
10
20
30
40
50
60
70
80
90
100
0 1 2 3 4 5 6 7 8 9 10 11 12 13 14 15 16 17 18 19 20 21 22 23 24
Charging Time [Hours]
Ava
ilabl
e C
apac
ity [%
C10
]
25% DOD50% DOD75% DOD100% DOD
0
10
20
30
40
50
60
70
80
90
100
0 1 2 3 4 5 6 7 8 9 10 11 12 13 14 15 16 17 18 19 20 21 22 23 24
Charging Time [Hours]
Ava
ilabl
e C
apac
ity [%
C10
]
25% DOD50% DOD75% DOD100% DOD
Fig. 42: Available Capacity versus Charging Time at 2.30 Vpc, Charging Current 1.5 • I10, DOD = Depth of Discharge Fig. 43: Available Capacity versus Charging Time at 2.30 Vpc, Charging Current 2 • I10, DOD = Depth of Discharge
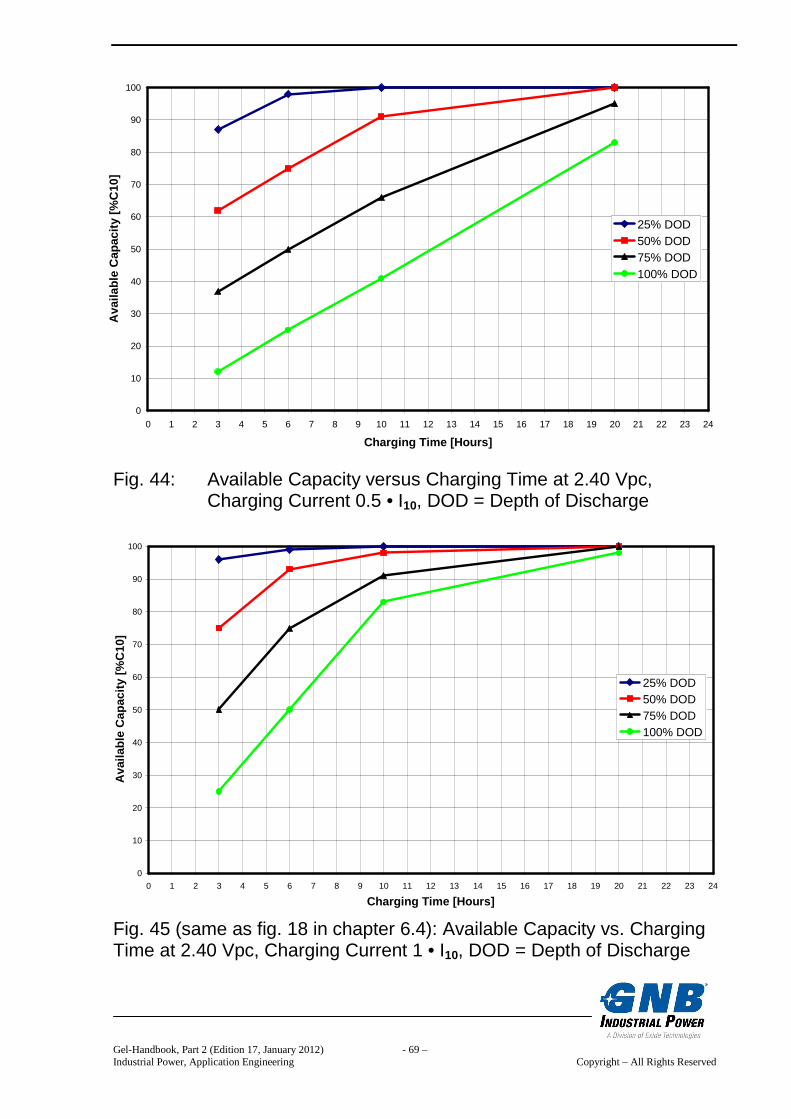
Gel-Handbook, Part 2 (Edition 17, January 2012) - 69 – Industrial Power, Application Engineering Copyright – All Rights Reserved
0
10
20
30
40
50
60
70
80
90
100
0 1 2 3 4 5 6 7 8 9 10 11 12 13 14 15 16 17 18 19 20 21 22 23 24
Charging Time [Hours]
Ava
ilabl
e C
apac
ity [%
C10
]
25% DOD50% DOD75% DOD100% DOD
Fig. 44: Available Capacity versus Charging Time at 2.40 Vpc, Charging Current 0.5 • I10, DOD = Depth of Discharge Fig. 45 (same as fig. 18 in chapter 6.4): Available Capacity vs. Charging Time at 2.40 Vpc, Charging Current 1 • I10, DOD = Depth of Discharge
0
10
20
30
40
50
60
70
80
90
100
0 1 2 3 4 5 6 7 8 9 10 11 12 13 14 15 16 17 18 19 20 21 22 23 24
Charging Time [Hours]
Ava
ilabl
e C
apac
ity [%
C10
]
25% DOD50% DOD75% DOD100% DOD
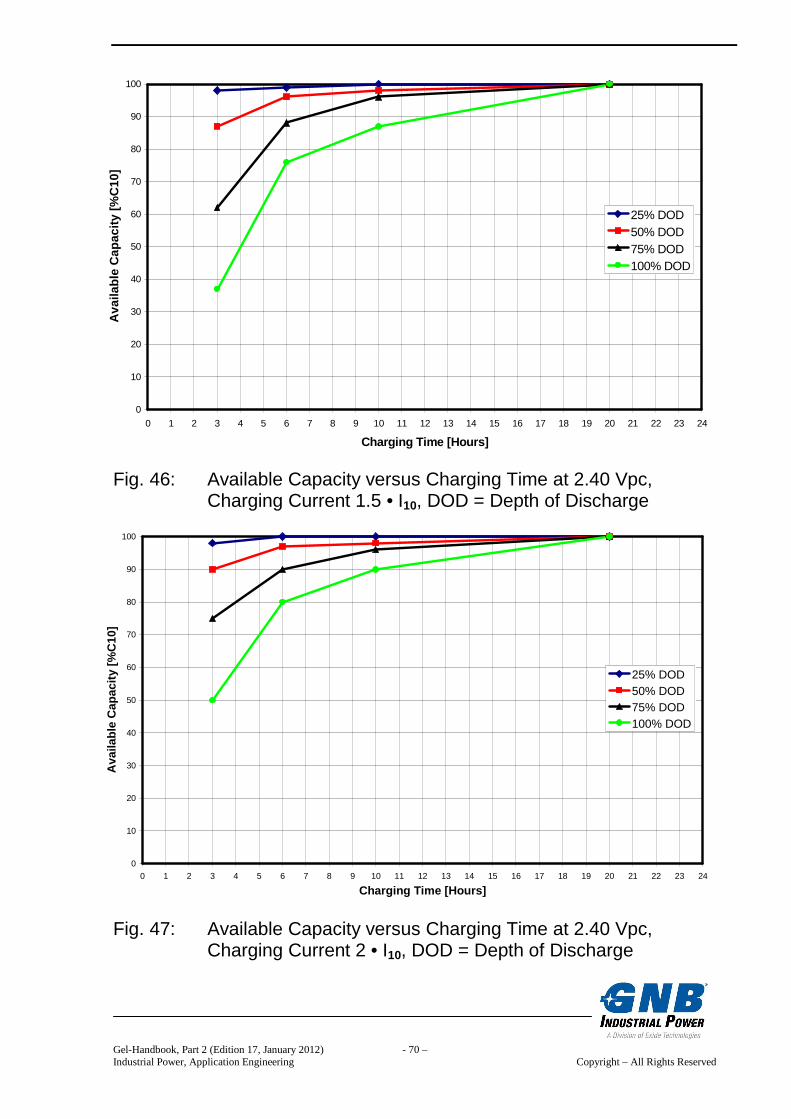
Gel-Handbook, Part 2 (Edition 17, January 2012) - 70 – Industrial Power, Application Engineering Copyright – All Rights Reserved
0
10
20
30
40
50
60
70
80
90
100
0 1 2 3 4 5 6 7 8 9 10 11 12 13 14 15 16 17 18 19 20 21 22 23 24
Charging Time [Hours]
Ava
ilabl
e C
apac
ity [%
C10
]
25% DOD50% DOD75% DOD100% DOD
0
10
20
30
40
50
60
70
80
90
100
0 1 2 3 4 5 6 7 8 9 10 11 12 13 14 15 16 17 18 19 20 21 22 23 24
Charging Time [Hours]
Ava
ilabl
e C
apac
ity [%
C10
]
25% DOD50% DOD75% DOD100% DOD
Fig. 46: Available Capacity versus Charging Time at 2.40 Vpc, Charging Current 1.5 • I10, DOD = Depth of Discharge Fig. 47: Available Capacity versus Charging Time at 2.40 Vpc, Charging Current 2 • I10, DOD = Depth of Discharge
Gel-Handbook, Part 2 (Edition 17, January 2012) - 71 – Industrial Power, Application Engineering Copyright – All Rights Reserved
Important Notice: The manufacturer of batteries “GNB Industrial Power” does not take over responsibility for any loyalties resulting from this paper or resulting from changes in the mentioned standards, neither for any different national standards which may exist and has to be followed by the installer, planner or architect. Exide Technologies GmbH Im Thiergarten 63654 Büdingen-Germany Tel.: + 49 (0) 60 42 - 81544 Fax: + 49 (0) 60 42 - 81398 www.gnb.com State: January 2012