Embed Size (px)
DESCRIPTION
Handbook of Indian Fisheries Statistics 2008
Citation preview
HA
ND
BO
OK
ON
FIS
HE
RIE
SS
TA
TIS
TIC
S2008
HA
ND
BO
OK
ON
FIS
HE
RIE
SS
TA
TIS
TIC
S2008
Government of IndiaMinistry of AgricultureDepartment of Animal Husbandry, Dairying and FisheriesKrishi Bhavan, New Delhi
7 5 21 1 6 0
1 7 5 6
2 4 4 2
3 8 3 6
5 6 5 6
7 1 2 7
0
1000
2000
3000
4000
5000
6000
7000
8000
1950-
51
1960-
61
1970-
71
1980-
81
1990-
91
2000-
01
2007-
08
Y e ar('00
0to
nnes
)
HAND BOOK ON
FISHERIES STATISTICS
2008
HAND BOOK ON
FISHERIES STATISTICS
2008
HANDBOOK ON
FISHERIES STATISTICS
2008
December, 2009
DEPARTMENT OF ANIMAL HUSBANDRY, DAIRYING AND FISHERIES
MINISTRY OF AGRICULTUREGOVERNMENT OF INDIA, NEW DELHI
PREFACE
I am delighted to present the Tenth edition of the 'Handbook on Fisheries Statistics'.
I trust this publication will serve as a useful reference book on various aspects of the
fisheries sector.
2. India has played an important role in global fisheries as the third largest
producer of fish in the world and the second largest producer from aquaculture.
With a contribution of 2.9 million tonnes from marine and 4.2 million tonnes
from the Inland sector, fisheries continue to make a significant contribution to
nutritional security. The contribution of the fisheries sector, at an annual growth
rate of 4.5%, is estimated at 1.07% to the GDP. The sector is a major foreign
exchange earner, with revenue reaching Rs.7,620 crores in 2007-08; this
accounts for about 14% of agricultural exports.
3. Apart from a long coastline India has a vast area covered by estuaries,
backwaters, lagoons, etc. We also have huge inland fisheries resources with
enormous scope for increasing fish production through freshwater
aquaculture.
4. The Government is developing a road map for enhancing food fish production
to 10 million metric tonnes by 2012. In addition to meeting the domestic
demand, we intend to enhance our export earning potential in terms of value
added products and ornamental fish trade.
5. I take this opportunity to express my thanks to the States, Union Territories and
other agencies, who have provided information for this handbook. I also
appreciate the work of the officers of Fishery Survey of India and the Fisheries
Division of this Department, especially the Fisheries Statistics Unit. I hope this
publication would be useful to Planners, Policy makers, Researchers and
other stakeholders.
New Delhi
26th November, 2009
(Rudhra Gangadharan)
Secretary
Department of Animal Husbandry,
Dairying & Fisheries
Ministry of Agriculture
Government of India
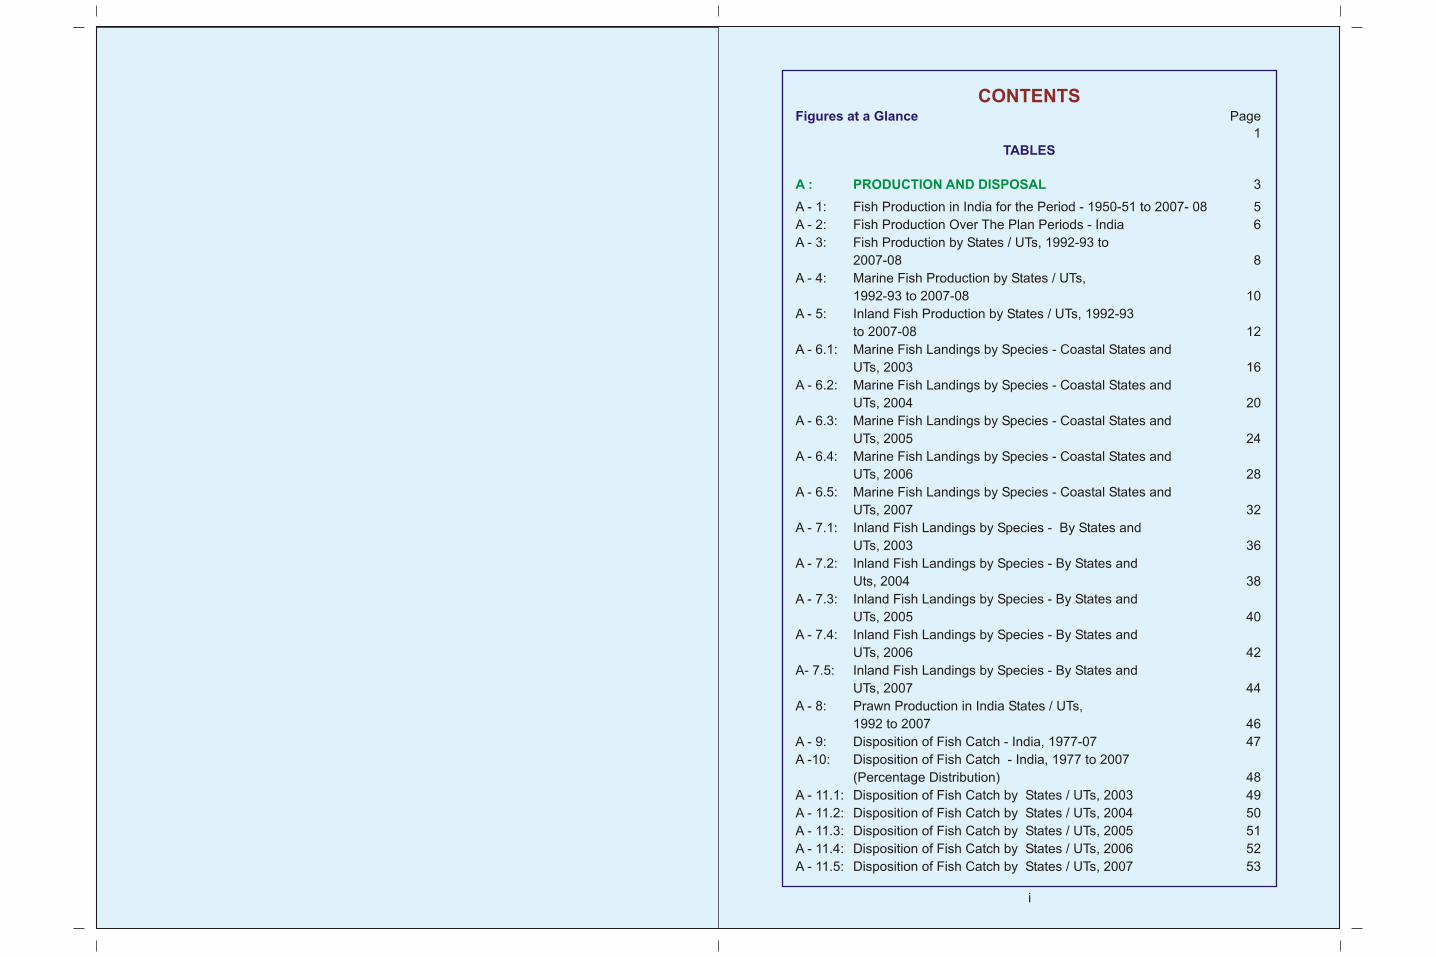
CONTENTSFigures at a Glance
TABLES
Page
1
3
A - 1: Fish Production in India for the Period - 1950-51 to 2007- 08 5
A - 2: Fish Production Over The Plan Periods - India 6
A - 3: Fish Production by States / UTs, 1992-93 to
2007-08 8
A - 4: Marine Fish Production by States / UTs,
1992-93 to 2007-08 10
A - 5: Inland Fish Production by States / UTs, 1992-93
to 2007-08 12
A - 6.1: Marine Fish Landings by Species - Coastal States and
UTs, 2003 16
A - 6.2: Marine Fish Landings by Species - Coastal States and
UTs, 2004 20
A - 6.3: Marine Fish Landings by Species - Coastal States and
UTs, 2005 24
A - 6.4: Marine Fish Landings by Species - Coastal States and
UTs, 2006 28
A - 6.5: Marine Fish Landings by Species - Coastal States and
UTs, 2007 32
A - 7.1: Inland Fish Landings by Species - By States and
UTs, 2003 36
A - 7.2: Inland Fish Landings by Species - By States and
Uts, 2004 38
A - 7.3: Inland Fish Landings by Species - By States and
UTs, 2005 40
A - 7.4: Inland Fish Landings by Species - By States and
UTs, 2006 42
A- 7.5: Inland Fish Landings by Species - By States and
UTs, 2007 44
A - 8: Prawn Production in India States / UTs,
1992 to 2007 46
A - 9: Disposition of Fish Catch - India, 1977-07 47
A -10: Disposition of Fish Catch - India, 1977 to 2007
(Percentage Distribution) 48
A - 11.1: Disposition of Fish Catch by States / UTs, 2003 49
A - 11.2: Disposition of Fish Catch by States / UTs, 2004 50
A - 11.3: Disposition of Fish Catch by States / UTs, 2005 51
A - 11.4: Disposition of Fish Catch by States / UTs, 2006 52
A - 11.5: Disposition of Fish Catch by States / UTs, 2007 53
A : PRODUCTION AND DISPOSAL
i
iiiii
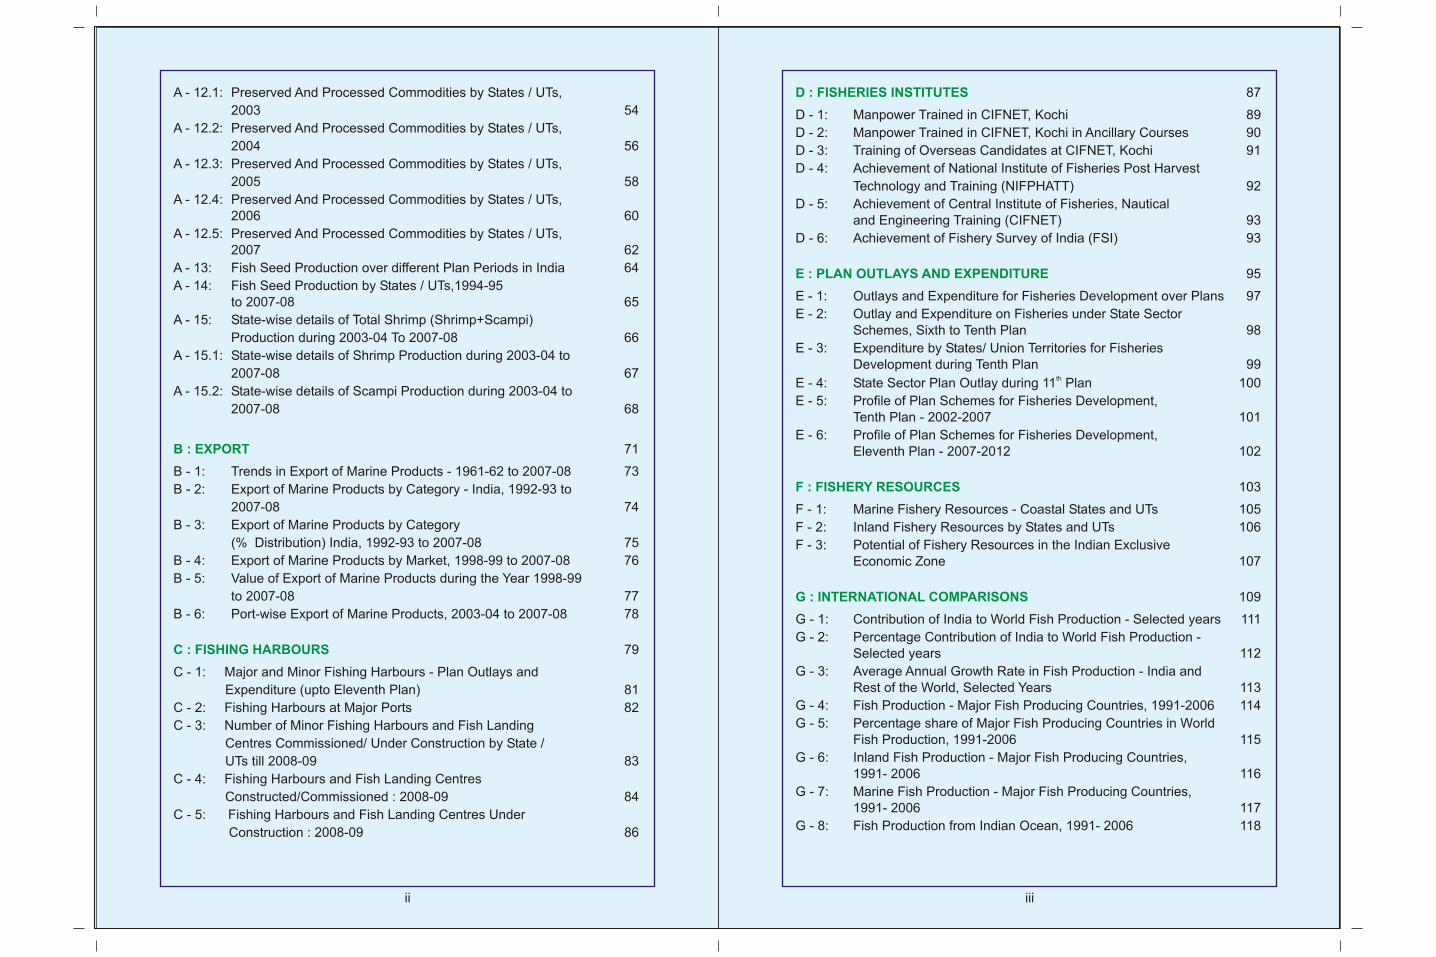
A - 12.1: Preserved And Processed Commodities by States / UTs,
2003 54
A - 12.2: Preserved And Processed Commodities by States / UTs,
2004 56
A - 12.3: Preserved And Processed Commodities by States / UTs,
2005 58
A - 12.4: Preserved And Processed Commodities by States / UTs,2006 60
A - 12.5: Preserved And Processed Commodities by States / UTs,2007 62
A - 13: Fish Seed Production over different Plan Periods in India 64
A - 14: Fish Seed Production by States / UTs,1994-95 to 2007-08 65
A - 15: State-wise details of Total Shrimp (Shrimp+Scampi)
Production during 2003-04 To 2007-08 66
A - 15.1: State-wise details of Shrimp Production during 2003-04 to
2007-08 67
A - 15.2: State-wise details of Scampi Production during 2003-04 to
2007-08 68
71
B - 1: Trends in Export of Marine Products - 1961-62 to 2007-08 73
B - 2: Export of Marine Products by Category - India, 1992-93 to
2007-08 74
B - 3: Export of Marine Products by Category
(% Distribution) India, 1992-93 to 2007-08 75
B - 4: Export of Marine Products by Market, 1998-99 to 2007-08 76
B - 5: Value of Export of Marine Products during the Year 1998-99
to 2007-08 77
B - 6: Port-wise Export of Marine Products, 2003-04 to 2007-08 78
79
C - 1: Major and Minor Fishing Harbours - Plan Outlays and
Expenditure (upto Eleventh Plan) 81
C - 2: Fishing Harbours at Major Ports 82
C - 3: Number of Minor Fishing Harbours and Fish Landing
Centres Commissioned/ Under Construction by State /
UTs till 2008-09 83
C - 4: Fishing Harbours and Fish Landing Centres
Constructed/Commissioned : 2008-09 84
C - 5: Fishing Harbours and Fish Landing Centres Under
Construction : 2008-09 86
B : EXPORT
C : FISHING HARBOURS
D : FISHERIES INSTITUTES
E : PLAN OUTLAYS AND EXPENDITURE
F : FISHERY RESOURCES
G : INTERNATIONAL COMPARISONS
87
D - 1: Manpower Trained in CIFNET, Kochi 89
D - 2: Manpower Trained in CIFNET, Kochi in Ancillary Courses 90
D - 3: Training of Overseas Candidates at CIFNET, Kochi 91
D - 4: Achievement of National Institute of Fisheries Post Harvest
Technology and Training (NIFPHATT) 92
D - 5: Achievement of Central Institute of Fisheries, Nauticaland Engineering Training (CIFNET) 93
D - 6: Achievement of Fishery Survey of India (FSI) 93
95
E - 1: Outlays and Expenditure for Fisheries Development over Plans 97
E - 2: Outlay and Expenditure on Fisheries under State SectorSchemes, Sixth to Tenth Plan 98
E - 3: Expenditure by States/ Union Territories for FisheriesDevelopment during Tenth Plan 99
thE - 4: State Sector Plan Outlay during 11 Plan 100
E - 5: Profile of Plan Schemes for Fisheries Development,Tenth Plan - 2002-2007 101
E - 6: Profile of Plan Schemes for Fisheries Development,Eleventh Plan - 2007-2012 102
103
F - 1: Marine Fishery Resources - Coastal States and UTs 105
F - 2: Inland Fishery Resources by States and UTs 106
F - 3: Potential of Fishery Resources in the Indian ExclusiveEconomic Zone 107
109
G - 1: Contribution of India to World Fish Production - Selected years 111
G - 2: Percentage Contribution of India to World Fish Production -Selected years 112
G - 3: Average Annual Growth Rate in Fish Production - India and Rest of the World, Selected Years 113
G - 4: Fish Production - Major Fish Producing Countries, 1991-2006 114
G - 5: Percentage share of Major Fish Producing Countries in World Fish Production, 1991-2006 115
G - 6: Inland Fish Production - Major Fish Producing Countries, 1991- 2006 116
G - 7: Marine Fish Production - Major Fish Producing Countries, 1991- 2006 117
G - 8: Fish Production from Indian Ocean, 1991- 2006 118
HANDBOOK ON FISHERIES STATISTICS 2008
1
iv
H : PRICE INDICES
I : LIST OF DISTRICTS STATE / UT WISE
J : MISCELLANEOUS
K : FISHERIES DEVELOPMENT
CHARTS
119
H - 1: Indices of Wholesale Prices 121
H- 2: Wholesale Prices of Rohu at Delhi 122
H - 3: Wholesale Prices of Fish at Tamil Nadu 123
H - 4: Wholesale Prices of Rohu and Bhetki at West Bengal 124
H - 5: Retail Prices of Rohu at Kolkata 125
H - 6: Retail Prices of Rohu at Delhi 125
127
I - 1: Code List of States and Districts 129
145
J- 1: Fishermen Population by States/ UTs, 2003 147
J - 2: Fishing Crafts - Coastal States and UTs 148
J - 3: Brackishwater Area and Production - Coastal States/ UTs2007-08 149
J - 4: Monthly Per Capita Consumption of Fish (Quantity) by State/UT 150
J - 5: Contribution of Fisheries Sector to Gross Domestic Product (Current Prices) 152
J - 6: Achievement of Fish Farmers Development Agencies till 2007-08 153
J - 7: Structure of Fisheries Cooperatives National Level Cooperative Federation 154
J - 8: List of Sanctioned Fish Farmers Development Agencies (FFDAs) 155
J - 9: Details of Brackishwater Fish Farmers Development
Agencies (BFDAs) 157
J-10.1: Central Assistance Extended for Setting up of Fish thMarketing Units during 10 Plan 158
J-10.2: Projects approved for setting up Post Harvest and Fish
Marketing Infrastructure under Central Sector Scheme thduring the 11 Plan (till 2008-09). 158
J - 11: Number and Location of Fishermen Awareness Centres and
Training Centres 159
161
NOTE ON THE FISHERIES SECTOR IN THE COUNTRY 163
1. Fish Production during recent years 7
2. Fish Production by source - selected years 14
3. Major fish producing States, 2007-08 15
4. Marine Fish Production, 2007-08 69
5. Total disposition of fish catch - 2007 70
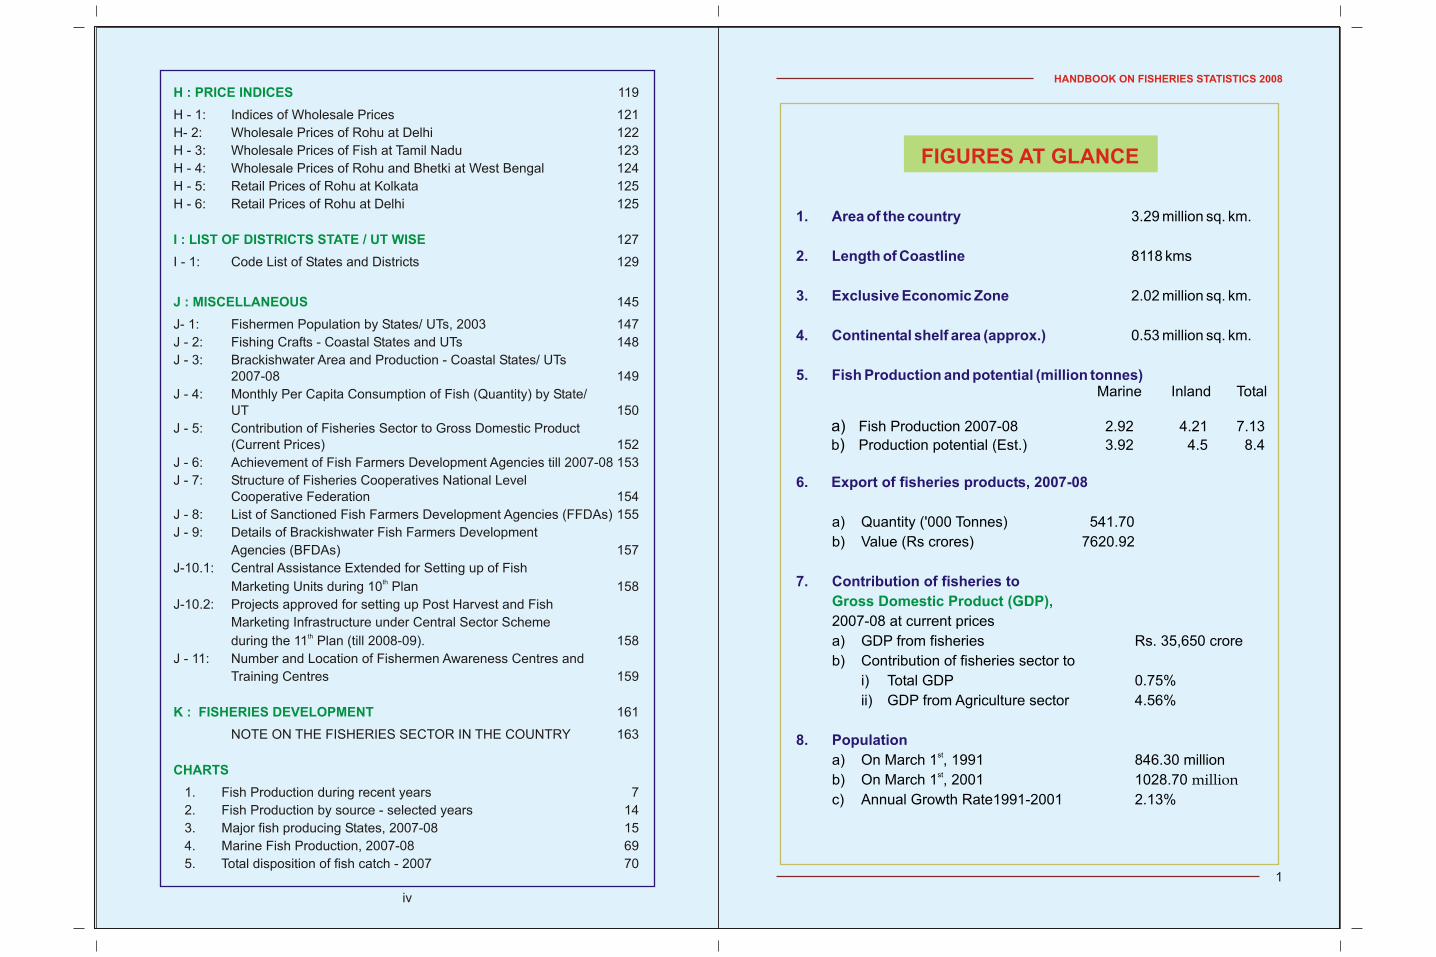
FIGURES AT GLANCE
1. Area of the country
2. Length of Coastline
3. Exclusive Economic Zone
4. Continental shelf area (approx.)
5. Fish Production and potential (million tonnes)
6. Export of fisheries products, 2007-08
7. Contribution of fisheries to
8. Population
3.29 million sq. km.
8118 kms
2.02 million sq. km.
0.53 million sq. km.
Marine Inland Total
a) Fish Production 2007-08 2.92 4.21 7.13
b) Production potential (Est.) 3.92 4.5 8.4
a) Quantity ('000 Tonnes) 541.70
b) Value (Rs crores) 7620.92
2007-08 at current prices
a) GDP from fisheries Rs. 35,650 crore
b) Contribution of fisheries sector to
i) Total GDP 0.75%
ii) GDP from Agriculture sector 4.56%
sta) On March 1 , 1991 846.30 million
stb) On March 1 , 2001 1028.70 million
c) Annual Growth Rate1991-2001 2.13%
Gross Domestic Product (GDP),
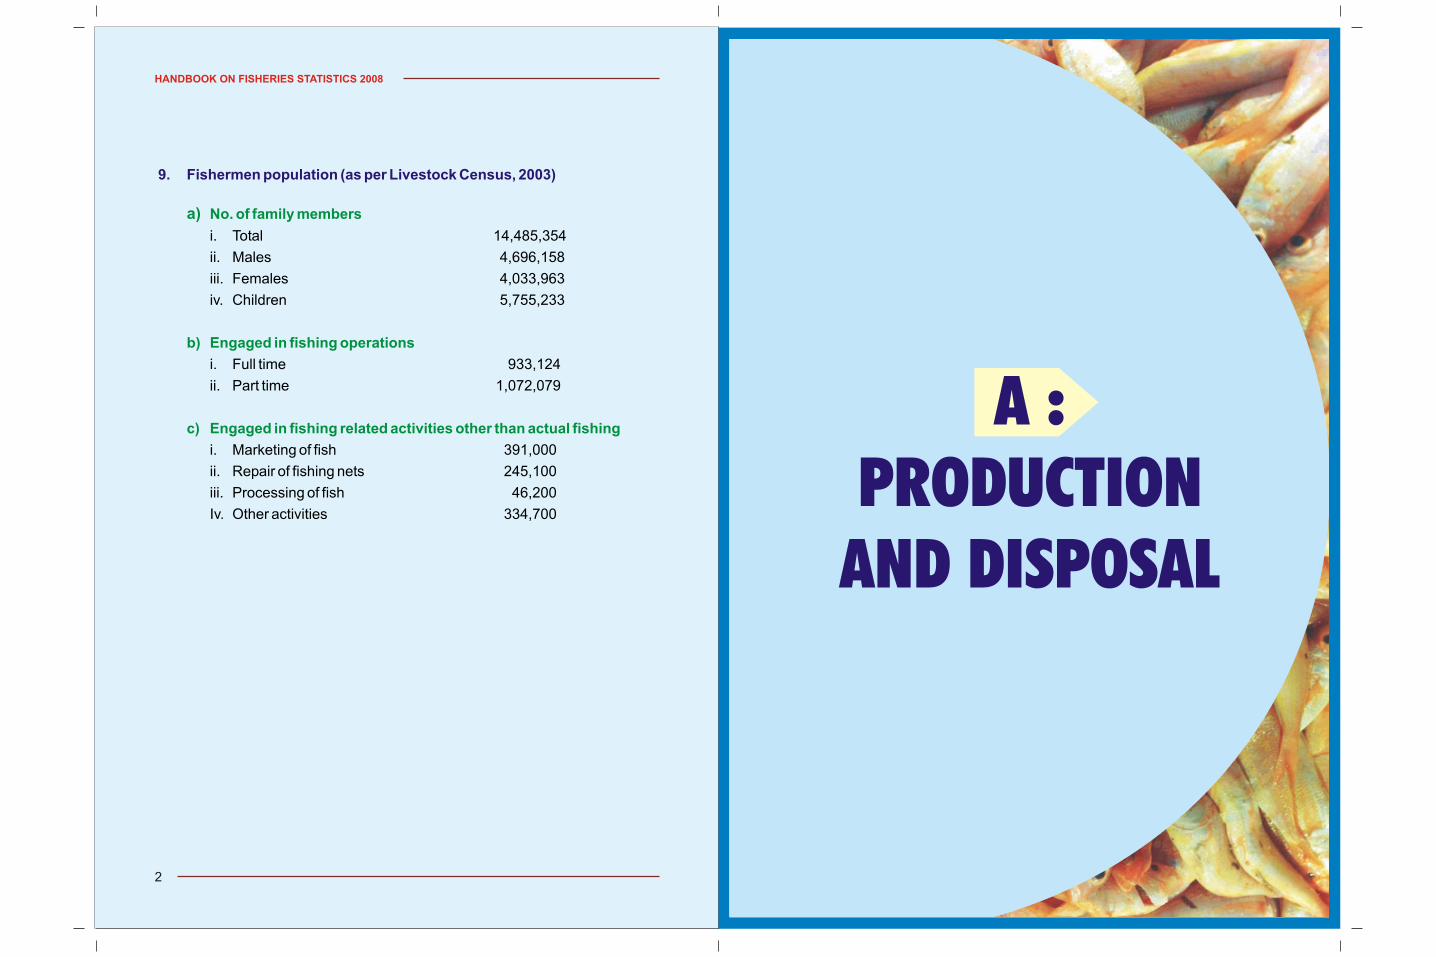
A :PRODUCTION
AND DISPOSAL
2
HANDBOOK ON FISHERIES STATISTICS 2008
9. Fishermen population (as per Livestock Census, 2003)
i. Total 14,485,354
ii. Males 4,696,158
iii. Females 4,033,963
iv. Children 5,755,233
i. Full time 933,124
ii. Part time 1,072,079
i. Marketing of fish 391,000
ii. Repair of fishing nets 245,100
iii. Processing of fish 46,200
Iv. Other activities 334,700
a) No. of family members
b) Engaged in fishing operations
c) Engaged in fishing related activities other than actual fishing
HANDBOOK ON FISHERIES STATISTICS 2008
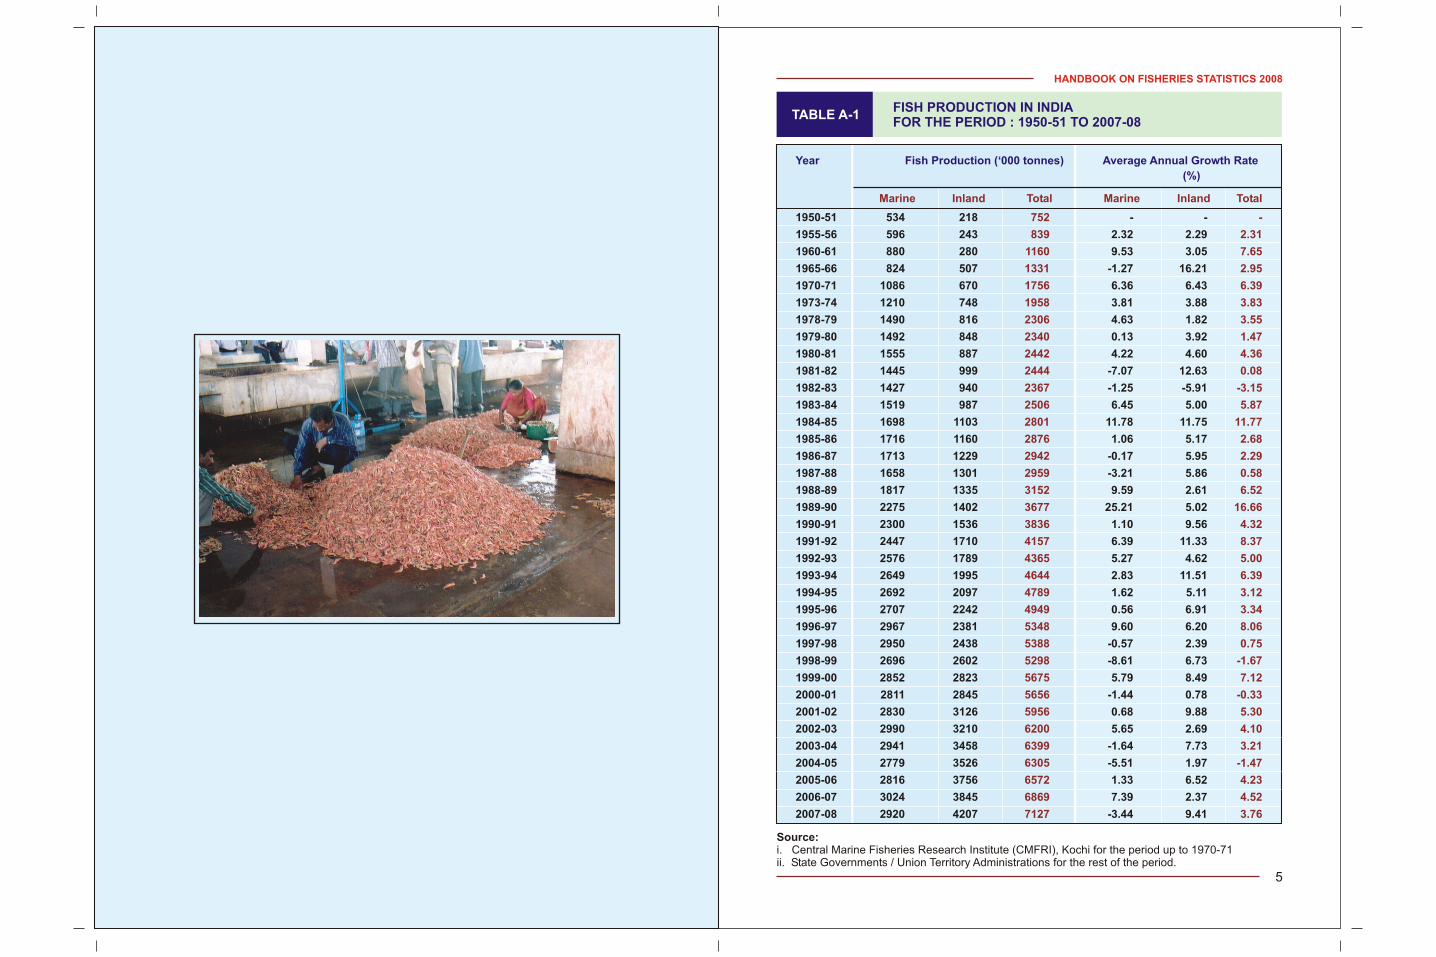
5
TABLE A-1FISH PRODUCTION IN INDIAFOR THE PERIOD : 1950-51 TO 2007-08
Year Fish Production (‘000 tonnes) Average Annual Growth Rate
(%)
1950-51 534 218 - -
1955-56 596 243 2.32 2.29
1960-61 880 280 9.53 3.05
1965-66 824 507 -1.27 16.21
1970-71 1086 670 6.36 6.43
1973-74 1210 748 3.81 3.88
1978-79 1490 816 4.63 1.82
1979-80 1492 848 0.13 3.92
1980-81 1555 887 4.22 4.60
1981-82 1445 999 -7.07 12.63
1982-83 1427 940 -1.25 -5.91
1983-84 1519 987 6.45 5.00
1984-85 1698 1103 11.78 11.75
1985-86 1716 1160 1.06 5.17
1986-87 1713 1229 -0.17 5.95
1987-88 1658 1301 -3.21 5.86
1988-89 1817 1335 9.59 2.61
1989-90 2275 1402 25.21 5.02
1990-91 2300 1536 1.10 9.56
1991-92 2447 1710 6.39 11.33
1992-93 2576 1789 5.27 4.62
1993-94 2649 1995 2.83 11.51
1994-95 2692 2097 1.62 5.11
1995-96 2707 2242 0.56 6.91
1996-97 2967 2381 9.60 6.20
1997-98 2950 2438 -0.57 2.39
1998-99 2696 2602 -8.61 6.73
1999-00 2852 2823 5.79 8.49
2000-01 2811 2845 -1.44 0.78
2001-02 2830 3126 0.68 9.88
2002-03 2990 3210 5.65 2.69
2003-04 2941 3458 -1.64 7.73
2004-05 2779 3526 -5.51 1.97
2005-06 2816 3756 1.33 6.52
2006-07 3024 3845 7.39 2.37
2007-08 2920 4207 -3.44 9.41
Marine Inland Total Marine Inland Total
752 -
839 2.31
1160 7.65
1331 2.95
1756 6.39
1958 3.83
2306 3.55
2340 1.47
2442 4.36
2444 0.08
2367 -3.15
2506 5.87
2801 11.77
2876 2.68
2942 2.29
2959 0.58
3152 6.52
3677 16.66
3836 4.32
4157 8.37
4365 5.00
4644 6.39
4789 3.12
4949 3.34
5348 8.06
5388 0.75
5298 -1.67
5675 7.12
5656 -0.33
5956 5.30
6200 4.10
6399 3.21
6305 -1.47
6572 4.23
6869 4.52
7127 3.76
Source:i. Central Marine Fisheries Research Institute (CMFRI), Kochi for the period up to 1970-71ii. State Governments / Union Territory Administrations for the rest of the period.
HANDBOOK ON FISHERIES STATISTICS 2008
6
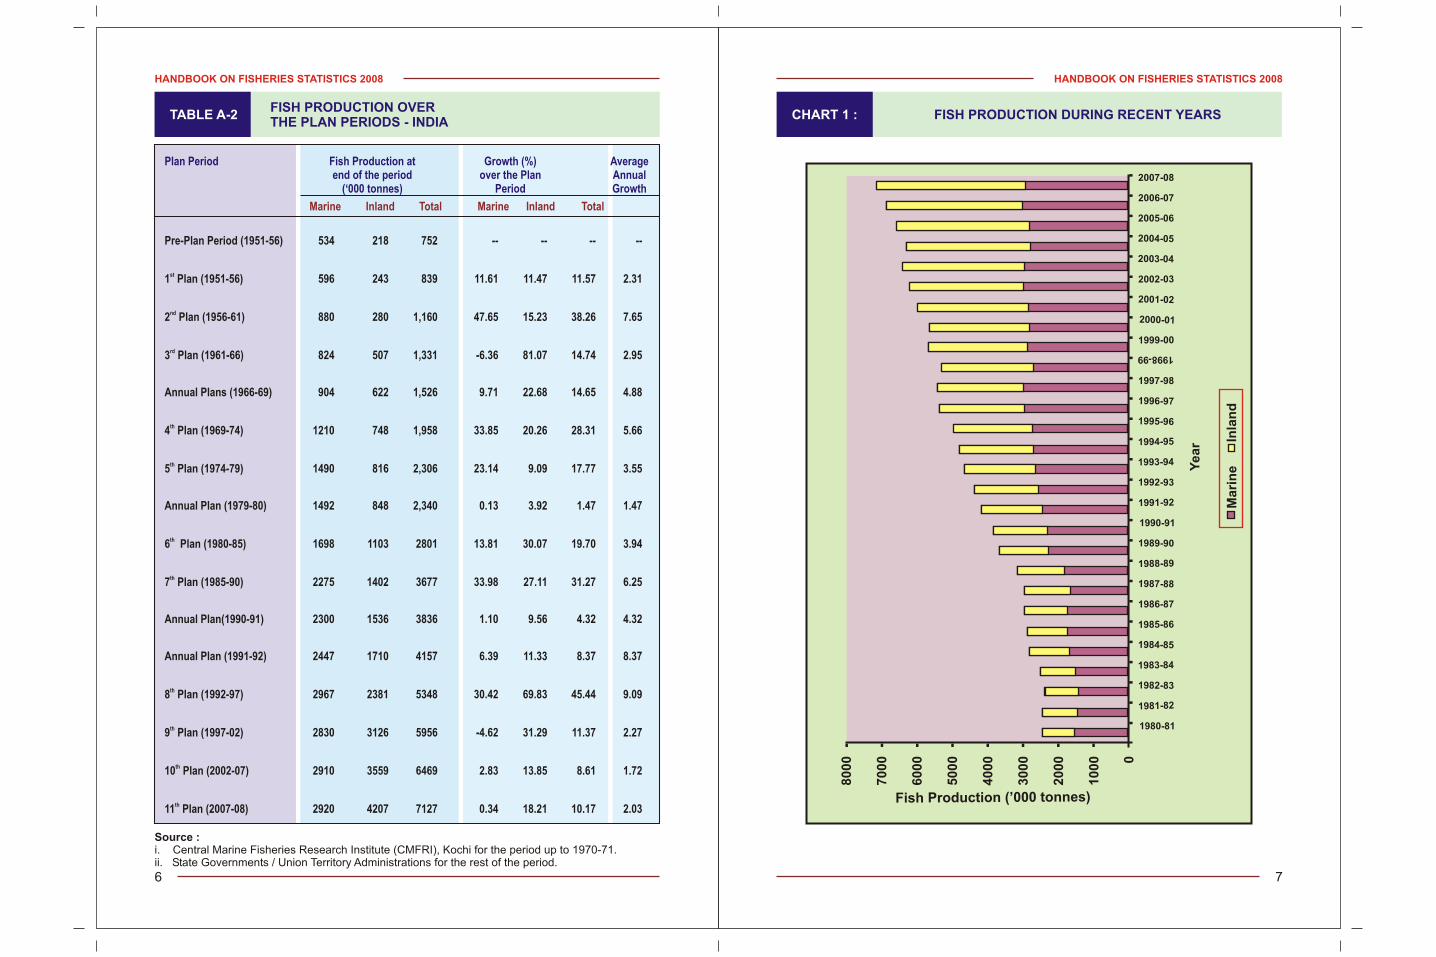
TABLE A-2FISH PRODUCTION OVERTHE PLAN PERIODS - INDIA
Plan Period Fish Production at Growth (%) Average end of the period over the Plan Annual
(‘000 tonnes) Period Growth
Marine Inland Total Marine Inland Total
Pre-Plan Period (1951-56) 534 218 752 -- -- -- --
st1 Plan (1951-56) 596 243 839 11.61 11.47 11.57 2.31
nd2 Plan (1956-61) 880 280 1,160 47.65 15.23 38.26 7.65
rd3 Plan (1961-66) 824 507 1,331 -6.36 81.07 14.74 2.95
Annual Plans (1966-69) 904 622 1,526 9.71 22.68 14.65 4.88
th4 Plan (1969-74) 1210 748 1,958 33.85 20.26 28.31 5.66
th5 Plan (1974-79) 1490 816 2,306 23.14 9.09 17.77 3.55
Annual Plan (1979-80) 1492 848 2,340 0.13 3.92 1.47 1.47
th6 Plan (1980-85) 1698 1103 2801 13.81 30.07 19.70 3.94
th7 Plan (1985-90) 2275 1402 3677 33.98 27.11 31.27 6.25
Annual Plan(1990-91) 2300 1536 3836 1.10 9.56 4.32 4.32
Annual Plan (1991-92) 2447 1710 4157 6.39 11.33 8.37 8.37
th8 Plan (1992-97) 2967 2381 5348 30.42 69.83 45.44 9.09
th9 Plan (1997-02) 2830 3126 5956 -4.62 31.29 11.37 2.27
th10 Plan (2002-07) 2910 3559 6469 2.83 13.85 8.61 1.72
th11 Plan (2007-08) 2920 4207 7127 0.34 18.21 10.17 2.03
Source :i. Central Marine Fisheries Research Institute (CMFRI), Kochi for the period up to 1970-71.ii. State Governments / Union Territory Administrations for the rest of the period.
HANDBOOK ON FISHERIES STATISTICS 2008
7
CHART 1 : FISH PRODUCTION DURING RECENT YEARS
Ye
ar
Ma
rin
eIn
lan
d
80
00
70
00
60
00
50
00
40
00
30
00
20
00
10
00 0
980 811 -
1 -8981 2
98 -831 2
983-841
1984-85
19 -85 86
19 6-878
1987-88
1988-89
819 9-90
1990-91
1199 -92
1992-93
993-941
1994-95
961995-
1 6-999 7
19 7 89 -9
1998-99
1999-00
0-01200
2001-02
20 -02 03
2003 04-
2 -004 05
2005-06
2006 0- 7
0 020 7- 8
F s r ’0i h P oduction ( 00 tonnes)
HANDBOOK ON FISHERIES STATISTICS 2008
9
HANDBOOK ON FISHERIES STATISTICS 2008
8
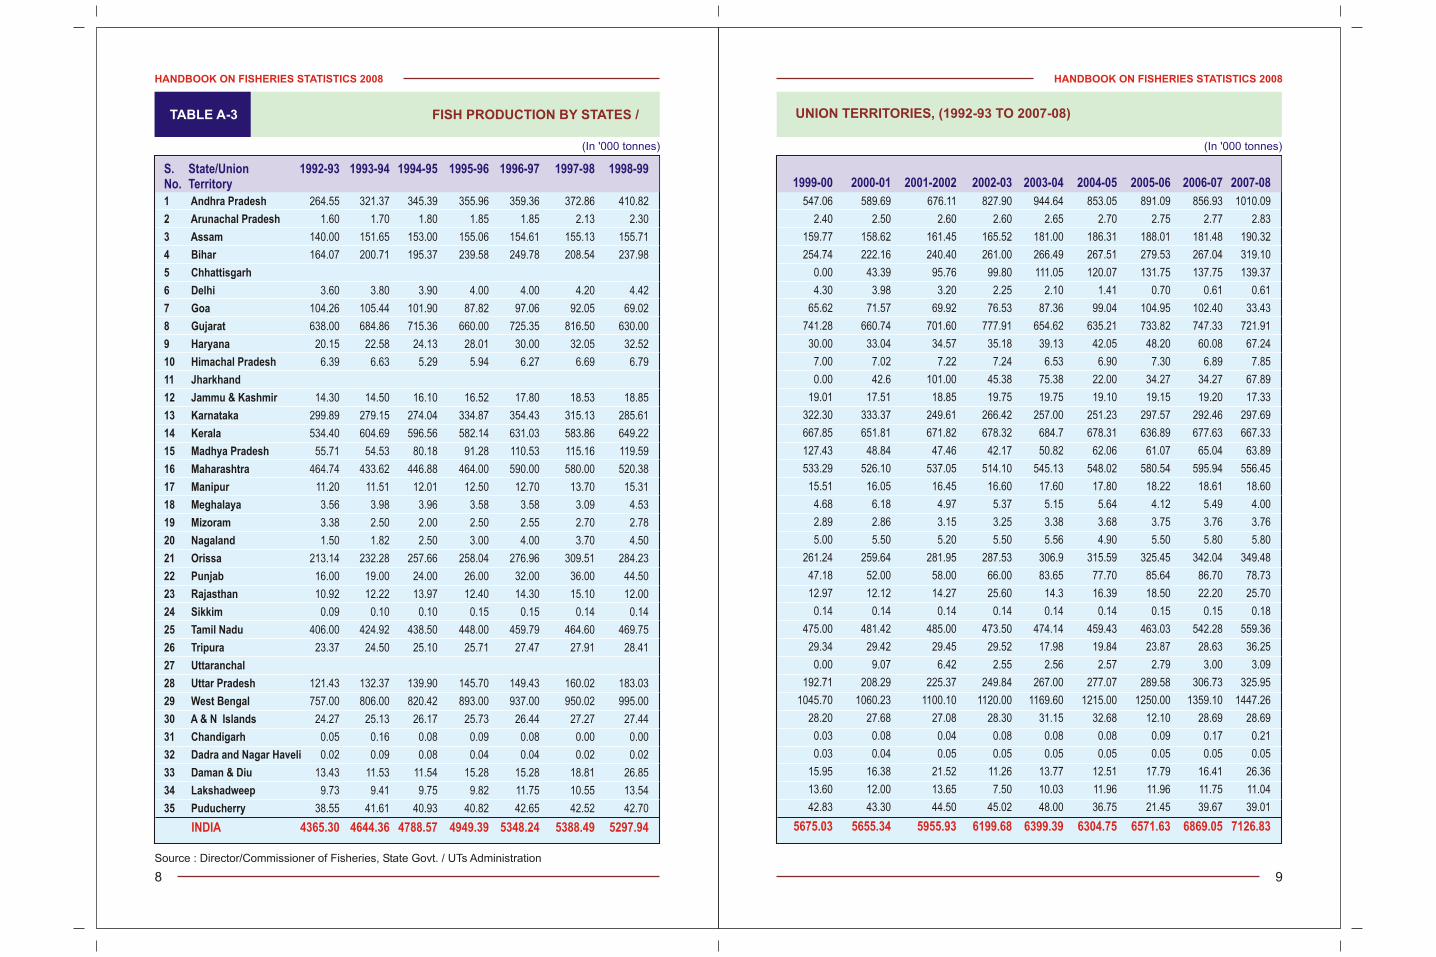
TABLE A-3 UNION TERRITORIES, (1992-93 TO 2007-08)FISH PRODUCTION BY STATES /
Source : Director/Commissioner of Fisheries, State Govt. / UTs Administration
(In '000 tonnes) (In '000 tonnes)
S. State/Union 1992-93 1993-94 1994-95 1995-96 1996-97 1997-98 1998-99No. Territory
1 Andhra Pradesh 264.55 321.37 345.39 355.96 359.36 372.86 410.82
2 Arunachal Pradesh 1.60 1.70 1.80 1.85 1.85 2.13 2.30
3 Assam 140.00 151.65 153.00 155.06 154.61 155.13 155.71
4 Bihar 164.07 200.71 195.37 239.58 249.78 208.54 237.98
5 Chhattisgarh
6 Delhi 3.60 3.80 3.90 4.00 4.00 4.20 4.42
7 Goa 104.26 105.44 101.90 87.82 97.06 92.05 69.02
8 Gujarat 638.00 684.86 715.36 660.00 725.35 816.50 630.00
9 Haryana 20.15 22.58 24.13 28.01 30.00 32.05 32.52
10 Himachal Pradesh 6.39 6.63 5.29 5.94 6.27 6.69 6.79
11 Jharkhand
12 Jammu & Kashmir 14.30 14.50 16.10 16.52 17.80 18.53 18.85
13 Karnataka 299.89 279.15 274.04 334.87 354.43 315.13 285.61
14 Kerala 534.40 604.69 596.56 582.14 631.03 583.86 649.22
15 Madhya Pradesh 55.71 54.53 80.18 91.28 110.53 115.16 119.59
16 Maharashtra 464.74 433.62 446.88 464.00 590.00 580.00 520.38
17 Manipur 11.20 11.51 12.01 12.50 12.70 13.70 15.31
18 Meghalaya 3.56 3.98 3.96 3.58 3.58 3.09 4.53
19 Mizoram 3.38 2.50 2.00 2.50 2.55 2.70 2.78
20 Nagaland 1.50 1.82 2.50 3.00 4.00 3.70 4.50
21 Orissa 213.14 232.28 257.66 258.04 276.96 309.51 284.23
22 Punjab 16.00 19.00 24.00 26.00 32.00 36.00 44.50
23 Rajasthan 10.92 12.22 13.97 12.40 14.30 15.10 12.00
24 Sikkim 0.09 0.10 0.10 0.15 0.15 0.14 0.14
25 Tamil Nadu 406.00 424.92 438.50 448.00 459.79 464.60 469.75
26 Tripura 23.37 24.50 25.10 25.71 27.47 27.91 28.41
27 Uttaranchal
28 Uttar Pradesh 121.43 132.37 139.90 145.70 149.43 160.02 183.03
29 West Bengal 757.00 806.00 820.42 893.00 937.00 950.02 995.00
30 A & N Islands 24.27 25.13 26.17 25.73 26.44 27.27 27.44
31 Chandigarh 0.05 0.16 0.08 0.09 0.08 0.00 0.00
32 Dadra and Nagar Haveli 0.02 0.09 0.08 0.04 0.04 0.02 0.02
33 Daman & Diu 13.43 11.53 11.54 15.28 15.28 18.81 26.85
34 Lakshadweep 9.73 9.41 9.75 9.82 11.75 10.55 13.54
35 Puducherry 38.55 41.61 40.93 40.82 42.65 42.52 42.70
INDIA 4365.30 4644.36 4788.57 4949.39 5348.24 5388.49 5297.94
1999-00 2000-01 2001-2002 2002-03 2003-04 2004-05 2005-06 2006-07 2007-08
547.06 589.69 676.11 827.90 944.64 853.05 891.09 856.93 1010.09
2.40 2.50 2.60 2.60 2.65 2.70 2.75 2.77 2.83
159.77 158.62 161.45 165.52 181.00 186.31 188.01 181.48 190.32
254.74 222.16 240.40 261.00 266.49 267.51 279.53 267.04 319.10
0.00 43.39 95.76 99.80 111.05 120.07 131.75 137.75 139.37
4.30 3.98 3.20 2.25 2.10 1.41 0.70 0.61 0.61
65.62 71.57 69.92 76.53 87.36 99.04 104.95 102.40 33.43
741.28 660.74 701.60 777.91 654.62 635.21 733.82 747.33 721.91
30.00 33.04 34.57 35.18 39.13 42.05 48.20 60.08 67.24
7.00 7.02 7.22 7.24 6.53 6.90 7.30 6.89 7.85
0.00 42.6 101.00 45.38 75.38 22.00 34.27 34.27 67.89
19.01 17.51 18.85 19.75 19.75 19.10 19.15 19.20 17.33
322.30 333.37 249.61 266.42 257.00 251.23 297.57 292.46 297.69
667.85 651.81 671.82 678.32 684.7 678.31 636.89 677.63 667.33
127.43 48.84 47.46 42.17 50.82 62.06 61.07 65.04 63.89
533.29 526.10 537.05 514.10 545.13 548.02 580.54 595.94 556.45
15.51 16.05 16.45 16.60 17.60 17.80 18.22 18.61 18.60
4.68 6.18 4.97 5.37 5.15 5.64 4.12 5.49 4.00
2.89 2.86 3.15 3.25 3.38 3.68 3.75 3.76 3.76
5.00 5.50 5.20 5.50 5.56 4.90 5.50 5.80 5.80
261.24 259.64 281.95 287.53 306.9 315.59 325.45 342.04 349.48
47.18 52.00 58.00 66.00 83.65 77.70 85.64 86.70 78.73
12.97 12.12 14.27 25.60 14.3 16.39 18.50 22.20 25.70
0.14 0.14 0.14 0.14 0.14 0.14 0.15 0.15 0.18
475.00 481.42 485.00 473.50 474.14 459.43 463.03 542.28 559.36
29.34 29.42 29.45 29.52 17.98 19.84 23.87 28.63 36.25
0.00 9.07 6.42 2.55 2.56 2.57 2.79 3.00 3.09
192.71 208.29 225.37 249.84 267.00 277.07 289.58 306.73 325.95
1045.70 1060.23 1100.10 1120.00 1169.60 1215.00 1250.00 1359.10 1447.26
28.20 27.68 27.08 28.30 31.15 32.68 12.10 28.69 28.69
0.03 0.08 0.04 0.08 0.08 0.08 0.09 0.17 0.21
0.03 0.04 0.05 0.05 0.05 0.05 0.05 0.05 0.05
15.95 16.38 21.52 11.26 13.77 12.51 17.79 16.41 26.36
13.60 12.00 13.65 7.50 10.03 11.96 11.96 11.75 11.04
42.83 43.30 44.50 45.02 48.00 36.75 21.45 39.67 39.01
5675.03 5655.34 5955.93 6199.68 6399.39 6304.75 6571.63 6869.05 7126.83
HANDBOOK ON FISHERIES STATISTICS 2008
11
HANDBOOK ON FISHERIES STATISTICS 2008
10
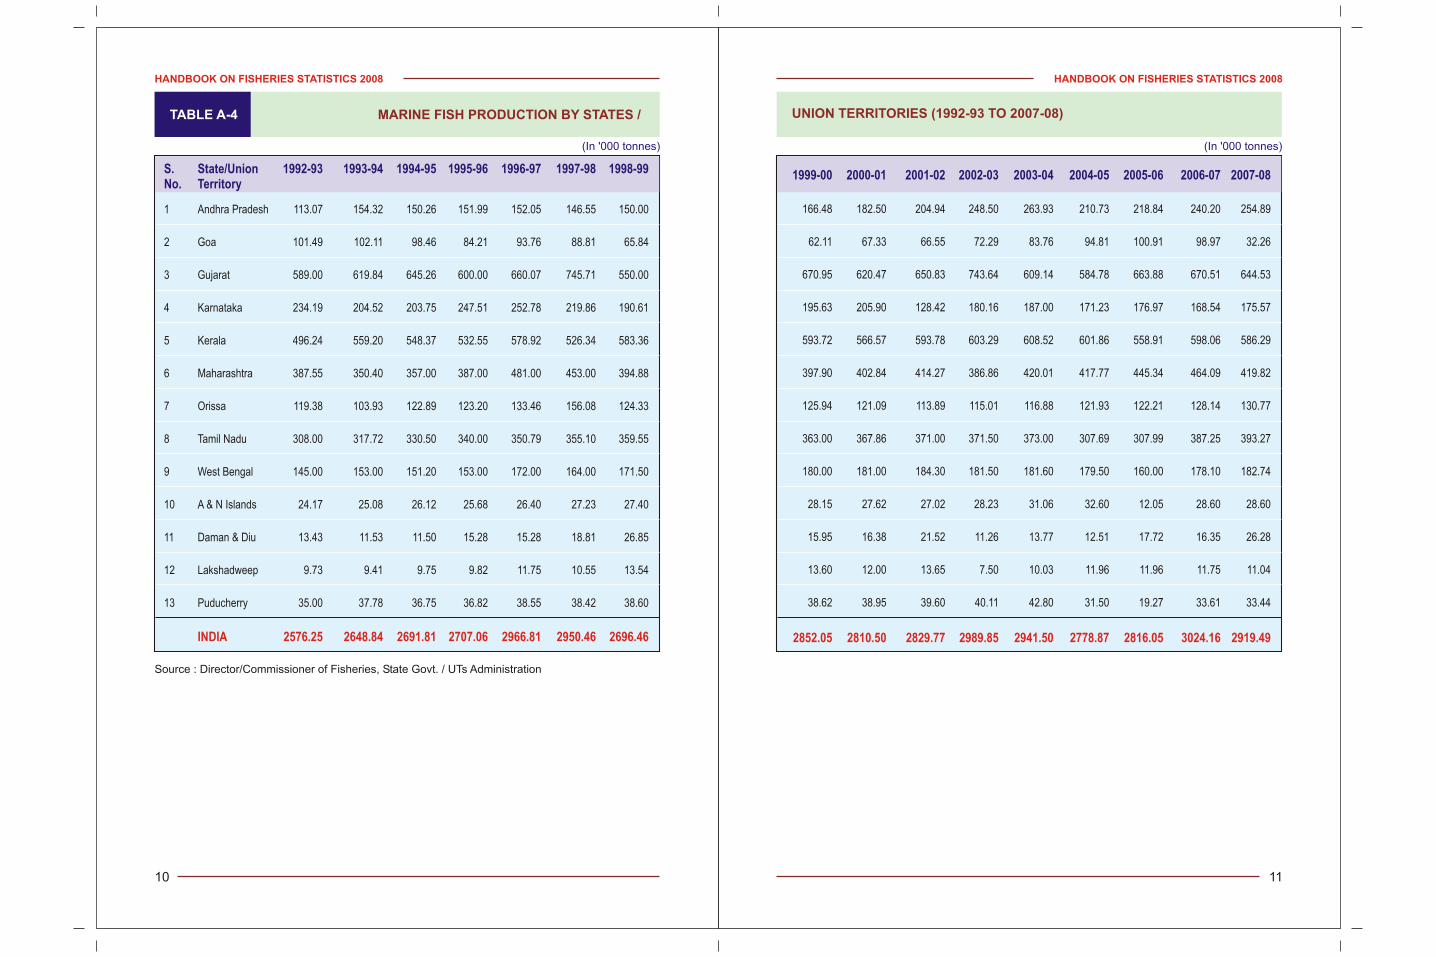
TABLE A-4 UNION TERRITORIES (1992-93 TO 2007-08)MARINE FISH PRODUCTION BY STATES /
Source : Director/Commissioner of Fisheries, State Govt. / UTs Administration
(In '000 tonnes) (In '000 tonnes)
S. State/Union 1992-93 1993-94 1994-95 1995-96 1996-97 1997-98 1998-99No. Territory
1 Andhra Pradesh 113.07 154.32 150.26 151.99 152.05 146.55 150.00
2 Goa 101.49 102.11 98.46 84.21 93.76 88.81 65.84
3 Gujarat 589.00 619.84 645.26 600.00 660.07 745.71 550.00
4 Karnataka 234.19 204.52 203.75 247.51 252.78 219.86 190.61
5 Kerala 496.24 559.20 548.37 532.55 578.92 526.34 583.36
6 Maharashtra 387.55 350.40 357.00 387.00 481.00 453.00 394.88
7 Orissa 119.38 103.93 122.89 123.20 133.46 156.08 124.33
8 Tamil Nadu 308.00 317.72 330.50 340.00 350.79 355.10 359.55
9 West Bengal 145.00 153.00 151.20 153.00 172.00 164.00 171.50
10 A & N Islands 24.17 25.08 26.12 25.68 26.40 27.23 27.40
11 Daman & Diu 13.43 11.53 11.50 15.28 15.28 18.81 26.85
12 Lakshadweep 9.73 9.41 9.75 9.82 11.75 10.55 13.54
13 Puducherry 35.00 37.78 36.75 36.82 38.55 38.42 38.60
INDIA 2576.25 2648.84 2691.81 2707.06 2966.81 2950.46 2696.46
1999-00 2000-01 2001-02 2002-03 2003-04 2004-05 2005-06 2006-07 2007-08
166.48 182.50 204.94 248.50 263.93 210.73 218.84 240.20 254.89
62.11 67.33 66.55 72.29 83.76 94.81 100.91 98.97 32.26
670.95 620.47 650.83 743.64 609.14 584.78 663.88 670.51 644.53
195.63 205.90 128.42 180.16 187.00 171.23 176.97 168.54 175.57
593.72 566.57 593.78 603.29 608.52 601.86 558.91 598.06 586.29
397.90 402.84 414.27 386.86 420.01 417.77 445.34 464.09 419.82
125.94 121.09 113.89 115.01 116.88 121.93 122.21 128.14 130.77
363.00 367.86 371.00 371.50 373.00 307.69 307.99 387.25 393.27
180.00 181.00 184.30 181.50 181.60 179.50 160.00 178.10 182.74
28.15 27.62 27.02 28.23 31.06 32.60 12.05 28.60 28.60
15.95 16.38 21.52 11.26 13.77 12.51 17.72 16.35 26.28
13.60 12.00 13.65 7.50 10.03 11.96 11.96 11.75 11.04
38.62 38.95 39.60 40.11 42.80 31.50 19.27 33.61 33.44
2852.05 2810.50 2829.77 2989.85 2941.50 2778.87 2816.05 3024.16 2919.49
HANDBOOK ON FISHERIES STATISTICS 2008
13
HANDBOOK ON FISHERIES STATISTICS 2008
12
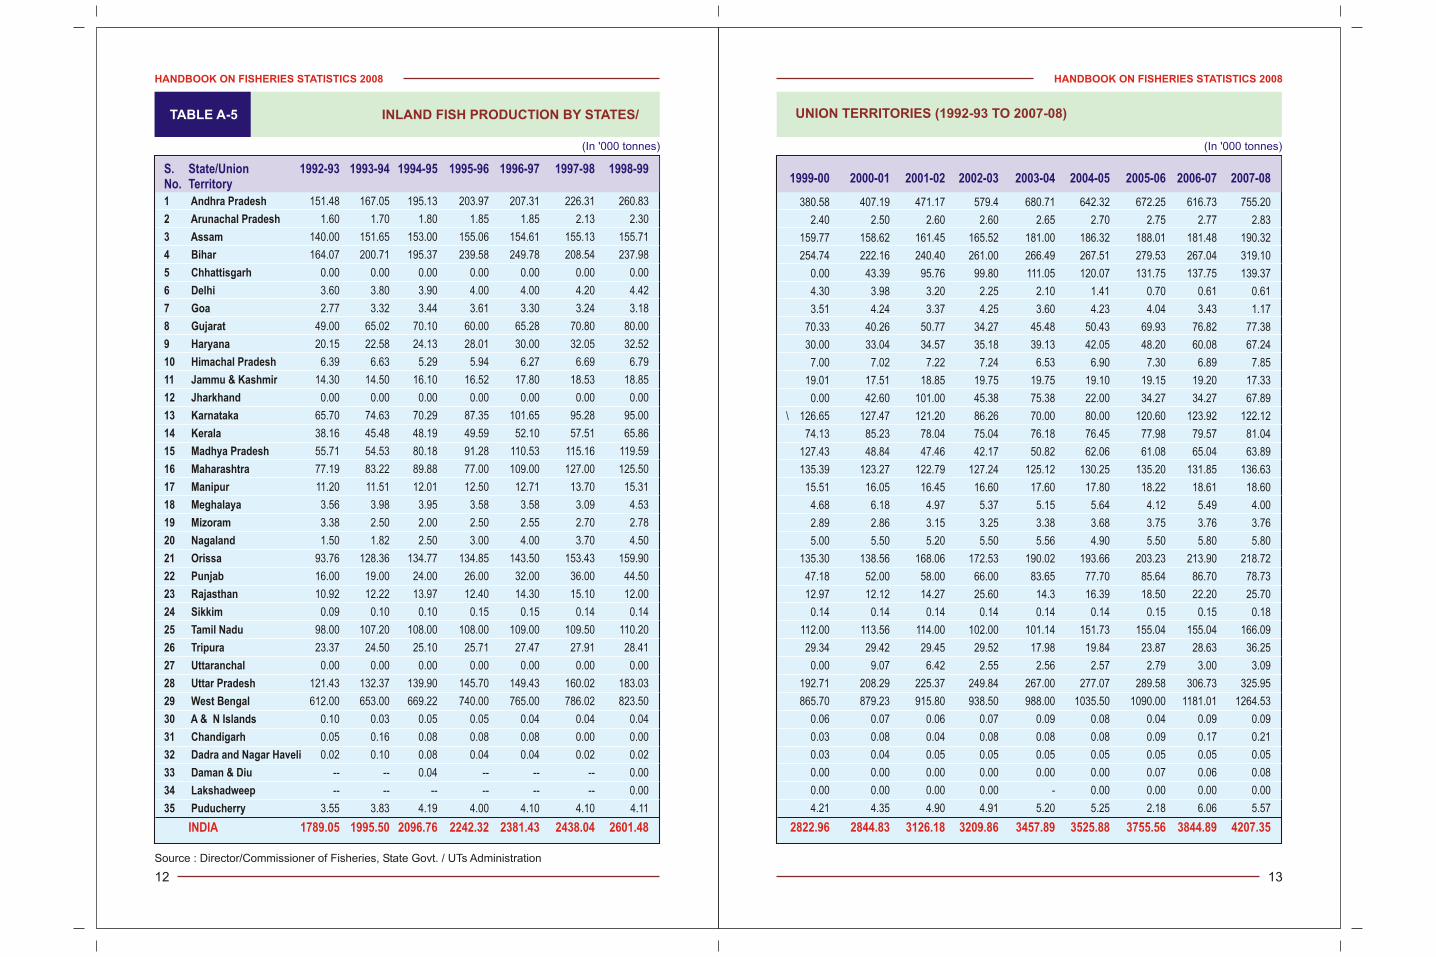
TABLE A-5 UNION TERRITORIES (1992-93 TO 2007-08)INLAND FISH PRODUCTION BY STATES/
Source : Director/Commissioner of Fisheries, State Govt. / UTs Administration
(In '000 tonnes) (In '000 tonnes)
S. State/Union 1992-93 1993-94 1994-95 1995-96 1996-97 1997-98 1998-99No. Territory
1 Andhra Pradesh 151.48 167.05 195.13 203.97 207.31 226.31 260.83
2 Arunachal Pradesh 1.60 1.70 1.80 1.85 1.85 2.13 2.30
3 Assam 140.00 151.65 153.00 155.06 154.61 155.13 155.71
4 Bihar 164.07 200.71 195.37 239.58 249.78 208.54 237.98
5 Chhattisgarh 0.00 0.00 0.00 0.00 0.00 0.00 0.00
6 Delhi 3.60 3.80 3.90 4.00 4.00 4.20 4.42
7 Goa 2.77 3.32 3.44 3.61 3.30 3.24 3.18
8 Gujarat 49.00 65.02 70.10 60.00 65.28 70.80 80.00
9 Haryana 20.15 22.58 24.13 28.01 30.00 32.05 32.52
10 Himachal Pradesh 6.39 6.63 5.29 5.94 6.27 6.69 6.79
11 Jammu & Kashmir 14.30 14.50 16.10 16.52 17.80 18.53 18.85
12 Jharkhand 0.00 0.00 0.00 0.00 0.00 0.00 0.00
13 Karnataka 65.70 74.63 70.29 87.35 101.65 95.28 95.00
14 Kerala 38.16 45.48 48.19 49.59 52.10 57.51 65.86
15 Madhya Pradesh 55.71 54.53 80.18 91.28 110.53 115.16 119.59
16 Maharashtra 77.19 83.22 89.88 77.00 109.00 127.00 125.50
17 Manipur 11.20 11.51 12.01 12.50 12.71 13.70 15.31
18 Meghalaya 3.56 3.98 3.95 3.58 3.58 3.09 4.53
19 Mizoram 3.38 2.50 2.00 2.50 2.55 2.70 2.78
20 Nagaland 1.50 1.82 2.50 3.00 4.00 3.70 4.50
21 Orissa 93.76 128.36 134.77 134.85 143.50 153.43 159.90
22 Punjab 16.00 19.00 24.00 26.00 32.00 36.00 44.50
23 Rajasthan 10.92 12.22 13.97 12.40 14.30 15.10 12.00
24 Sikkim 0.09 0.10 0.10 0.15 0.15 0.14 0.14
25 Tamil Nadu 98.00 107.20 108.00 108.00 109.00 109.50 110.20
26 Tripura 23.37 24.50 25.10 25.71 27.47 27.91 28.41
27 Uttaranchal 0.00 0.00 0.00 0.00 0.00 0.00 0.00
28 Uttar Pradesh 121.43 132.37 139.90 145.70 149.43 160.02 183.03
29 West Bengal 612.00 653.00 669.22 740.00 765.00 786.02 823.50
30 A & N Islands 0.10 0.03 0.05 0.05 0.04 0.04 0.04
31 Chandigarh 0.05 0.16 0.08 0.08 0.08 0.00 0.00
32 Dadra and Nagar Haveli 0.02 0.10 0.08 0.04 0.04 0.02 0.02
33 Daman & Diu -- -- 0.04 -- -- -- 0.00
34 Lakshadweep -- -- -- -- -- -- 0.00
35 Puducherry 3.55 3.83 4.19 4.00 4.10 4.10 4.11
INDIA 1789.05 1995.50 2096.76 2242.32 2381.43 2438.04 2601.48
1999-00 2000-01 2001-02 2002-03 2003-04 2004-05 2005-06 2006-07 2007-08
380.58 407.19 471.17 579.4 680.71 642.32 672.25 616.73 755.20
2.40 2.50 2.60 2.60 2.65 2.70 2.75 2.77 2.83
159.77 158.62 161.45 165.52 181.00 186.32 188.01 181.48 190.32
254.74 222.16 240.40 261.00 266.49 267.51 279.53 267.04 319.10
0.00 43.39 95.76 99.80 111.05 120.07 131.75 137.75 139.37
4.30 3.98 3.20 2.25 2.10 1.41 0.70 0.61 0.61
3.51 4.24 3.37 4.25 3.60 4.23 4.04 3.43 1.17
70.33 40.26 50.77 34.27 45.48 50.43 69.93 76.82 77.38
30.00 33.04 34.57 35.18 39.13 42.05 48.20 60.08 67.24
7.00 7.02 7.22 7.24 6.53 6.90 7.30 6.89 7.85
19.01 17.51 18.85 19.75 19.75 19.10 19.15 19.20 17.33
0.00 42.60 101.00 45.38 75.38 22.00 34.27 34.27 67.89
\ 126.65 127.47 121.20 86.26 70.00 80.00 120.60 123.92 122.12
74.13 85.23 78.04 75.04 76.18 76.45 77.98 79.57 81.04
127.43 48.84 47.46 42.17 50.82 62.06 61.08 65.04 63.89
135.39 123.27 122.79 127.24 125.12 130.25 135.20 131.85 136.63
15.51 16.05 16.45 16.60 17.60 17.80 18.22 18.61 18.60
4.68 6.18 4.97 5.37 5.15 5.64 4.12 5.49 4.00
2.89 2.86 3.15 3.25 3.38 3.68 3.75 3.76 3.76
5.00 5.50 5.20 5.50 5.56 4.90 5.50 5.80 5.80
135.30 138.56 168.06 172.53 190.02 193.66 203.23 213.90 218.72
47.18 52.00 58.00 66.00 83.65 77.70 85.64 86.70 78.73
12.97 12.12 14.27 25.60 14.3 16.39 18.50 22.20 25.70
0.14 0.14 0.14 0.14 0.14 0.14 0.15 0.15 0.18
112.00 113.56 114.00 102.00 101.14 151.73 155.04 155.04 166.09
29.34 29.42 29.45 29.52 17.98 19.84 23.87 28.63 36.25
0.00 9.07 6.42 2.55 2.56 2.57 2.79 3.00 3.09
192.71 208.29 225.37 249.84 267.00 277.07 289.58 306.73 325.95
865.70 879.23 915.80 938.50 988.00 1035.50 1090.00 1181.01 1264.53
0.06 0.07 0.06 0.07 0.09 0.08 0.04 0.09 0.09
0.03 0.08 0.04 0.08 0.08 0.08 0.09 0.17 0.21
0.03 0.04 0.05 0.05 0.05 0.05 0.05 0.05 0.05
0.00 0.00 0.00 0.00 0.00 0.00 0.07 0.06 0.08
0.00 0.00 0.00 0.00 - 0.00 0.00 0.00 0.00
4.21 4.35 4.90 4.91 5.20 5.25 2.18 6.06 5.57
2822.96 2844.83 3126.18 3209.86 3457.89 3525.88 3755.56 3844.89 4207.35
16
00
.00
14
00
.00
12
00
.00
10
00
.00
80
0.0
0
60
0.0
0
40
0.0
0
20
0.0
0
0.0
0
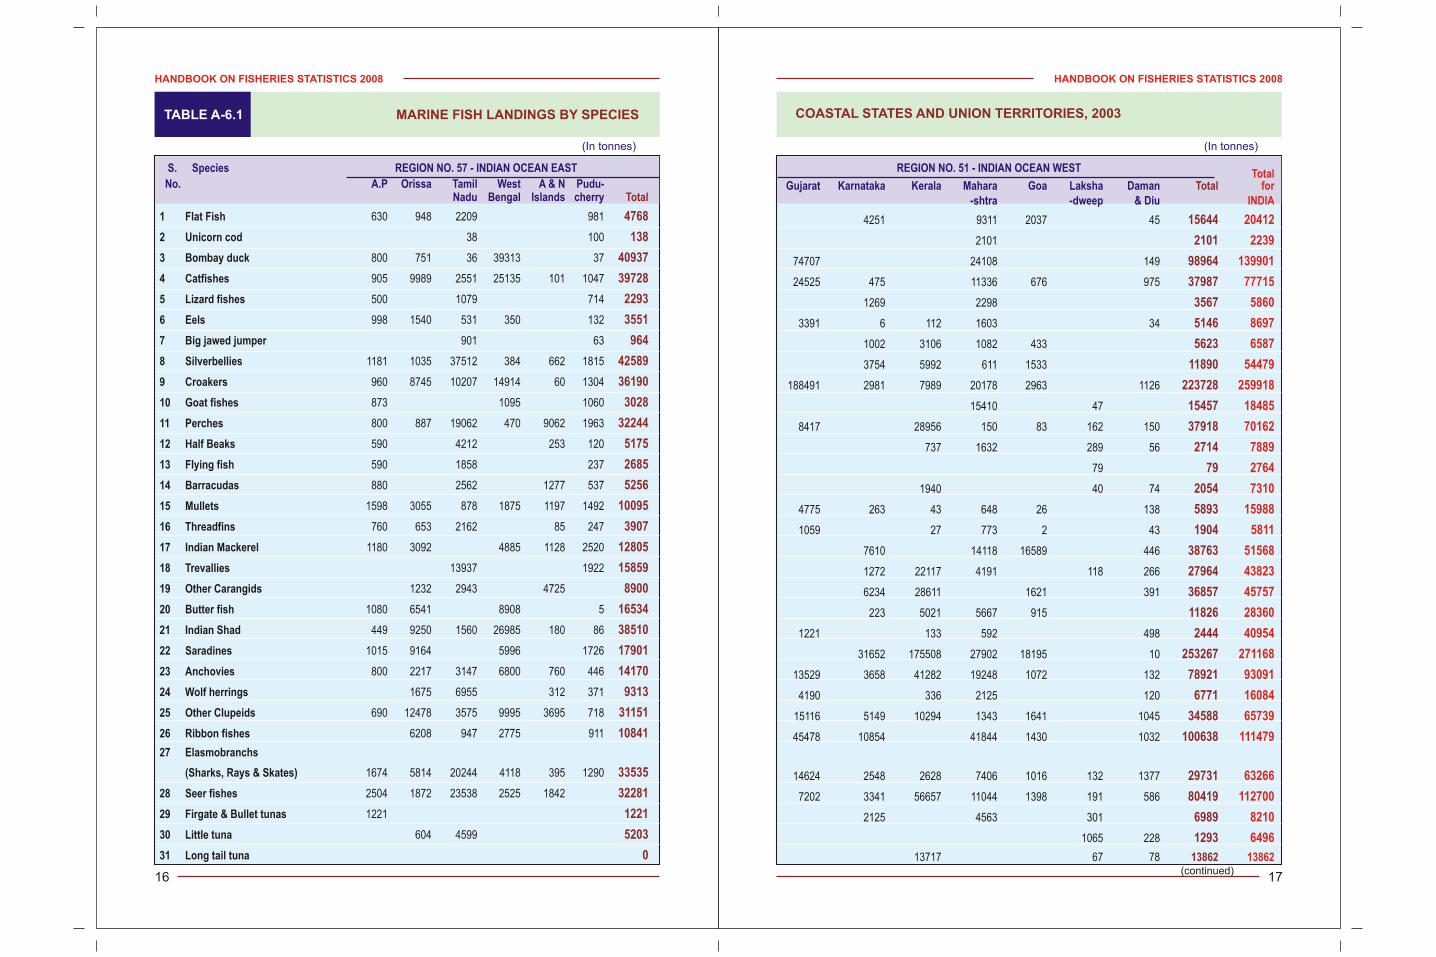
h P 0 to sFis roduction (’0 0 nne )
gaWest Ben l
A dhr r d shn a P a e
Gujarat
ralaKe
Ta i dm l Na u
a a s tM h ra h ra
i saOr s
U ta P adest r r h
i aB h r
Karnataka
Assam
Chhattisgarh
unj bP a
ha h ndJ rk a
Haryana
M hadhya Prades
Others
1447.26
1010. 90
721.91
667.33
559. 63
55 6.45
34 .49 8
325.95
319.10
297.69
32190.
1 .39 37
78 73.
67.89
67.24
63.89
426 .78
HANDBOOK ON FISHERIES STATISTICS 2008
15
HANDBOOK ON FISHERIES STATISTICS 2008
14
CH
AR
T 3
:
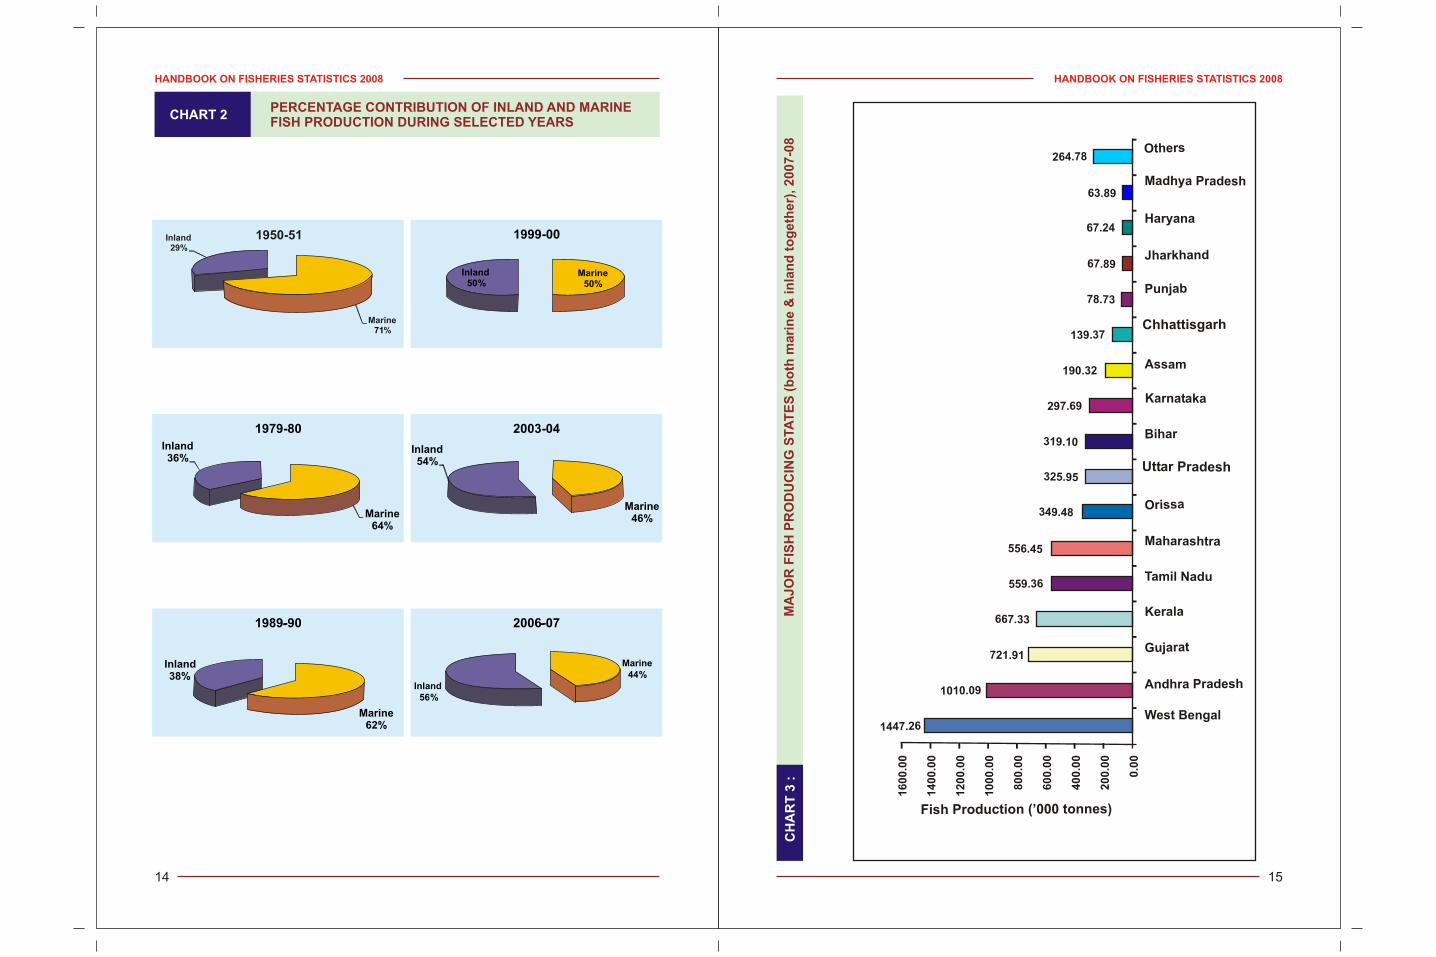
CHART 2
MA
JO
R F
ISH
PR
OD
UC
ING
STA
TE
S (
bo
th m
ari
ne
& in
lan
d t
og
eth
er)
, 2
00
7-0
8
PERCENTAGE CONTRIBUTION OF INLAND AND MARINEFISH PRODUCTION DURING SELECTED YEARS
Marine50%
Inland50%
1999-00
2003-04
Marine46%
Inland54%
2006-07
Marine44%
Inland56%
-
Marine71%
Inland29%
1950-51
1989-90
Marine62%
Inland38%
-
Marine64%
Inland36%
1979-80
(In tonnes)
HANDBOOK ON FISHERIES STATISTICS 2008
17
HANDBOOK ON FISHERIES STATISTICS 2008
16
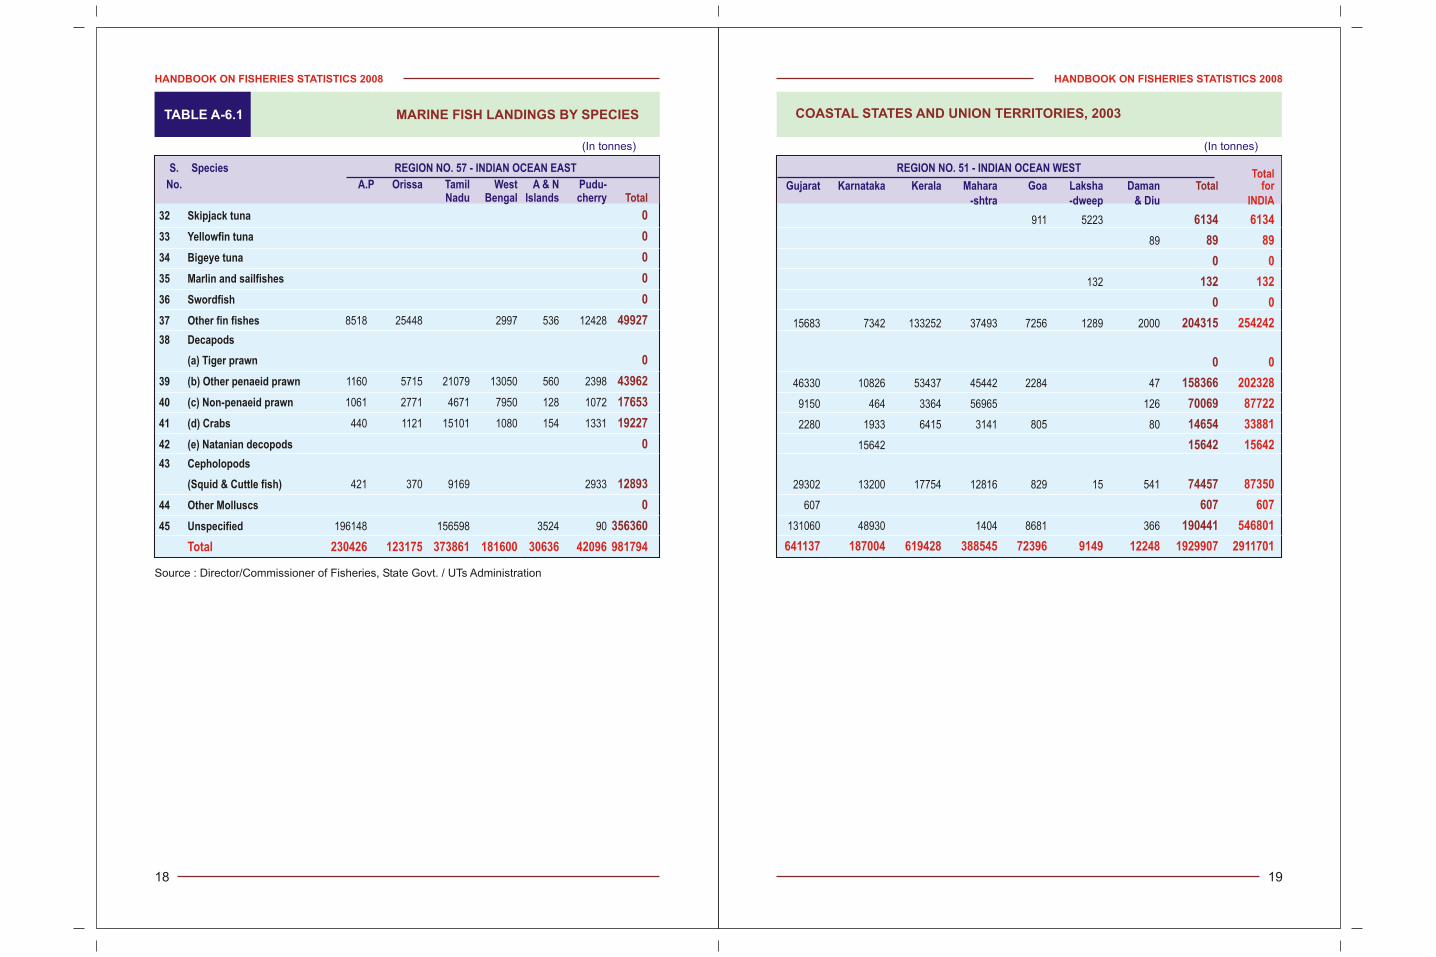
TABLE A-6.1 COASTAL STATES AND UNION TERRITORIES, 2003MARINE FISH LANDINGS BY SPECIES
(In tonnes)
4251 9311 2037 45
2101
74707 24108 149
24525 475 11336 676 975
1269 2298
3391 6 112 1603 34
1002 3106 1082 433
3754 5992 611 1533
188491 2981 7989 20178 2963 1126
15410 47
8417 28956 150 83 162 150
737 1632 289 56
79
1940 40 74
4775 263 43 648 26 138
1059 27 773 2 43
7610 14118 16589 446
1272 22117 4191 118 266
6234 28611 1621 391
223 5021 5667 915
1221 133 592 498
31652 175508 27902 18195 10
13529 3658 41282 19248 1072 132
4190 336 2125 120
15116 5149 10294 1343 1641 1045
45478 10854 41844 1430 1032
14624 2548 2628 7406 1016 132 1377
7202 3341 56657 11044 1398 191 586
2125 4563 301
1065 228
13717 67 78
REGION NO. 51 - INDIAN OCEAN WEST
Gujarat Karnataka Kerala Mahara Goa Laksha Daman-shtra -dweep & Diu
Totalfor
INDIA
20412
2239
139901
77715
5860
8697
6587
54479
259918
18485
70162
7889
2764
7310
15988
5811
51568
43823
45757
28360
40954
271168
93091
16084
65739
111479
63266
112700
8210
6496
13862
Total
15644
2101
98964
37987
3567
5146
5623
11890
223728
15457
37918
2714
79
2054
5893
1904
38763
27964
36857
11826
2444
253267
78921
6771
34588
100638
29731
80419
6989
1293
13862(continued)
S. Species REGION NO. 57 - INDIAN OCEAN EAST
No. A.P Orissa Tamil West A & N Pudu-Nadu Bengal Islands cherry Total
4768
138
40937
39728
2293
3551
964
42589
36190
3028
32244
5175
2685
5256
10095
3907
12805
15859
8900
16534
38510
17901
14170
9313
31151
10841
33535
32281
1221
5203
0
1 Flat Fish 630 948 2209 981
2 Unicorn cod 38 100
3 Bombay duck 800 751 36 39313 37
4 Catfishes 905 9989 2551 25135 101 1047
5 Lizard fishes 500 1079 714
6 Eels 998 1540 531 350 132
7 Big jawed jumper 901 63
8 Silverbellies 1181 1035 37512 384 662 1815
9 Croakers 960 8745 10207 14914 60 1304
10 Goat fishes 873 1095 1060
11 Perches 800 887 19062 470 9062 1963
12 Half Beaks 590 4212 253 120
13 Flying fish 590 1858 237
14 Barracudas 880 2562 1277 537
15 Mullets 1598 3055 878 1875 1197 1492
16 Threadfins 760 653 2162 85 247
17 Indian Mackerel 1180 3092 4885 1128 2520
18 Trevallies 13937 1922
19 Other Carangids 1232 2943 4725
20 Butter fish 1080 6541 8908 5
21 Indian Shad 449 9250 1560 26985 180 86
22 Saradines 1015 9164 5996 1726
23 Anchovies 800 2217 3147 6800 760 446
24 Wolf herrings 1675 6955 312 371
25 Other Clupeids 690 12478 3575 9995 3695 718
26 Ribbon fishes 6208 947 2775 911
27 Elasmobranchs
(Sharks, Rays & Skates) 1674 5814 20244 4118 395 1290
28 Seer fishes 2504 1872 23538 2525 1842
29 Firgate & Bullet tunas 1221
30 Little tuna 604 4599
31 Long tail tuna
(In tonnes)
HANDBOOK ON FISHERIES STATISTICS 2008
19
HANDBOOK ON FISHERIES STATISTICS 2008
18
TABLE A-6.1 COASTAL STATES AND UNION TERRITORIES, 2003MARINE FISH LANDINGS BY SPECIES
(In tonnes)
32 Skipjack tuna
33 Yellowfin tuna
34 Bigeye tuna
35 Marlin and sailfishes
36 Swordfish
37 Other fin fishes 8518 25448 2997 536 12428
38 Decapods
(a) Tiger prawn
39 (b) Other penaeid prawn 1160 5715 21079 13050 560 2398
40 (c) Non-penaeid prawn 1061 2771 4671 7950 128 1072
41 (d) Crabs 440 1121 15101 1080 154 1331
42 (e) Natanian decopods
43 Cepholopods
(Squid & Cuttle fish) 421 370 9169 2933
44 Other Molluscs
45 Unspecified 196148 156598 3524 90
S. Species REGION NO. 57 - INDIAN OCEAN EAST
No. A.P Orissa Tamil West A & N Pudu-Nadu Bengal Islands cherry Total
0
0
0
0
0
49927
0
43962
17653
19227
0
12893
0
356360
Total 230426 123175 373861 181600 30636 42096 981794
Source : Director/Commissioner of Fisheries, State Govt. / UTs Administration
911 5223
89
132
15683 7342 133252 37493 7256 1289 2000
46330 10826 53437 45442 2284 47
9150 464 3364 56965 126
2280 1933 6415 3141 805 80
15642
29302 13200 17754 12816 829 15 541
607
131060 48930 1404 8681 366
REGION NO. 51 - INDIAN OCEAN WEST
Gujarat Karnataka Kerala Mahara Goa Laksha Daman-shtra -dweep & Diu
Totalfor
INDIA
6134
89
0
132
0
254242
0
202328
87722
33881
15642
87350
607
546801
641137 187004 619428 388545 72396 9149 12248 1929907 2911701
Total
6134
89
0
132
0
204315
0
158366
70069
14654
15642
74457
607
190441
(In tonnes)
HANDBOOK ON FISHERIES STATISTICS 2008
21
HANDBOOK ON FISHERIES STATISTICS 2008
20
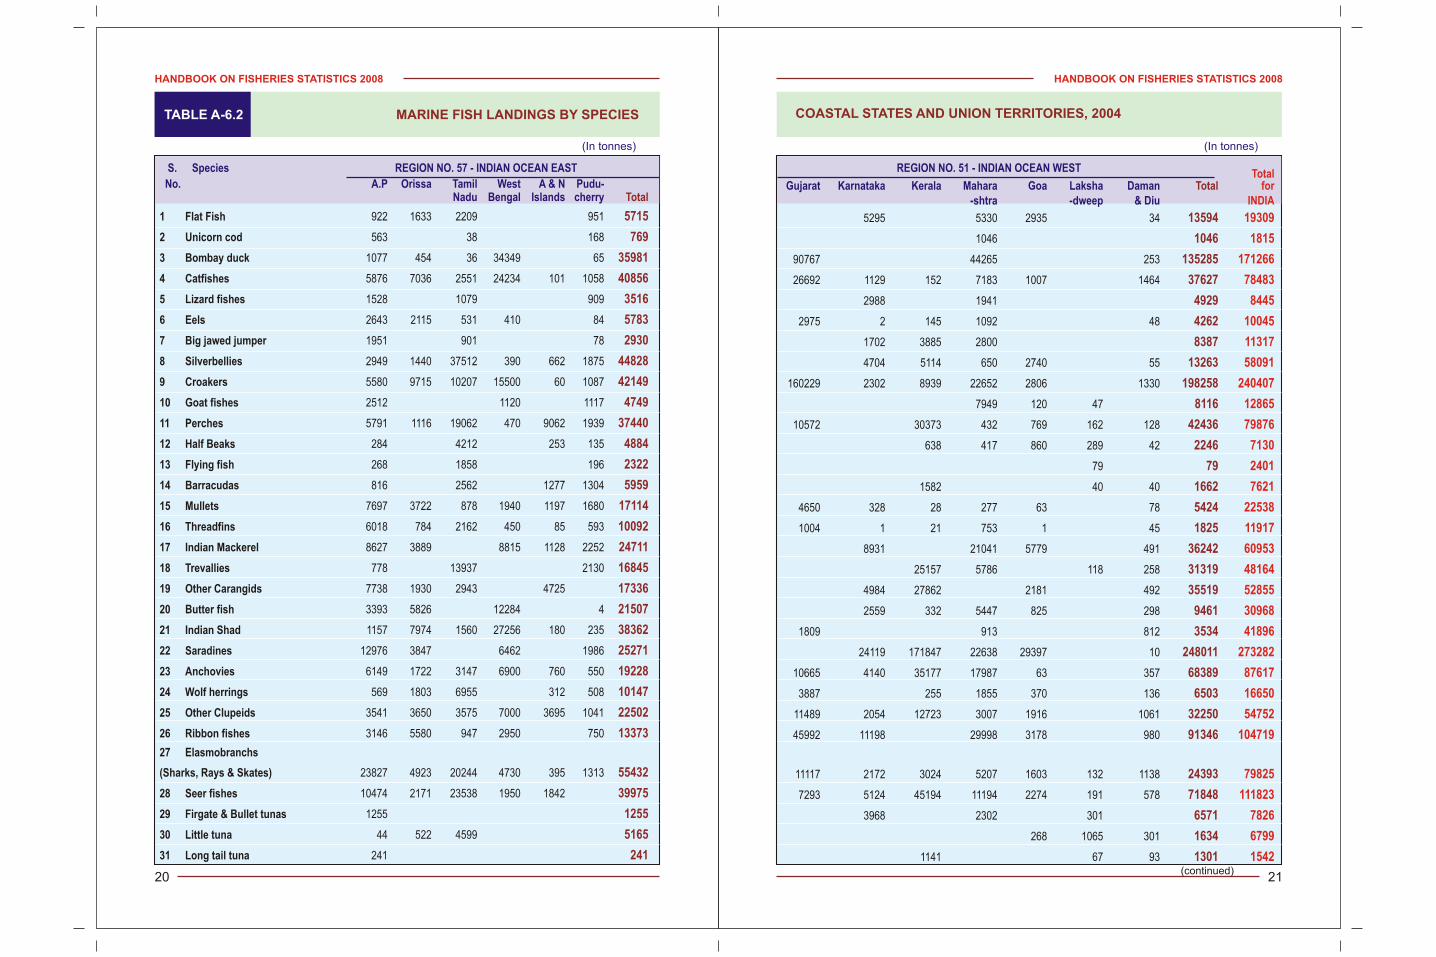
TABLE A-6.2 COASTAL STATES AND UNION TERRITORIES, 2004MARINE FISH LANDINGS BY SPECIES
(In tonnes)
(continued)
5295 5330 2935 34
1046
90767 44265 253
26692 1129 152 7183 1007 1464
2988 1941
2975 2 145 1092 48
1702 3885 2800
4704 5114 650 2740 55
160229 2302 8939 22652 2806 1330
7949 120 47
10572 30373 432 769 162 128
638 417 860 289 42
79
1582 40 40
4650 328 28 277 63 78
1004 1 21 753 1 45
8931 21041 5779 491
25157 5786 118 258
4984 27862 2181 492
2559 332 5447 825 298
1809 913 812
24119 171847 22638 29397 10
10665 4140 35177 17987 63 357
3887 255 1855 370 136
11489 2054 12723 3007 1916 1061
45992 11198 29998 3178 980
11117 2172 3024 5207 1603 132 1138
7293 5124 45194 11194 2274 191 578
3968 2302 301
268 1065 301
1141 67 93
REGION NO. 51 - INDIAN OCEAN WEST
Gujarat Karnataka Kerala Mahara Goa Laksha Daman-shtra -dweep & Diu
Totalfor
INDIA
19309
1815
171266
78483
8445
10045
11317
58091
240407
12865
79876
7130
2401
7621
22538
11917
60953
48164
52855
30968
41896
273282
87617
16650
54752
104719
79825
111823
7826
6799
1542
Total
13594
1046
135285
37627
4929
4262
8387
13263
198258
8116
42436
2246
79
1662
5424
1825
36242
31319
35519
9461
3534
248011
68389
6503
32250
91346
24393
71848
6571
1634
1301
S. Species REGION NO. 57 - INDIAN OCEAN EAST
No. A.P Orissa Tamil West A & N Pudu-Nadu Bengal Islands cherry Total
5715
769
35981
40856
3516
5783
2930
44828
42149
4749
37440
4884
2322
5959
17114
10092
24711
16845
17336
21507
38362
25271
19228
10147
22502
13373
55432
39975
1255
5165
241
1 Flat Fish 922 1633 2209 951
2 Unicorn cod 563 38 168
3 Bombay duck 1077 454 36 34349 65
4 Catfishes 5876 7036 2551 24234 101 1058
5 Lizard fishes 1528 1079 909
6 Eels 2643 2115 531 410 84
7 Big jawed jumper 1951 901 78
8 Silverbellies 2949 1440 37512 390 662 1875
9 Croakers 5580 9715 10207 15500 60 1087
10 Goat fishes 2512 1120 1117
11 Perches 5791 1116 19062 470 9062 1939
12 Half Beaks 284 4212 253 135
13 Flying fish 268 1858 196
14 Barracudas 816 2562 1277 1304
15 Mullets 7697 3722 878 1940 1197 1680
16 Threadfins 6018 784 2162 450 85 593
17 Indian Mackerel 8627 3889 8815 1128 2252
18 Trevallies 778 13937 2130
19 Other Carangids 7738 1930 2943 4725
20 Butter fish 3393 5826 12284 4
21 Indian Shad 1157 7974 1560 27256 180 235
22 Saradines 12976 3847 6462 1986
23 Anchovies 6149 1722 3147 6900 760 550
24 Wolf herrings 569 1803 6955 312 508
25 Other Clupeids 3541 3650 3575 7000 3695 1041
26 Ribbon fishes 3146 5580 947 2950 750
27 Elasmobranchs
(Sharks, Rays & Skates) 23827 4923 20244 4730 395 1313
28 Seer fishes 10474 2171 23538 1950 1842
29 Firgate & Bullet tunas 1255
30 Little tuna 44 522 4599
31 Long tail tuna 241
(In tonnes)
HANDBOOK ON FISHERIES STATISTICS 2008
23
HANDBOOK ON FISHERIES STATISTICS 2008
22
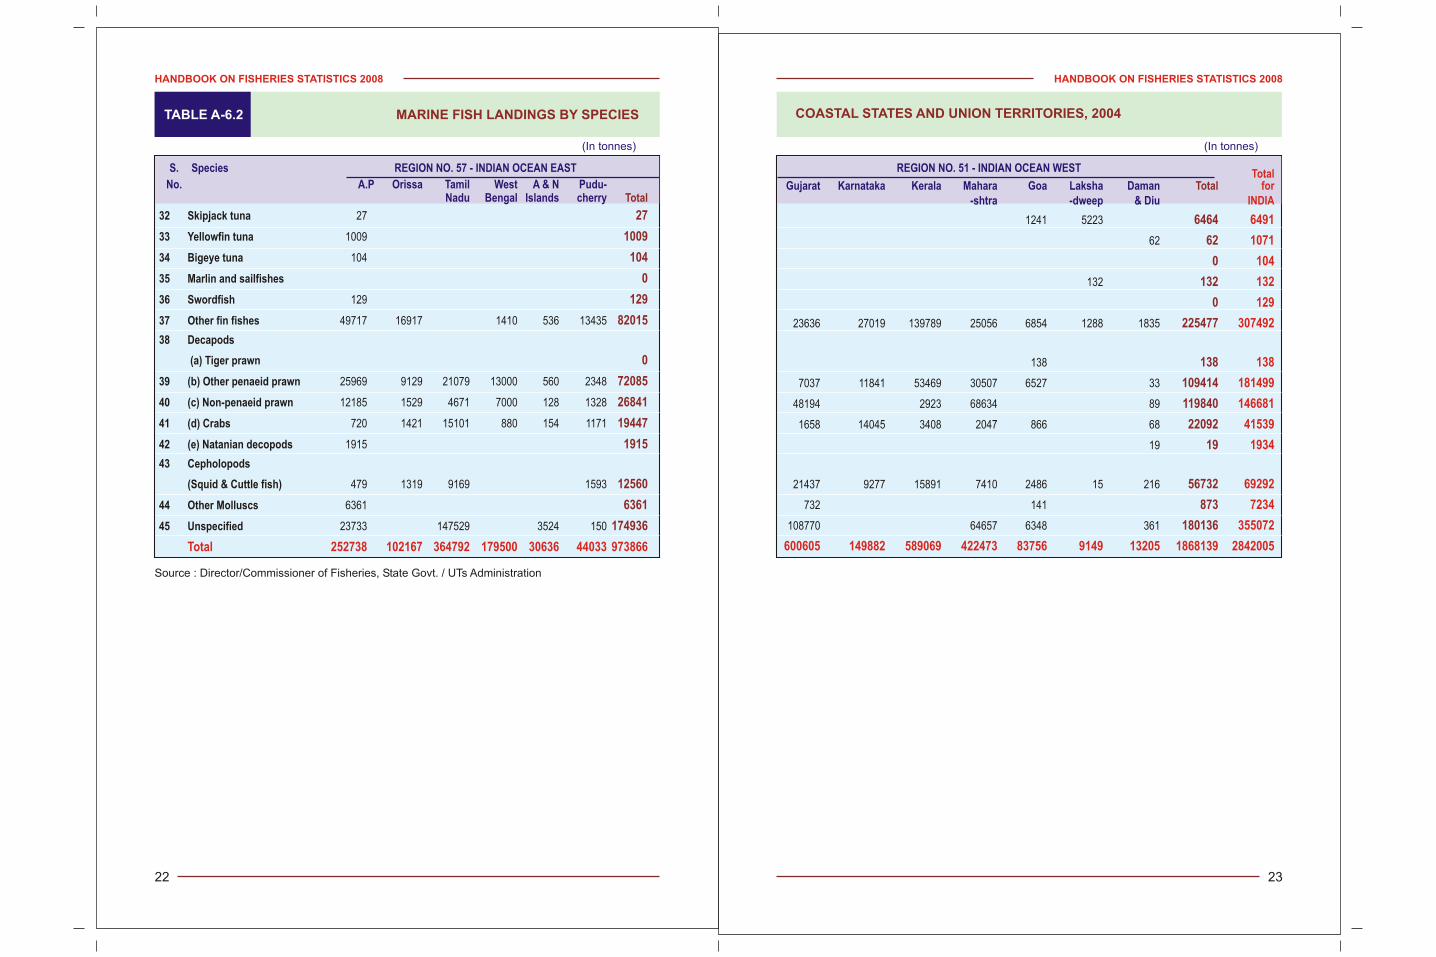
TABLE A-6.2 COASTAL STATES AND UNION TERRITORIES, 2004MARINE FISH LANDINGS BY SPECIES
(In tonnes)
32 Skipjack tuna 27
33 Yellowfin tuna 1009
34 Bigeye tuna 104
35 Marlin and sailfishes
36 Swordfish 129
37 Other fin fishes 49717 16917 1410 536 13435
38 Decapods
(a) Tiger prawn
39 (b) Other penaeid prawn 25969 9129 21079 13000 560 2348
40 (c) Non-penaeid prawn 12185 1529 4671 7000 128 1328
41 (d) Crabs 720 1421 15101 880 154 1171
42 (e) Natanian decopods 1915
43 Cepholopods
(Squid & Cuttle fish) 479 1319 9169 1593
44 Other Molluscs 6361
45 Unspecified 23733 147529 3524 150
S. Species REGION NO. 57 - INDIAN OCEAN EAST
No. A.P Orissa Tamil West A & N Pudu-Nadu Bengal Islands cherry Total
27
1009
104
0
129
82015
0
72085
26841
19447
1915
12560
6361
174936
Total 252738 102167 364792 179500 30636 44033 973866
Source : Director/Commissioner of Fisheries, State Govt. / UTs Administration
1241 5223
62
132
23636 27019 139789 25056 6854 1288 1835
138
7037 11841 53469 30507 6527 33
48194 2923 68634 89
1658 14045 3408 2047 866 68
19
21437 9277 15891 7410 2486 15 216
732 141
108770 64657 6348 361
REGION NO. 51 - INDIAN OCEAN WEST
Gujarat Karnataka Kerala Mahara Goa Laksha Daman-shtra -dweep & Diu
Totalfor
INDIA
6491
1071
104
132
129
307492
138
181499
146681
41539
1934
69292
7234
355072
600605 149882 589069 422473 83756 9149 13205 1868139 2842005
Total
6464
62
0
132
0
225477
138
109414
119840
22092
19
56732
873
180136

(In tonnes)
HANDBOOK ON FISHERIES STATISTICS 2008
25
HANDBOOK ON FISHERIES STATISTICS 2008
24
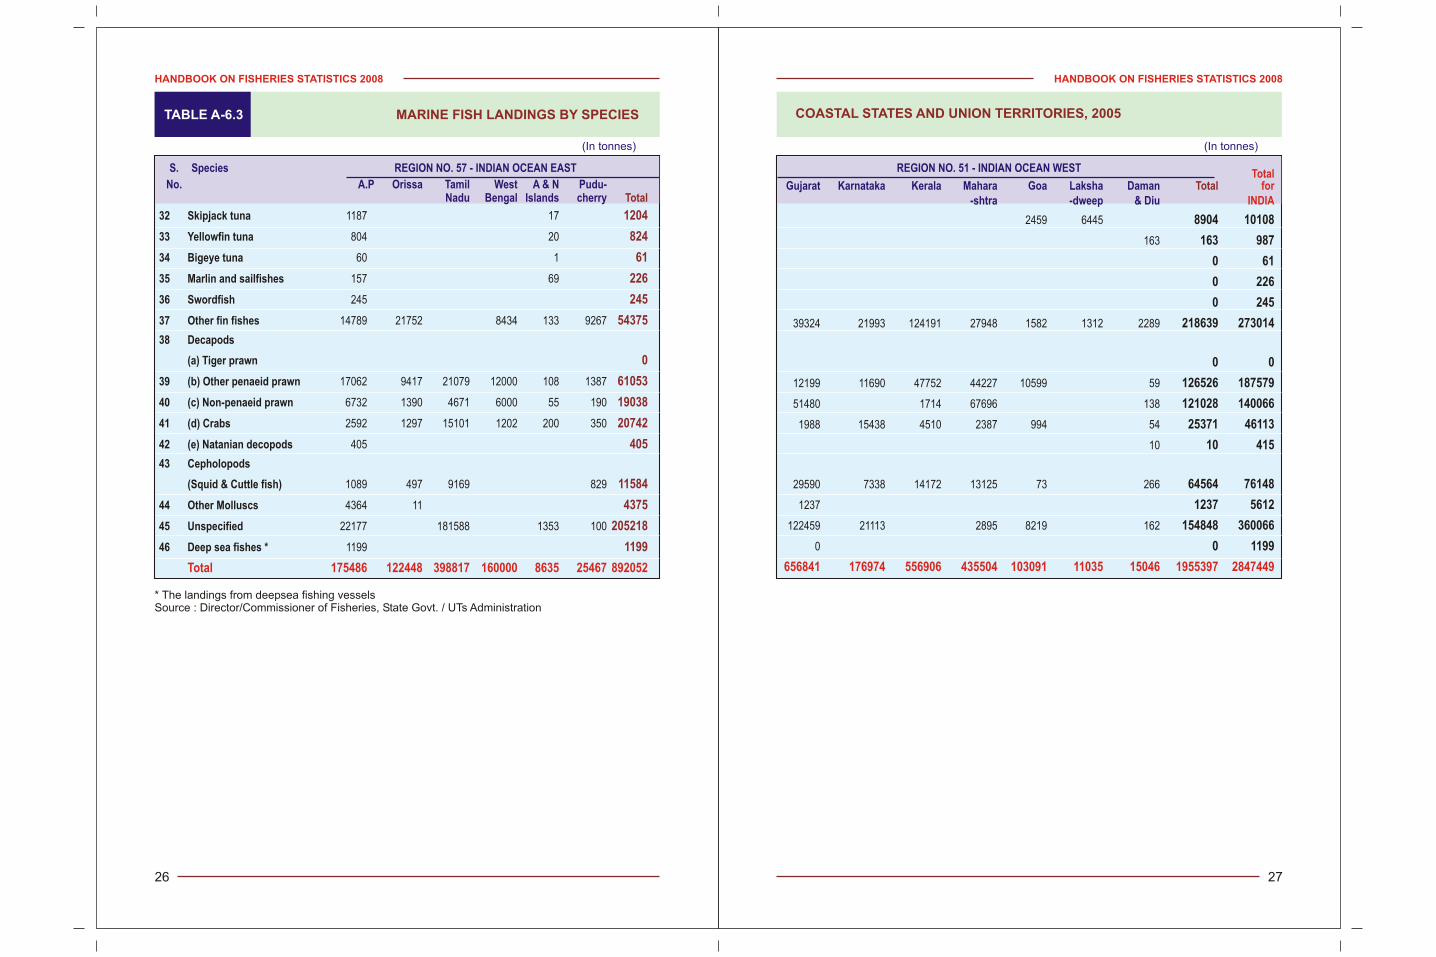
TABLE A-6.3 COASTAL STATES AND UNION TERRITORIES, 2005MARINE FISH LANDINGS BY SPECIES
(In tonnes)
(continued)
5537 5958 2054 31
2458
91916 66614 248
26827 1261 9550 1303 1706
3084 2431
6604 6 167 1601 57
2038 1499 3025
5565 5292 811 2046 67
152060 3070 9855 28832 3211 1186
9976 87
16275 30333 324 1379 177 112
690 845 2262 38
63
1656 28 40
5472 435 42 360 289 64
1221 28 67 506 132
8921 17877 12006 429
21711 7149 3206 199 266
3485 26906 392
1904 9547 10903 720 1206
1935 942 636
30215 149375 28014 28246 2
10922 2408 30084 22104 17 686
5093 264 2468 849 155
15081 3574 15490 3858 3505 1095
41175 13641 33262 5791 1240
14725 2590 3149 5746 1871 221 935
9258 6415 46559 7496 9556 120 548
5225 1635
4116 854 660 516
11881 88 118
REGION NO. 51 - INDIAN OCEAN WEST
Gujarat Karnataka Kerala Mahara Goa Laksha Daman-shtra -dweep & Diu
Totalfor
INDIA
19154
2963
188264
89054
7901
13722
9136
61471
234414
13551
79851
8485
2274
5685
25486
13062
60512
48711
45387
39450
30253
262654
77715
19087
62587
114968
61056
116492
7737
11786
12742
Total
13580
2458
158778
40647
5515
8435
6562
13781
198214
10063
48600
3835
63
1724
6662
1954
39233
32531
30783
24280
3513
235852
66221
8829
42603
95109
29237
79952
6860
6146
12087
S. Species REGION NO. 57 - INDIAN OCEAN EAST
No. A.P Orissa Tamil West A & N Pudu-Nadu Bengal Islands cherry Total
5574
505
29486
48407
2386
5287
2574
47690
36200
3488
31251
4650
2211
3961
18824
11108
21279
16180
14604
15170
26740
26802
11494
10258
19984
19859
31819
36540
877
5640
655
1 Flat Fish 1058 1773 2209 534
2 Unicorn cod 407 38 60
3 Bombay duck 660 626 36 28102 62
4 Catfishes 8086 9790 2551 27465 32 483
5 Lizard fishes 811 1079 496
6 Eels 2817 1834 531 67 38
7 Big jawed jumper 1617 901 56
8 Silverbellies 3027 1684 37512 3987 217 1263
9 Croakers 4404 11860 10207 9100 30 599
10 Goat fishes 2307 511 670
11 Perches 5320 2310 19062 359 3019 1181
12 Half Beaks 385 4212 16 37
13 Flying fish 323 1858 30
14 Barracudas 563 2562 376 460
15 Mullets 4346 5803 878 6712 290 795
16 Threadfins 5321 1122 2162 2274 7 222
17 Indian Mackerel 6263 4567 8551 313 1585
18 Trevallies 1099 13937 1144
19 Other Carangids 7320 3187 2943 1154
20 Butter fish 1954 10153 3060 3
21 Indian Shad 1805 4049 1526 19061 74 225
22 Saradines 11911 4910 8452 1529
23 Anchovies 4523 3133 3147 579 112
24 Wolf herrings 344 2656 6955 303
25 Other Clupeids 5264 4589 3575 5342 706 508
26 Ribbon fishes 3924 6947 947 7807 234
27 Elasmobranchs
(Sharks, Rays & Skates) 6253 4409 20244 127 71 715
28 Seer fishes 9653 2167 23538 808 374
29 Firgate & Bullet tunas 877
30 Little tuna 526 515 4599
31 Long tail tuna 655
(In tonnes)
HANDBOOK ON FISHERIES STATISTICS 2008
27
HANDBOOK ON FISHERIES STATISTICS 2008
26
TABLE A-6.3 COASTAL STATES AND UNION TERRITORIES, 2005MARINE FISH LANDINGS BY SPECIES
(In tonnes)
32 Skipjack tuna 1187 17
33 Yellowfin tuna 804 20
34 Bigeye tuna 60 1
35 Marlin and sailfishes 157 69
36 Swordfish 245
37 Other fin fishes 14789 21752 8434 133 9267
38 Decapods
(a) Tiger prawn
39 (b) Other penaeid prawn 17062 9417 21079 12000 108 1387
40 (c) Non-penaeid prawn 6732 1390 4671 6000 55 190
41 (d) Crabs 2592 1297 15101 1202 200 350
42 (e) Natanian decopods 405
43 Cepholopods
(Squid & Cuttle fish) 1089 497 9169 829
44 Other Molluscs 4364 11
45 Unspecified 22177 181588 1353 100
46 Deep sea fishes * 1199
S. Species REGION NO. 57 - INDIAN OCEAN EAST
No. A.P Orissa Tamil West A & N Pudu-Nadu Bengal Islands cherry Total
1204
824
61
226
245
54375
0
61053
19038
20742
405
11584
4375
205218
1199
Total 175486 122448 398817 160000 8635 25467 892052
* The landings from deepsea fishing vesselsSource : Director/Commissioner of Fisheries, State Govt. / UTs Administration
2459 6445 8904 10108
163 163 987
0 61
0 226
0 245
39324 21993 124191 27948 1582 1312 2289 218639 273014
0 0
12199 11690 47752 44227 10599 59 126526 187579
51480 1714 67696 138 121028 140066
1988 15438 4510 2387 994 54 25371 46113
10 10 415
29590 7338 14172 13125 73 266 64564 76148
1237 1237 5612
122459 21113 2895 8219 162 154848 360066
0 0 1199
REGION NO. 51 - INDIAN OCEAN WEST
Gujarat Karnataka Kerala Mahara Goa Laksha Daman-shtra -dweep & Diu
Totalfor
INDIA
656841 176974 556906 435504 103091 11035 15046 1955397 2847449
Total
(In tonnes)
HANDBOOK ON FISHERIES STATISTICS 2008
29
HANDBOOK ON FISHERIES STATISTICS 2008
28
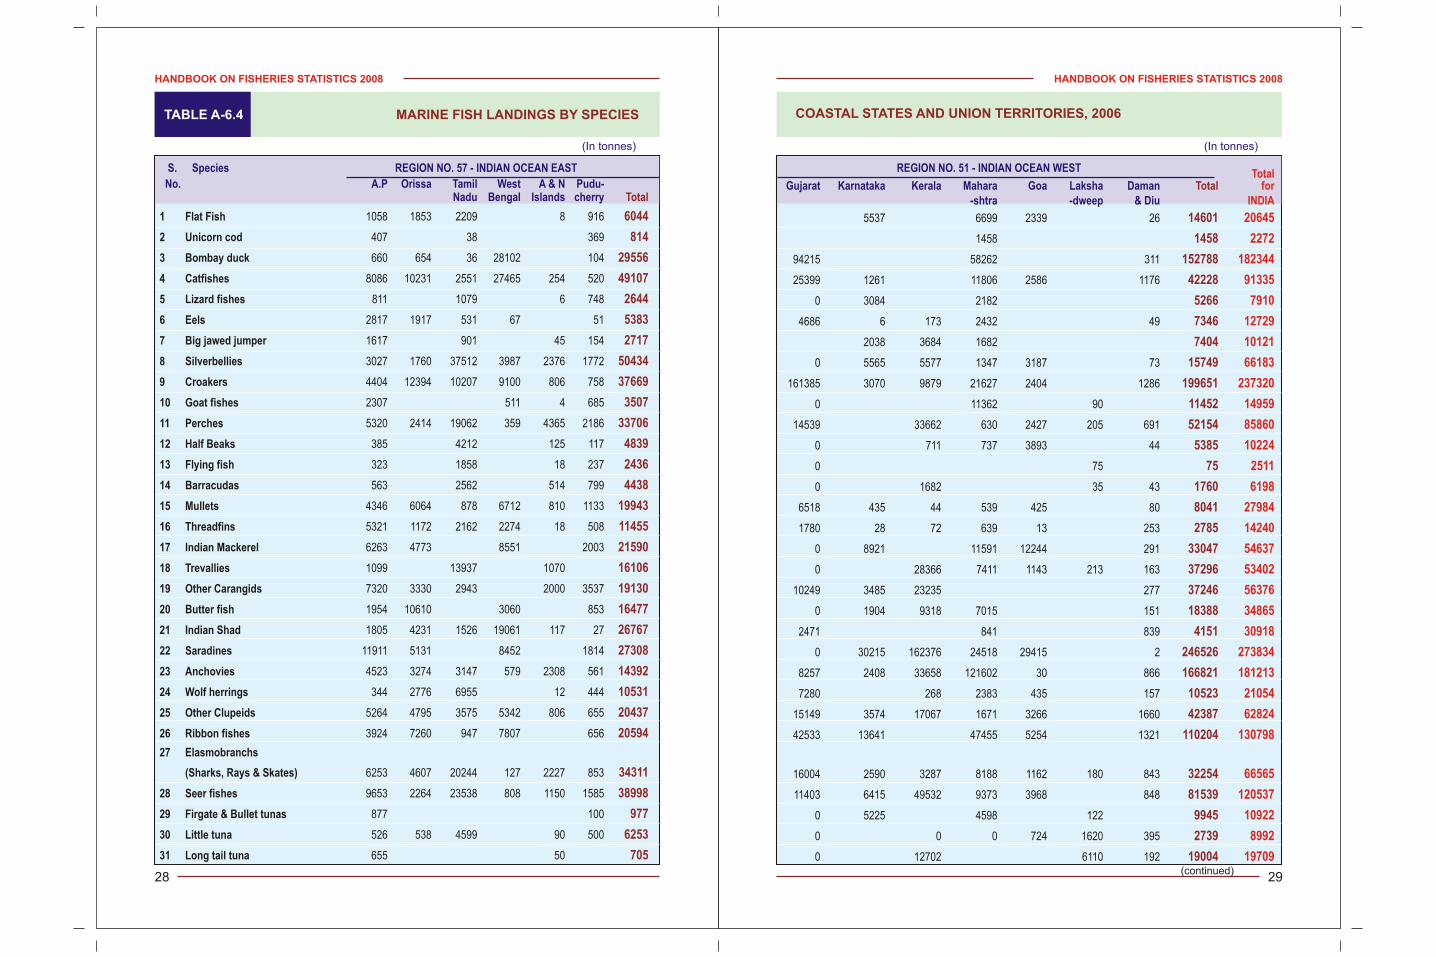
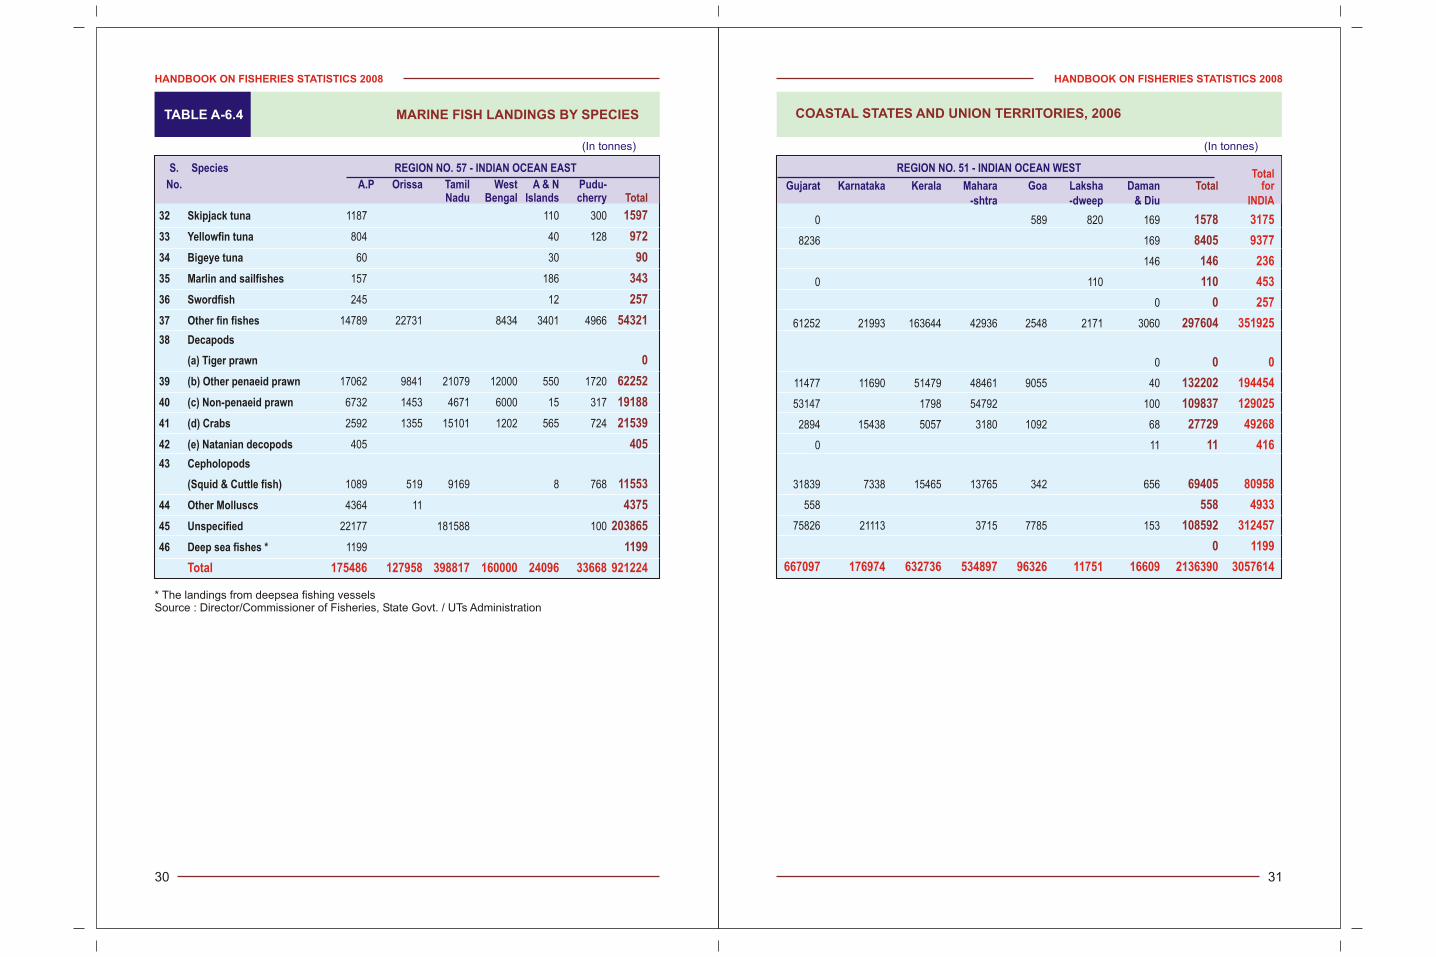
TABLE A-6.4 COASTAL STATES AND UNION TERRITORIES, 2006MARINE FISH LANDINGS BY SPECIES
(In tonnes)
(continued)
5537 6699 2339 26
1458
94215 58262 311
25399 1261 11806 2586 1176
0 3084 2182
4686 6 173 2432 49
2038 3684 1682
0 5565 5577 1347 3187 73
161385 3070 9879 21627 2404 1286
0 11362 90
14539 33662 630 2427 205 691
0 711 737 3893 44
0 75
0 1682 35 43
6518 435 44 539 425 80
1780 28 72 639 13 253
0 8921 11591 12244 291
0 28366 7411 1143 213 163
10249 3485 23235 277
0 1904 9318 7015 151
2471 841 839
0 30215 162376 24518 29415 2
8257 2408 33658 121602 30 866
7280 268 2383 435 157
15149 3574 17067 1671 3266 1660
42533 13641 47455 5254 1321
16004 2590 3287 8188 1162 180 843
11403 6415 49532 9373 3968 848
0 5225 4598 122
0 0 0 724 1620 395
0 12702 6110 192
REGION NO. 51 - INDIAN OCEAN WEST
Gujarat Karnataka Kerala Mahara Goa Laksha Daman-shtra -dweep & Diu
Totalfor
INDIA
20645
2272
182344
91335
7910
12729
10121
66183
237320
14959
85860
10224
2511
6198
27984
14240
54637
53402
56376
34865
30918
273834
181213
21054
62824
130798
66565
120537
10922
8992
19709
Total
14601
1458
152788
42228
5266
7346
7404
15749
199651
11452
52154
5385
75
1760
8041
2785
33047
37296
37246
18388
4151
246526
166821
10523
42387
110204
32254
81539
9945
2739
19004
S. Species REGION NO. 57 - INDIAN OCEAN EAST
No. A.P Orissa Tamil West A & N Pudu-Nadu Bengal Islands cherry Total
6044
814
29556
49107
2644
5383
2717
50434
37669
3507
33706
4839
2436
4438
19943
11455
21590
16106
19130
16477
26767
27308
14392
10531
20437
20594
34311
38998
977
6253
705
1 Flat Fish 1058 1853 2209 8 916
2 Unicorn cod 407 38 369
3 Bombay duck 660 654 36 28102 104
4 Catfishes 8086 10231 2551 27465 254 520
5 Lizard fishes 811 1079 6 748
6 Eels 2817 1917 531 67 51
7 Big jawed jumper 1617 901 45 154
8 Silverbellies 3027 1760 37512 3987 2376 1772
9 Croakers 4404 12394 10207 9100 806 758
10 Goat fishes 2307 511 4 685
11 Perches 5320 2414 19062 359 4365 2186
12 Half Beaks 385 4212 125 117
13 Flying fish 323 1858 18 237
14 Barracudas 563 2562 514 799
15 Mullets 4346 6064 878 6712 810 1133
16 Threadfins 5321 1172 2162 2274 18 508
17 Indian Mackerel 6263 4773 8551 2003
18 Trevallies 1099 13937 1070
19 Other Carangids 7320 3330 2943 2000 3537
20 Butter fish 1954 10610 3060 853
21 Indian Shad 1805 4231 1526 19061 117 27
22 Saradines 11911 5131 8452 1814
23 Anchovies 4523 3274 3147 579 2308 561
24 Wolf herrings 344 2776 6955 12 444
25 Other Clupeids 5264 4795 3575 5342 806 655
26 Ribbon fishes 3924 7260 947 7807 656
27 Elasmobranchs
(Sharks, Rays & Skates) 6253 4607 20244 127 2227 853
28 Seer fishes 9653 2264 23538 808 1150 1585
29 Firgate & Bullet tunas 877 100
30 Little tuna 526 538 4599 90 500
31 Long tail tuna 655 50
(In tonnes)
HANDBOOK ON FISHERIES STATISTICS 2008
31
HANDBOOK ON FISHERIES STATISTICS 2008
30
TABLE A-6.4 COASTAL STATES AND UNION TERRITORIES, 2006MARINE FISH LANDINGS BY SPECIES
(In tonnes)
32 Skipjack tuna 1187 110 300
33 Yellowfin tuna 804 40 128
34 Bigeye tuna 60 30
35 Marlin and sailfishes 157 186
36 Swordfish 245 12
37 Other fin fishes 14789 22731 8434 3401 4966
38 Decapods
(a) Tiger prawn
39 (b) Other penaeid prawn 17062 9841 21079 12000 550 1720
40 (c) Non-penaeid prawn 6732 1453 4671 6000 15 317
41 (d) Crabs 2592 1355 15101 1202 565 724
42 (e) Natanian decopods 405
43 Cepholopods
(Squid & Cuttle fish) 1089 519 9169 8 768
44 Other Molluscs 4364 11
45 Unspecified 22177 181588 100
46 Deep sea fishes * 1199
S. Species REGION NO. 57 - INDIAN OCEAN EAST
No. A.P Orissa Tamil West A & N Pudu-Nadu Bengal Islands cherry Total
1597
972
90
343
257
54321
0
62252
19188
21539
405
11553
4375
203865
1199
Total 175486 127958 398817 160000 24096 33668 921224
* The landings from deepsea fishing vesselsSource : Director/Commissioner of Fisheries, State Govt. / UTs Administration
0 589 820 169
8236 169
146
0 110
0
61252 21993 163644 42936 2548 2171 3060
0
11477 11690 51479 48461 9055 40
53147 1798 54792 100
2894 15438 5057 3180 1092 68
0 11
31839 7338 15465 13765 342 656
558
75826 21113 3715 7785 153
REGION NO. 51 - INDIAN OCEAN WEST
Gujarat Karnataka Kerala Mahara Goa Laksha Daman-shtra -dweep & Diu
Totalfor
INDIA
3175
9377
236
453
257
351925
0
194454
129025
49268
416
80958
4933
312457
1199
667097 176974 632736 534897 96326 11751 16609 2136390 3057614
Total
1578
8405
146
110
0
297604
0
132202
109837
27729
11
69405
558
108592
0
(In tonnes)
HANDBOOK ON FISHERIES STATISTICS 2008
33
HANDBOOK ON FISHERIES STATISTICS 2008
32
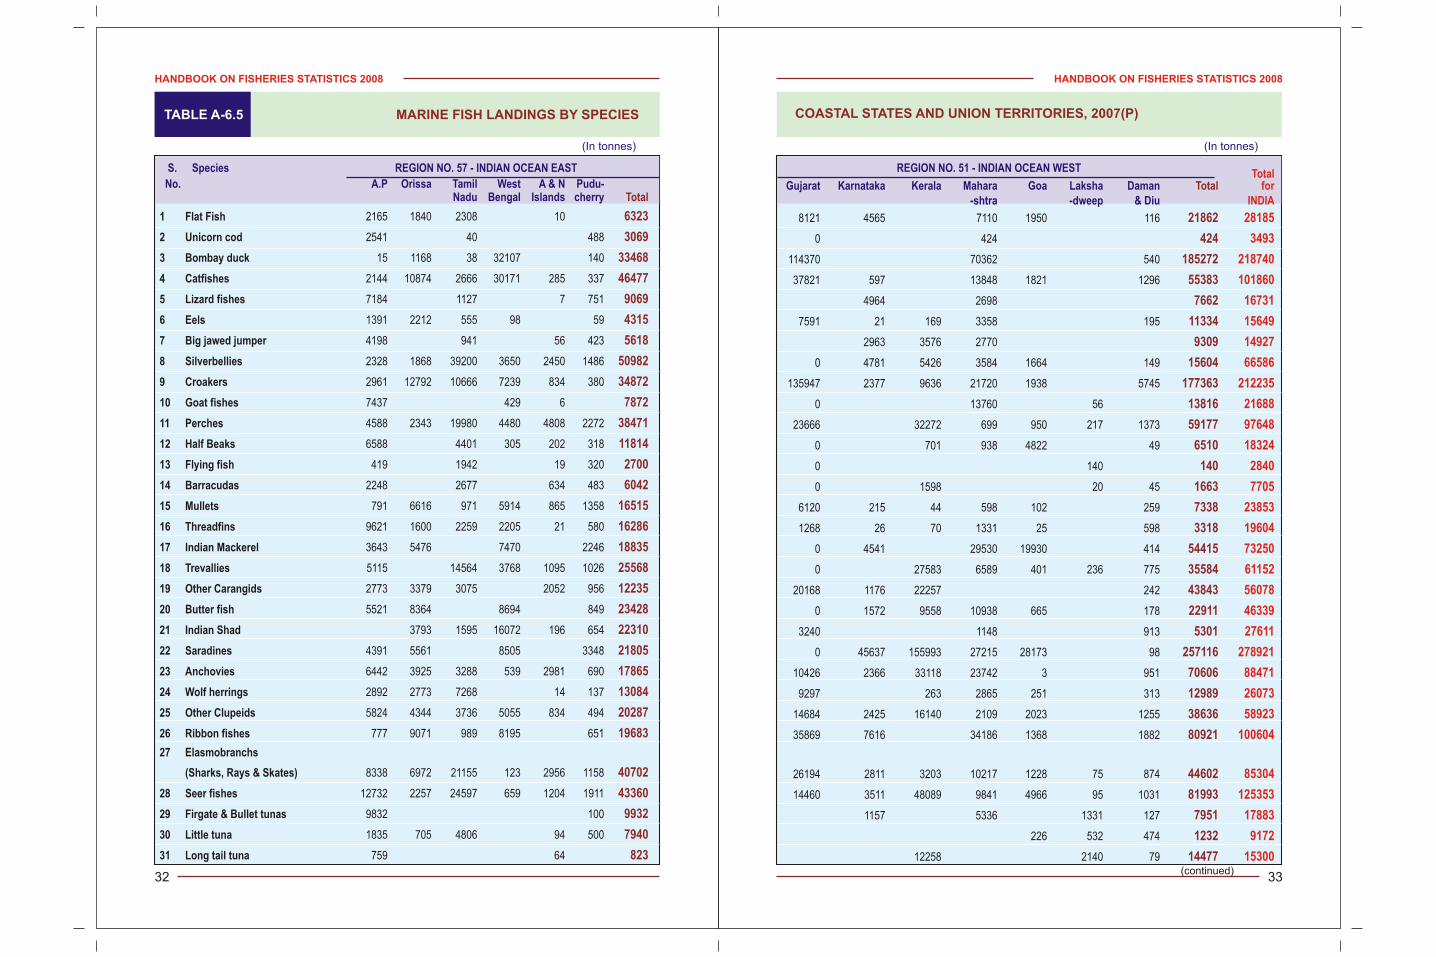
TABLE A-6.5 COASTAL STATES AND UNION TERRITORIES, 2007(P)MARINE FISH LANDINGS BY SPECIES
(In tonnes)
(continued)
8121 4565 7110 1950 116
0 424
114370 70362 540
37821 597 13848 1821 1296
4964 2698
7591 21 169 3358 195
2963 3576 2770
0 4781 5426 3584 1664 149
135947 2377 9636 21720 1938 5745
0 13760 56
23666 32272 699 950 217 1373
0 701 938 4822 49
0 140
0 1598 20 45
6120 215 44 598 102 259
1268 26 70 1331 25 598
0 4541 29530 19930 414
0 27583 6589 401 236 775
20168 1176 22257 242
0 1572 9558 10938 665 178
3240 1148 913
0 45637 155993 27215 28173 98
10426 2366 33118 23742 3 951
9297 263 2865 251 313
14684 2425 16140 2109 2023 1255
35869 7616 34186 1368 1882
26194 2811 3203 10217 1228 75 874
14460 3511 48089 9841 4966 95 1031
1157 5336 1331 127
226 532 474
12258 2140 79
REGION NO. 51 - INDIAN OCEAN WEST
Gujarat Karnataka Kerala Mahara Goa Laksha Daman-shtra -dweep & Diu
Totalfor
INDIA
28185
3493
218740
101860
16731
15649
14927
66586
212235
21688
97648
18324
2840
7705
23853
19604
73250
61152
56078
46339
27611
278921
88471
26073
58923
100604
85304
125353
17883
9172
15300
Total
21862
424
185272
55383
7662
11334
9309
15604
177363
13816
59177
6510
140
1663
7338
3318
54415
35584
43843
22911
5301
257116
70606
12989
38636
80921
44602
81993
7951
1232
14477
S. Species REGION NO. 57 - INDIAN OCEAN EAST
No. A.P Orissa Tamil West A & N Pudu-Nadu Bengal Islands cherry Total
6323
3069
33468
46477
9069
4315
5618
50982
34872
7872
38471
11814
2700
6042
16515
16286
18835
25568
12235
23428
22310
21805
17865
13084
20287
19683
40702
43360
9932
7940
823
1 Flat Fish 2165 1840 2308 10
2 Unicorn cod 2541 40 488
3 Bombay duck 15 1168 38 32107 140
4 Catfishes 2144 10874 2666 30171 285 337
5 Lizard fishes 7184 1127 7 751
6 Eels 1391 2212 555 98 59
7 Big jawed jumper 4198 941 56 423
8 Silverbellies 2328 1868 39200 3650 2450 1486
9 Croakers 2961 12792 10666 7239 834 380
10 Goat fishes 7437 429 6
11 Perches 4588 2343 19980 4480 4808 2272
12 Half Beaks 6588 4401 305 202 318
13 Flying fish 419 1942 19 320
14 Barracudas 2248 2677 634 483
15 Mullets 791 6616 971 5914 865 1358
16 Threadfins 9621 1600 2259 2205 21 580
17 Indian Mackerel 3643 5476 7470 2246
18 Trevallies 5115 14564 3768 1095 1026
19 Other Carangids 2773 3379 3075 2052 956
20 Butter fish 5521 8364 8694 849
21 Indian Shad 3793 1595 16072 196 654
22 Saradines 4391 5561 8505 3348
23 Anchovies 6442 3925 3288 539 2981 690
24 Wolf herrings 2892 2773 7268 14 137
25 Other Clupeids 5824 4344 3736 5055 834 494
26 Ribbon fishes 777 9071 989 8195 651
27 Elasmobranchs
(Sharks, Rays & Skates) 8338 6972 21155 123 2956 1158
28 Seer fishes 12732 2257 24597 659 1204 1911
29 Firgate & Bullet tunas 9832 100
30 Little tuna 1835 705 4806 94 500
31 Long tail tuna 759 64
(In tonnes)
HANDBOOK ON FISHERIES STATISTICS 2008
35
HANDBOOK ON FISHERIES STATISTICS 2008
34
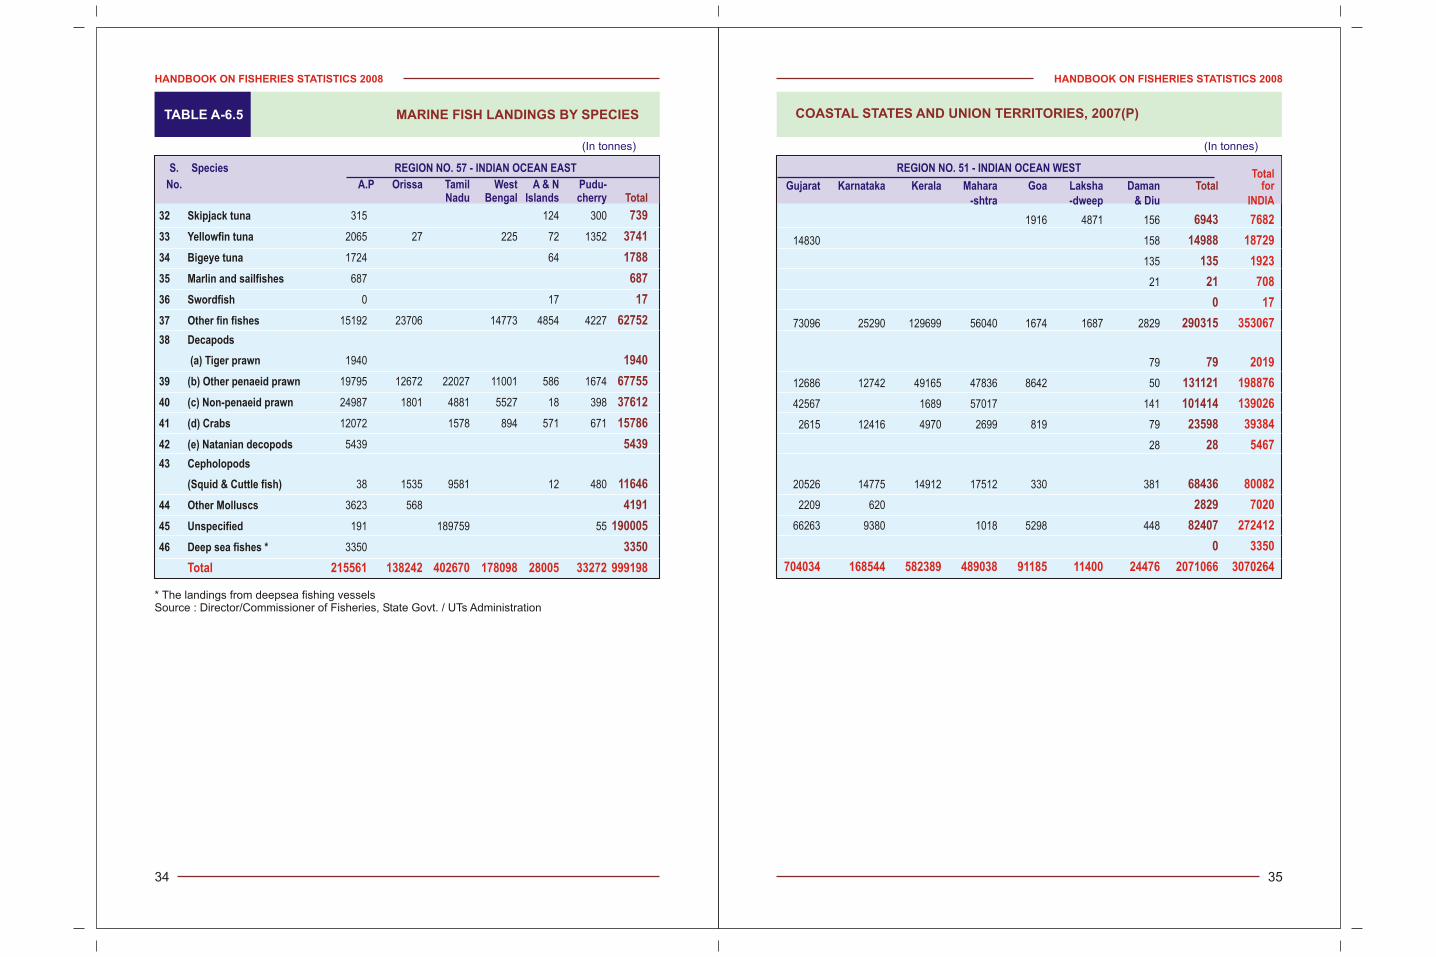
TABLE A-6.5 COASTAL STATES AND UNION TERRITORIES, 2007(P)MARINE FISH LANDINGS BY SPECIES
(In tonnes)
32 Skipjack tuna 315 124 300
33 Yellowfin tuna 2065 27 225 72 1352
34 Bigeye tuna 1724 64
35 Marlin and sailfishes 687
36 Swordfish 0 17
37 Other fin fishes 15192 23706 14773 4854 4227
38 Decapods
(a) Tiger prawn 1940
39 (b) Other penaeid prawn 19795 12672 22027 11001 586 1674
40 (c) Non-penaeid prawn 24987 1801 4881 5527 18 398
41 (d) Crabs 12072 1578 894 571 671
42 (e) Natanian decopods 5439
43 Cepholopods
(Squid & Cuttle fish) 38 1535 9581 12 480
44 Other Molluscs 3623 568
45 Unspecified 191 189759 55
46 Deep sea fishes * 3350
S. Species REGION NO. 57 - INDIAN OCEAN EAST
No. A.P Orissa Tamil West A & N Pudu-Nadu Bengal Islands cherry Total
739
3741
1788
687
17
62752
1940
67755
37612
15786
5439
11646
4191
190005
3350
Total 215561 138242 402670 178098 28005 33272 999198
* The landings from deepsea fishing vesselsSource : Director/Commissioner of Fisheries, State Govt. / UTs Administration
1916 4871 156
14830 158
135
21
73096 25290 129699 56040 1674 1687 2829
79
12686 12742 49165 47836 8642 50
42567 1689 57017 141
2615 12416 4970 2699 819 79
28
20526 14775 14912 17512 330 381
2209 620
66263 9380 1018 5298 448
REGION NO. 51 - INDIAN OCEAN WEST
Gujarat Karnataka Kerala Mahara Goa Laksha Daman-shtra -dweep & Diu
Totalfor
INDIA
7682
18729
1923
708
17
353067
2019
198876
139026
39384
5467
80082
7020
272412
3350
704034 168544 582389 489038 91185 11400 24476 2071066 3070264
Total
6943
14988
135
21
0
290315
79
131121
101414
23598
28
68436
2829
82407
0
(In tonnes)
HANDBOOK ON FISHERIES STATISTICS 2008
37
HANDBOOK ON FISHERIES STATISTICS 2008
36
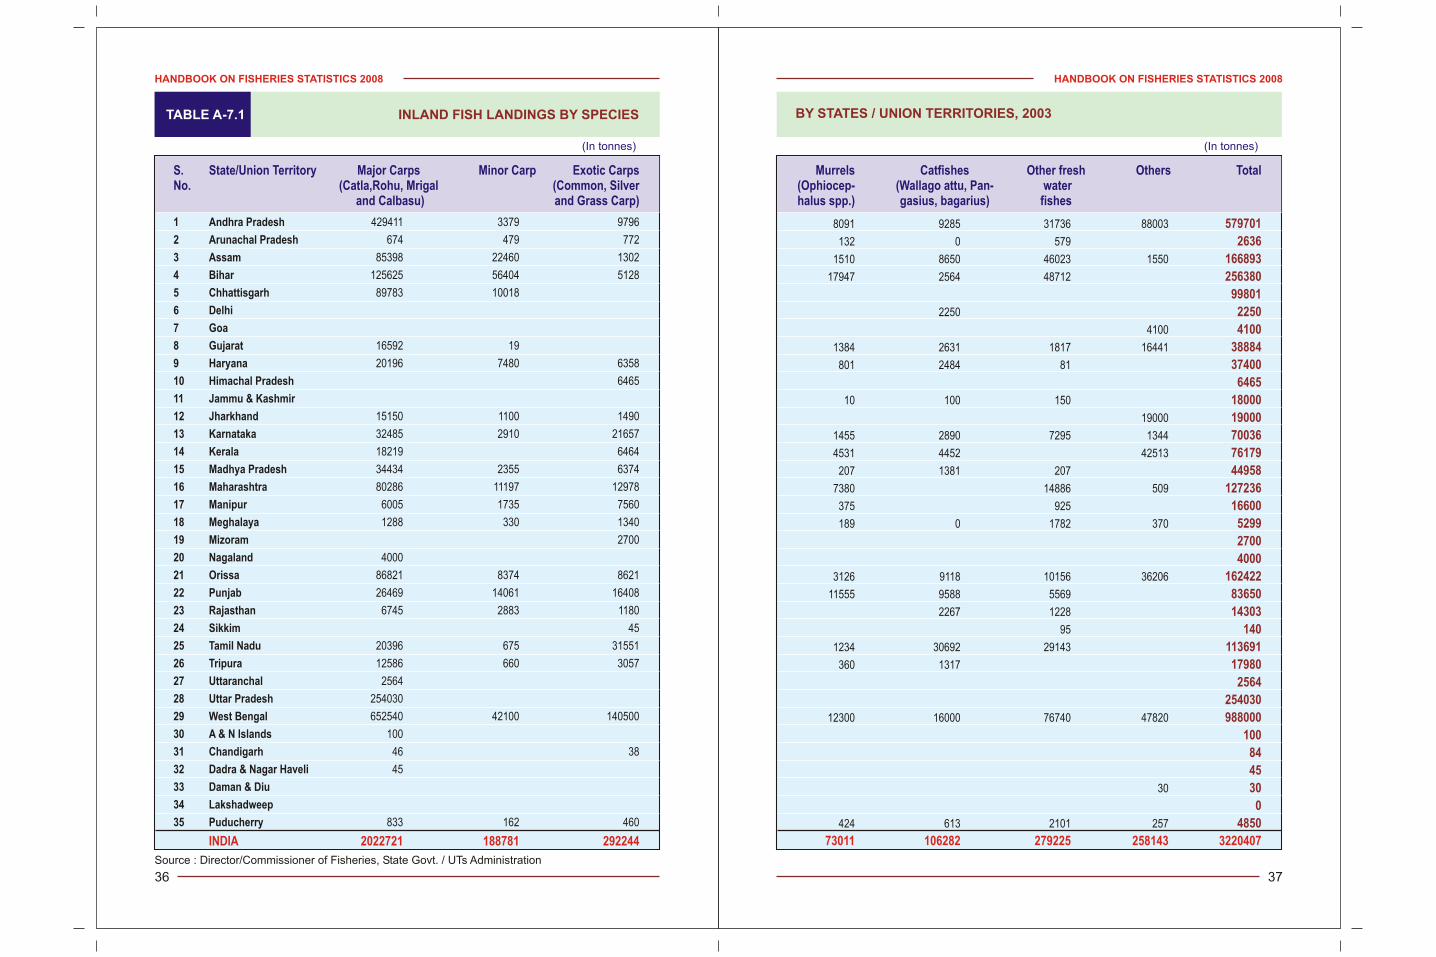
TABLE A-7.1 BY STATES / UNION TERRITORIES, 2003INLAND FISH LANDINGS BY SPECIES
(In tonnes)
Source : Director/Commissioner of Fisheries, State Govt. / UTs Administration
S. State/Union Territory Major Carps Minor Carp Exotic Carps No. (Catla,Rohu, Mrigal (Common, Silver
and Calbasu) and Grass Carp)
1 Andhra Pradesh 429411 3379 9796
2 Arunachal Pradesh 674 479 772
3 Assam 85398 22460 1302
4 Bihar 125625 56404 5128
5 Chhattisgarh 89783 10018
6 Delhi
7 Goa
8 Gujarat 16592 19
9 Haryana 20196 7480 6358
10 Himachal Pradesh 6465
11 Jammu & Kashmir
12 Jharkhand 15150 1100 1490
13 Karnataka 32485 2910 21657
14 Kerala 18219 6464
15 Madhya Pradesh 34434 2355 6374
16 Maharashtra 80286 11197 12978
17 Manipur 6005 1735 7560
18 Meghalaya 1288 330 1340
19 Mizoram 2700
20 Nagaland 4000
21 Orissa 86821 8374 8621
22 Punjab 26469 14061 16408
23 Rajasthan 6745 2883 1180
24 Sikkim 45
25 Tamil Nadu 20396 675 31551
26 Tripura 12586 660 3057
27 Uttaranchal 2564
28 Uttar Pradesh 254030
29 West Bengal 652540 42100 140500
30 A & N Islands 100
31 Chandigarh 46 38
32 Dadra & Nagar Haveli 45
33 Daman & Diu
34 Lakshadweep
35 Puducherry 833 162 460
INDIA 2022721 188781 292244
Murrels Catfishes Other fresh Others Total(Ophiocep- (Wallago attu, Pan- water halus spp.) gasius, bagarius) fishes
8091 9285 31736 88003
132 0 579
1510 8650 46023 1550
17947 2564 48712
2250
4100
1384 2631 1817 16441
801 2484 81
10 100 150
19000
1455 2890 7295 1344
4531 4452 42513
207 1381 207
7380 14886 509
375 925
189 0 1782 370
3126 9118 10156 36206
11555 9588 5569
2267 1228
95
1234 30692 29143
360 1317
12300 16000 76740 47820
30
424 613 2101 257
579701
2636
166893
256380
99801
2250
4100
38884
37400
6465
18000
19000
70036
76179
44958
127236
16600
5299
2700
4000
162422
83650
14303
140
113691
17980
2564
254030
988000
100
84
45
30
0
4850
73011 106282 279225 258143 3220407

(In tonnes)
HANDBOOK ON FISHERIES STATISTICS 2008
39
HANDBOOK ON FISHERIES STATISTICS 2008
38
TABLE A-7.2 BY STATES / UNION TERRITORIES, 2004INLAND FISH LANDINGS BY SPECIES
(In tonnes)
Source : Director/Commissioner of Fisheries, State Govt. / UTs Administration
S. State/Union Territory Major Carps Minor Carp Exotic Carps No. (Catla,Rohu, Mrigal (Common, Silver
and Calbasu) and Grass Carp)
1 Andhra Pradesh 385672 23236 67558
2 Arunachal Pradesh 2503 490 517
3 Assam 88078 17220 18710
4 Bihar 88584 43243 4840
5 Chhattisgarh 101127 16174 5552
6 Delhi 1110
7 Goa 3
8 Gujarat 29096 2063
9 Haryana 42243 12640 5450
10 Himachal Pradesh 3972
11 Jammu & Kashmir 3007 118 11536
12 Jharkhand 26375 860 1340
13 Karnataka 33678 4615 1124
14 Kerala 25643
15 Madhya Pradesh 52998 7978
16 Maharashtra 73034 16059 5520
17 Manipur 9678 5093 1591
18 Meghalaya 2576 783 972
19 Mizoram 3610
20 Nagaland 2987 1392 413
21 Orissa 116999 36312 14358
22 Punjab 93598 22765 6347
23 Rajasthan 6166 3632 150
24 Sikkim 45 45
25 Tamil Nadu 20396 6675 31551
26 Tripura 19053 50 511
27 Uttaranchal 3711
28 Uttar Pradesh 278770
29 West Bengal 798608 71500 145500
30 A & N Islands 100
31 Chandigarh 84 38
32 Dadra & Nagar Haveli 108
33 Daman & Diu
34 Lakshadweep
35 Puducherry 1079 330 558
INDIA 2314691 293228 324181
Murrels Catfishes Other fresh Others Total(Ophiocep- (Wallago attu, Pan- water halus spp.) gasius, bagarius) fishes
10592 10340 24165 77848
125 638
900 4600 26340 3912
16941 2420 25817
5553
219 4071
2730 838 1324 26916
905 2797
646
4439
25 45 10
2308 4615 1539 1300
4170 4783 42867
263 1777 128
7271 8032 1081
84 5182
133 1658 407
368
25 98 440
171 255 4930 19056
10264 9868 2579 476
2869 1865
95
1234 27692 13764
141 83
256
27707 522
5400 5000 42850 72612
55
286 508 810 372
599411
4273
159760
181845
128406
1110
4293
62967
64035
4618
19100
28655
49179
77463
63144
110997
21628
6529
3978
5355
192081
145897
14682
185
101312
19838
3967
306999
1141470
100
122
108
55
0
3943
63618 78990 190567 262230 3527505

(In tonnes)
HANDBOOK ON FISHERIES STATISTICS 2008
41
HANDBOOK ON FISHERIES STATISTICS 2008
40
TABLE A-7.3 BY STATES / UNION TERRITORIES, 2005INLAND FISH LANDINGS BY SPECIES
(In tonnes)
Source : Director/Commissioner of Fisheries, State Govt. / UTs Administration
S. State/Union Territory Major Carps Minor Carp Exotic Carps No. (Catla,Rohu, Mrigal (Common, Silver
and Calbasu) and Grass Carp)
1 Andhra Pradesh 323523 91662 108504
2 Arunachal Pradesh 670 490 780
3 Assam 68318 28022 19075
4 Bihar 126693 56884 5171
5 Chhattisgarh 94182 12558 18836
6 Delhi 1185 0 0
7 Goa 0 0 0
8 Gujarat 24381 71 0
9 Haryana 27080 10030 8525
10 Himachal Pradesh 1169 40 1298
11 Jammu & Kashmir 3018 119 11543
12 Jharkhand 31613 812 2395
13 Karnataka 56656 4956 37771
14 Kerala 18327 0 6508
15 Madhya Pradesh 49630 3306 9200
16 Maharashtra 85178 6760 13520
17 Manipur 2663 1333 14196
18 Meghalaya 1754 299 1731
19 Mizoram 4082 0 0
20 Nagaland 2286 108 2786
21 Orissa 127767 9390 18979
22 Punjab 22500 13660 18086
23 Rajasthan 8106 3913 1369
24 Sikkim 0 0 60
25 Tamil Nadu 20396 94 31551
26 Tripura 15516 2387 3581
27 Uttaranchal 2572 0 0
28 Uttar Pradesh 289575 0 0
29 West Bengal 714032 45181 151728
30 A & N Islands 33 0 2
31 Chandigarh 84 0 38
32 Dadra & Nagar Haveli 45 63 0
33 Daman & Diu 0 0 0
34 Lakshadweep 0 0 0
35 Puducherry 579 195 374
INDIA 2121041 292333 487607
Murrels Catfishes Other fresh Others Total(Ophiocep- (Wallago attu, Pan- water halus spp.) gasius, bagarius) fishes
12741 7177 10466 56310
0 125 638 0
11238 19182 45670 1240
18100 2586 49126 0
0 0 0
0 210 0 2132
0 0 0 0
2808 6998 1487 27518
1103 3412 0 0
232 4555 0 0
0 0 4470 0
55 65 30 0
2476 4956 12387 1398
4177 4795 0 43673
291 1973 298 0
8112 0 20282 1352
0 0 28
111 0 1606 50
0 0 0 0
19 81 220 0
2987 10647 12847 20071
11159 10763 9474 0
326 2600 2099 0
0 0 90 0
177 30692 15085 115143
0 1070 1317 0
0 0 0 0
0 0 0 0
17004 20254 72183 69620
8 12 14 0
0 0 0 0
0 0 0 0
0 0 0 69
0 0 0 0
191 189 1980 364
610383
2703
192745
258560
125576
2342
1185
63263
50150
7294
19150
34970
120600
77480
64698
135204
18220
5551
4082
5500
202688
85642
18413
150
213138
23871
2572
289575
1090002
69
122
108
69
0
3872
93315 132342 261797 338940 3727375

(In tonnes)
HANDBOOK ON FISHERIES STATISTICS 2008
43
HANDBOOK ON FISHERIES STATISTICS 2008
42
TABLE A-7.4 BY STATES / UNION TERRITORIES, 2006INLAND FISH LANDINGS BY SPECIES
(In tonnes)
Source : Director/Commissioner of Fisheries, State Govt. / UTs Administration
S. State/Union Territory Major Carps Minor Carp Exotic Carps No. (Catla,Rohu, Mrigal (Common, Silver
and Calbasu) and Grass Carp)
1 Andhra Pradesh 323523 91662 108504
2 Arunachal Pradesh 980 590 975
3 Assam 66455 26935 18760
4 Bihar 118569 53236 4839
5 Chhattisgarh 96805 12907 19361
6 Delhi 1185 0 0
7 Goa 0 0 0
8 Gujarat 25109 213 0
9 Haryana 27080 10030 8525
10 Himachal Pradesh 6840 0 0
11 Jammu & Kashmir 3018 119 11543
12 Jharkhand 49809 1005 3040
13 Karnataka 56656 4956 37771
14 Kerala 19548 0 6995
15 Madhya Pradesh 49891 3324 9248
16 Maharashtra 83064 13580 11603
17 Manipur 2773 1379 14348
18 Meghalaya 1569 374 1469
19 Mizoram 4152 0 0
20 Nagaland 2286 108 2786
21 Orissa 133516 9812 19833
22 Punjab 21987 14179 17573
23 Rajasthan 8106 3913 1369
24 Sikkim 0 0 60
25 Tamil Nadu 21313 98 32971
26 Tripura 18612 2864 4296
27 Uttaranchal 3003 0 0
28 Uttar Pradesh 306728 0 0
29 West Bengal 714032 45181 151728
30 A & N Islands 37 0 1
31 Chandigarh 84 0 38
32 Dadra & Nagar Haveli 108 0 0
33 Daman & Diu 0 0 0
34 Lakshadweep 0 0 0
35 Puducherry 874 205 820
INDIA 2164709 296670 488456
Murrels Catfishes Other fresh Others Total(Ophiocep- (Wallago attu, Pan- water halus spp.) gasius, bagarius) fishes
12741 7177 10466 56310
0 225 0 0
10720 18330 43980 950
16939 2420 45977 0
0 0 0 0
0 0 0 0
0 195 0 2248
3659 7167 1350 35010
1103 3412 0 0
0 0 0 47
0 0 4470 0
70 95 61 0
2476 4956 12387 1398
4372 5024 0 16319
293 1983 299 0
7646 0 15427 527
0 0 43 0
124 0 1452 71
0 0 0 0
19 81 220 0
3121 11126 13425 20973
11679 11283 9996 0
326 2600 2099 0
0 0 90 0
185 32073 15763 120324
0 1420 1442 0
0 0 0 0
0 0 0 0
17004 20254 72183 69620
9 15 21 0
0 0 0 0
0 0 0 0
0 0 0 64
0 0 0 0
188 191 2632 556
610383
2770
186130
241980
129073
1185
2443
72508
50150
6887
19150
54080
120600
52258
65038
131847
18543
5059
4152
5500
211806
86697
18413
150
222727
28634
3003
306728
1090002
83
122
108
64
0
5466
92674 130027 253783 324417 3750736
(In tonnes)
HANDBOOK ON FISHERIES STATISTICS 2008
45
HANDBOOK ON FISHERIES STATISTICS 2008
44
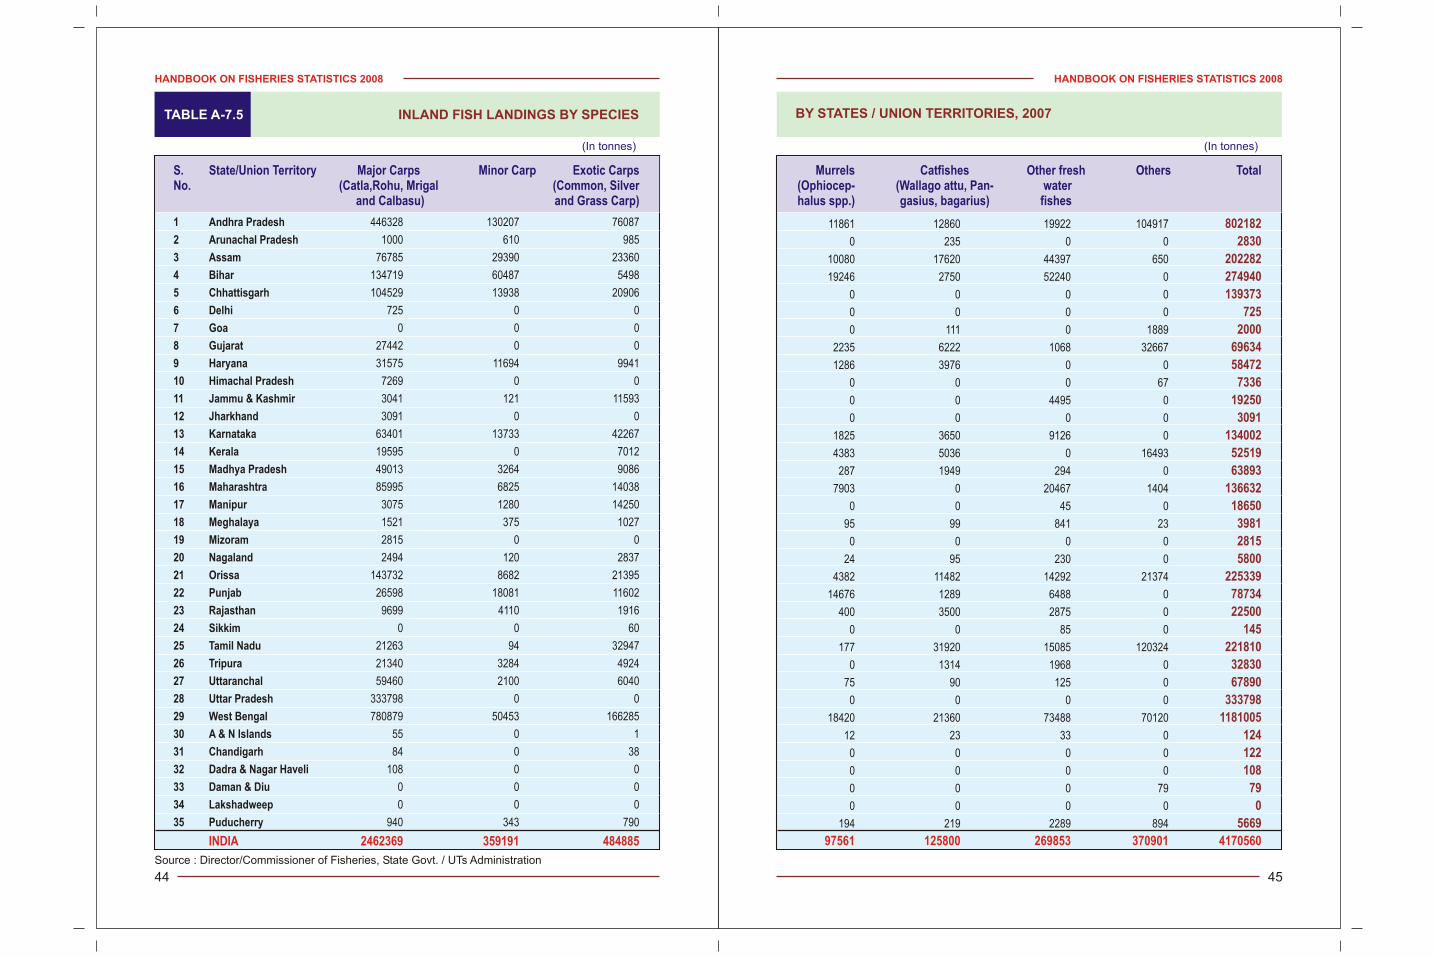
TABLE A-7.5 BY STATES / UNION TERRITORIES, 2007INLAND FISH LANDINGS BY SPECIES
(In tonnes)
Source : Director/Commissioner of Fisheries, State Govt. / UTs Administration
S. State/Union Territory Major Carps Minor Carp Exotic Carps No. (Catla,Rohu, Mrigal (Common, Silver
and Calbasu) and Grass Carp)
1 Andhra Pradesh 446328 130207 76087
2 Arunachal Pradesh 1000 610 985
3 Assam 76785 29390 23360
4 Bihar 134719 60487 5498
5 Chhattisgarh 104529 13938 20906
6 Delhi 725 0 0
7 Goa 0 0 0
8 Gujarat 27442 0 0
9 Haryana 31575 11694 9941
10 Himachal Pradesh 7269 0 0
11 Jammu & Kashmir 3041 121 11593
12 Jharkhand 3091 0 0
13 Karnataka 63401 13733 42267
14 Kerala 19595 0 7012
15 Madhya Pradesh 49013 3264 9086
16 Maharashtra 85995 6825 14038
17 Manipur 3075 1280 14250
18 Meghalaya 1521 375 1027
19 Mizoram 2815 0 0
20 Nagaland 2494 120 2837
21 Orissa 143732 8682 21395
22 Punjab 26598 18081 11602
23 Rajasthan 9699 4110 1916
24 Sikkim 0 0 60
25 Tamil Nadu 21263 94 32947
26 Tripura 21340 3284 4924
27 Uttaranchal 59460 2100 6040
28 Uttar Pradesh 333798 0 0
29 West Bengal 780879 50453 166285
30 A & N Islands 55 0 1
31 Chandigarh 84 0 38
32 Dadra & Nagar Haveli 108 0 0
33 Daman & Diu 0 0 0
34 Lakshadweep 0 0 0
35 Puducherry 940 343 790
INDIA 2462369 359191 484885
Murrels Catfishes Other fresh Others Total(Ophiocep- (Wallago attu, Pan- water halus spp.) gasius, bagarius) fishes
11861 12860 19922 104917
0 235 0 0
10080 17620 44397 650
19246 2750 52240 0
0 0 0 0
0 0 0 0
0 111 0 1889
2235 6222 1068 32667
1286 3976 0 0
0 0 0 67
0 0 4495 0
0 0 0 0
1825 3650 9126 0
4383 5036 0 16493
287 1949 294 0
7903 0 20467 1404
0 0 45 0
95 99 841 23
0 0 0 0
24 95 230 0
4382 11482 14292 21374
14676 1289 6488 0
400 3500 2875 0
0 0 85 0
177 31920 15085 120324
0 1314 1968 0
75 90 125 0
0 0 0 0
18420 21360 73488 70120
12 23 33 0
0 0 0 0
0 0 0 0
0 0 0 79
0 0 0 0
194 219 2289 894
802182
2830
202282
274940
139373
725
2000
69634
58472
7336
19250
3091
134002
52519
63893
136632
18650
3981
2815
5800
225339
78734
22500
145
221810
32830
67890
333798
1181005
124
122
108
79
0
5669
97561 125800 269853 370901 4170560
HANDBOOK ON FISHERIES STATISTICS 2008
47
HANDBOOK ON FISHERIES STATISTICS 2008
46
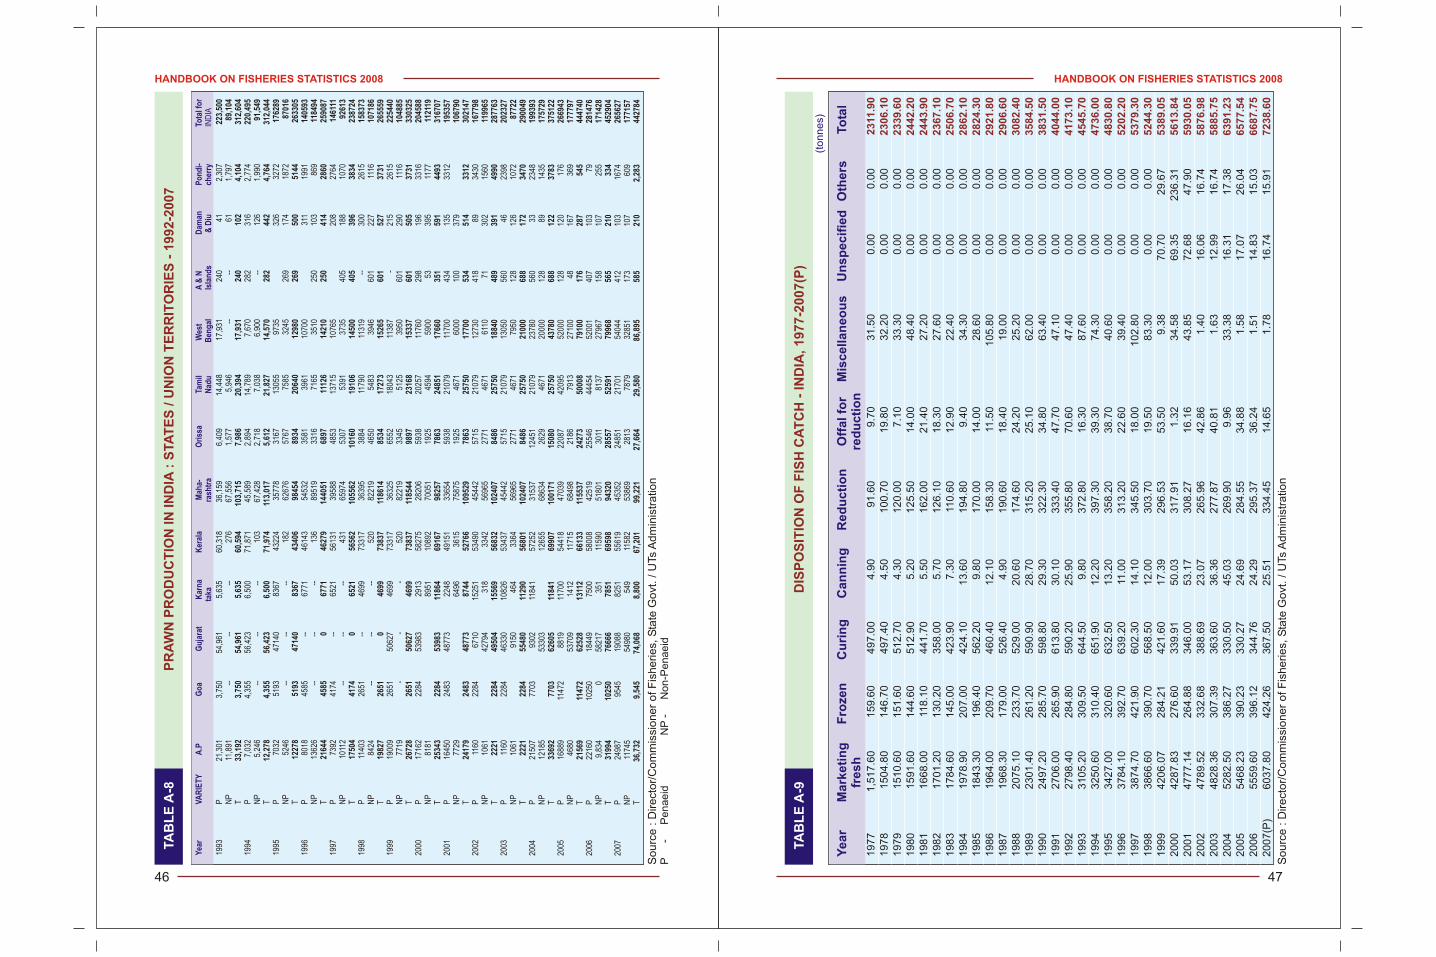
TA
BL
E A
-8
PR
AW
N P
RO
DU
CT
ION
IN
IN
DIA
: S
TA
TE
S / U
NIO
N T
ER
RIT
OR
IES
- 1
992-2
007
TA
BL
E A
-9D
ISP
OS
ITIO
N O
F F
ISH
CA
TC
H -
IN
DIA
, 1977-2
007(P
)
(t
onnes)
Yea
rVA
RIE
TY
A.P
Go
a G
uja
rat
Kar
na
Ker
ala
Mah
a-
Ori
ssa
Tam
il
Wes
t A
& N
D
aman
Po
nd
i-To
tal f
or
taka
ra
shtr
aN
adu
Ben
gal
Is
lan
ds
& D
iu
cher
ryIN
DIA
1993
P21
,301
3,75
054
,961
5,63
560
,318
36,1
596,
409
14,4
4817
,931
240
412,
307
223,
500
NP
11,8
91--
----
276
67,5
561,
577
5,94
6--
--61
1,79
789
,104
T33
,192
3,75
054
,961
5,63
560
,594
103,
715
7,98
620
,394
17,9
3124
010
24,
104
312,
604
1994
P7,
032
4,35
556
,423
6,50
071
,871
45,5
892,
894
14,7
897,
670
282
316
2,77
422
0,49
5N
P5,
246
----
--10
367
,428
2,71
87,
038
6,90
0--
126
1,99
091
,549
T12
,278
4,35
556
,423
6,50
071
,974
113,
017
5,61
221
,827
14,5
7028
244
24,
764
312,
044
1995
P70
3251
9347
140
8367
4322
435
778
3167
1305
597
3532
632
7217
6289
NP
5246
----
--18
262
676
5767
7585
3245
269
174
1872
8701
6T
1227
851
9347
140
8367
4340
698
454
8934
2064
012
980
269
500
5144
2633
0519
96P
8018
4585
--67
7146
143
5453
235
8139
6110
700
311
1991
1405
93N
P13
626
----
--13
689
519
3316
7165
3510
250
103
869
1184
94T
2164
445
850
6771
4627
914
4051
6897
1112
614
210
250
414
2860
2590
8719
97P
7392
4174
--65
2156
131
3958
848
5313
715
1076
520
827
6414
6111
NP
1011
2--
----
431
6597
453
0753
9137
3540
518
810
7092
613
T17
504
4174
065
2156
562
1055
6210
160
1910
614
500
405
396
3834
2387
2419
98P
1140
326
51--
4699
7331
736
395
3884
1179
011
319
--30
026
1515
8373
NP
8424
----
--52
082
219
4650
5483
3946
601
227
1116
1071
86T
1982
726
510
4699
7383
711
8614
8534
1727
315
265
601
527
3731
2655
5919
99P
1900
926
5150
627
4699
7331
736
325
6552
1804
311
387
-21
526
1522
5440
NP
7719
--
-52
082
219
3345
5125
3950
601
290
1116
1048
85T
2672
826
5150
627
4699
7383
711
8544
9897
2316
815
337
601
505
3731
3303
2520
00P
1716
222
8453
983
2913
5827
528
206
5938
2025
711
760
298
196
3316
2045
88N
P81
8189
5110
892
7005
119
2545
9459
0053
395
1177
1121
19T
2534
322
8453
983
1186
469
167
9825
778
6324
851
1766
035
159
144
9331
6707
2001
P16
450
2483
4877
322
4849
151
3365
459
3821
079
1170
043
413
533
1219
5357
NP
7729
6496
3615
7587
519
2546
7160
0010
037
910
6790
T24
179
2483
4877
387
4452
766
1095
2978
6325
750
1770
053
451
433
1230
2147
2002
P11
6022
8467
1015
251
5349
045
442
5715
2107
912
730
418
8934
3016
7798
NP
1061
4279
431
833
4256
965
2771
4671
6110
7130
215
6011
9965
T22
2122
8449
504
1556
956
832
1024
0784
8625
750
1884
048
939
149
9028
7763
2003
P11
6022
8446
330
1082
653
437
4544
257
1521
079
1305
056
046
2398
2023
27N
P10
6191
5046
433
6456
965
2771
4671
7950
128
126
1072
8772
2T
2221
2284
5548
011
290
5680
110
2407
8486
2575
021
000
688
172
3470
2900
4920
04P
2150
777
0393
0211
841
5725
231
537
1245
121
079
2378
056
033
2348
1993
93N
P12
185
5330
312
655
6863
426
2946
7120
000
128
8914
3517
5729
T33
692
7703
6260
511
841
6990
710
0171
1508
025
750
4378
068
812
237
8337
5122
2005
P16
889
1147
288
1911
700
5441
847
039
2208
742
095
5200
012
812
017
626
6943
NP
4680
5370
914
1211
715
6849
821
8679
1327
100
4816
736
917
7797
T21
569
1147
262
528
1311
266
133
1155
3724
273
5000
879
100
176
287
545
4447
4020
06P
2216
010
250
1844
975
0058
008
4251
925
546
4445
452
001
407
103
7928
1476
NP
9,83
40
5821
735
111
590
5180
130
1181
3727
967
158
107
255
1714
28T
3199
410
250
7666
678
5169
598
9432
028
557
5259
179
968
565
210
334
4529
0420
07P
2498
795
4519
088
8251
5561
945
352
2485
121
701
5404
441
210
316
7426
5627
NP
1174
554
980
549
1158
253
869
2813
7879
3285
117
310
760
917
7157
T36
,732
9,54
574
,068
8,80
067
,201
99,2
2127
,664
29,5
8086
,895
585
210
2,28
344
2784
Sourc
e : D
irect
or/
Com
mis
sioner
of F
isheries,
Sta
te G
ovt
. / U
Ts A
dm
inis
tra
tion
P -
P
enaeid
N
P -
N
on-P
enaeid
1977
1,5
17.6
0159.6
0497.0
04.9
091.6
09.7
031.5
00.0
00.0
01978
1504.8
0146.7
0497.4
04.5
0100.7
019.8
032.2
00.0
00.0
01979
1510.6
0151.6
0512.7
04.3
0120.0
07.1
033.3
00.0
00.0
01980
1591.6
0144.6
0512.9
05.2
0125.5
014.0
048.4
00.0
00.0
01981
1668.0
011
8.1
0441.7
05.5
0162.0
021.4
027.2
00.0
00.0
01982
1701.2
0130.2
0358.0
05.7
0126.1
018.3
027.6
00.0
00.0
01983
1784.6
0145.0
0423.9
07.3
011
0.6
012.9
022.4
00.0
00.0
01984
1978.9
0207.0
0424.1
013.6
0194.8
09.4
034.3
00.0
00.0
01985
1843.3
0196.4
0562.2
09.8
0170.0
014.0
028.6
00.0
00.0
01986
1964.0
0209.7
0460.4
012.1
0158.3
011
.50
105.8
00.0
00.0
01987
1968.3
0179.0
0526.4
04.9
0190.6
018.4
019.0
00.0
00.0
01988
2075.1
0233.7
0529.0
020.6
0174.6
024.2
025.2
00.0
00.0
01989
2301.4
0261.2
0590.9
028.7
0315.2
025.1
062.0
00.0
00.0
01990
2497.2
0285.7
0598.8
029.3
0322.3
034.8
063.4
00.0
00.0
01991
2706.0
0265.9
0613.8
030.1
0333.4
047.7
047.1
00.0
00.0
01992
2798.4
0284.8
0590.2
025.9
0355.8
070.6
047.4
00.0
00.0
01993
3105.2
0309.5
0644.5
09.8
0372.8
016.3
087.6
00.0
00.0
01994
3250.6
0310.4
0651.9
012.2
0397.3
039.3
074.3
00.0
00.0
01995
3427.0
0320.6
0632.5
013.2
0358.2
038.7
040.6
00.0
00.0
01996
3784.1
0392.7
0639.2
011
.00
313.2
022.6
039.4
00.0
00.0
01997
3874.7
0421.9
0602.3
014.1
0345.5
018.0
0102.8
00.0
00.0
01998
3866.6
0390.7
0568.5
012.0
0303.7
019.5
083.3
00.0
00.0
01999
4206.0
7284.2
1421.6
017.3
9296.5
353.5
09.3
870.7
029.6
72000
4287.8
3276.6
0339.9
150.0
3317.9
11.3
234.5
869.3
5236.3
12001
4777.1
4264.8
8346.0
053.1
7308.2
716.1
643.8
572.6
847.9
02002
4789.5
2332.6
8388.6
923.0
7265.9
642.8
61.4
016.0
616.7
42003
4828.3
6307.3
9363.6
036.3
6277.8
740.8
11.6
312.9
916.7
42004
5282.5
0386.2
7330.5
045.0
3269.9
09.9
633.3
816.3
117.3
82005
5468.2
3390.2
3330.2
724.6
9284.5
534.8
81.5
817.0
726.0
42006
5559.6
0396.1
2344.7
624.2
9295.3
736.2
41.5
114.8
315.0
32007(P
)6037.8
0424.2
6367.5
025.5
1334.4
514.6
51.7
816.7
415.9
1
Year
Mark
eti
ng
F
roze
nC
uri
ng
Ca
nn
ing
Re
du
cti
on
Off
al fo
r M
isc
ella
ne
ou
sU
nsp
ecif
ied
Oth
ers
To
tal
fresh
red
uc
tio
n2311.9
02306.1
02339.6
02442.2
02443.9
02367.1
02506.7
02862.1
02824.3
02921.8
02906.6
03082.4
03584.5
03831.5
04044.0
04173.1
04545.7
04736.0
04830.8
05202.2
05379.3
05244.3
05389.0
55613.8
45930.0
55876.9
85885.7
56391.2
36577.5
46687.7
57238.6
0
Sourc
e : D
irect
or/
Com
mis
sioner
of F
isheries,
Sta
te G
ovt
. / U
Ts A
dm
inis
tra
tion
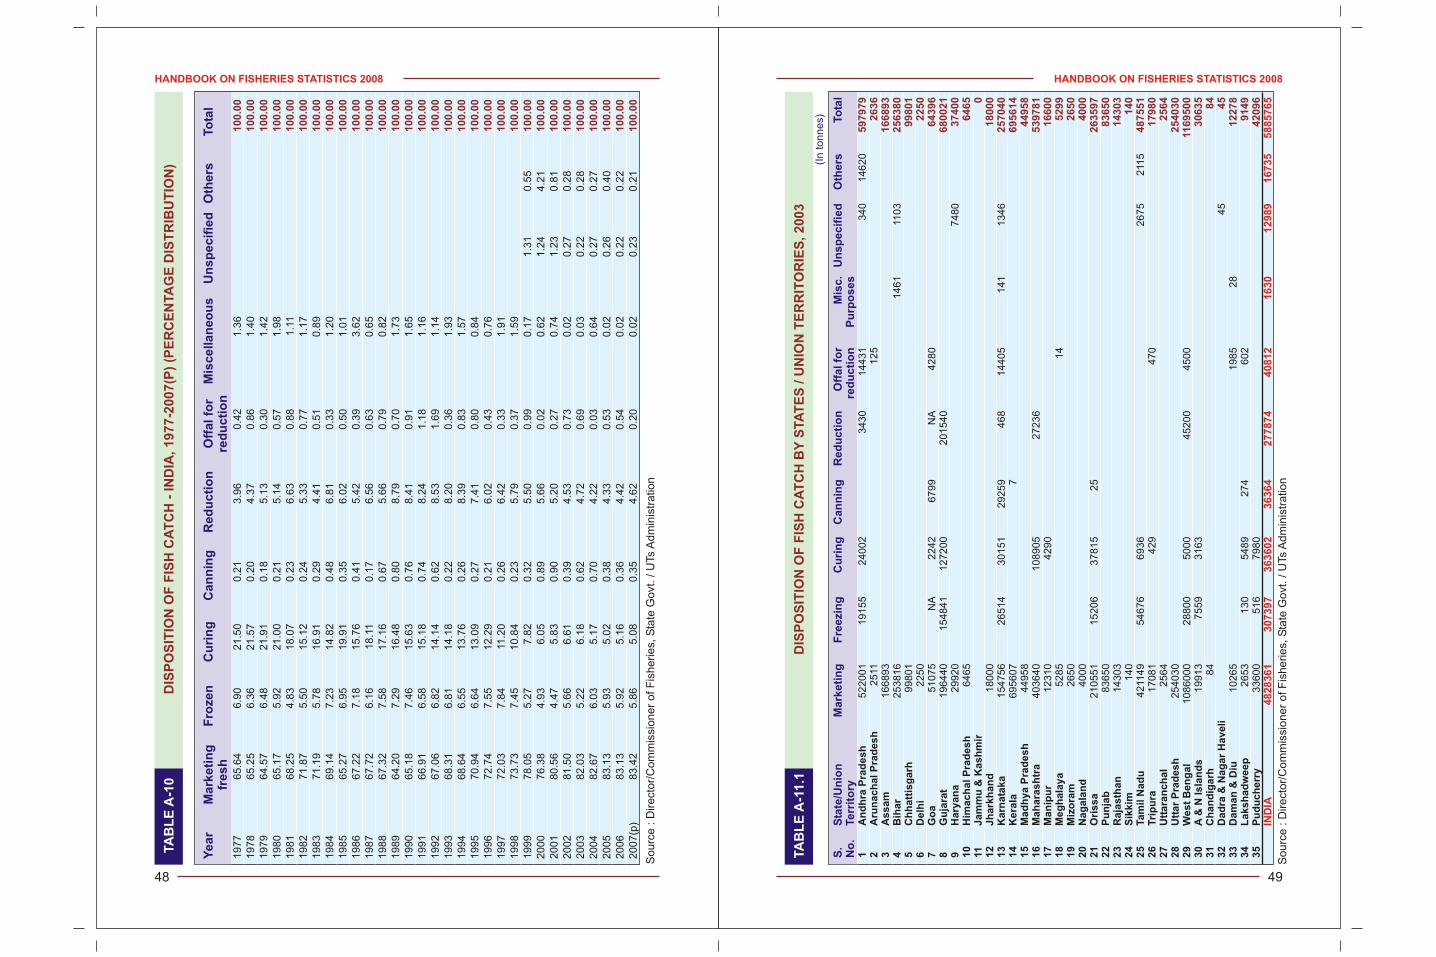
HANDBOOK ON FISHERIES STATISTICS 2008
49
HANDBOOK ON FISHERIES STATISTICS 2008
48
TA
BL
E A
-11
.1D
ISP
OS
ITIO
N O
F F
ISH
CA
TC
H B
Y S
TA
TE
S / U
NIO
N T
ER
RIT
OR
IES
, 2003
(I
n tonnes)
Sourc
e : D
irect
or/
Com
mis
sioner
of F
isheries,
Sta
te G
ovt
. / U
Ts A
dm
inis
tra
tion
TA
BL
E A
-10
DIS
PO
SIT
ION
OF
FIS
H C
AT
CH
- IN
DIA
, 1977-2
007(P
) (P
ER
CE
NTA
GE
DIS
TR
IBU
TIO
N)
1977
65.6
46.9
021.5
00.2
13.9
60.4
21.3
61978
65.2
56.3
621.5
70.2
04.3
70.8
61.4
01979
64.5
76.4
821.9
10.1
85.1
30.3
01.4
21980
65.1
75.9
221.0
00.2
15.1
40.5
71.9
81981
68.2
54.8
318.0
70.2
36.6
30.8
81.1
11982
71.8
75.5
015.1
20.2
45.3
30.7
71.1
71983
71.1
95.7
816.9
10.2
94.4
10.5
10.8
91984
69.1
47.2
314.8
20.4
86.8
10.3
31.2
01985
65.2
76.9
519.9
10.3
56.0
20.5
01.0
11986
67.2
27.1
815.7
60.4
15.4
20.3
93.6
21987
67.7
26.1
618.1
10.1
76.5
60.6
30.6
51988
67.3
27.5
817.1
60.6
75.6
60.7
90.8
21989
64.2
07.2
916.4
80.8
08.7
90.7
01.7
31990
65.1
87.4
615.6
30.7
68.4
10.9
11.6
51991
66.9
16.5
815.1
80.7
48.2
41.1
81.1
61992
67.0
66.8
214.1
40.6
28.5
31.6
91.1
41993
68.3
16.8
114.1
80.2
28.2
00.3
61.9
31994
68.6
46.5
513.7
60.2
68.3
90.8
31.5
71995
70.9
46.6
413.0
90.2
77.4
10.8
00.8
41996
72.7
47.5
512.2
90.2
16.0
20.4
30.7
61997
72.0
37.8
411
.20
0.2
66.4
20.3
31.9
11998
73.7
37.4
510.8
40.2
35.7
90.3
71.5
91999
78.0
55.2
77.8
20.3
25.5
00.9
90.1
71.3
10.5
52000
76.3
84.9
36.0
50.8
95.6
60.0
20.6
21.2
44.2
12001
80.5
64.4
75.8
30.9
05.2
00.2
70.7
41.2
30.8
12002
81.5
05.6
66.6
10.3
94.5
30.7
30.0
20.2
70.2
82003
82.0
35.2
26.1
80.6
24.7
20.6
90.0
30.2
20.2
82004
82.6
76.0
35.1
70.7
04.2
20.0
30.6
40.2
70.2
72005
83.1
35.9
35.0
20.3
84.3
30.5
30.0
20.2
60.4
02006
83.1
35.9
25.1
60.3
64.4
20.5
40.0
20.2
20.2
22007(p
)83.4
25.8
65.0
80.3
54.6
20.2
00.0
20.2
30.2
1
Year
Mark
eti
ng
F
roze
nC
uri
ng
Ca
nn
ing
Re
du
cti
on
Off
al fo
r M
isc
ella
ne
ou
sU
nsp
ecif
ied
Oth
ers
To
tal
fresh
red
uc
tio
n100.0
0100.0
0100.0
0100.0
0100.0
0100.0
0100.0
0100.0
0100.0
0100.0
0100.0
0100.0
0100.0
0100.0
0100.0
0100.0
0100.0
0100.0
0100.0
0100.0
0100.0
0100.0
0100.0
0100.0
0100.0
0100.0
0100.0
0100.0
0100.0
0100.0
0100.0
0
Sourc
e : D
irect
or/
Com
mis
sioner
of F
isheries,
Sta
te G
ovt
. / U
Ts A
dm
inis
tra
tion
1A
nd
hra
Pra
desh
522001
19155
24002
3430
14431
340
14620
2A
run
ach
al P
rad
esh
2511
125
3A
ssam
166893
4B
ihar
253816
1461
1103
5C
hh
att
isg
arh
99801
6D
elh
i2250
7G
oa
51075
NA
2242
6799
NA
4280
8G
uja
rat
196440
154841
127200
201540
9H
ary
an
a29920
7480
10
Him
ach
al P
rad
esh
6465
11
Jam
mu
& K
ash
mir
12
Jh
ark
han
d18000
13
Karn
ata
ka
154756
26514
30151
29259
468
14405
141
1346
14
Kera
la695607
715
Mad
hya P
rad
esh
44958
16
Mah
ara
sh
tra
403640
108905
27236
17
Man
ipu
r12310
4290
18
Meg
hala
ya
5285
14
19
Miz
ora
m2650
20
Nag
ala
nd
4000
21
Ori
ssa
210551
15206
37815
25
22
Pu
nja
b83650
23
Raja
sth
an
14303
24
Sik
kim
140
25
Tam
il N
ad
u4211
49
54676
6936
2675
211
526
Tri
pu
ra17081
429
470
27
Utt
ara
nch
al
2564
28
Utt
ar
Pra
desh
254030
29
West
Ben
gal
1086000
28800
5000
45200
4500
30
A &
N Isla
nd
s19913
7559
3163
31
Ch
an
dig
arh
84
32
Dad
ra &
Nag
ar
Haveli
45
33
Dam
an
& D
iu10265
1985
28
34
Laksh
ad
weep
2653
130
5489
274
602
35
Pu
du
ch
err
y33600
516
7980
S.
Sta
te/U
nio
nM
ark
eti
ng
F
reezi
ng
C
uri
ng
C
an
nin
g
Re
du
cti
on
Off
al
for
Mis
c.
Un
sp
ec
ifie
dO
the
rs T
ota
l N
o.
Terr
ito
ryre
du
cti
on
Pu
rpo
se
s597979
2636
166893
256380
99801
2250
64396
680021
37400
6465 0
18000
257040
695614
44958
539781
16600
5299
2650
4000
263597
83650
14303
140
487551
17980
2564
254030
1169500
30635
84
45
12278
9149
42096
IND
IA4828361
307397
363602
36364
277874
40812
1630
12989
16735
5885765
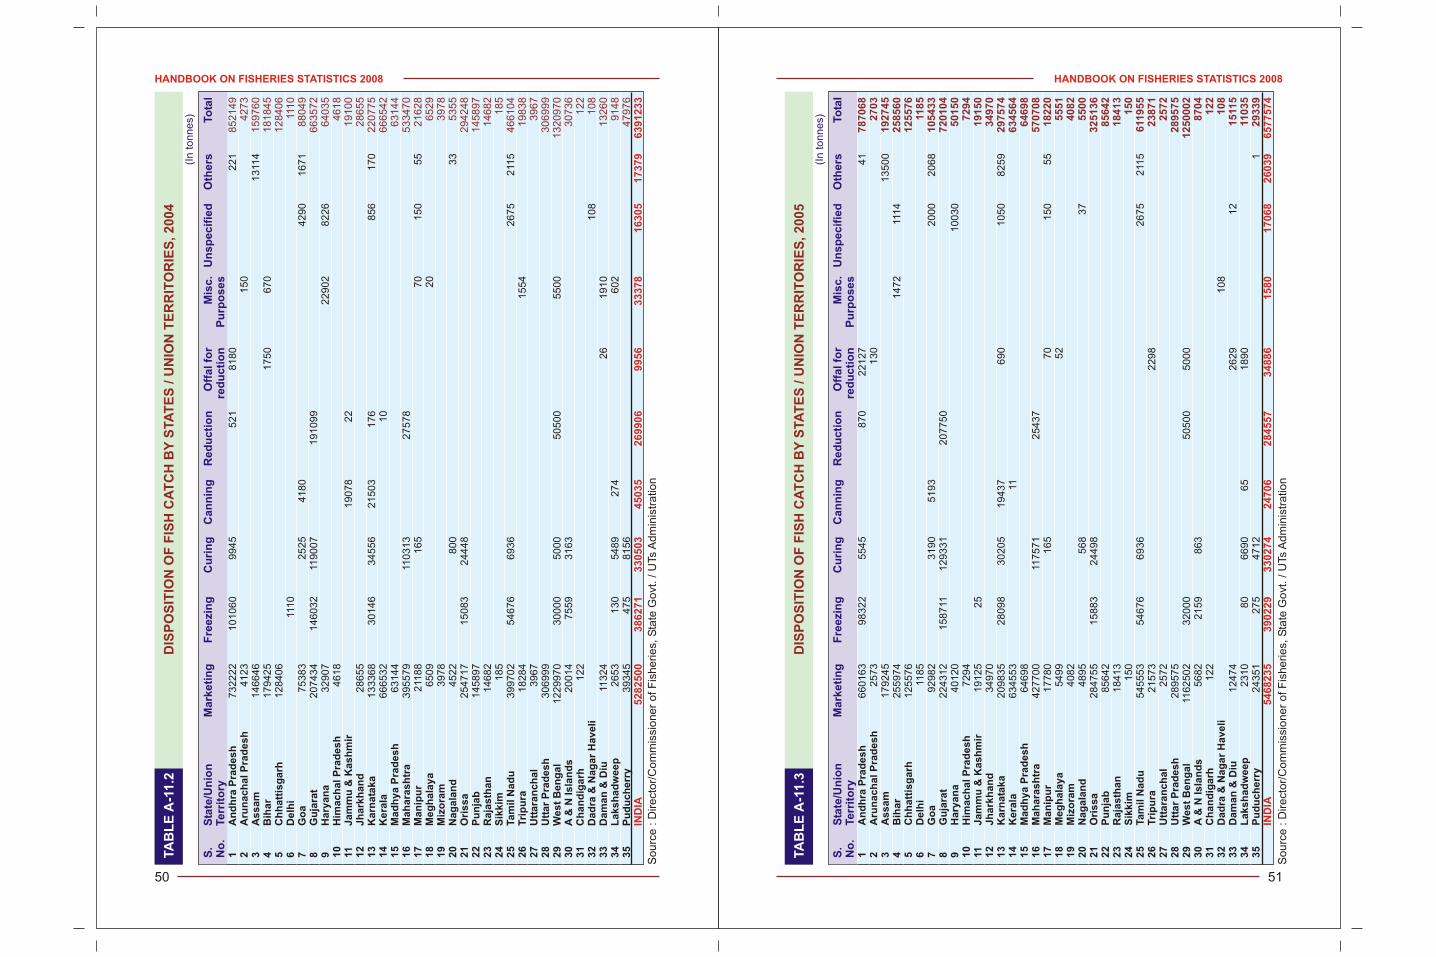
HANDBOOK ON FISHERIES STATISTICS 2008
51
HANDBOOK ON FISHERIES STATISTICS 2008
50
TA
BL
E A
-11
.3D
ISP
OS
ITIO
N O
F F
ISH
CA
TC
H B
Y S
TA
TE
S / U
NIO
N T
ER
RIT
OR
IES
, 2005
(I
n tonnes)
Sourc
e : D
irect
or/
Com
mis
sioner
of F
isheries,
Sta
te G
ovt
. / U
Ts A
dm
inis
tra
tion
1A
nd
hra
Pra
desh
660163
98322
5545
870
22127
41
2A
run
ach
al P
rad
esh
2573
130
3A
ssam
179245
13500
4B
ihar
255974
1472
1114
5C
hh
att
isg
arh
125576
6D
elh
i11
85
7G
oa
92982
3190
5193
2000
2068
8G
uja
rat
224312
158711
129331
207750
9H
ary
an
a40120
10030
10
Him
ach
al P
rad
esh
7294
11
Jam
mu
& K
ash
mir
19125
25
12
Jh
ark
han
d34970
13
Karn
ata
ka
209835
28098
30205
19437
690
1050
8259
14
Kera
la634553
1115
Mad
hya P
rad
esh
64698
16
Mah
ara
sh
tra
427700
117571
25437
17
Man
ipu
r17780
165
70
150
55
18
Meg
hala
ya
5499
52
19
Miz
ora
m4082
20
Nag
ala
nd
4895
568
37
21
Ori
ssa
284755
15883
24498
22
Pu
nja
b85642
23
Raja
sth
an
18413
24
Sik
kim
150
25
Tam
il N
ad
u545553
54676
6936
2675
211
526
Tri
pu
ra21573
2298
27
Utt
ara
nch
al
2572
28
Utt
ar
Pra
desh
289575
29
West
Ben
gal
1162502
32000
50500
5000
30
A &
N Isla
nd
s5682
2159
863
31
Ch
an
dig
arh
122
32
Dad
ra &
Nag
ar
Haveli
108
33
Dam
an
& D
iu12474
2629
12
34
Laksh
ad
weep
2310
80
6690
65
1890
35
Pu
du
ch
err
y24351
275
4712
1
S.
Sta
te/U
nio
nM
ark
eti
ng
F
reezi
ng
C
uri
ng
C
an
nin
g
Re
du
cti
on
Off
al
for
Mis
c.
Un
sp
ec
ifie
dO
the
rs T
ota
l N
o.
Terr
ito
ryre
du
cti
on
Pu
rpo
se
s787068
2703
192745
258560
125576
1185
105433
720104
50150
7294
19150
34970
297574
634564
64698
570708
18220
5551
4082
5500
325136
85642
18413
150
611955
23871
2572
289575
1250002
8704
122
108
15115
11035
29339
IND
IA5468235
390229
330274
24706
284557
34886
1580
17068
26039
6577574
TA
BL
E A
-11
.2D
ISP
OS
ITIO
N O
F F
ISH
CA
TC
H B
Y S
TA
TE
S / U
NIO
N T
ER
RIT
OR
IES
, 2004
(I
n tonnes)
Sourc
e : D
irect
or/
Com
mis
sioner
of F
isheries,
Sta
te G
ovt
. / U
Ts A
dm
inis
tra
tion
1A
nd
hra
Pra
desh
732222
101060
9945
521
8180
221
2A
run
ach
al P
rad
esh
4123
150
3A
ssam
146646
1311
44
Bih
ar
179425
1750
670
5C
hh
att
isg
arh
128406
6D
elh
i11
10
7G
oa
75383
2525
4180
4290
1671
8G
uja
rat
207434
146032
119007
191099
9H
ary
an
a32907
22902
8226
10
Him
ach
al P
rad
esh
4618
11
Jam
mu
& K
ash
mir
19078
22
12
Jh
ark
han
d28655
13
Karn
ata
ka
133368
30146
34556
21503
176
856
170
14
Kera
la666532
10
15
Mad
hya P
rad
esh
63144
16
Mah
ara
sh
tra
395579
110313
27578
17
Man
ipu
r211
88
165
70
150
55
18
Meg
hala
ya
6509
20
19
Miz
ora
m3978
20
Nag
ala
nd
4522
800
33
21
Ori
ssa
254717
15083
24448
22
Pu
nja
b145897
23
Raja
sth
an
14682
24
Sik
kim
185
25
Tam
il N
ad
u399702
54676
6936
2675
211
526
Tri
pu
ra18284
1554
27
Utt
ara
nch
al
3967
28
Utt
ar
Pra
desh
306999
29
West
Ben
gal
1229970
30000
5000
50500
5500
30
A &
N Isla
nd
s20014
7559
3163
31
Ch
an
dig
arh
122
32
Dad
ra &
Nag
ar
Haveli
108
33
Dam
an
& D
iu11
324
26
1910
34
Laksh
ad
weep
2653
130
5489
274
602
35
Pu
du
ch
err
y39345
475
8156
S.
Sta
te/U
nio
nM
ark
eti
ng
F
reezi
ng
C
uri
ng
C
an
nin
g
Red
ucti
on
Off
al fo
r M
isc.
Un
sp
ecif
ied
Oth
ers
To
tal
No
.Terr
ito
ryre
du
cti
on
Pu
rpo
ses
852149
4273
159760
181845
128406
111
08
80
49
66
35
72
64
03
54
61
81
91
00
28
65
52
20
77
56
66
54
26
31
44
53
34
70
21
62
86
52
93
97
85
35
52
94
24
81
45
89
71
46
82
18
54
66
10
41
98
38
39
67
30
69
99
13
20
97
03
07
36
12
21
08
13
26
09
14
84
79
76
IND
IA5
28
25
00
38
62
71
33
05
03
45
03
52
69
90
69
95
63
33
78
16
30
51
73
79
63
91
23
3
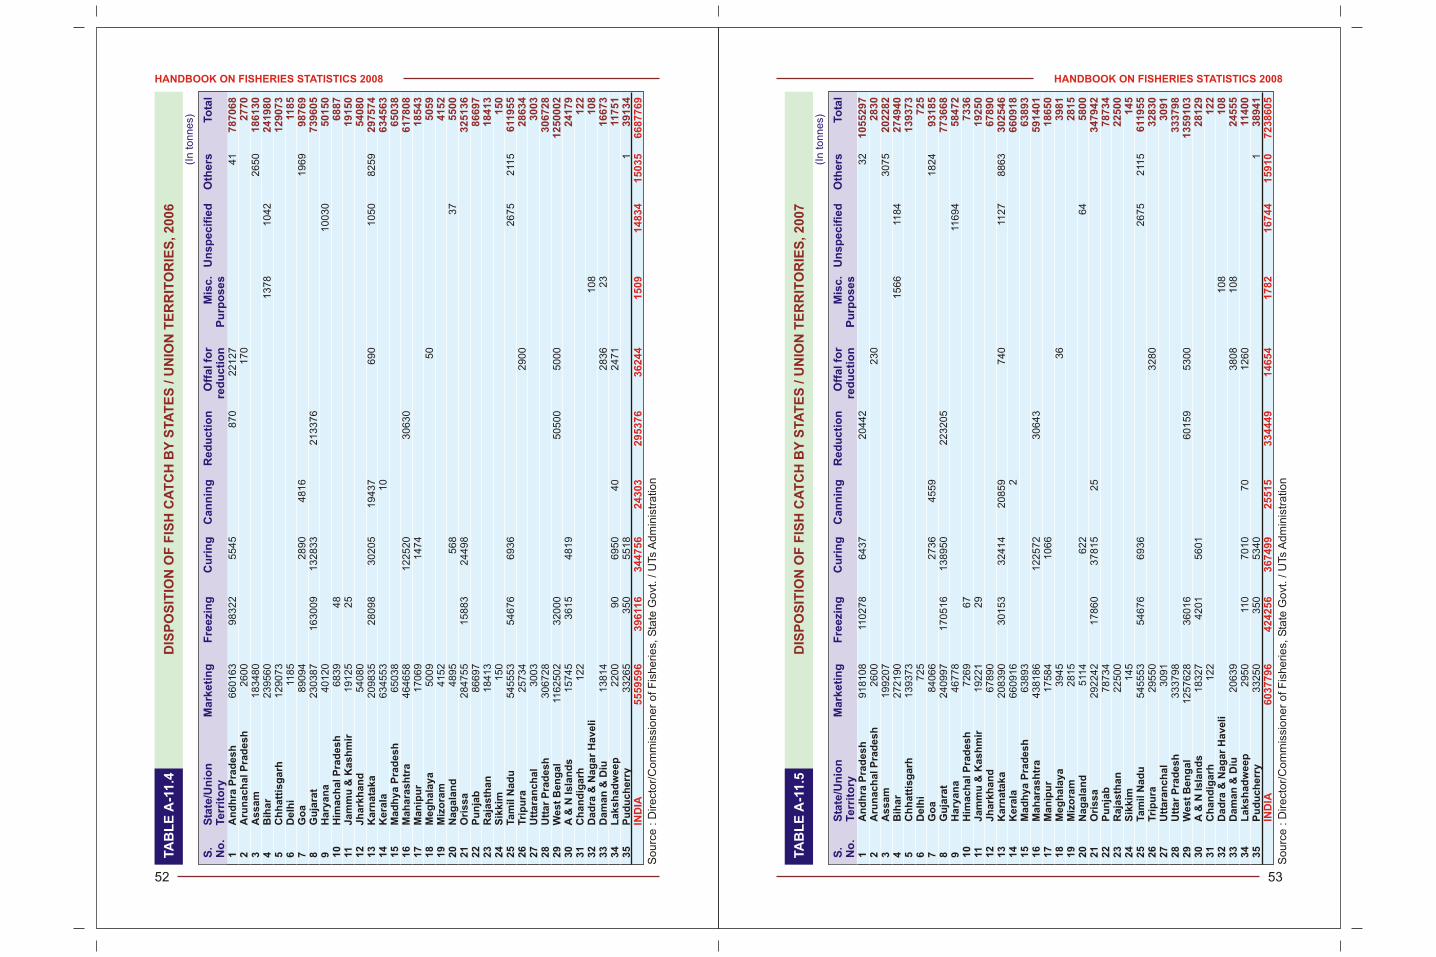
HANDBOOK ON FISHERIES STATISTICS 2008
53
HANDBOOK ON FISHERIES STATISTICS 2008
52
TA
BL
E A
-11
.4D
ISP
OS
ITIO
N O
F F
ISH
CA
TC
H B
Y S
TA
TE
S / U
NIO
N T
ER
RIT
OR
IES
, 2006
(I
n tonnes)
Sourc
e : D
irect
or/
Com
mis
sioner
of F
isheries,
Sta
te G
ovt
. / U
Ts A
dm
inis
tra
tion
1A
nd
hra
Pra
desh
660163
98322
5545
870
22127
41
2A
run
ach
al P
rad
esh
2600
170
3A
ssam
183480
2650
4B
ihar
239560
1378
1042
5C
hh
att
isg
arh
129073
6D
elh
i11
85
7G
oa
89094
2890
4816
1969
8G
uja
rat
230387
163009
132833
213376
9H
ary
an
a40120
10030
10
Him
ach
al P
rad
esh
6839
48
11
Jam
mu
& K
ash
mir
19125
25
12
Jh
ark
han
d54080
13
Karn
ata
ka
209835
28098
30205
19437
690
1050
8259
14
Kera
la634553
10
15
Mad
hya P
rad
esh
65038
16
Mah
ara
sh
tra
464658
122520
30630
17
Man
ipu
r17069
1474
18
Meg
hala
ya
5009
50
19
Miz
ora
m4152
20
Nag
ala
nd
4895
568
37
21
Ori
ssa
284755
15883
24498
22
Pu
nja
b86697
23
Raja
sth
an
18413
24
Sik
kim
150
25
Tam
il N
ad
u545553
54676
6936
2675
211
526
Tri
pu
ra25734
2900
27
Utt
ara
nch
al
3003
28
Utt
ar
Pra
desh
306728
29
West
Ben
gal
1162502
32000
50500
5000
30
A &
N Isla
nd
s15745
3615
4819
31
Ch
an
dig
arh
122
32
Dad
ra &
Nag
ar
Haveli
108
33
Dam
an
& D
iu13814
2836
23
34
Laksh
ad
weep
2200
90
6950
40
2471
35
Pu
du
ch
err
y33265
350
5518
1
S.
Sta
te/U
nio
nM
ark
eti
ng
F
reezi
ng
C
uri
ng
C
an
nin
g
Re
du
cti
on
Off
al
for
Mis
c.
Un
sp
ec
ifie
dO
the
rs T
ota
l N
o.
Terr
ito
ryre
du
cti
on
Pu
rpo
se
s787068
2770
186130
241980
129073
1185
98769
739605
50150
6887
19150
54080
297574
634563
65038
617808
18543
5059
4152
5500
325136
86697
18413
150
611955
28634
3003
306728
1250002
24179
122
108
16673
11751
39134
IND
IA5559596
396
116
344756
24303
295376
36244
1509
14834
15035
6687769
TA
BL
E A
-11
.5D
ISP
OS
ITIO
N O
F F
ISH
CA
TC
H B
Y S
TA
TE
S / U
NIO
N T
ER
RIT
OR
IES
, 2007
(I
n tonnes)
Sourc
e : D
irect
or/
Com
mis
sioner
of F
isheries,
Sta
te G
ovt
. / U
Ts A
dm
inis
tra
tion
1A
nd
hra
Pra
desh
918108
110278
6437
20442
32
2A
run
ach
al P
rad
esh
2600
230
3A
ssam
199207
3075
4B
ihar
272190
1566
1184
5C
hh
att
isg
arh
139373
6D
elh
i725
7G
oa
84066
2736
4559
1824
8G
uja
rat
240997
170516
138950
223205
9H
ary
an
a46778
11694
10
Him
ach
al P
rad
esh
7269
67
11
Jam
mu
& K
ash
mir
19221
29
12
Jh
ark
han
d67890
13
Karn
ata
ka
208390
30153
32414
20859
740
1127
8863
14
Kera
la660916
215
Mad
hya P
rad
esh
63893
16
Mah
ara
sh
tra
438186
122572
30643
17
Man
ipu
r17584
1066
18
Meg
hala
ya
3945
36
19
Miz
ora
m2815
20
Nag
ala
nd
511
4622
64
21
Ori
ssa
292242
17860
37815
25
22
Pu
nja
b78734
23
Raja
sth
an
22500
24
Sik
kim
145
25
Tam
il N
ad
u545553
54676
6936
2675
211
526
Tri
pu
ra29550
3280
27
Utt
ara
nch
al
3091
28
Utt
ar
Pra
desh
333798
29
West
Ben
gal
1257628
36016
60159
5300
30
A &
N Isla
nd
s18327
4201
5601
31
Ch
an
dig
arh
122
32
Dad
ra &
Nag
ar
Haveli
108
33
Dam
an
& D
iu20639
3808
108
34
Laksh
ad
weep
2950
110
7010
70
1260
35
Pu
du
ch
err
y33250
350
5340
1
S.
Sta
te/U
nio
nM
ark
eti
ng
F
reezi
ng
C
uri
ng
C
an
nin
g
Re
du
cti
on
Off
al
for
Mis
c.
Un
sp
ec
ifie
dO
the
rs T
ota
l N
o.
Terr
ito
ryre
du
cti
on
Pu
rpo
se
s1055297
2830
202282
274940
139373
725
93185
773668
58472
7336
19250
67890
302546
660918
63893
591401
18650
3981
2815
5800
347942
78734
22500
145
611955
32830
3091
333798
1359103
28129
122
108
24555
11400
38941
IND
IA6037796
424256
367499
25515
334449
14654
1782
16744
15910
7238605
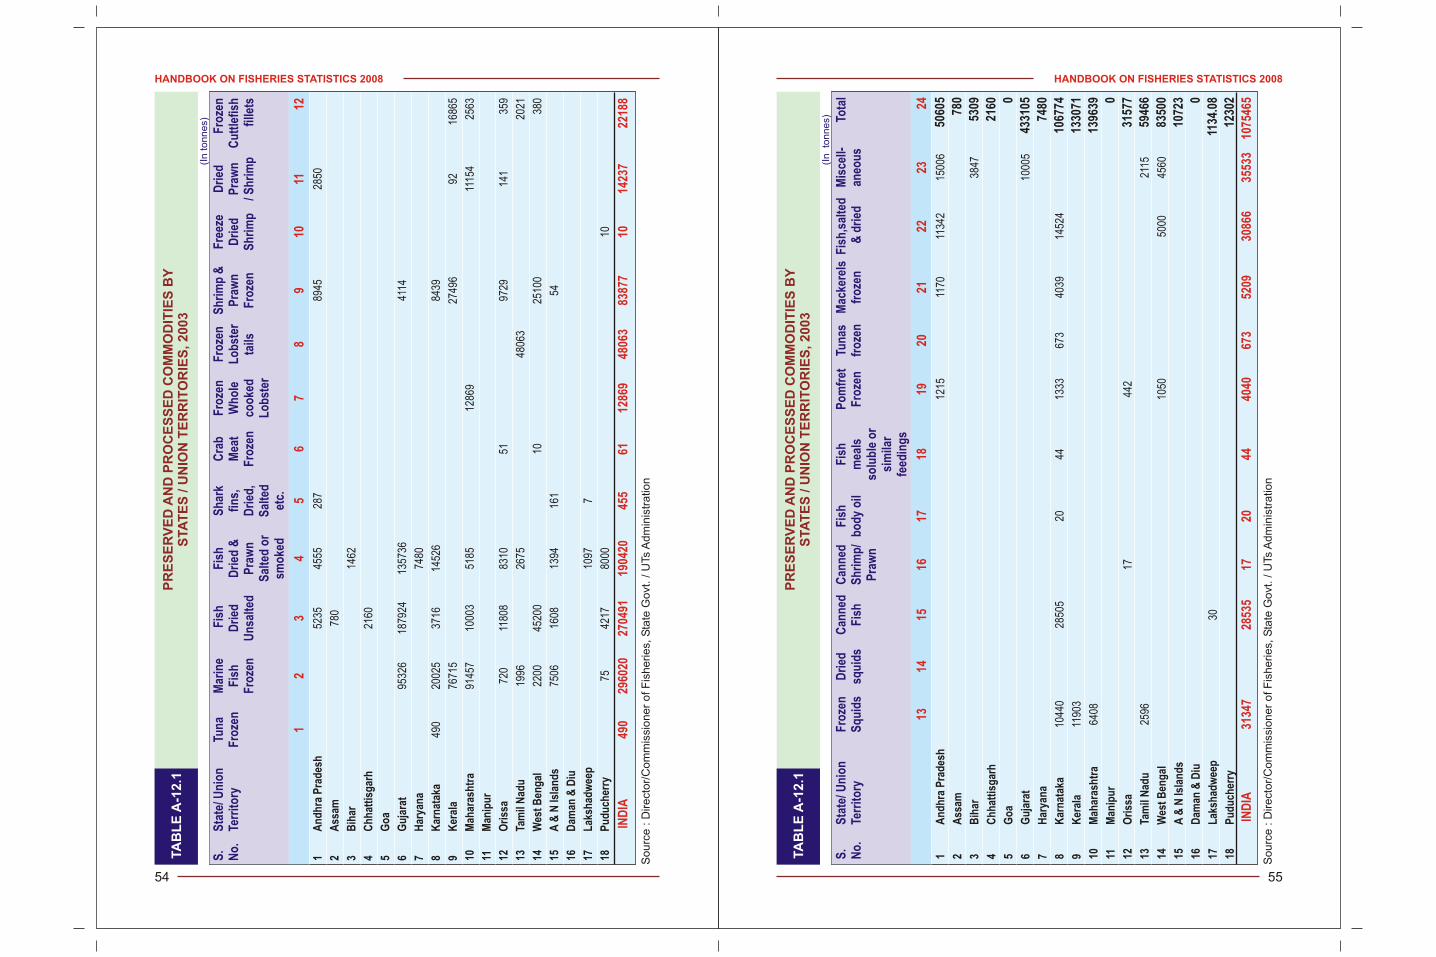
HANDBOOK ON FISHERIES STATISTICS 2008
55
HANDBOOK ON FISHERIES STATISTICS 2008
54
TA
BL
E A
-12.1
PR
ES
ER
VE
D A
ND
PR
OC
ES
SE
D C
OM
MO
DIT
IES
BY
STA
TE
S / U
NIO
N T
ER
RIT
OR
IES
, 2003
(I
n tonnes)
Sourc
e : D
irect
or/
Com
mis
sioner
of F
isheries,
Sta
te G
ovt
. / U
Ts A
dm
inis
tra
tion
1A
nd
hra
Pra
des
h52
3545
5528
789
4528
50
2A
ssam
780
3B
ihar
1462
4C
hh
atti
sgar
h21
60
5G
oa
6G
uja
rat
9532
618
7924
1357
3641
14
7H
arya
na
7480
8K
arn
atak
a49
020
025
3716
1452
684
39
9K
eral
a76
715
2749
692
1686
5
10M
ahar
ash
tra
9145
710
003
5185
1286
911
154
2563
11M
anip
ur
12O
riss
a72
011
808
8310
5197
2914
135
9
13Ta
mil
Nad
u19
9626
7548
063
2021
14W
est
Ben
gal
2200
4520
010
2510
038
0
15A
& N
Isla
nd
s75
0616
0813
9416
154
16D
aman
& D
iu
17L
aksh
adw
eep
1097
7
18P
ud
uch
erry
7542
1780
0010
S.
Sta
te/ U
nio
nTu
na
Mar
ine
Fis
hF
ish
S
har
kC
rab
Fro
zen
F
roze
nS
hri
mp
&F
reez
eD
ried
Fro
zen
No
.Te
rrit
ory
Fro
zen
Fis
hD
ried
Dri
ed &
fin
s,M
eat
Wh
ole
Lo
bst
erP
raw
nD
ried
Pra
wn
Cu
ttle
fish
F
roze
nU
nsa
lted
Pra
wn
D
ried
, F
roze
nco
oke
dta
ilsF
roze
nS
hri
mp
/ Sh
rim
pfi
llets
Sal
ted
or
Sal
ted
Lo
bst
ersm
oke
det
c.
12
34
56
78
910
1112
IND
IA
490
2960
2027
0491
1904
2045
561
1286
948
063
8387
710
1423
722
188
TA
BL
E A
-12
.1P
RE
SE
RV
ED
AN
D P
RO
CE
SS
ED
CO
MM
OD
ITIE
S B
YS
TA
TE
S / U
NIO
N T
ER
RIT
OR
IES
, 2
00
3
(I
n to
nn
es)
So
urc
e : D
ire
cto
r/C
om
mis
sio
ne
r o
f F
ish
erie
s, S
tate
Go
vt.
/ U
Ts A
dm
inis
tra
tio
n
1A
nd
hra
Pra
des
h12
1511
7011
342
1500
650
605
2A
ssam
780
3B
ihar
3847
5309
4C
hh
atti
sgar
h21
60
5G
oa
0
6G
uja
rat
1000
543
3105
7H
arya
na
7480
8K
arn
atak
a10
440
2850
520
4413
3367
340
3914
524
1067
74
9K
eral
a11
903
1330
71
10M
ahar
ash
tra
6408
1396
39
11M
anip
ur
0
12O
riss
a17
442
3157
7
13Ta
mil
Nad
u25
9621
1559
466
14W
est
Ben
gal
1050
5000
4560
8350
0
15A
& N
Isla
nd
s10
723
16D
aman
& D
iu0
17L
aksh
adw
eep
3011
34.0
8
18P
ud
uch
erry
1230
2
S.
Sta
te/ U
nio
nF
roze
nD
ried
Can
ned
Can
ned
F
ish
Fis
h
Po
mfr
et
Tun
asM
acke
rels
Fis
h,s
alte
dM
isce
ll-To
tal
No
.Te
rrit
ory
Sq
uid
ssq
uid
sF
ish
Sh
rim
p/
bo
dy
oil
mea
lsF
roze
nfr
oze
nfr
oze
n &
dri
edan
eou
sP
raw
nso
lub
le o
r si
mila
rfe
edin
gs
1314
1516
1718
1920
2122
2324
IND
IA
3134
728
535
1720
4440
4067
352
0930
866
3553
310
7546
5
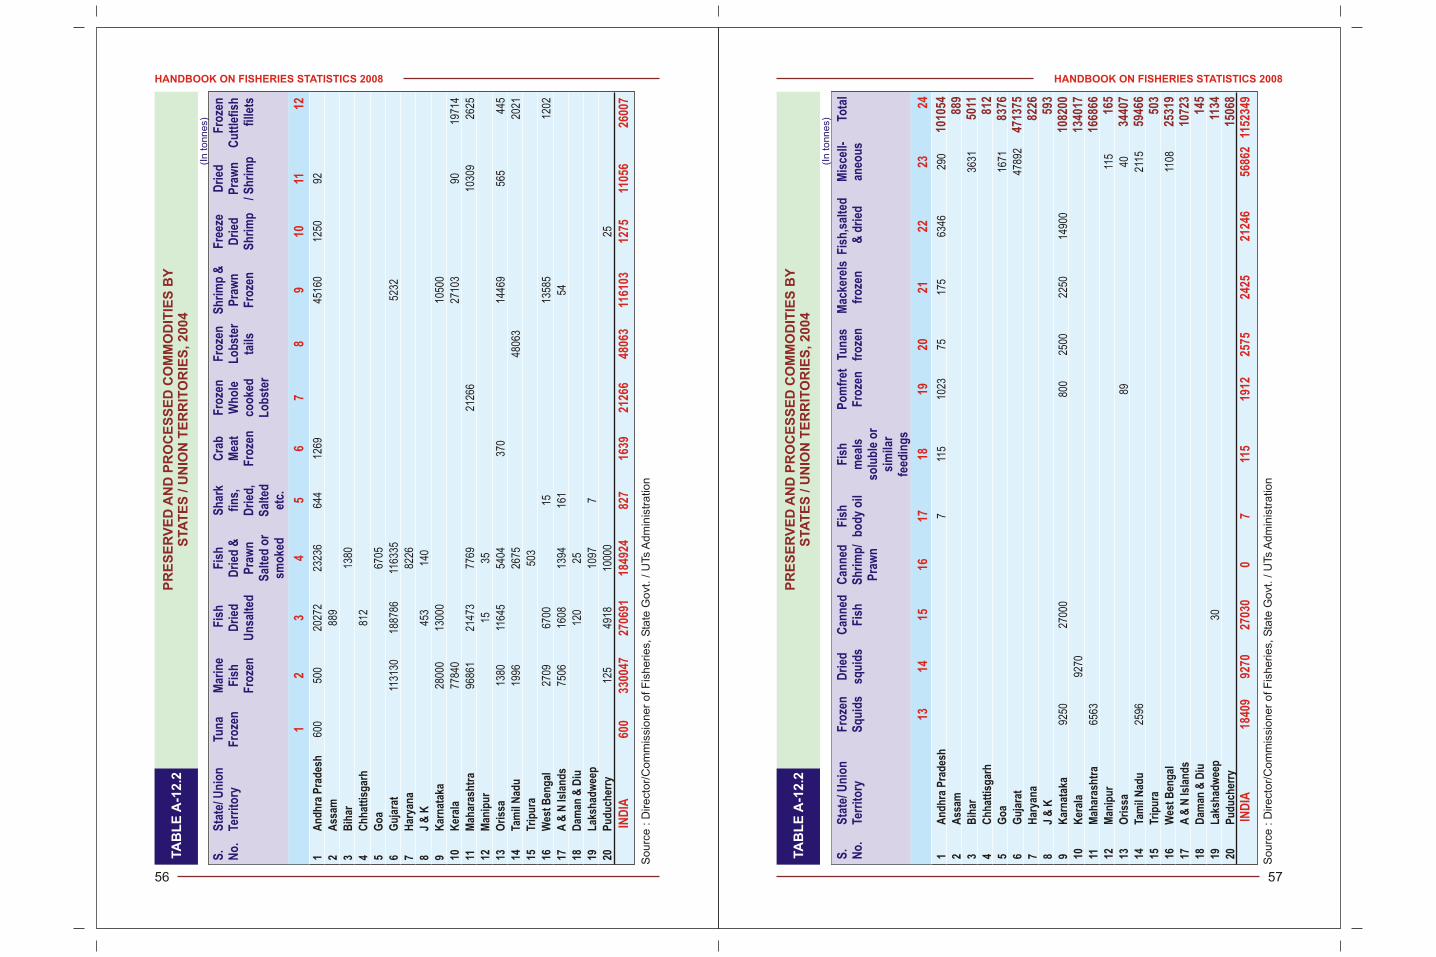
HANDBOOK ON FISHERIES STATISTICS 2008
57
HANDBOOK ON FISHERIES STATISTICS 2008
56
1A
nd
hra
Pra
des
h60
050
020
272
2323
664
412
6945
160
1250
92
2A
ssam
889
3B
ihar
1380
4C
hh
atti
sgar
h81
2
5G
oa
6705
6G
uja
rat
1131
3018
8786
1163
3552
32
7H
arya
na
8226
8J
& K
453
140
9K
arn
atak
a28
000
1300
010
500
10K
eral
a77
840
2710
390
1971
4
11M
ahar
ash
tra
9686
121
473
7769
2126
610
309
2625
12M
anip
ur
1535
13O
riss
a13
8011
645
5404
370
1446
956
544
5
14Ta
mil
Nad
u19
9626
7548
063
2021
15Tr
ipu
ra50
3
16W
est
Ben
gal
2709
6700
1513
585
1202
17A
& N
Isla
nd
s75
0616
0813
9416
154
18D
aman
& D
iu12
025
19L
aksh
adw
eep
1097
7
20P
ud
uch
erry
125
4918
1000
025
S.
Sta
te/ U
nio
nTu
na
Mar
ine
Fis
hF
ish
S
har
kC
rab
Fro
zen
F
roze
nS
hri
mp
&F
reez
eD
ried
Fro
zen
No
.Te
rrit
ory
Fro
zen
Fis
hD
ried
Dri
ed &
fin
s,M
eat
Wh
ole
Lo
bst
erP
raw
nD
ried
Pra
wn
Cu
ttle
fish
F
roze
nU
nsa
lted
Pra
wn
D
ried
, F
roze
nco
oke
dta
ilsF
roze
nS
hri
mp
/ Sh
rim
pfi
llets
Sal
ted
or
Sal
ted
Lo
bst
ersm
oke
det
c.
12
34
56
78
910
1112
IND
IA
600
3300
4727
0691
1849
2482
716
3921
266
4806
311
6103
1275
1105
626
007
TA
BL
E A
-12
.2P
RE
SE
RV
ED
AN
D P
RO
CE
SS
ED
CO
MM
OD
ITIE
S B
YS
TA
TE
S / U
NIO
N T
ER
RIT
OR
IES
, 2
00
4
(I
n to
nn
es)
So
urc
e : D
ire
cto
r/C
om
mis
sio
ne
r o
f F
ish
erie
s, S
tate
Go
vt.
/ U
Ts A
dm
inis
tra
tio
n
TA
BL
E A
-12
.2P
RE
SE
RV
ED
AN
D P
RO
CE
SS
ED
CO
MM
OD
ITIE
S B
YS
TA
TE
S / U
NIO
N T
ER
RIT
OR
IES
, 2
00
4
(I
n to
nn
es)
So
urc
e : D
ire
cto
r/C
om
mis
sio
ne
r o
f F
ish
erie
s, S
tate
Go
vt.
/ U
Ts A
dm
inis
tra
tio
n
1A
nd
hra
Pra
des
h7
115
1023
7517
563
4629
0
2A
ssam
3B
ihar
3631
4C
hh
atti
sgar
h
5G
oa
1671
6G
uja
rat
4789
2
7H
arya
na
8J
& K
9K
arn
atak
a92
5027
000
800
2500
2250
1490
0
10K
eral
a92
70
11M
ahar
ash
tra
6563
12M
anip
ur
115
13O
riss
a89
40
14Ta
mil
Nad
u25
9621
15
15Tr
ipu
ra
16W
est
Ben
gal
1108
17A
& N
Isla
nd
s
18D
aman
& D
iu
19L
aksh
adw
eep
30
20P
ud
uch
erry
S.
Sta
te/ U
nio
nF
roze
nD
ried
Can
ned
Can
ned
F
ish
Fis
h
Po
mfr
et
Tun
asM
acke
rels
Fis
h,s
alte
dM
isce
ll-To
tal
No
.Te
rrit
ory
Sq
uid
ssq
uid
sF
ish
Sh
rim
p/
bo
dy
oil
mea
lsF
roze
nfr
oze
nfr
oze
n &
dri
edan
eou
sP
raw
nso
lub
le o
r si
mila
rfe
edin
gs
1314
1516
1718
1920
2122
2324
IN
DIA
18
409
9270
2703
00
711
519
1225
7524
2521
246
5686
211
5234
9
1010
54 889
5011
812
8376
4713
7582
26 593
1082
0013
4017
1668
66 165
3440
759
466
503
2531
910
723
145
1134
1506
8
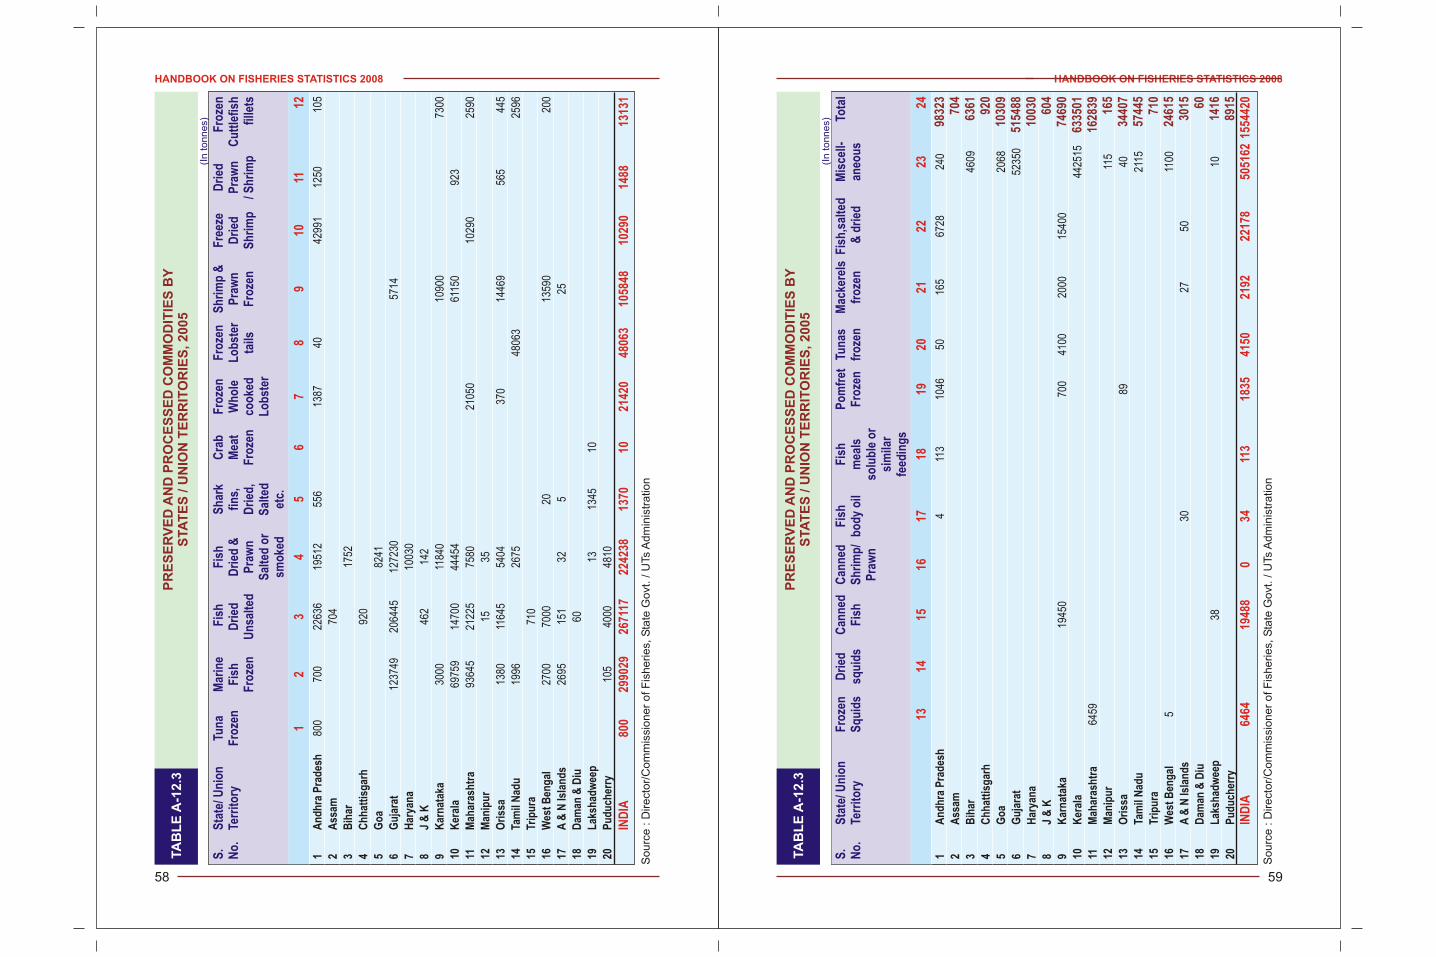
HANDBOOK ON FISHERIES STATISTICS 2008
59
HANDBOOK ON FISHERIES STATISTICS 2008
58
TA
BL
E A
-12.3
PR
ES
ER
VE
D A
ND
PR
OC
ES
SE
D C
OM
MO
DIT
IES
BY
STA
TE
S / U
NIO
N T
ER
RIT
OR
IES
, 2005
(I
n tonnes)
Sourc
e : D
irect
or/
Com
mis
sioner
of F
isheries,
Sta
te G
ovt
. / U
Ts A
dm
inis
tra
tion
1A
nd
hra
Pra
des
h80
070
022
636
1951
255
613
8740
4299
112
5010
5
2A
ssam
704
3B
ihar
1752
4C
hh
atti
sgar
h92
0
5G
oa
8241
6G
uja
rat
1237
4920
6445
1272
3057
14
7H
arya
na
1003
0
8J
& K
462
142
9K
arn
atak
a30
0011
840
1090
073
00
10K
eral
a69
759
1470
044
454
6115
092
3
11M
ahar
ash
tra
9364
521
225
7580
2105
010
290
2590
12M
anip
ur
1535
13O
riss
a13
8011
645
5404
370
1446
956
544
5
14Ta
mil
Nad
u19
9626
7548
063
2596
15Tr
ipu
ra71
0
16W
est
Ben
gal
2700
7000
2013
590
200
17A
& N
Isla
nd
s26
9515
132
525
18D
aman
& D
iu60
19L
aksh
adw
eep
1313
4510
20P
ud
uch
erry
105
4000
4810
S.
Sta
te/ U
nio
nTu
na
Mar
ine
Fis
hF
ish
S
har
kC
rab
Fro
zen
F
roze
nS
hri
mp
&F
reez
eD
ried
Fro
zen
No
.Te
rrit
ory
Fro
zen
Fis
hD
ried
Dri
ed &
fin
s,M
eat
Wh
ole
Lo
bst
erP
raw
nD
ried
Pra
wn
Cu
ttle
fish
F
roze
nU
nsa
lted
Pra
wn
D
ried
, F
roze
nco
oke
dta
ilsF
roze
nS
hri
mp
/ Sh
rim
pfi
llets
Sal
ted
or
Sal
ted
Lo
bst
ersm
oke
det
c.
12
34
56
78
910
1112
IND
IA80
029
9029
2671
1722
4238
1370
1021
420
4806
310
5848
1029
014
8813
131
TA
BL
E A
-12
.3P
RE
SE
RV
ED
AN
D P
RO
CE
SS
ED
CO
MM
OD
ITIE
S B
YS
TA
TE
S / U
NIO
N T
ER
RIT
OR
IES
, 2
00
5
(I
n to
nn
es)
So
urc
e : D
ire
cto
r/C
om
mis
sio
ne
r o
f F
ish
erie
s, S
tate
Go
vt.
/ U
Ts A
dm
inis
tra
tio
n
1A
nd
hra
Pra
des
h4
113
1046
5016
567
2824
0
2A
ssam
3B
ihar
4609
4C
hh
atti
sgar
h
5G
oa
2068
6G
uja
rat
5235
0
7H
arya
na
8J
& K
9K
arn
atak
a19
450
700
4100
2000
1540
0
10K
eral
a44
2515
11M
ahar
ash
tra
6459
12M
anip
ur
115
13O
riss
a89
40
14Ta
mil
Nad
u21
15
15Tr
ipu
ra
16W
est
Ben
gal
511
00
17A
& N
Isla
nd
s30
2750
18D
aman
& D
iu
19L
aksh
adw
eep
3810
20P
ud
uch
erry
S.
Sta
te/ U
nio
nF
roze
nD
ried
Can
ned
Can
ned
F
ish
Fis
h
Po
mfr
et
Tun
asM
acke
rels
Fis
h,s
alte
dM
isce
ll-To
tal
No
.Te
rrit
ory
Sq
uid
ssq
uid
sF
ish
Sh
rim
p/
bo
dy
oil
mea
lsF
roze
nfr
oze
nfr
oze
n &
dri
edan
eou
sP
raw
nso
lub
le o
r si
mila
rfe
edin
gs
1314
1516
1718
1920
2122
2324
IND
IA64
6419
488
034
113
1835
4150
2192
2217
850
5162
1554
420
9832
370
463
61 920
1030
951
5488
1003
060
474
690
6335
0116
2839 165
3440
757
445
710
2461
530
15 6014
1689
15
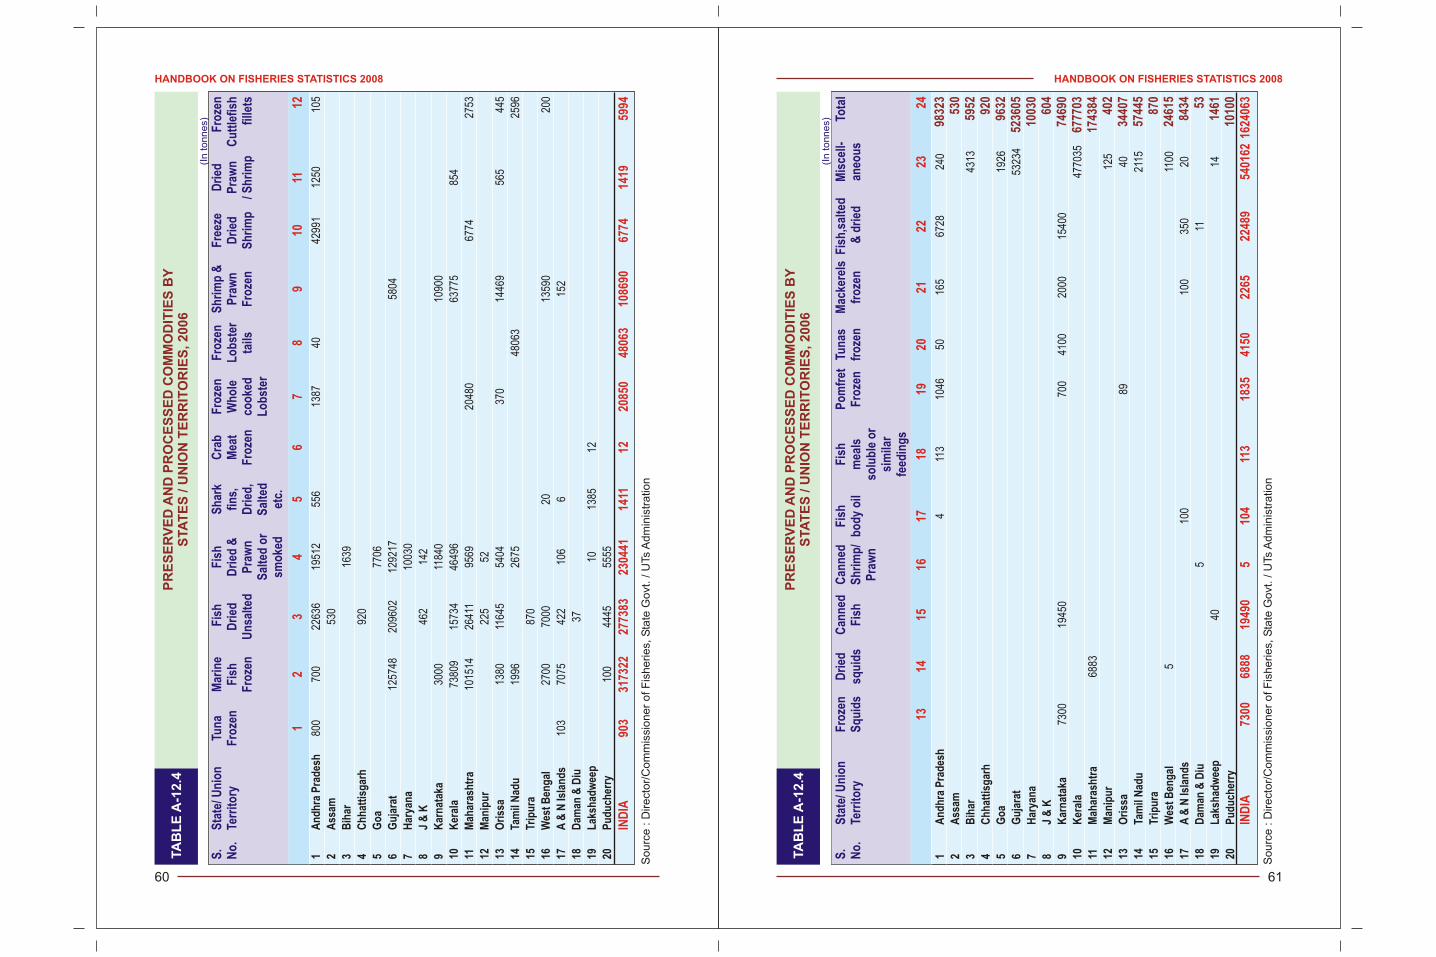
HANDBOOK ON FISHERIES STATISTICS 2008
61
HANDBOOK ON FISHERIES STATISTICS 2008
60
TA
BL
E A
-12.4
PR
ES
ER
VE
D A
ND
PR
OC
ES
SE
D C
OM
MO
DIT
IES
BY
STA
TE
S / U
NIO
N T
ER
RIT
OR
IES
, 2006
(I
n tonnes)
Sourc
e : D
irect
or/
Com
mis
sioner
of F
isheries,
Sta
te G
ovt
. / U
Ts A
dm
inis
tra
tion
1A
nd
hra
Pra
des
h80
070
022
636
1951
255
613
8740
4299
112
5010
5
2A
ssam
530
3B
ihar
1639
4C
hh
atti
sgar
h92
0
5G
oa
7706
6G
uja
rat
1257
4820
9602
1292
1758
04
7H
arya
na
1003
0
8J
& K
462
142
9K
arn
atak
a30
0011
840
1090
0
10K
eral
a73
809
1573
446
496
6377
585
4
11M
ahar
ash
tra
1015
1426
411
9569
2048
067
7427
53
12M
anip
ur
225
52
13O
riss
a13
8011
645
5404
370
1446
956
544
5
14Ta
mil
Nad
u19
9626
7548
063
2596
15Tr
ipu
ra87
0
16W
est
Ben
gal
2700
7000
2013
590
200
17A
& N
Isla
nd
s10
370
7542
210
66
152
18D
aman
& D
iu37
19L
aksh
adw
eep
1013
8512
20P
ud
uch
erry
100
4445
5555
S.
Sta
te/ U
nio
nTu
na
Mar
ine
Fis
hF
ish
S
har
kC
rab
Fro
zen
F
roze
nS
hri
mp
&F
reez
eD
ried
Fro
zen
No
.Te
rrit
ory
Fro
zen
Fis
hD
ried
Dri
ed &
fin
s,M
eat
Wh
ole
Lo
bst
erP
raw
nD
ried
Pra
wn
Cu
ttle
fish
F
roze
nU
nsa
lted
Pra
wn
D
ried
, F
roze
nco
oke
dta
ilsF
roze
nS
hri
mp
/ Sh
rim
pfi
llets
Sal
ted
or
Sal
ted
Lo
bst
ersm
oke
det
c.
12
34
56
78
910
1112
IND
IA90
331
7322
2773
8323
0441
1411
1220
850
4806
310
8690
6774
1419
5994
TA
BL
E A
-12
.4P
RE
SE
RV
ED
AN
D P
RO
CE
SS
ED
CO
MM
OD
ITIE
S B
YS
TA
TE
S / U
NIO
N T
ER
RIT
OR
IES
, 2
00
6
(I
n to
nn
es)
So
urc
e : D
ire
cto
r/C
om
mis
sio
ne
r o
f F
ish
erie
s, S
tate
Go
vt.
/ U
Ts A
dm
inis
tra
tio
n
1A
nd
hra
Pra
des
h4
113
1046
5016
567
2824
0
2A
ssam
3B
ihar
4313
4C
hh
atti
sgar
h
5G
oa
1926
6G
uja
rat
5323
4
7H
arya
na
8J
& K
9K
arn
atak
a73
0019
450
700
4100
2000
1540
0
10K
eral
a47
7035
11M
ahar
ash
tra
6883
12M
anip
ur
125
13O
riss
a89
40
14Ta
mil
Nad
u21
15
15Tr
ipu
ra
16W
est
Ben
gal
511
00
17A
& N
Isla
nd
s10
010
035
020
18D
aman
& D
iu5
11
19L
aksh
adw
eep
4014
20P
ud
uch
erry
S.
Sta
te/ U
nio
nF
roze
nD
ried
Can
ned
Can
ned
F
ish
Fis
h
Po
mfr
et
Tun
asM
acke
rels
Fis
h,s
alte
dM
isce
ll-To
tal
No
.Te
rrit
ory
Sq
uid
ssq
uid
sF
ish
Sh
rim
p/
bo
dy
oil
mea
lsF
roze
nfr
oze
nfr
oze
n &
dri
edan
eou
sP
raw
nso
lub
le o
r si
mila
rfe
edin
gs
1314
1516
1718
1920
2122
2324
IND
IA73
0068
8819
490
510
411
318
3541
5022
6522
489
5401
6216
2406
3
9832
353
059
52 920
9632
5236
0510
030
604
7469
067
7703
1743
84 402
3440
757
445
870
2461
584
34 5314
6110
100

HANDBOOK ON FISHERIES STATISTICS 2008
63
HANDBOOK ON FISHERIES STATISTICS 2008
62
TA
BL
E A
-12.5
PR
ES
ER
VE
D A
ND
PR
OC
ES
SE
D C
OM
MO
DIT
IES
BY
STA
TE
S / U
NIO
N T
ER
RIT
OR
IES
, 2007(P
)
(I
n tonnes)
Sourc
e : D
irect
or/
Com
mis
sioner
of F
isheries,
Sta
te G
ovt
. / U
Ts A
dm
inis
tra
tion
1A
nd
hra
Pra
des
h22
9026
487
3813
512
912
921
5020
212
3018
62
2A
ssam
615
3B
ihar
1862
4C
hh
atti
sgar
h13
50
5G
oa
7294
6G
uja
rat
1326
4022
1277
1363
7161
25
7H
arya
na
1169
4
8J
& K
485
145
9K
arn
atak
a10
0011
215
1146
8
10K
eral
a73
279
1542
846
692
6331
495
0
11M
ahar
ash
tra
9441
224
081
8725
2280
969
7035
02
12M
anip
ur
3569
13O
riss
a72
011
808
8310
5197
2914
135
9
14Ta
mil
Nad
u19
9626
7548
063
2596
15Tr
ipu
ra90
4
16W
est
Ben
gal
3700
8078
2315
579
362
17A
& N
Isla
nd
s10
370
7542
210
620
152
18D
aman
& D
iu60
3
19L
aksh
adw
eep
913
5014
20P
ud
uch
erry
110
4650
5900
S.
Sta
te/ U
nio
nTu
na
Mar
ine
Fis
hF
ish
S
har
kC
rab
Fro
zen
F
roze
nS
hri
mp
&F
reez
eD
ried
Fro
zen
No
.Te
rrit
ory
Fro
zen
Fis
hD
ried
Dri
ed &
fin
s,M
eat
Wh
ole
Lo
bst
erP
raw
nD
ried
Pra
wn
Cu
ttle
fish
F
roze
nU
nsa
lted
Pra
wn
D
ried
, F
roze
nco
oke
dta
ilsF
roze
nS
hri
mp
/ Sh
rim
pfi
llets
Sal
ted
or
Sal
ted
Lo
bst
ersm
oke
det
c.
12
34
56
78
910
1112
IND
IA0
3079
6029
4496
2413
8314
7914
2286
048
083
1063
6769
7010
9468
19
TA
BL
E A
-12
.5P
RE
SE
RV
ED
AN
D P
RO
CE
SS
ED
CO
MM
OD
ITIE
S B
YS
TA
TE
S / U
NIO
N T
ER
RIT
OR
IES
, 2
00
7(P
)
(I
n to
nn
es)
So
urc
e : D
ire
cto
r/C
om
mis
sio
ne
r o
f F
ish
erie
s, S
tate
Go
vt.
/ U
Ts A
dm
inis
tra
tio
n
1A
nd
hra
Pra
des
h2
840
555
011
9462
4092
5851
66
2A
ssam
3B
ihar
4900
4C
hh
atti
sgar
h
5G
oa
1824
6G
uja
rat
5611
1
7H
arya
na
8J
& K
9K
arn
atak
a0
1403
619
991
472
926
1200
1610
3
10K
eral
a46
7664
11M
ahar
ash
tra
8756
12M
anip
ur
135
13O
riss
a17
442
14Ta
mil
Nad
u21
15
15Tr
ipu
ra
16W
est
Ben
gal
1070
0
17A
& N
Isla
nd
s10
010
035
06
18D
aman
& D
iu2
19L
aksh
adw
eep
7012
20P
ud
uch
erry
S.
Sta
te/ U
nio
nF
roze
nD
ried
Can
ned
Can
ned
F
ish
Fis
h
Po
mfr
et
Tun
asM
acke
rels
Fis
h,s
alte
dM
isce
ll-To
tal
No
.Te
rrit
ory
Sq
uid
ssq
uid
sF
ish
Sh
rim
p/
bo
dy
oil
mea
lsF
roze
nfr
oze
nfr
oze
n &
dri
edan
eou
sP
raw
nso
lub
le o
r si
mila
rfe
edin
gs
1314
1516
1718
1920
2122
2324
IND
IA2
2281
020
078
4055
105
021
0898
813
4025
713
5386
3316
5335
7
1102
78 615
6762
1350
9118
5525
2411
694
630
7641
166
7327
1692
55 239
3157
757
445
904
2845
284
34 6514
5510
660
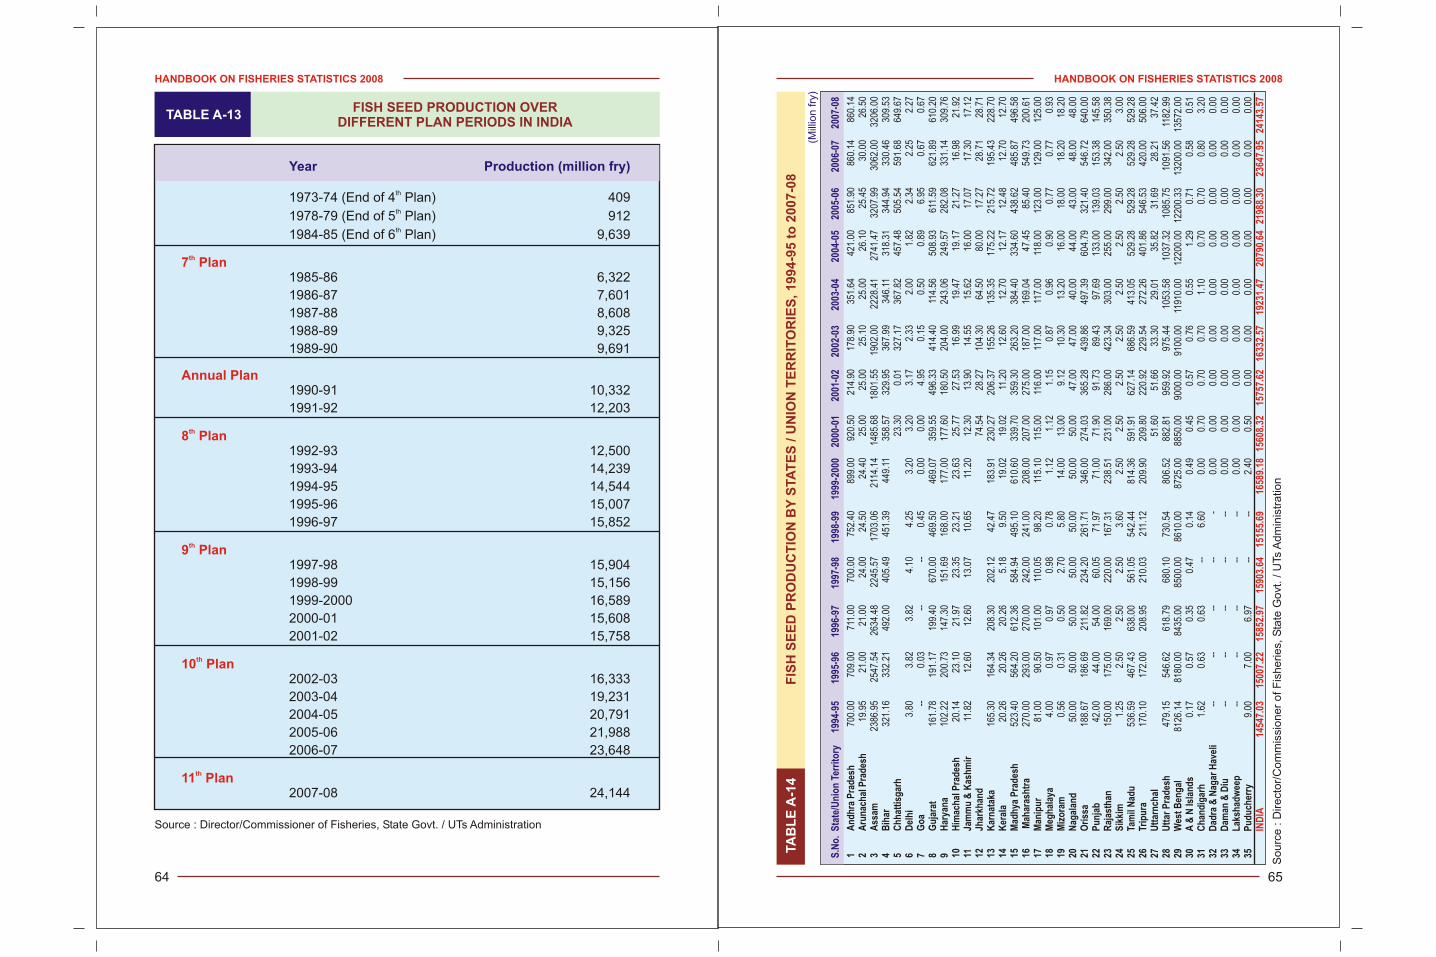
HANDBOOK ON FISHERIES STATISTICS 2008
65
HANDBOOK ON FISHERIES STATISTICS 2008
64
TABLE A-13FISH SEED PRODUCTION OVER
DIFFERENT PLAN PERIODS IN INDIA
Source : Director/Commissioner of Fisheries, State Govt. / UTs Administration
th1973-74 (End of 4 Plan) 409th1978-79 (End of 5 Plan) 912th1984-85 (End of 6 Plan) 9,639
1985-86 6,322
1986-87 7,601
1987-88 8,608
1988-89 9,325
1989-90 9,691
1990-91 10,332
1991-92 12,203
1992-93 12,500
1993-94 14,239
1994-95 14,544
1995-96 15,007
1996-97 15,852
1997-98 15,904
1998-99 15,156
1999-2000 16,589
2000-01 15,608
2001-02 15,758
2002-03 16,333
2003-04 19,231
2004-05 20,791
2005-06 21,988
2006-07 23,648
2007-08 24,144
Year Production (million fry)
th7 Plan
Annual Plan
th8 Plan
th9 Plan
th10 Plan
th11 PlanTA
BL
E A
-14
F
ISH
SE
ED
PR
OD
UC
TIO
N B
Y S
TA
TE
S / U
NIO
N T
ER
RIT
OR
IES
, 1
99
4-9
5 t
o 2
00
7-0
8
(Mill
ion
fry
)
So
urc
e : D
ire
cto
r/C
om
mis
sio
ne
r o
f F
ish
erie
s, S
tate
Go
vt. / U
Ts A
dm
inis
tra
tion
1A
nd
hra
Pra
des
h70
0.00
709.
0071
1.00
700.
0075
2.40
899.
0092
0.50
214.
9017
8.90
351.
6442
1.00
851.
9086
0.14
860.
142
Aru
nac
hal
Pra
des
h19
.95
21.0
021
.00
24.0
024
.50
24.4
025
.00
25.0
025
.10
25.0
026
.10
25.4
530
.00
26.5
03
Ass
am23
86.9
525
47.5
426
34.4
822
45.5
717
03.0
621
14.1
414
85.6
818
01.5
519
02.0
022
28.4
127
41.4
732
07.9
930
62.0
032
06.0
04
Bih
ar32
1.16
332.
2149
2.00
405.
4945
1.39
449.
1135
8.57
329.
9536
7.99
346.
1131
8.31
344.
9433
0.46
309.
535
Ch
hat
tisg
arh
23.3
00.
0132
7.17
367.
8245
7.48
505.
5459
1.68
649.
676
Del
hi
3.80
3.82
3.82
4.10
4.25
3.20
3.20
3.17
2.33
2.00
1.82
2.34
2.25
2.27
7G
oa
--0.
03--
--0.
450.
000.
004.
950.
150.
500.
896.
950.
670.
678
Gu
jara
t16
1.78
191.
1719
9.40
670.
0046
9.50
469.
0735
9.55
496.
3341
4.40
114.
5650
8.93
611.
5962
1.89
610.
209
Har
yan
a10
2.22
200.
7314
7.30
151.
6916
8.00
177.
0017
7.60
180.
5020
4.00
243.
0624
9.57
282.
0833
1.14
309.
7610
Him
ach
al P
rad
esh
20.1
423
.10
21.9
723
.35
23.2
123
.63
25.7
727
.53
16.9
919
.47
19.1
721
.27
16.9
821
.92
11Ja
mm
u &
Kas
hm
ir11
.82
12.6
012
.60
13.0
710
.65
11.2
012
.30
13.9
014
.55
15.6
216
.00
17.0
717
.30
17.1
212
Jhar
khan
d74
.54
28.2
710
4.30
64.5
080
.00
17.2
728
.71
28.7
113
Kar
nat
aka
165.
3016
4.34
208.
3020
2.12
42.4
718
3.91
230.
2720
6.37
155.
2613
5.35
175.
2221
5.72
195.
4322
8.70
14K
eral
a20
.26
20.2
620
.26
5.18
9.50
19.0
219
.02
11.2
012
.60
12.7
012
.17
12.4
812
.70
12.7
015
Mad
hya
Pra
des
h52
3.40
564.
2061
2.36
584.
9449
5.10
610.
6033
9.70
359.
3026
3.20
384.
4033
4.60
438.
6248
5.87
496.
5816
Mah
aras
htr
a27
0.00
293.
0027
0.00
242.
0024
1.00
208.
0020
7.00
275.
0018
7.00
169.
0447
.45
85.4
054
9.73
200.
6117
Man
ipu
r81
.00
90.5
010
1.00
110.
0598
.20
115.
1011
5.00
116.
0011
7.00
117.
0011
8.00
123.
0012
9.00
125.
0018
Meg
hal
aya
4.00
0.97
0.97
0.98
0.78
1.12
1.12
1.15
0.87
0.96
0.90
0.77
0.77
0.93
19M
izo
ram
0.56
0.31
0.50
2.70
5.80
14.0
013
.00
9.12
10.3
013
.20
16.0
018
.00
18.2
018
.20
20N
agal
and
50.0
050
.00
50.0
050
.00
50.0
050
.00
50.0
047
.00
47.0
040
.00
44.0
043
.00
48.0
048
.00
21O
riss
a18
8.67
186.
6921
1.82
234.
2026
1.71
346.
0027
4.03
365.
2843
9.86
497.
3960
4.79
321.
4054
6.72
640.
0022
Pu
nja
b42
.00
44.0
054
.00
60.0
571
.97
71.0
071
.90
91.7
389
.43
97.6
913
3.00
139.
0315
3.38
145.
5823
Raj
asth
an15
0.00
175.
0016
9.00
220.
0016
7.31
238.
5123
1.00
286.
0042
3.34
303.
0025
5.00
299.
0034
2.00
350.
3824
Sik
kim
1.25
2.50
2.50
2.50
3.60
2.50
2.50
2.50
2.50
2.50
2.50
2.50
2.50
3.00
25Ta
mil
Nad
u53
6.59
467.
4363
8.00
561.
0554
2.44
814.
3659
1.91
627.
1468
6.59
413.
0552
9.28
529.
2852
9.28
529.
2826
Trip
ura
170.
1017
2.00
208.
9521
0.03
211.
1220
9.90
209.
8022
0.92
229.
5427
2.26
401.
8654
6.53
420.
0050
6.00
27U
ttar
nch
al51
.60
51.6
633
.30
29.0
135
.82
31.6
928
.21
37.4
228
Utt
ar P
rad
esh
479.
1554
6.62
618.
7968
0.10
730.
5480
6.52
882.
8195
9.92
975.
4410
53.5
810
37.3
210
85.7
510
91.5
611
82.9
929
Wes
t B
eng
al81
26.1
481
80.0
084
35.0
085
00.0
086
10.0
087
25.0
088
50.0
090
00.0
091
00.0
011
910.
0012
200.
0012
200.
3313
200.
0013
572.
0030
A &
N Is
lan
ds
0.17
0.57
0.35
0.47
0.14
0.49
0.45
0.57
0.76
0.55
1.29
0.71
0.58
0.51
31C
han
dig
arh
1.62
0.63
0.63
--6.
600.
000.
700.
700.
701.
100.
700.
700.
803.
2032
Dad
ra &
Nag
ar H
avel
i--
----
---
0.00
0.00
0.00
0.00
0.00
0.00
0.00
0.00
0.00
33D
aman
& D
iu--
----
----
0.00
0.00
0.00
0.00
0.00
0.00
0.00
0.00
0.00
34L
aksh
adw
eep
----
----
--0.
000.
000.
000.
000.
000.
000.
000.
000.
0035
Pu
du
cher
ry9.
007.
006.
97--
--2.
400.
500.
000.
000.
000.
000.
000.
000.
00
S.N
o.
Sta
te/U
nio
n T
erri
tory
1994
-95
1995
-96
1996
-97
1997
-98
1998
-99
1999
-200
020
00-0
120
01-0
220
02-0
320
03-0
420
04-0
520
05-0
620
06-0
720
07-0
8
IND
IA14
547.
0315
007.
2215
852.
9715
903.
6415
155.
6916
589.
1815
608.
3215
757.
6216
332.
5719
231.
4720
790.
6421
988.
3023
647.
9524
143.
57
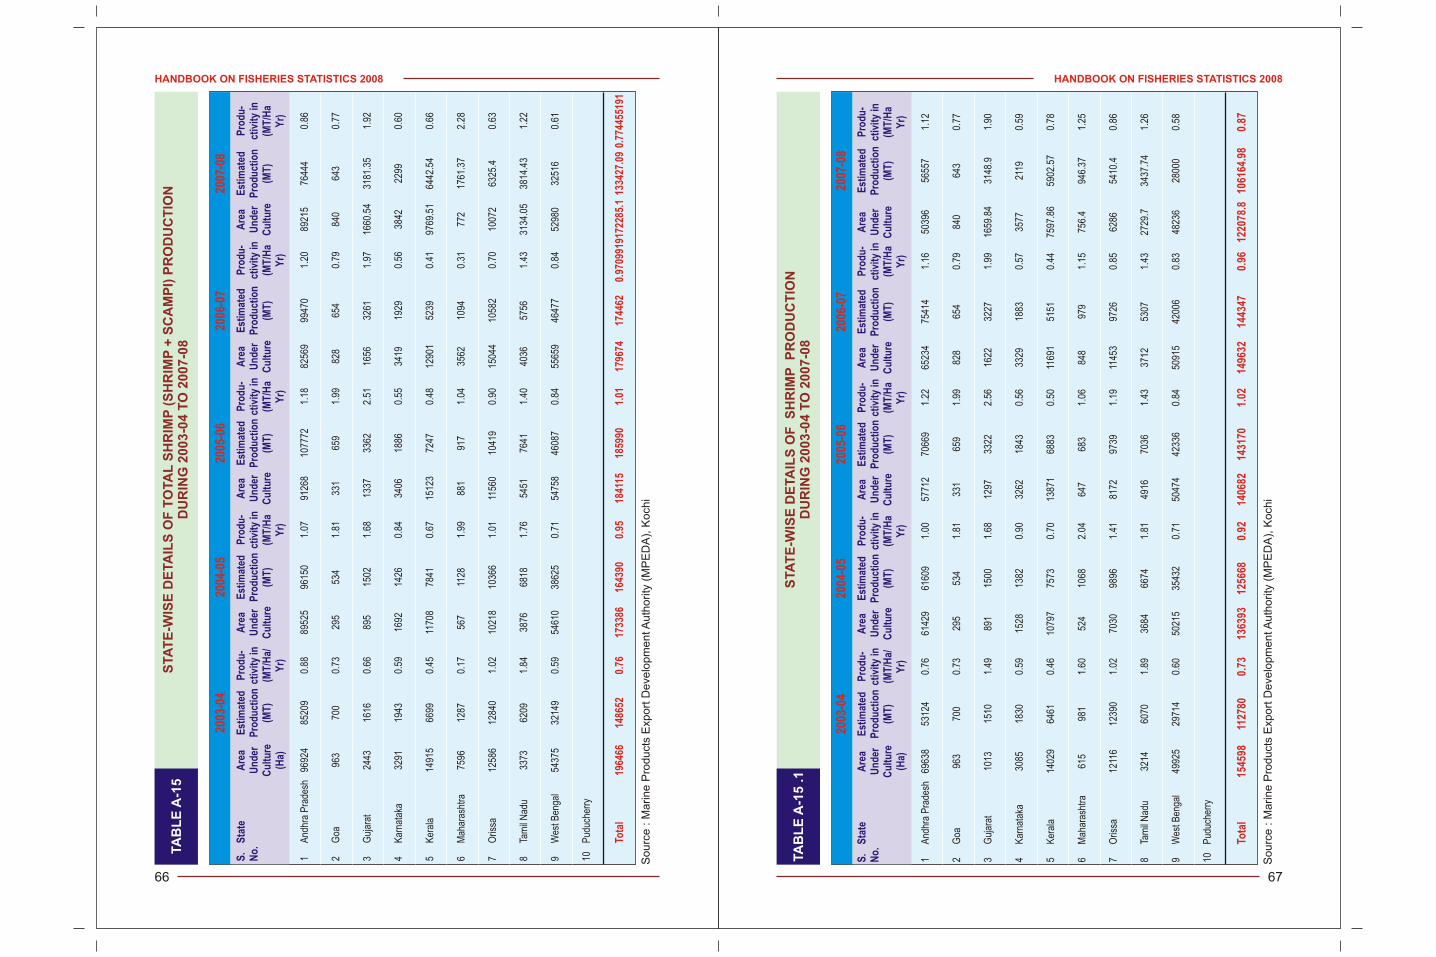
HANDBOOK ON FISHERIES STATISTICS 2008
67
HANDBOOK ON FISHERIES STATISTICS 2008
66
TA
BL
E A
-15
STA
TE
-WIS
E D
ETA
ILS
OF
TO
TA
L S
HR
IMP
(S
HR
IMP
+ S
CA
MP
I) P
RO
DU
CT
ION
DU
RIN
G 2
00
3-0
4 T
O 2
00
7-0
8
So
urc
e : M
arin
e P
rod
uct
s E
xpo
rt D
eve
lop
me
nt A
uth
ority
(M
PE
DA
), K
och
i
1A
ndhr
a P
rade
sh96
924
8520
90.
8889
525
9615
01.
0791
268
1077
721.
1882
569
9947
01.
2089
215
7644
40.
86
2G
oa96
370
00.
7329
553
41.
8133
165
91.
9982
865
40.
7984
064
30.
77
3G
ujar
at24
4316
160.
6689
515
021.
6813
3733
622.
5116
5632
611.
9716
60.5
431
81.3
51.
92
4K
arna
taka
3291
1943
0.59
1692
1426
0.84
3406
1886
0.55
3419
1929
0.56
3842
2299
0.60
5K
eral
a14
915
6699
0.45
1170
878
410.
6715
123
7247
0.48
1290
152
390.
4197
69.5
164
42.5
40.
66
6M
ahar
asht
ra75
9612
870.
1756
711
281.
9988
191
71.
0435
6210
940.
3177
217
61.3
72.
28
7O
rissa
1258
612
840
1.02
1021
810
366
1.01
1156
010
419
0.90
1504
410
582
0.70
1007
263
25.4
0.63
8Ta
mil
Nad
u33
7362
091.
8438
7668
181.
7654
5176
411.
4040
3657
561.
4331
34.0
538
14.4
31.
22
9W
est B
enga
l54
375
3214
90.
5954
610
3862
50.
7154
758
4608
70.
8455
659
4647
70.
8452
980
3251
60.
61
10P
uduc
herr
y
2003
-04
2004
-05
2005
-06
2006
-07
2007
-08
Tota
l19
6466
1486
520.
7617
3386
1643
900.
9518
4115
1859
901.
0117
9674
1744
620.
9709
9191
7228
5.1
1334
27.0
90.
7744
5519
1
S.
Sta
teA
rea
Est
imat
ed
Pro
du
-A
rea
Est
imat
ed
Pro
du
-A
rea
Est
imat
ed
Pro
du
-A
rea
Est
imat
ed
Pro
du
-A
rea
Est
imat
ed
Pro
du
-N
o.
Un
der
Pro
du
ctio
n c
tivi
ty in
U
nd
erP
rod
uct
ion
cti
vity
in
Un
der
Pro
du
ctio
n c
tivi
ty in
U
nd
erP
rod
uct
ion
ct
ivit
y in
U
nd
erP
rod
uct
ion
ct
ivit
y in
C
ult
ure
(M
T)
(MT
/Ha/
Cu
ltu
re
(MT
)(M
T/H
aC
ult
ure
(M
T)
(MT
/Ha
Cu
ltu
re
(MT
)(M
T/H
aC
ult
ure
(M
T)
(MT
/Ha
(Ha)
Yr)
Yr)
Yr)
Yr)
Yr)
TA
BL
E A
-15
.1
STA
TE
-WIS
E D
ETA
ILS
OF
S
HR
IMP
P
RO
DU
CT
ION
DU
RIN
G 2
00
3-0
4 T
O 2
00
7-0
8
So
urc
e : M
arin
e P
rod
uct
s E
xpo
rt D
eve
lop
me
nt A
uth
ority
(M
PE
DA
), K
och
i
1A
ndhr
a P
rade
sh69
638
5312
40.
7661
429
6160
91.
0057
712
7066
91.
2265
234
7541
41.
1650
396
5655
71.
12
2G
oa96
370
00.
7329
553
41.
8133
165
91.
9982
865
40.
7984
064
30.
77
3G
ujar
at10
1315
101.
4989
115
001.
6812
9733
222.
5616
2232
271.
9916
59.8
431
48.9
1.90
4K
arna
taka
3085
1830
0.59
1528
1382
0.90
3262
1843
0.56
3329
1883
0.57
3577
2119
0.59
5K
eral
a14
029
6461
0.46
1079
775
730.
7013
871
6883
0.50
1169
151
510.
4475
97.8
659
02.5
70.
78
6M
ahar
asht
ra61
598
11.
6052
410
682.
0464
768
31.
0684
897
91.
1575
6.4
946.
371.
25
7O
rissa
1211
612
390
1.02
7030
9896
1.41
8172
9739
1.19
1145
397
260.
8562
8654
10.4
0.86
8Ta
mil
Nad
u32
1460
701.
8936
8466
741.
8149
1670
361.
4337
1253
071.
4327
29.7
3437
.74
1.26
9W
est B
enga
l49
925
2971
40.
6050
215
3543
20.
7150
474
4233
60.
8450
915
4200
60.
8348
236
2800
00.
58
10P
uduc
herr
y
2003
-04
2004
-05
2005
-06
2006
-07
2007
-08
Tota
l15
4598
1127
800.
7313
6393
1256
680.
9214
0682
1431
701.
0214
9632
1443
470.
9612
2078
.810
6164
.98
0.87
S.
Sta
teA
rea
Est
imat
ed
Pro
du
-A
rea
Est
imat
ed
Pro
du
-A
rea
Est
imat
ed
Pro
du
-A
rea
Est
imat
ed
Pro
du
-A
rea
Est
imat
ed
Pro
du
-N
o.
Un
der
Pro
du
ctio
n c
tivi
ty in
U
nd
erP
rod
uct
ion
cti
vity
in
Un
der
Pro
du
ctio
n c
tivi
ty in
U
nd
erP
rod
uct
ion
ct
ivit
y in
U
nd
erP
rod
uct
ion
cti
vity
in
Cu
ltu
re
(MT
)(M
T/H
a/C
ult
ure
(M
T)
(MT
/Ha
Cu
ltu
re
(MT
)(M
T/H
aC
ult
ure
(M
T)
(MT
/Ha
Cu
ltu
re
(MT
)(M
T/H
a(H
a)Y
r)Y
r)Y
r)Y
r)Y
r)
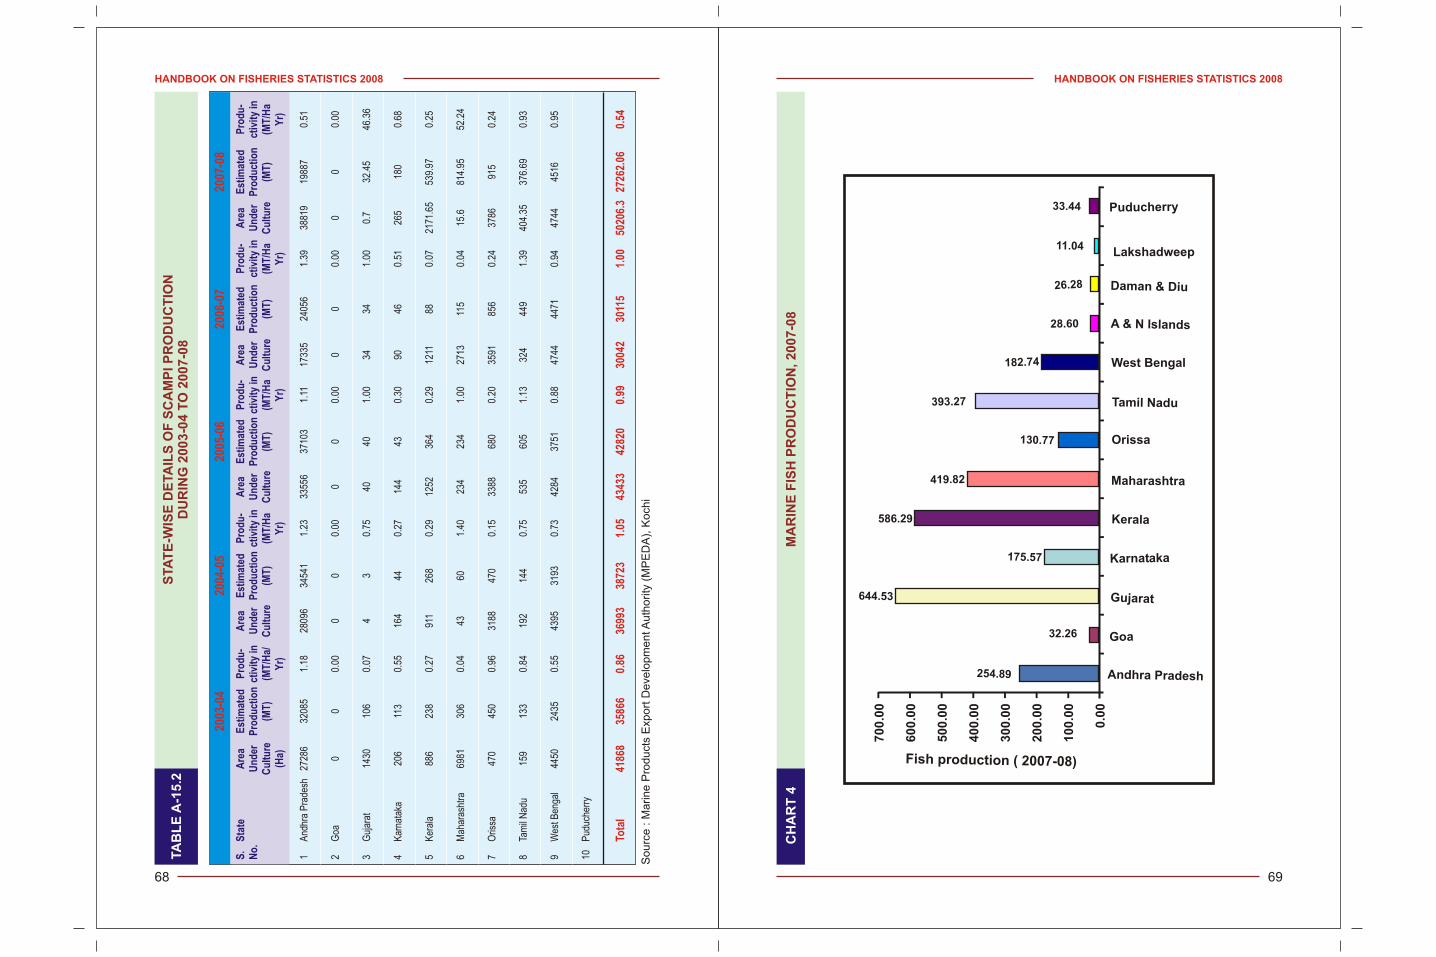
CH
AR
T 4
MA
RIN
E F
ISH
PR
OD
UC
TIO
N, 2
00
7-0
8
70
0.0
0
60
0.0
0
50
0.0
0
40
0.0
0
30
0.0
0
20
0.0
0
10
0.0
0
0.0
0
r c n 2Fish p odu tio ( 007-08)
A hr ra eshnd a P d
Goa
G j ratu a
K r a aa n t ka
aKer la
h tMa arash ra
Or ssai
NTamil adu
We t Bengals
A & N Islands
Dam & uan Di
L ka shadweep
Puducherry
2 8954.
632.2
4 364 .5
.175 57
8 .5 6 29
4 9.81 2
130.77
393.27
74182.
28.60
26 28.
411.0
3 43 . 4
HANDBOOK ON FISHERIES STATISTICS 2008
69
HANDBOOK ON FISHERIES STATISTICS 2008
68
TA
BL
E A
-15
.2S
TA
TE
-WIS
E D
ETA
ILS
OF
SC
AM
PI P
RO
DU
CT
ION
DU
RIN
G 2
00
3-0
4 T
O 2
00
7-0
8
So
urc
e : M
arin
e P
rod
uct
s E
xpo
rt D
eve
lop
me
nt A
uth
ority
(M
PE
DA
), K
och
i
1A
ndhr
a P
rade
sh27
286
3208
51.
1828
096
3454
11.
2333
556
3710
31.
1117
335
2405
61.
3938
819
1988
70.
51
2G
oa0
00.
000
00.
000
00.
000
00.
000
00.
00
3G
ujar
at14
3010
60.
074
30.
7540
401.
0034
341.
000.
732
.45
46.3
6
4K
arna
taka
206
113
0.55
164
440.
2714
443
0.30
9046
0.51
265
180
0.68
5K
eral
a88
623
80.
2791
126
80.
2912
5236
40.
2912
1188
0.07
2171
.65
539.
970.
25
6M
ahar
asht
ra69
8130
60.
0443
601.
4023
423
41.
0027
1311
50.
0415
.681
4.95
52.2
4
7O
rissa
470
450
0.96
3188
470
0.15
3388
680
0.20
3591
856
0.24
3786
915
0.24
8Ta
mil
Nad
u15
913
30.
8419
214
40.
7553
560
51.
1332
444
91.
3940
4.35
376.
690.
93
9W
est B
enga
l44
5024
350.
5543
9531
930.
7342
8437
510.
8847
4444
710.
9447
4445
160.
95
10P
uduc
herr
y
2003
-04
2004
-05
2005
-06
2006
-07
2007
-08
Tota
l41
868
3586
60.
8636
993
3872
31.
0543
433
4282
00.
9930
042
3011
51.
0050
206.
327
262.
060.
54
S.
Sta
teA
rea
Est
imat
ed
Pro
du
-A
rea
Est
imat
ed
Pro
du
-A
rea
Est
imat
ed
Pro
du
-A
rea
Est
imat
ed
Pro
du
-A
rea
Est
imat
ed
Pro
du
-N
o.
Un
der
Pro
du
ctio
n c
tivi
ty in
U
nd
erP
rod
uct
ion
cti
vity
in
Un
der
Pro
du
ctio
n c
tivi
ty in
U
nd
erP
rod
uct
ion
ct
ivit
y in
U
nd
erP
rod
uct
ion
ct
ivit
y in
C
ult
ure
(M
T)
(MT
/Ha/
Cu
ltu
re
(MT
)(M
T/H
aC
ult
ure
(M
T)
(MT
/Ha
Cu
ltu
re
(MT
)(M
T/H
aC
ult
ure
(M
T)
(MT
/Ha
(Ha)
Yr)
Yr)
Yr)
Yr)
Yr)
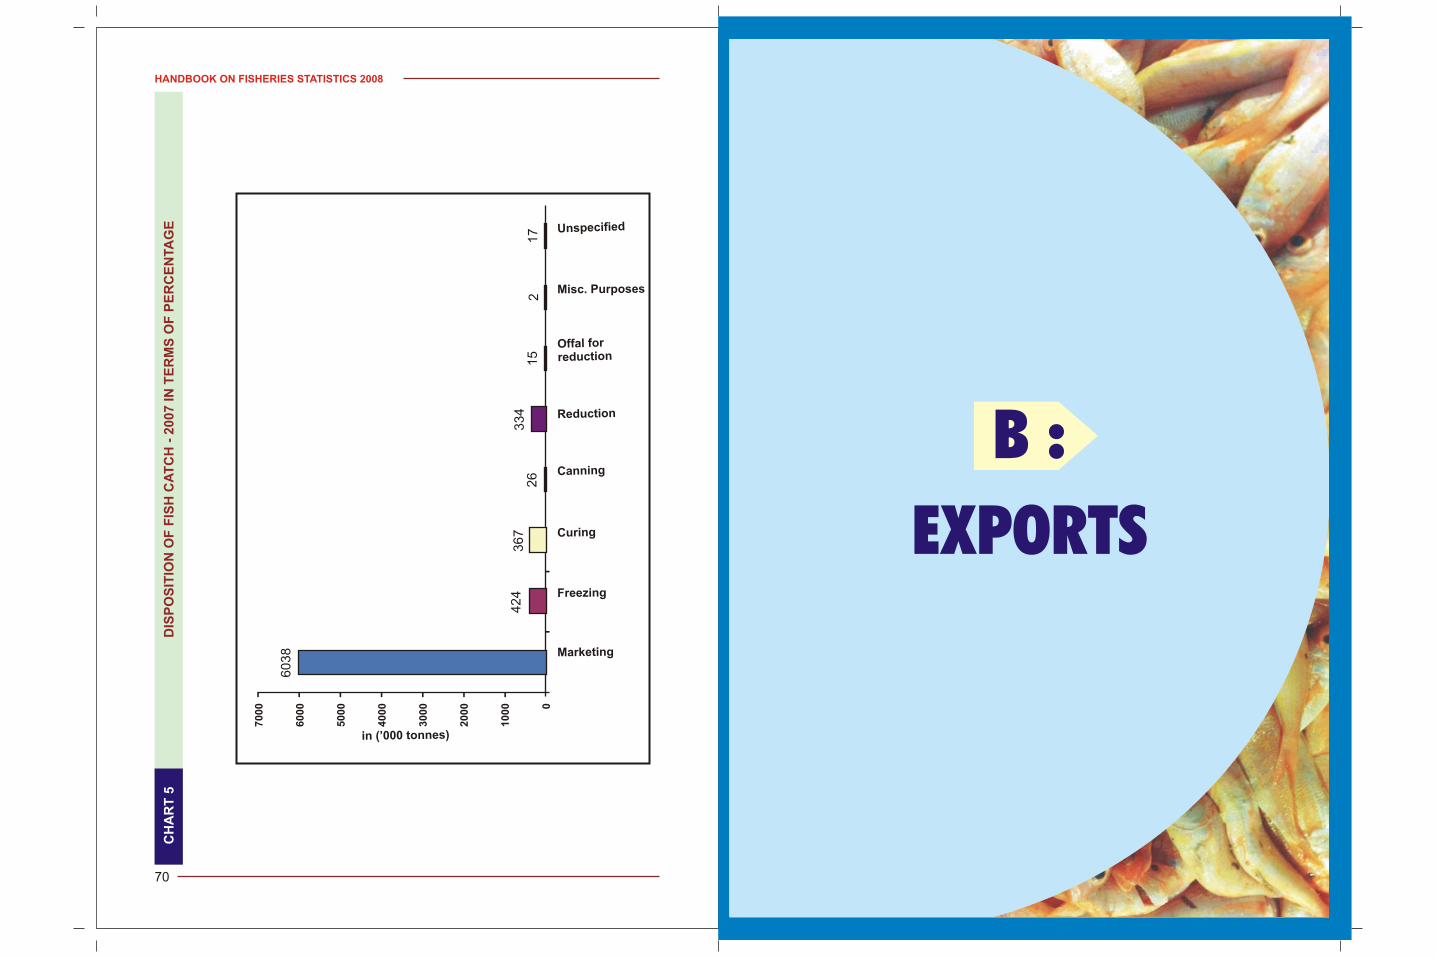
HANDBOOK ON FISHERIES STATISTICS 2008
70
CH
AR
T 5
DIS
PO
SIT
ION
OF
FIS
H C
AT
CH
- 2
00
7 IN
TE
RM
S O
F P
ER
CE
NTA
GE
70
00
60
00
50
00
40
00
30
00
20
00
10
00 0
60
38
42
43
67
26
33
41
52
17
M ketiar ng
Fr ezinge
Cu ir ng
Ca ni gn n
uRed ction
Offal fored cti nr u o
s u oMi c. P rp ses
ifiedUnspec
tin (’000 onnes)
B :
EXPORTS
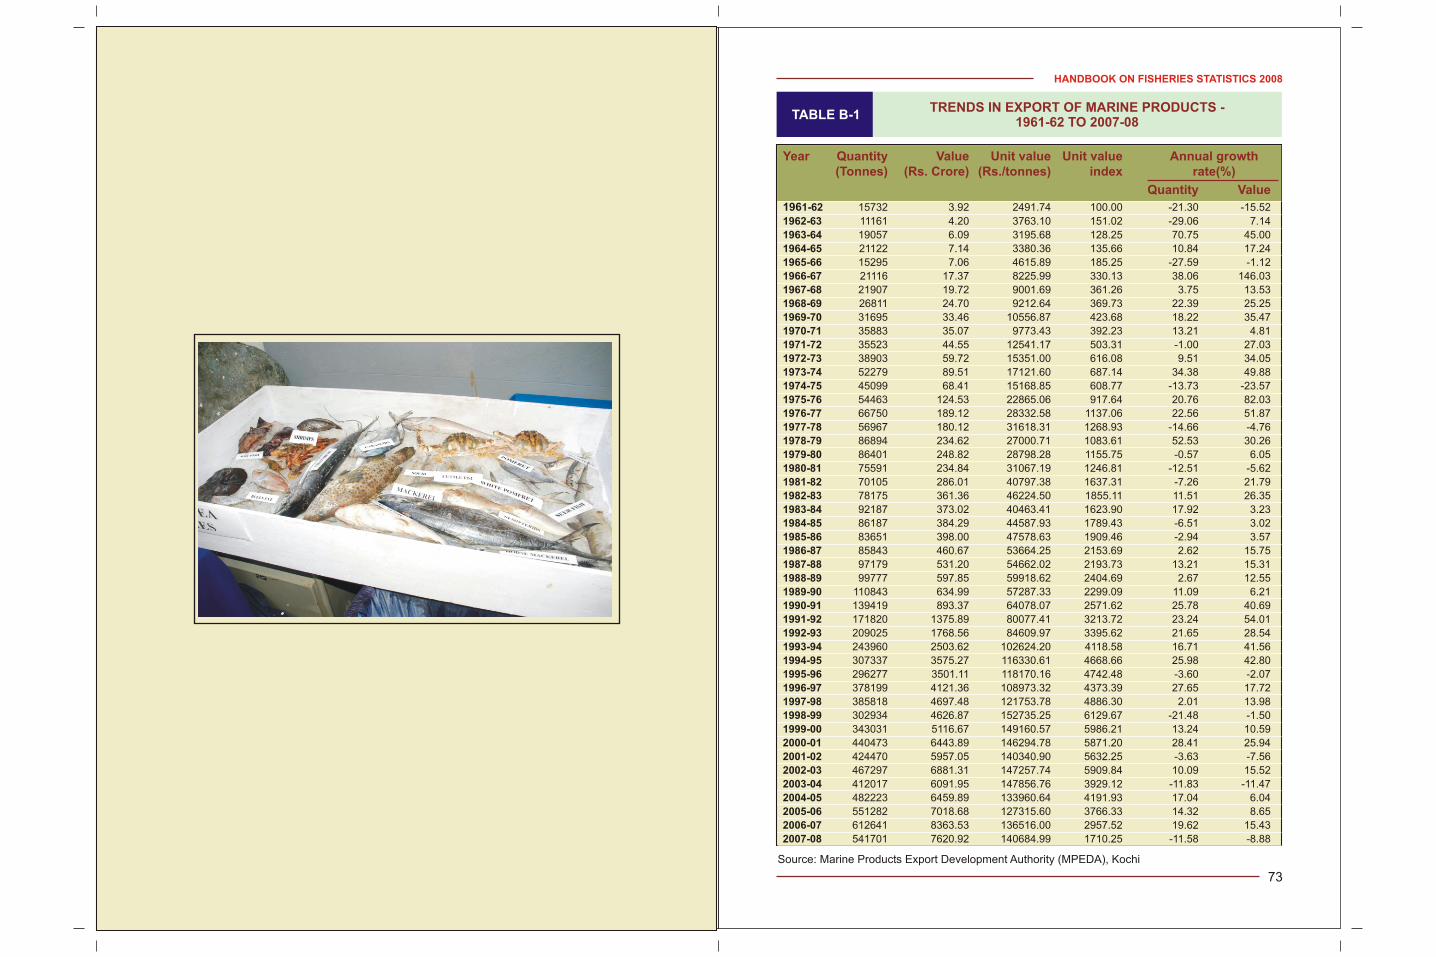
HANDBOOK ON FISHERIES STATISTICS 2008
73
TABLE B-1 TRENDS IN EXPORT OF MARINE PRODUCTS -
1961-62 TO 2007-08
Source: Marine Products Export Development Authority (MPEDA), Kochi
Year Quantity Value Unit value Unit value Annual growth (Tonnes) (Rs. Crore) (Rs./tonnes) index rate(%)
Quantity Value
1961-62 15732 3.92 2491.74 100.00 -21.30 -15.52
1962-63 11161 4.20 3763.10 151.02 -29.06 7.14
1963-64 19057 6.09 3195.68 128.25 70.75 45.00
1964-65 21122 7.14 3380.36 135.66 10.84 17.24
1965-66 15295 7.06 4615.89 185.25 -27.59 -1.12
1966-67 21116 17.37 8225.99 330.13 38.06 146.03
1967-68 21907 19.72 9001.69 361.26 3.75 13.53
1968-69 26811 24.70 9212.64 369.73 22.39 25.25
1969-70 31695 33.46 10556.87 423.68 18.22 35.47
1970-71 35883 35.07 9773.43 392.23 13.21 4.81
1971-72 35523 44.55 12541.17 503.31 -1.00 27.03
1972-73 38903 59.72 15351.00 616.08 9.51 34.05
1973-74 52279 89.51 17121.60 687.14 34.38 49.88
1974-75 45099 68.41 15168.85 608.77 -13.73 -23.57
1975-76 54463 124.53 22865.06 917.64 20.76 82.03
1976-77 66750 189.12 28332.58 1137.06 22.56 51.87
1977-78 56967 180.12 31618.31 1268.93 -14.66 -4.76
1978-79 86894 234.62 27000.71 1083.61 52.53 30.26
1979-80 86401 248.82 28798.28 1155.75 -0.57 6.05
1980-81 75591 234.84 31067.19 1246.81 -12.51 -5.62
1981-82 70105 286.01 40797.38 1637.31 -7.26 21.79
1982-83 78175 361.36 46224.50 1855.11 11.51 26.35
1983-84 92187 373.02 40463.41 1623.90 17.92 3.23
1984-85 86187 384.29 44587.93 1789.43 -6.51 3.02
1985-86 83651 398.00 47578.63 1909.46 -2.94 3.57
1986-87 85843 460.67 53664.25 2153.69 2.62 15.75
1987-88 97179 531.20 54662.02 2193.73 13.21 15.31
1988-89 99777 597.85 59918.62 2404.69 2.67 12.55
1989-90 110843 634.99 57287.33 2299.09 11.09 6.21
1990-91 139419 893.37 64078.07 2571.62 25.78 40.69
1991-92 171820 1375.89 80077.41 3213.72 23.24 54.01
1992-93 209025 1768.56 84609.97 3395.62 21.65 28.54
1993-94 243960 2503.62 102624.20 4118.58 16.71 41.56
1994-95 307337 3575.27 116330.61 4668.66 25.98 42.80
1995-96 296277 3501.11 118170.16 4742.48 -3.60 -2.07
1996-97 378199 4121.36 108973.32 4373.39 27.65 17.72
1997-98 385818 4697.48 121753.78 4886.30 2.01 13.98
1998-99 302934 4626.87 152735.25 6129.67 -21.48 -1.50
1999-00 343031 5116.67 149160.57 5986.21 13.24 10.59
2000-01 440473 6443.89 146294.78 5871.20 28.41 25.94
2001-02 424470 5957.05 140340.90 5632.25 -3.63 -7.56
2002-03 467297 6881.31 147257.74 5909.84 10.09 15.52
2003-04 412017 6091.95 147856.76 3929.12 -11.83 -11.47
2004-05 482223 6459.89 133960.64 4191.93 17.04 6.04
2005-06 551282 7018.68 127315.60 3766.33 14.32 8.65
2006-07 612641 8363.53 136516.00 2957.52 19.62 15.43
2007-08 541701 7620.92 140684.99 1710.25 -11.58 -8.88
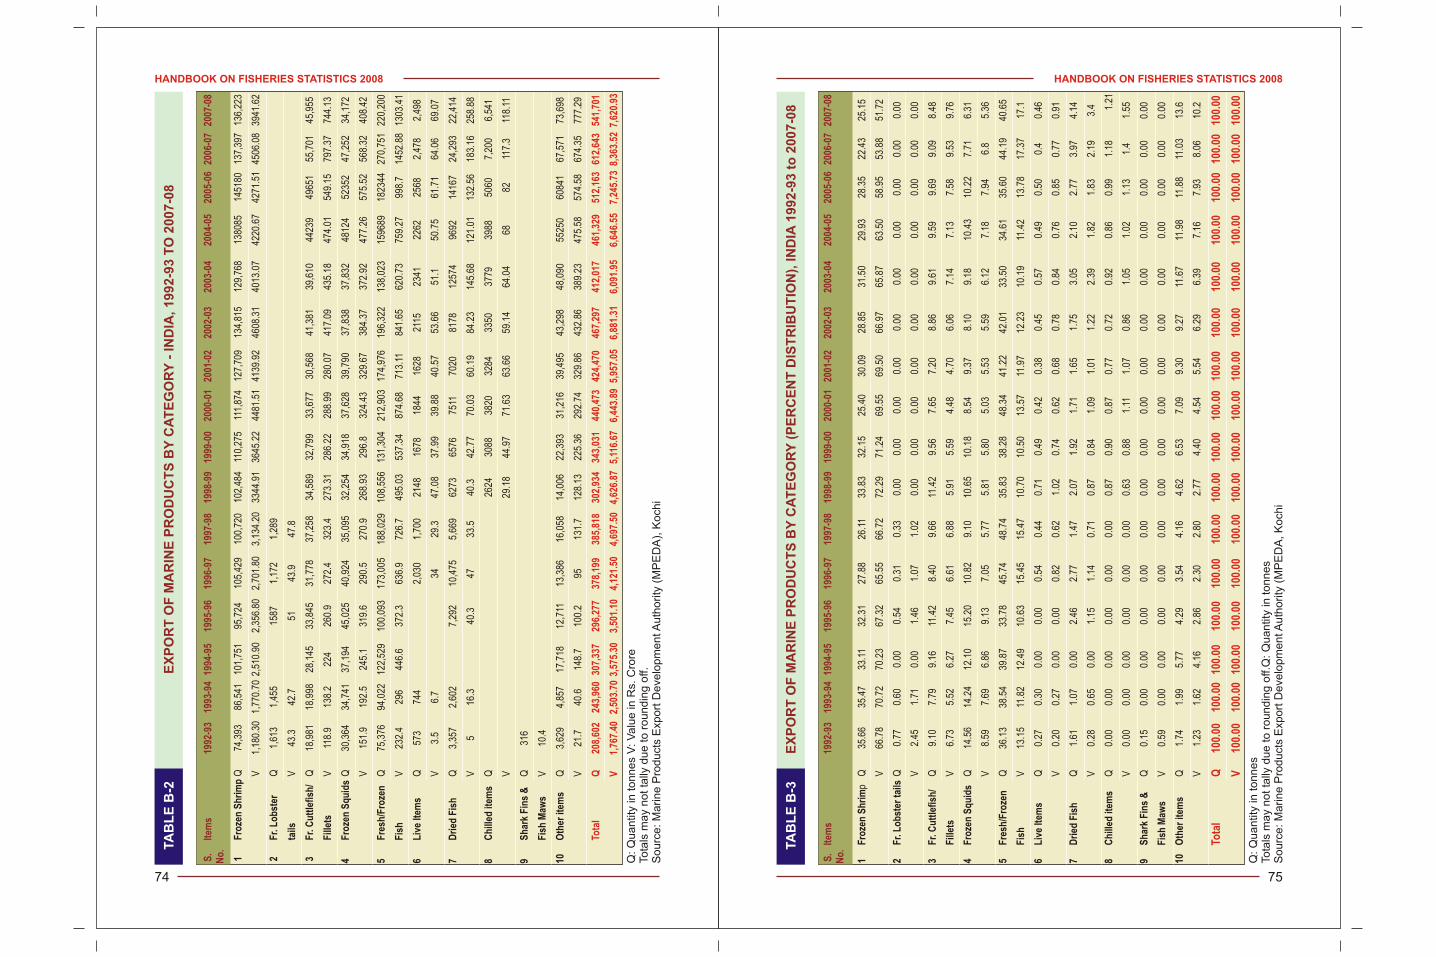
HANDBOOK ON FISHERIES STATISTICS 2008
75
HANDBOOK ON FISHERIES STATISTICS 2008
74
TA
BL
E B
-2E
XP
OR
T O
F M
AR
INE
PR
OD
UC
TS
BY
CA
TE
GO
RY
- IN
DIA
, 1
99
2-9
3 T
O 2
00
7-0
8
Q: Q
ua
ntit
y in
to
nn
es
V: V
alu
e in
Rs.
Cro
reTo
tals
ma
y n
ot ta
lly d
ue
to
ro
un
din
g o
ff.
So
urc
e: M
arin
e P
rod
uct
s E
xpo
rt D
eve
lop
me
nt A
uth
ority
(M
PE
DA
), K
och
i
1F
roze
n S
hri
mp
Q74
,393
86,5
4110
1,75
195
,724
105,
429
100,
720
102,
484
110,
275
111,
874
127,
709
134,
815
129,
768
1380
8514
5180
137,
397
136,
223
V1,
180.
301,
770.
702,
510.
902,
356.
802,
701.
803,
134.
2033
44.9
136
45.2
244
81.5
141
39.9
246
08.3
140
13.0
742
20.6
742
71.5
145
06.0
839
41.6
2
2F
r. L
ob
ster
Q
1,61
31,
455
1587
1,17
21,
289
tails
V43
.342
.751
43.9
47.8
3F
r. C
utt
lefi
sh/
Q18
,981
18,9
9828
,145
33,8
4531
,778
37,2
5834
,589
32,7
9933
,677
30,5
6841
,381
39,6
1044
239
4965
155
,701
45,9
55
Fill
ets
V11
8.9
138.
222
426
0.9
272.
432
3.4
273.
3128
6.22
288.
9928
0.07
417.
0943
5.18
474.
0154
9.15
797.
3774
4.13
4F
roze
n S
qu
ids
Q30
,364
34,7
4137
,194
45,0
2540
,924
35,0
9532
,254
34,9
1837
,628
39,7
9037
,838
37,8
3248
124
5235
247
,252
34,1
72
V15
1.9
192.
524
5.1
319.
629
0.5
270.
926
8.93
296.
832
4.43
329.
6738
4.37
372.
9247
7.26
575.
5256
8.32
408.
42
5F
resh
/Fro
zen
Q
75,3
7694
,022
122,
529
100,
093
173,
005
188,
029
108,
556
131,
304
212,
903
174,
976
196,
322
138,
023
1596
8918
2344
270,
751
220,
200
Fis
hV
232.
429
644
6.6
372.
363
6.9
726.
749
5.03
537.
3487
4.68
713.
1184
1.65
620.
7375
9.27
998.
714
52.8
813
03.4
1
6L
ive
Item
sQ
573
744
2,03
01,
700
2148
1678
1844
1628
2115
2341
2262
2568
2,47
82,
498
V3.
56.
734
29.3
47.0
837
.99
39.8
840
.57
53.6
651
.150
.75
61.7
164
.06
69.0
7
7D
ried
Fis
hQ
3,35
72,
602
7,29
210
,475
5,66
962
7365
7675
1170
2081
7812
574
9692
1416
724
,293
22,4
14
V5
16.3
40.3
4733
.540
.342
.77
70.0
360
.19
84.2
314
5.68
121.
0113
2.56
183.
1625
8.88
8C
hill
ed it
ems
Q26
2430
8838
2032
8433
5037
7939
8850
607,
200
6,54
1
V29
.18
44.9
771
.63
63.6
659
.14
64.0
468
8211
7.3
118.
11
9S
har
k F
ins
&
Q31
6
Fis
h M
aws
V10
.4
10O
ther
item
sQ
3,62
94,
857
17,7
1812
,711
13,3
8616
,058
14,0
0622
,393
31,2
1639
,495
43,2
9848
,090
5525
060
841
67,5
7173
,698
V21
.740
.614
8.7
100.
295
131.
712
8.13
225.
3629
2.74
329.
8643
2.86
389.
2347
5.58
574.
5867
4.35
777.
29
S.
Item
s19
92-9
319
93-9
419
94-9
519
95-9
619
96-9
719
97-9
819
98-9
919
99-0
020
00-0
120
01-0
220
02-0
320
03-0
420
04-0
520
05-0
620
06-0
720
07-0
8N
o.
Tota
lQ
208,
602
243,
960
307,
337
296,
277
378,
199
385,
818
302,
934
343,
031
440,
473
424,
470
467,
297
412,
017
461,
329
512,
163
612,
643
541,
701
V1,
767.
402,
503.
703,
575.
303,
501.
104,
121.
504,
697.
504,
626.
875,
116.
676,
443.
895,
957.
056,
881.
316,
091.
956,
646.
557,
245.
738,
363.
527,
620.
93
TA
BL
E B
-3
EX
PO
RT
OF
MA
RIN
E P
RO
DU
CT
S B
Y C
AT
EG
OR
Y (
PE
RC
EN
T D
IST
RIB
UT
ION
), IN
DIA
19
92
-93
to
20
07
-08
Q: Q
ua
ntit
y in
to
nn
es
Tota
ls m
ay
no
t ta
lly d
ue
to
ro
un
din
g o
ff.Q
: Q
ua
ntit
y in
to
nn
es
So
urc
e: M
arin
e P
rod
uct
s E
xpo
rt D
eve
lop
me
nt A
uth
ority
(M
PE
DA
, K
och
i
1F
roze
n S
hri
mp
Q35
.66
35.4
733
.11
32.3
127
.88
26.1
133
.83
32.1
525
.40
30.0
928
.85
31.5
029
.93
28.3
522
.43
25.1
5
V66
.78
70.7
270
.23
67.3
265
.55
66.7
272
.29
71.2
469
.55
69.5
066
.97
65.8
763
.50
58.9
553
.88
51.7
2
2F
r. L
ob
ster
tai
lsQ
0.77
0.60
0.00
0.54
0.31
0.33
0.00
0.00
0.00
0.00
0.00
0.00
0.00
0.00
0.00
0.00
V2.
451.
710.
001.
461.
071.
020.
000.
000.
000.
000.
000.
000.
000.
000.
000.
00
3F
r. C
utt
lefi
sh/
Q9.
107.
799.
1611
.42
8.40
9.66
11.4
29.
567.
657.
208.
869.
619.
599.
699.
098.
48
Fill
ets
V6.
735.
526.
277.
456.
616.
885.
915.
594.
484.
706.
067.
147.
137.
589.
539.
76
4F
roze
n S
qu
ids
Q14
.56
14.2
412
.10
15.2
010
.82
9.10
10.6
510
.18
8.54
9.37
8.10
9.18
10.4
310
.22
7.71
6.31
V8.
597.
696.
869.
137.
055.
775.
815.
805.
035.
535.
596.
127.
187.
946.
85.
36
5F
resh
/Fro
zen
Q
36.1
338
.54
39.8
733
.78
45.7
448
.74
35.8
338
.28
48.3
441
.22
42.0
133
.50
34.6
135
.60
44.1
940
.65
Fis
hV
13.1
511
.82
12.4
910
.63
15.4
515
.47
10.7
010
.50
13.5
711
.97
12.2
310
.19
11.4
213
.78
17.3
717
.1
6L
ive
Item
sQ
0.27
0.30
0.00
0.00
0.54
0.44
0.71
0.49
0.42
0.38
0.45
0.57
0.49
0.50
0.4
0.46
V0.
200.
270.
000.
000.
820.
621.
020.
740.
620.
680.
780.
840.
760.
850.
770.
91
7D
ried
Fis
hQ
1.61
1.07
0.00
2.46
2.77
1.47
2.07
1.92
1.71
1.65
1.75
3.05
2.10
2.77
3.97
4.14
V0.
280.
650.
001.
151.
140.
710.
870.
841.
091.
011.
222.
391.
821.
832.
193.
4
8C
hill
ed it
ems
Q0.
000.
000.
000.
000.
000.
000.
870.
900.
870.
770.
720.
920.
860.
991.
181.
21
V0.
000.
000.
000.
000.
000.
000.
630.
881.
111.
070.
861.
051.
021.
131.
41.
55
9S
har
k F
ins
&
Q0.
150.
000.
000.
000.
000.
000.
000.
000.
000.
000.
000.
000.
000.
000.
000.
00
Fis
h M
aws
V0.
590.
000.
000.
000.
000.
000.
000.
000.
000.
000.
000.
000.
000.
000.
000.
00
10O
ther
item
sQ
1.74
1.99
5.77
4.29
3.54
4.16
4.62
6.53
7.09
9.30
9.27
11.6
711
.98
11.8
811
.03
13.6
V1.
231.
624.
162.
862.
302.
802.
774.
404.
545.
546.
296.
397.
167.
938.
0610
.2
S.
Item
s19
92-9
319
93-9
419
94-9
519
95-9
619
96-9
719
97-9
819
98-9
919
99-0
020
00-0
120
01-0
220
02-0
320
03-0
420
04-0
520
05-0
620
06-0
720
07-0
8N
o.
Tota
lQ
100.
0010
0.00
100.
0010
0.00
100.
0010
0.00
100.
0010
0.00
100.
0010
0.00
100.
0010
0.00
100.
0010
0.00
100.
0010
0.00
V10
0.00
100.
0010
0.00
100.
0010
0.00
100.
0010
0.00
100.
0010
0.00
100.
0010
0.00
100.
0010
0.00
100.
0010
0.00
100.
00
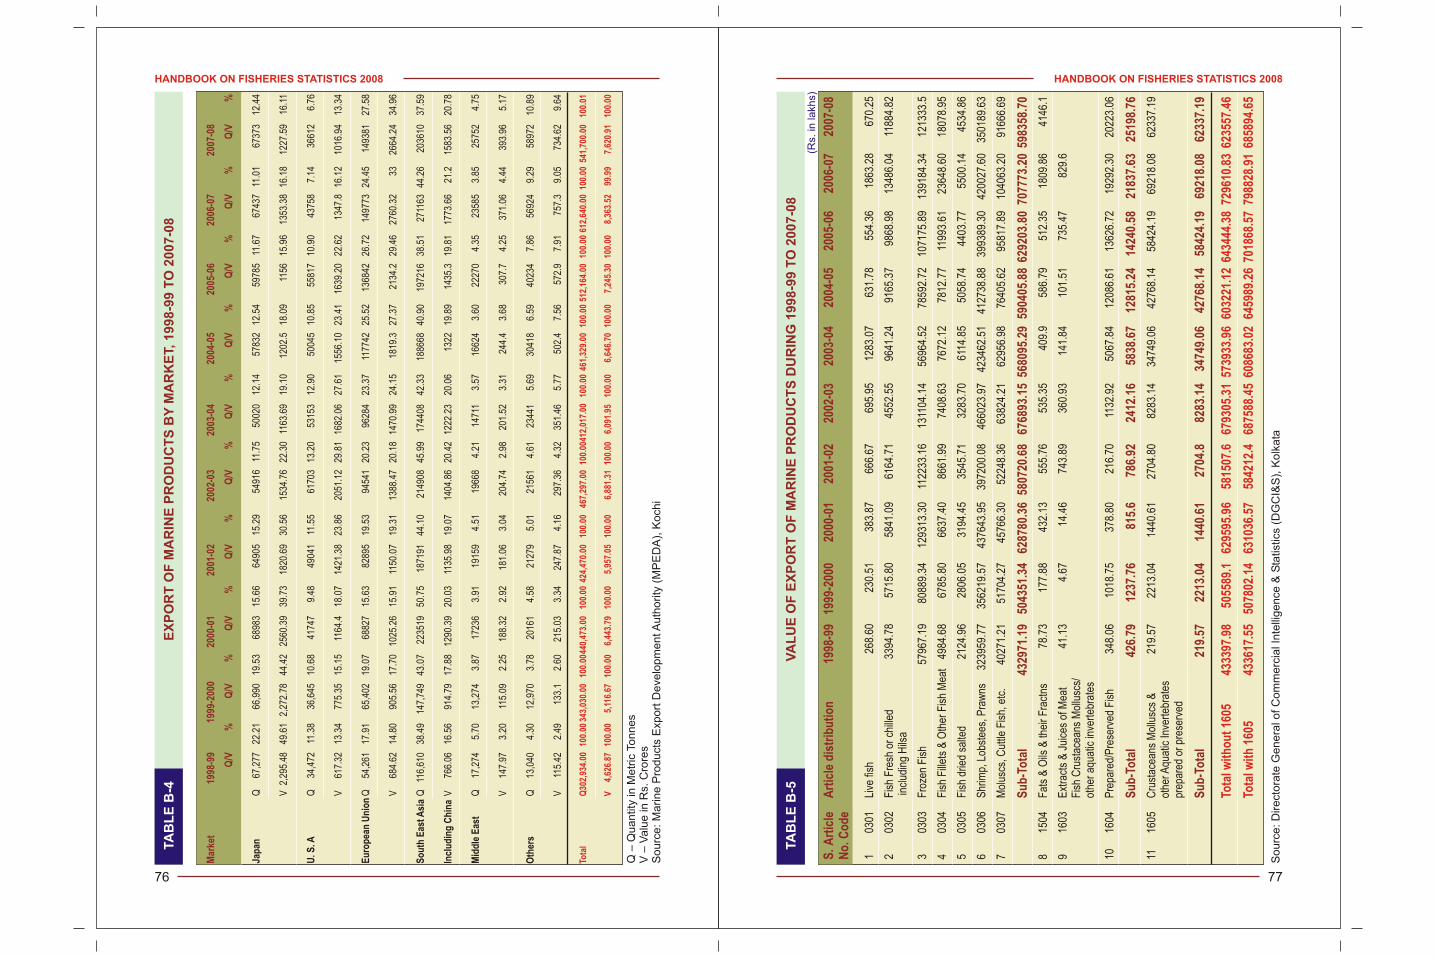
HANDBOOK ON FISHERIES STATISTICS 2008
77
HANDBOOK ON FISHERIES STATISTICS 2008
76
TA
BL
E B
-4
EX
PO
RT
OF
MA
RIN
E P
RO
DU
CT
S B
Y M
AR
KE
T, 1
99
8-9
9 T
O 2
00
7-0
8
Q –
Qu
an
tity
in M
etr
ic T
on
ne
sV
– V
alu
e in
Rs.
Cro
res
So
urc
e: M
arin
e P
rod
uct
s E
xpo
rt D
eve
lop
me
nt A
uth
ority
(M
PE
DA
), K
och
i
TA
BL
E B
-5V
AL
UE
OF
EX
PO
RT
OF
MA
RIN
E P
RO
DU
CT
S D
UR
ING
19
98
-99
TO
20
07
-08
So
urc
e: D
ire
cto
rate
Ge
ne
ral o
f C
om
me
rcia
l In
telli
ge
nce
& S
tatis
tics
(DG
CI&
S),
Ko
lka
ta
Mar
ket
1998
-99
1999
-200
020
00-0
120
01-0
220
02-0
320
03-0
420
04-0
520
05-0
620
06-0
720
07-0
8
Q/V
%Q
/V%
Q/V
%Q
/V%
Q/V
%Q
/V%
Q/V
%Q
/V%
Q/V
%Q
/V%
Jap
anQ
67,2
7722
.21
66,9
9019
.53
6898
315
.66
6490
515
.29
5491
611
.75
5002
012
.14
5783
212
.54
5978
511
.67
6743
711
.01
6737
312
.44
V2,
295.
4849
.61
2,27
2.78
44.4
225
60.3
939
.73
1820
.69
30.5
615
34.7
622
.30
1163
.69
19.1
012
02.5
18.0
911
5615
.96
1353
.38
16.1
812
27.5
916
.11
U. S
. AQ
34,4
7211
.38
36,6
4510
.68
4174
79.
4849
041
11.5
561
703
13.2
053
153
12.9
050
045
10.8
555
817
10.9
043
758
7.14
3661
26.
76
V61
7.32
13.3
477
5.35
15.1
511
64.4
18.0
714
21.3
823
.86
2051
.12
29.8
116
82.0
627
.61
1556
.10
23.4
116
39.2
022
.62
1347
.816
.12
1016
.94
13.3
4
Eu
rop
ean
Un
ion
Q54
,261
17.9
165
,402
19.0
768
827
15.6
382
895
19.5
394
541
20.2
396
284
23.3
711
7742
25.5
213
6842
26.7
214
9773
24.4
514
9381
27.5
8
V68
4.62
14.8
090
5.56
17.7
010
25.2
615
.91
1150
.07
19.3
113
88.4
720
.18
1470
.99
24.1
518
19.3
27.3
721
34.2
29.4
627
60.3
233
2664
.24
34.9
6
So
uth
Eas
t Asi
a Q
116,
610
38.4
914
7,74
943
.07
2235
1950
.75
1871
9144
.10
2149
0845
.99
1744
0842
.33
1886
6840
.90
1972
1638
.51
2711
6344
.26
2036
1037
.59
Incl
ud
ing
Ch
ina
V76
6.06
16.5
691
4.79
17.8
812
90.3
920
.03
1135
.98
19.0
714
04.8
620
.42
1222
.23
20.0
613
2219
.89
1435
.319
.81
1773
.66
21.2
1583
.56
20.7
8
Mid
dle
Eas
tQ
17,2
745.
7013
,274
3.87
1723
63.
9119
159
4.51
1966
84.
2114
711
3.57
1662
43.
6022
270
4.35
2358
53.
8525
752
4.75
V14
7.97
3.20
115.
092.
2518
8.32
2.92
181.
063.
0420
4.74
2.98
201.
523.
3124
4.4
3.68
307.
74.
2537
1.06
4.44
393.
965.
17
Oth
ers
Q13
,040
4.30
12,9
703.
7820
161
4.58
2127
95.
0121
561
4.61
2344
15.
6930
418
6.59
4023
47.
8656
924
9.29
5897
210
.89
V11
5.42
2.49
133.
12.
6021
5.03
3.34
247.
874.
1629
7.36
4.32
351.
465.
7750
2.4
7.56
572.
97.
9175
7.3
9.05
734.
629.
64
Tota
lQ
302,
934.
0010
0.00
343,
030.
0010
0.00
440,
473.
0010
0.00
424,
470.
0010
0.00
467,
297.
0010
0.00
412,
017.
0010
0.00
461,
329.
0010
0.00
512,
164.
0010
0.00
612,
640.
0010
0.00
541,
700.
0010
0.01
V4,
626.
8710
0.00
5,11
6.67
100.
006,
443.
7910
0.00
5,95
7.05
100.
006,
881.
3110
0.00
6,09
1.95
100.
006,
646.
7010
0.00
7,24
5.30
100.
008,
363.
5299
.99
7,62
0.91
100.
00
(Rs.
in la
khs)
103
01Li
ve fi
sh26
8.60
230.
5138
3.87
666.
6769
5.95
1283
.07
631.
7855
4.36
1863
.28
670.
25
203
02F
ish
Fre
sh o
r ch
illed
3394
.78
5715
.80
5841
.09
6164
.71
4552
.55
9641
.24
9165
.37
9868
.98
1348
6.04
1188
4.82
incl
udin
g H
ilsa
303
03F
roze
n F
ish
5796
7.19
8088
9.34
1293
13.3
011
2233
.16
1311
04.1
456
964.
5278
592.
7210
7175
.89
1391
84.3
412
1333
.5
403
04F
ish
Fill
ets
& O
ther
Fis
h M
eat
4984
.68
6785
.80
6637
.40
8661
.99
7408
.63
7672
.12
7812
.77
1199
3.61
2364
8.60
1807
8.95
503
05F
ish
drie
d sa
lted
2124
.96
2806
.05
3194
.45
3545
.71
3283
.70
6114
.85
5058
.74
4403
.77
5500
.14
4534
.86
603
06S
hrim
p, L
obst
ees,
Pra
wns
3239
59.7
735
6219
.57
4376
43.9
539
7200
.08
4660
23.9
742
3462
.51
4127
38.8
839
9389
.30
4200
27.6
035
0189
.63
703
07M
olus
cs, C
uttle
Fis
h, e
tc.
4027
1.21
5170
4.27
4576
6.30
5224
8.36
6382
4.21
6295
6.98
7640
5.62
9581
7.89
1040
63.2
091
666.
69
815
04F
ats
& O
ils &
thei
r F
ract
ns78
.73
177.
8843
2.13
555.
7653
5.35
409.
958
6.79
512.
3518
09.8
641
46.1
916
03E
xtra
cts
& J
uice
s of
Mea
t41
.13
4.67
14.4
674
3.89
360.
9314
1.84
101.
5173
5.47
829.
6F
ish
Cru
stac
eans
Mol
lusc
s/ot
her
aqua
tic in
vert
ebra
tes
1016
04P
repa
red/
Pre
serv
ed F
ish
348.
0610
18.7
537
8.80
216.
7011
32.9
250
67.8
412
086.
6113
626.
7219
292.
3020
223.
06
1116
05C
rust
acea
ns M
ollu
scs
&
219.
5722
13.0
414
40.6
127
04.8
082
83.1
434
749.
0642
768.
1458
424.
1969
218.
0862
337.
19ot
her A
quat
ic In
vert
ebra
tes
prep
ared
or
pres
erve
d
S.
Art
icle
Art
icle
dis
trib
uti
on
1998
-99
1999
-200
020
00-0
120
01-0
220
02-0
320
03-0
420
04-0
520
05-0
620
06-0
720
07-0
8N
o.C
od
e
Su
b-T
ota
l43
2971
.19
5043
51.3
462
8780
.36
5807
20.6
867
6893
.15
5680
95.2
959
0405
.88
6292
03.8
070
7773
.20
5983
58.7
0
Su
b-T
ota
l42
6.79
1237
.76
815.
678
6.92
2412
.16
5838
.67
1281
5.24
1424
0.58
2183
7.63
2519
8.76
Su
b-T
ota
l21
9.57
2213
.04
1440
.61
2704
.882
83.1
434
749.
0642
768.
1458
424.
1969
218.
0862
337.
19
Tota
l wit
ho
ut
1605
4333
97.9
850
5589
.162
9595
.96
5815
07.6
6793
05.3
157
3933
.96
6032
21.1
264
3444
.38
7296
10.8
362
3557
.46
Tota
l wit
h 1
605
4336
17.5
550
7802
.14
6310
36.5
758
4212
.468
7588
.45
6086
83.0
264
5989
.26
7018
68.5
779
8828
.91
6858
94.6
5
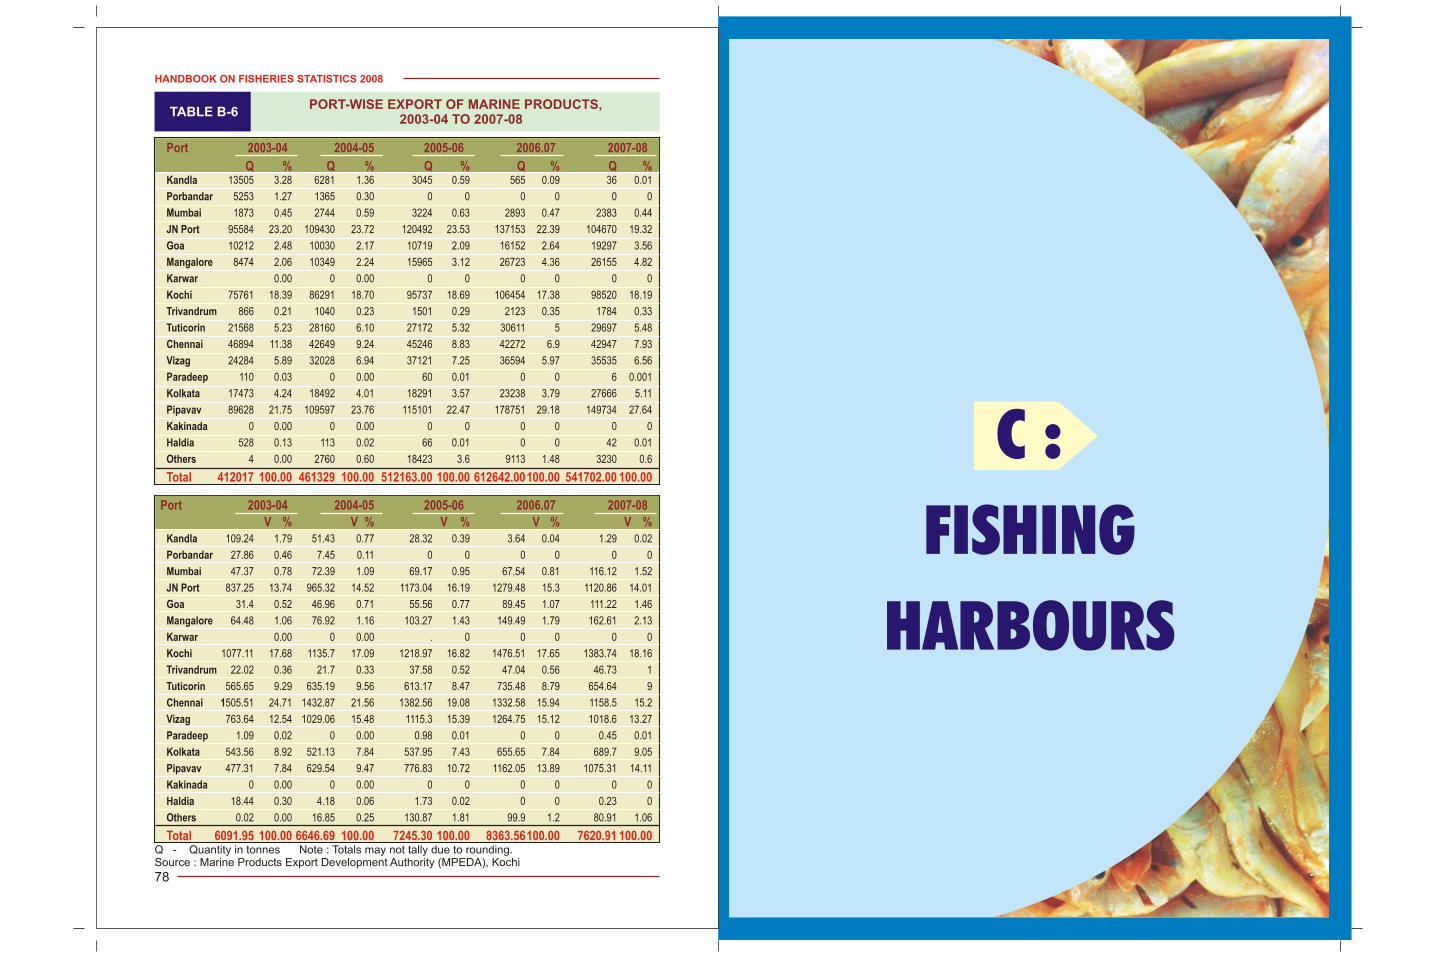
C :
FISHING
HARBOURS
TABLE B-6 PORT-WISE EXPORT OF MARINE PRODUCTS,
2003-04 TO 2007-08
HANDBOOK ON FISHERIES STATISTICS 2008
78
Q - Quantity in tonnes Note : Totals may not tally due to rounding.Source : Marine Products Export Development Authority (MPEDA), Kochi
Kandla 13505 3.28 6281 1.36 3045 0.59 565 0.09 36 0.01
Porbandar 5253 1.27 1365 0.30 0 0 0 0 0 0
Mumbai 1873 0.45 2744 0.59 3224 0.63 2893 0.47 2383 0.44
JN Port 95584 23.20 109430 23.72 120492 23.53 137153 22.39 104670 19.32
Goa 10212 2.48 10030 2.17 10719 2.09 16152 2.64 19297 3.56
Mangalore 8474 2.06 10349 2.24 15965 3.12 26723 4.36 26155 4.82
Karwar 0.00 0 0.00 0 0 0 0 0 0
Kochi 75761 18.39 86291 18.70 95737 18.69 106454 17.38 98520 18.19
Trivandrum 866 0.21 1040 0.23 1501 0.29 2123 0.35 1784 0.33
Tuticorin 21568 5.23 28160 6.10 27172 5.32 30611 5 29697 5.48
Chennai 46894 11.38 42649 9.24 45246 8.83 42272 6.9 42947 7.93
Vizag 24284 5.89 32028 6.94 37121 7.25 36594 5.97 35535 6.56
Paradeep 110 0.03 0 0.00 60 0.01 0 0 6 0.001
Kolkata 17473 4.24 18492 4.01 18291 3.57 23238 3.79 27666 5.11
Pipavav 89628 21.75 109597 23.76 115101 22.47 178751 29.18 149734 27.64
Kakinada 0 0.00 0 0.00 0 0 0 0 0 0
Haldia 528 0.13 113 0.02 66 0.01 0 0 42 0.01
Others 4 0.00 2760 0.60 18423 3.6 9113 1.48 3230 0.6
Port 2003-04 2004-05 2005-06 2006.07 2007-08
Q % Q % Q % Q % Q %
Total 412017 100.00 461329 100.00 512163.00 100.00 612642.00100.00 541702.00 100.00
Port 2003-04 2004-05 2005-06 2006.07 2007-08
V % V % V % V % V %Kandla 109.24 1.79 51.43 0.77 28.32 0.39 3.64 0.04 1.29 0.02
Porbandar 27.86 0.46 7.45 0.11 0 0 0 0 0 0
Mumbai 47.37 0.78 72.39 1.09 69.17 0.95 67.54 0.81 116.12 1.52
JN Port 837.25 13.74 965.32 14.52 1173.04 16.19 1279.48 15.3 1120.86 14.01
Goa 31.4 0.52 46.96 0.71 55.56 0.77 89.45 1.07 111.22 1.46
Mangalore 64.48 1.06 76.92 1.16 103.27 1.43 149.49 1.79 162.61 2.13
Karwar 0.00 0 0.00 . 0 0 0 0 0
Kochi 1077.11 17.68 1135.7 17.09 1218.97 16.82 1476.51 17.65 1383.74 18.16
Trivandrum 22.02 0.36 21.7 0.33 37.58 0.52 47.04 0.56 46.73 1
Tuticorin 565.65 9.29 635.19 9.56 613.17 8.47 735.48 8.79 654.64 9
Chennai 1505.51 24.71 1432.87 21.56 1382.56 19.08 1332.58 15.94 1158.5 15.2
Vizag 763.64 12.54 1029.06 15.48 1115.3 15.39 1264.75 15.12 1018.6 13.27
Paradeep 1.09 0.02 0 0.00 0.98 0.01 0 0 0.45 0.01
Kolkata 543.56 8.92 521.13 7.84 537.95 7.43 655.65 7.84 689.7 9.05
Pipavav 477.31 7.84 629.54 9.47 776.83 10.72 1162.05 13.89 1075.31 14.11
Kakinada 0 0.00 0 0.00 0 0 0 0 0 0
Haldia 18.44 0.30 4.18 0.06 1.73 0.02 0 0 0.23 0
Others 0.02 0.00 16.85 0.25 130.87 1.81 99.9 1.2 80.91 1.06
Total 6091.95 100.00 6646.69 100.00 7245.30 100.00 8363.56100.00 7620.91 100.00
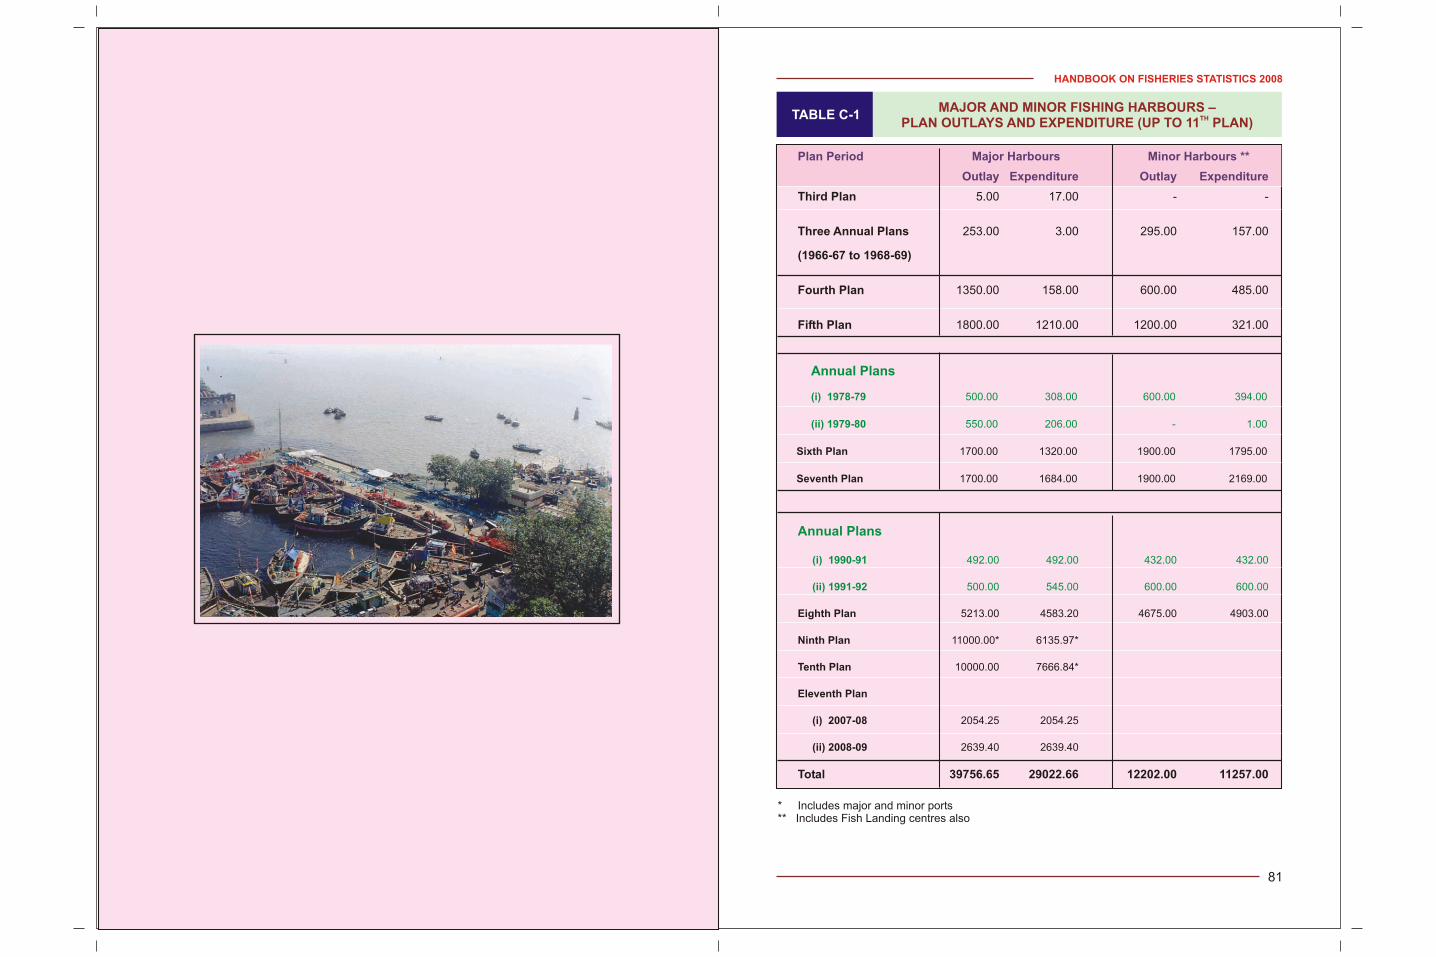
HANDBOOK ON FISHERIES STATISTICS 2008
81
TABLE C-1MAJOR AND MINOR FISHING HARBOURS –
THPLAN OUTLAYS AND EXPENDITURE (UP TO 11 PLAN)
* Includes major and minor ports** Includes Fish Landing centres also
Plan Period Major Harbours Minor Harbours **
Outlay Expenditure Outlay Expenditure
Third Plan 5.00 17.00 - -
Three Annual Plans 253.00 3.00 295.00 157.00
(1966-67 to 1968-69)
Fourth Plan 1350.00 158.00 600.00 485.00
Fifth Plan 1800.00 1210.00 1200.00 321.00
Annual Plans
(i) 1978-79 500.00 308.00 600.00 394.00
(ii) 1979-80 550.00 206.00 - 1.00
Sixth Plan 1700.00 1320.00 1900.00 1795.00
Seventh Plan 1700.00 1684.00 1900.00 2169.00
Eighth Plan 5213.00 4583.20 4675.00 4903.00
Ninth Plan 11000.00* 6135.97*
Tenth Plan 10000.00 7666.84*
Eleventh Plan
(i) 2007-08 2054.25 2054.25
(ii) 2008-09 2639.40 2639.40
Total 39756.65 29022.66 12202.00 11257.00
Annual Plans
(i) 1990-91 492.00 492.00 432.00 432.00
(ii) 1991-92 500.00 545.00 600.00 600.00
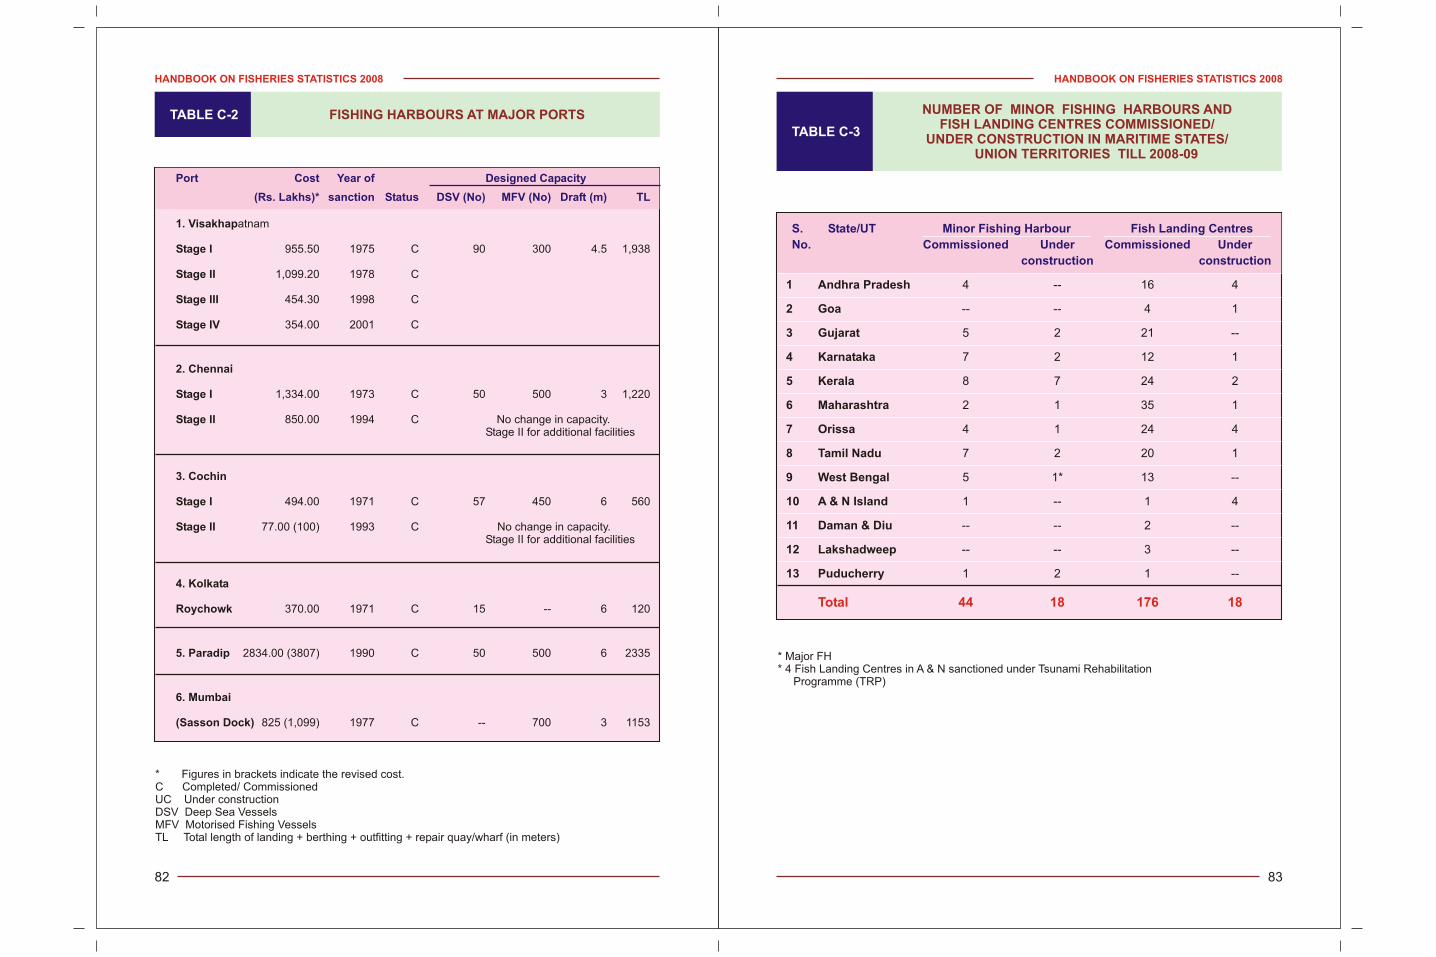
HANDBOOK ON FISHERIES STATISTICS 2008
83
TABLE C-3
NUMBER OF MINOR FISHING HARBOURS ANDFISH LANDING CENTRES COMMISSIONED/
UNDER CONSTRUCTION IN MARITIME STATES/ UNION TERRITORIES TILL 2008-09
* Major FH* 4 Fish Landing Centres in A & N sanctioned under Tsunami Rehabilitation Programme (TRP)
S. State/UT Minor Fishing Harbour Fish Landing Centres
No. Commissioned Under Commissioned Under
construction construction
1 Andhra Pradesh 4 -- 16 4
2 Goa -- -- 4 1
3 Gujarat 5 2 21 --
4 Karnataka 7 2 12 1
5 Kerala 8 7 24 2
6 Maharashtra 2 1 35 1
7 Orissa 4 1 24 4
8 Tamil Nadu 7 2 20 1
9 West Bengal 5 1* 13 --
10 A & N Island 1 -- 1 4
11 Daman & Diu -- -- 2 --
12 Lakshadweep -- -- 3 --
13 Puducherry 1 2 1 --
Total 44 18 176 18
TABLE C-2 FISHING HARBOURS AT MAJOR PORTS
* Figures in brackets indicate the revised cost.C Completed/ CommissionedUC Under constructionDSV Deep Sea VesselsMFV Motorised Fishing VesselsTL Total length of landing + berthing + outfitting + repair quay/wharf (in meters)
HANDBOOK ON FISHERIES STATISTICS 2008
82
1. Visakhapatnam
Stage I 955.50 1975 C 90 300 4.5 1,938
Stage II 1,099.20 1978 C
Stage III 454.30 1998 C
Stage IV 354.00 2001 C
2. Chennai
Stage I 1,334.00 1973 C 50 500 3 1,220
Stage II 850.00 1994 C No change in capacity.Stage II for additional facilities
3. Cochin
Stage I 494.00 1971 C 57 450 6 560
Stage II 77.00 (100) 1993 C No change in capacity. Stage II for additional facilities
4. Kolkata
Roychowk 370.00 1971 C 15 -- 6 120
5. Paradip 2834.00 (3807) 1990 C 50 500 6 2335
6. Mumbai
(Sasson Dock) 825 (1,099) 1977 C -- 700 3 1153
Port Cost Year of Designed Capacity
(Rs. Lakhs)* sanction Status DSV (No) MFV (No) Draft (m) TL
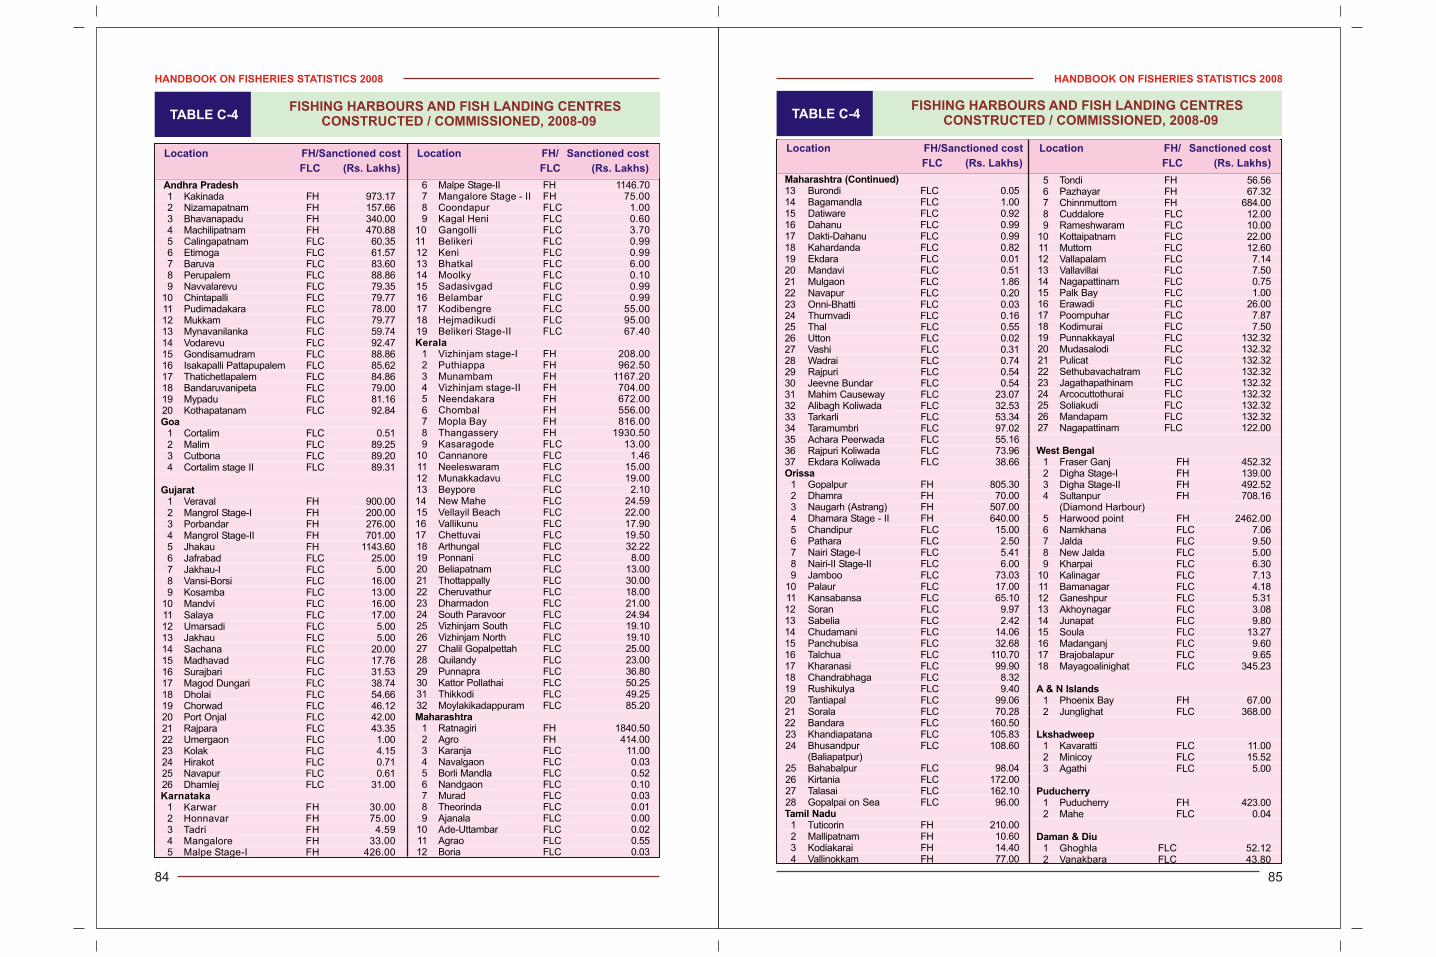
HANDBOOK ON FISHERIES STATISTICS 2008HANDBOOK ON FISHERIES STATISTICS 2008
84
TABLE C-4FISHING HARBOURS AND FISH LANDING CENTRES
CONSTRUCTED / COMMISSIONED, 2008-09TABLE C-4
FISHING HARBOURS AND FISH LANDING CENTRES CONSTRUCTED / COMMISSIONED, 2008-09
85
Location FH/Sanctioned cost Location FH/ Sanctioned cost
FLC (Rs. Lakhs) FLC (Rs. Lakhs)
Andhra Pradesh1 Kakinada FH 973.172 Nizamapatnam FH 157.663 Bhavanapadu FH 340.004 Machilipatnam FH 470.885 Calingapatnam FLC 60.356 Etimoga FLC 61.577 Baruva FLC 83.608 Perupalem FLC 88.869 Navvalarevu FLC 79.35
10 Chintapalli FLC 79.7711 Pudimadakara FLC 78.0012 Mukkam FLC 79.7713 Mynavanilanka FLC 59.7414 Vodarevu FLC 92.4715 Gondisamudram FLC 88.8616 Isakapalli Pattapupalem FLC 85.6217 Thatichetlapalem FLC 84.8618 Bandaruvanipeta FLC 79.0019 Mypadu FLC 81.1620 Kothapatanam FLC 92.84Goa
1 Cortalim FLC 0.512 Malim FLC 89.253 Cutbona FLC 89.204 Cortalim stage II FLC 89.31
Gujarat1 Veraval FH 900.002 Mangrol Stage-I FH 200.003 Porbandar FH 276.004 Mangrol Stage-II FH 701.005 Jhakau FH 1143.606 Jafrabad FLC 25.007 Jakhau-I FLC 5.008 Vansi-Borsi FLC 16.009 Kosamba FLC 13.00
10 Mandvi FLC 16.0011 Salaya FLC 17.0012 Umarsadi FLC 5.0013 Jakhau FLC 5.0014 Sachana FLC 20.0015 Madhavad FLC 17.7616 Surajbari FLC 31.5317 Magod Dungari FLC 38.7418 Dholai FLC 54.6619 Chorwad FLC 46.1220 Port Onjal FLC 42.0021 Rajpara FLC 43.3522 Umergaon FLC 1.0023 Kolak FLC 4.1524 Hirakot FLC 0.7125 Navapur FLC 0.6126 Dhamlej FLC 31.00Karnataka
1 Karwar FH 30.002 Honnavar FH 75.003 Tadri FH 4.594 Mangalore FH 33.005 Malpe Stage-I FH 426.00
6 Malpe Stage-II FH 1146.707 Mangalore Stage - II FH 75.008 Coondapur FLC 1.009 Kagal Heni FLC 0.60
10 Gangolli FLC 3.7011 Belikeri FLC 0.9912 Keni FLC 0.9913 Bhatkal FLC 6.0014 Moolky FLC 0.1015 Sadasivgad FLC 0.9916 Belambar FLC 0.9917 Kodibengre FLC 55.0018 Hejmadikudi FLC 95.0019 Belikeri Stage-II FLC 67.40Kerala
1 Vizhinjam stage-I FH 208.002 Puthiappa FH 962.503 Munambam FH 1167.204 Vizhinjam stage-II FH 704.005 Neendakara FH 672.006 Chombal FH 556.007 Mopla Bay FH 816.008 Thangassery FH 1930.509 Kasaragode FLC 13.00
10 Cannanore FLC 1.4611 Neeleswaram FLC 15.0012 Munakkadavu FLC 19.0013 Beypore FLC 2.1014 New Mahe FLC 24.5915 Vellayil Beach FLC 22.0016 Vallikunu FLC 17.9017 Chettuvai FLC 19.5018 Arthungal FLC 32.2219 Ponnani FLC 8.0020 Beliapatnam FLC 13.0021 Thottappally FLC 30.0022 Cheruvathur FLC 18.0023 Dharmadon FLC 21.0024 South Paravoor FLC 24.9425 Vizhinjam South FLC 19.1026 Vizhinjam North FLC 19.1027 Chalil Gopalpettah FLC 25.0028 Quilandy FLC 23.0029 Punnapra FLC 36.8030 Kattor Pollathai FLC 50.2531 Thikkodi FLC 49.2532 Moylakikadappuram FLC 85.20Maharashtra
1 Ratnagiri FH 1840.502 Agro FH 414.003 Karanja FLC 11.004 Navalgaon FLC 0.035 Borli Mandla FLC 0.526 Nandgaon FLC 0.107 Murad FLC 0.038 Theorinda FLC 0.019 Ajanala FLC 0.00
10 Ade-Uttambar FLC 0.0211 Agrao FLC 0.5512 Boria FLC 0.03
Location FH/Sanctioned cost Location FH/ Sanctioned cost
FLC (Rs. Lakhs) FLC (Rs. Lakhs)
5 Tondi FH 56.566 Pazhayar FH 67.327 Chinnmuttom FH 684.008 Cuddalore FLC 12.009 Rameshwaram FLC 10.00
10 Kottaipatnam FLC 22.0011 Muttom FLC 12.6012 Vallapalam FLC 7.1413 Vallavillai FLC 7.5014 Nagapattinam FLC 0.7515 Palk Bay FLC 1.0016 Erawadi FLC 26.0017 Poompuhar FLC 7.8718 Kodimurai FLC 7.5019 Punnakkayal FLC 132.3220 Mudasalodi FLC 132.3221 Pulicat FLC 132.3222 Sethubavachatram FLC 132.3223 Jagathapathinam FLC 132.3224 Arcocuttothurai FLC 132.3225 Soliakudi FLC 132.3226 Mandapam FLC 132.3227 Nagapattinam FLC 122.00
West Bengal1 Fraser Ganj FH 452.322 Digha Stage-I FH 139.003 Digha Stage-II FH 492.524 Sultanpur FH 708.16
(Diamond Harbour)5 Harwood point FH 2462.006 Namkhana FLC 7.067 Jalda FLC 9.508 New Jalda FLC 5.009 Kharpai FLC 6.30
10 Kalinagar FLC 7.1311 Bamanagar FLC 4.1812 Ganeshpur FLC 5.3113 Akhoynagar FLC 3.0814 Junapat FLC 9.8015 Soula FLC 13.2716 Madanganj FLC 9.6017 Brajobalapur FLC 9.6518 Mayagoalinighat FLC 345.23
A & N Islands1 Phoenix Bay FH 67.002 Junglighat FLC 368.00
Lkshadweep1 Kavaratti FLC 11.002 Minicoy FLC 15.523 Agathi FLC 5.00
Puducherry1 Puducherry FH 423.002 Mahe FLC 0.04
Daman & Diu1 Ghoghla FLC 52.122 Vanakbara FLC 43.80
Maharashtra (Continued)13 Burondi FLC 0.0514 Bagamandla FLC 1.0015 Datiware FLC 0.9216 Dahanu FLC 0.9917 Dakti-Dahanu FLC 0.9918 Kahardanda FLC 0.8219 Ekdara FLC 0.0120 Mandavi FLC 0.5121 Mulgaon FLC 1.8622 Navapur FLC 0.2023 Onni-Bhatti FLC 0.0324 Thurnvadi FLC 0.1625 Thal FLC 0.5526 Utton FLC 0.0227 Vashi FLC 0.3128 Wadrai FLC 0.7429 Rajpuri FLC 0.5430 Jeevne Bundar FLC 0.5431 Mahim Causeway FLC 23.0732 Alibagh Koliwada FLC 32.5333 Tarkarli FLC 53.3434 Taramumbri FLC 97.0235 Achara Peerwada FLC 55.1636 Rajpuri Koliwada FLC 73.9637 Ekdara Koliwada FLC 38.66Orissa
1 Gopalpur FH 805.302 Dhamra FH 70.003 Naugarh (Astrang) FH 507.004 Dhamara Stage - II FH 640.005 Chandipur FLC 15.006 Pathara FLC 2.507 Nairi Stage-I FLC 5.418 Nairi-II Stage-II FLC 6.009 Jamboo FLC 73.03
10 Palaur FLC 17.0011 Kansabansa FLC 65.1012 Soran FLC 9.9713 Sabelia FLC 2.4214 Chudamani FLC 14.0615 Panchubisa FLC 32.6816 Talchua FLC 110.7017 Kharanasi FLC 99.9018 Chandrabhaga FLC 8.3219 Rushikulya FLC 9.4020 Tantiapal FLC 99.0621 Sorala FLC 70.2822 Bandara FLC 160.5023 Khandiapatana FLC 105.8324 Bhusandpur FLC 108.60
(Baliapatpur)25 Bahabalpur FLC 98.0426 Kirtania FLC 172.0027 Talasai FLC 162.1028 Gopalpai on Sea FLC 96.00Tamil Nadu
1 Tuticorin FH 210.002 Mallipatnam FH 10.603 Kodiakarai FH 14.404 Vallinokkam FH 77.00
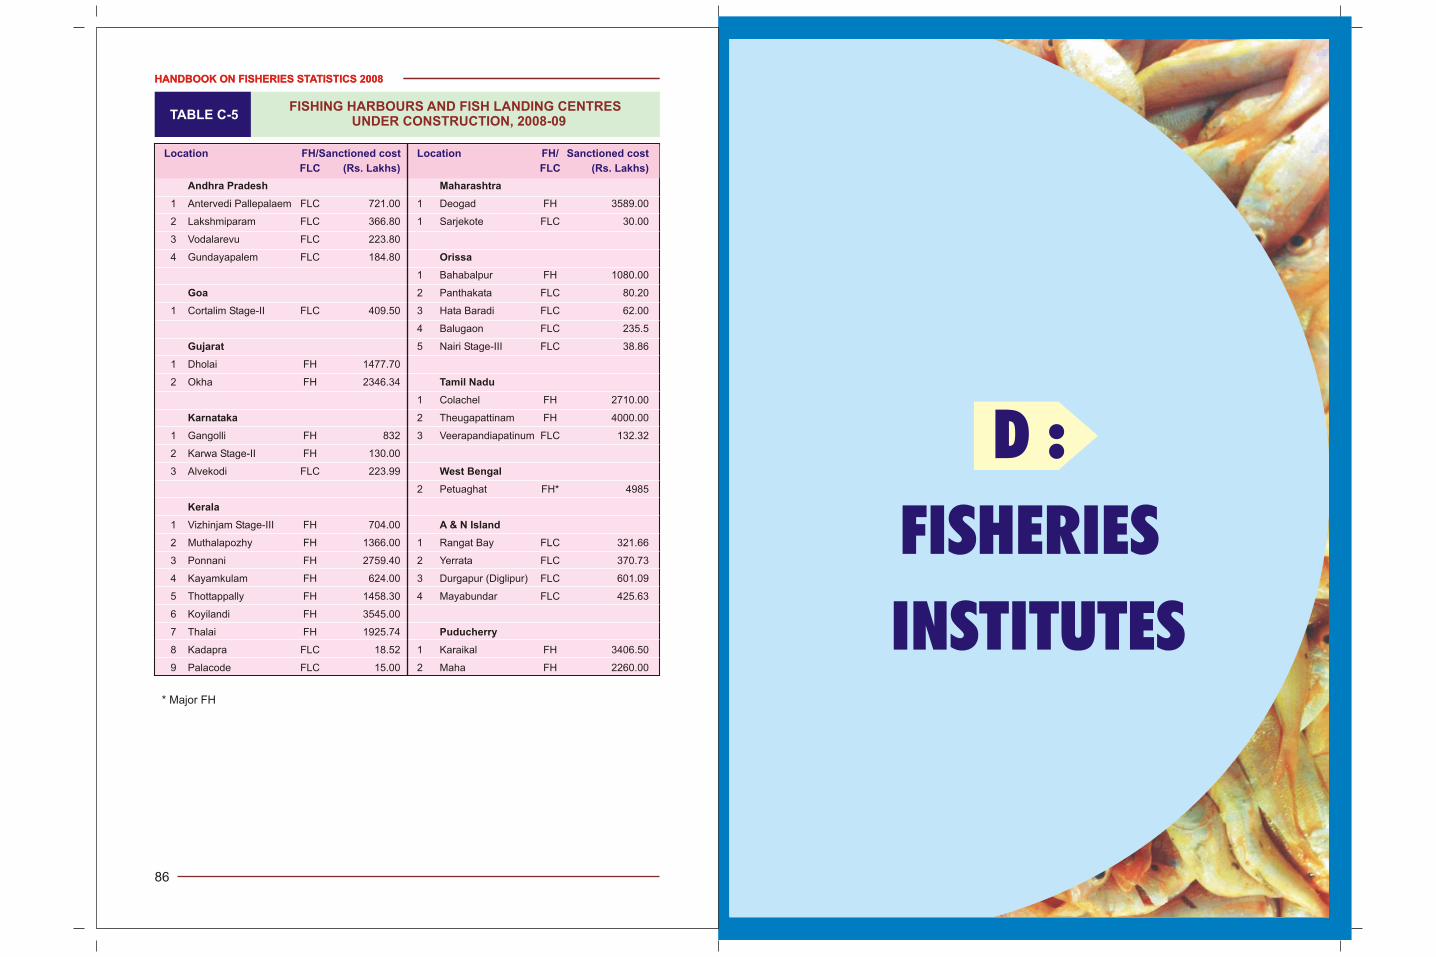
D :
FISHERIES
INSTITUTES
HANDBOOK ON FISHERIES STATISTICS 2008
86
HANDBOOK ON FISHERIES STATISTICS 2008
TABLE C-5FISHING HARBOURS AND FISH LANDING CENTRES
UNDER CONSTRUCTION, 2008-09
Location FH/Sanctioned cost Location FH/ Sanctioned cost
FLC (Rs. Lakhs) FLC (Rs. Lakhs)
Andhra Pradesh Maharashtra
1 Antervedi Pallepalaem FLC 721.00 1 Deogad FH 3589.00
2 Lakshmiparam FLC 366.80 1 Sarjekote FLC 30.00
3 Vodalarevu FLC 223.80
4 Gundayapalem FLC 184.80 Orissa
1 Bahabalpur FH 1080.00
Goa 2 Panthakata FLC 80.20
1 Cortalim Stage-II FLC 409.50 3 Hata Baradi FLC 62.00
4 Balugaon FLC 235.5
Gujarat 5 Nairi Stage-III FLC 38.86
1 Dholai FH 1477.70
2 Okha FH 2346.34 Tamil Nadu
1 Colachel FH 2710.00
Karnataka 2 Theugapattinam FH 4000.00
1 Gangolli FH 832 3 Veerapandiapatinum FLC 132.32
2 Karwa Stage-II FH 130.00
3 Alvekodi FLC 223.99 West Bengal
2 Petuaghat FH* 4985
Kerala
1 Vizhinjam Stage-III FH 704.00 A & N Island
2 Muthalapozhy FH 1366.00 1 Rangat Bay FLC 321.66
3 Ponnani FH 2759.40 2 Yerrata FLC 370.73
4 Kayamkulam FH 624.00 3 Durgapur (Diglipur) FLC 601.09
5 Thottappally FH 1458.30 4 Mayabundar FLC 425.63
6 Koyilandi FH 3545.00
7 Thalai FH 1925.74 Puducherry
8 Kadapra FLC 18.52 1 Karaikal FH 3406.50
9 Palacode FLC 15.00 2 Maha FH 2260.00
* Major FH
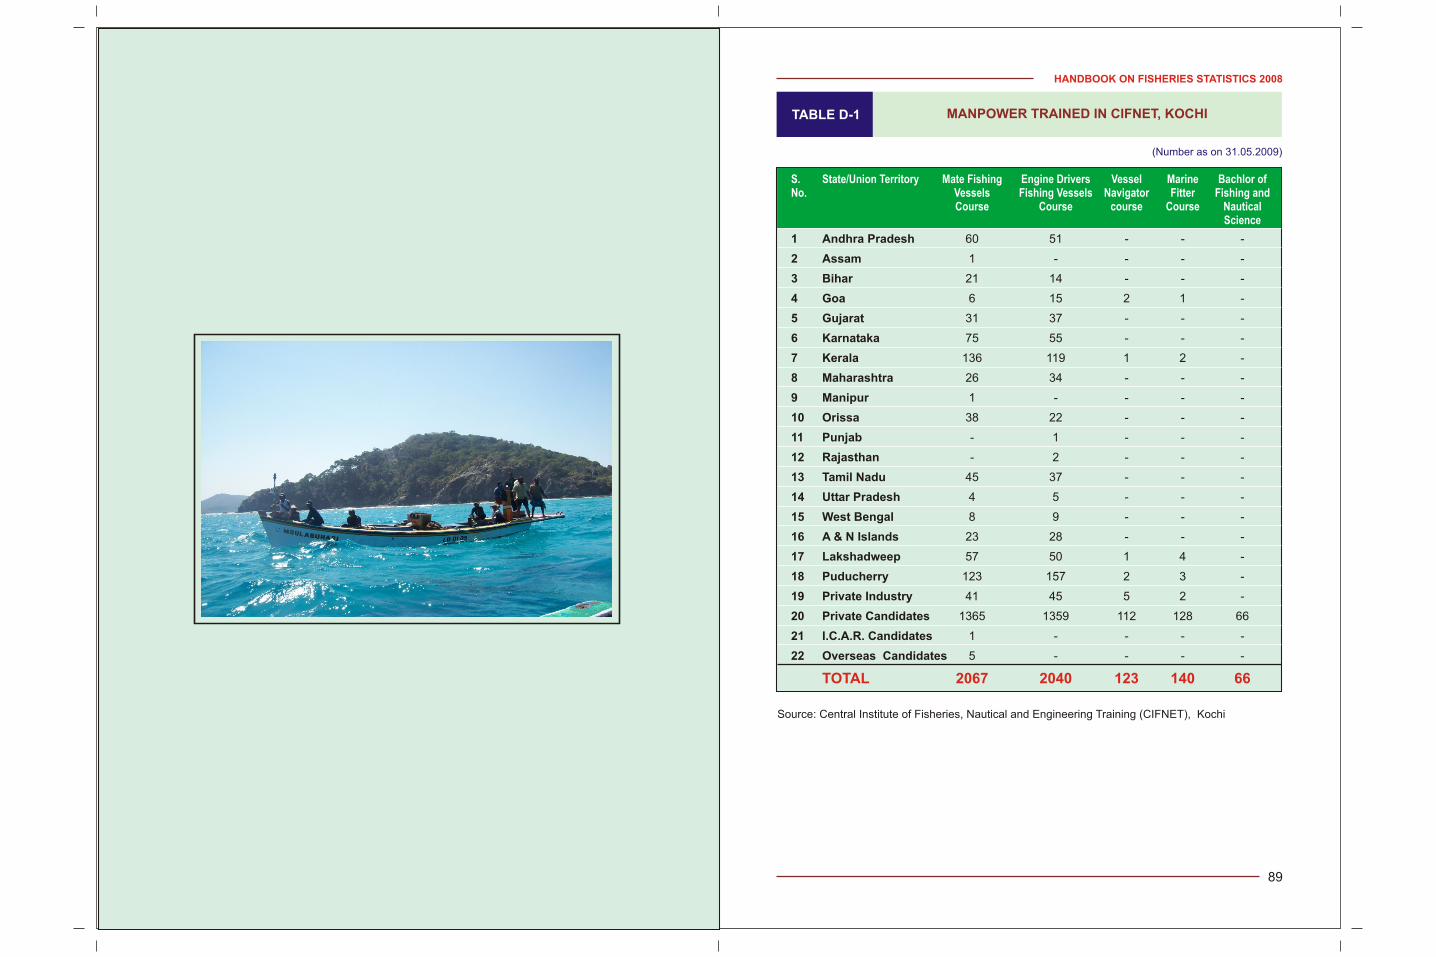
HANDBOOK ON FISHERIES STATISTICS 2008
89
TABLE D-1 MANPOWER TRAINED IN CIFNET, KOCHI
Source: Central Institute of Fisheries, Nautical and Engineering Training (CIFNET), Kochi
S. State/Union Territory Mate Fishing Engine Drivers Vessel Marine Bachlor ofNo. Vessels Fishing Vessels Navigator Fitter Fishing and
Course Course course Course NauticalScience
1 Andhra Pradesh 60 51 - - -
2 Assam 1 - - - -
3 Bihar 21 14 - - -
4 Goa 6 15 2 1 -
5 Gujarat 31 37 - - -
6 Karnataka 75 55 - - -
7 Kerala 136 119 1 2 -
8 Maharashtra 26 34 - - -
9 Manipur 1 - - - -
10 Orissa 38 22 - - -
11 Punjab - 1 - - -
12 Rajasthan - 2 - - -
13 Tamil Nadu 45 37 - - -
14 Uttar Pradesh 4 5 - - -
15 West Bengal 8 9 - - -
16 A & N Islands 23 28 - - -
17 Lakshadweep 57 50 1 4 -
18 Puducherry 123 157 2 3 -
19 Private Industry 41 45 5 2 -
20 Private Candidates 1365 1359 112 128 66
21 I.C.A.R. Candidates 1 - - - -
22 Overseas Candidates 5 - - - -
TOTAL 2067 2040 123 140 66
(Number as on 31.05.2009)
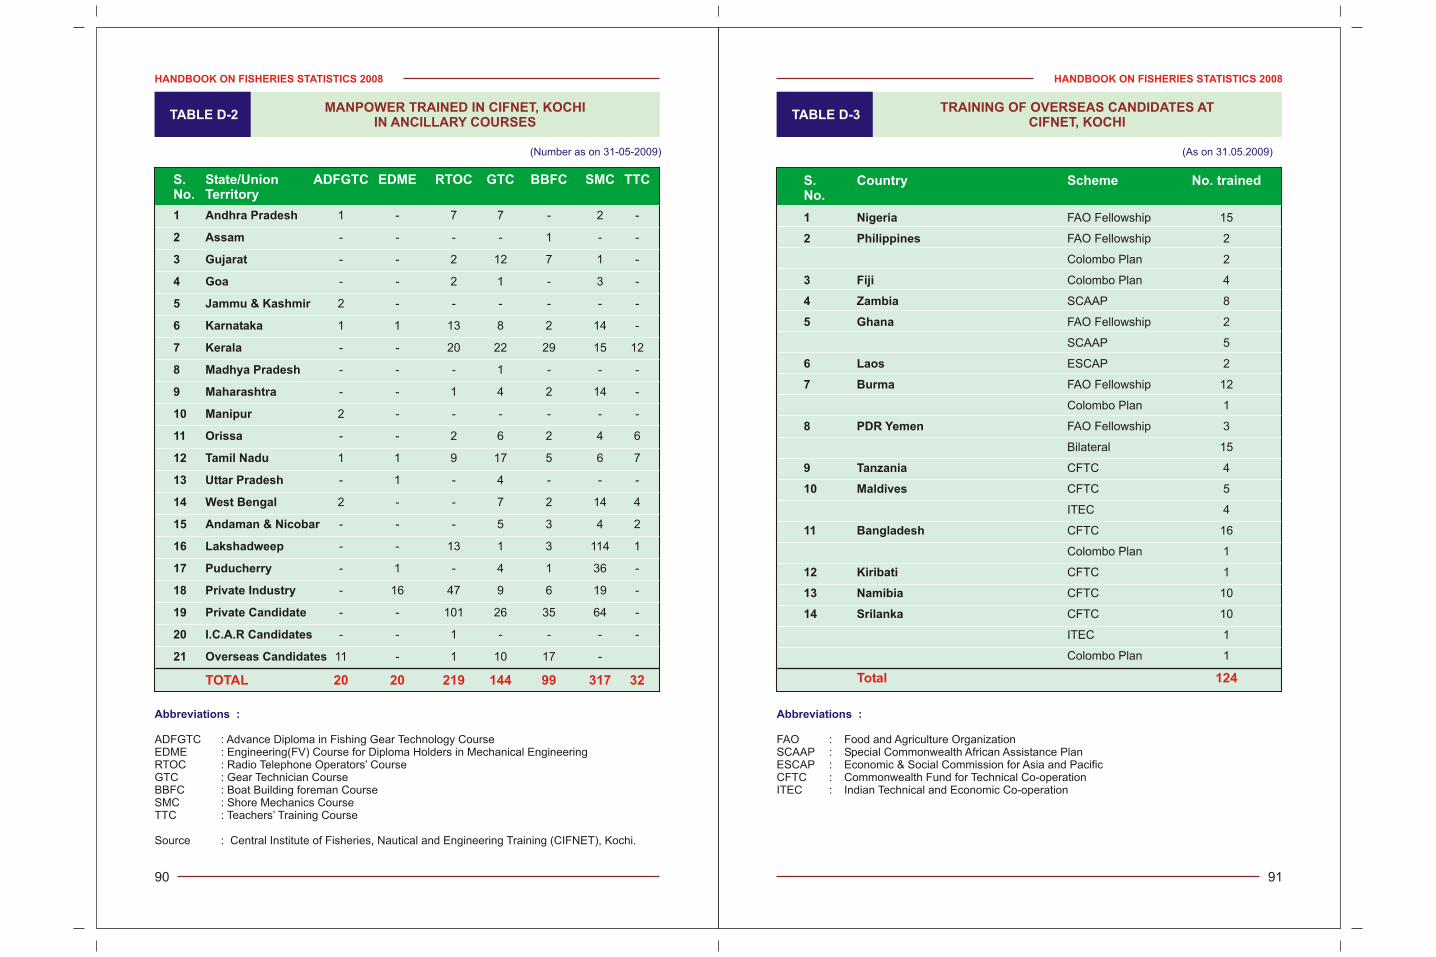
HANDBOOK ON FISHERIES STATISTICS 2008
91
HANDBOOK ON FISHERIES STATISTICS 2008
90
TABLE D-3TRAINING OF OVERSEAS CANDIDATES AT
CIFNET, KOCHI
Abbreviations :
FAO : Food and Agriculture OrganizationSCAAP : Special Commonwealth African Assistance PlanESCAP : Economic & Social Commission for Asia and PacificCFTC : Commonwealth Fund for Technical Co-operationITEC : Indian Technical and Economic Co-operation
1 Nigeria FAO Fellowship 15
2 Philippines FAO Fellowship 2
Colombo Plan 2
3 Fiji Colombo Plan 4
4 Zambia SCAAP 8
5 Ghana FAO Fellowship 2
SCAAP 5
6 Laos ESCAP 2
7 Burma FAO Fellowship 12
Colombo Plan 1
8 PDR Yemen FAO Fellowship 3
Bilateral 15
9 Tanzania CFTC 4
10 Maldives CFTC 5
ITEC 4
11 Bangladesh CFTC 16
Colombo Plan 1
12 Kiribati CFTC 1
13 Namibia CFTC 10
14 Srilanka CFTC 10
ITEC 1
Colombo Plan 1
S. Country Scheme No. trainedNo.
Total 124
(As on 31.05.2009)
TABLE D-2MANPOWER TRAINED IN CIFNET, KOCHI
IN ANCILLARY COURSES
Abbreviations :
ADFGTC : Advance Diploma in Fishing Gear Technology CourseEDME : Engineering(FV) Course for Diploma Holders in Mechanical EngineeringRTOC : Radio Telephone Operators’ CourseGTC : Gear Technician CourseBBFC : Boat Building foreman CourseSMC : Shore Mechanics CourseTTC : Teachers’ Training Course
Source : Central Institute of Fisheries, Nautical and Engineering Training (CIFNET), Kochi.
1 Andhra Pradesh 1 - 7 7 - 2 -
2 Assam - - - - 1 - -
3 Gujarat - - 2 12 7 1 -
4 Goa - - 2 1 - 3 -
5 Jammu & Kashmir 2 - - - - - -
6 Karnataka 1 1 13 8 2 14 -
7 Kerala - - 20 22 29 15 12
8 Madhya Pradesh - - - 1 - - -
9 Maharashtra - - 1 4 2 14 -
10 Manipur 2 - - - - - -
11 Orissa - - 2 6 2 4 6
12 Tamil Nadu 1 1 9 17 5 6 7
13 Uttar Pradesh - 1 - 4 - - -
14 West Bengal 2 - - 7 2 14 4
15 Andaman & Nicobar - - - 5 3 4 2
16 Lakshadweep - - 13 1 3 114 1
17 Puducherry - 1 - 4 1 36 -
18 Private Industry - 16 47 9 6 19 -
19 Private Candidate - - 101 26 35 64 -
20 I.C.A.R Candidates - - 1 - - - -
21 Overseas Candidates 11 - 1 10 17 -
S. State/Union ADFGTC EDME RTOC GTC BBFC SMC TTCNo. Territory
TOTAL 20 20 219 144 99 317 32
(Number as on 31-05-2009)
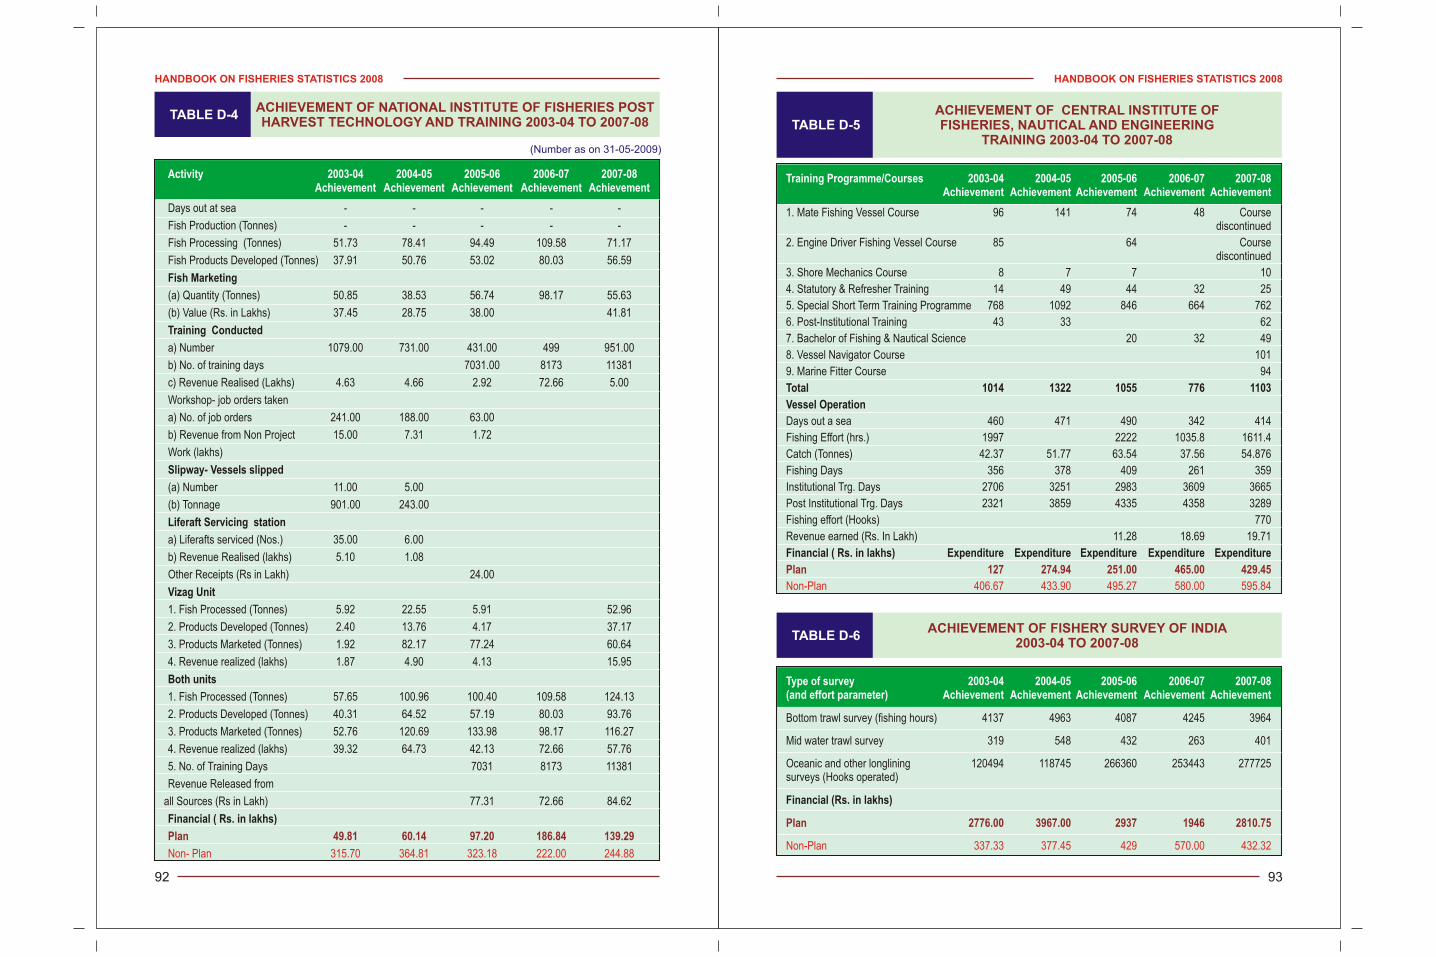
HANDBOOK ON FISHERIES STATISTICS 2008
93
HANDBOOK ON FISHERIES STATISTICS 2008
92
TABLE D-5ACHIEVEMENT OF CENTRAL INSTITUTE OFFISHERIES, NAUTICAL AND ENGINEERING
TRAINING 2003-04 TO 2007-08
Training Programme/Courses 2003-04 2004-05 2005-06 2006-07 2007-08Achievement Achievement Achievement Achievement Achievement
1. Mate Fishing Vessel Course 96 141 74 48 Coursediscontinued
2. Engine Driver Fishing Vessel Course 85 64 Coursediscontinued
3. Shore Mechanics Course 8 7 7 10
4. Statutory & Refresher Training 14 49 44 32 25
5. Special Short Term Training Programme 768 1092 846 664 762
6. Post-Institutional Training 43 33 62
7. Bachelor of Fishing & Nautical Science 20 32 49
8. Vessel Navigator Course 101
9. Marine Fitter Course 94
Total 1014 1322 1055 776 1103
Vessel Operation
Days out a sea 460 471 490 342 414
Fishing Effort (hrs.) 1997 2222 1035.8 1611.4
Catch (Tonnes) 42.37 51.77 63.54 37.56 54.876
Fishing Days 356 378 409 261 359
Institutional Trg. Days 2706 3251 2983 3609 3665
Post Institutional Trg. Days 2321 3859 4335 4358 3289
Fishing effort (Hooks) 770
Revenue earned (Rs. In Lakh) 11.28 18.69 19.71
Financial ( Rs. in lakhs) Expenditure Expenditure Expenditure Expenditure Expenditure
Plan 127 274.94 251.00 465.00 429.45
Non-Plan 406.67 433.90 495.27 580.00 595.84
TABLE D-4 ACHIEVEMENT OF NATIONAL INSTITUTE OF FISHERIES POSTHARVEST TECHNOLOGY AND TRAINING 2003-04 TO 2007-08
Days out at sea - - - - -
Fish Production (Tonnes) - - - - -
Fish Processing (Tonnes) 51.73 78.41 94.49 109.58 71.17
Fish Products Developed (Tonnes) 37.91 50.76 53.02 80.03 56.59
Fish Marketing
(a) Quantity (Tonnes) 50.85 38.53 56.74 98.17 55.63
(b) Value (Rs. in Lakhs) 37.45 28.75 38.00 41.81
Training Conducted
a) Number 1079.00 731.00 431.00 499 951.00
b) No. of training days 7031.00 8173 11381
c) Revenue Realised (Lakhs) 4.63 4.66 2.92 72.66 5.00
Workshop- job orders taken
a) No. of job orders 241.00 188.00 63.00
b) Revenue from Non Project 15.00 7.31 1.72
Work (lakhs)
Slipway- Vessels slipped
(a) Number 11.00 5.00
(b) Tonnage 901.00 243.00
Liferaft Servicing station
a) Liferafts serviced (Nos.) 35.00 6.00
b) Revenue Realised (lakhs) 5.10 1.08
Other Receipts (Rs in Lakh) 24.00
Vizag Unit
1. Fish Processed (Tonnes) 5.92 22.55 5.91 52.96
2. Products Developed (Tonnes) 2.40 13.76 4.17 37.17
3. Products Marketed (Tonnes) 1.92 82.17 77.24 60.64
4. Revenue realized (lakhs) 1.87 4.90 4.13 15.95
Both units
1. Fish Processed (Tonnes) 57.65 100.96 100.40 109.58 124.13
2. Products Developed (Tonnes) 40.31 64.52 57.19 80.03 93.76
3. Products Marketed (Tonnes) 52.76 120.69 133.98 98.17 116.27
4. Revenue realized (lakhs) 39.32 64.73 42.13 72.66 57.76
5. No. of Training Days 7031 8173 11381
Revenue Released from
all Sources (Rs in Lakh) 77.31 72.66 84.62
Financial ( Rs. in lakhs)
Activity 2003-04 2004-05 2005-06 2006-07 2007-08Achievement Achievement Achievement Achievement Achievement
Plan 49.81 60.14 97.20 186.84 139.29
Non- Plan 315.70 364.81 323.18 222.00 244.88
(Number as on 31-05-2009)
TABLE D-6ACHIEVEMENT OF FISHERY SURVEY OF INDIA
2003-04 TO 2007-08
Type of survey 2003-04 2004-05 2005-06 2006-07 2007-08(and effort parameter) Achievement Achievement Achievement Achievement Achievement
Bottom trawl survey (fishing hours) 4137 4963 4087 4245 3964
Mid water trawl survey 319 548 432 263 401
Oceanic and other longlining 120494 118745 266360 253443 277725surveys (Hooks operated)
Financial (Rs. in lakhs)
Plan 2776.00 3967.00 2937 1946 2810.75
Non-Plan 337.33 377.45 429 570.00 432.32
E :
PLAN OUTLAYS
AND
EXPENDITURES
HANDBOOK ON FISHERIES STATISTICS 2008
94
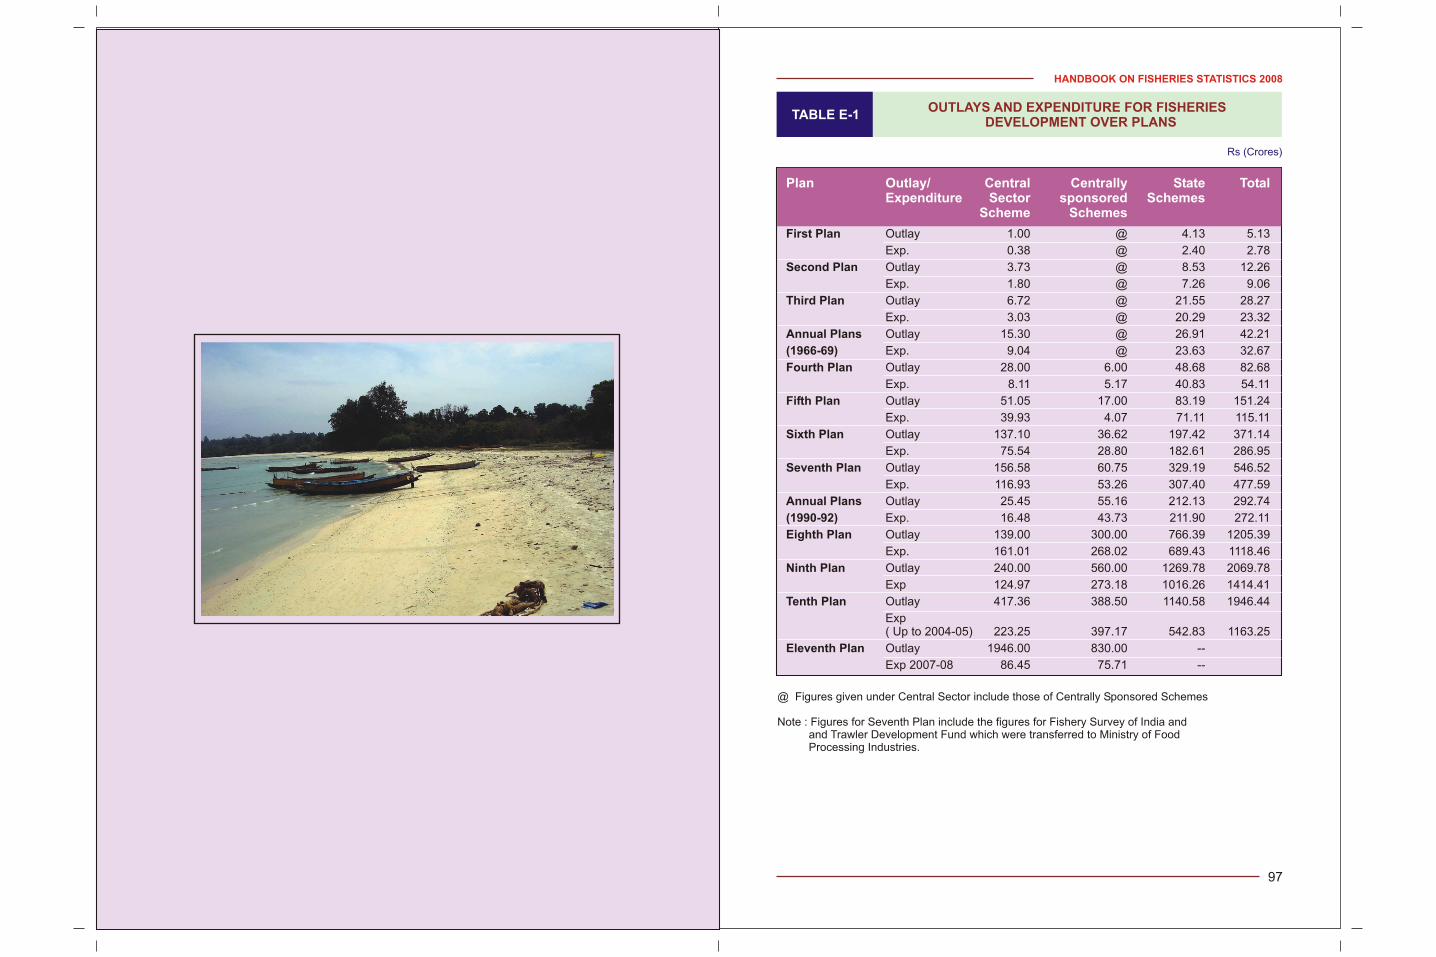
HANDBOOK ON FISHERIES STATISTICS 2008
97
TABLE E-1OUTLAYS AND EXPENDITURE FOR FISHERIES
DEVELOPMENT OVER PLANS
@ Figures given under Central Sector include those of Centrally Sponsored Schemes
Note : Figures for Seventh Plan include the figures for Fishery Survey of India and and Trawler Development Fund which were transferred to Ministry of Food Processing Industries.
Plan Outlay/ Central Centrally State TotalExpenditure Sector sponsored Schemes
Scheme Schemes
First Plan Outlay 1.00 @ 4.13 5.13
Exp. 0.38 @ 2.40 2.78
Second Plan Outlay 3.73 @ 8.53 12.26
Exp. 1.80 @ 7.26 9.06
Third Plan Outlay 6.72 @ 21.55 28.27
Exp. 3.03 @ 20.29 23.32
Annual Plans Outlay 15.30 @ 26.91 42.21
(1966-69) Exp. 9.04 @ 23.63 32.67
Fourth Plan Outlay 28.00 6.00 48.68 82.68
Exp. 8.11 5.17 40.83 54.11
Fifth Plan Outlay 51.05 17.00 83.19 151.24
Exp. 39.93 4.07 71.11 115.11
Sixth Plan Outlay 137.10 36.62 197.42 371.14
Exp. 75.54 28.80 182.61 286.95
Seventh Plan Outlay 156.58 60.75 329.19 546.52
Exp. 116.93 53.26 307.40 477.59
Annual Plans Outlay 25.45 55.16 212.13 292.74
(1990-92) Exp. 16.48 43.73 211.90 272.11
Eighth Plan Outlay 139.00 300.00 766.39 1205.39
Exp. 161.01 268.02 689.43 1118.46
Ninth Plan Outlay 240.00 560.00 1269.78 2069.78
Exp 124.97 273.18 1016.26 1414.41
Tenth Plan Outlay 417.36 388.50 1140.58 1946.44
Exp( Up to 2004-05) 223.25 397.17 542.83 1163.25
Eleventh Plan Outlay 1946.00 830.00 --
Exp 2007-08 86.45 75.71 --
Rs (Crores)
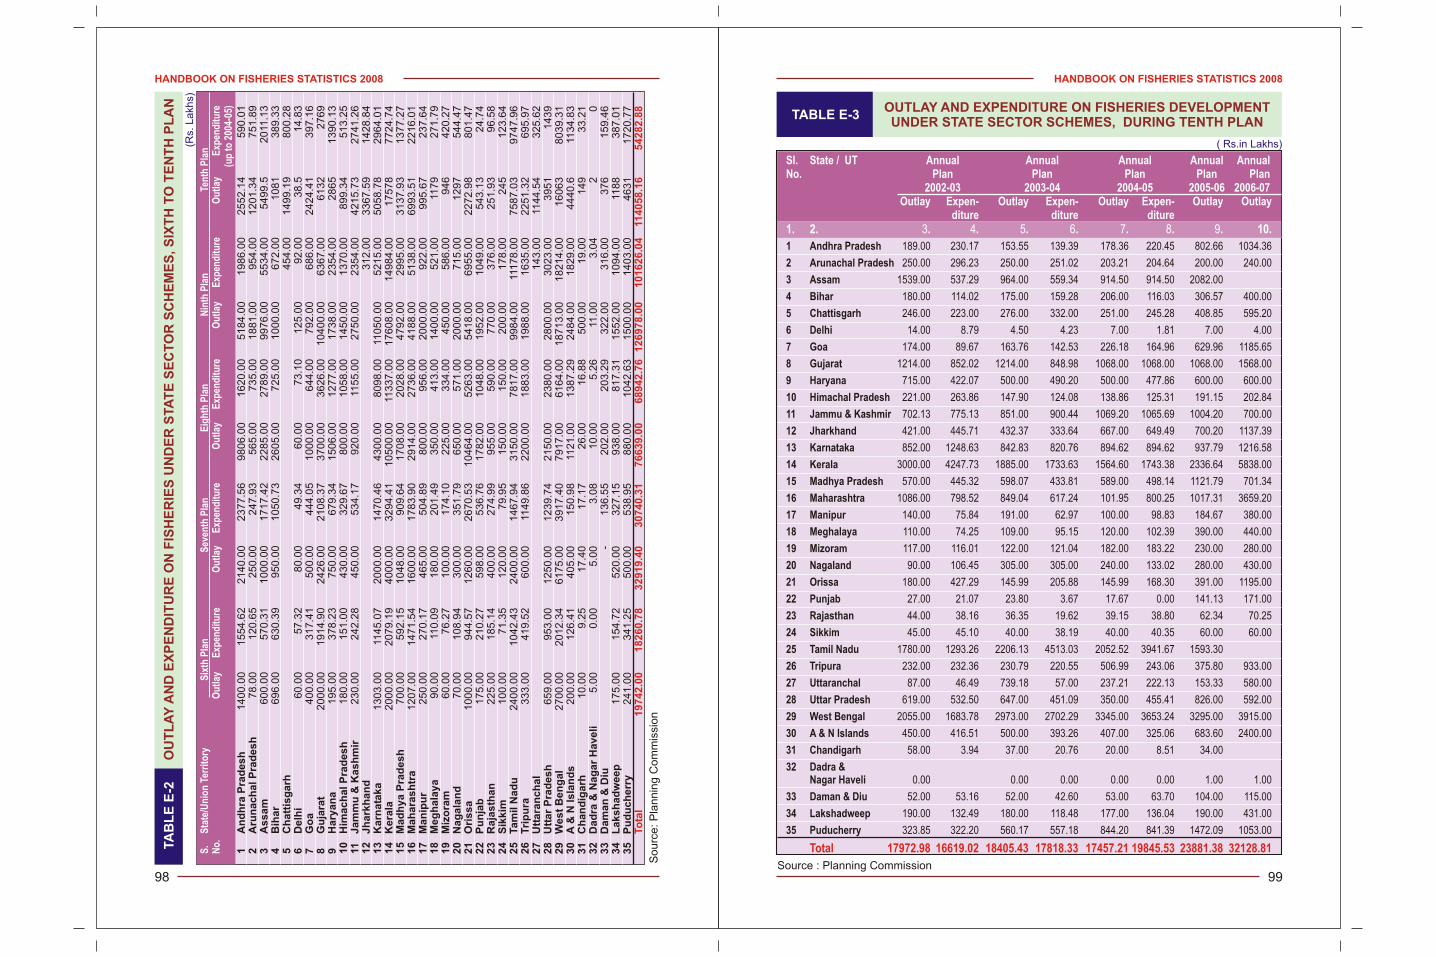
HANDBOOK ON FISHERIES STATISTICS 2008
99
HANDBOOK ON FISHERIES STATISTICS 2008
98
TA
BL
E E
-2O
UT
LA
Y A
ND
EX
PE
ND
ITU
RE
ON
FIS
HE
RIE
S U
ND
ER
STA
TE
SE
CT
OR
SC
HE
ME
S, S
IXT
H T
O T
EN
TH
PL
AN
So
urc
e: P
lan
nin
g C
om
mis
sio
n
(Rs.
La
khs)
S.
Sta
te/U
nio
n T
erri
tory
Six
th P
lan
Sev
enth
Pla
nE
igh
th P
lan
Nin
th P
lan
Ten
th P
lan
No
.O
utl
ayE
xpen
dit
ure
Ou
tlay
Exp
end
itu
reO
utl
ayE
xpen
dit
ure
Ou
tlay
Exp
end
itu
reO
utl
ayE
xpen
dit
ure
(up
to
200
4-05
)1
An
dh
ra P
rad
es
h1
40
0.0
01
55
4.6
22
14
0.0
02
37
7.5
69
80
6.0
01
62
0.0
05
18
4.0
01
98
6.0
02
55
2.1
45
90
.01
2A
run
ac
ha
l P
rad
es
h7
8.0
01
20
.65
25
0.0
02
47
.93
56
5.0
07
35
.00
18
81
.00
95
4.0
01
20
1.3
47
51
.89
3A
ss
am
60
0.0
05
70
.31
10
00
.00
17
17
.42
22
85
.00
27
89
.00
99
76
.00
55
34
.00
54
99
.52
011
.13
4B
iha
r6
96
.00
63
0.3
99
50
.00
10
50
.73
26
05
.00
72
5.0
01
00
0.0
06
72
.00
10
81
38
9.3
35
Ch
att
isg
arh
45
4.0
01
49
9.1
98
00
.28
6D
elh
i6
0.0
05
7.3
28
0.0
04
9.3
46
0.0
07
3.1
01
25
.00
92
.00
38
.51
4.8
37
Go
a4
00
.00
31
7.4
15
00
.00
44
4.0
51
00
0.0
06
44
.00
79
2.0
06
86
.00
24
24
.41
39
7.1
68
Gu
jara
t2
00
0.0
01
91
4.9
02
42
6.0
02
10
8.3
73
70
0.0
03
62
6.0
01
04
00
.00
63
67
.00
61
32
27
69
9H
ary
an
a1
95
.00
37
8.2
37
50
.00
67
9.3
41
50
6.0
01
27
7.0
01
73
8.0
02
35
4.0
02
86
51
39
0.1
31
0H
ima
ch
al P
rad
es
h1
80
.00
15
1.0
04
30
.00
32
9.6
78
00
.00
10
58
.00
14
50
.00
13
70
.00
89
9.3
45
13
.25
11
Ja
mm
u &
Ka
sh
mir
23
0.0
02
42
.28
45
0.0
05
34
.17
92
0.0
011
55
.00
27
50
.00
23
54
.00
42
15
.73
27
41
.26
12
Jh
ark
ha
nd
31
2.0
03
36
7.5
91
42
8.8
41
3K
arn
ata
ka
13
03
.00
114
5.0
72
00
0.0
01
47
0.4
64
30
0.0
08
09
8.0
011
05
0.0
05
21
5.0
05
05
8.7
82
96
4.0
11
4K
era
la2
00
0.0
02
07
9.1
94
00
0.0
03
29
4.4
11
05
00
.00
113
37
.00
17
60
8.0
01
49
84
.00
17
57
87
72
4.7
41
5M
ad
hy
a P
rad
es
h7
00
.00
59
2.1
51
04
8.0
09
09
.64
17
08
.00
20
28
.00
47
92
.00
29
95
.00
31
37
.93
13
77
.27
16
Ma
ha
ras
htr
a1
20
7.0
01
47
1.5
41
60
0.0
01
78
3.9
02
91
4.0
02
73
6.0
04
18
8.0
05
13
8.0
06
99
3.5
12
21
6.0
11
7M
an
ipu
r2
50
.00
27
0.1
74
65
.00
50
4.8
98
00
.00
95
6.0
02
00
0.0
09
22
.00
99
5.6
72
37
.64
18
Me
gh
ala
ya
90
.00
110
.09
18
0.0
02
01
.49
35
0.0
04
13
.00
14
00
.00
52
1.0
011
79
27
1.7
91
9M
izo
ram
60
.00
76
.27
10
0.0
01
74
.10
22
5.0
03
34
.00
45
0.0
05
86
.00
94
64
20
.27
20
Na
ga
lan
d7
0.0
01
08
.94
30
0.0
03
51
.79
65
0.0
05
71
.00
20
00
.00
71
5.0
01
29
75
44
.47
21
Ori
ss
a1
00
0.0
09
44
.57
12
60
.00
26
70
.53
10
46
4.0
05
26
3.0
05
41
8.0
06
95
5.0
02
27
2.9
88
01
.47
22
Pu
nja
b1
75
.00
21
0.2
75
98
.00
53
6.7
61
78
2.0
01
04
8.0
01
95
2.0
01
04
9.0
05
43
.13
24
.74
23
Ra
jas
tha
n2
25
.00
18
5.1
44
00
.00
27
4.9
99
55
.00
59
0.0
07
70
.00
37
6.0
02
51
.93
96
.58
24
Sik
kim
10
0.0
07
1.3
51
20
.00
79
.95
15
0.0
01
50
.00
20
0.0
01
78
.00
24
51
23
.64
25
Ta
mil N
ad
u2
40
0.0
01
04
2.4
32
40
0.0
01
46
7.9
43
15
0.0
07
81
7.0
09
98
4.0
011
17
8.0
07
58
7.0
39
74
7.9
62
6Tri
pu
ra3
33
.00
41
9.5
26
00
.00
114
9.8
62
20
0.0
01
88
3.0
01
98
8.0
01
63
5.0
02
25
1.3
26
95
.97
27
Utt
ara
nc
ha
l1
43
.00
114
4.5
43
25
.62
28
Utt
ar
Pra
de
sh
65
9.0
09
53
.00
12
50
.00
12
39
.74
21
50
.00
23
80
.00
28
00
.00
30
23
.00
39
51
14
39
29
We
st
Be
ng
al
27
00
.00
20
12
.34
61
75
.00
39
17
.40
79
17
.00
61
64
.00
18
71
3.0
01
82
14
.00
16
06
38
03
9.3
13
0A
& N
Is
lan
ds
20
0.0
01
26
.41
40
5.0
01
50
.98
112
1.0
01
38
7.2
92
48
4.0
01
82
9.0
04
44
0.6
113
4.8
33
1C
ha
nd
iga
rh1
0.0
09
.25
17
.40
17
.17
26
.00
16
.88
50
0.0
01
9.0
01
49
33
.21
32
Da
dra
& N
ag
ar
Ha
ve
li5
.00
0.0
05
.00
3.0
81
0.0
05
.26
11.0
03
.04
20
33
Da
ma
n &
Diu
-1
36
.55
20
2.0
02
03
.29
32
2.0
03
16
.00
37
61
59
.46
34
La
ks
ha
dw
ee
p1
75
.00
15
4.7
25
20
.00
32
7.1
59
38
.00
81
7.3
11
55
2.0
01
09
4.0
011
88
38
7.0
13
5P
ud
uc
he
rry
24
1.0
03
41
.25
50
0.0
05
38
.95
88
0.0
01
04
2.6
31
50
0.0
01
40
3.0
04
63
11
72
0.7
7To
tal
19
74
2.0
01
82
60
.78
32
91
9.4
03
07
40
.31
76
63
9.0
06
89
42
.76
12
69
78
.00
10
16
26
.04
11
40
58
.16
54
28
2.8
8
TABLE E-3OUTLAY AND EXPENDITURE ON FISHERIES DEVELOPMENT UNDER STATE SECTOR SCHEMES, DURING TENTH PLAN
Source : Planning Commission
( Rs.in Lakhs)
Sl. State / UT Annual Annual Annual Annual AnnualNo. Plan Plan Plan Plan Plan
2002-03 2003-04 2004-05 2005-06 2006-07 Outlay Expen- Outlay Expen- Outlay Expen- Outlay Outlay
diture diture diture1. 2. 3. 4. 5. 6. 7. 8. 9. 10.
1 Andhra Pradesh 189.00 230.17 153.55 139.39 178.36 220.45 802.66 1034.36
2 Arunachal Pradesh 250.00 296.23 250.00 251.02 203.21 204.64 200.00 240.00
3 Assam 1539.00 537.29 964.00 559.34 914.50 914.50 2082.00
4 Bihar 180.00 114.02 175.00 159.28 206.00 116.03 306.57 400.00
5 Chattisgarh 246.00 223.00 276.00 332.00 251.00 245.28 408.85 595.20
6 Delhi 14.00 8.79 4.50 4.23 7.00 1.81 7.00 4.00
7 Goa 174.00 89.67 163.76 142.53 226.18 164.96 629.96 1185.65
8 Gujarat 1214.00 852.02 1214.00 848.98 1068.00 1068.00 1068.00 1568.00
9 Haryana 715.00 422.07 500.00 490.20 500.00 477.86 600.00 600.00
10 Himachal Pradesh 221.00 263.86 147.90 124.08 138.86 125.31 191.15 202.84
11 Jammu & Kashmir 702.13 775.13 851.00 900.44 1069.20 1065.69 1004.20 700.00
12 Jharkhand 421.00 445.71 432.37 333.64 667.00 649.49 700.20 1137.39
13 Karnataka 852.00 1248.63 842.83 820.76 894.62 894.62 937.79 1216.58
14 Kerala 3000.00 4247.73 1885.00 1733.63 1564.60 1743.38 2336.64 5838.00
15 Madhya Pradesh 570.00 445.32 598.07 433.81 589.00 498.14 1121.79 701.34
16 Maharashtra 1086.00 798.52 849.04 617.24 101.95 800.25 1017.31 3659.20
17 Manipur 140.00 75.84 191.00 62.97 100.00 98.83 184.67 380.00
18 Meghalaya 110.00 74.25 109.00 95.15 120.00 102.39 390.00 440.00
19 Mizoram 117.00 116.01 122.00 121.04 182.00 183.22 230.00 280.00
20 Nagaland 90.00 106.45 305.00 305.00 240.00 133.02 280.00 430.00
21 Orissa 180.00 427.29 145.99 205.88 145.99 168.30 391.00 1195.00
22 Punjab 27.00 21.07 23.80 3.67 17.67 0.00 141.13 171.00
23 Rajasthan 44.00 38.16 36.35 19.62 39.15 38.80 62.34 70.25
24 Sikkim 45.00 45.10 40.00 38.19 40.00 40.35 60.00 60.00
25 Tamil Nadu 1780.00 1293.26 2206.13 4513.03 2052.52 3941.67 1593.30
26 Tripura 232.00 232.36 230.79 220.55 506.99 243.06 375.80 933.00
27 Uttaranchal 87.00 46.49 739.18 57.00 237.21 222.13 153.33 580.00
28 Uttar Pradesh 619.00 532.50 647.00 451.09 350.00 455.41 826.00 592.00
29 West Bengal 2055.00 1683.78 2973.00 2702.29 3345.00 3653.24 3295.00 3915.00
30 A & N Islands 450.00 416.51 500.00 393.26 407.00 325.06 683.60 2400.00
31 Chandigarh 58.00 3.94 37.00 20.76 20.00 8.51 34.00
32 Dadra &Nagar Haveli 0.00 0.00 0.00 0.00 0.00 1.00 1.00
33 Daman & Diu 52.00 53.16 52.00 42.60 53.00 63.70 104.00 115.00
34 Lakshadweep 190.00 132.49 180.00 118.48 177.00 136.04 190.00 431.00
35 Puducherry 323.85 322.20 560.17 557.18 844.20 841.39 1472.09 1053.00
Total 17972.98 16619.02 18405.43 17818.33 17457.21 19845.53 23881.38 32128.81
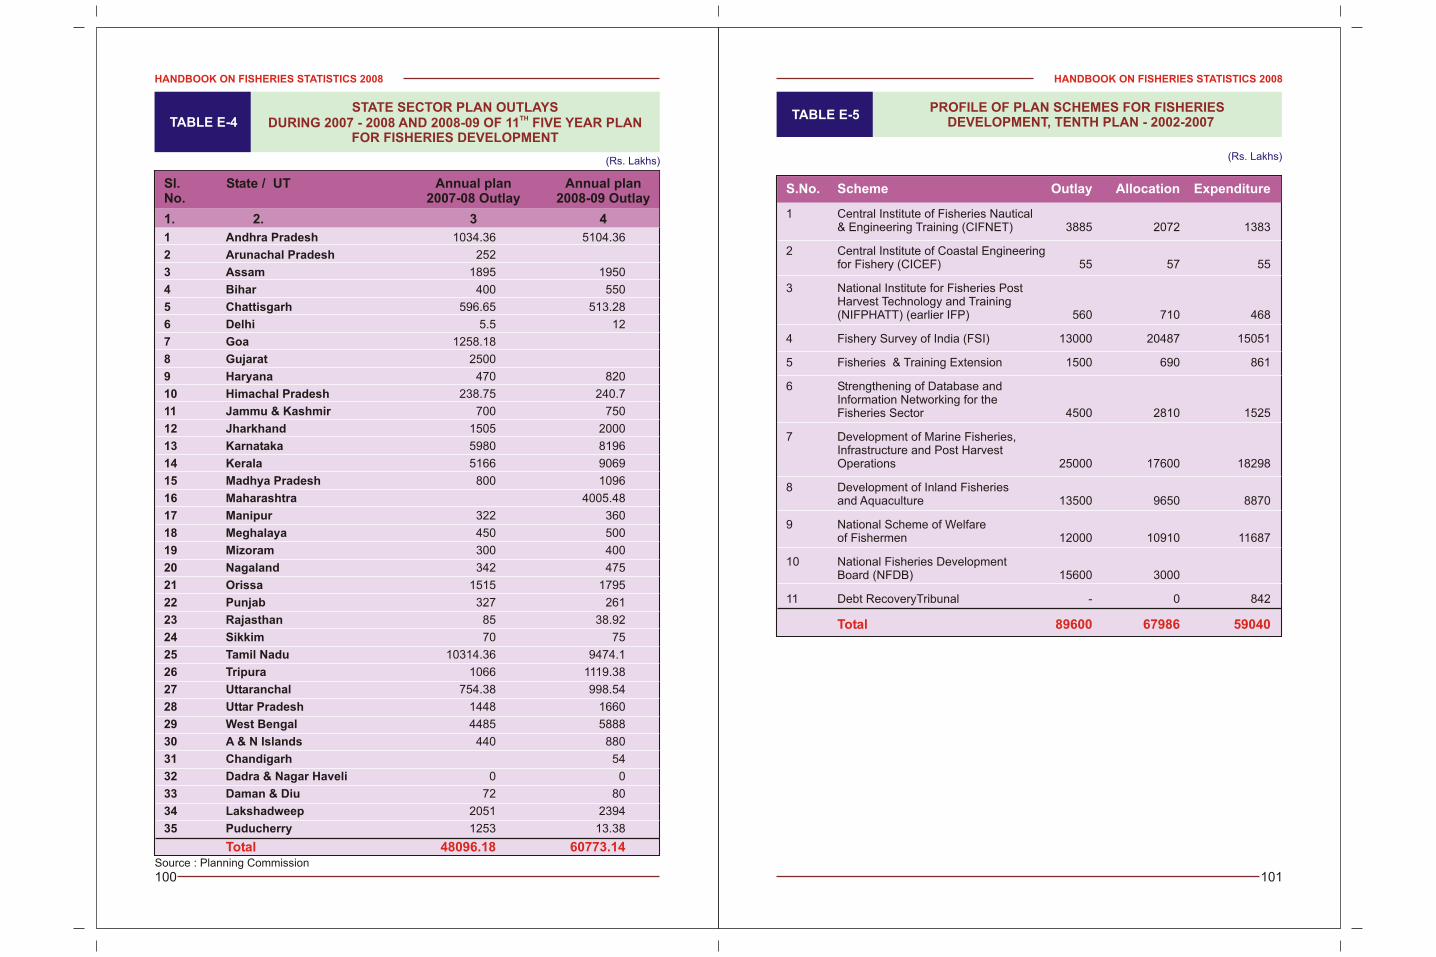
HANDBOOK ON FISHERIES STATISTICS 2008
101
HANDBOOK ON FISHERIES STATISTICS 2008
100
TABLE E-5PROFILE OF PLAN SCHEMES FOR FISHERIES
DEVELOPMENT, TENTH PLAN - 2002-2007
(Rs. Lakhs)
TABLE E-4STATE SECTOR PLAN OUTLAYS
THDURING 2007 - 2008 AND 2008-09 OF 11 FIVE YEAR PLAN FOR FISHERIES DEVELOPMENT
(Rs. Lakhs)
Source : Planning Commission
Sl. State / UT Annual plan Annual plan No. 2007-08 Outlay 2008-09 Outlay
1. 2. 3 4
1 Andhra Pradesh 1034.36 5104.36
2 Arunachal Pradesh 252
3 Assam 1895 1950
4 Bihar 400 550
5 Chattisgarh 596.65 513.28
6 Delhi 5.5 12
7 Goa 1258.18
8 Gujarat 2500
9 Haryana 470 820
10 Himachal Pradesh 238.75 240.7
11 Jammu & Kashmir 700 750
12 Jharkhand 1505 2000
13 Karnataka 5980 8196
14 Kerala 5166 9069
15 Madhya Pradesh 800 1096
16 Maharashtra 4005.48
17 Manipur 322 360
18 Meghalaya 450 500
19 Mizoram 300 400
20 Nagaland 342 475
21 Orissa 1515 1795
22 Punjab 327 261
23 Rajasthan 85 38.92
24 Sikkim 70 75
25 Tamil Nadu 10314.36 9474.1
26 Tripura 1066 1119.38
27 Uttaranchal 754.38 998.54
28 Uttar Pradesh 1448 1660
29 West Bengal 4485 5888
30 A & N Islands 440 880
31 Chandigarh 54
32 Dadra & Nagar Haveli 0 0
33 Daman & Diu 72 80
34 Lakshadweep 2051 2394
35 Puducherry 1253 13.38
Total 48096.18 60773.14
S.No. Scheme Outlay Allocation Expenditure
1 Central Institute of Fisheries Nautical& Engineering Training (CIFNET) 3885 2072 1383
2 Central Institute of Coastal Engineering for Fishery (CICEF) 55 57 55
3 National Institute for Fisheries Post Harvest Technology and Training(NIFPHATT) (earlier IFP) 560 710 468
4 Fishery Survey of India (FSI) 13000 20487 15051
5 Fisheries & Training Extension 1500 690 861
6 Strengthening of Database and Information Networking for the Fisheries Sector 4500 2810 1525
7 Development of Marine Fisheries,Infrastructure and Post HarvestOperations 25000 17600 18298
8 Development of Inland Fisheries and Aquaculture 13500 9650 8870
9 National Scheme of Welfare of Fishermen 12000 10910 11687
10 National Fisheries Development Board (NFDB) 15600 3000
11 Debt RecoveryTribunal - 0 842
Total 89600 67986 59040
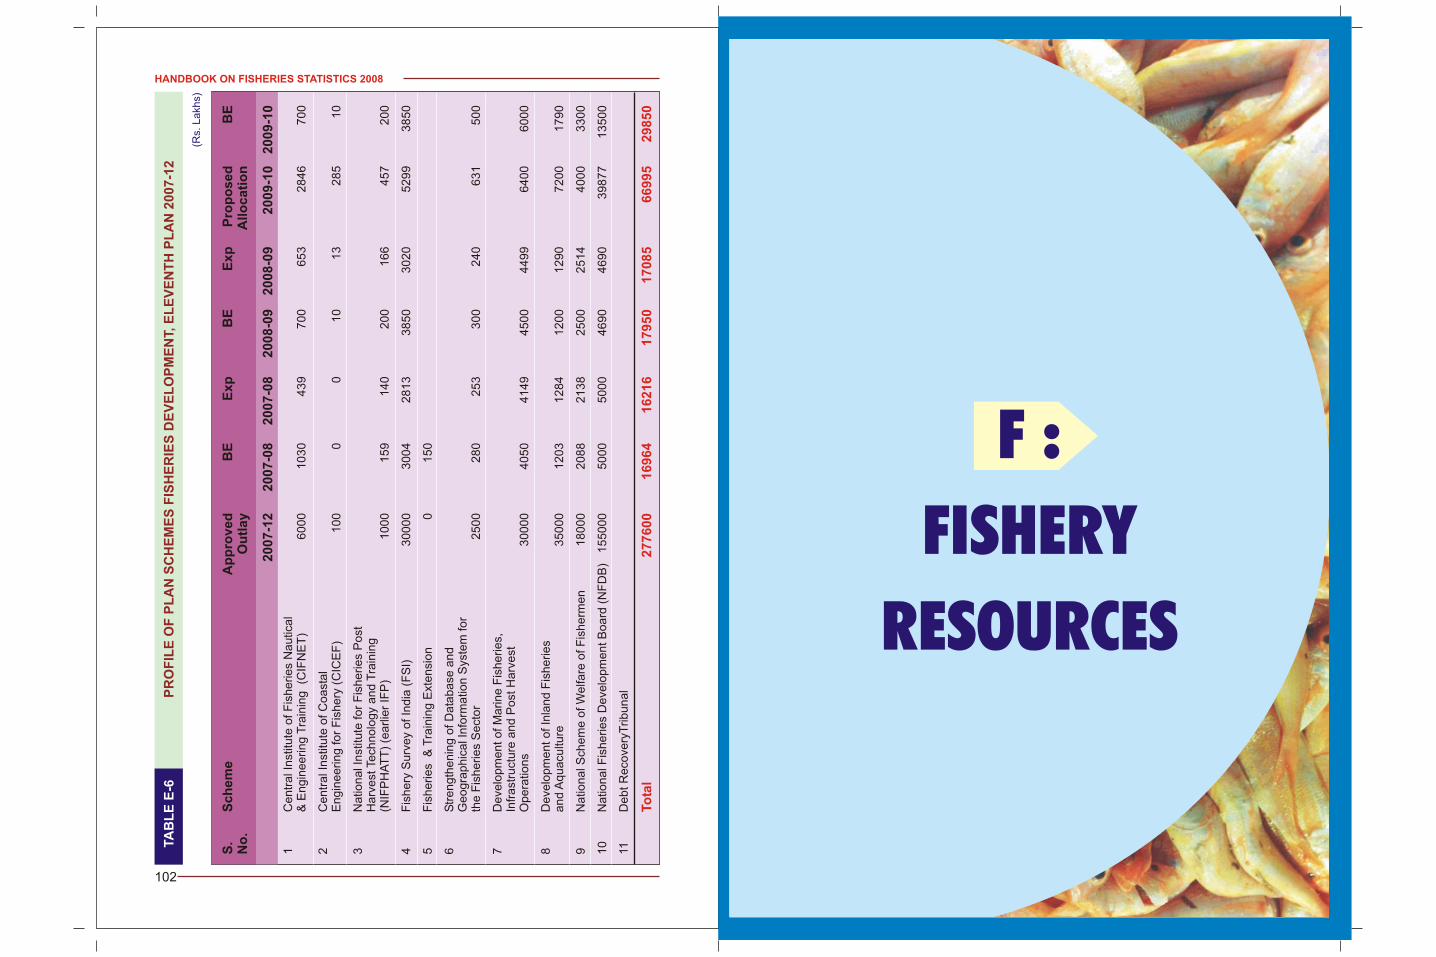
HANDBOOK ON FISHERIES STATISTICS 2008
102
TA
BL
E E
-6P
RO
FIL
E O
F P
LA
N S
CH
EM
ES
FIS
HE
RIE
S D
EV
EL
OP
ME
NT,
EL
EV
EN
TH
PL
AN
20
07
-12
(Rs.
La
khs)
S.
Sc
he
me
Ap
pro
ve
dB
EE
xp
BE
Ex
pP
rop
os
ed
B
EN
o.
Ou
tla
yA
llo
ca
tio
n
20
07
-12
20
07
-08
20
07
-08
20
08
-09
20
08
-09
20
09
-10
20
09
-10
1C
en
tra
l In
stitu
te o
f F
ish
erie
s N
au
tica
l &
En
gin
ee
rin
g T
rain
ing
(C
IFN
ET
)6
00
01
03
04
39
70
06
53
28
46
70
0
2C
en
tra
l In
stitu
te o
f C
oa
sta
lE
ng
ine
erin
g fo
r F
ish
ery
(C
ICE
F)
10
00
01
01
32
85
10
3N
atio
na
l In
stitu
te fo
r F
ish
erie
s P
ost
H
arv
est
Te
chn
olo
gy
an
d T
rain
ing
(NIF
PH
AT
T)
(ea
rlie
r IF
P)
10
00
15
91
40
20
01
66
45
72
00
4F
ish
ery
Su
rve
y o
f In
dia
(F
SI)
30
00
03
00
42
81
33
85
03
02
05
29
93
85
0
5F
ish
erie
s &
Tra
inin
g E
xte
nsi
on
01
50
6S
tre
ng
the
nin
g o
f D
ata
ba
se a
nd
Ge
og
rap
hic
al I
nfo
rma
tion
Sys
tem
fo
rth
e F
ish
erie
s S
ect
or
25
00
28
02
53
30
02
40
63
15
00
7D
eve
lop
me
nt o
f M
arin
e F
ish
erie
s,In
fra
stru
ctu
re a
nd
Po
st H
arv
est
Op
era
tion
s3
00
00
40
50
41
49
45
00
44
99
64
00
60
00
8D
eve
lop
me
nt o
f In
lan
d F
ish
erie
sa
nd
Aq
ua
cultu
re3
50
00
12
03
12
84
12
00
12
90
72
00
17
90
9N
atio
na
l Sch
em
e o
f W
elfa
re o
f F
ish
erm
en
18
00
02
08
82
13
82
50
02
51
44
00
03
30
0
10
Na
tion
al F
ish
erie
s D
eve
lop
me
nt B
oa
rd (
NF
DB
)1
55
00
05
00
05
00
04
69
04
69
03
98
77
13
50
0
11D
eb
t R
eco
very
Trib
un
al
To
tal
27
76
00
16
96
41
62
16
17
95
01
70
85
66
99
52
98
50
F :
FISHERY
RESOURCES
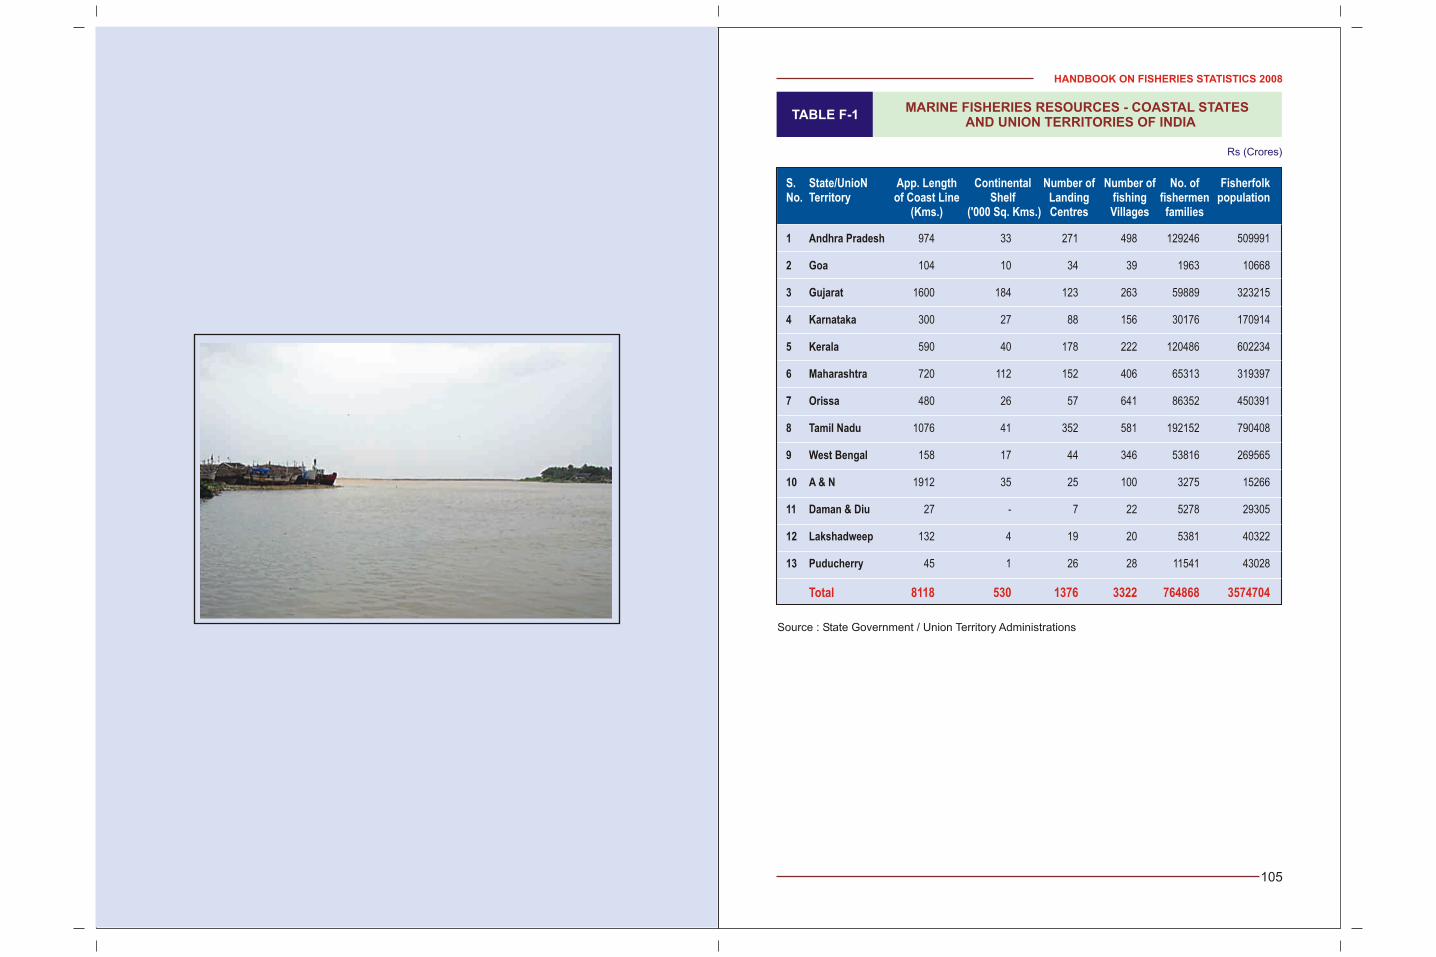
HANDBOOK ON FISHERIES STATISTICS 2008
105
TABLE F-1MARINE FISHERIES RESOURCES - COASTAL STATES
AND UNION TERRITORIES OF INDIA
Source : State Government / Union Territory Administrations
S. State/UnioN App. Length Continental Number of Number of No. of FisherfolkNo. Territory of Coast Line Shelf Landing fishing fishermen population
(Kms.) ('000 Sq. Kms.) Centres Villages families
1 Andhra Pradesh 974 33 271 498 129246 509991
2 Goa 104 10 34 39 1963 10668
3 Gujarat 1600 184 123 263 59889 323215
4 Karnataka 300 27 88 156 30176 170914
5 Kerala 590 40 178 222 120486 602234
6 Maharashtra 720 112 152 406 65313 319397
7 Orissa 480 26 57 641 86352 450391
8 Tamil Nadu 1076 41 352 581 192152 790408
9 West Bengal 158 17 44 346 53816 269565
10 A & N 1912 35 25 100 3275 15266
11 Daman & Diu 27 - 7 22 5278 29305
12 Lakshadweep 132 4 19 20 5381 40322
13 Puducherry 45 1 26 28 11541 43028
Total 8118 530 1376 3322 764868 3574704
Rs (Crores)
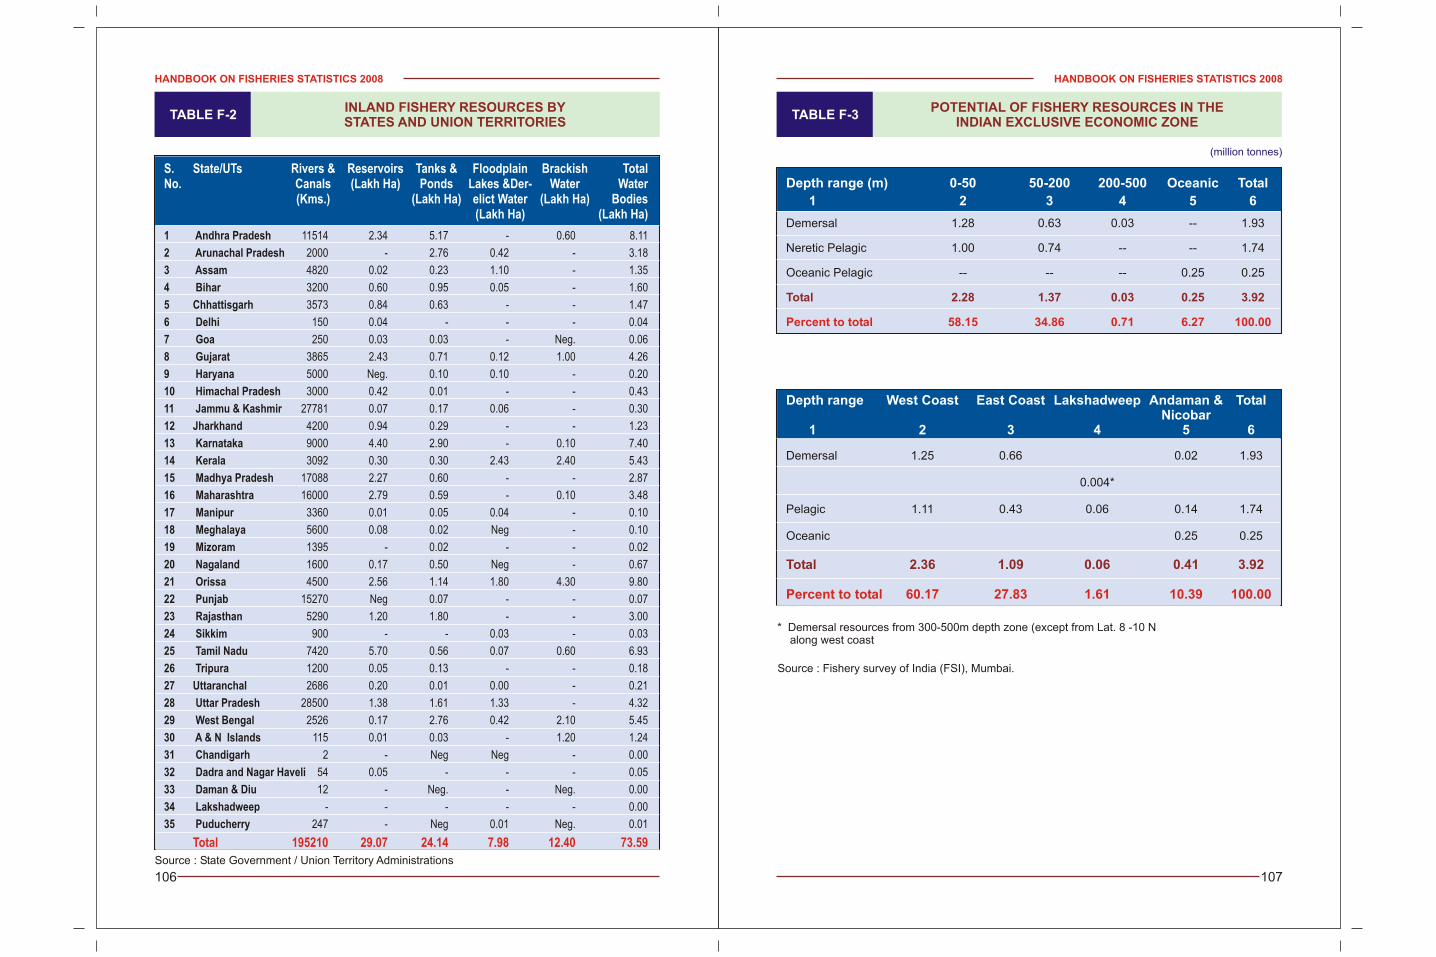
HANDBOOK ON FISHERIES STATISTICS 2008
107
TABLE F-3POTENTIAL OF FISHERY RESOURCES IN THE
INDIAN EXCLUSIVE ECONOMIC ZONE
* Demersal resources from 300-500m depth zone (except from Lat. 8 -10 N along west coast
Depth range (m) 0-50 50-200 200-500 Oceanic Total
1 2 3 4 5 6
Demersal 1.28 0.63 0.03 -- 1.93
Neretic Pelagic 1.00 0.74 -- -- 1.74
Oceanic Pelagic -- -- -- 0.25 0.25
Total 2.28 1.37 0.03 0.25 3.92
Percent to total 58.15 34.86 0.71 6.27 100.00
(million tonnes)
TABLE F-2INLAND FISHERY RESOURCES BYSTATES AND UNION TERRITORIES
S. State/UTs Rivers & Reservoirs Tanks & Floodplain Brackish Total No. Canals (Lakh Ha) Ponds Lakes &Der- Water Water
(Kms.) (Lakh Ha) elict Water (Lakh Ha) Bodies(Lakh Ha) (Lakh Ha)
1 Andhra Pradesh 11514 2.34 5.17 - 0.60 8.11
2 Arunachal Pradesh 2000 - 2.76 0.42 - 3.18
3 Assam 4820 0.02 0.23 1.10 - 1.35
4 Bihar 3200 0.60 0.95 0.05 - 1.60
5 Chhattisgarh 3573 0.84 0.63 - - 1.47
6 Delhi 150 0.04 - - - 0.04
7 Goa 250 0.03 0.03 - Neg. 0.06
8 Gujarat 3865 2.43 0.71 0.12 1.00 4.26
9 Haryana 5000 Neg. 0.10 0.10 - 0.20
10 Himachal Pradesh 3000 0.42 0.01 - - 0.43
11 Jammu & Kashmir 27781 0.07 0.17 0.06 - 0.30
12 Jharkhand 4200 0.94 0.29 - - 1.23
13 Karnataka 9000 4.40 2.90 - 0.10 7.40
14 Kerala 3092 0.30 0.30 2.43 2.40 5.43
15 Madhya Pradesh 17088 2.27 0.60 - - 2.87
16 Maharashtra 16000 2.79 0.59 - 0.10 3.48
17 Manipur 3360 0.01 0.05 0.04 - 0.10
18 Meghalaya 5600 0.08 0.02 Neg - 0.10
19 Mizoram 1395 - 0.02 - - 0.02
20 Nagaland 1600 0.17 0.50 Neg - 0.67
21 Orissa 4500 2.56 1.14 1.80 4.30 9.80
22 Punjab 15270 Neg 0.07 - - 0.07
23 Rajasthan 5290 1.20 1.80 - - 3.00
24 Sikkim 900 - - 0.03 - 0.03
25 Tamil Nadu 7420 5.70 0.56 0.07 0.60 6.93
26 Tripura 1200 0.05 0.13 - - 0.18
27 Uttaranchal 2686 0.20 0.01 0.00 - 0.21
28 Uttar Pradesh 28500 1.38 1.61 1.33 - 4.32
29 West Bengal 2526 0.17 2.76 0.42 2.10 5.45
30 A & N Islands 115 0.01 0.03 - 1.20 1.24
31 Chandigarh 2 - Neg Neg - 0.00
32 Dadra and Nagar Haveli 54 0.05 - - - 0.05
33 Daman & Diu 12 - Neg. - Neg. 0.00
34 Lakshadweep - - - - - 0.00
35 Puducherry 247 - Neg 0.01 Neg. 0.01
Total 195210 29.07 24.14 7.98 12.40 73.59
HANDBOOK ON FISHERIES STATISTICS 2008
106
Depth range West Coast East Coast Lakshadweep Andaman & TotalNicobar
1 2 3 4 5 6
Demersal 1.25 0.66 0.02 1.93
0.004*
Pelagic 1.11 0.43 0.06 0.14 1.74
Oceanic 0.25 0.25
Total 2.36 1.09 0.06 0.41 3.92
Percent to total 60.17 27.83 1.61 10.39 100.00
Source : State Government / Union Territory Administrations
Source : Fishery survey of India (FSI), Mumbai.
HANDBOOK ON FISHERIES STATISTICS 2008
108
G :
INTERNATIONAL
COMPARISONS
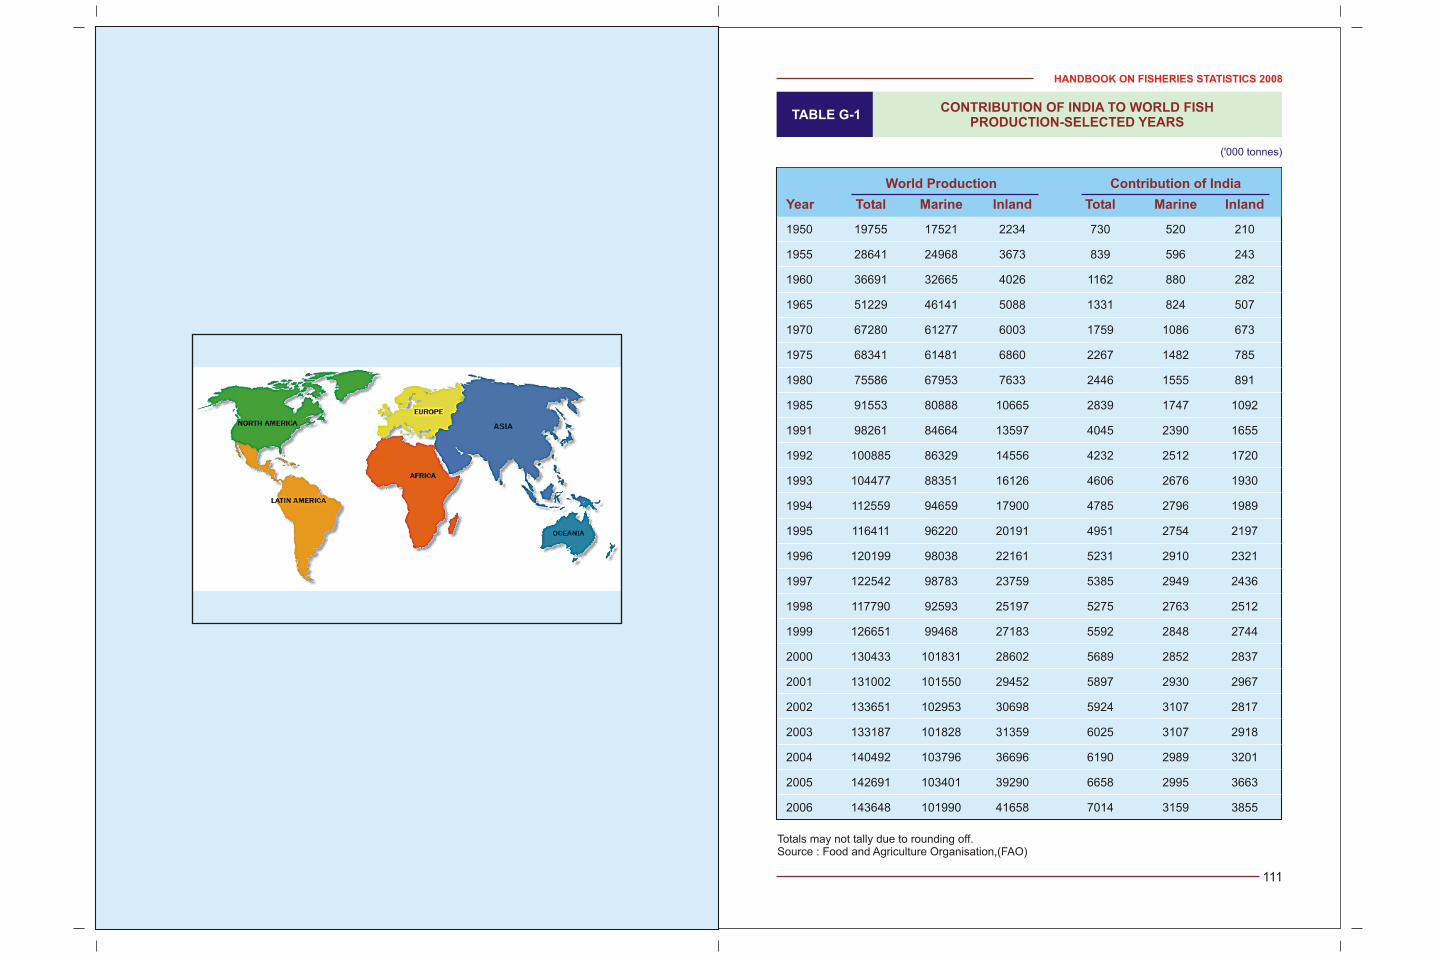
HANDBOOK ON FISHERIES STATISTICS 2008
111
TABLE G-1CONTRIBUTION OF INDIA TO WORLD FISH
PRODUCTION-SELECTED YEARS
Totals may not tally due to rounding off.Source : Food and Agriculture Organisation,(FAO)
World Production Contribution of India
Year Total Marine Inland Total Marine Inland
1950 19755 17521 2234 730 520 210
1955 28641 24968 3673 839 596 243
1960 36691 32665 4026 1162 880 282
1965 51229 46141 5088 1331 824 507
1970 67280 61277 6003 1759 1086 673
1975 68341 61481 6860 2267 1482 785
1980 75586 67953 7633 2446 1555 891
1985 91553 80888 10665 2839 1747 1092
1991 98261 84664 13597 4045 2390 1655
1992 100885 86329 14556 4232 2512 1720
1993 104477 88351 16126 4606 2676 1930
1994 112559 94659 17900 4785 2796 1989
1995 116411 96220 20191 4951 2754 2197
1996 120199 98038 22161 5231 2910 2321
1997 122542 98783 23759 5385 2949 2436
1998 117790 92593 25197 5275 2763 2512
1999 126651 99468 27183 5592 2848 2744
2000 130433 101831 28602 5689 2852 2837
2001 131002 101550 29452 5897 2930 2967
2002 133651 102953 30698 5924 3107 2817
2003 133187 101828 31359 6025 3107 2918
2004 140492 103796 36696 6190 2989 3201
2005 142691 103401 39290 6658 2995 3663
2006 143648 101990 41658 7014 3159 3855
('000 tonnes)
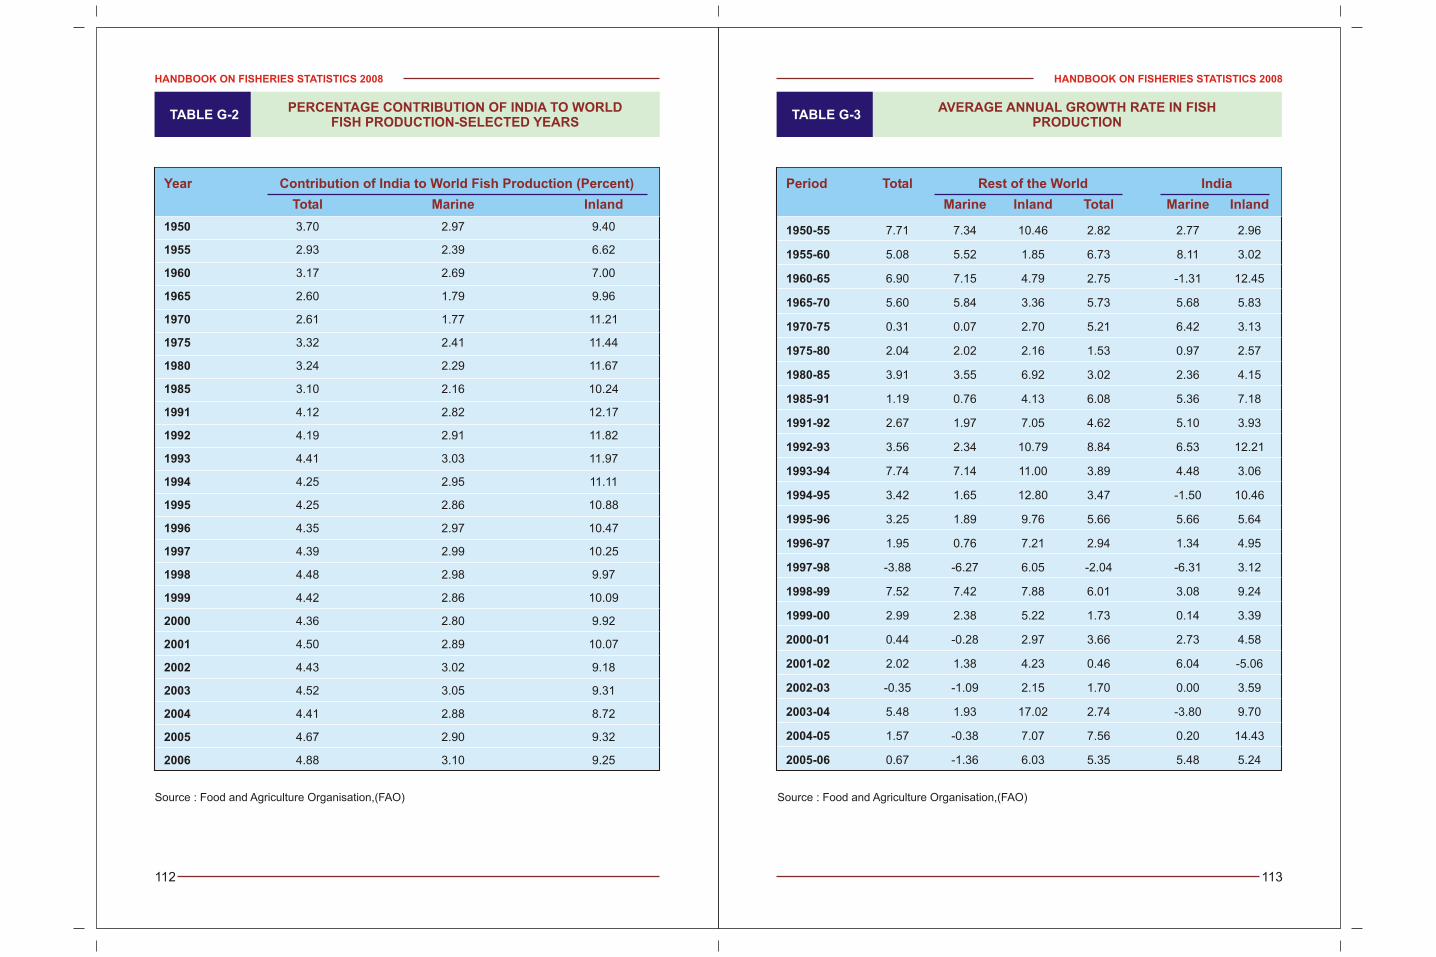
HANDBOOK ON FISHERIES STATISTICS 2008
113
TABLE G-3AVERAGE ANNUAL GROWTH RATE IN FISH
PRODUCTION
Period Total Rest of the World India
Marine Inland Total Marine Inland
1950-55 7.71 7.34 10.46 2.82 2.77 2.96
1955-60 5.08 5.52 1.85 6.73 8.11 3.02
1960-65 6.90 7.15 4.79 2.75 -1.31 12.45
1965-70 5.60 5.84 3.36 5.73 5.68 5.83
1970-75 0.31 0.07 2.70 5.21 6.42 3.13
1975-80 2.04 2.02 2.16 1.53 0.97 2.57
1980-85 3.91 3.55 6.92 3.02 2.36 4.15
1985-91 1.19 0.76 4.13 6.08 5.36 7.18
1991-92 2.67 1.97 7.05 4.62 5.10 3.93
1992-93 3.56 2.34 10.79 8.84 6.53 12.21
1993-94 7.74 7.14 11.00 3.89 4.48 3.06
1994-95 3.42 1.65 12.80 3.47 -1.50 10.46
1995-96 3.25 1.89 9.76 5.66 5.66 5.64
1996-97 1.95 0.76 7.21 2.94 1.34 4.95
1997-98 -3.88 -6.27 6.05 -2.04 -6.31 3.12
1998-99 7.52 7.42 7.88 6.01 3.08 9.24
1999-00 2.99 2.38 5.22 1.73 0.14 3.39
2000-01 0.44 -0.28 2.97 3.66 2.73 4.58
2001-02 2.02 1.38 4.23 0.46 6.04 -5.06
2002-03 -0.35 -1.09 2.15 1.70 0.00 3.59
2003-04 5.48 1.93 17.02 2.74 -3.80 9.70
2004-05 1.57 -0.38 7.07 7.56 0.20 14.43
2005-06 0.67 -1.36 6.03 5.35 5.48 5.24
TABLE G-2PERCENTAGE CONTRIBUTION OF INDIA TO WORLD
FISH PRODUCTION-SELECTED YEARS
Year Contribution of India to World Fish Production (Percent)
Total Marine Inland
1950 3.70 2.97 9.40
1955 2.93 2.39 6.62
1960 3.17 2.69 7.00
1965 2.60 1.79 9.96
1970 2.61 1.77 11.21
1975 3.32 2.41 11.44
1980 3.24 2.29 11.67
1985 3.10 2.16 10.24
1991 4.12 2.82 12.17
1992 4.19 2.91 11.82
1993 4.41 3.03 11.97
1994 4.25 2.95 11.11
1995 4.25 2.86 10.88
1996 4.35 2.97 10.47
1997 4.39 2.99 10.25
1998 4.48 2.98 9.97
1999 4.42 2.86 10.09
2000 4.36 2.80 9.92
2001 4.50 2.89 10.07
2002 4.43 3.02 9.18
2003 4.52 3.05 9.31
2004 4.41 2.88 8.72
2005 4.67 2.90 9.32
2006 4.88 3.10 9.25
HANDBOOK ON FISHERIES STATISTICS 2008
112
Source : Food and Agriculture Organisation,(FAO) Source : Food and Agriculture Organisation,(FAO)
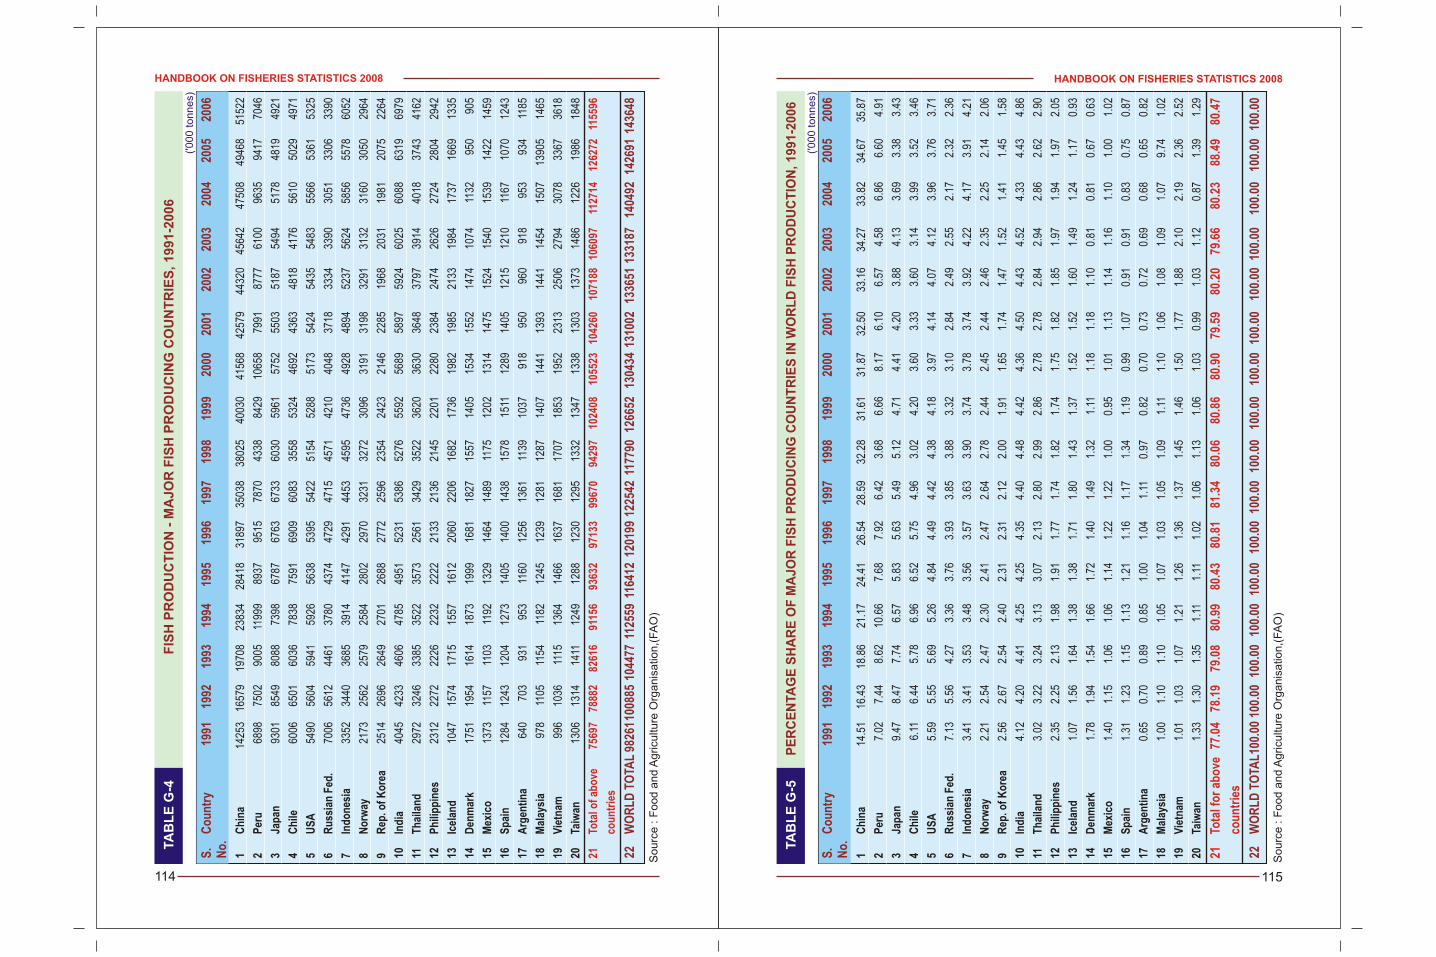
HANDBOOK ON FISHERIES STATISTICS 2008
115
HANDBOOK ON FISHERIES STATISTICS 2008
114
TA
BL
E G
-4 F
ISH
PR
OD
UC
TIO
N -
MA
JO
R F
ISH
PR
OD
UC
ING
CO
UN
TR
IES
, 1
99
1-2
00
6
So
urc
e : F
oo
d a
nd
Ag
ricu
lture
Org
an
isa
tion
,(FA
O)
('0
00
to
nn
es)
S.
Co
un
try
1991
1992
1993
1994
1995
1996
1997
1998
1999
2000
2001
2002
2003
2004
2005
2006
No
.
22W
OR
LD
TO
TAL
9826
110
0885
1044
7711
2559
1164
1212
0199
1225
4211
7790
1266
5213
0434
1310
0213
3651
1331
8714
0492
1426
9114
3648
1C
hin
a14
253
1657
919
708
2383
428
418
3189
735
038
3802
540
030
4156
842
579
4432
045
642
4750
849
468
5152
2
2P
eru
6898
7502
9005
1199
989
3795
1578
7043
3884
2910
658
7991
8777
6100
9635
9417
7046
3Ja
pan
9301
8549
8088
7398
6787
6763
6733
6030
5961
5752
5503
5187
5494
5178
4819
4921
4C
hile
6006
6501
6036
7838
7591
6909
6083
3558
5324
4692
4363
4818
4176
5610
5029
4971
5U
SA
5490
5604
5941
5926
5638
5395
5422
5154
5288
5173
5424
5435
5483
5566
5361
5325
6R
uss
ian
Fed
.70
0656
1244
6137
8043
7447
2947
1545
7142
1040
4837
1833
3433
9030
5133
0633
90
7In
do
nes
ia33
5234
4036
8539
1441
4742
9144
5345
9547
3649
2848
9452
3756
2458
5655
7860
52
8N
orw
ay21
7325
6225
7925
8428
0229
7032
3132
7230
9631
9131
9832
9131
3231
6030
5029
64
9R
ep. o
f K
ore
a25
1426
9626
4927
0126
8827
7225
9623
5424
2321
4622
8519
6820
3119
8120
7522
64
10In
dia
4045
4233
4606
4785
4951
5231
5386
5276
5592
5689
5897
5924
6025
6088
6319
6979
11T
hai
lan
d29
7232
4633
8535
2235
7325
6134
2935
2236
2036
3036
4837
9739
1440
1837
4341
62
12P
hili
pp
ines
2312
2272
2226
2232
2222
2133
2136
2145
2201
2280
2384
2474
2626
2724
2804
2942
13Ic
elan
d10
4715
7417
1515
5716
1220
6022
0616
8217
3619
8219
8521
3319
8417
3716
6913
35
14D
enm
ark
1751
1954
1614
1873
1999
1681
1827
1557
1405
1534
1552
1474
1074
1132
950
905
15M
exic
o13
7311
5711
0311
9213
2914
6414
8911
7512
0213
1414
7515
2415
4015
3914
2214
59
16S
pai
n12
8412
4312
0412
7314
0514
0014
3815
7815
1112
8914
0512
1512
1011
6710
7012
43
17A
rgen
tin
a64
070
393
195
311
6012
5613
6111
3910
3791
895
096
091
895
393
411
85
18M
alay
sia
978
1105
1154
1182
1245
1239
1281
1287
1407
1441
1393
1441
1454
1507
1390
514
65
19V
ietn
am99
610
3611
1513
6414
6616
3716
8117
0718
5319
5223
1325
0627
9430
7833
6736
18
20Ta
iwan
1306
1314
1411
1249
1288
1230
1295
1332
1347
1338
1303
1373
1486
1226
1986
1848
21To
tal o
f ab
ove
7569
778
882
8261
691
156
9363
297
133
9967
094
297
1024
0810
5523
1042
6010
7188
1060
9711
2714
1262
7211
5596
cou
ntr
ies
TA
BL
E G
-5
PE
RC
EN
TA
GE
SH
AR
E O
F M
AJ
OR
FIS
H P
RO
DU
CIN
G C
OU
NT
RIE
S IN
WO
RL
D F
ISH
PR
OD
UC
TIO
N, 1
99
1-2
00
6
('0
00
to
nn
es)
S.
Co
un
try
1991
1992
1993
1994
1995
1996
1997
1998
1999
2000
2001
2002
2003
2004
2005
2006
No
.
22W
OR
LD
TO
TAL
100.
0010
0.00
100.
0010
0.00
100.
0010
0.00
100.
0010
0.00
100.
0010
0.00
100.
0010
0.00
100.
0010
0.00
100.
0010
0.00
1C
hin
a14
.51
16.4
318
.86
21.1
724
.41
26.5
428
.59
32.2
831
.61
31.8
732
.50
33.1
634
.27
33.8
234
.67
35.8
7
2P
eru
7.02
7.44
8.62
10.6
67.
687.
926.
423.
686.
668.
176.
106.
574.
586.
866.
604.
91
3Ja
pan
9.47
8.47
7.74
6.57
5.83
5.63
5.49
5.12
4.71
4.41
4.20
3.88
4.13
3.69
3.38
3.43
4C
hile
6.11
6.44
5.78
6.96
6.52
5.75
4.96
3.02
4.20
3.60
3.33
3.60
3.14
3.99
3.52
3.46
5U
SA
5.59
5.55
5.69
5.26
4.84
4.49
4.42
4.38
4.18
3.97
4.14
4.07
4.12
3.96
3.76
3.71
6R
uss
ian
Fed
.7.
135.
564.
273.
363.
763.
933.
853.
883.
323.
102.
842.
492.
552.
172.
322.
36
7In
do
nes
ia3.
413.
413.
533.
483.
563.
573.
633.
903.
743.
783.
743.
924.
224.
173.
914.
21
8N
orw
ay2.
212.
542.
472.
302.
412.
472.
642.
782.
442.
452.
442.
462.
352.
252.
142.
06
9R
ep. o
f K
ore
a2.
562.
672.
542.
402.
312.
312.
122.
001.
911.
651.
741.
471.
521.
411.
451.
58
10In
dia
4.12
4.20
4.41
4.25
4.25
4.35
4.40
4.48
4.42
4.36
4.50
4.43
4.52
4.33
4.43
4.86
11T
hai
lan
d3.
023.
223.
243.
133.
072.
132.
802.
992.
862.
782.
782.
842.
942.
862.
622.
90
12P
hili
pp
ines
2.35
2.25
2.13
1.98
1.91
1.77
1.74
1.82
1.74
1.75
1.82
1.85
1.97
1.94
1.97
2.05
13Ic
elan
d1.
071.
561.
641.
381.
381.
711.
801.
431.
371.
521.
521.
601.
491.
241.
170.
93
14D
enm
ark
1.78
1.94
1.54
1.66
1.72
1.40
1.49
1.32
1.11
1.18
1.18
1.10
0.81
0.81
0.67
0.63
15M
exic
o1.
401.
151.
061.
061.
141.
221.
221.
000.
951.
011.
131.
141.
161.
101.
001.
02
16S
pai
n1.
311.
231.
151.
131.
211.
161.
171.
341.
190.
991.
070.
910.
910.
830.
750.
87
17A
rgen
tin
a0.
650.
700.
890.
851.
001.
041.
110.
970.
820.
700.
730.
720.
690.
680.
650.
82
18M
alay
sia
1.00
1.10
1.10
1.05
1.07
1.03
1.05
1.09
1.11
1.10
1.06
1.08
1.09
1.07
9.74
1.02
19V
ietn
am1.
011.
031.
071.
211.
261.
361.
371.
451.
461.
501.
771.
882.
102.
192.
362.
52
20Ta
iwan
1.33
1.30
1.35
1.11
1.11
1.02
1.06
1.13
1.06
1.03
0.99
1.03
1.12
0.87
1.39
1.29
21To
tal f
or
abo
ve77
.04
78.1
979
.08
80.9
980
.43
80.8
181
.34
80.0
680
.86
80.9
079
.59
80.2
079
.66
80.2
388
.49
80.4
7
cou
ntr
ies
So
urc
e : F
oo
d a
nd
Ag
ricu
lture
Org
an
isa
tion
,(FA
O)
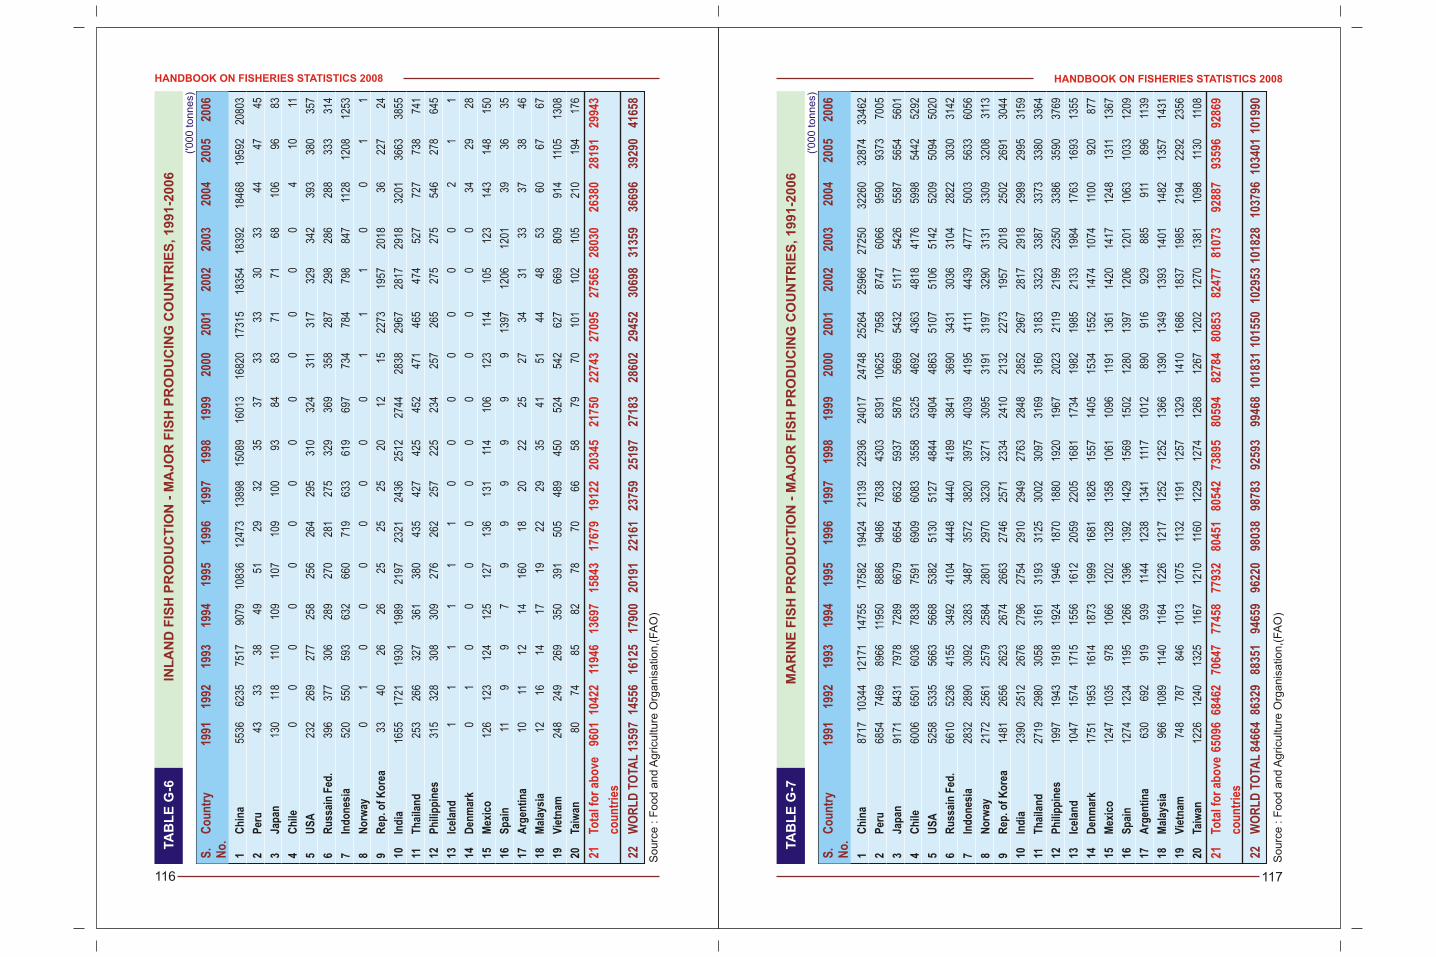
HANDBOOK ON FISHERIES STATISTICS 2008
117
HANDBOOK ON FISHERIES STATISTICS 2008
116
TA
BL
E G
-6 IN
LA
ND
FIS
H P
RO
DU
CT
ION
- M
AJ
OR
FIS
H P
RO
DU
CIN
G C
OU
NT
RIE
S, 1
99
1-2
00
6
So
urc
e : F
oo
d a
nd
Ag
ricu
lture
Org
an
isa
tion
,(FA
O)
So
urc
e : F
oo
d a
nd
Ag
ricu
lture
Org
an
isa
tion
,(FA
O)
('0
00
to
nn
es)
S.
Co
un
try
1991
1992
1993
1994
1995
1996
1997
1998
1999
2000
2001
2002
2003
2004
2005
2006
No
.
22W
OR
LD
TO
TAL
1359
714
556
1612
517
900
2019
122
161
2375
925
197
2718
328
602
2945
230
698
3135
936
696
3929
041
658
1C
hin
a55
3662
3575
1790
7910
836
1247
313
898
1508
916
013
1682
017
315
1835
418
392
1846
819
592
2080
3
2P
eru
4333
3849
5129
3235
3733
3330
3344
4745
3Ja
pan
130
118
110
109
107
109
100
9384
8371
7168
106
9683
4C
hile
00
00
00
00
00
00
04
1011
5U
SA
232
269
277
258
256
264
295
310
324
311
317
329
342
393
380
357
6R
uss
ain
Fed
.39
637
730
628
927
028
127
532
936
935
828
729
828
628
833
331
4
7In
do
nes
ia52
055
059
363
266
071
963
361
969
773
478
479
884
711
2812
0812
53
8N
orw
ay0
10
00
00
00
11
10
01
1
9R
ep. o
f K
ore
a33
4026
2625
2525
2012
1522
7319
5720
1836
227
24
10In
dia
1655
1721
1930
1989
2197
2321
2436
2512
2744
2838
2967
2817
2918
3201
3663
3855
11T
hai
lan
d25
326
632
736
138
043
542
742
545
247
146
547
452
772
773
874
1
12P
hili
pp
ines
315
328
308
309
276
262
257
225
234
257
265
275
275
546
278
645
13Ic
elan
d1
11
11
10
00
00
00
21
1
14D
enm
ark
01
00
00
00
00
00
034
2928
15M
exic
o12
612
312
412
512
713
613
111
410
612
311
410
512
314
314
815
0
16S
pai
n11
99
79
99
99
913
9712
0612
0139
3635
17A
rgen
tin
a10
1112
1416
018
2022
2527
3431
3337
3846
18M
alay
sia
1216
1417
1922
2935
4151
4448
5360
6767
19V
ietn
am24
824
926
935
039
150
548
945
052
454
262
766
980
991
411
0513
08
20Ta
iwan
8074
8582
7870
6658
7970
101
102
105
210
194
176
21To
tal f
or
abo
ve96
0110
422
1194
613
697
1584
317
679
1912
220
345
2175
022
743
2709
527
565
2803
026
380
2819
129
943
cou
ntr
ies
TA
BL
E G
-7M
AR
INE
FIS
H P
RO
DU
CT
ION
- M
AJ
OR
FIS
H P
RO
DU
CIN
G C
OU
NT
RIE
S, 1
99
1-2
00
6
('0
00
to
nn
es)
S.
Co
un
try
1991
1992
1993
1994
1995
1996
1997
1998
1999
2000
2001
2002
2003
2004
2005
2006
No
.
22W
OR
LD
TO
TAL
8466
486
329
8835
194
659
9622
098
038
9878
392
593
9946
810
1831
1015
5010
2953
1018
2810
3796
1034
0110
1990
1C
hin
a87
1710
344
1217
114
755
1758
219
424
2113
922
936
2401
724
748
2526
425
966
2725
032
260
3287
433
462
2P
eru
6854
7469
8966
1195
088
8694
8678
3843
0383
9110
625
7958
8747
6066
9590
9373
7005
3Ja
pan
9171
8431
7978
7289
6679
6654
6632
5937
5876
5669
5432
5117
5426
5587
5654
5601
4C
hile
6006
6501
6036
7838
7591
6909
6083
3558
5325
4692
4363
4818
4176
5998
5442
5292
5U
SA
5258
5335
5663
5668
5382
5130
5127
4844
4904
4863
5107
5106
5142
5209
5094
5020
6R
uss
ain
Fed
.66
1052
3641
5534
9241
0444
4844
4041
8938
4136
9034
3130
3631
0428
2230
3031
42
7In
do
nes
ia28
3228
9030
9232
8334
8735
7238
2039
7540
3941
9541
1144
3947
7750
0356
3360
56
8N
orw
ay21
7225
6125
7925
8428
0129
7032
3032
7130
9531
9131
9732
9031
3133
0932
0831
13
9R
ep. o
f K
ore
a14
8126
5626
2326
7426
6327
4625
7123
3424
1021
3222
7319
5720
1825
0226
9130
44
10In
dia
2390
2512
2676
2796
2754
2910
2949
2763
2848
2852
2967
2817
2918
2989
2995
3159
11T
hai
lan
d27
1929
8030
5831
6131
9331
2530
0230
9731
6931
6031
8333
2333
8733
7333
8033
64
12P
hili
pp
ines
1997
1943
1918
1924
1946
1870
1880
1920
1967
2023
2119
2199
2350
3386
3590
3769
13Ic
elan
d10
4715
7417
1515
5616
1220
5922
0516
8117
3419
8219
8521
3319
8417
6316
9313
55
14D
enm
ark
1751
1953
1614
1873
1999
1681
1826
1557
1405
1534
1552
1474
1074
1100
920
877
15M
exic
o12
4710
3597
810
6612
0213
2813
5810
6110
9611
9113
6114
2014
1712
4813
1113
67
16S
pai
n12
7412
3411
9512
6613
9613
9214
2915
6915
0212
8013
9712
0612
0110
6310
3312
09
17A
rgen
tin
a63
069
291
993
911
4412
3813
4111
1710
1289
091
692
988
591
189
611
39
18M
alay
sia
966
1089
1140
1164
1226
1217
1252
1252
1366
1390
1349
1393
1401
1482
1357
1431
19V
ietn
am74
878
784
610
1310
7511
3211
9112
5713
2914
1016
8618
3719
8521
9422
9223
56
20Ta
iwan
1226
1240
1325
1167
1210
1160
1229
1274
1268
1267
1202
1270
1381
1098
1130
1108
21To
tal f
or
abo
ve65
096
6846
270
647
7745
877
932
8045
180
542
7389
580
594
8278
480
853
8247
781
073
9288
793
596
9286
9
cou
ntr
ies
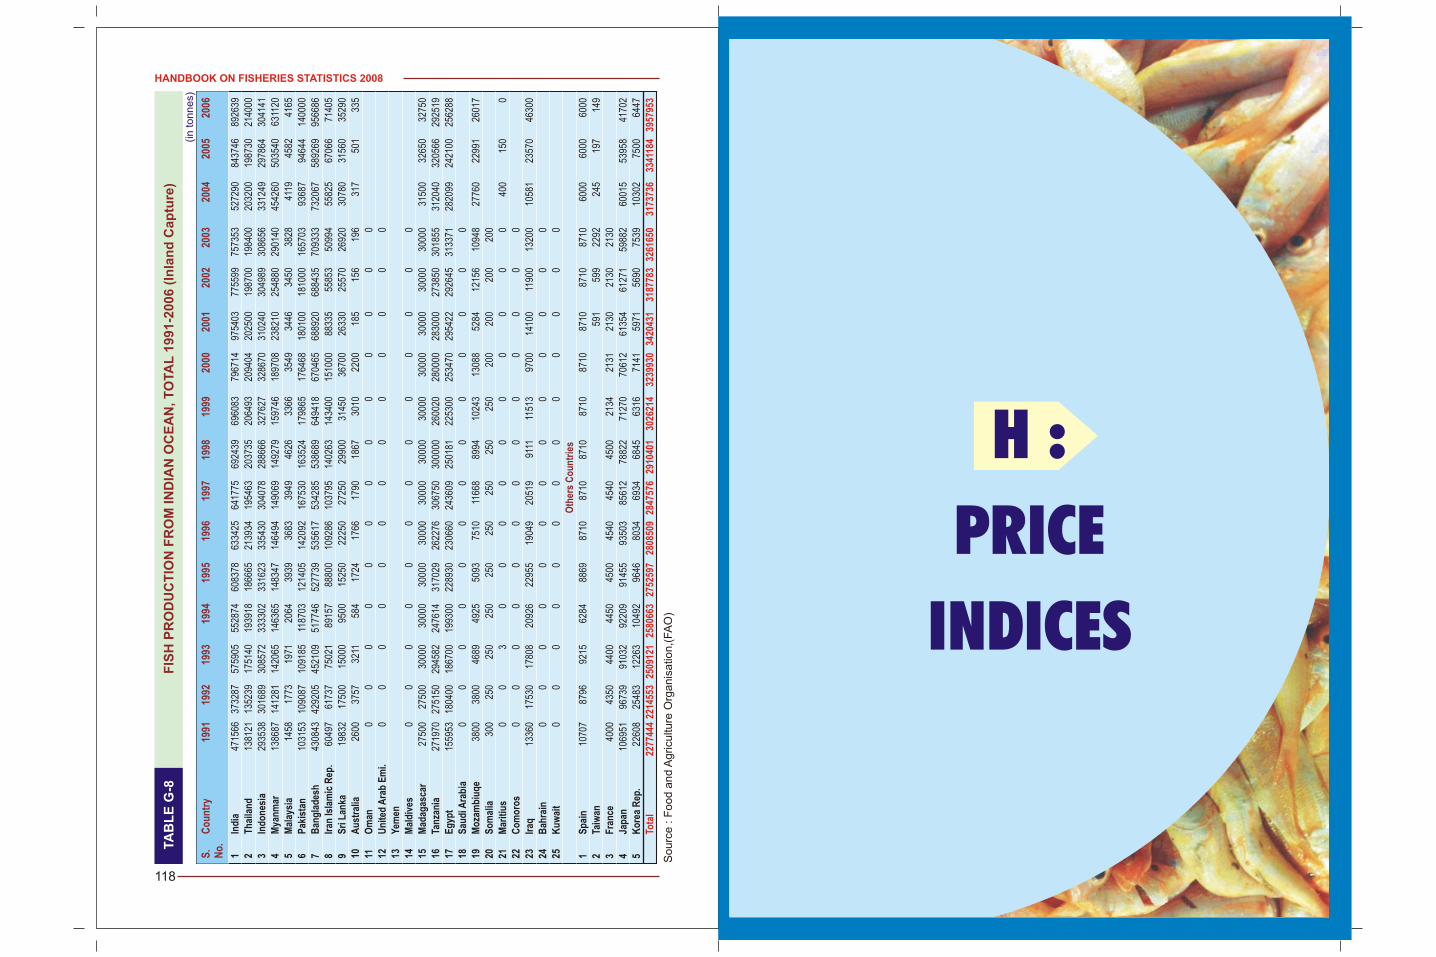
HANDBOOK ON FISHERIES STATISTICS 2008
118
TA
BL
E G
-8F
ISH
PR
OD
UC
TIO
N F
RO
M IN
DIA
N O
CE
AN
, T
OTA
L 1
99
1-2
00
6 (
Inla
nd
Ca
ptu
re)
(in
to
nn
es)
S.
Co
un
try
1991
1992
1993
1994
1995
1996
1997
1998
1999
2000
2001
2002
2003
2004
2005
2006
No
.
Oth
ers
Co
un
trie
s
1In
dia
4715
6637
3287
5759
0555
2874
6083
7863
3425
6417
7569
2439
6960
8379
6714
9754
0377
5599
7573
5352
7290
8437
4689
2639
2T
hai
lan
d13
8121
1352
3917
5140
1939
1818
6665
2139
3419
5463
2037
3520
6493
2094
0420
2500
1987
0019
8400
2032
0019
8730
2140
00
3In
do
nes
ia29
3538
3016
8930
8572
3333
0233
1623
3354
3030
4078
2886
6632
7627
3286
7031
0240
3049
8930
8656
3312
4929
7864
3041
41
4M
yan
mar
1386
8714
1281
1420
6514
6365
1483
4714
6494
1490
6914
9279
1597
4618
9708
2382
1025
4880
2901
4045
4260
5035
4063
1120
5M
alay
sia
1458
1773
1971
2064
3939
3683
3949
4626
3366
3549
3446
3450
3828
4119
4582
4165
6P
akis
tan
1031
5310
9087
1091
8511
8703
1214
0514
2092
1675
3016
3524
1798
6517
6468
1801
0018
1000
1657
0393
687
9464
414
0000
7B
ang
lad
esh
4308
4342
9205
4521
0951
7746
5277
3953
5617
5342
8553
8689
6494
1867
0465
6889
2068
8435
7093
3373
2067
5892
6995
6686
8Ir
an Is
lam
ic R
ep.
6049
761
737
7502
189
157
8880
010
9286
1037
9514
0263
1434
0015
1000
8833
555
853
5099
455
825
6706
671
405
9S
ri L
anka
1983
217
500
1500
095
0015
250
2225
027
250
2990
031
450
3670
026
330
2557
026
920
3078
031
560
3529
0
10A
ust
ralia
2600
3757
3211
584
1724
1766
1790
1867
3010
2200
185
156
196
317
501
335
11O
man
00
00
00
00
00
00
0
12U
nit
ed A
rab
Em
i.0
00
00
00
00
00
00
13Y
emen
14M
ald
ives
00
00
00
00
00
00
0
15M
adag
asca
r27
500
2750
030
000
3000
030
000
3000
030
000
3000
030
000
3000
030
000
3000
030
000
3150
032
650
3275
0
16Ta
nza
nia
2719
7027
5150
2945
8224
7614
3170
2926
2276
3067
5030
0000
2600
2028
0000
2830
0027
3850
3018
5531
2040
3205
6629
2519
17E
gyp
t15
5953
1804
0018
6700
1993
0022
8930
2306
6024
3609
2501
8122
5300
2534
7029
5422
2926
4531
3371
2820
9924
2100
2562
88
18S
aud
i Ara
bia
00
00
00
00
00
00
0
19M
oza
mb
iuq
e38
0038
0046
8949
2550
9375
1011
668
8994
1024
313
088
5284
1215
610
948
2776
022
991
2601
7
20S
om
alia
300
250
250
250
250
250
250
250
250
200
200
200
200
21M
arit
ius
00
30
00
00
00
00
040
015
00
22C
om
oro
s0
00
00
00
00
00
00
23Ir
aq13
360
1753
017
808
2092
622
955
1904
920
519
9111
1151
397
0014
100
1190
013
200
1058
123
570
4630
0
24B
ahra
in0
00
00
00
00
00
00
25K
uw
ait
00
00
00
00
00
00
0
1S
pai
n10
707
8796
9215
6284
8869
8710
8710
8710
8710
8710
8710
8710
8710
6000
6000
6000
2Ta
iwan
591
599
2292
245
197
149
3F
ran
ce40
0043
5044
0044
5045
0045
4045
4045
0021
3421
3121
3021
3021
30
4Ja
pan
1069
5196
739
9103
292
209
9145
593
503
8561
278
822
7127
070
612
6135
461
271
5988
260
015
5395
841
702
5K
ore
a R
ep.
2260
825
483
1226
310
492
9646
8034
6934
6845
6316
7141
5971
5690
7539
1030
275
0064
47
Tota
l22
7744
422
1455
325
0912
125
8066
327
5259
728
0850
928
4757
629
1040
130
2621
432
3993
034
2043
131
8778
332
6165
031
7373
633
4118
439
5795
3
So
urc
e : F
oo
d a
nd
Ag
ricu
lture
Org
an
isa
tion
,(FA
O)
H :
PRICE
INDICES
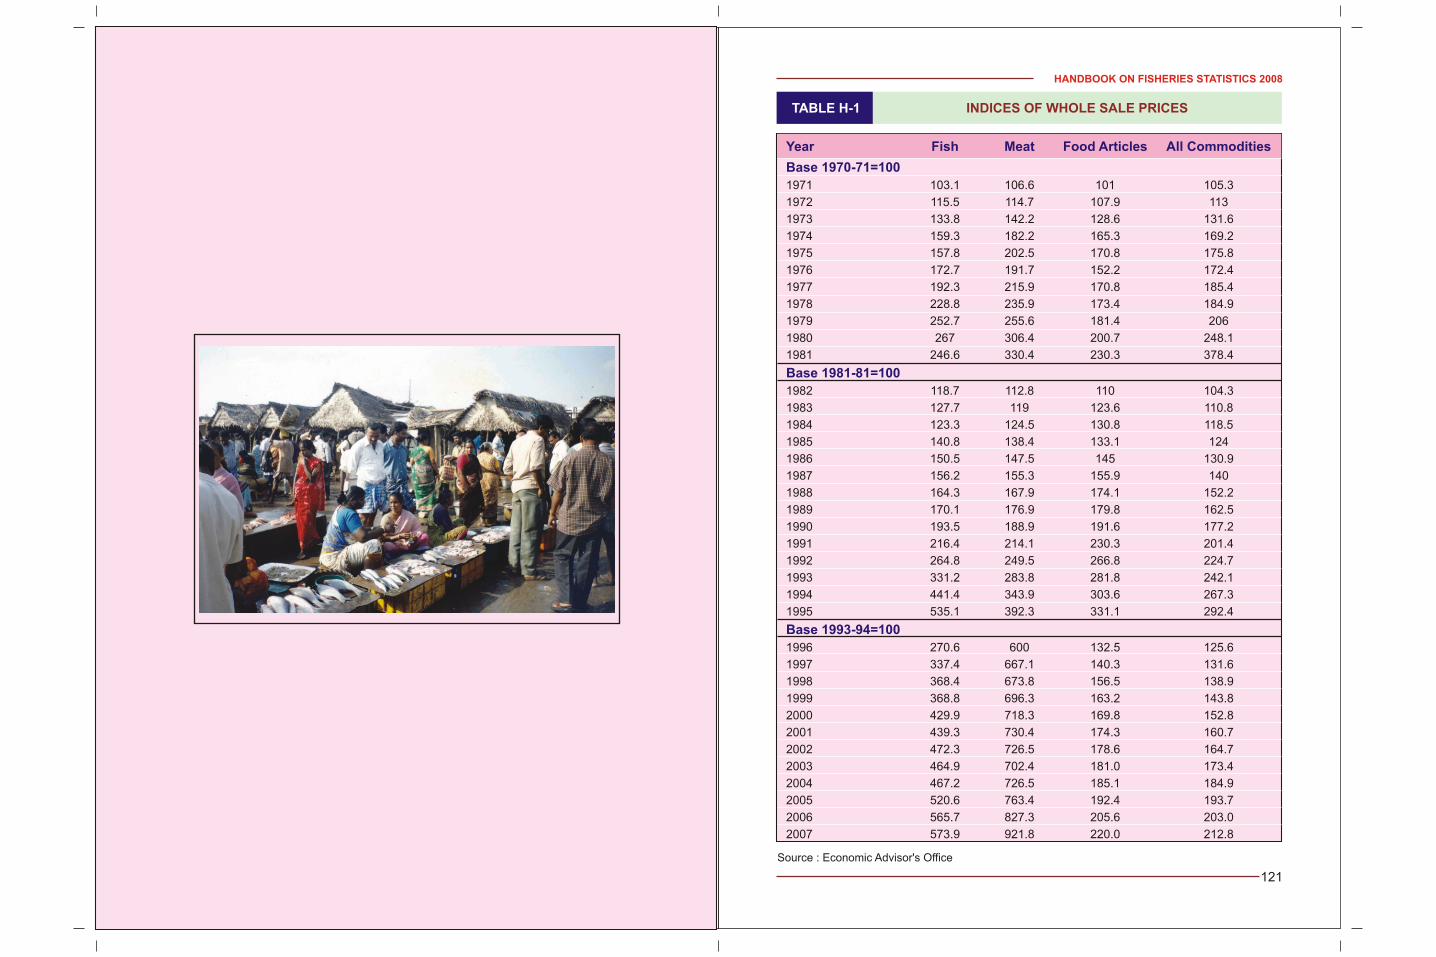
HANDBOOK ON FISHERIES STATISTICS 2008
121
TABLE H-1 INDICES OF WHOLE SALE PRICES
Source : Economic Advisor's Office
Year Fish Meat Food Articles All Commodities
Base 1970-71=100
Base 1981-81=100
Base 1993-94=100
1971 103.1 106.6 101 105.3
1972 115.5 114.7 107.9 113
1973 133.8 142.2 128.6 131.6
1974 159.3 182.2 165.3 169.2
1975 157.8 202.5 170.8 175.8
1976 172.7 191.7 152.2 172.4
1977 192.3 215.9 170.8 185.4
1978 228.8 235.9 173.4 184.9
1979 252.7 255.6 181.4 206
1980 267 306.4 200.7 248.1
1981 246.6 330.4 230.3 378.4
1982 118.7 112.8 110 104.3
1983 127.7 119 123.6 110.8
1984 123.3 124.5 130.8 118.5
1985 140.8 138.4 133.1 124
1986 150.5 147.5 145 130.9
1987 156.2 155.3 155.9 140
1988 164.3 167.9 174.1 152.2
1989 170.1 176.9 179.8 162.5
1990 193.5 188.9 191.6 177.2
1991 216.4 214.1 230.3 201.4
1992 264.8 249.5 266.8 224.7
1993 331.2 283.8 281.8 242.1
1994 441.4 343.9 303.6 267.3
1995 535.1 392.3 331.1 292.4
1996 270.6 600 132.5 125.6
1997 337.4 667.1 140.3 131.6
1998 368.4 673.8 156.5 138.9
1999 368.8 696.3 163.2 143.8
2000 429.9 718.3 169.8 152.8
2001 439.3 730.4 174.3 160.7
2002 472.3 726.5 178.6 164.7
2003 464.9 702.4 181.0 173.4
2004 467.2 726.5 185.1 184.9
2005 520.6 763.4 192.4 193.7
2006 565.7 827.3 205.6 203.0
2007 573.9 921.8 220.0 212.8
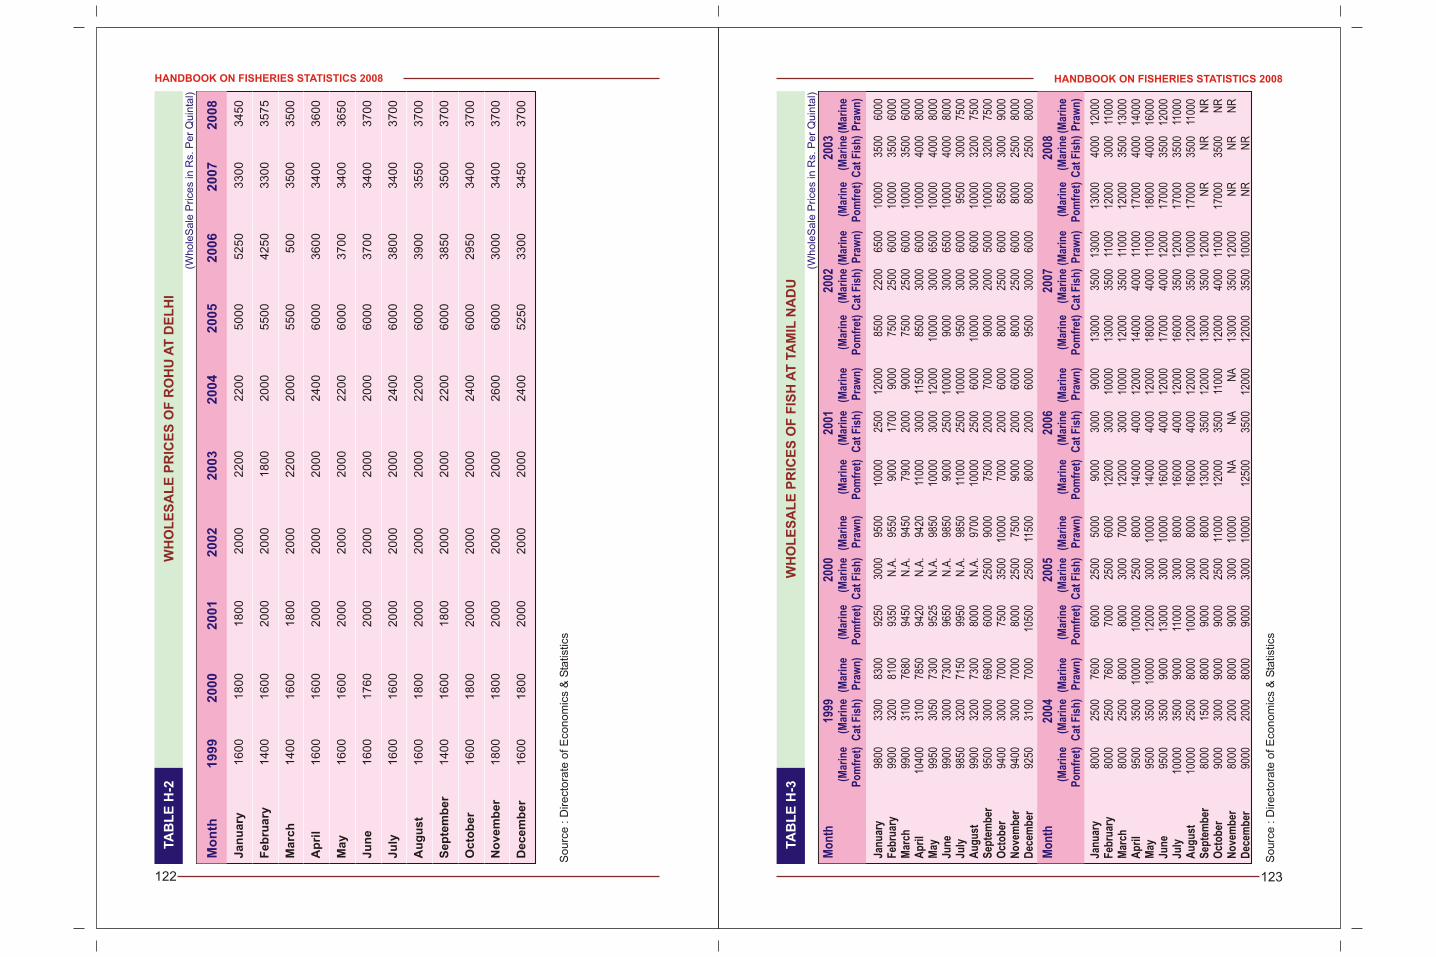
HANDBOOK ON FISHERIES STATISTICS 2008
123
TA
BL
E H
-3W
HO
LE
SA
LE
PR
ICE
S O
F F
ISH
AT
TA
MIL
NA
DU
(Wh
ole
Sa
le P
rice
s in
Rs.
Pe
r Q
uin
tal)
Mo
nth
1999
2000
2001
2002
2003
(Mar
ine
(Mar
ine
(Mar
ine
(Mar
ine
(Mar
ine
(Mar
ine
(Mar
ine
(Mar
ine
(Mar
ine
(Mar
ine
(Mar
ine
(Mar
ine
(Mar
ine
(Mar
ine
(Mar
ine
Po
mfr
et)
Cat
Fis
h)
Pra
wn
)P
om
fret
) C
at F
ish
) P
raw
n)
Po
mfr
et)
Cat
Fis
h)
Pra
wn
)P
om
fret
) C
at F
ish
) P
raw
n)
Po
mfr
et)
Cat
Fis
h)
Pra
wn
)
Mo
nth
2004
2005
2006
2007
2008
(Mar
ine
(Mar
ine
(Mar
ine
(Mar
ine
(Mar
ine
(Mar
ine
(Mar
ine
(Mar
ine
(Mar
ine
(Mar
ine
(Mar
ine
(Mar
ine
(Mar
ine
(Mar
ine
(Mar
ine
Po
mfr
et)
Cat
Fis
h)
Pra
wn
)P
om
fret
) C
at F
ish
) P
raw
n)
Po
mfr
et)
Cat
Fis
h)
Pra
wn
)P
om
fret
) C
at F
ish
) P
raw
n)
Po
mfr
et)
Cat
Fis
h)
Pra
wn
)
Jan
uar
y98
0033
0083
0092
5030
0095
0010
000
2500
1200
085
0022
0065
0010
000
3500
6000
Feb
ruar
y99
0032
0081
0093
50N
.A.
9550
9000
1700
9000
7500
2500
6000
1000
035
0060
00M
arch
9900
3100
7680
9450
N.A
.94
5079
0020
0090
0075
0025
0060
0010
000
3500
6000
Ap
ril
1040
031
0078
5094
20N
.A.
9420
1100
030
0011
500
8500
3000
6000
1000
040
0080
00M
ay99
5030
5073
0095
25N
.A.
9850
1000
030
0012
000
1000
030
0065
0010
000
4000
8000
Jun
e99
0030
0073
0096
50N
.A.
9850
9000
2500
1000
090
0030
0065
0010
000
4000
8000
July
9850
3200
7150
9950
N.A
.98
5011
000
2500
1000
095
0030
0060
0095
0030
0075
00A
ug
ust
9900
3200
7300
8000
N.A
.97
0010
000
2500
6000
1000
030
0060
0010
000
3200
7500
Sep
tem
ber
9500
3000
6900
6000
2500
9000
7500
2000
7000
9000
2000
5000
1000
032
0075
00O
cto
ber
9400
3000
7000
7500
3500
1000
070
0020
0060
0080
0025
0060
0085
0030
0090
00N
ove
mb
er94
0030
0070
0080
0025
0075
0090
0020
0060
0080
0025
0060
0080
0025
0080
00D
ecem
ber
9250
3100
7000
1050
025
0011
500
8000
2000
6000
9500
3000
6000
8000
2500
8000
Jan
uar
y80
0025
0076
0060
0025
0050
0090
0030
0090
0013
000
3500
1300
013
000
4000
1200
0F
ebru
ary
8000
2500
7600
7000
2500
6000
1200
030
0010
000
1300
035
0011
000
1200
030
0011
000
Mar
ch80
0025
0080
0080
0030
0070
0012
000
3000
1000
012
000
3500
1100
012
000
3500
1300
0A
pri
l95
0035
0010
000
1000
025
0080
0014
000
4000
1200
014
000
4000
1100
017
000
4000
1400
0M
ay95
0035
0010
000
1200
030
0010
000
1400
040
0012
000
1800
040
0011
000
1800
040
0016
000
Jun
e95
0035
0090
0013
000
3000
1000
016
000
4000
1200
017
000
4000
1200
017
000
3500
1200
0Ju
ly10
000
3500
9000
1100
030
0080
0016
000
4000
1200
016
000
3500
1200
017
000
3500
1100
0A
ug
ust
1000
025
0080
0010
000
3000
8000
1600
040
0012
000
1200
035
0010
000
1700
035
0011
000
Sep
tem
ber
8000
1500
8000
9000
2000
8000
1300
035
0012
000
1300
035
0012
000
NR
NR
NR
Oct
ob
er90
0030
0090
0090
0025
0011
000
1200
035
0011
000
1200
040
0011
000
1700
035
00N
RN
ove
mb
er80
0020
0080
0090
0030
0010
000
NA
NA
NA
1300
035
0012
000
NR
NR
NR
Dec
emb
er90
0020
0080
0090
0030
0010
000
1250
035
0012
000
1200
035
0010
000
NR
NR
So
urc
e : D
ire
cto
rate
of E
con
om
ics
& S
tatis
tics
HANDBOOK ON FISHERIES STATISTICS 2008
122
TA
BL
E H
-2W
HO
LE
SA
LE
PR
ICE
S O
F R
OH
U A
T D
EL
HI
So
urc
e : D
ire
cto
rate
of E
con
om
ics
& S
tatis
tics
(Wh
ole
Sa
le P
rice
s in
Rs.
Pe
r Q
uin
tal)
Mo
nth
19
99
20
00
20
01
20
02
20
03
20
04
20
05
20
06
20
07
20
08
Ja
nu
ary
16
00
18
00
18
00
20
00
22
00
22
00
50
00
52
50
33
00
34
50
Fe
bru
ary
14
00
16
00
20
00
20
00
18
00
20
00
55
00
42
50
33
00
35
75
Ma
rch
14
00
16
00
18
00
20
00
22
00
20
00
55
00
50
03
50
03
50
0
Ap
ril
16
00
16
00
20
00
20
00
20
00
24
00
60
00
36
00
34
00
36
00
Ma
y1
60
01
60
02
00
02
00
02
00
02
20
06
00
03
70
03
40
03
65
0
Ju
ne
16
00
17
60
20
00
20
00
20
00
20
00
60
00
37
00
34
00
37
00
Ju
ly1
60
01
60
02
00
02
00
02
00
02
40
06
00
03
80
03
40
03
70
0
Au
gu
st
16
00
18
00
20
00
20
00
20
00
22
00
60
00
39
00
35
50
37
00
Se
pte
mb
er
14
00
16
00
18
00
20
00
20
00
22
00
60
00
38
50
35
00
37
00
Oc
tob
er
16
00
18
00
20
00
20
00
20
00
24
00
60
00
29
50
34
00
37
00
No
ve
mb
er
18
00
18
00
20
00
20
00
20
00
26
00
60
00
30
00
34
00
37
00
De
ce
mb
er
16
00
18
00
20
00
20
00
20
00
24
00
52
50
33
00
34
50
37
00
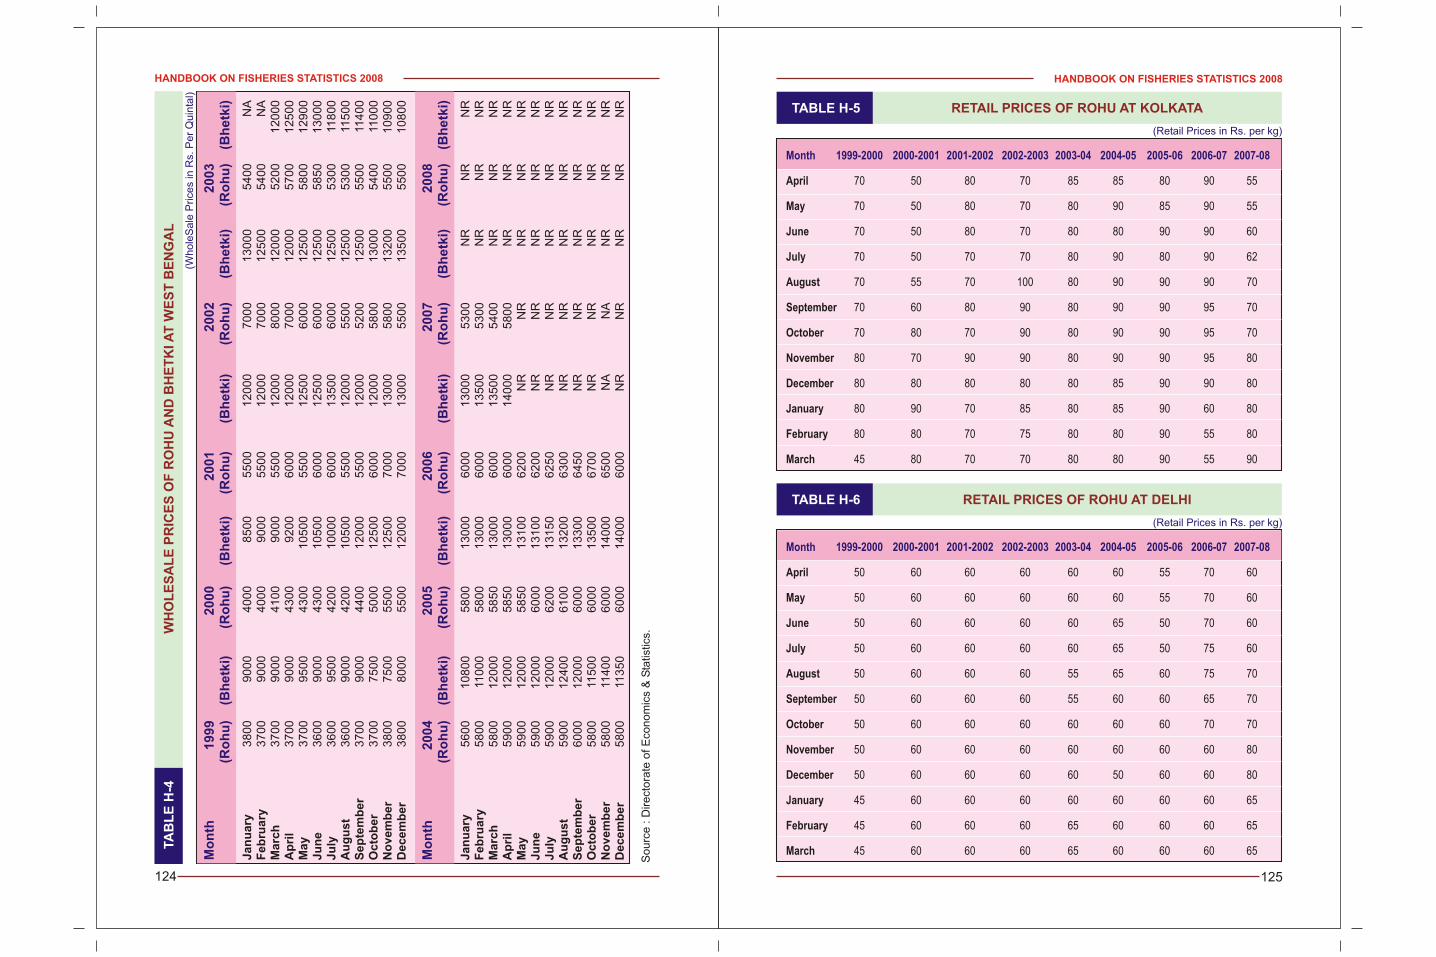
HANDBOOK ON FISHERIES STATISTICS 2008
125
HANDBOOK ON FISHERIES STATISTICS 2008
124
TA
BL
E H
-4W
HO
LE
SA
LE
PR
ICE
S O
F R
OH
U A
ND
BH
ET
KI A
T W
ES
T B
EN
GA
L
(Wh
ole
Sa
le P
rice
s in
Rs.
Pe
r Q
uin
tal)
Mo
nth
19
99
20
00
20
01
20
02
20
03
(Ro
hu
)(B
he
tki)
(Ro
hu
)(B
he
tki)
(Ro
hu
)(B
he
tki)
(Ro
hu
)(B
he
tki)
(Ro
hu
)(B
he
tki)
Mo
nth
20
04
20
05
20
06
20
07
20
08
(Ro
hu
)(B
he
tki)
(Ro
hu
)(B
he
tki)
(Ro
hu
)(B
he
tki)
(Ro
hu
)(B
he
tki)
(Ro
hu
)(B
he
tki)
Ja
nu
ary
38
00
90
00
40
00
85
00
55
00
12
00
07
00
01
30
00
54
00
NA
Fe
bru
ary
37
00
90
00
40
00
90
00
55
00
12
00
07
00
01
25
00
54
00
NA
Ma
rch
37
00
90
00
41
00
90
00
55
00
12
00
08
00
01
20
00
52
00
12
00
0A
pri
l3
70
09
00
04
30
09
20
06
00
01
20
00
70
00
12
00
05
70
01
25
00
Ma
y3
70
09
50
04
30
01
05
00
55
00
12
50
06
00
01
25
00
58
00
12
90
0J
un
e3
60
09
00
04
30
01
05
00
60
00
12
50
06
00
01
25
00
58
50
13
00
0J
uly
36
00
95
00
42
00
10
00
06
00
01
35
00
60
00
12
50
05
30
011
80
0A
ug
us
t3
60
09
00
04
20
01
05
00
55
00
12
00
05
50
01
25
00
53
00
115
00
Se
pte
mb
er
37
00
90
00
44
00
12
00
05
50
01
20
00
52
00
12
50
05
50
011
40
0O
cto
be
r3
70
07
50
05
00
01
25
00
60
00
12
00
05
80
01
30
00
54
00
110
00
No
ve
mb
er
38
00
75
00
55
00
12
50
07
00
01
30
00
58
00
13
20
05
50
01
09
00
De
ce
mb
er
38
00
80
00
55
00
12
00
07
00
01
30
00
55
00
13
50
05
50
01
08
00
Ja
nu
ary
56
00
10
80
05
80
01
30
00
60
00
13
00
05
30
0N
RN
RN
RF
eb
rua
ry5
80
011
00
05
80
01
30
00
60
00
13
50
05
30
0N
RN
RN
RM
arc
h5
80
01
20
00
58
50
13
00
06
00
01
35
00
54
00
NR
NR
NR
Ap
ril
59
00
12
00
05
85
01
30
00
60
00
14
00
05
80
0N
RN
RN
RM
ay
59
00
12
00
05
85
01
31
00
62
00
NR
NR
NR
NR
NR
Ju
ne
59
00
12
00
06
00
01
31
00
62
00
NR
NR
NR
NR
NR
Ju
ly5
90
01
20
00
62
00
13
15
06
25
0N
RN
RN
RN
RN
RA
ug
us
t5
90
01
24
00
61
00
13
20
06
30
0N
RN
RN
RN
RN
RS
ep
tem
be
r6
00
01
20
00
60
00
13
30
06
45
0N
RN
RN
RN
RN
RO
cto
be
r5
80
011
50
06
00
01
35
00
67
00
NR
NR
NR
NR
NR
No
ve
mb
er
58
00
114
00
60
00
14
00
06
50
0N
AN
AN
RN
RN
RD
ec
em
be
r5
80
011
35
06
00
01
40
00
60
00
NR
NR
NR
NR
NR
So
urc
e : D
ire
cto
rate
of E
con
om
ics
& S
tatis
tics.
Month 1999-2000 2000-2001 2001-2002 2002-2003 2003-04 2004-05 2005-06 2006-07 2007-08
April 70 50 80 70 85 85 80 90 55
May 70 50 80 70 80 90 85 90 55
June 70 50 80 70 80 80 90 90 60
July 70 50 70 70 80 90 80 90 62
August 70 55 70 100 80 90 90 90 70
September 70 60 80 90 80 90 90 95 70
October 70 80 70 90 80 90 90 95 70
November 80 70 90 90 80 90 90 95 80
December 80 80 80 80 80 85 90 90 80
January 80 90 70 85 80 85 90 60 80
February 80 80 70 75 80 80 90 55 80
March 45 80 70 70 80 80 90 55 90
TABLE H-5 RETAIL PRICES OF ROHU AT KOLKATA
(Retail Prices in Rs. per kg)
TABLE H-6 RETAIL PRICES OF ROHU AT DELHI
Month 1999-2000 2000-2001 2001-2002 2002-2003 2003-04 2004-05 2005-06 2006-07 2007-08
April 50 60 60 60 60 60 55 70 60
May 50 60 60 60 60 60 55 70 60
June 50 60 60 60 60 65 50 70 60
July 50 60 60 60 60 65 50 75 60
August 50 60 60 60 55 65 60 75 70
September 50 60 60 60 55 60 60 65 70
October 50 60 60 60 60 60 60 70 70
November 50 60 60 60 60 60 60 60 80
December 50 60 60 60 60 50 60 60 80
January 45 60 60 60 60 60 60 60 65
February 45 60 60 60 65 60 60 60 65
March 45 60 60 60 65 60 60 60 65
(Retail Prices in Rs. per kg)
HANDBOOK ON FISHERIES STATISTICS 2008
126
I :
LIST OF DISTRICTS
– STATE / UT WISE
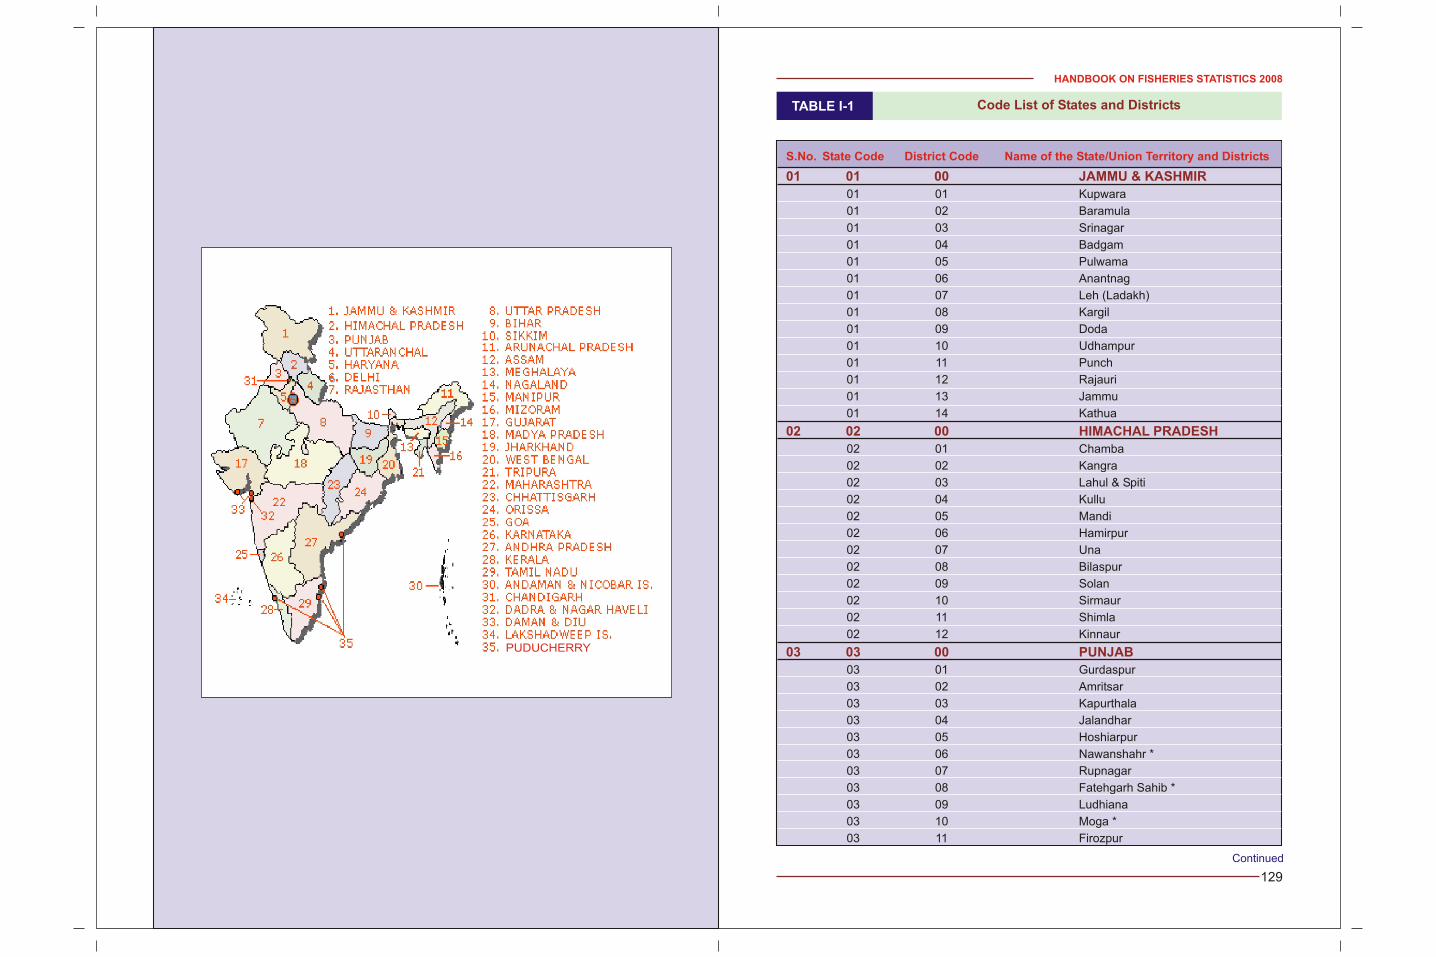
HANDBOOK ON FISHERIES STATISTICS 2008
129
Continued
S.No. State Code District Code Name of the State/Union Territory and Districts
01 01 Kupwara
01 02 Baramula
01 03 Srinagar
01 04 Badgam
01 05 Pulwama
01 06 Anantnag
01 07 Leh (Ladakh)
01 08 Kargil
01 09 Doda
01 10 Udhampur
01 11 Punch
01 12 Rajauri
01 13 Jammu
01 14 Kathua
02 01 Chamba
02 02 Kangra
02 03 Lahul & Spiti
02 04 Kullu
02 05 Mandi
02 06 Hamirpur
02 07 Una
02 08 Bilaspur
02 09 Solan
02 10 Sirmaur
02 11 Shimla
02 12 Kinnaur
03 01 Gurdaspur
03 02 Amritsar
03 03 Kapurthala
03 04 Jalandhar
03 05 Hoshiarpur
03 06 Nawanshahr *
03 07 Rupnagar
03 08 Fatehgarh Sahib *
03 09 Ludhiana
03 10 Moga *
03 11 Firozpur
01 01 00 JAMMU & KASHMIR
02 02 00 HIMACHAL PRADESH
03 03 00 PUNJAB
TABLE I-1 Code List of States and Districts
PUDUCHERRY
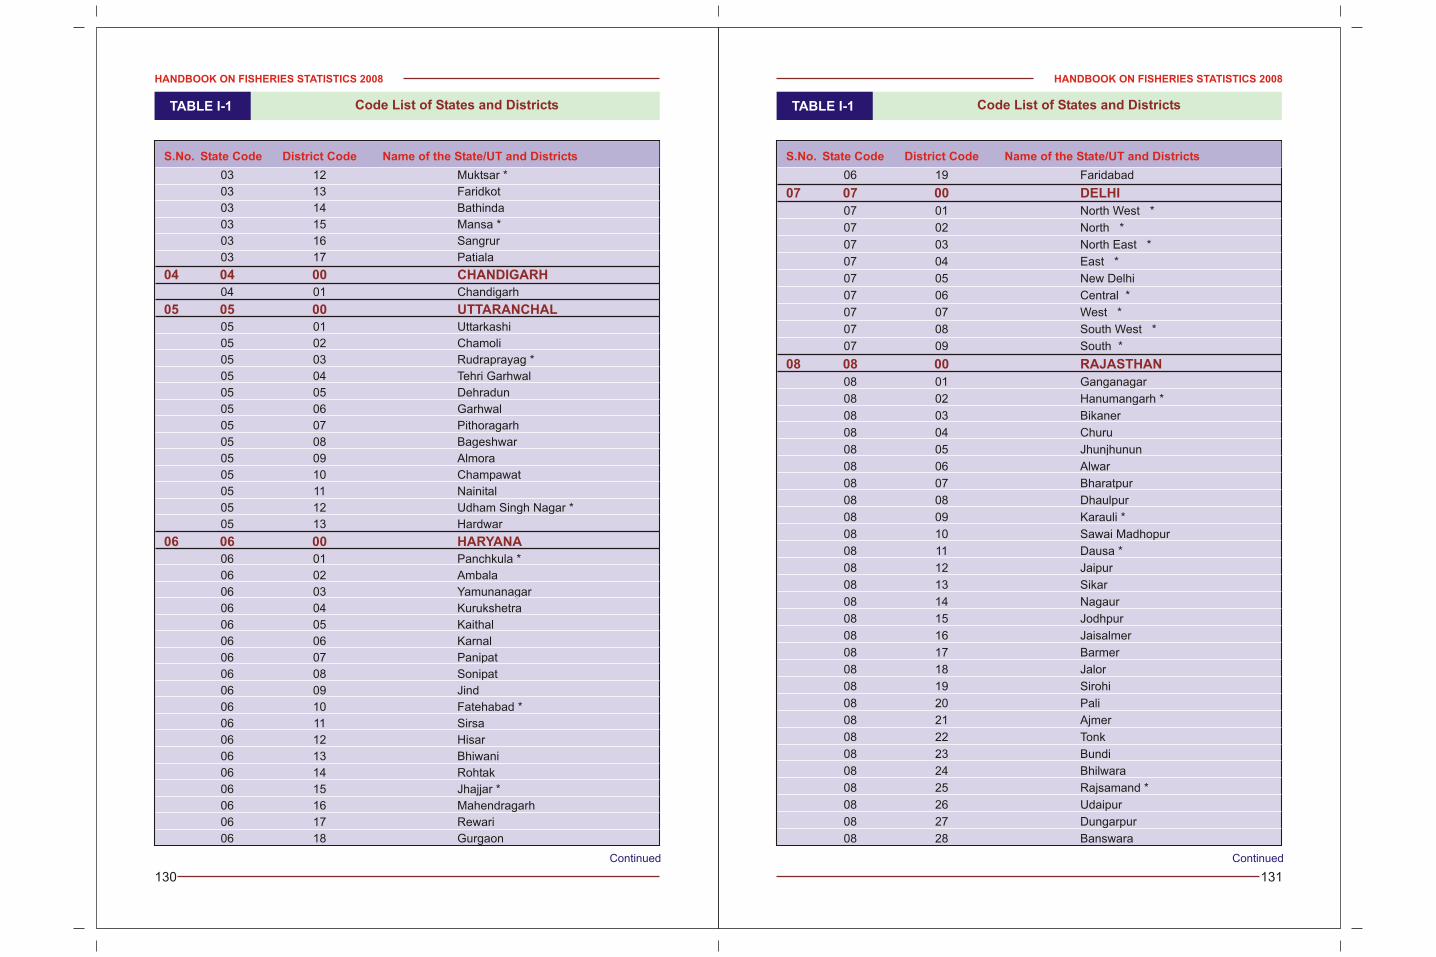
HANDBOOK ON FISHERIES STATISTICS 2008
131
Continued
S.No. State Code District Code Name of the State/UT and Districts
06 19 Faridabad
07 01 North West *
07 02 North *
07 03 North East *
07 04 East *
07 05 New Delhi
07 06 Central *
07 07 West *
07 08 South West *
07 09 South *
08 01 Ganganagar
08 02 Hanumangarh *
08 03 Bikaner
08 04 Churu
08 05 Jhunjhunun
08 06 Alwar
08 07 Bharatpur
08 08 Dhaulpur
08 09 Karauli *
08 10 Sawai Madhopur
08 11 Dausa *
08 12 Jaipur
08 13 Sikar
08 14 Nagaur
08 15 Jodhpur
08 16 Jaisalmer
08 17 Barmer
08 18 Jalor
08 19 Sirohi
08 20 Pali
08 21 Ajmer
08 22 Tonk
08 23 Bundi
08 24 Bhilwara
08 25 Rajsamand *
08 26 Udaipur
08 27 Dungarpur
08 28 Banswara
07 07 00 DELHI
08 08 00 RAJASTHAN
TABLE I-1 Code List of States and Districts
Continued
S.No. State Code District Code Name of the State/UT and Districts
03 12 Muktsar *
03 13 Faridkot
03 14 Bathinda
03 15 Mansa *
03 16 Sangrur
03 17 Patiala
04 01 Chandigarh
05 01 Uttarkashi
05 02 Chamoli
05 03 Rudraprayag *
05 04 Tehri Garhwal
05 05 Dehradun
05 06 Garhwal
05 07 Pithoragarh
05 08 Bageshwar
05 09 Almora
05 10 Champawat
05 11 Nainital
05 12 Udham Singh Nagar *
05 13 Hardwar
06 01 Panchkula *
06 02 Ambala
06 03 Yamunanagar
06 04 Kurukshetra
06 05 Kaithal
06 06 Karnal
06 07 Panipat
06 08 Sonipat
06 09 Jind
06 10 Fatehabad *
06 11 Sirsa
06 12 Hisar
06 13 Bhiwani
06 14 Rohtak
06 15 Jhajjar *
06 16 Mahendragarh
06 17 Rewari
06 18 Gurgaon
04 04 00 CHANDIGARH
05 05 00 UTTARANCHAL
06 06 00 HARYANA
TABLE I-1 Code List of States and Districts
HANDBOOK ON FISHERIES STATISTICS 2008
130
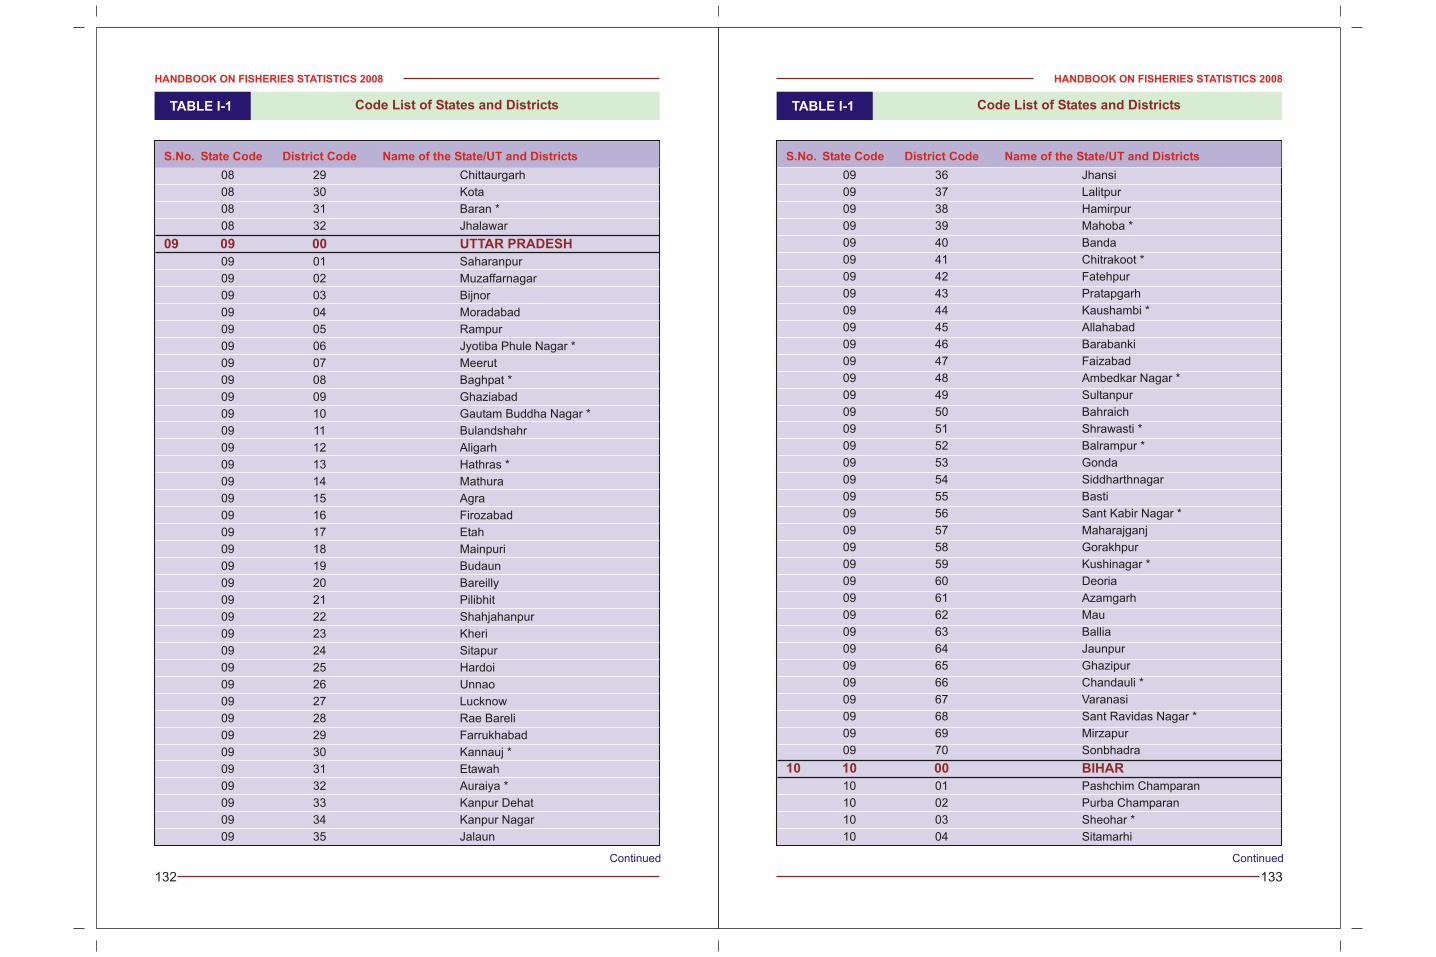
HANDBOOK ON FISHERIES STATISTICS 2008
133
Continued
S.No. State Code District Code Name of the State/UT and Districts
09 36 Jhansi
09 37 Lalitpur
09 38 Hamirpur
09 39 Mahoba *
09 40 Banda
09 41 Chitrakoot *
09 42 Fatehpur
09 43 Pratapgarh
09 44 Kaushambi *
09 45 Allahabad
09 46 Barabanki
09 47 Faizabad
09 48 Ambedkar Nagar *
09 49 Sultanpur
09 50 Bahraich
09 51 Shrawasti *
09 52 Balrampur *
09 53 Gonda
09 54 Siddharthnagar
09 55 Basti
09 56 Sant Kabir Nagar *
09 57 Maharajganj
09 58 Gorakhpur
09 59 Kushinagar *
09 60 Deoria
09 61 Azamgarh
09 62 Mau
09 63 Ballia
09 64 Jaunpur
09 65 Ghazipur
09 66 Chandauli *
09 67 Varanasi
09 68 Sant Ravidas Nagar *
09 69 Mirzapur
09 70 Sonbhadra
10 01 Pashchim Champaran
10 02 Purba Champaran
10 03 Sheohar *
10 04 Sitamarhi
10 10 00 BIHAR
TABLE I-1 Code List of States and Districts
Continued
S.No. State Code District Code Name of the State/UT and Districts
08 29 Chittaurgarh
08 30 Kota
08 31 Baran *
08 32 Jhalawar
09 01 Saharanpur
09 02 Muzaffarnagar
09 03 Bijnor
09 04 Moradabad
09 05 Rampur
09 06 Jyotiba Phule Nagar *
09 07 Meerut
09 08 Baghpat *
09 09 Ghaziabad
09 10 Gautam Buddha Nagar *
09 11 Bulandshahr
09 12 Aligarh
09 13 Hathras *
09 14 Mathura
09 15 Agra
09 16 Firozabad
09 17 Etah
09 18 Mainpuri
09 19 Budaun
09 20 Bareilly
09 21 Pilibhit
09 22 Shahjahanpur
09 23 Kheri
09 24 Sitapur
09 25 Hardoi
09 26 Unnao
09 27 Lucknow
09 28 Rae Bareli
09 29 Farrukhabad
09 30 Kannauj *
09 31 Etawah
09 32 Auraiya *
09 33 Kanpur Dehat
09 34 Kanpur Nagar
09 35 Jalaun
09 09 00 UTTAR PRADESH
TABLE I-1 Code List of States and Districts
HANDBOOK ON FISHERIES STATISTICS 2008
132
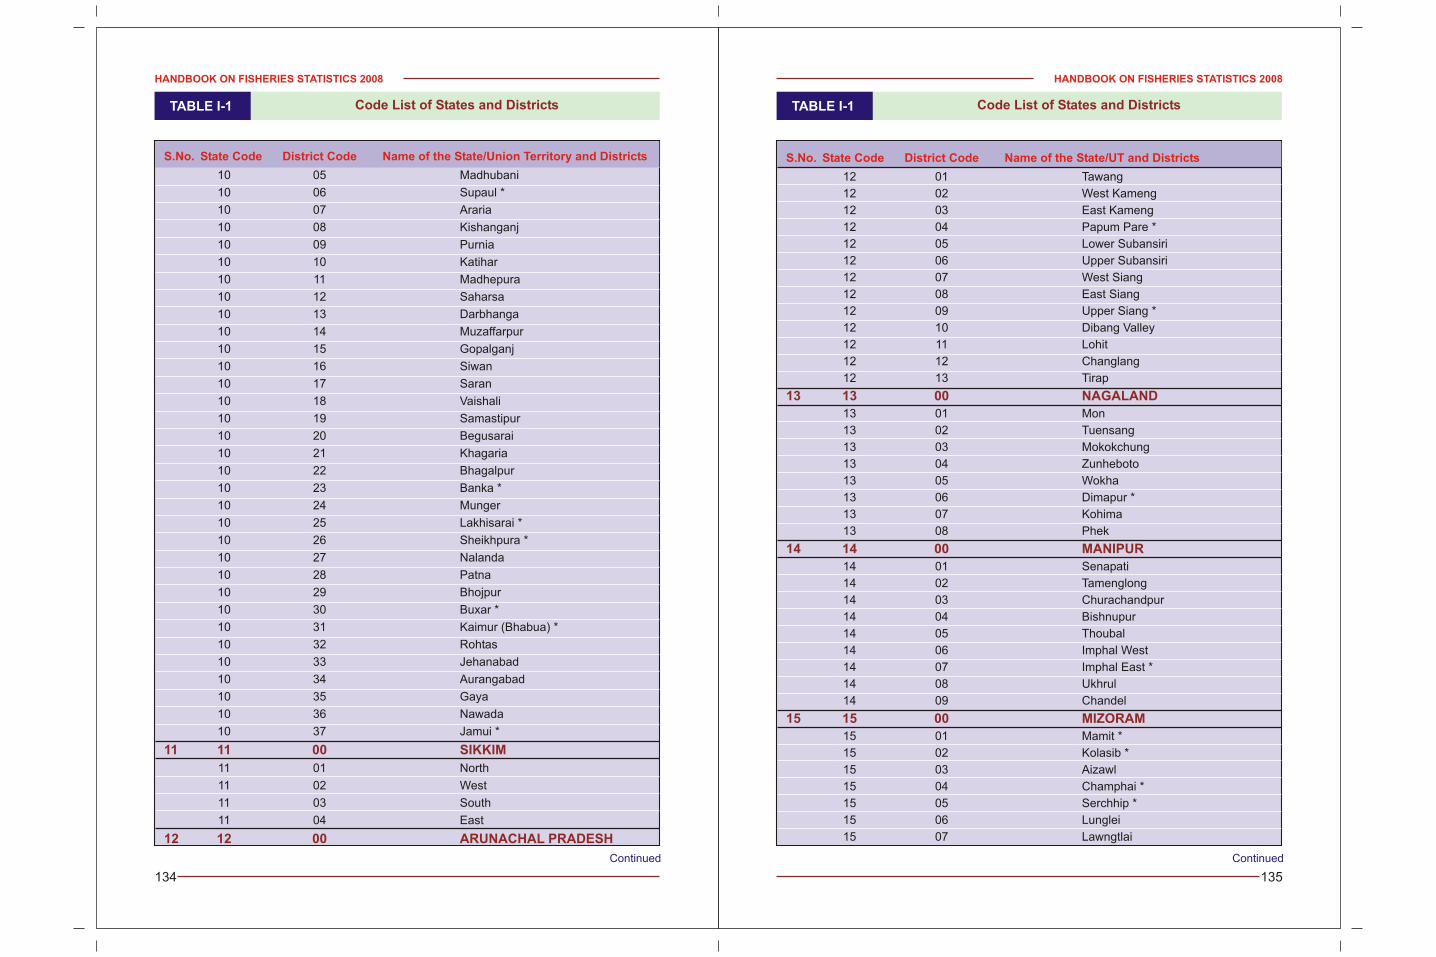
HANDBOOK ON FISHERIES STATISTICS 2008
135
Continued
S.No. State Code District Code Name of the State/UT and Districts
12 01 Tawang
12 02 West Kameng
12 03 East Kameng
12 04 Papum Pare *
12 05 Lower Subansiri
12 06 Upper Subansiri
12 07 West Siang
12 08 East Siang
12 09 Upper Siang *
12 10 Dibang Valley
12 11 Lohit
12 12 Changlang
12 13 Tirap
13 01 Mon
13 02 Tuensang
13 03 Mokokchung
13 04 Zunheboto
13 05 Wokha
13 06 Dimapur *
13 07 Kohima
13 08 Phek
14 01 Senapati
14 02 Tamenglong
14 03 Churachandpur
14 04 Bishnupur
14 05 Thoubal
14 06 Imphal West
14 07 Imphal East *
14 08 Ukhrul
14 09 Chandel
15 01 Mamit *
15 02 Kolasib *
15 03 Aizawl
15 04 Champhai *
15 05 Serchhip *
15 06 Lunglei
15 07 Lawngtlai
13 13 00 NAGALAND
14 14 00 MANIPUR
15 15 00 MIZORAM
TABLE I-1 Code List of States and Districts
Continued
S.No. State Code District Code Name of the State/Union Territory and Districts
10 05 Madhubani
10 06 Supaul *
10 07 Araria
10 08 Kishanganj
10 09 Purnia
10 10 Katihar
10 11 Madhepura
10 12 Saharsa
10 13 Darbhanga
10 14 Muzaffarpur
10 15 Gopalganj
10 16 Siwan
10 17 Saran
10 18 Vaishali
10 19 Samastipur
10 20 Begusarai
10 21 Khagaria
10 22 Bhagalpur
10 23 Banka *
10 24 Munger
10 25 Lakhisarai *
10 26 Sheikhpura *
10 27 Nalanda
10 28 Patna
10 29 Bhojpur
10 30 Buxar *
10 31 Kaimur (Bhabua) *
10 32 Rohtas
10 33 Jehanabad
10 34 Aurangabad
10 35 Gaya
10 36 Nawada
10 37 Jamui *
11 01 North
11 02 West
11 03 South
11 04 East
11 11 00 SIKKIM
12 12 00 ARUNACHAL PRADESH
TABLE I-1 Code List of States and Districts
HANDBOOK ON FISHERIES STATISTICS 2008
134
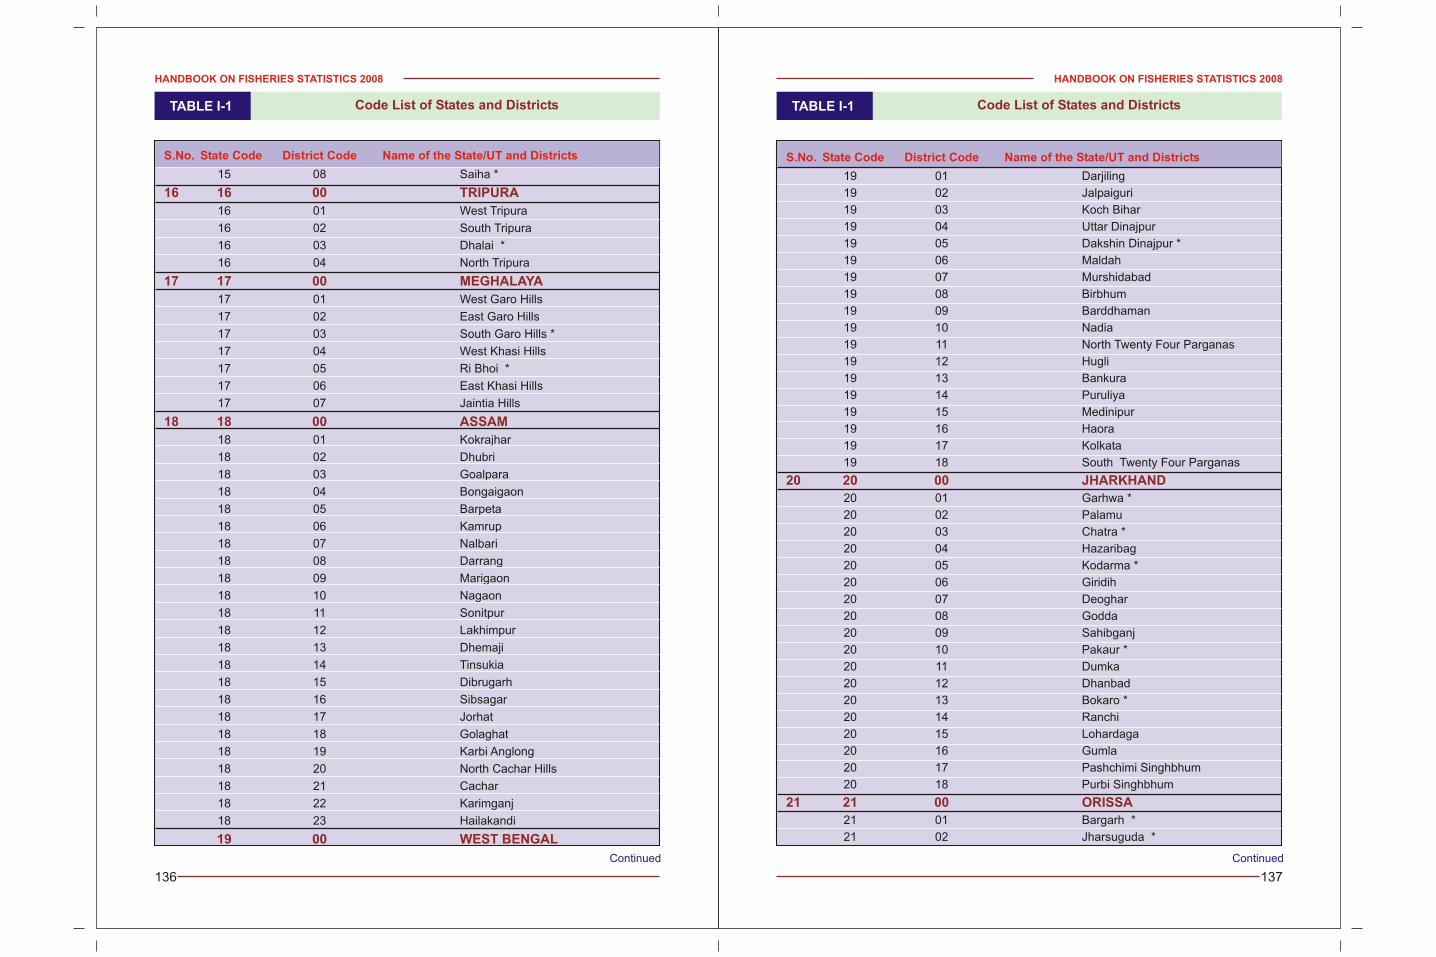
HANDBOOK ON FISHERIES STATISTICS 2008
137
Continued
S.No. State Code District Code Name of the State/UT and Districts
19 01 Darjiling
19 02 Jalpaiguri
19 03 Koch Bihar
19 04 Uttar Dinajpur
19 05 Dakshin Dinajpur *
19 06 Maldah
19 07 Murshidabad
19 08 Birbhum
19 09 Barddhaman
19 10 Nadia
19 11 North Twenty Four Parganas
19 12 Hugli
19 13 Bankura
19 14 Puruliya
19 15 Medinipur
19 16 Haora
19 17 Kolkata
19 18 South Twenty Four Parganas
20 01 Garhwa *
20 02 Palamu
20 03 Chatra *
20 04 Hazaribag
20 05 Kodarma *
20 06 Giridih
20 07 Deoghar
20 08 Godda
20 09 Sahibganj
20 10 Pakaur *
20 11 Dumka
20 12 Dhanbad
20 13 Bokaro *
20 14 Ranchi
20 15 Lohardaga
20 16 Gumla
20 17 Pashchimi Singhbhum
20 18 Purbi Singhbhum
21 01 Bargarh *
21 02 Jharsuguda *
20 20 00 JHARKHAND
21 21 00 ORISSA
TABLE I-1 Code List of States and Districts
Continued
S.No. State Code District Code Name of the State/UT and Districts
15 08 Saiha *
16 01 West Tripura
16 02 South Tripura
16 03 Dhalai *
16 04 North Tripura
17 01 West Garo Hills
17 02 East Garo Hills
17 03 South Garo Hills *
17 04 West Khasi Hills
17 05 Ri Bhoi *
17 06 East Khasi Hills
17 07 Jaintia Hills
18 01 Kokrajhar
18 02 Dhubri
18 03 Goalpara
18 04 Bongaigaon
18 05 Barpeta
18 06 Kamrup
18 07 Nalbari
18 08 Darrang
18 09 Marigaon
18 10 Nagaon
18 11 Sonitpur
18 12 Lakhimpur
18 13 Dhemaji
18 14 Tinsukia
18 15 Dibrugarh
18 16 Sibsagar
18 17 Jorhat
18 18 Golaghat
18 19 Karbi Anglong
18 20 North Cachar Hills
18 21 Cachar
18 22 Karimganj
18 23 Hailakandi
16 16 00 TRIPURA
17 17 00 MEGHALAYA
18 18 00 ASSAM
19 00 WEST BENGAL
TABLE I-1 Code List of States and Districts
HANDBOOK ON FISHERIES STATISTICS 2008
136
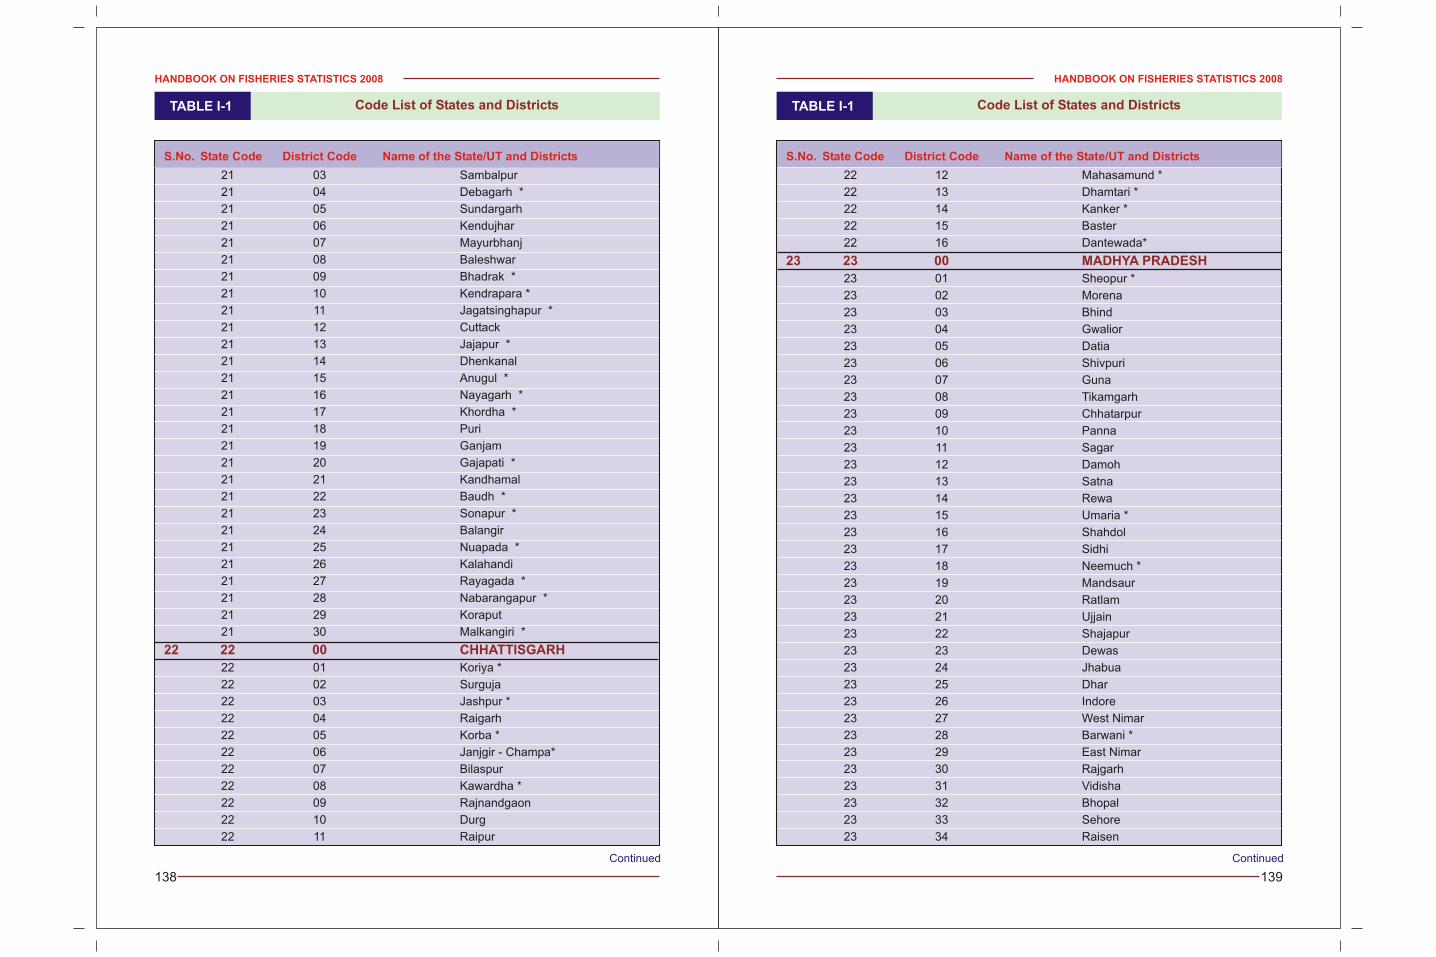
HANDBOOK ON FISHERIES STATISTICS 2008
139
S.No. State Code District Code Name of the State/UT and Districts
22 12 Mahasamund *
22 13 Dhamtari *
22 14 Kanker *
22 15 Baster
22 16 Dantewada*
23 01 Sheopur *
23 02 Morena
23 03 Bhind
23 04 Gwalior
23 05 Datia
23 06 Shivpuri
23 07 Guna
23 08 Tikamgarh
23 09 Chhatarpur
23 10 Panna
23 11 Sagar
23 12 Damoh
23 13 Satna
23 14 Rewa
23 15 Umaria *
23 16 Shahdol
23 17 Sidhi
23 18 Neemuch *
23 19 Mandsaur
23 20 Ratlam
23 21 Ujjain
23 22 Shajapur
23 23 Dewas
23 24 Jhabua
23 25 Dhar
23 26 Indore
23 27 West Nimar
23 28 Barwani *
23 29 East Nimar
23 30 Rajgarh
23 31 Vidisha
23 32 Bhopal
23 33 Sehore
23 34 Raisen
23 23 00 MADHYA PRADESH
TABLE I-1 Code List of States and Districts
ContinuedContinued
S.No. State Code District Code Name of the State/UT and Districts
21 03 Sambalpur
21 04 Debagarh *
21 05 Sundargarh
21 06 Kendujhar
21 07 Mayurbhanj
21 08 Baleshwar
21 09 Bhadrak *
21 10 Kendrapara *
21 11 Jagatsinghapur *
21 12 Cuttack
21 13 Jajapur *
21 14 Dhenkanal
21 15 Anugul *
21 16 Nayagarh *
21 17 Khordha *
21 18 Puri
21 19 Ganjam
21 20 Gajapati *
21 21 Kandhamal
21 22 Baudh *
21 23 Sonapur *
21 24 Balangir
21 25 Nuapada *
21 26 Kalahandi
21 27 Rayagada *
21 28 Nabarangapur *
21 29 Koraput
21 30 Malkangiri *
22 01 Koriya *
22 02 Surguja
22 03 Jashpur *
22 04 Raigarh
22 05 Korba *
22 06 Janjgir - Champa*
22 07 Bilaspur
22 08 Kawardha *
22 09 Rajnandgaon
22 10 Durg
22 11 Raipur
22 22 00 CHHATTISGARH
TABLE I-1 Code List of States and Districts
HANDBOOK ON FISHERIES STATISTICS 2008
138
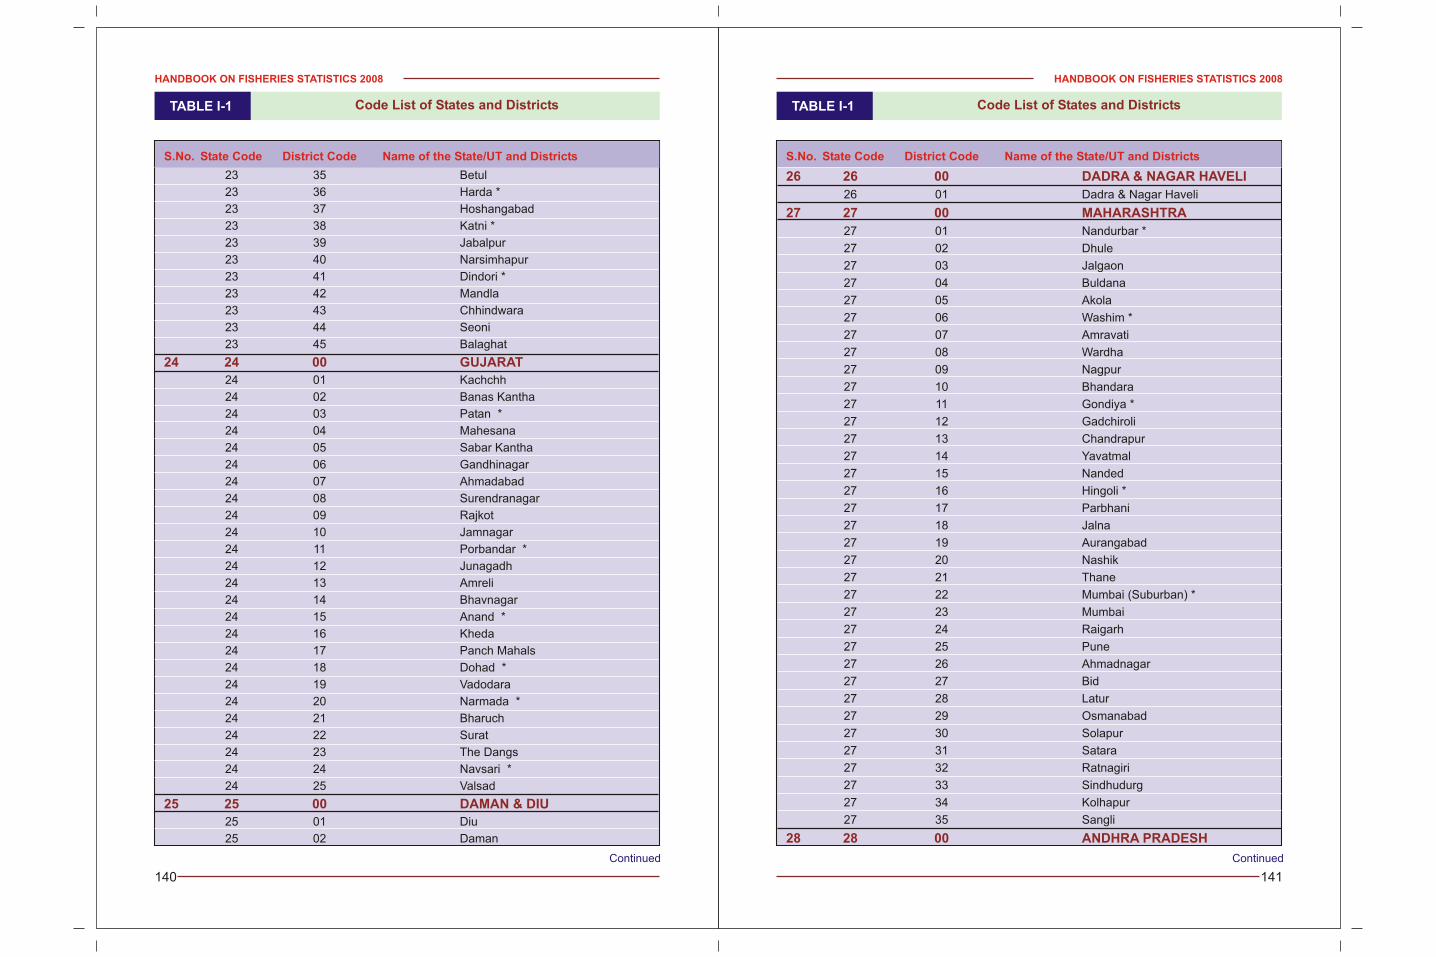
HANDBOOK ON FISHERIES STATISTICS 2008
141
S.No. State Code District Code Name of the State/UT and Districts
26 01 Dadra & Nagar Haveli
27 01 Nandurbar *
27 02 Dhule
27 03 Jalgaon
27 04 Buldana
27 05 Akola
27 06 Washim *
27 07 Amravati
27 08 Wardha
27 09 Nagpur
27 10 Bhandara
27 11 Gondiya *
27 12 Gadchiroli
27 13 Chandrapur
27 14 Yavatmal
27 15 Nanded
27 16 Hingoli *
27 17 Parbhani
27 18 Jalna
27 19 Aurangabad
27 20 Nashik
27 21 Thane
27 22 Mumbai (Suburban) *
27 23 Mumbai
27 24 Raigarh
27 25 Pune
27 26 Ahmadnagar
27 27 Bid
27 28 Latur
27 29 Osmanabad
27 30 Solapur
27 31 Satara
27 32 Ratnagiri
27 33 Sindhudurg
27 34 Kolhapur
27 35 Sangli
26 26 00 DADRA & NAGAR HAVELI
27 27 00 MAHARASHTRA
28 28 00 ANDHRA PRADESH
TABLE I-1 Code List of States and Districts
ContinuedContinued
S.No. State Code District Code Name of the State/UT and Districts
23 35 Betul
23 36 Harda *
23 37 Hoshangabad
23 38 Katni *
23 39 Jabalpur
23 40 Narsimhapur
23 41 Dindori *
23 42 Mandla
23 43 Chhindwara
23 44 Seoni
23 45 Balaghat
24 01 Kachchh
24 02 Banas Kantha
24 03 Patan *
24 04 Mahesana
24 05 Sabar Kantha
24 06 Gandhinagar
24 07 Ahmadabad
24 08 Surendranagar
24 09 Rajkot
24 10 Jamnagar
24 11 Porbandar *
24 12 Junagadh
24 13 Amreli
24 14 Bhavnagar
24 15 Anand *
24 16 Kheda
24 17 Panch Mahals
24 18 Dohad *
24 19 Vadodara
24 20 Narmada *
24 21 Bharuch
24 22 Surat
24 23 The Dangs
24 24 Navsari *
24 25 Valsad
25 01 Diu
25 02 Daman
24 24 00 GUJARAT
25 25 00 DAMAN & DIU
TABLE I-1 Code List of States and Districts
HANDBOOK ON FISHERIES STATISTICS 2008
140
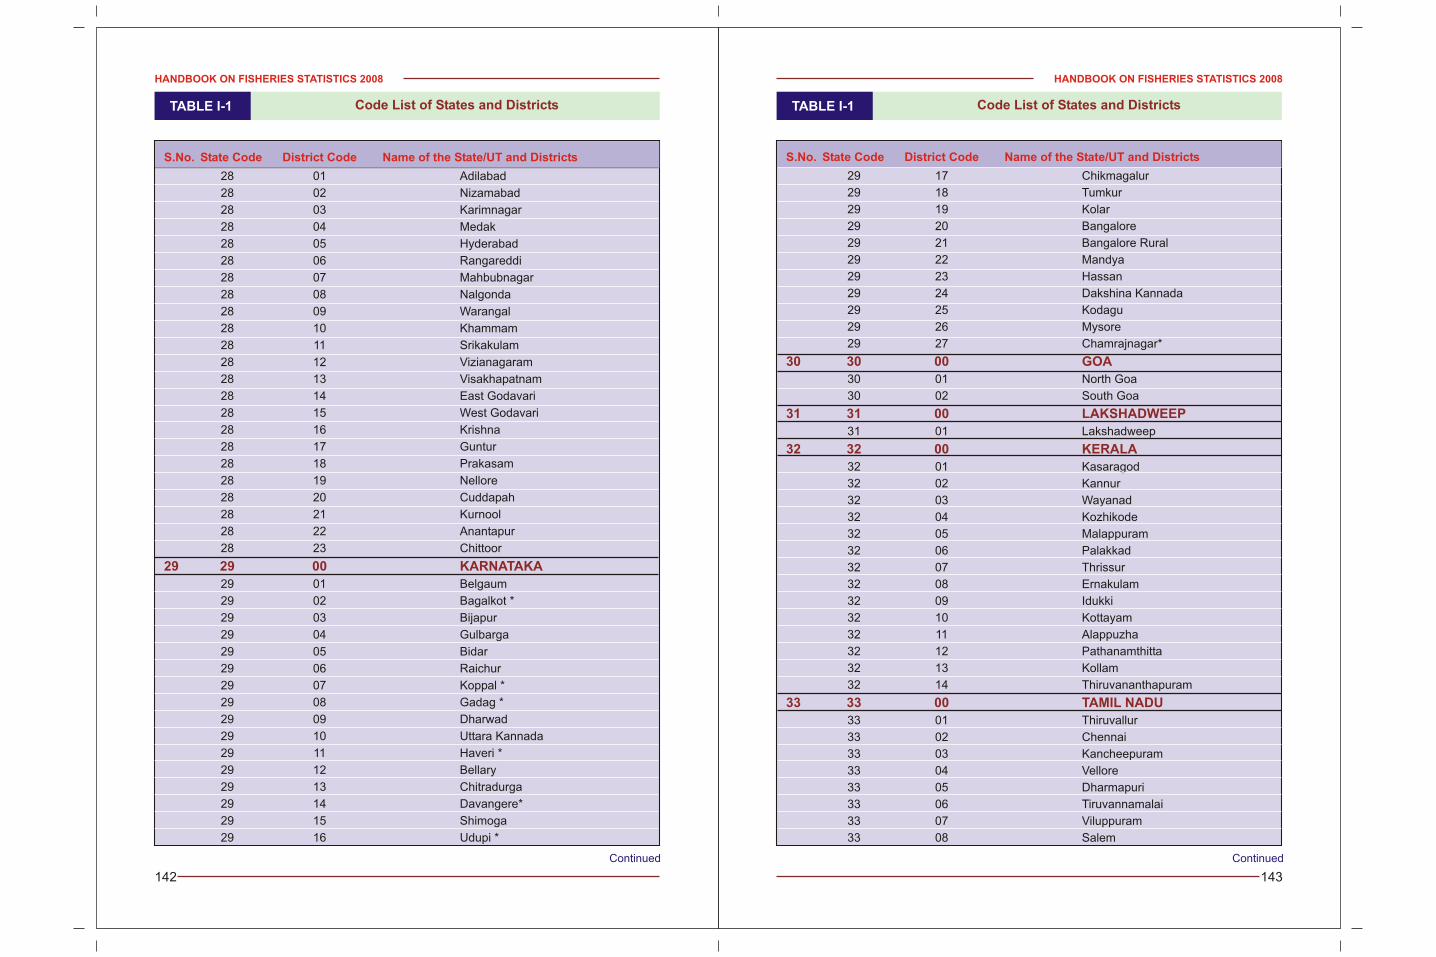
HANDBOOK ON FISHERIES STATISTICS 2008
143
S.No. State Code District Code Name of the State/UT and Districts
29 17 Chikmagalur
29 18 Tumkur
29 19 Kolar
29 20 Bangalore
29 21 Bangalore Rural
29 22 Mandya
29 23 Hassan
29 24 Dakshina Kannada
29 25 Kodagu
29 26 Mysore
29 27 Chamrajnagar*
30 01 North Goa
30 02 South Goa
31 01 Lakshadweep
32 01 Kasaragod
32 02 Kannur
32 03 Wayanad
32 04 Kozhikode
32 05 Malappuram
32 06 Palakkad
32 07 Thrissur
32 08 Ernakulam
32 09 Idukki
32 10 Kottayam
32 11 Alappuzha
32 12 Pathanamthitta
32 13 Kollam
32 14 Thiruvananthapuram
33 01 Thiruvallur
33 02 Chennai
33 03 Kancheepuram
33 04 Vellore
33 05 Dharmapuri
33 06 Tiruvannamalai
33 07 Viluppuram
33 08 Salem
30 30 00 GOA
31 31 00 LAKSHADWEEP
32 32 00 KERALA
33 33 00 TAMIL NADU
TABLE I-1 Code List of States and Districts
ContinuedContinued
S.No. State Code District Code Name of the State/UT and Districts
28 01 Adilabad
28 02 Nizamabad
28 03 Karimnagar
28 04 Medak
28 05 Hyderabad
28 06 Rangareddi
28 07 Mahbubnagar
28 08 Nalgonda
28 09 Warangal
28 10 Khammam
28 11 Srikakulam
28 12 Vizianagaram
28 13 Visakhapatnam
28 14 East Godavari
28 15 West Godavari
28 16 Krishna
28 17 Guntur
28 18 Prakasam
28 19 Nellore
28 20 Cuddapah
28 21 Kurnool
28 22 Anantapur
28 23 Chittoor
29 01 Belgaum
29 02 Bagalkot *
29 03 Bijapur
29 04 Gulbarga
29 05 Bidar
29 06 Raichur
29 07 Koppal *
29 08 Gadag *
29 09 Dharwad
29 10 Uttara Kannada
29 11 Haveri *
29 12 Bellary
29 13 Chitradurga
29 14 Davangere*
29 15 Shimoga
29 16 Udupi *
29 29 00 KARNATAKA
TABLE I-1 Code List of States and Districts
HANDBOOK ON FISHERIES STATISTICS 2008
142
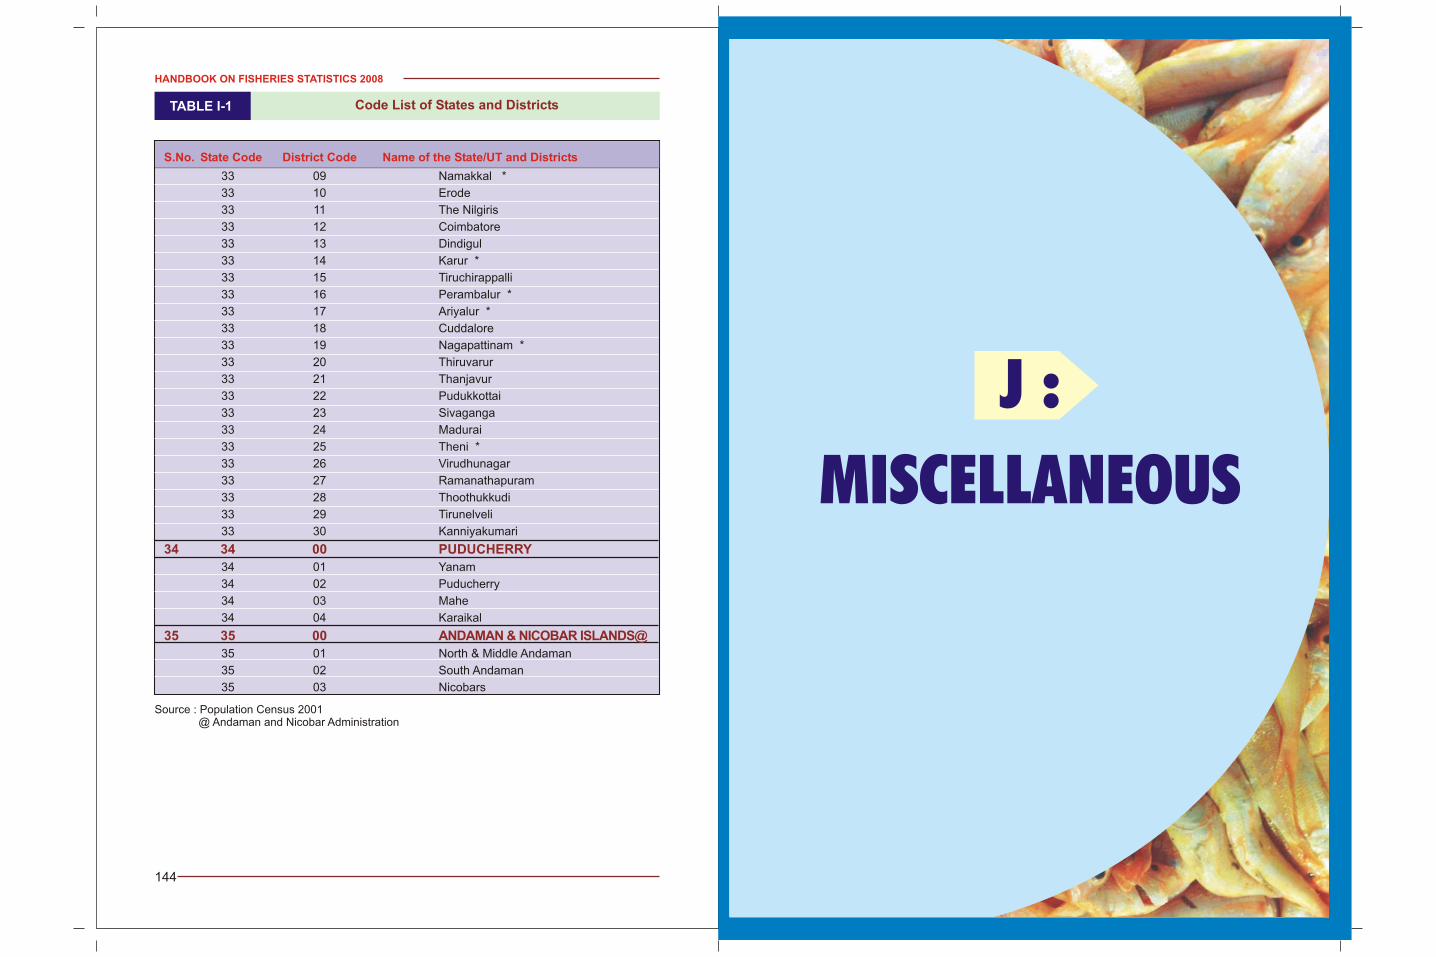
S.No. State Code District Code Name of the State/UT and Districts
33 09 Namakkal *
33 10 Erode
33 11 The Nilgiris
33 12 Coimbatore
33 13 Dindigul
33 14 Karur *
33 15 Tiruchirappalli
33 16 Perambalur *
33 17 Ariyalur *
33 18 Cuddalore
33 19 Nagapattinam *
33 20 Thiruvarur
33 21 Thanjavur
33 22 Pudukkottai
33 23 Sivaganga
33 24 Madurai
33 25 Theni *
33 26 Virudhunagar
33 27 Ramanathapuram
33 28 Thoothukkudi
33 29 Tirunelveli
33 30 Kanniyakumari
34 01 Yanam
34 02 Puducherry
34 03 Mahe
34 04 Karaikal
35 01 North & Middle Andaman
35 02 South Andaman
35 03 Nicobars
34 34 00 PUDUCHERRY
35 35 00 ANDAMAN & NICOBAR ISLANDS@
TABLE I-1 Code List of States and Districts
HANDBOOK ON FISHERIES STATISTICS 2008
144
Source : Population Census 2001 @ Andaman and Nicobar Administration
J :
MISCELLANEOUS
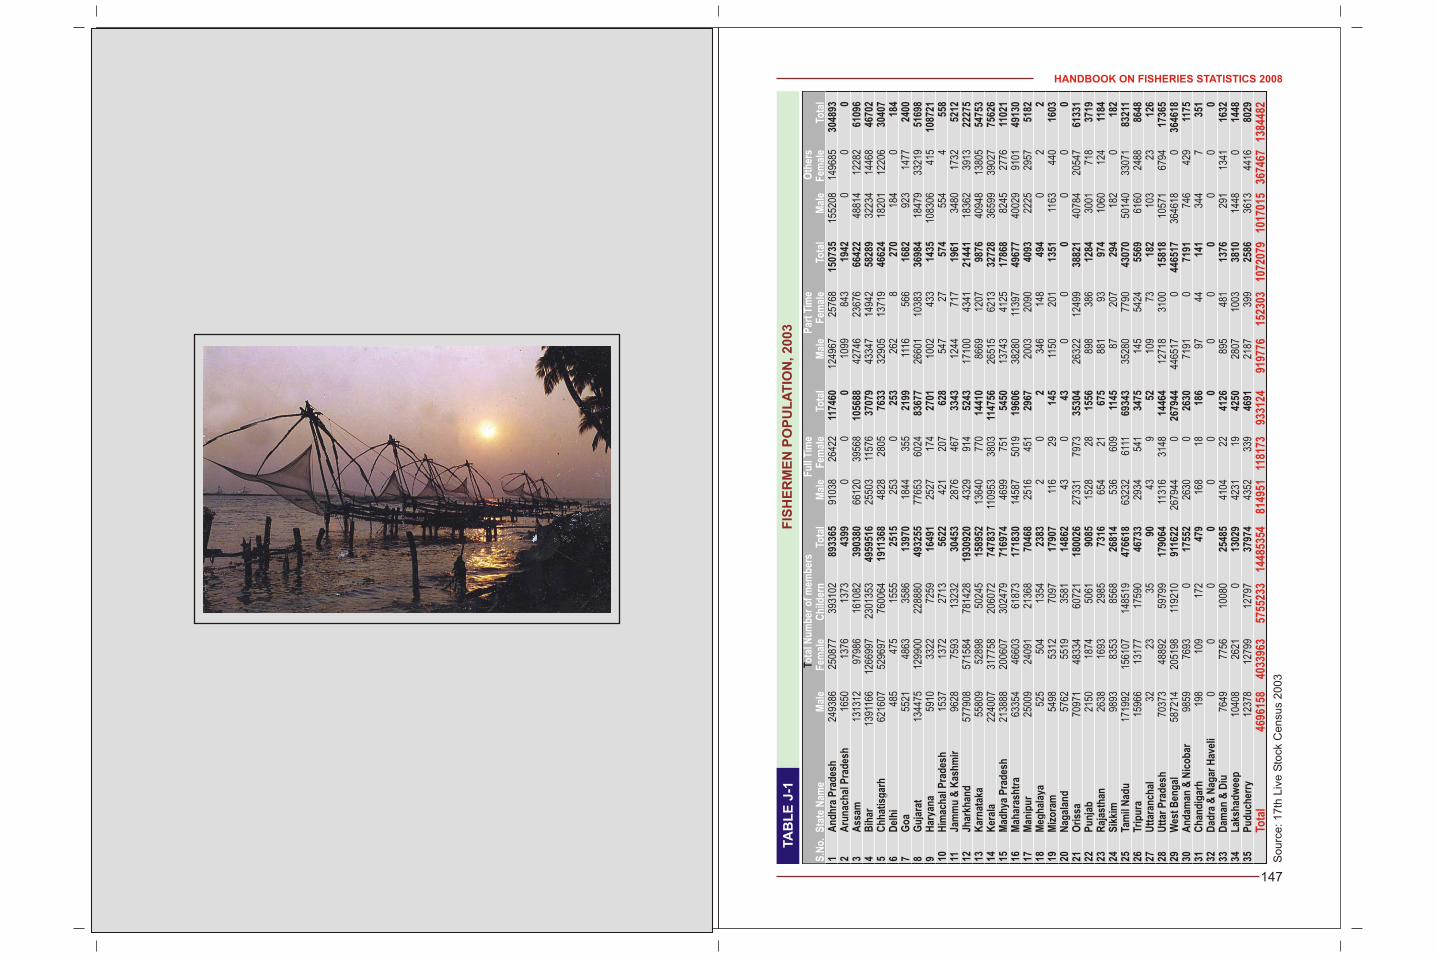
HANDBOOK ON FISHERIES STATISTICS 2008
147
TA
BL
E J
-1 F
ISH
ER
ME
N P
OP
UL
AT
ION
, 2
00
3
So
urc
e: 1
7th
Liv
e S
tock
Ce
nsu
s 2
00
3
T
1
An
dh
ra P
rad
esh
2493
8625
0877
3931
0289
3365
9103
826
422
1174
6012
4967
2576
815
0735
1552
0814
9685
3048
932
Aru
nac
hal
Pra
des
h16
5013
7613
7343
990
00
1099
843
1942
00
03
Ass
am13
1312
9798
616
1082
3903
8066
120
3956
810
5688
4274
623
676
6642
248
814
1228
261
096
4B
ihar
1391
166
1266
997
2301
353
4959
516
2550
311
576
3707
943
347
1494
258
289
3223
414
468
4670
25
Ch
hat
isg
arh
6216
0752
9697
7600
6419
1136
848
2828
0576
3332
905
1371
946
624
1820
112
206
3040
76
Del
hi
485
475
1555
2515
253
025
326
28
270
184
018
47
Go
a55
2148
6335
8613
970
1844
355
2199
1116
566
1682
923
1477
2400
8G
uja
rat
1344
7512
9900
2288
8049
3255
7765
360
2483
677
2660
110
383
3698
418
479
3321
951
698
9H
arya
na
5910
3322
7259
1649
125
2717
427
0110
0243
314
3510
8306
415
1087
2110
Him
ach
al P
rad
esh
1537
1372
2713
5622
421
207
628
547
2757
455
44
558
11Ja
mm
u &
Kas
hm
ir96
2875
9313
232
3045
328
7646
733
4312
4471
719
6134
8017
3252
1212
Jhar
khan
d57
7908
5715
8478
1428
1930
920
4329
914
5243
1710
043
4121
441
1836
239
1322
275
13K
arn
atak
a55
809
5289
850
245
1589
5213
640
770
1441
086
6912
0798
7640
948
1380
554
753
14K
eral
a22
4007
3177
5820
6072
7478
3711
0953
3803
1147
5626
515
6213
3272
836
599
3902
775
626
15M
adh
ya P
rad
esh
2138
8820
0607
3024
7971
6974
4699
751
5450
1374
341
2517
868
8245
2776
1102
116
Mah
aras
htr
a63
354
4660
361
873
1718
3014
587
5019
1960
638
280
1139
749
677
4002
991
0149
130
17M
anip
ur
2500
924
091
2136
870
468
2516
451
2967
2003
2090
4093
2225
2957
5182
18M
egh
alay
a52
550
413
5423
832
02
346
148
494
02
219
Miz
ora
m54
9853
1270
9717
907
116
2914
511
5020
113
5111
6344
016
0320
Nag
alan
d57
6255
1935
8114
862
430
430
00
00
021
Ori
ssa
7097
148
334
6072
118
0026
2733
179
7335
304
2632
212
499
3882
140
784
2054
761
331
22P
un
jab
2150
1874
5061
9085
1528
2815
5689
838
612
8430
0171
837
1923
Raj
asth
an26
3816
9329
8573
1665
421
675
881
9397
410
6012
411
8424
Sik
kim
9893
8353
8568
2681
453
660
911
4587
207
294
182
018
225
Tam
il N
adu
1719
9215
6107
1485
1947
6618
6323
261
1169
343
3528
077
9043
070
5014
033
071
8321
126
Trip
ura
1596
613
177
1759
046
733
2934
541
3475
145
5424
5569
6160
2488
8648
27U
ttar
anch
al32
2335
9043
952
109
7318
210
323
126
28U
ttar
Pra
des
h70
373
4889
259
799
1790
6411
316
3148
1446
412
718
3100
1581
810
571
6794
1736
529
Wes
t B
eng
al58
7214
2051
9811
9210
9116
2226
7944
026
7944
4465
170
4465
1736
4618
036
4618
30A
nd
aman
& N
ico
bar
9859
7693
017
552
2630
026
3071
910
7191
746
429
1175
31C
han
dig
arh
198
109
172
479
168
1818
697
4414
134
47
351
32D
adra
& N
agar
Hav
eli
00
00
00
00
00
00
033
Dam
an &
Diu
7649
7756
1008
025
485
4104
2241
2689
548
113
7629
113
4116
3234
Lak
shad
wee
p10
408
2621
013
029
4231
1942
5028
0710
0338
1014
480
1448
35P
ud
uch
erry
1237
812
799
1279
737
974
4352
339
4691
2187
399
2586
3613
4416
8029
ota
l Nu
mb
er o
f m
emb
ers
Fu
ll Ti
me
Par
t Ti
me
Oth
ers
S.N
o.
Sta
te N
ame
Mal
e F
emal
e C
hild
ern
Tota
lM
ale
Fem
ale
Tota
lM
ale
Fem
ale
Tota
l M
ale
Fem
ale
Tota
l
Tota
l46
9615
840
3396
357
5523
314
4853
5481
4951
1181
7393
3124
9197
7615
2303
1072
079
1017
015
3674
6713
8448
2
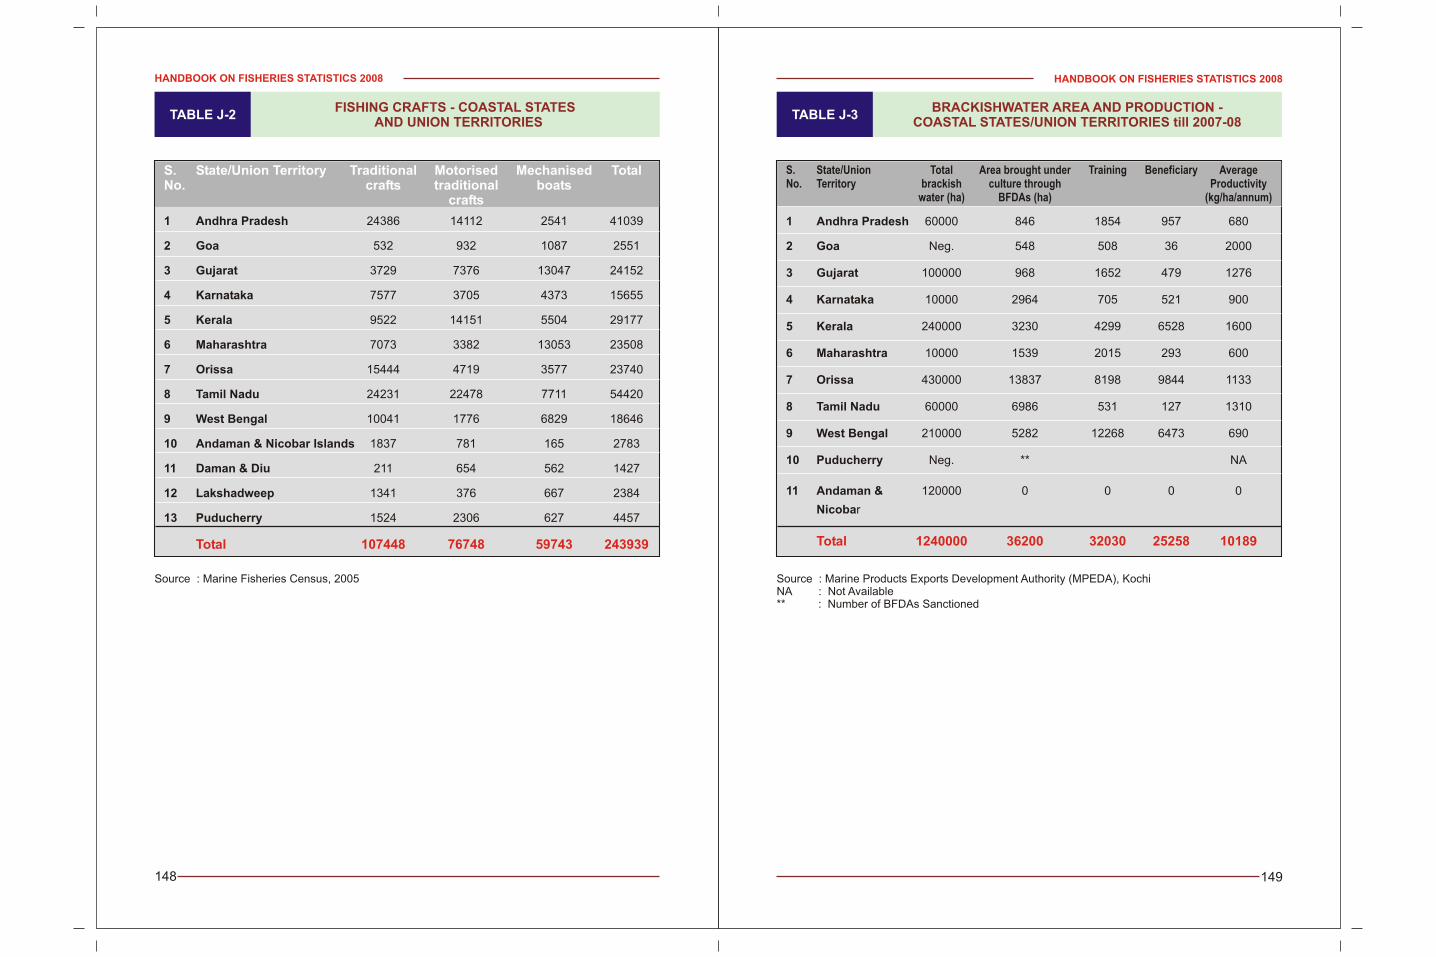
HANDBOOK ON FISHERIES STATISTICS 2008
149
HANDBOOK ON FISHERIES STATISTICS 2008
148
S. State/Union Territory Traditional Motorised Mechanised TotalNo. crafts traditional boats
crafts
1 Andhra Pradesh 24386 14112 2541 41039
2 Goa 532 932 1087 2551
3 Gujarat 3729 7376 13047 24152
4 Karnataka 7577 3705 4373 15655
5 Kerala 9522 14151 5504 29177
6 Maharashtra 7073 3382 13053 23508
7 Orissa 15444 4719 3577 23740
8 Tamil Nadu 24231 22478 7711 54420
9 West Bengal 10041 1776 6829 18646
10 Andaman & Nicobar Islands 1837 781 165 2783
11 Daman & Diu 211 654 562 1427
12 Lakshadweep 1341 376 667 2384
13 Puducherry 1524 2306 627 4457
Total 107448 76748 59743 243939
TABLE J-2FISHING CRAFTS - COASTAL STATES
AND UNION TERRITORIES
S. State/Union Total Area brought under Training Beneficiary AverageNo. Territory brackish culture through Productivity
water (ha) BFDAs (ha) (kg/ha/annum)
1 Andhra Pradesh 60000 846 1854 957 680
2 Goa Neg. 548 508 36 2000
3 Gujarat 100000 968 1652 479 1276
4 Karnataka 10000 2964 705 521 900
5 Kerala 240000 3230 4299 6528 1600
6 Maharashtra 10000 1539 2015 293 600
7 Orissa 430000 13837 8198 9844 1133
8 Tamil Nadu 60000 6986 531 127 1310
9 West Bengal 210000 5282 12268 6473 690
10 Puducherry Neg. ** NA
11 Andaman & 120000 0 0 0 0
Nicobar
Total 1240000 36200 32030 25258 10189
TABLE J-3BRACKISHWATER AREA AND PRODUCTION -
COASTAL STATES/UNION TERRITORIES till 2007-08
Source : Marine Products Exports Development Authority (MPEDA), KochiNA : Not Available** : Number of BFDAs Sanctioned
Source : Marine Fisheries Census, 2005
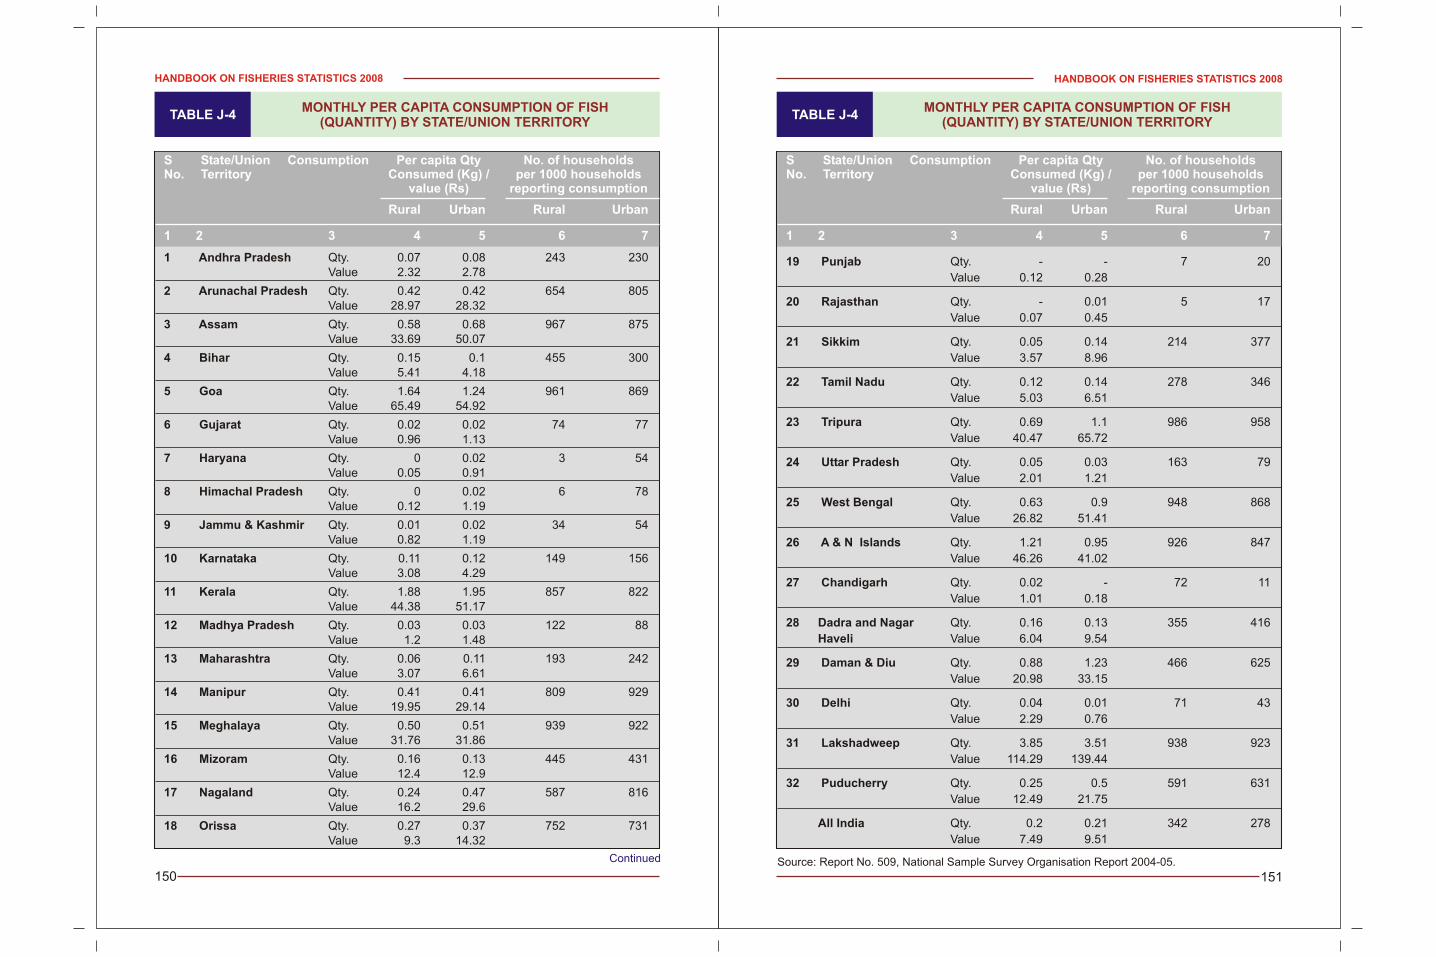
HANDBOOK ON FISHERIES STATISTICS 2008
151
HANDBOOK ON FISHERIES STATISTICS 2008
150
S State/Union Consumption Per capita Qty No. of households No. Territory Consumed (Kg) / per 1000 households
value (Rs) reporting consumption
Rural Urban Rural Urban
1 2 3 4 5 6 7
1 Andhra Pradesh Qty. 0.07 0.08 243 230Value 2.32 2.78
2 Arunachal Pradesh Qty. 0.42 0.42 654 805Value 28.97 28.32
3 Assam Qty. 0.58 0.68 967 875Value 33.69 50.07
4 Bihar Qty. 0.15 0.1 455 300Value 5.41 4.18
5 Goa Qty. 1.64 1.24 961 869Value 65.49 54.92
6 Gujarat Qty. 0.02 0.02 74 77Value 0.96 1.13
7 Haryana Qty. 0 0.02 3 54Value 0.05 0.91
8 Himachal Pradesh Qty. 0 0.02 6 78Value 0.12 1.19
9 Jammu & Kashmir Qty. 0.01 0.02 34 54Value 0.82 1.19
10 Karnataka Qty. 0.11 0.12 149 156Value 3.08 4.29
11 Kerala Qty. 1.88 1.95 857 822Value 44.38 51.17
12 Madhya Pradesh Qty. 0.03 0.03 122 88Value 1.2 1.48
13 Maharashtra Qty. 0.06 0.11 193 242Value 3.07 6.61
14 Manipur Qty. 0.41 0.41 809 929Value 19.95 29.14
15 Meghalaya Qty. 0.50 0.51 939 922Value 31.76 31.86
16 Mizoram Qty. 0.16 0.13 445 431Value 12.4 12.9
17 Nagaland Qty. 0.24 0.47 587 816Value 16.2 29.6
18 Orissa Qty. 0.27 0.37 752 731Value 9.3 14.32
TABLE J-4 MONTHLY PER CAPITA CONSUMPTION OF FISH
(QUANTITY) BY STATE/UNION TERRITORY
S State/Union Consumption Per capita Qty No. of households No. Territory Consumed (Kg) / per 1000 households
value (Rs) reporting consumption
Rural Urban Rural Urban
1 2 3 4 5 6 7
19 Punjab Qty. - - 7 20
Value 0.12 0.28
20 Rajasthan Qty. - 0.01 5 17
Value 0.07 0.45
21 Sikkim Qty. 0.05 0.14 214 377
Value 3.57 8.96
22 Tamil Nadu Qty. 0.12 0.14 278 346
Value 5.03 6.51
23 Tripura Qty. 0.69 1.1 986 958
Value 40.47 65.72
24 Uttar Pradesh Qty. 0.05 0.03 163 79
Value 2.01 1.21
25 West Bengal Qty. 0.63 0.9 948 868
Value 26.82 51.41
26 A & N Islands Qty. 1.21 0.95 926 847
Value 46.26 41.02
27 Chandigarh Qty. 0.02 - 72 11
Value 1.01 0.18
28 Dadra and Nagar Qty. 0.16 0.13 355 416
Haveli Value 6.04 9.54
29 Daman & Diu Qty. 0.88 1.23 466 625
Value 20.98 33.15
30 Delhi Qty. 0.04 0.01 71 43
Value 2.29 0.76
31 Lakshadweep Qty. 3.85 3.51 938 923
Value 114.29 139.44
32 Puducherry Qty. 0.25 0.5 591 631
Value 12.49 21.75
All India Qty. 0.2 0.21 342 278
Value 7.49 9.51
TABLE J-4MONTHLY PER CAPITA CONSUMPTION OF FISH
(QUANTITY) BY STATE/UNION TERRITORY
Continued Source: Report No. 509, National Sample Survey Organisation Report 2004-05.
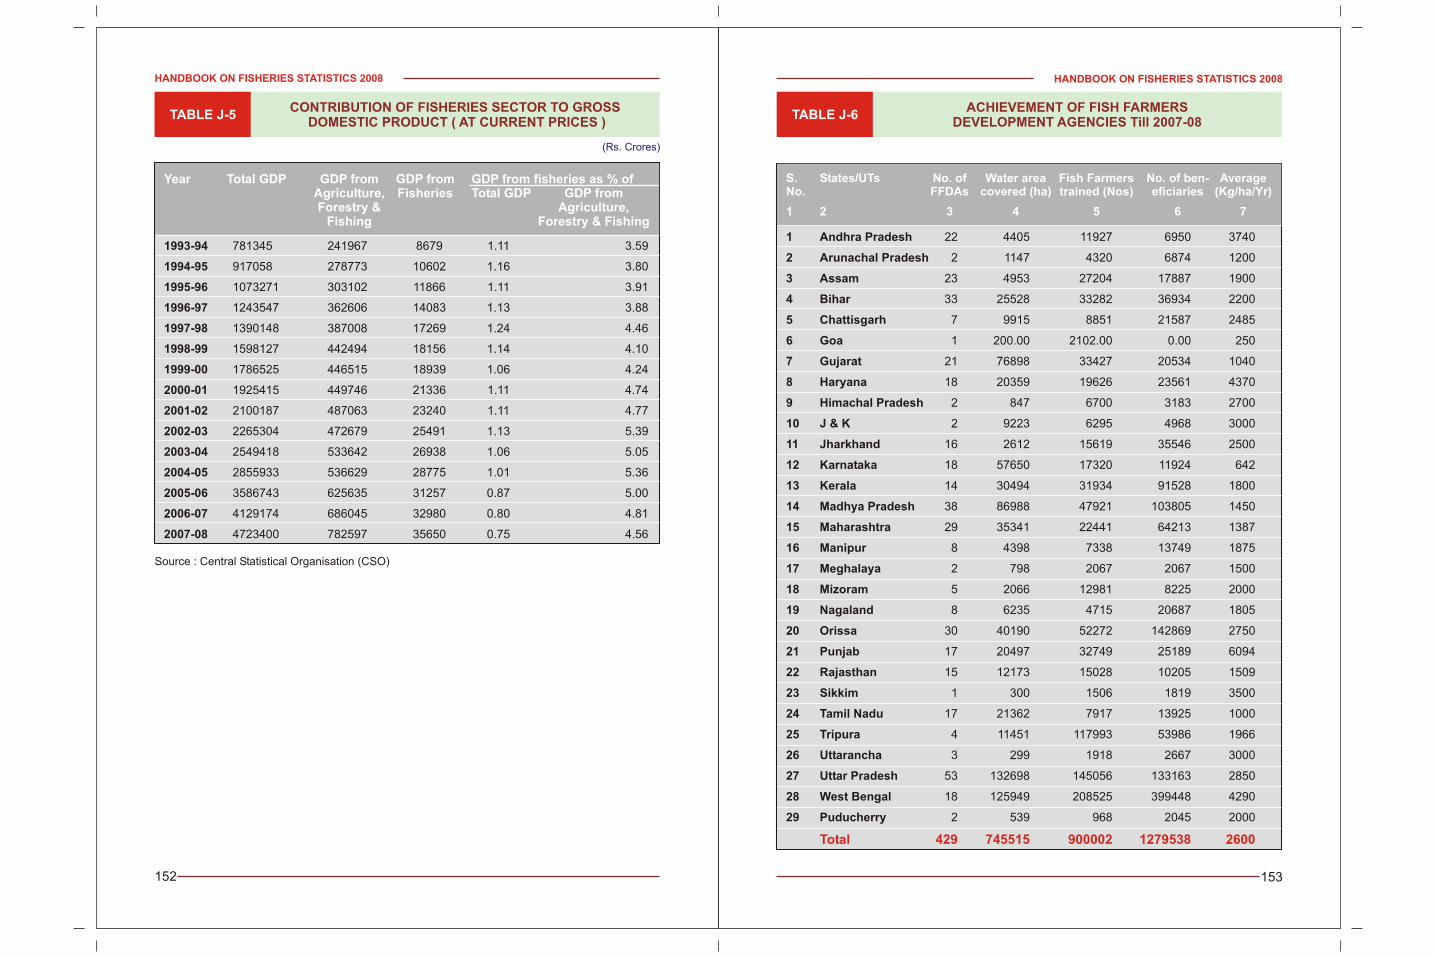
HANDBOOK ON FISHERIES STATISTICS 2008
153
HANDBOOK ON FISHERIES STATISTICS 2008
152
Year Total GDP GDP from GDP from GDP from fisheries as % ofAgriculture, Fisheries Total GDP GDP fromForestry & Agriculture,
Fishing Forestry & Fishing
1993-94 781345 241967 8679 1.11 3.59
1994-95 917058 278773 10602 1.16 3.80
1995-96 1073271 303102 11866 1.11 3.91
1996-97 1243547 362606 14083 1.13 3.88
1997-98 1390148 387008 17269 1.24 4.46
1998-99 1598127 442494 18156 1.14 4.10
1999-00 1786525 446515 18939 1.06 4.24
2000-01 1925415 449746 21336 1.11 4.74
2001-02 2100187 487063 23240 1.11 4.77
2002-03 2265304 472679 25491 1.13 5.39
2003-04 2549418 533642 26938 1.06 5.05
2004-05 2855933 536629 28775 1.01 5.36
2005-06 3586743 625635 31257 0.87 5.00
2006-07 4129174 686045 32980 0.80 4.81
2007-08 4723400 782597 35650 0.75 4.56
TABLE J-5 CONTRIBUTION OF FISHERIES SECTOR TO GROSS
DOMESTIC PRODUCT ( AT CURRENT PRICES )TABLE J-6
ACHIEVEMENT OF FISH FARMERS DEVELOPMENT AGENCIES Till 2007-08
S. States/UTs No. of Water area Fish Farmers No. of ben- AverageNo. FFDAs covered (ha) trained (Nos) eficiaries (Kg/ha/Yr)
1 2 3 4 5 6 7
1 Andhra Pradesh 22 4405 11927 6950 3740
2 Arunachal Pradesh 2 1147 4320 6874 1200
3 Assam 23 4953 27204 17887 1900
4 Bihar 33 25528 33282 36934 2200
5 Chattisgarh 7 9915 8851 21587 2485
6 Goa 1 200.00 2102.00 0.00 250
7 Gujarat 21 76898 33427 20534 1040
8 Haryana 18 20359 19626 23561 4370
9 Himachal Pradesh 2 847 6700 3183 2700
10 J & K 2 9223 6295 4968 3000
11 Jharkhand 16 2612 15619 35546 2500
12 Karnataka 18 57650 17320 11924 642
13 Kerala 14 30494 31934 91528 1800
14 Madhya Pradesh 38 86988 47921 103805 1450
15 Maharashtra 29 35341 22441 64213 1387
16 Manipur 8 4398 7338 13749 1875
17 Meghalaya 2 798 2067 2067 1500
18 Mizoram 5 2066 12981 8225 2000
19 Nagaland 8 6235 4715 20687 1805
20 Orissa 30 40190 52272 142869 2750
21 Punjab 17 20497 32749 25189 6094
22 Rajasthan 15 12173 15028 10205 1509
23 Sikkim 1 300 1506 1819 3500
24 Tamil Nadu 17 21362 7917 13925 1000
25 Tripura 4 11451 117993 53986 1966
26 Uttarancha 3 299 1918 2667 3000
27 Uttar Pradesh 53 132698 145056 133163 2850
28 West Bengal 18 125949 208525 399448 4290
29 Puducherry 2 539 968 2045 2000
Total 429 745515 900002 1279538 2600
(Rs. Crores)
Source : Central Statistical Organisation (CSO)
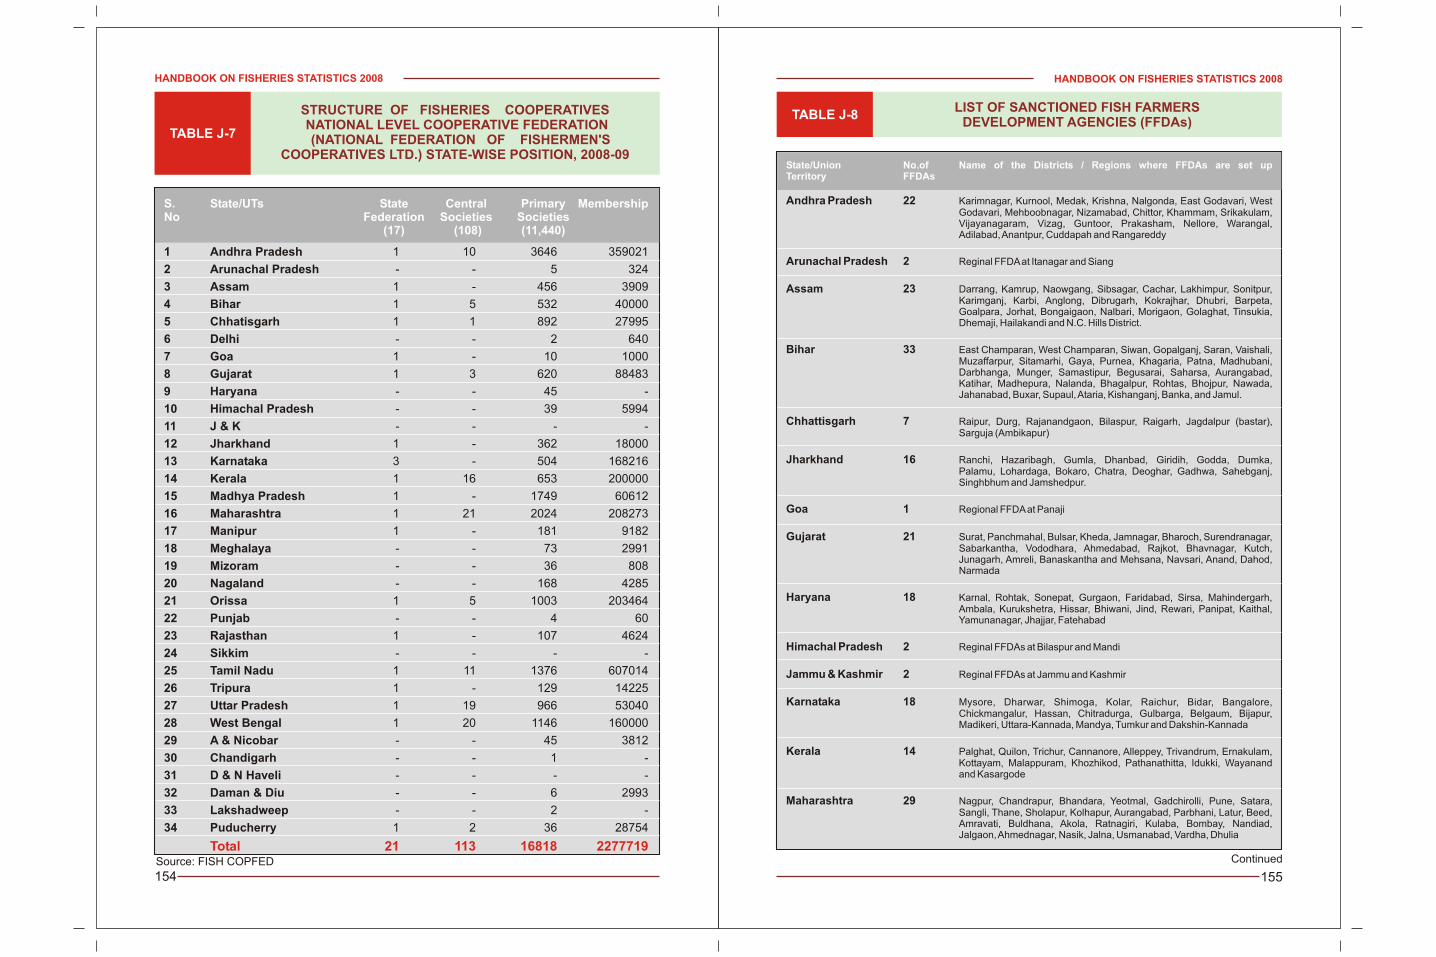
HANDBOOK ON FISHERIES STATISTICS 2008
155
HANDBOOK ON FISHERIES STATISTICS 2008
154
S. State/UTs State Central Primary MembershipNo Federation Societies Societies
(17) (108) (11,440)
1 Andhra Pradesh 1 10 3646 359021
2 Arunachal Pradesh - - 5 324
3 Assam 1 - 456 3909
4 Bihar 1 5 532 40000
5 Chhatisgarh 1 1 892 27995
6 Delhi - - 2 640
7 Goa 1 - 10 1000
8 Gujarat 1 3 620 88483
9 Haryana - - 45 -
10 Himachal Pradesh - - 39 5994
11 J & K - - - -
12 Jharkhand 1 - 362 18000
13 Karnataka 3 - 504 168216
14 Kerala 1 16 653 200000
15 Madhya Pradesh 1 - 1749 60612
16 Maharashtra 1 21 2024 208273
17 Manipur 1 - 181 9182
18 Meghalaya - - 73 2991
19 Mizoram - - 36 808
20 Nagaland - - 168 4285
21 Orissa 1 5 1003 203464
22 Punjab - - 4 60
23 Rajasthan 1 - 107 4624
24 Sikkim - - - -
25 Tamil Nadu 1 11 1376 607014
26 Tripura 1 - 129 14225
27 Uttar Pradesh 1 19 966 53040
28 West Bengal 1 20 1146 160000
29 A & Nicobar - - 45 3812
30 Chandigarh - - 1 -
31 D & N Haveli - - - -
32 Daman & Diu - - 6 2993
33 Lakshadweep - - 2 -
34 Puducherry 1 2 36 28754
Total 21 113 16818 2277719
TABLE J-7
STRUCTURE OF FISHERIES COOPERATIVES NATIONAL LEVEL COOPERATIVE FEDERATION (NATIONAL FEDERATION OF FISHERMEN'S
COOPERATIVES LTD.) STATE-WISE POSITION, 2008-09
TABLE J-8LIST OF SANCTIONED FISH FARMERS
DEVELOPMENT AGENCIES (FFDAs)
State/Union No.of Name of the Districts / Regions where FFDAs are set upTerritory FFDAs
Andhra Pradesh 22 Karimnagar, Kurnool, Medak, Krishna, Nalgonda, East Godavari, WestGodavari, Mehboobnagar, Nizamabad, Chittor, Khammam, Srikakulam,Vijayanagaram, Vizag, Guntoor, Prakasham, Nellore, Warangal,Adilabad, Anantpur, Cuddapah and Rangareddy
Arunachal Pradesh 2 Reginal FFDA at Itanagar and Siang
Assam 23 Darrang, Kamrup, Naowgang, Sibsagar, Cachar, Lakhimpur, Sonitpur,Karimganj, Karbi, Anglong, Dibrugarh, Kokrajhar, Dhubri, Barpeta,Goalpara, Jorhat, Bongaigaon, Nalbari, Morigaon, Golaghat, Tinsukia,Dhemaji, Hailakandi and N.C. Hills District.
Bihar 33 East Champaran, West Champaran, Siwan, Gopalganj, Saran, Vaishali,Muzaffarpur, Sitamarhi, Gaya, Purnea, Khagaria, Patna, Madhubani,Darbhanga, Munger, Samastipur, Begusarai, Saharsa, Aurangabad,Katihar, Madhepura, Nalanda, Bhagalpur, Rohtas, Bhojpur, Nawada,Jahanabad, Buxar, Supaul, Ataria, Kishanganj, Banka, and Jamul.
Chhattisgarh 7 Raipur, Durg, Rajanandgaon, Bilaspur, Raigarh, Jagdalpur (bastar),Sarguja (Ambikapur)
Jharkhand 16 Ranchi, Hazaribagh, Gumla, Dhanbad, Giridih, Godda, Dumka,Palamu, Lohardaga, Bokaro, Chatra, Deoghar, Gadhwa, Sahebganj, Singhbhum and Jamshedpur.
Goa 1 Regional FFDA at Panaji
Gujarat 21 Surat, Panchmahal, Bulsar, Kheda, Jamnagar, Bharoch, Surendranagar,Sabarkantha, Vododhara, Ahmedabad, Rajkot, Bhavnagar, Kutch,Junagarh, Amreli, Banaskantha and Mehsana, Navsari, Anand, Dahod,Narmada
Haryana 18 Karnal, Rohtak, Sonepat, Gurgaon, Faridabad, Sirsa, Mahindergarh,Ambala, Kurukshetra, Hissar, Bhiwani, Jind, Rewari, Panipat, Kaithal,Yamunanagar, Jhajjar, Fatehabad
Himachal Pradesh 2 Reginal FFDAs at Bilaspur and Mandi
Jammu & Kashmir 2 Reginal FFDAs at Jammu and Kashmir
Karnataka 18 Mysore, Dharwar, Shimoga, Kolar, Raichur, Bidar, Bangalore,Chickmangalur, Hassan, Chitradurga, Gulbarga, Belgaum, Bijapur, Madikeri, Uttara-Kannada, Mandya, Tumkur and Dakshin-Kannada
Kerala 14 Palghat, Quilon, Trichur, Cannanore, Alleppey, Trivandrum, Ernakulam,Kottayam, Malappuram, Khozhikod, Pathanathitta, Idukki, Wayanandand Kasargode
Maharashtra 29 Nagpur, Chandrapur, Bhandara, Yeotmal, Gadchirolli, Pune, Satara, Sangli, Thane, Sholapur, Kolhapur, Aurangabad, Parbhani, Latur, Beed,Amravati, Buldhana, Akola, Ratnagiri, Kulaba, Bombay, Nandiad,Jalgaon, Ahmednagar, Nasik, Jalna, Usmanabad, Vardha, Dhulia
ContinuedSource: FISH COPFED
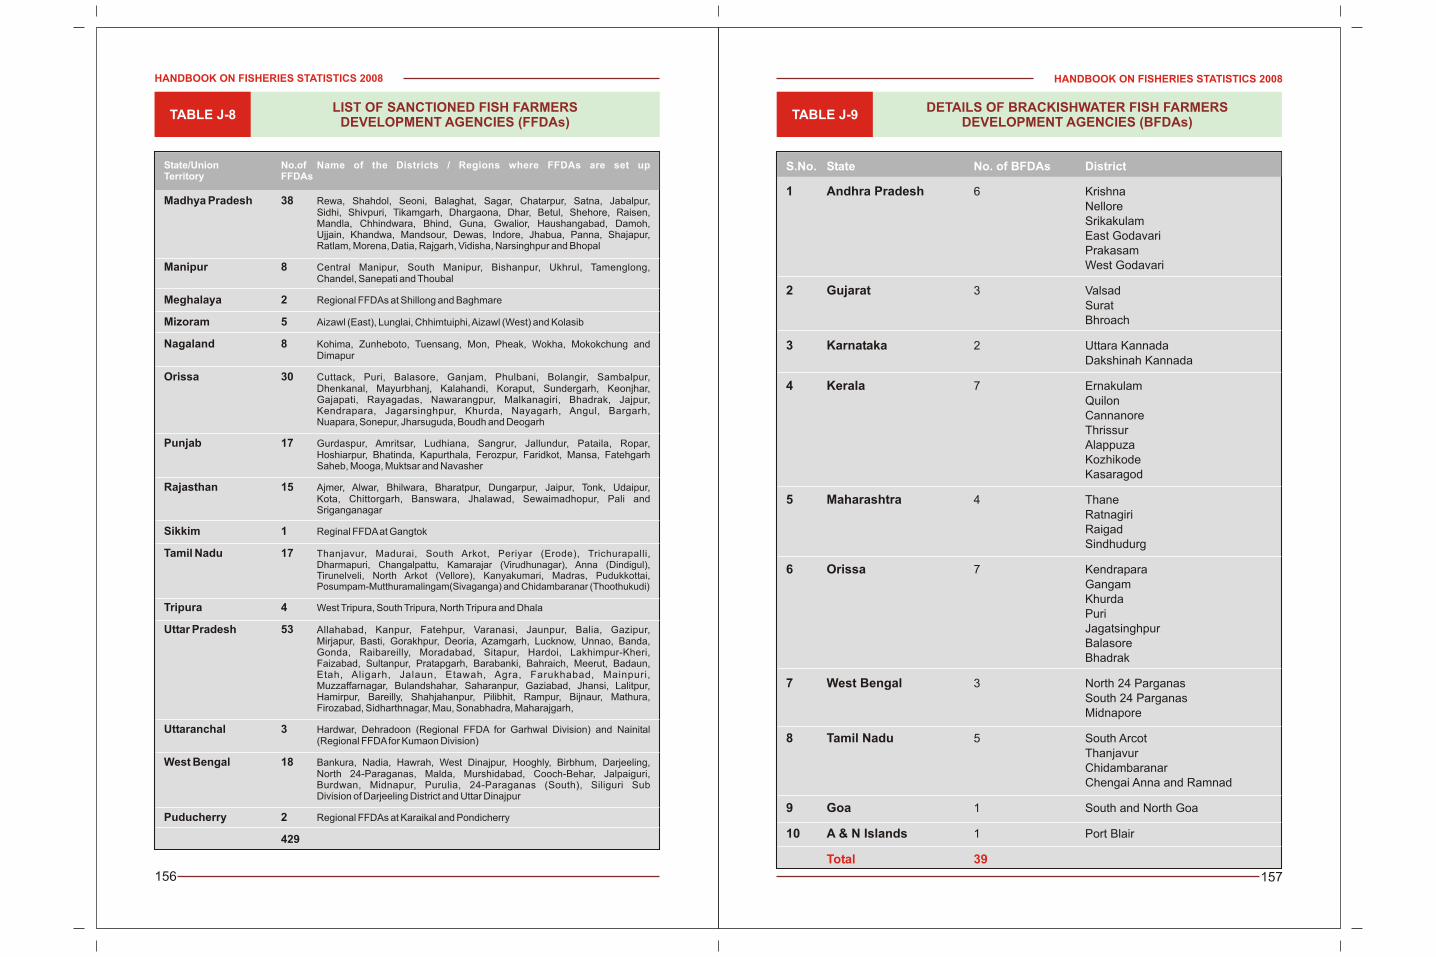
HANDBOOK ON FISHERIES STATISTICS 2008
157
HANDBOOK ON FISHERIES STATISTICS 2008
156
Continued
TABLE J-9 DETAILS OF BRACKISHWATER FISH FARMERS
DEVELOPMENT AGENCIES (BFDAs)
S.No. State No. of BFDAs District
1 Andhra Pradesh 6 KrishnaNelloreSrikakulamEast GodavariPrakasamWest Godavari
2 Gujarat 3 ValsadSuratBhroach
3 Karnataka 2 Uttara KannadaDakshinah Kannada
4 Kerala 7 ErnakulamQuilonCannanoreThrissurAlappuzaKozhikodeKasaragod
5 Maharashtra 4 ThaneRatnagiriRaigadSindhudurg
6 Orissa 7 KendraparaGangamKhurdaPuriJagatsinghpurBalasoreBhadrak
7 West Bengal 3 North 24 ParganasSouth 24 ParganasMidnapore
8 Tamil Nadu 5 South ArcotThanjavurChidambaranarChengai Anna and Ramnad
9 Goa 1 South and North Goa
10 A & N Islands 1 Port Blair
Total 39
TABLE J-8LIST OF SANCTIONED FISH FARMERS
DEVELOPMENT AGENCIES (FFDAs)
State/Union No.of Name of the Districts / Regions where FFDAs are set upTerritory FFDAs
Madhya Pradesh 38 Rewa, Shahdol, Seoni, Balaghat, Sagar, Chatarpur, Satna, Jabalpur,Sidhi, Shivpuri, Tikamgarh, Dhargaona, Dhar, Betul, Shehore, Raisen,Mandla, Chhindwara, Bhind, Guna, Gwalior, Haushangabad, Damoh,Ujjain, Khandwa, Mandsour, Dewas, Indore, Jhabua, Panna, Shajapur,Ratlam, Morena, Datia, Rajgarh, Vidisha, Narsinghpur and Bhopal
Manipur 8 Central Manipur, South Manipur, Bishanpur, Ukhrul, Tamenglong,Chandel, Sanepati and Thoubal
Meghalaya 2 Regional FFDAs at Shillong and Baghmare
Mizoram 5 Aizawl (East), Lunglai, Chhimtuiphi, Aizawl (West) and Kolasib
Nagaland 8 Kohima, Zunheboto, Tuensang, Mon, Pheak, Wokha, Mokokchung andDimapur
Orissa 30 Cuttack, Puri, Balasore, Ganjam, Phulbani, Bolangir, Sambalpur,Dhenkanal, Mayurbhanj, Kalahandi, Koraput, Sundergarh, Keonjhar,Gajapati, Rayagadas, Nawarangpur, Malkanagiri, Bhadrak, Jajpur,Kendrapara, Jagarsinghpur, Khurda, Nayagarh, Angul, Bargarh, Nuapara, Sonepur, Jharsuguda, Boudh and Deogarh
Punjab 17 Gurdaspur, Amritsar, Ludhiana, Sangrur, Jallundur, Pataila, Ropar,Hoshiarpur, Bhatinda, Kapurthala, Ferozpur, Faridkot, Mansa, FatehgarhSaheb, Mooga, Muktsar and Navasher
Rajasthan 15 Ajmer, Alwar, Bhilwara, Bharatpur, Dungarpur, Jaipur, Tonk, Udaipur,Kota, Chittorgarh, Banswara, Jhalawad, Sewaimadhopur, Pali andSriganganagar
Sikkim 1 Reginal FFDA at Gangtok
Tamil Nadu 17 Thanjavur, Madurai, South Arkot, Periyar (Erode), Trichurapalli, Dharmapuri, Changalpattu, Kamarajar (Virudhunagar), Anna (Dindigul),Tirunelveli, North Arkot (Vellore), Kanyakumari, Madras, Pudukkottai,Posumpam-Mutthuramalingam(Sivaganga) and Chidambaranar (Thoothukudi)
Tripura 4 West Tripura, South Tripura, North Tripura and Dhala
Uttar Pradesh 53 Allahabad, Kanpur, Fatehpur, Varanasi, Jaunpur, Balia, Gazipur,Mirjapur, Basti, Gorakhpur, Deoria, Azamgarh, Lucknow, Unnao, Banda,Gonda, Raibareilly, Moradabad, Sitapur, Hardoi, Lakhimpur-Kheri,Faizabad, Sultanpur, Pratapgarh, Barabanki, Bahraich, Meerut, Badaun,Etah, Aligarh, Jalaun, Etawah, Agra, Farukhabad, Mainpuri,Muzzaffarnagar, Bulandshahar, Saharanpur, Gaziabad, Jhansi, Lalitpur,Hamirpur, Bareilly, Shahjahanpur, Pilibhit, Rampur, Bijnaur, Mathura,Firozabad, Sidharthnagar, Mau, Sonabhadra, Maharajgarh,
Uttaranchal 3 Hardwar, Dehradoon (Regional FFDA for Garhwal Division) and Nainital(Regional FFDA for Kumaon Division)
West Bengal 18 Bankura, Nadia, Hawrah, West Dinajpur, Hooghly, Birbhum, Darjeeling,North 24-Paraganas, Malda, Murshidabad, Cooch-Behar, Jalpaiguri,Burdwan, Midnapur, Purulia, 24-Paraganas (South), Siliguri SubDivision of Darjeeling District and Uttar Dinajpur
Puducherry 2 Regional FFDAs at Karaikal and Pondicherry
429
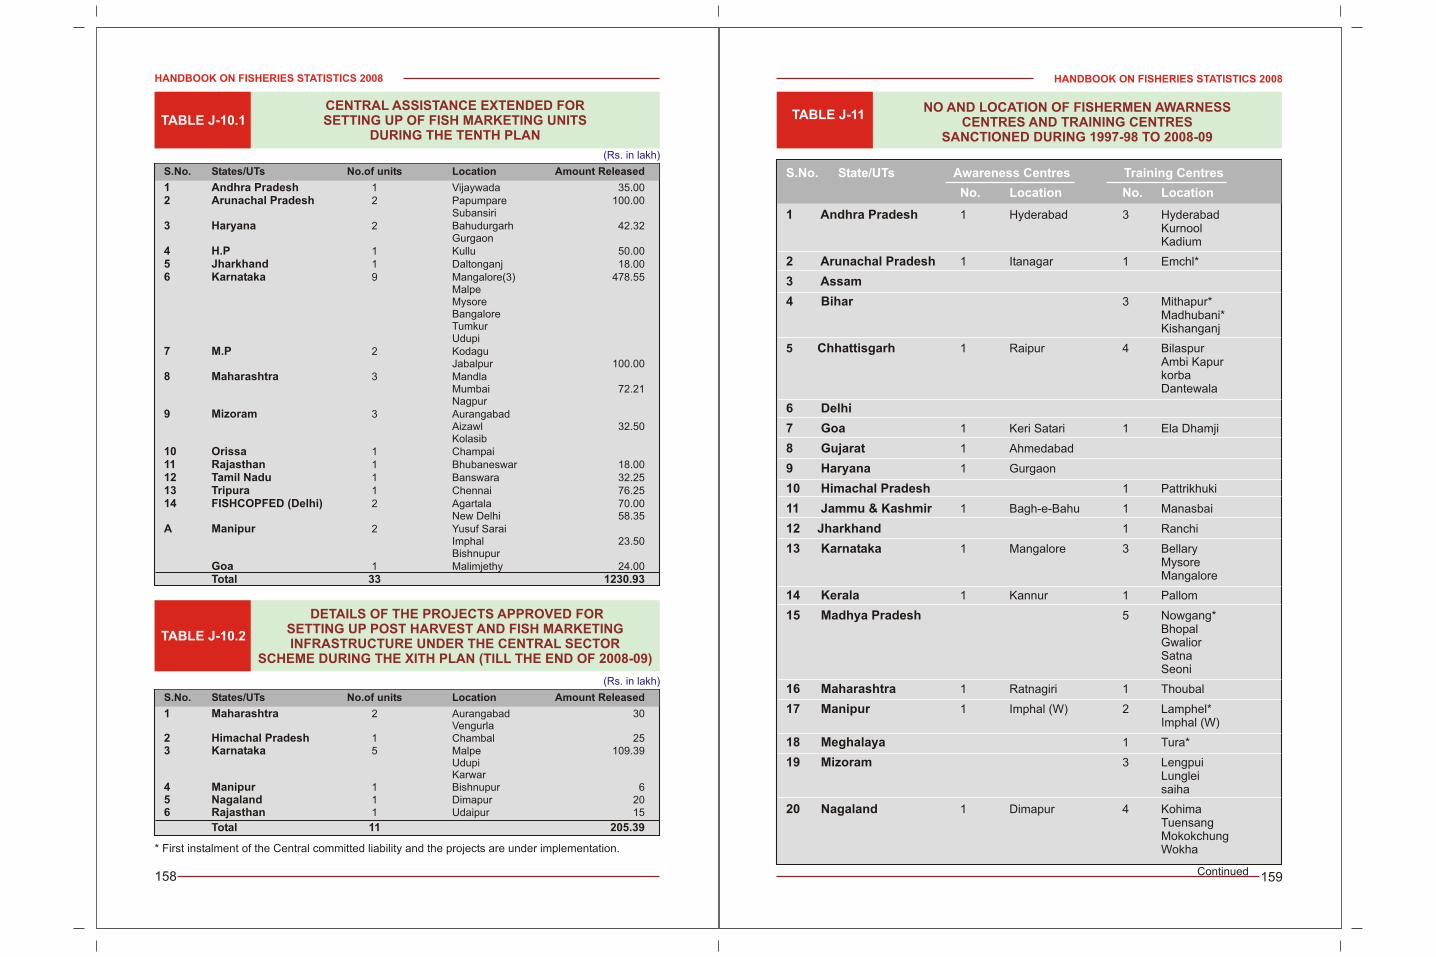
HANDBOOK ON FISHERIES STATISTICS 2008
159
HANDBOOK ON FISHERIES STATISTICS 2008
158
TABLE J-11NO AND LOCATION OF FISHERMEN AWARNESS
CENTRES AND TRAINING CENTRES SANCTIONED DURING 1997-98 TO 2008-09
TABLE J-10.1CENTRAL ASSISTANCE EXTENDED FORSETTING UP OF FISH MARKETING UNITS
DURING THE TENTH PLAN
(Rs. in lakh)
S.No. States/UTs No.of units Location Amount Released
1 Andhra Pradesh 1 Vijaywada 35.002 Arunachal Pradesh 2 Papumpare 100.00
Subansiri3 Haryana 2 Bahudurgarh 42.32
Gurgaon4 H.P 1 Kullu 50.005 Jharkhand 1 Daltonganj 18.006 Karnataka 9 Mangalore(3) 478.55
MalpeMysoreBangaloreTumkurUdupi
7 M.P 2 KodaguJabalpur 100.00
8 Maharashtra 3 MandlaMumbai 72.21Nagpur
9 Mizoram 3 AurangabadAizawl 32.50Kolasib
10 Orissa 1 Champai11 Rajasthan 1 Bhubaneswar 18.0012 Tamil Nadu 1 Banswara 32.2513 Tripura 1 Chennai 76.2514 FISHCOPFED (Delhi) 2 Agartala 70.00
New Delhi 58.35A Manipur 2 Yusuf Sarai
Imphal 23.50Bishnupur
Goa 1 Malimjethy 24.00Total 33 1230.93
TABLE J-10.2
DETAILS OF THE PROJECTS APPROVED FOR SETTING UP POST HARVEST AND FISH MARKETINGINFRASTRUCTURE UNDER THE CENTRAL SECTOR
SCHEME DURING THE XITH PLAN (TILL THE END OF 2008-09)
(Rs. in lakh)
S.No. States/UTs No.of units Location Amount Released
1 Maharashtra 2 Aurangabad 30Vengurla
2 Himachal Pradesh 1 Chambal 253 Karnataka 5 Malpe 109.39
UdupiKarwar
4 Manipur 1 Bishnupur 65 Nagaland 1 Dimapur 206 Rajasthan 1 Udaipur 15
Total 11 205.39
* First instalment of the Central committed liability and the projects are under implementation.
S.No. State/UTs Awareness Centres Training Centres
No. Location No. Location
1 Andhra Pradesh 1 Hyderabad 3 HyderabadKurnoolKadium
2 Arunachal Pradesh 1 Itanagar 1 Emchl*
3 Assam
4 Bihar 3 Mithapur*Madhubani*Kishanganj
5 Chhattisgarh 1 Raipur 4 BilaspurAmbi KapurkorbaDantewala
6 Delhi
7 Goa 1 Keri Satari 1 Ela Dhamji
8 Gujarat 1 Ahmedabad
9 Haryana 1 Gurgaon
10 Himachal Pradesh 1 Pattrikhuki
11 Jammu & Kashmir 1 Bagh-e-Bahu 1 Manasbai
12 Jharkhand 1 Ranchi
13 Karnataka 1 Mangalore 3 BellaryMysoreMangalore
14 Kerala 1 Kannur 1 Pallom
15 Madhya Pradesh 5 Nowgang*BhopalGwaliorSatnaSeoni
16 Maharashtra 1 Ratnagiri 1 Thoubal
17 Manipur 1 Imphal (W) 2 Lamphel*Imphal (W)
18 Meghalaya 1 Tura*
19 Mizoram 3 LengpuiLungleisaiha
20 Nagaland 1 Dimapur 4 KohimaTuensangMokokchungWokha
Continued
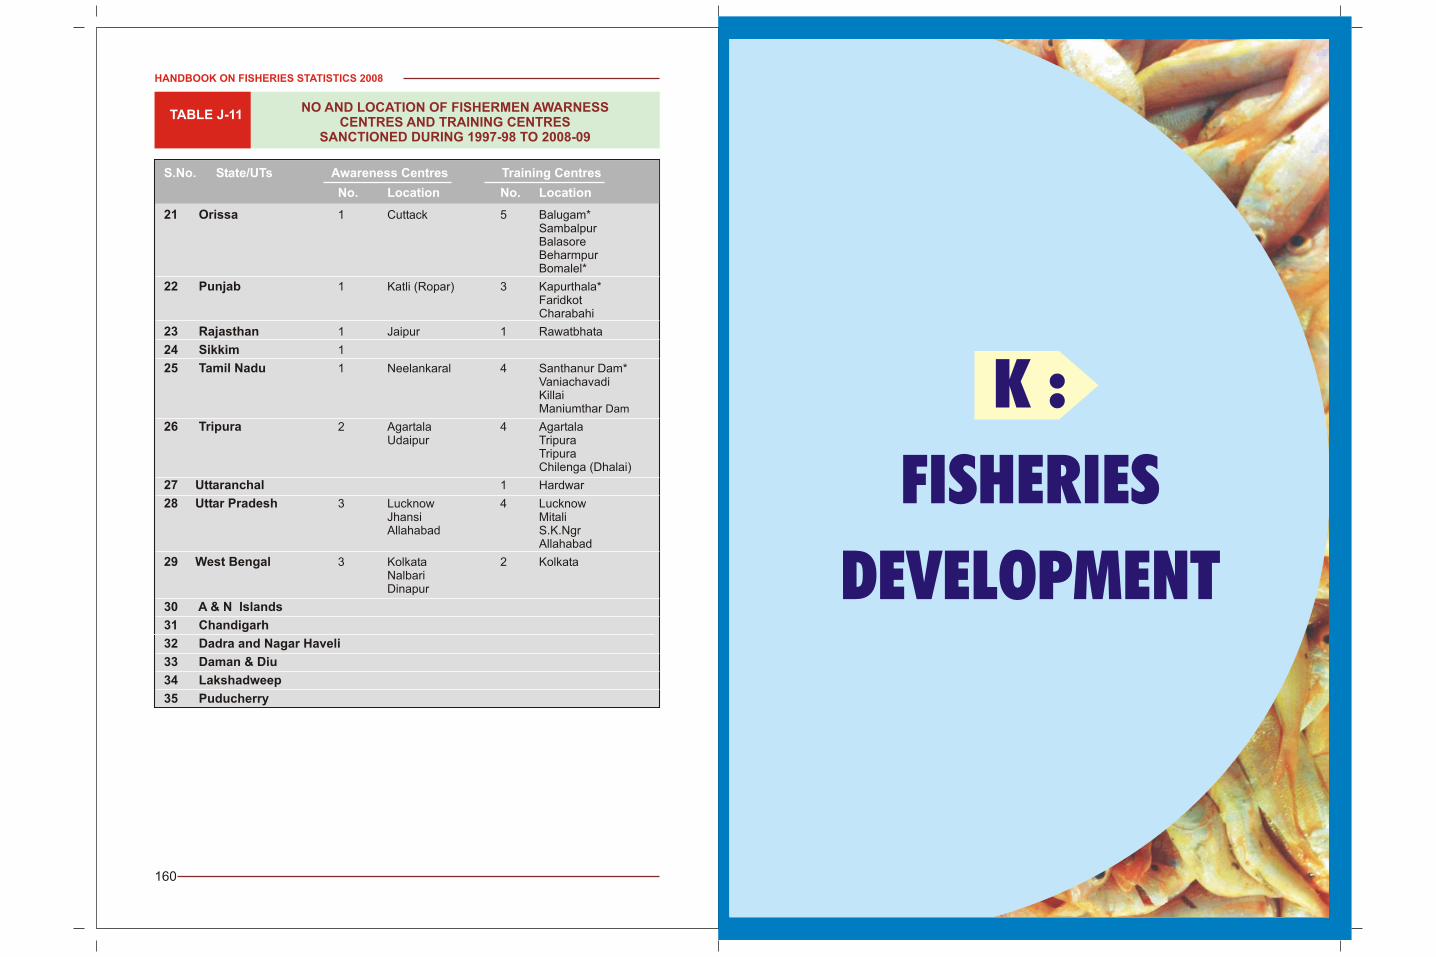
HANDBOOK ON FISHERIES STATISTICS 2008
160
TABLE J-11NO AND LOCATION OF FISHERMEN AWARNESS
CENTRES AND TRAINING CENTRES SANCTIONED DURING 1997-98 TO 2008-09
S.No. State/UTs Awareness Centres Training Centres
No. Location No. Location
21 Orissa 1 Cuttack 5 Balugam*SambalpurBalasoreBeharmpurBomalel*
22 Punjab 1 Katli (Ropar) 3 Kapurthala*FaridkotCharabahi
23 Rajasthan 1 Jaipur 1 Rawatbhata
24 Sikkim 1
25 Tamil Nadu 1 Neelankaral 4 Santhanur Dam*VaniachavadiKillaiManiumthar Dam
26 Tripura 2 Agartala 4 AgartalaUdaipur Tripura
TripuraChilenga (Dhalai)
27 Uttaranchal 1 Hardwar
28 Uttar Pradesh 3 Lucknow 4 LucknowJhansi MitaliAllahabad S.K.Ngr
Allahabad
29 West Bengal 3 Kolkata 2 KolkataNalbariDinapur
30 A & N Islands
31 Chandigarh
32 Dadra and Nagar Haveli
33 Daman & Diu
34 Lakshadweep
35 Puducherry
K :
FISHERIES
DEVELOPMENT
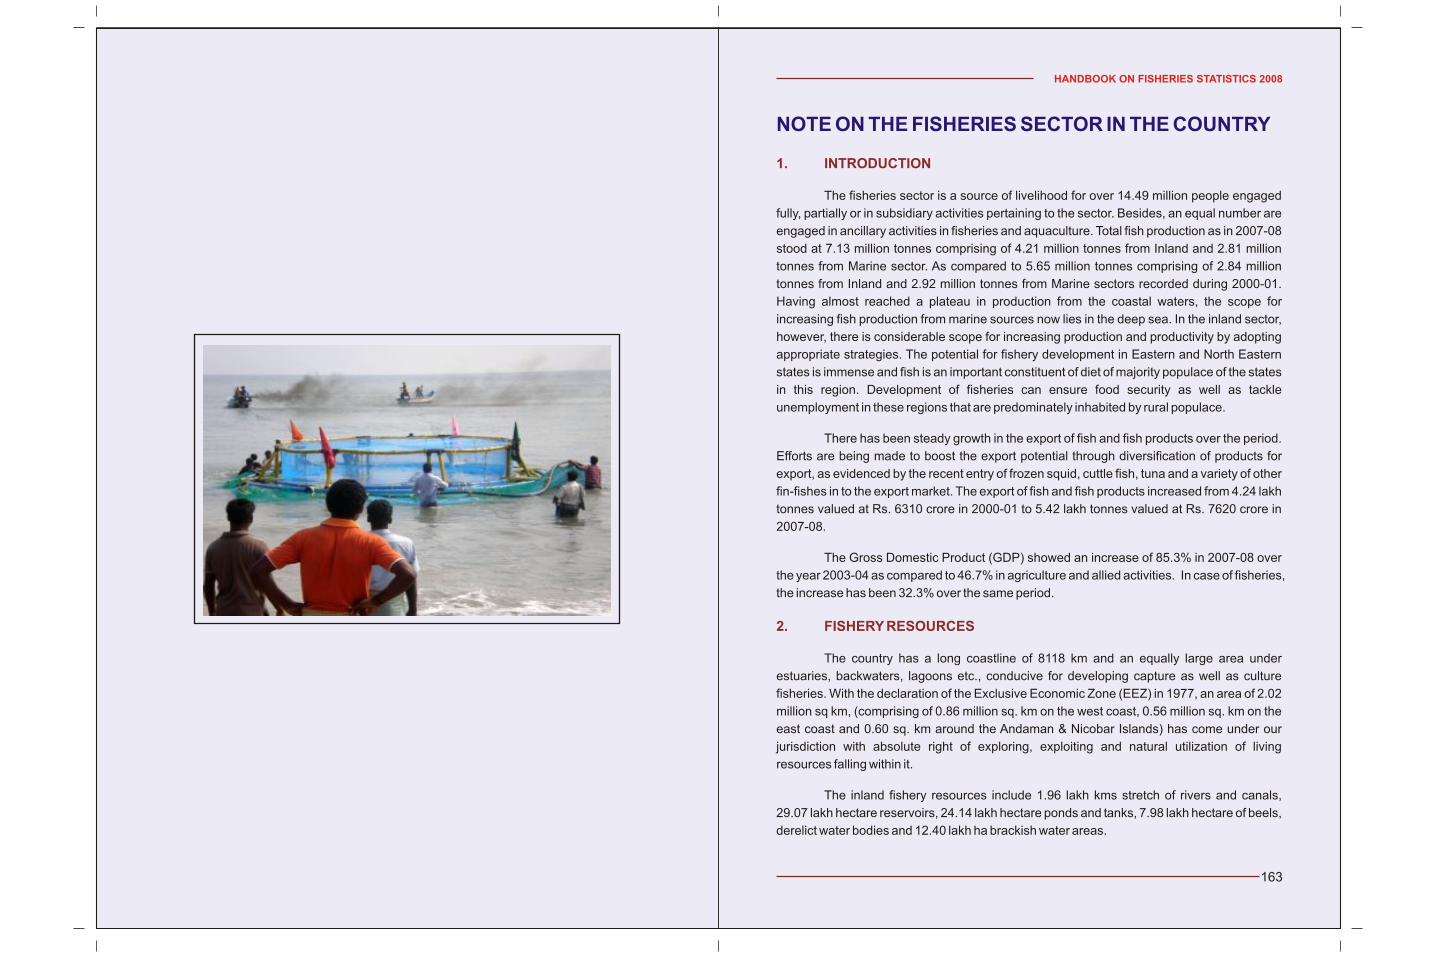
HANDBOOK ON FISHERIES STATISTICS 2008
163
NOTE ON THE FISHERIES SECTOR IN THE COUNTRY
1. INTRODUCTION
2. FISHERY RESOURCES
The fisheries sector is a source of livelihood for over 14.49 million people engaged
fully, partially or in subsidiary activities pertaining to the sector. Besides, an equal number are
engaged in ancillary activities in fisheries and aquaculture. Total fish production as in 2007-08
stood at 7.13 million tonnes comprising of 4.21 million tonnes from Inland and 2.81 million
tonnes from Marine sector. As compared to 5.65 million tonnes comprising of 2.84 million
tonnes from Inland and 2.92 million tonnes from Marine sectors recorded during 2000-01.
Having almost reached a plateau in production from the coastal waters, the scope for
increasing fish production from marine sources now lies in the deep sea. In the inland sector,
however, there is considerable scope for increasing production and productivity by adopting
appropriate strategies. The potential for fishery development in Eastern and North Eastern
states is immense and fish is an important constituent of diet of majority populace of the states
in this region. Development of fisheries can ensure food security as well as tackle
unemployment in these regions that are predominately inhabited by rural populace.
There has been steady growth in the export of fish and fish products over the period.
Efforts are being made to boost the export potential through diversification of products for
export, as evidenced by the recent entry of frozen squid, cuttle fish, tuna and a variety of other
fin-fishes in to the export market. The export of fish and fish products increased from 4.24 lakh
tonnes valued at Rs. 6310 crore in 2000-01 to 5.42 lakh tonnes valued at Rs. 7620 crore in
2007-08.
The Gross Domestic Product (GDP) showed an increase of 85.3% in 2007-08 over
the year 2003-04 as compared to 46.7% in agriculture and allied activities. In case of fisheries,
the increase has been 32.3% over the same period.
The country has a long coastline of 8118 km and an equally large area under
estuaries, backwaters, lagoons etc., conducive for developing capture as well as culture
fisheries. With the declaration of the Exclusive Economic Zone (EEZ) in 1977, an area of 2.02
million sq km, (comprising of 0.86 million sq. km on the west coast, 0.56 million sq. km on the
east coast and 0.60 sq. km around the Andaman & Nicobar Islands) has come under our
jurisdiction with absolute right of exploring, exploiting and natural utilization of living
resources falling within it.
The inland fishery resources include 1.96 lakh kms stretch of rivers and canals,
29.07 lakh hectare reservoirs, 24.14 lakh hectare ponds and tanks, 7.98 lakh hectare of beels,
derelict water bodies and 12.40 lakh ha brackish water areas.
The two components viz, Development of Fresh Water Aquaculture and
Development of Brackish Water Aquaculture are being implemented by a single agency, i.e.,
Fish Farmer Development Agency (FFDA) in the States and UTs. Through the network of 429
Fish Farmer Development Agencies (FFDAs) and 39 Brackish water Fish Farmers
Development Agencies (BFDAs) covering all potential districts across the country, about 8.93
lakh ha water area have been brought under improved fish culture practices and 9.53 lakh fish
farmers/fishermen were imparted training in pisciculture till 2008-09 in various States/UTs
under the scheme.
The existing components as well as new components have been brought under an
umbrella scheme namely Centrally Sponsored Scheme on Development of Marine Fisheries,
Infrastructure & Post Harvest Operations. This scheme envisaged augmentation of fish
production and productivity in the marine fishing and thereby to improve food security, export
earnings and livelihood system of coastal fishing communities. The Centrally Sponsored thscheme is continued during 11 Plan with the following major components :-
a) Motorization of traditional Craft
b) Safety of Fishermen at Sea
c) Fishermen Development Rebate on HSD oil
d) Introduction of intermediate craft of improved design.
e) Establishment of Operation of Vessel Monitoring System.
f) Promoting fuel efficient and environment friendly fishing practices.
g) Management of Marine Fisheries.
(I) Establishment of Fishing Harbours & fish landing centers
Since inception of the scheme, 7 major fishing harbours, 61 minor fishing harbours
and 194 fish landing centres have been taken up for implementation in various coastal
States/UTs. Out of which, 6 major fishing harbours, 44 minor fishing harbours and 176 fish
landing centres have been completed and put to use. Remaining 1 major fishing harbour, 17
minor fishing harbours and 18 fish landing centres are at various stages of construction at
present.
(II) Strengthening of Post Harvest Infrastructure :
The aim of this component is to create necessary facilities to provide remunerative
price to the fish farmers for their produce and made available fresh fish at reasonable price to
the consumer. This component consists of four sub components namely :
i) Developing of fish preservation and storage infrastructure.
ii) Developing retail fish marketing infrastructure.
iii) Assistance for fish transport infrastructure.
3.2 DEVELOPMENT OF MARINE FISHERIES, INFRASTRUCTURE AND
POST HARVEST OPERATIONS
3.2.1 Development of Marine Fisheries
3.2.2 Development of Infrastructure and Post Harvest Operations
3. DEVELOPMENT OF INLAND AND MARINE FISHERIES IN THE TENTH
PLAN / ELEVENTH PLAN
The outlay approved by the Planning Commission for the fisheries sector is Rs. 2776
crore for the Eleventh Plan period. Against the BE of Rs. 170.00 crore and Rs. 180.00 crore in
2007-08 and 2008-09 respectively the actual expenditure of Rs. 162.00 crore and Rs. 171.00
crore, were incurred for the respective year. Out of the total allocation of Rs. 299.00 crore in
2009-10, Rs. 164.00 crore is earmarked for Centrally Sponsored / Central Sector Scheme in
fisheries sector whereas Rs. 135.00 crore was earmarked for National Fisheries
Development Board. In the approved outlay for eleventh plan, 55% is earmarked for NFDB
and rest for Centrally Sponsored / Central Sector Schemes in fisheries sector.
In order to have a comprehensive and focussed approach, the schemes which were thimplemented up to 10 Plan were brought under the following umbrella schemes during the
th11 Plan:
§ Development of Inland Fisheries and Aquaculture
§ Development of Marine Fisheries, Infrastructure and Post Harvest Operations
§ Strengthening of Database & Geographical Information System for the
Fisheries Sector.
§ National Scheme of Welfare of Fishermen.
This macro scheme covers all aspects related to inland fisheries such as brackish
water, ponds, reservoirs, canals, use of waterlogged areas/alkaline & saline soils etc for
development of fisheries. The main objectives of the scheme envisages encouraging leasing
of water area, expanding aquaculture by construction of new ponds, popularising fish/shrimp
farming, utilizing vast brackish water area for fish/shrimp culture, providing suitable
technology package for promotion of cold water fisheries, utilizing saline/alkaline soil for
raising commercial crop of fish, increase of fish production in capture as well as involving Fish
Farming Development Agencies (FFDA) fully for development and delivery of sustainable
aquaculture throughout the country. The Centrally Sponsored Scheme renamed as th"Development of Inland Fisheries and Aquaculture" during 10 Plan is being continued
thduring 11 Plan with one more component added during 2008-09 as detailed below :-
i) Development of Freshwater Aquaculture
ii) Development of Brackish water Aquaculture
iii) Development of Coldwater Fisheries and Aquaculture in the Hilly Regions
iv) Development of Water-logged Areas into Aquaculture Estates
v) Utilization of Inland Saline/Alkaline Soils for Aquaculture
vi) Inland Capture Fisheries (Reservoirs/Rivers etc.)
vii) Innovative Projects.
3.1 DEVELOPMENT OF INLAND FISHERIES AND AQUACULTURE
HANDBOOK ON FISHERIES STATISTICS 2008
165
HANDBOOK ON FISHERIES STATISTICS 2008
164
HANDBOOK ON FISHERIES STATISTICS 2008
166
HANDBOOK ON FISHERIES STATISTICS 2008
167
iv) Development of central fish market in metros and big cities.thSince, reintroduction of the scheme during 10 Five Year Plan, 13 ice plants / cold
storages, 45 fish retail outlets / kiosks, 31 insulated / refrigerated vehicles have been set up in
the country.
(III) Assistance for maintenance Dredging of Fishing Harbours and Fish
landing Centres.
Every fish harbour / fish landing centre is subjected to siltation due to natural
phenomena. Realizing the siltation problem faced by the existing fishing harbours and fish
landing centres, a Trailing Suction Hopper Dredger, 'TSD Sindhuraj' has been procured under
Japanese Grant-in-aid programme to assist the States/UTs/Port-Trust for maintenance
dredging at the existing fishing harbour. Under this component financial assistance is
provided to coastal States/UTs & Port-Trust for undertaking maintenance dredging.
thThis component has continued during 11 Five Year Plan with an aim to provide
financial assistance for taking innovative activities in Marine Fisheries / Infrastructure, Human
Resources Development, Strengthening of Fisheries Management, Monitoring, Evolution,
Research & Development Studies.
The scheme with total outlay of Rs 48.68 crore for implementation during the
Eleventh Plan has the following components:
1) Sample survey for estimation of inland fishery resources and their
potential and fish production,
2) Development of Geographical Information System,
3) Census on important Attributes of Marine Fisheries
4) Catch Assessment Survey for inland and marine fisheries potential in
coastal areas,
5) Assessment of fish production,
6) Evaluation Studies / Professional Services.
The scheme is implemented with 100% Central assistance.
7) Registration of Fishing Vessels.
8) Development of database of fisheries cooperative of India.
9) Mapping of smaller water bodies and development of GIS based fishery
management system.
10) Strengthening of Statistical Unit at Headquarters.
The centrally Sponsored National Scheme of Welfare of Fishermen comprising of thfour broad components as given below are in operation during the 11 five year plan for the
3.2.3 Innovative Activities.
3.3 Strengthening Of Database And Geographical Information System For
Fisheries Sector
3.4 WELFARE, TRAINING & EXTENSION PROGRAMME FOR FISHERS
3.4.1 National Scheme Of Welfare Of Fishermen
welfare of the fishermen in India:
a) Development of Model Fishermen Villages
b) Group Accident Insurance for Active Fishermen
c) Saving-cum-Relief Scheme
d) Training and extension
During 2008-09, assistance were provided for construction of 6886 houses of
fishermen, to cover 2.2 lakh fishers under saving cum relief and to insure 33.20 lakh fishers
under the Group Accident Insurance for active fishermen and to train 3480 fishers.
In order to promote fisheries sector, Govt. of India has four Fisheries Institutes
working under its administrative control. These institution help in providing technical trained
manpower to the sector, preparation of techno economic feasibility report for setting up of
fishing harbour / fish landing centres etc, training in fish processing and other related activities.
The Fishery Survey of India (FSI) is responsible for survey and assessment of marine fishery
resources of the Indian EEZ with its headquarters at Mumbai. The FSI has seven operational
bases at Porbandar, Mumbai, Mormugao and Kochi along the West Coast, Chennai and
Visakhapatnam along the east coast and Port Blair in the Andaman & Nicobar Islands. A total
of 13 ocean ongoing survey vessels are deployed for fisheries resources survey and
monitoring. Besides resources surveys, the FSI monitors the fishery resources for the
purpose of regulation and management, makes an assessment of suitability of different types
of craft & gear for deep-sea and oceanic fishing, imparting in-vessel training to
CIFNET/Polytechnic trainees, disseminates information on fishery resources through
various media to the fishing community, industry, other end users, etc. The survey fleet of the
Institute undertakes bottom trawl survey, midwater/columnar resources survey and long line
survey for demersal, columnar and oceanic tunas and allied resources as well as for oceanic
sharks. The Institute has operated 274428 hooks for tuna and other longlining, conducted
survey for 3202 for midwater and bottom trawling, thus completed 1480 fishing days by
vessels during 2008-09.
The primary objective of the Institute is to make available sufficient number of trained
operatives for fishing vessels and technicians for shore establishments. Besides, short
duration programme, two regular courses of 24 months duration namely Vessel Navigator
Marine Fitter are conducted by the CIFNET. 762 candidates have been trained in short term
courses, 96 candidates were trained in long term duration courses during 2007-08.
4. INSTITUTIONAL ARRANGEMENTS FOR THE FISHERIES SECTOR:
4.1 Fishery Survey of India (FSI), Mumbai
4.2 Central Institute of Fisheries, Nautical & Engineering Training
(CIFNET), Cochin
HANDBOOK ON FISHERIES STATISTICS 2008
169
HANDBOOK ON FISHERIES STATISTICS 2008
168
4.3 National Institute of Fisheries Post Harvest Technology and Training
(NIFPHATT), Cochin
4.4 Central Institute of Coastal Engineering for Fishery (CICEF), Bangalore
4.5 National Fisheries Development Board (NFDB)
The Integrated Fisheries Project was renamed as "National Institute of Fisheries
Post Harvest Technology and Training" in 2008. This Institute envisages processing,
popularization and test marketing of unconventional varieties of fish. The Institute has an
ice-cum-freezing plant and a modern fish-processing unit. It also provides institutional
training in various courses. Besides the Head Quarters at Kochi, the Institute also has a
centre at Visakhapatnam. The Institute processed 124.13 MT of fish, marketed 116.27 MT of
fish during 2007-08. The total number of trainee days attained by institute was 523 during
2008-09.
The objective of the Institute set up in 1968 with its office at Bangalore is to conduct
engineering and economic investigation, preparation of techno-economic feasibility report for
development of fishing harbours at suitable sites along the Indian Coast and brackish water
fish farms. The Institute monitors the construction of fishery harbours sanctioned under
centrally sponsored scheme by the Ministry of Agriculture and renders technical guidance to
the maritime states/ UT's in the speedy implementation of the projects. The Institute also
extends technical assistance to the maritime State Governments/ UTs in preparation/
finalization of project reports for seeking Central assistance for developing fishing harbour/
fish landing centres. The institute has conduced 78 reconssiance surveys, and prepared 77
Techno-Economic Feasibility Reports (TEFRs) till March 2009. The institute has also
reconnoitered about 66, 200 ha of brackish water area and engineering investigation were
carried out over 15600 h.a. in all maritime states for development of brackish water shrimp
culture projects.
National Fisheries Development Board (NFDB) has been set up in September 2006
with its head quarter at Hyderabad. The Board has been registered under Andhra Pradesh
Society Registration Act 2001 on 10/07/06 to realize the untapped potential of fisheries sector
in inland and marine fish capture, culture, processing & marketing of fish, and over all growth
of fisheries sector with the application of modern tools of research & development including
biotechnology for optimizing production and productivity form fisheries.
The activities of the Board is focussed towards increasing the fish production of the
country to a level of 10.3 million tonnes, to double the exports from Rs. 7,000/- crore to
Rs. 14,000/- crore and provide employment to an extent of 3.5 million person by extending
assistance to various agencies for implementation of activities under inland, brackish water
and marine sector.
4.5.1 Objective of the National Fisheries Development Board are :
4.5.2 Major activities to be taken up by the National Fisheries Development
Board :
� To bring major activities relating to fisheries and aquaculture for focussed
attention and professional management;� To coordinate activities pertaining to fisheries undertaken by different
Ministries / Departments in the Central Government and also coordinate with
the State / UT Government;� To improve production, processing, storage, transport and marketing of the
products and culture fisheries;� To achieve sustainable management and conservation of natural aquatic
resources including the fish stocks;� To apply modern tools of research and development including biotechnology
for optimizing production and productivity from fisheries;� To provide modern infrastructure mechanisms for fisheries and ensure their
effective management and optimum utilization;� To generate substantial employment;� To train and empower women in the fisheries sector; and� To enhance contribution of fish towards food and nutritional security.
To achieve the aforesaid objectives, the Board envisages to take up the various
activities like Intensive aquaculture in ponds and tanks, Enhancing productivity from
Reservoir Fisheries, Coastal Aquaculture, Deep sea Fishing and Tuna Processing,
Mariculture, Sea Ranching, Seaweed Cultivation, Infrastructure for Post Harvest
Programmes, Fish Dressing Centres and Solar Drying of Fish, and Domestic Marketing. The
other proposed activities which NFDB may take up include trout culture, installation of
artificial fish habitats, fish aggregation devices, mahseer breeding and culture, ornamental
fish culture, mariculture of bivalves, marine pearl culture, setting up of aquaculture service
centres, fisheries service centres, etc.
Accordingly, the board started i) Setting up of SPF P. Monodon Multiplication Centre
at Srikakulam district of Andhra Pradesh, ii) Seed Stocking in 2106 reservoirs covering an
area of 7.95 lakh h.a. with 44.96 lakh fingerlings in 13 states, iii) 14 units of open Sea Cage
Culture demonstrating along the maritime states jointly with CMFRI, iv) Farming of Asian
Seabass, Lates Calcarifer in the ponds jointly with CIBA, v) Establishing Aquatic Animal
Quarantine facility at Chennai in association with Coastal Aquaculture Authority, MPEDA and
CIBA. Further, NFDB has taken up various HRD programmes jointly with various institutes
like ASCI, MANAGE, etc.
5. OTHER ISSUES:
5.1 The Coastal Aquaculture Authority Act, 2005 (24 of 2005)
5.2 Comprehensive Marine Fishing Policy:
5.3 Long term leasing policy for inland water bodies:
5.4 Uniform ban on fishing:
The Government of India enacted the Coastal Aquaculture Authority Act, 2005 (24 of
2005) on 23 June 2005 and established the Coastal Aquaculture Authority (CAA) vide
Notification No. S. O. 1803 (E) dated 22 December 2005 for regulating the activities
connected with aquaculture in coastal areas.
The main objective of the CAA is to regulate coastal aquaculture and to ensure
sustained increase in aquaculture production without causing damage to the coastal
enviroment. The Central Government has prescribed guidelines for regulating coastal
aquaculture to ensure that coastal aquaculture does not cause any detriment to the
environment.
One of the major tasks accomplished by the CAA was the registration of shrimp
farms on the recommendations of the States and District level Committees constituted for the
purpose.
Comprehensive Marine Fishing Policy 2004 has been launched in November 2004
to augment marine fish production of the country up to the sustainable level in a responsible
manner so as to boost export of sea food from the country and also to increase per capita fish
protein intake of the masses; to ensure socio-economic security of the artisanal fishermen
whose livelihood solely depends on this vocation; and. to ensure sustainable development of
marine fisheries with due concern for ecological integrity and bio-diversity. Suitable measures
are being taken up to implement this policy in the 11th Plan for over all development of the
marine fisheries sector.
Government of India continue to persuade the all stakeholders to have a long term
leasing policy to lease out the inland water bodies for longer period that is for 5 to 10 years to
attract investment from financial institutions. Accordingly, all the State Government / UT
Administration have been requested to make such policies and implement for development of
freshwater fisheries and aquaculture. Some states have started adopting such practices, but
others are yet to take initiatives in this regard.
There is utmost requirement to have uniform ban on fishing on both the coasts during
monsoon a season for breeding of fish. Guidelines and instructions have already been issued
to all the States / UTs. The matter was taken up in detail in the Conference of the State
Ministers of Fisheries in February 2007. There are some disputes between some states about
the date and the matter is being taken up to resolve this issue.
HANDBOOK ON FISHERIES STATISTICS 2008
170