Embed Size (px)
Citation preview
0.00
20.00
40.00
60.00
80.00
100.00
120.00
140.00
2005-06 2006-07 2007-08 2008-09 2009-10 2010-11 2011-12 2012-13 2013-14 2014-15 2015-16 2016-17 2017-18
28.1
6
30.2
4
29.2
0
29.7
8
31.0
4
32.5
0
33.7
2
33.2
1
34.4
3
35.6
9
36.0
0
36.2
5
36.8
8
37.5
6
38.4
5
42.0
7
46.3
8
48.9
4
49.8
1
52.9
4
57.1
9
61.3
6
66.9
1
71.6
2
78.0
6 89.0
2
65.7
2
68.6
9
71.2
7
76.1
6
79.9
8
82.3
1
86.6
6
90.4
0
95.7
9
102.
60
107.
62
114.
31 125.
90
(In La
kh to
nnes
)
year
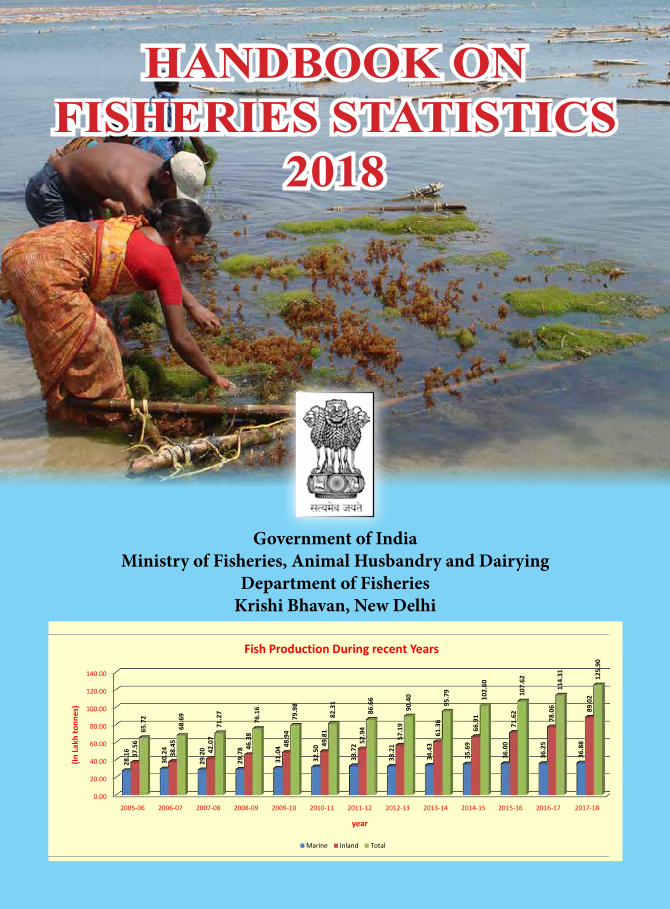
Fish Production During recent Years
Marine Inland Total
HANDBOOK ON FISHERIES STATISTICS
2018
Government of IndiaMinistry of Fisheries, Animal Husbandry and Dairying
Department of FisheriesKrishi Bhavan, New Delhi
HA
ND
BO
OK
ON
FIS
HE
RIE
S S
TA
TIS
TIC
S 2
01
8
Department of Fisheries Ministry of Fisheries, Animal Husbandry & Dairying
Govt. of India, New Delhi
September 2019
HANDBOOK ON FISHERIES STATISTICS
2018
Compiled by
Fisheries Statistics Division Department of Fisheries Ministry of Fisheries, Animal Husbandry & Dairying Government of India
Printed by Fishery Survey of India on behalf of Department of Fisheries
Printed at Onlooker Press, 16, Sassoon Dock, Mumbai - 400 005. Tel.: +91 22 2218 2939/ 3544, Email : [email protected]


i
CONTENTSTABLES Page
SECTION A : PRODUCTION AND DISPOSAL
A - 1: Fish Production in India for the Period - 1950-51 to 2017- 18 5A - 2: State/UT wise Inland and Marine Fish Production 2011-12 to 2017-18 8A - 3: State / Union Territory wise Fish Production 2011-12 to 2017-18 11A - 4: State / Union Territory wise Inland Fish Production 2011-12 to 2017-18 12A - 5: Species wise Marine Fish Landings By Coastal States and Union Territories, 2017 14A - 6 : Inland Fish Landings by Species by States/ Union Territories, 2017 18A - 7 : Disposition of Fish Catch, India, 1991to 2017 19A - 8 : Disposition of Fish Catch, India, 1991 to 2017 (Percentage Distribution) 21A - 9 : Disposition of Fish Catch by States/ Union Territories, 2017 23A - 10 : Preserved and Processed Commodities By States/ Union Territories, 2017 24A - 11 : Year Wise Fish Seed Production in India 27A - 12 : Fish Seed Production by States / Union Territories, 2005-06 to 2017-18 28
SECTION B : EXPORTS
B - 1 : Trend in Export of Marine Products - 1990-91 to 2017-18 33B - 2 : Item-wise Export of Marine Products - India, 2005-06 to 2017-18 35B - 3 : Export of Marine Products by Category (Percent Distribution) India, 2004-05 to 2017-18 37B - 4 : Market-wise Export of Marine Products, 2010-11 to 2017-18 38B - 5 : Value of Export of Marine Products, 2001-02 to 2017-18 40B - 6 : Port-wise Export of Marine Products, 2010- 11 to 2017-18 42
SECTION C : FISHING HARBOURS
C - 1 : Funds Released to Various Maritime State Governments/Uts and Port Trusts Under the Central Plan Schemes for Development of Fishing Harbours and Fish Landing Centres Since Inception of the Scheme in 1964.
49
C - 2 : Major Fishing Harbours at Major Ports 50C - 3 : Number of Major, Minor Fishing Harbours and Fish Landing Centres Commissioned/ Under
Construction by State / Union Territory wise till 2018-19 51
C - 4 : Fishing Harbours and Fish Landing Centres Constructed/Commissioned till 2017-18 52C - 5: Fishing Harbours and Fish Landing Centres Under Construction till 2017-18 56C - 6: State/ Union Territory wise details of Notified Fish Landing Centres by the Coastal State
Government and Union Territory (as on 31.03.2018)57
ii
TABLES PageSECTION D : FISHERIES INSTITUTES
D - 1: Manpower Trained in CIFNET, Kochi 61D - 2: Manpower Trained in CIFNET, Kochi in Ancillary Courses 62D - 3: Training of Overseas Candidates at CIFNET, Kochi 63D - 4: Achievement of National Institute of Fisheries Post Harvest, Technology and Training Project
2002-03 to 2017-1864
D - 5: Achievement of Central Institute of Fisheries Nautical and Engineering Training 2004-05 to 2017-18
66
D - 6 : Achievement of Fishery Survey of India 2004-05 to 2017-18 66
SECTION E : EXPENDITURE ON FISHERY SECTOR
E - 1 : Year wise Approved Outlay and Expenditure for Development of Fisheries Sector 2014-15 to 2018-19
69
E - 2 : Scheme wise Outlay and Expenditure 2007-08 to 2017-18 (For Fisheries Development) 70E - 3 : State/ Union Territory wise Fund Released for Development of Fisheries Sector 2010-11 to
2018-1972
E - 4.1 : State/ Union Territory wise New and Ongoing Projects Approved under RKVY in Fisheries Sector 2007-08 to 2014-15
73
E - 4.2 : State/ Union Territory wise Completed and Ongoing Projects Approved under RKVY in Fisheries Sector 2015-16 to 2019-20
74
E - 5 : Year wise Total Fund Released for Development of Fisheries Sector 2005-06 to 2017-18 78E - 6 : Expenditure on Fisheries Development from NFDB under State Sector Scheme 2007-08 to
2017-1882
SECTION F : FISHERY RESOURCES
F - 1 : Marine Fisheries Resources with Fishermen Population - Coastal States and Union Territories 85F - 2 : Inland Fisheries Resources by States and Union Territories, 2017-18 86F - 3 : Potential of Fisheries Resources in the Indian Exclusive Economic Zone 87
SECTION G : INTERNATIONAL SCENARIO
G - 1 : Contribution of India to World Fish Production in Selected years 91G -2 : Percentage Contribution of India to World Fish Production, Selected years 92G - 3 : Average Annual Growth Rate in Fish Production (Percentage) 93G - 4 : Major Countries for Inland Capture Fisheries, 2012 to 2016 94G - 5 : Major Countries for Marine Capture Fisheries, 2012 to 2016 95G - 6 : Capture Fisheries of different Countries, 2012 to 2016 96
iii
TABLES PageG - 7 : World Fisheries and Aquaculture Production and Utilization - 2011 to 2016 96G - 7.1 : Major Capture and Aquaculture Fish Producing Countries, 2016 97G - 8 : Major Importer/Exporters Countries of Fish and Fisheries Products 98G - 9 : Major Farm Seaweed Producers 99
SECTION H : PRICE INDICES
H : Indices of Wholesale Prices of Fish, Mutton, Food Article and All Commodities 103
SECTION I : LIST OF DISTRICTS, STATES/ UTs WITH THEIR CODES
I : Code List of States/ UTs and Districts 107
SECTION J : FISHERIES WELFARE
J- 1 : State wise Details of Fishermen Benefitted under the Central Sponsored Scheme on National Scheme of Welfare of Fishermen, 2012-13 to 2017-18
117
J - 2 : State wise Details of Fund Released under the Central Sponsored Scheme on National Scheme of Welfare of Fishermen, 2012-13 to 2017-18
119
SECTION K : MISCELLANEOUS
K -1 : Number of Fishermen Population Engaged in Fisheries Activities, 2017 123K -2 : Registration Status of Fishing Vessels and Fishing Crafts in Coastal States and Union
Territories (as on 31.07.2019)125
K -3 : State wise Culture Production of New Exportable Species, 2017-18 126K -4 : State wise Details of Shrimp Production 2017-18 127K -4.1 : Details of Brackishwater Area, Area Developed for Aquaculture, Area under Culture and
Production, 2017-18128
K -4.2 : Tiger Shrimp, L. Vannamei and Scampi Production 129K -4.3 : State wise Shrimp (Tiger Shrimp, L. Vannamei and Scampi) Production, 2008-09 to 2017-18 130K -4.4 : State wise Area Utilized and Production of Tiger Shrimp, 2008-09 to 2017-18 131K -4.5 : State wise Area Utilized and Production of L. Vannamei, 2009-10 to 2017-18 132K -4.6 : State wise Area Utilized and Production of Scampi, 2008-09 to 2015-16 133K -5 : Monthly per Capita Consumption of Fish and Prawns (Quantity) by States/ Union Territories 134K -6 : Gross Value Added by Economic Activity, 2011-12 to 2016-17 136K -7 : Central Assistance (NFDB) Extended for Setting of Fish Marketing Units, 2010-11 to 2017-18 137K -8 : Structure of Functional Fisheries Cooperatives National Level Cooperative State wise
Position145
iv
TABLES PageK -9 : Details of Projects Approved by NFDB for Setting up Post Harvest Infrastructure Facilities
under Sponsored Scheme, 2010-11 to 2017-18146
K -10 : Training Achievements of NFDB from 2010-11 to 2017-18 147
SECTION L : FISHERIES DEVELOPMENT
NOTE ON THE FISHERIES SECTOR IN THE COUNTRY 167
CHARTS
1. Fish Production 2005-06 to 2017-18 62. Percentage of Inland and Marine Fisheries 73. Major fish producing States, 2017-18 104. Marine fish producing States/UTs, 2017-18 115. Major Inland fish producing States, 2017-18 136. Year wise disposition of catch, 2013-2017 207. Percentage share of disposition of catch, 2017 228. Major fish producing Countries, 2016 269. Trend of marine fisheries export 3410. Growth rate of marine fisheries export 3411. Item-wise marine products export (quantity), 2017-18 3612. Item-wise marine products export (value), 2017-18 3613. Market-wise marine products export (quantity), 2017-18 3914. Market-wise marine products export (value), 2017-18 3915. Fisherfolk population in maritime States/ UTs, 2016 8516. Fishing vessels registered by coastal States/ UTs under real craft system 124
1
FIGURES AT A GLANCE
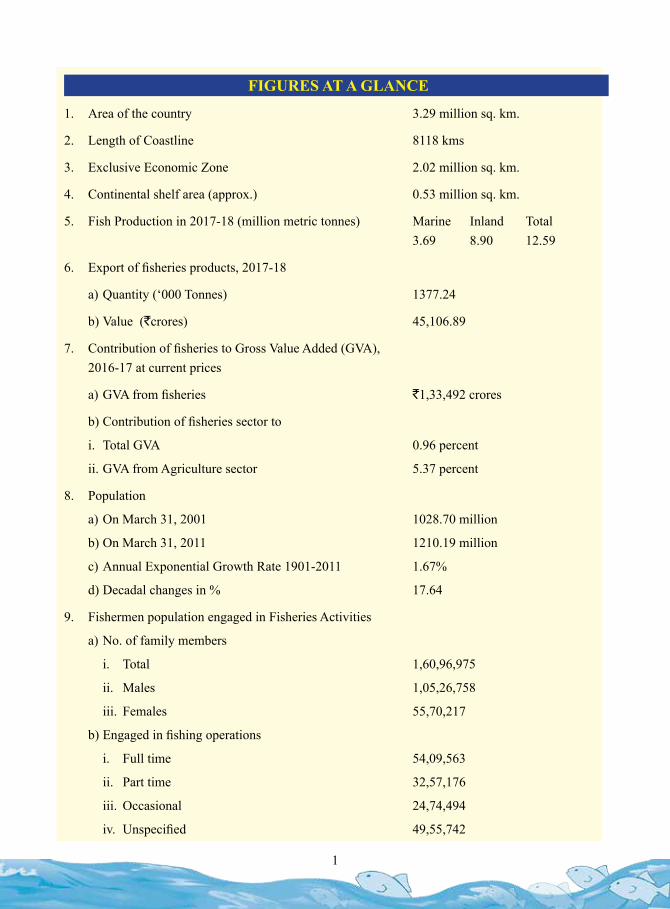
1. Area of the country 3.29 million sq. km.
2. Length of Coastline 8118 kms
3. Exclusive Economic Zone 2.02 million sq. km.
4. Continental shelf area (approx.) 0.53 million sq. km.
5. Fish Production in 2017-18 (million metric tonnes) Marine Inland Total 3.69 8.90 12.59
6. Export of fisheries products, 2017-18
a) Quantity (‘000 Tonnes) 1377.24
b) Value (`crores) 45,106.89
7. Contribution of fisheries to Gross Value Added (GVA), 2016-17 at current prices
a) GVA from fisheries `1,33,492 crores
b) Contribution of fisheries sector to
i. Total GVA 0.96 percent
ii. GVA from Agriculture sector 5.37 percent
8. Population
a) On March 31, 2001 1028.70 million
b) On March 31, 2011 1210.19 million
c) Annual Exponential Growth Rate 1901-2011 1.67%
d) Decadal changes in % 17.64
9. Fishermen population engaged in Fisheries Activities
a) No. of family members
i. Total 1,60,96,975
ii. Males 1,05,26,758
iii. Females 55,70,217
b) Engaged in fishing operations
i. Full time 54,09,563
ii. Part time 32,57,176
iii. Occasional 24,74,494
iv. Unspecified 49,55,742

SECTION : A
PRODUCTIONAND DISPOSAL
5
HANDBOOK ON FISHERIES STATISTICS 2018
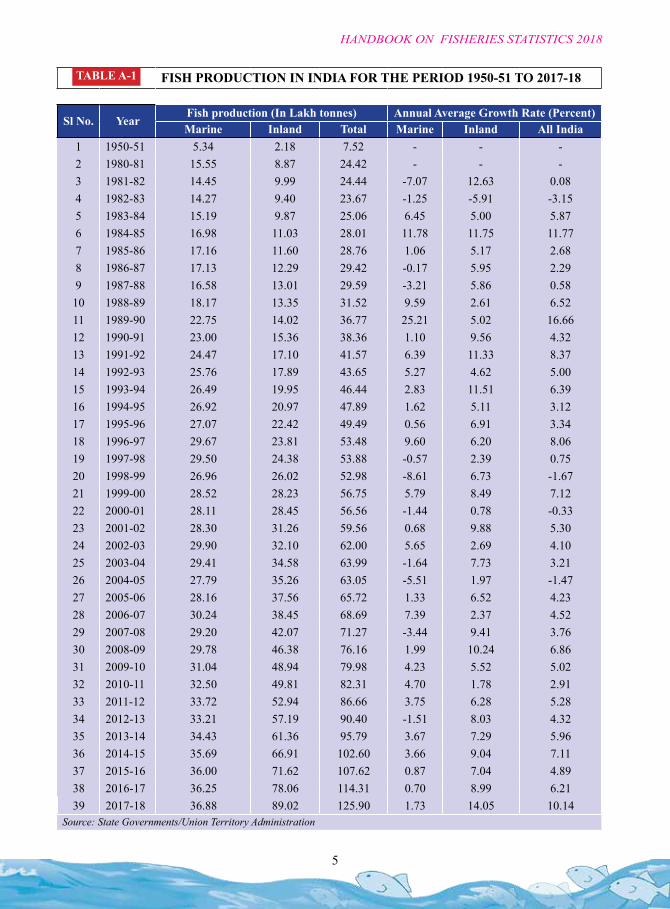
TABLE A-1 FISH PRODUCTION IN INDIA FOR THE PERIOD 1950-51 TO 2017-18
Sl No. YearFish production (In Lakh tonnes) Annual Average Growth Rate (Percent)Marine Inland Total Marine Inland All India
1 1950-51 5.34 2.18 7.52 - - -2 1980-81 15.55 8.87 24.42 - - -3 1981-82 14.45 9.99 24.44 -7.07 12.63 0.084 1982-83 14.27 9.40 23.67 -1.25 -5.91 -3.155 1983-84 15.19 9.87 25.06 6.45 5.00 5.876 1984-85 16.98 11.03 28.01 11.78 11.75 11.777 1985-86 17.16 11.60 28.76 1.06 5.17 2.688 1986-87 17.13 12.29 29.42 -0.17 5.95 2.299 1987-88 16.58 13.01 29.59 -3.21 5.86 0.58
10 1988-89 18.17 13.35 31.52 9.59 2.61 6.5211 1989-90 22.75 14.02 36.77 25.21 5.02 16.6612 1990-91 23.00 15.36 38.36 1.10 9.56 4.3213 1991-92 24.47 17.10 41.57 6.39 11.33 8.3714 1992-93 25.76 17.89 43.65 5.27 4.62 5.0015 1993-94 26.49 19.95 46.44 2.83 11.51 6.3916 1994-95 26.92 20.97 47.89 1.62 5.11 3.1217 1995-96 27.07 22.42 49.49 0.56 6.91 3.3418 1996-97 29.67 23.81 53.48 9.60 6.20 8.0619 1997-98 29.50 24.38 53.88 -0.57 2.39 0.7520 1998-99 26.96 26.02 52.98 -8.61 6.73 -1.6721 1999-00 28.52 28.23 56.75 5.79 8.49 7.1222 2000-01 28.11 28.45 56.56 -1.44 0.78 -0.3323 2001-02 28.30 31.26 59.56 0.68 9.88 5.3024 2002-03 29.90 32.10 62.00 5.65 2.69 4.1025 2003-04 29.41 34.58 63.99 -1.64 7.73 3.2126 2004-05 27.79 35.26 63.05 -5.51 1.97 -1.4727 2005-06 28.16 37.56 65.72 1.33 6.52 4.2328 2006-07 30.24 38.45 68.69 7.39 2.37 4.5229 2007-08 29.20 42.07 71.27 -3.44 9.41 3.7630 2008-09 29.78 46.38 76.16 1.99 10.24 6.8631 2009-10 31.04 48.94 79.98 4.23 5.52 5.0232 2010-11 32.50 49.81 82.31 4.70 1.78 2.9133 2011-12 33.72 52.94 86.66 3.75 6.28 5.2834 2012-13 33.21 57.19 90.40 -1.51 8.03 4.3235 2013-14 34.43 61.36 95.79 3.67 7.29 5.9636 2014-15 35.69 66.91 102.60 3.66 9.04 7.1137 2015-16 36.00 71.62 107.62 0.87 7.04 4.8938 2016-17 36.25 78.06 114.31 0.70 8.99 6.2139 2017-18 36.88 89.02 125.90 1.73 14.05 10.14
Source: State Governments/Union Territory Administration
6
HANDBOOK ON FISHERIES STATISTICS 2018
CH
AR
T: 1
FISH
PR
OD
UC
TIO
N D
UR
ING
RE
CE
NT
YE
AR
S (M
AR
INE
AN
D IN
LA
ND
)
0.00
20.0
0
40.0
0
60.0
0
80.0
0
100.
00
120.
00
140.
00
2005
-06
2006
-07
2007
-08
2008
-09
2009
-10
2010
-11
2011
-12
2012
-13
2013
-14
2014
-15
2015
-16
2016
-17
2017
-18
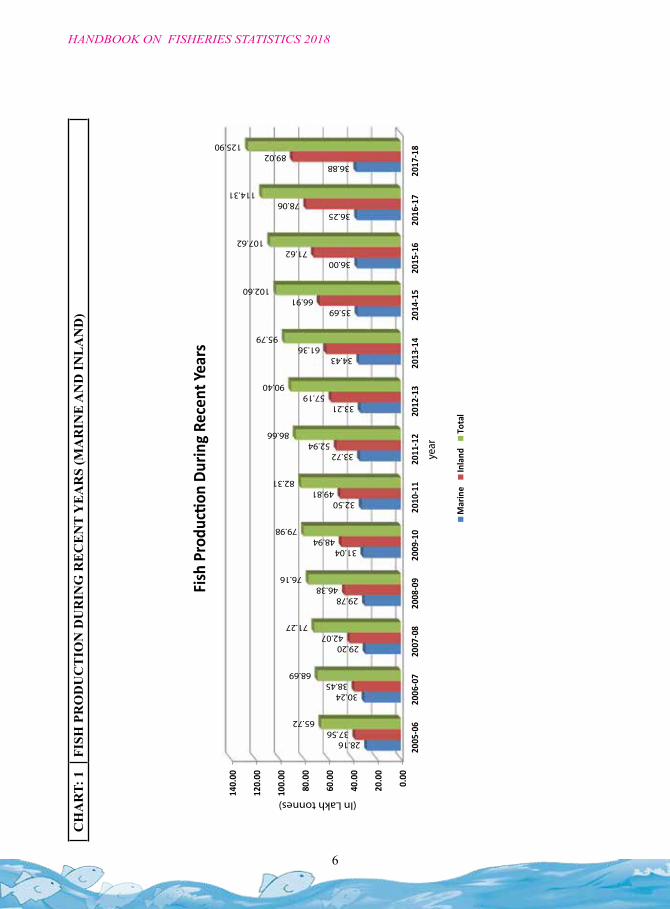
28.16
30.24
29.20
29.78
31.04
32.50
33.72
33.21
34.43
35.69
36.00
36.25
36.88
37.56
38.45
42.07
46.38
48.94
49.81
52.94
57.19
61.36
66.91
71.62
78.06
89.02
65.72
68.69
71.27
76.16
79.98
82.31
86.66
90.40
95.79
102.60
107.62
114.31
125.90
(In Lakh tonnes)
year
Fish
Pro
ducti
on D
urin
g Re
cent
Yea
rs
Mar
ine
Inla
ndTo
tal
7
HANDBOOK ON FISHERIES STATISTICS 2018
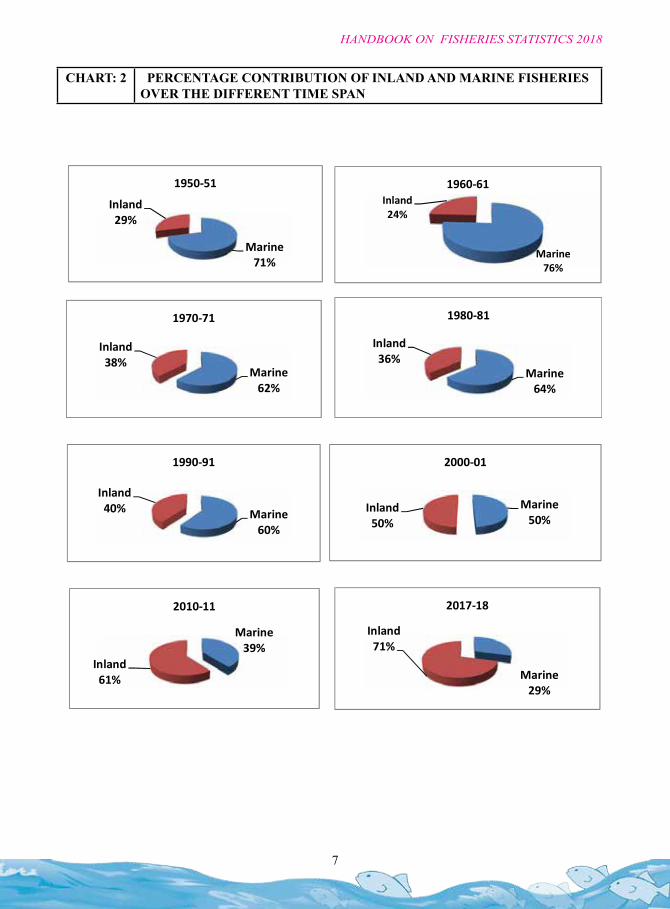
CHART: 2 PERCENTAGE CONTRIBUTION OF INLAND AND MARINE FISHERIES OVER THE DIFFERENT TIME SPAN
Marine 76%
Inland 24%
1960-61
Marine 39%
Inland 61%
2010-11
Marine 29%
Inland 71%
2017-18
Marine 71%
Inland 29%
1950-51
Marine 62%
Inland 38%
1970-71
Marine 64%
Inland 36%
1980-81
Marine 60%
Inland 40%
1990-91
Marine 50%
Inland 50%
2000-01
8
HANDBOOK ON FISHERIES STATISTICS 2018
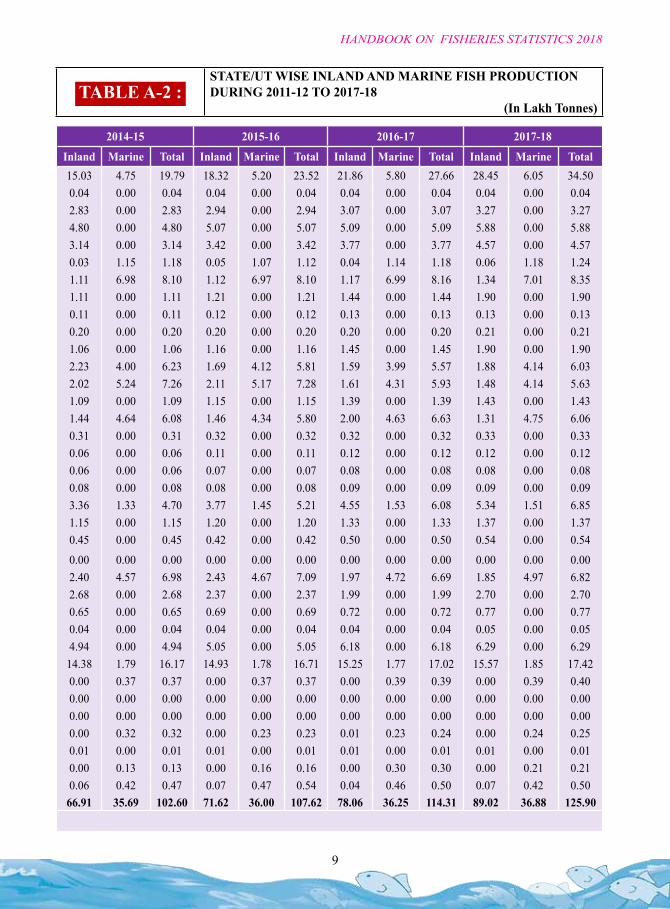
S. No. States/UTs2011-12 2012-13 2013-14 2014-15 2015-16 2016-17 2017-18
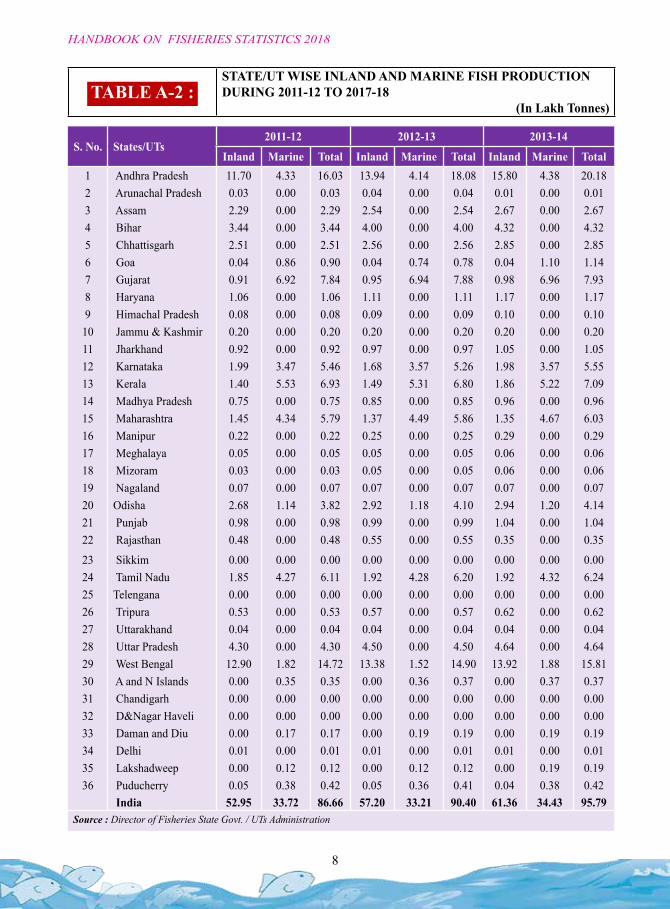
Inland Marine Total Inland Marine Total Inland Marine Total Inland Marine Total Inland Marine Total Inland Marine Total Inland Marine Total1 Andhra Pradesh 11.70 4.33 16.03 13.94 4.14 18.08 15.80 4.38 20.18 15.03 4.75 19.79 18.32 5.20 23.52 21.86 5.80 27.66 28.45 6.05 34.502 Arunachal Pradesh 0.03 0.00 0.03 0.04 0.00 0.04 0.01 0.00 0.01 0.04 0.00 0.04 0.04 0.00 0.04 0.04 0.00 0.04 0.04 0.00 0.043 Assam 2.29 0.00 2.29 2.54 0.00 2.54 2.67 0.00 2.67 2.83 0.00 2.83 2.94 0.00 2.94 3.07 0.00 3.07 3.27 0.00 3.274 Bihar 3.44 0.00 3.44 4.00 0.00 4.00 4.32 0.00 4.32 4.80 0.00 4.80 5.07 0.00 5.07 5.09 0.00 5.09 5.88 0.00 5.885 Chhattisgarh 2.51 0.00 2.51 2.56 0.00 2.56 2.85 0.00 2.85 3.14 0.00 3.14 3.42 0.00 3.42 3.77 0.00 3.77 4.57 0.00 4.576 Goa 0.04 0.86 0.90 0.04 0.74 0.78 0.04 1.10 1.14 0.03 1.15 1.18 0.05 1.07 1.12 0.04 1.14 1.18 0.06 1.18 1.247 Gujarat 0.91 6.92 7.84 0.95 6.94 7.88 0.98 6.96 7.93 1.11 6.98 8.10 1.12 6.97 8.10 1.17 6.99 8.16 1.34 7.01 8.358 Haryana 1.06 0.00 1.06 1.11 0.00 1.11 1.17 0.00 1.17 1.11 0.00 1.11 1.21 0.00 1.21 1.44 0.00 1.44 1.90 0.00 1.909 Himachal Pradesh 0.08 0.00 0.08 0.09 0.00 0.09 0.10 0.00 0.10 0.11 0.00 0.11 0.12 0.00 0.12 0.13 0.00 0.13 0.13 0.00 0.1310 Jammu & Kashmir 0.20 0.00 0.20 0.20 0.00 0.20 0.20 0.00 0.20 0.20 0.00 0.20 0.20 0.00 0.20 0.20 0.00 0.20 0.21 0.00 0.2111 Jharkhand 0.92 0.00 0.92 0.97 0.00 0.97 1.05 0.00 1.05 1.06 0.00 1.06 1.16 0.00 1.16 1.45 0.00 1.45 1.90 0.00 1.9012 Karnataka 1.99 3.47 5.46 1.68 3.57 5.26 1.98 3.57 5.55 2.23 4.00 6.23 1.69 4.12 5.81 1.59 3.99 5.57 1.88 4.14 6.0313 Kerala 1.40 5.53 6.93 1.49 5.31 6.80 1.86 5.22 7.09 2.02 5.24 7.26 2.11 5.17 7.28 1.61 4.31 5.93 1.48 4.14 5.6314 Madhya Pradesh 0.75 0.00 0.75 0.85 0.00 0.85 0.96 0.00 0.96 1.09 0.00 1.09 1.15 0.00 1.15 1.39 0.00 1.39 1.43 0.00 1.4315 Maharashtra 1.45 4.34 5.79 1.37 4.49 5.86 1.35 4.67 6.03 1.44 4.64 6.08 1.46 4.34 5.80 2.00 4.63 6.63 1.31 4.75 6.0616 Manipur 0.22 0.00 0.22 0.25 0.00 0.25 0.29 0.00 0.29 0.31 0.00 0.31 0.32 0.00 0.32 0.32 0.00 0.32 0.33 0.00 0.3317 Meghalaya 0.05 0.00 0.05 0.05 0.00 0.05 0.06 0.00 0.06 0.06 0.00 0.06 0.11 0.00 0.11 0.12 0.00 0.12 0.12 0.00 0.1218 Mizoram 0.03 0.00 0.03 0.05 0.00 0.05 0.06 0.00 0.06 0.06 0.00 0.06 0.07 0.00 0.07 0.08 0.00 0.08 0.08 0.00 0.0819 Nagaland 0.07 0.00 0.07 0.07 0.00 0.07 0.07 0.00 0.07 0.08 0.00 0.08 0.08 0.00 0.08 0.09 0.00 0.09 0.09 0.00 0.0920 Odisha 2.68 1.14 3.82 2.92 1.18 4.10 2.94 1.20 4.14 3.36 1.33 4.70 3.77 1.45 5.21 4.55 1.53 6.08 5.34 1.51 6.8521 Punjab 0.98 0.00 0.98 0.99 0.00 0.99 1.04 0.00 1.04 1.15 0.00 1.15 1.20 0.00 1.20 1.33 0.00 1.33 1.37 0.00 1.3722 Rajasthan 0.48 0.00 0.48 0.55 0.00 0.55 0.35 0.00 0.35 0.45 0.00 0.45 0.42 0.00 0.42 0.50 0.00 0.50 0.54 0.00 0.54
23 Sikkim 0.00 0.00 0.00 0.00 0.00 0.00 0.00 0.00 0.00 0.00 0.00 0.00 0.00 0.00 0.00 0.00 0.00 0.00 0.00 0.00 0.0024 Tamil Nadu 1.85 4.27 6.11 1.92 4.28 6.20 1.92 4.32 6.24 2.40 4.57 6.98 2.43 4.67 7.09 1.97 4.72 6.69 1.85 4.97 6.8225 Telengana 0.00 0.00 0.00 0.00 0.00 0.00 0.00 0.00 0.00 2.68 0.00 2.68 2.37 0.00 2.37 1.99 0.00 1.99 2.70 0.00 2.7026 Tripura 0.53 0.00 0.53 0.57 0.00 0.57 0.62 0.00 0.62 0.65 0.00 0.65 0.69 0.00 0.69 0.72 0.00 0.72 0.77 0.00 0.7727 Uttarakhand 0.04 0.00 0.04 0.04 0.00 0.04 0.04 0.00 0.04 0.04 0.00 0.04 0.04 0.00 0.04 0.04 0.00 0.04 0.05 0.00 0.0528 Uttar Pradesh 4.30 0.00 4.30 4.50 0.00 4.50 4.64 0.00 4.64 4.94 0.00 4.94 5.05 0.00 5.05 6.18 0.00 6.18 6.29 0.00 6.2929 West Bengal 12.90 1.82 14.72 13.38 1.52 14.90 13.92 1.88 15.81 14.38 1.79 16.17 14.93 1.78 16.71 15.25 1.77 17.02 15.57 1.85 17.4230 A and N Islands 0.00 0.35 0.35 0.00 0.36 0.37 0.00 0.37 0.37 0.00 0.37 0.37 0.00 0.37 0.37 0.00 0.39 0.39 0.00 0.39 0.4031 Chandigarh 0.00 0.00 0.00 0.00 0.00 0.00 0.00 0.00 0.00 0.00 0.00 0.00 0.00 0.00 0.00 0.00 0.00 0.00 0.00 0.00 0.0032 D&Nagar Haveli 0.00 0.00 0.00 0.00 0.00 0.00 0.00 0.00 0.00 0.00 0.00 0.00 0.00 0.00 0.00 0.00 0.00 0.00 0.00 0.00 0.0033 Daman and Diu 0.00 0.17 0.17 0.00 0.19 0.19 0.00 0.19 0.19 0.00 0.32 0.32 0.00 0.23 0.23 0.01 0.23 0.24 0.00 0.24 0.2534 Delhi 0.01 0.00 0.01 0.01 0.00 0.01 0.01 0.00 0.01 0.01 0.00 0.01 0.01 0.00 0.01 0.01 0.00 0.01 0.01 0.00 0.0135 Lakshadweep 0.00 0.12 0.12 0.00 0.12 0.12 0.00 0.19 0.19 0.00 0.13 0.13 0.00 0.16 0.16 0.00 0.30 0.30 0.00 0.21 0.2136 Puducherry 0.05 0.38 0.42 0.05 0.36 0.41 0.04 0.38 0.42 0.06 0.42 0.47 0.07 0.47 0.54 0.04 0.46 0.50 0.07 0.42 0.50
India 52.95 33.72 86.66 57.20 33.21 90.40 61.36 34.43 95.79 66.91 35.69 102.60 71.62 36.00 107.62 78.06 36.25 114.31 89.02 36.88 125.90Source : Director of Fisheries State Govt. / UTs Administration
TABLE A-2 : STATE/UT WISE INLAND AND MARINE FISH PRODUCTION DURING 2011-12 TO 2017-18
(In Lakh Tonnes)
9
HANDBOOK ON FISHERIES STATISTICS 2018
S. No. States/UTs2011-12 2012-13 2013-14 2014-15 2015-16 2016-17 2017-18
Inland Marine Total Inland Marine Total Inland Marine Total Inland Marine Total Inland Marine Total Inland Marine Total Inland Marine Total1 Andhra Pradesh 11.70 4.33 16.03 13.94 4.14 18.08 15.80 4.38 20.18 15.03 4.75 19.79 18.32 5.20 23.52 21.86 5.80 27.66 28.45 6.05 34.502 Arunachal Pradesh 0.03 0.00 0.03 0.04 0.00 0.04 0.01 0.00 0.01 0.04 0.00 0.04 0.04 0.00 0.04 0.04 0.00 0.04 0.04 0.00 0.043 Assam 2.29 0.00 2.29 2.54 0.00 2.54 2.67 0.00 2.67 2.83 0.00 2.83 2.94 0.00 2.94 3.07 0.00 3.07 3.27 0.00 3.274 Bihar 3.44 0.00 3.44 4.00 0.00 4.00 4.32 0.00 4.32 4.80 0.00 4.80 5.07 0.00 5.07 5.09 0.00 5.09 5.88 0.00 5.885 Chhattisgarh 2.51 0.00 2.51 2.56 0.00 2.56 2.85 0.00 2.85 3.14 0.00 3.14 3.42 0.00 3.42 3.77 0.00 3.77 4.57 0.00 4.576 Goa 0.04 0.86 0.90 0.04 0.74 0.78 0.04 1.10 1.14 0.03 1.15 1.18 0.05 1.07 1.12 0.04 1.14 1.18 0.06 1.18 1.247 Gujarat 0.91 6.92 7.84 0.95 6.94 7.88 0.98 6.96 7.93 1.11 6.98 8.10 1.12 6.97 8.10 1.17 6.99 8.16 1.34 7.01 8.358 Haryana 1.06 0.00 1.06 1.11 0.00 1.11 1.17 0.00 1.17 1.11 0.00 1.11 1.21 0.00 1.21 1.44 0.00 1.44 1.90 0.00 1.909 Himachal Pradesh 0.08 0.00 0.08 0.09 0.00 0.09 0.10 0.00 0.10 0.11 0.00 0.11 0.12 0.00 0.12 0.13 0.00 0.13 0.13 0.00 0.13
10 Jammu & Kashmir 0.20 0.00 0.20 0.20 0.00 0.20 0.20 0.00 0.20 0.20 0.00 0.20 0.20 0.00 0.20 0.20 0.00 0.20 0.21 0.00 0.2111 Jharkhand 0.92 0.00 0.92 0.97 0.00 0.97 1.05 0.00 1.05 1.06 0.00 1.06 1.16 0.00 1.16 1.45 0.00 1.45 1.90 0.00 1.9012 Karnataka 1.99 3.47 5.46 1.68 3.57 5.26 1.98 3.57 5.55 2.23 4.00 6.23 1.69 4.12 5.81 1.59 3.99 5.57 1.88 4.14 6.0313 Kerala 1.40 5.53 6.93 1.49 5.31 6.80 1.86 5.22 7.09 2.02 5.24 7.26 2.11 5.17 7.28 1.61 4.31 5.93 1.48 4.14 5.6314 Madhya Pradesh 0.75 0.00 0.75 0.85 0.00 0.85 0.96 0.00 0.96 1.09 0.00 1.09 1.15 0.00 1.15 1.39 0.00 1.39 1.43 0.00 1.4315 Maharashtra 1.45 4.34 5.79 1.37 4.49 5.86 1.35 4.67 6.03 1.44 4.64 6.08 1.46 4.34 5.80 2.00 4.63 6.63 1.31 4.75 6.0616 Manipur 0.22 0.00 0.22 0.25 0.00 0.25 0.29 0.00 0.29 0.31 0.00 0.31 0.32 0.00 0.32 0.32 0.00 0.32 0.33 0.00 0.3317 Meghalaya 0.05 0.00 0.05 0.05 0.00 0.05 0.06 0.00 0.06 0.06 0.00 0.06 0.11 0.00 0.11 0.12 0.00 0.12 0.12 0.00 0.1218 Mizoram 0.03 0.00 0.03 0.05 0.00 0.05 0.06 0.00 0.06 0.06 0.00 0.06 0.07 0.00 0.07 0.08 0.00 0.08 0.08 0.00 0.0819 Nagaland 0.07 0.00 0.07 0.07 0.00 0.07 0.07 0.00 0.07 0.08 0.00 0.08 0.08 0.00 0.08 0.09 0.00 0.09 0.09 0.00 0.0920 Odisha 2.68 1.14 3.82 2.92 1.18 4.10 2.94 1.20 4.14 3.36 1.33 4.70 3.77 1.45 5.21 4.55 1.53 6.08 5.34 1.51 6.8521 Punjab 0.98 0.00 0.98 0.99 0.00 0.99 1.04 0.00 1.04 1.15 0.00 1.15 1.20 0.00 1.20 1.33 0.00 1.33 1.37 0.00 1.3722 Rajasthan 0.48 0.00 0.48 0.55 0.00 0.55 0.35 0.00 0.35 0.45 0.00 0.45 0.42 0.00 0.42 0.50 0.00 0.50 0.54 0.00 0.54
23 Sikkim 0.00 0.00 0.00 0.00 0.00 0.00 0.00 0.00 0.00 0.00 0.00 0.00 0.00 0.00 0.00 0.00 0.00 0.00 0.00 0.00 0.0024 Tamil Nadu 1.85 4.27 6.11 1.92 4.28 6.20 1.92 4.32 6.24 2.40 4.57 6.98 2.43 4.67 7.09 1.97 4.72 6.69 1.85 4.97 6.8225 Telengana 0.00 0.00 0.00 0.00 0.00 0.00 0.00 0.00 0.00 2.68 0.00 2.68 2.37 0.00 2.37 1.99 0.00 1.99 2.70 0.00 2.7026 Tripura 0.53 0.00 0.53 0.57 0.00 0.57 0.62 0.00 0.62 0.65 0.00 0.65 0.69 0.00 0.69 0.72 0.00 0.72 0.77 0.00 0.7727 Uttarakhand 0.04 0.00 0.04 0.04 0.00 0.04 0.04 0.00 0.04 0.04 0.00 0.04 0.04 0.00 0.04 0.04 0.00 0.04 0.05 0.00 0.0528 Uttar Pradesh 4.30 0.00 4.30 4.50 0.00 4.50 4.64 0.00 4.64 4.94 0.00 4.94 5.05 0.00 5.05 6.18 0.00 6.18 6.29 0.00 6.2929 West Bengal 12.90 1.82 14.72 13.38 1.52 14.90 13.92 1.88 15.81 14.38 1.79 16.17 14.93 1.78 16.71 15.25 1.77 17.02 15.57 1.85 17.4230 A and N Islands 0.00 0.35 0.35 0.00 0.36 0.37 0.00 0.37 0.37 0.00 0.37 0.37 0.00 0.37 0.37 0.00 0.39 0.39 0.00 0.39 0.4031 Chandigarh 0.00 0.00 0.00 0.00 0.00 0.00 0.00 0.00 0.00 0.00 0.00 0.00 0.00 0.00 0.00 0.00 0.00 0.00 0.00 0.00 0.0032 D&Nagar Haveli 0.00 0.00 0.00 0.00 0.00 0.00 0.00 0.00 0.00 0.00 0.00 0.00 0.00 0.00 0.00 0.00 0.00 0.00 0.00 0.00 0.0033 Daman and Diu 0.00 0.17 0.17 0.00 0.19 0.19 0.00 0.19 0.19 0.00 0.32 0.32 0.00 0.23 0.23 0.01 0.23 0.24 0.00 0.24 0.2534 Delhi 0.01 0.00 0.01 0.01 0.00 0.01 0.01 0.00 0.01 0.01 0.00 0.01 0.01 0.00 0.01 0.01 0.00 0.01 0.01 0.00 0.0135 Lakshadweep 0.00 0.12 0.12 0.00 0.12 0.12 0.00 0.19 0.19 0.00 0.13 0.13 0.00 0.16 0.16 0.00 0.30 0.30 0.00 0.21 0.2136 Puducherry 0.05 0.38 0.42 0.05 0.36 0.41 0.04 0.38 0.42 0.06 0.42 0.47 0.07 0.47 0.54 0.04 0.46 0.50 0.07 0.42 0.50
India 52.95 33.72 86.66 57.20 33.21 90.40 61.36 34.43 95.79 66.91 35.69 102.60 71.62 36.00 107.62 78.06 36.25 114.31 89.02 36.88 125.90Source : Director of Fisheries State Govt. / UTs Administration
TABLE A-2 : STATE/UT WISE INLAND AND MARINE FISH PRODUCTION DURING 2011-12 TO 2017-18
(In Lakh Tonnes)
10
HANDBOOK ON FISHERIES STATISTICS 2018
CH
AR
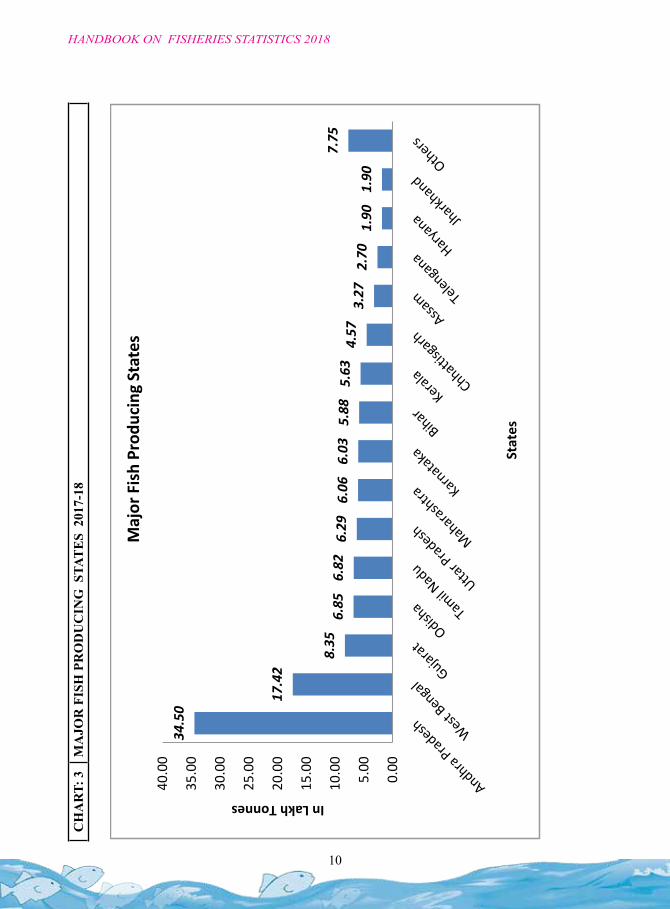
T: 3
MA
JOR
FIS
H P
RO
DU
CIN
G S
TAT
ES
201
7-18
34.5
0
17.4
2
8.35
6.85
6.82
6.29
6.06
6.03
5.88
5.63
4.57
3.27
2.70
1.90
1.90
7.75
0.00
5.00
10.0
0
15.0
0
20.0
0
25.0
0
30.0
0
35.0
0
40.0
0
In Lakh Tonnes
Stat
es
Maj
or F
ish
Prod
ucin
g St
ates
11
HANDBOOK ON FISHERIES STATISTICS 2018
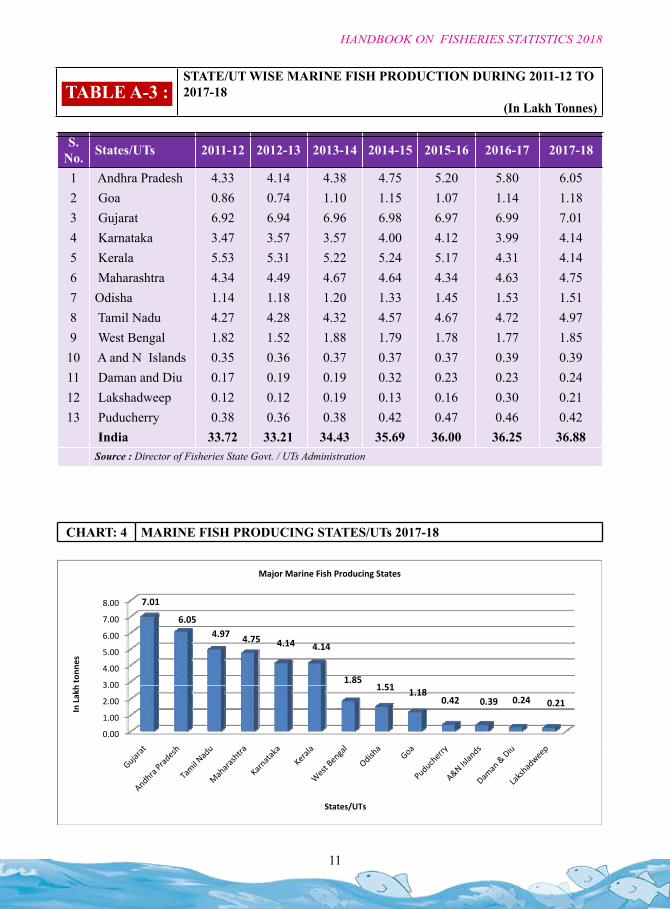
S. No. States/UTs 2011-12 2012-13 2013-14 2014-15 2015-16 2016-17 2017-18
1 Andhra Pradesh 4.33 4.14 4.38 4.75 5.20 5.80 6.052 Goa 0.86 0.74 1.10 1.15 1.07 1.14 1.183 Gujarat 6.92 6.94 6.96 6.98 6.97 6.99 7.014 Karnataka 3.47 3.57 3.57 4.00 4.12 3.99 4.145 Kerala 5.53 5.31 5.22 5.24 5.17 4.31 4.146 Maharashtra 4.34 4.49 4.67 4.64 4.34 4.63 4.757 Odisha 1.14 1.18 1.20 1.33 1.45 1.53 1.518 Tamil Nadu 4.27 4.28 4.32 4.57 4.67 4.72 4.979 West Bengal 1.82 1.52 1.88 1.79 1.78 1.77 1.85
10 A and N Islands 0.35 0.36 0.37 0.37 0.37 0.39 0.3911 Daman and Diu 0.17 0.19 0.19 0.32 0.23 0.23 0.2412 Lakshadweep 0.12 0.12 0.19 0.13 0.16 0.30 0.2113 Puducherry 0.38 0.36 0.38 0.42 0.47 0.46 0.42
India 33.72 33.21 34.43 35.69 36.00 36.25 36.88Source : Director of Fisheries State Govt. / UTs Administration
TABLE A-3 : STATE/UT WISE MARINE FISH PRODUCTION DURING 2011-12 TO 2017-18
(In Lakh Tonnes)
CHART: 4 MARINE FISH PRODUCING STATES/UTs 2017-18CHART ‐4 : MARINE FISH PRODUCING STATES 2017‐18
7 00
8.00 7.01
6 05
Major Marine Fish Producing States
3 00
4.00
5.00
6.00
7.00 6.054.97 4.75 4.14 4.14
1.851 51 to
nnes
0.00
1.00
2.00
3.00 1.51 1.180.42 0.39 0.24 0.21
In Lakh
States/UTs
12
HANDBOOK ON FISHERIES STATISTICS 2018
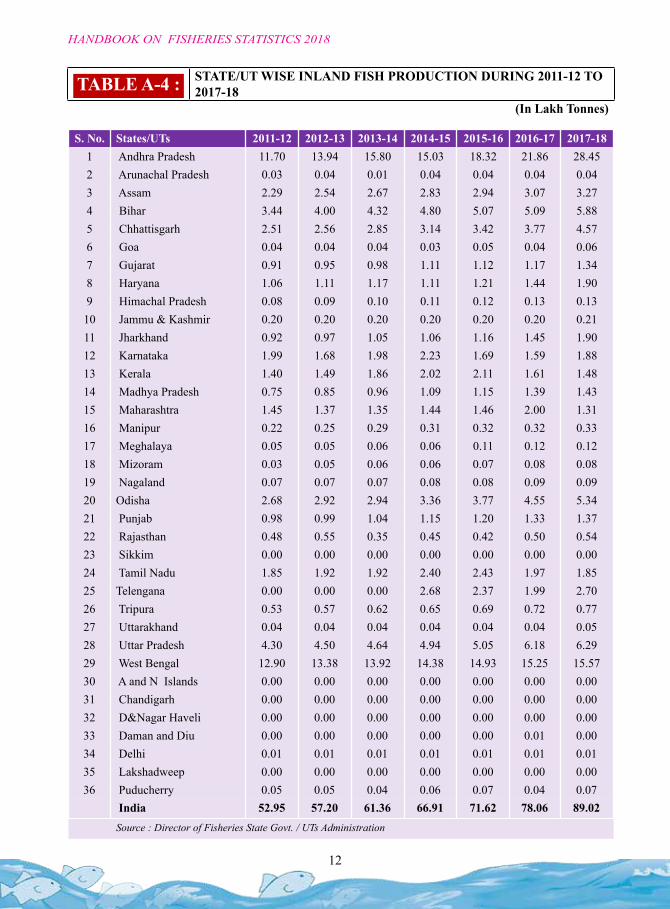
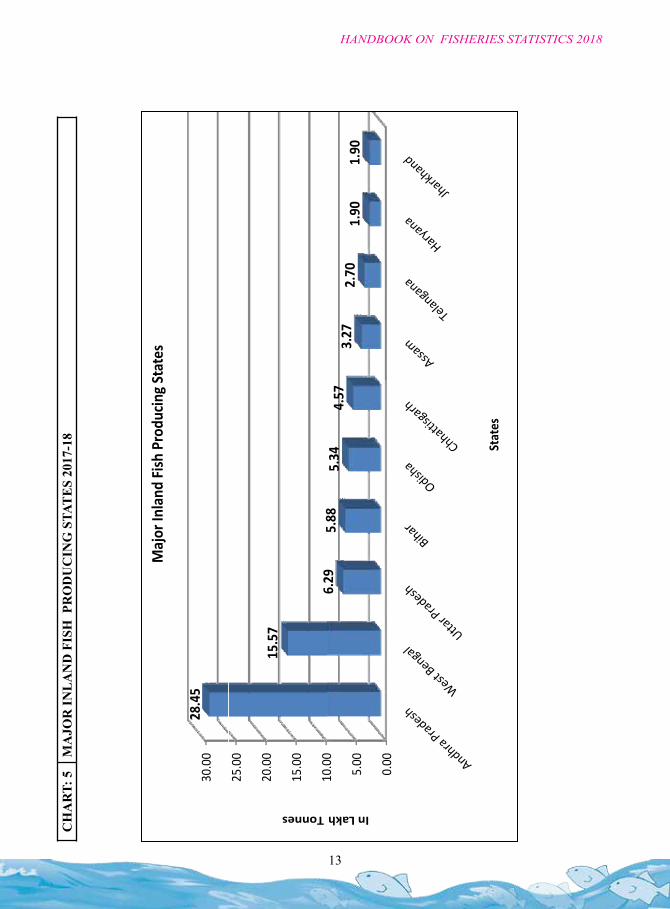
S. No. States/UTs 2011-12 2012-13 2013-14 2014-15 2015-16 2016-17 2017-181 Andhra Pradesh 11.70 13.94 15.80 15.03 18.32 21.86 28.452 Arunachal Pradesh 0.03 0.04 0.01 0.04 0.04 0.04 0.043 Assam 2.29 2.54 2.67 2.83 2.94 3.07 3.274 Bihar 3.44 4.00 4.32 4.80 5.07 5.09 5.885 Chhattisgarh 2.51 2.56 2.85 3.14 3.42 3.77 4.576 Goa 0.04 0.04 0.04 0.03 0.05 0.04 0.067 Gujarat 0.91 0.95 0.98 1.11 1.12 1.17 1.348 Haryana 1.06 1.11 1.17 1.11 1.21 1.44 1.909 Himachal Pradesh 0.08 0.09 0.10 0.11 0.12 0.13 0.1310 Jammu & Kashmir 0.20 0.20 0.20 0.20 0.20 0.20 0.2111 Jharkhand 0.92 0.97 1.05 1.06 1.16 1.45 1.9012 Karnataka 1.99 1.68 1.98 2.23 1.69 1.59 1.8813 Kerala 1.40 1.49 1.86 2.02 2.11 1.61 1.4814 Madhya Pradesh 0.75 0.85 0.96 1.09 1.15 1.39 1.4315 Maharashtra 1.45 1.37 1.35 1.44 1.46 2.00 1.3116 Manipur 0.22 0.25 0.29 0.31 0.32 0.32 0.3317 Meghalaya 0.05 0.05 0.06 0.06 0.11 0.12 0.1218 Mizoram 0.03 0.05 0.06 0.06 0.07 0.08 0.0819 Nagaland 0.07 0.07 0.07 0.08 0.08 0.09 0.0920 Odisha 2.68 2.92 2.94 3.36 3.77 4.55 5.3421 Punjab 0.98 0.99 1.04 1.15 1.20 1.33 1.3722 Rajasthan 0.48 0.55 0.35 0.45 0.42 0.50 0.5423 Sikkim 0.00 0.00 0.00 0.00 0.00 0.00 0.0024 Tamil Nadu 1.85 1.92 1.92 2.40 2.43 1.97 1.8525 Telengana 0.00 0.00 0.00 2.68 2.37 1.99 2.7026 Tripura 0.53 0.57 0.62 0.65 0.69 0.72 0.7727 Uttarakhand 0.04 0.04 0.04 0.04 0.04 0.04 0.0528 Uttar Pradesh 4.30 4.50 4.64 4.94 5.05 6.18 6.2929 West Bengal 12.90 13.38 13.92 14.38 14.93 15.25 15.5730 A and N Islands 0.00 0.00 0.00 0.00 0.00 0.00 0.0031 Chandigarh 0.00 0.00 0.00 0.00 0.00 0.00 0.0032 D&Nagar Haveli 0.00 0.00 0.00 0.00 0.00 0.00 0.0033 Daman and Diu 0.00 0.00 0.00 0.00 0.00 0.01 0.0034 Delhi 0.01 0.01 0.01 0.01 0.01 0.01 0.0135 Lakshadweep 0.00 0.00 0.00 0.00 0.00 0.00 0.0036 Puducherry 0.05 0.05 0.04 0.06 0.07 0.04 0.07
India 52.95 57.20 61.36 66.91 71.62 78.06 89.02Source : Director of Fisheries State Govt. / UTs Administration
TABLE A-4 : STATE/UT WISE INLAND FISH PRODUCTION DURING 2011-12 TO 2017-18
(In Lakh Tonnes)
13
HANDBOOK ON FISHERIES STATISTICS 2018
CH
AR
T: 5
MA
JOR
INLA
ND
FIS
H P
RO
DU
CIN
G S
TATE
S 20
17-1
8
30.0
028
.45
Maj
or In
land
Fis
h Pr
oduc
ing
Stat
es
1000
15.0
0
20.0
0
25.0
0
15.5
7
629
588
Tonnes
0.00
5.00
10.0
06.
295.
885.
344.
573.
272.
701.
901.
90
In Lakh
Stat
es
14
HANDBOOK ON FISHERIES STATISTICS 2018
INDIAN OCEAN EAST INDIAN OCEAN WEST
S. No. Species Andhra
Pradesh Odisha Tamil Nadu
West Bengal
A&N Islands Pondicherry Total Goa Gujarat Karnataka Kerala Maharashtra Daman & Diu Lakshadweep Total Total for
India
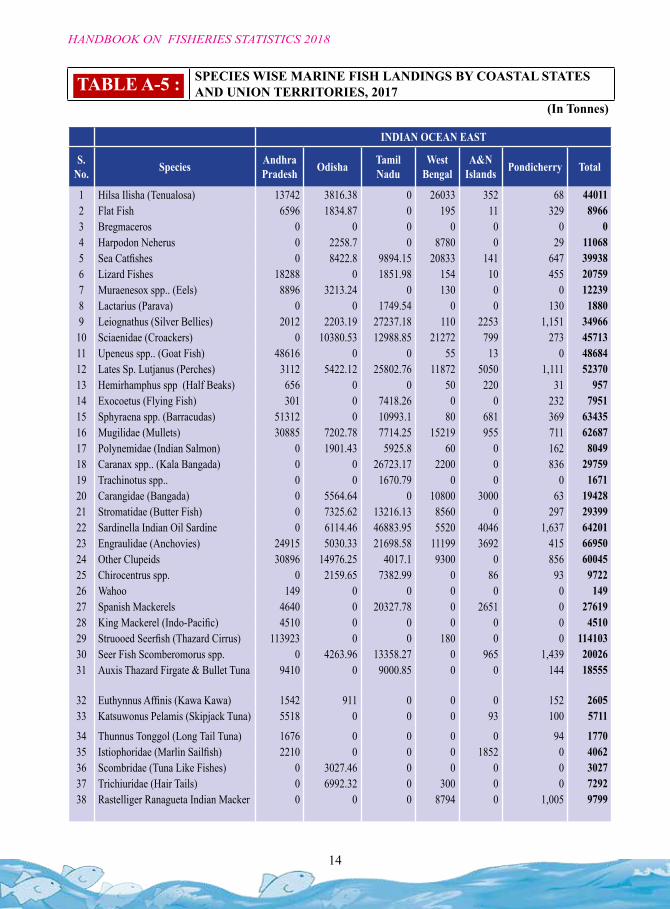
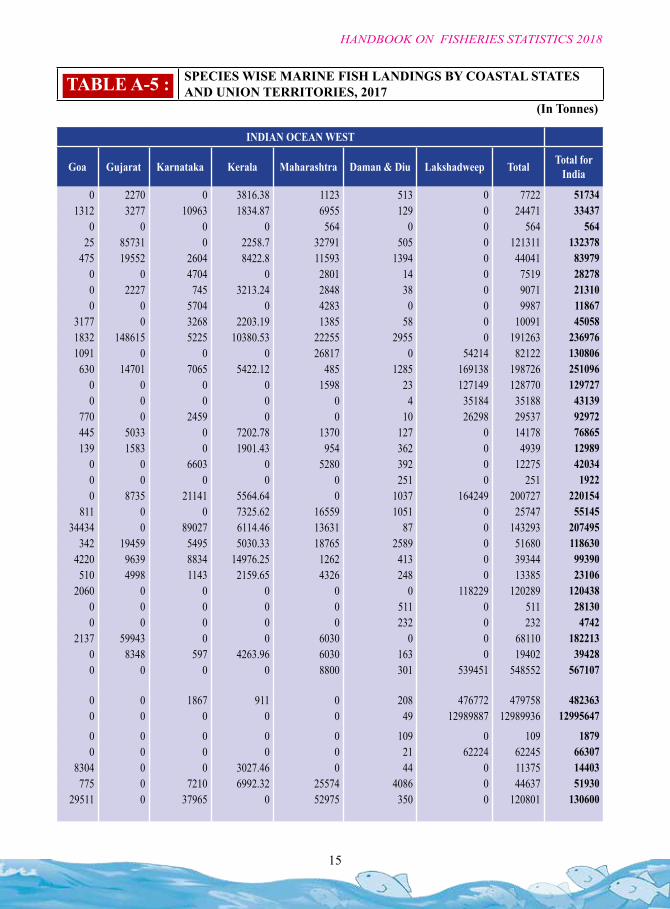
1 Hilsa Ilisha (Tenualosa) 13742 3816.38 0 26033 352 68 44011 0 2270 0 3816.38 1123 513 0 7722 517342 Flat Fish 6596 1834.87 0 195 11 329 8966 1312 3277 10963 1834.87 6955 129 0 24471 334373 Bregmaceros 0 0 0 0 0 0 0 0 0 0 0 564 0 0 564 5644 Harpodon Neherus 0 2258.7 0 8780 0 29 11068 25 85731 0 2258.7 32791 505 0 121311 1323785 Sea Catfishes 0 8422.8 9894.15 20833 141 647 39938 475 19552 2604 8422.8 11593 1394 0 44041 839796 Lizard Fishes 18288 0 1851.98 154 10 455 20759 0 0 4704 0 2801 14 0 7519 282787 Muraenesox spp.. (Eels) 8896 3213.24 0 130 0 0 12239 0 2227 745 3213.24 2848 38 0 9071 213108 Lactarius (Parava) 0 0 1749.54 0 0 130 1880 0 0 5704 0 4283 0 0 9987 118679 Leiognathus (Silver Bellies) 2012 2203.19 27237.18 110 2253 1,151 34966 3177 0 3268 2203.19 1385 58 0 10091 4505810 Sciaenidae (Croackers) 0 10380.53 12988.85 21272 799 273 45713 1832 148615 5225 10380.53 22255 2955 0 191263 23697611 Upeneus spp.. (Goat Fish) 48616 0 0 55 13 0 48684 1091 0 0 0 26817 0 54214 82122 13080612 Lates Sp. Lutjanus (Perches) 3112 5422.12 25802.76 11872 5050 1,111 52370 630 14701 7065 5422.12 485 1285 169138 198726 25109613 Hemirhamphus spp (Half Beaks) 656 0 0 50 220 31 957 0 0 0 0 1598 23 127149 128770 12972714 Exocoetus (Flying Fish) 301 0 7418.26 0 0 232 7951 0 0 0 0 0 4 35184 35188 4313915 Sphyraena spp. (Barracudas) 51312 0 10993.1 80 681 369 63435 770 0 2459 0 0 10 26298 29537 9297216 Mugilidae (Mullets) 30885 7202.78 7714.25 15219 955 711 62687 445 5033 0 7202.78 1370 127 0 14178 7686517 Polynemidae (Indian Salmon) 0 1901.43 5925.8 60 0 162 8049 139 1583 0 1901.43 954 362 0 4939 1298918 Caranax spp.. (Kala Bangada) 0 0 26723.17 2200 0 836 29759 0 0 6603 0 5280 392 0 12275 4203419 Trachinotus spp.. 0 0 1670.79 0 0 0 1671 0 0 0 0 0 251 0 251 192220 Carangidae (Bangada) 0 5564.64 0 10800 3000 63 19428 0 8735 21141 5564.64 0 1037 164249 200727 22015421 Stromatidae (Butter Fish) 0 7325.62 13216.13 8560 0 297 29399 811 0 0 7325.62 16559 1051 0 25747 5514522 Sardinella Indian Oil Sardine 0 6114.46 46883.95 5520 4046 1,637 64201 34434 0 89027 6114.46 13631 87 0 143293 20749523 Engraulidae (Anchovies) 24915 5030.33 21698.58 11199 3692 415 66950 342 19459 5495 5030.33 18765 2589 0 51680 11863024 Other Clupeids 30896 14976.25 4017.1 9300 0 856 60045 4220 9639 8834 14976.25 1262 413 0 39344 9939025 Chirocentrus spp. 0 2159.65 7382.99 0 86 93 9722 510 4998 1143 2159.65 4326 248 0 13385 2310626 Wahoo 149 0 0 0 0 0 149 2060 0 0 0 0 0 118229 120289 12043827 Spanish Mackerels 4640 0 20327.78 0 2651 0 27619 0 0 0 0 0 511 0 511 2813028 King Mackerel (Indo-Pacific) 4510 0 0 0 0 0 4510 0 0 0 0 0 232 0 232 474229 Struooed Seerfish (Thazard Cirrus) 113923 0 0 180 0 0 114103 2137 59943 0 0 6030 0 0 68110 18221330 Seer Fish Scomberomorus spp. 0 4263.96 13358.27 0 965 1,439 20026 0 8348 597 4263.96 6030 163 0 19402 3942831 Auxis Thazard Firgate & Bullet Tuna 9410 0 9000.85 0 0 144 18555 0 0 0 0 8800 301 539451 548552 567107
32 Euthynnus Affinis (Kawa Kawa) 1542 911 0 0 0 152 2605 0 0 1867 911 0 208 476772 479758 48236333 Katsuwonus Pelamis (Skipjack Tuna) 5518 0 0 0 93 100 5711 0 0 0 0 0 49 12989887 12989936 12995647
34 Thunnus Tonggol (Long Tail Tuna) 1676 0 0 0 0 94 1770 0 0 0 0 0 109 0 109 187935 Istiophoridae (Marlin Sailfish) 2210 0 0 0 1852 0 4062 0 0 0 0 0 21 62224 62245 6630736 Scombridae (Tuna Like Fishes) 0 3027.46 0 0 0 0 3027 8304 0 0 3027.46 0 44 0 11375 1440337 Trichiuridae (Hair Tails) 0 6992.32 0 300 0 0 7292 775 0 7210 6992.32 25574 4086 0 44637 5193038 Rastelliger Ranagueta Indian Macker 0 0 0 8794 0 1,005 9799 29511 0 37965 0 52975 350 0 120801 130600
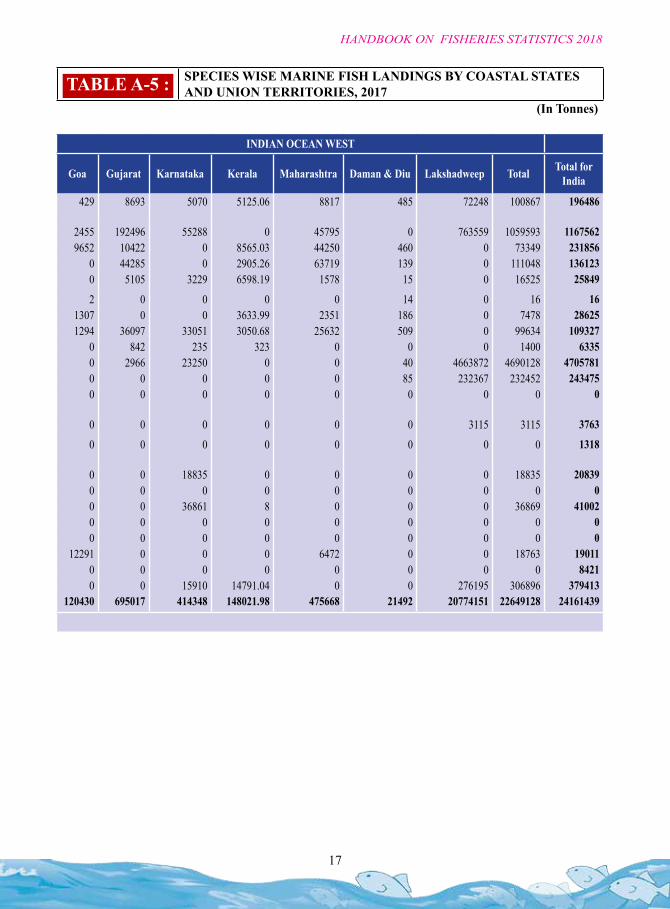
TABLE A-5 : SPECIES WISE MARINE FISH LANDINGS BY COASTAL STATES AND UNION TERRITORIES, 2017
(In Tonnes)
15
HANDBOOK ON FISHERIES STATISTICS 2018
INDIAN OCEAN EAST INDIAN OCEAN WEST
S. No. Species Andhra
Pradesh Odisha Tamil Nadu
West Bengal
A&N Islands Pondicherry Total Goa Gujarat Karnataka Kerala Maharashtra Daman & Diu Lakshadweep Total Total for
India
1 Hilsa Ilisha (Tenualosa) 13742 3816.38 0 26033 352 68 44011 0 2270 0 3816.38 1123 513 0 7722 517342 Flat Fish 6596 1834.87 0 195 11 329 8966 1312 3277 10963 1834.87 6955 129 0 24471 334373 Bregmaceros 0 0 0 0 0 0 0 0 0 0 0 564 0 0 564 5644 Harpodon Neherus 0 2258.7 0 8780 0 29 11068 25 85731 0 2258.7 32791 505 0 121311 1323785 Sea Catfishes 0 8422.8 9894.15 20833 141 647 39938 475 19552 2604 8422.8 11593 1394 0 44041 839796 Lizard Fishes 18288 0 1851.98 154 10 455 20759 0 0 4704 0 2801 14 0 7519 282787 Muraenesox spp.. (Eels) 8896 3213.24 0 130 0 0 12239 0 2227 745 3213.24 2848 38 0 9071 213108 Lactarius (Parava) 0 0 1749.54 0 0 130 1880 0 0 5704 0 4283 0 0 9987 118679 Leiognathus (Silver Bellies) 2012 2203.19 27237.18 110 2253 1,151 34966 3177 0 3268 2203.19 1385 58 0 10091 45058
10 Sciaenidae (Croackers) 0 10380.53 12988.85 21272 799 273 45713 1832 148615 5225 10380.53 22255 2955 0 191263 23697611 Upeneus spp.. (Goat Fish) 48616 0 0 55 13 0 48684 1091 0 0 0 26817 0 54214 82122 13080612 Lates Sp. Lutjanus (Perches) 3112 5422.12 25802.76 11872 5050 1,111 52370 630 14701 7065 5422.12 485 1285 169138 198726 25109613 Hemirhamphus spp (Half Beaks) 656 0 0 50 220 31 957 0 0 0 0 1598 23 127149 128770 12972714 Exocoetus (Flying Fish) 301 0 7418.26 0 0 232 7951 0 0 0 0 0 4 35184 35188 4313915 Sphyraena spp. (Barracudas) 51312 0 10993.1 80 681 369 63435 770 0 2459 0 0 10 26298 29537 9297216 Mugilidae (Mullets) 30885 7202.78 7714.25 15219 955 711 62687 445 5033 0 7202.78 1370 127 0 14178 7686517 Polynemidae (Indian Salmon) 0 1901.43 5925.8 60 0 162 8049 139 1583 0 1901.43 954 362 0 4939 1298918 Caranax spp.. (Kala Bangada) 0 0 26723.17 2200 0 836 29759 0 0 6603 0 5280 392 0 12275 4203419 Trachinotus spp.. 0 0 1670.79 0 0 0 1671 0 0 0 0 0 251 0 251 192220 Carangidae (Bangada) 0 5564.64 0 10800 3000 63 19428 0 8735 21141 5564.64 0 1037 164249 200727 22015421 Stromatidae (Butter Fish) 0 7325.62 13216.13 8560 0 297 29399 811 0 0 7325.62 16559 1051 0 25747 5514522 Sardinella Indian Oil Sardine 0 6114.46 46883.95 5520 4046 1,637 64201 34434 0 89027 6114.46 13631 87 0 143293 20749523 Engraulidae (Anchovies) 24915 5030.33 21698.58 11199 3692 415 66950 342 19459 5495 5030.33 18765 2589 0 51680 11863024 Other Clupeids 30896 14976.25 4017.1 9300 0 856 60045 4220 9639 8834 14976.25 1262 413 0 39344 9939025 Chirocentrus spp. 0 2159.65 7382.99 0 86 93 9722 510 4998 1143 2159.65 4326 248 0 13385 2310626 Wahoo 149 0 0 0 0 0 149 2060 0 0 0 0 0 118229 120289 12043827 Spanish Mackerels 4640 0 20327.78 0 2651 0 27619 0 0 0 0 0 511 0 511 2813028 King Mackerel (Indo-Pacific) 4510 0 0 0 0 0 4510 0 0 0 0 0 232 0 232 474229 Struooed Seerfish (Thazard Cirrus) 113923 0 0 180 0 0 114103 2137 59943 0 0 6030 0 0 68110 18221330 Seer Fish Scomberomorus spp. 0 4263.96 13358.27 0 965 1,439 20026 0 8348 597 4263.96 6030 163 0 19402 3942831 Auxis Thazard Firgate & Bullet Tuna 9410 0 9000.85 0 0 144 18555 0 0 0 0 8800 301 539451 548552 567107
32 Euthynnus Affinis (Kawa Kawa) 1542 911 0 0 0 152 2605 0 0 1867 911 0 208 476772 479758 48236333 Katsuwonus Pelamis (Skipjack Tuna) 5518 0 0 0 93 100 5711 0 0 0 0 0 49 12989887 12989936 12995647
34 Thunnus Tonggol (Long Tail Tuna) 1676 0 0 0 0 94 1770 0 0 0 0 0 109 0 109 187935 Istiophoridae (Marlin Sailfish) 2210 0 0 0 1852 0 4062 0 0 0 0 0 21 62224 62245 6630736 Scombridae (Tuna Like Fishes) 0 3027.46 0 0 0 0 3027 8304 0 0 3027.46 0 44 0 11375 1440337 Trichiuridae (Hair Tails) 0 6992.32 0 300 0 0 7292 775 0 7210 6992.32 25574 4086 0 44637 5193038 Rastelliger Ranagueta Indian Macker 0 0 0 8794 0 1,005 9799 29511 0 37965 0 52975 350 0 120801 130600
TABLE A-5 : SPECIES WISE MARINE FISH LANDINGS BY COASTAL STATES AND UNION TERRITORIES, 2017
(In Tonnes)
16
HANDBOOK ON FISHERIES STATISTICS 2018
INDIAN OCEAN EAST INDIAN OCEAN WEST
S. No. Species Andhra
Pradesh Odisha Tamil Nadu
West Bengal
A&N Islands Pondicherry Total Goa Gujarat Karnataka Kerala Maharashtra Daman & Diu Lakshadweep Total Total for
India
39 Elasmobranches (Shark, Rays, Skates)
62985 5125.06 12337.01 12103 2253 816 95619 429 8693 5070 5125.06 8817 485 72248 100867 196486
40 Other Marine Fishes 0 3467.68 89399.75 10445 176 4,481 107969 2455 192496 55288 0 45795 0 763559 1059593 116756241 Decapods (a) Penaeid Prawn 107779 5097.35 36801.7 7093 0 1,736 158507 9652 10422 0 8565.03 44250 460 0 73349 231856
(b) Non-Penaeid Prawn 17545 2905.26 0 3575 0 1,049 25074 0 44285 0 2905.26 63719 139 0 111048 136123 (c) Other Crust Crab 2210 6598.19 0 360 0 156 9324 0 5105 3229 6598.19 1578 15 0 16525 25849
42 Natanian Decapods 0 0 0 0 0 0 0 2 0 0 0 0 14 0 16 1643 Marine Crust Crab 0 3633.99 16755.75 27 730 0 21147 1307 0 0 3633.99 2351 186 0 7478 2862544 Cephalopods (a) Squid & Cuttle Fish 1456 3050.68 4472.77 130 0 584 9693 1294 36097 33051 3050.68 25632 509 0 99634 109327
(b) Other Molluscs 0 323 4472.77 0 19 120 4935 0 842 235 323 0 0 0 1400 633545 Thunnus albacares (Yellowfin tuna) 14210 0 0 120 99 1,224 15653 0 2966 23250 0 0 40 4663872 4690128 470578146 Thunnus obesus (Bigeye tuna) 10812 0 0 0 11 200 11023 0 0 0 0 0 85 232367 232452 24347547 Istiophorus platypterus (Indo-Pacific
sailfish0 0 0 0 0 0 0 0 0 0 0 0 0 0 0 0
48 Xiphias gladius (Swordfish) 648 0 0 0 0 0 648 0 0 0 0 0 0 3115 3115 3763
49 Panaeus monodon (Giant tiger prawn)
0 0 1318.16 0 0 0 1318 0 0 0 0 0 0 0 0 1318
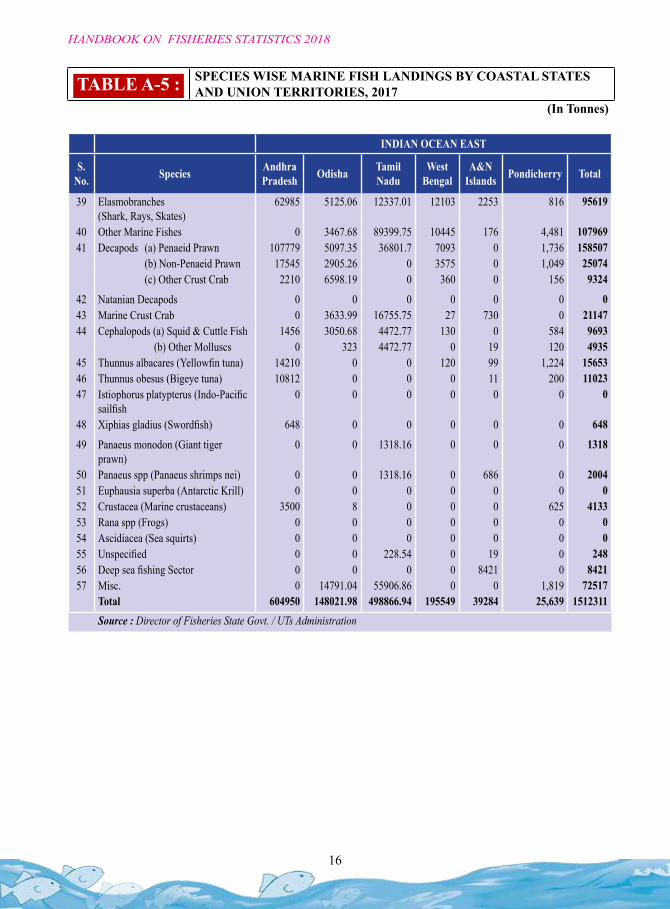
50 Panaeus spp (Panaeus shrimps nei) 0 0 1318.16 0 686 0 2004 0 0 18835 0 0 0 0 18835 2083951 Euphausia superba (Antarctic Krill) 0 0 0 0 0 0 0 0 0 0 0 0 0 0 0 052 Crustacea (Marine crustaceans) 3500 8 0 0 0 625 4133 0 0 36861 8 0 0 0 36869 4100253 Rana spp (Frogs) 0 0 0 0 0 0 0 0 0 0 0 0 0 0 0 054 Ascidiacea (Sea squirts) 0 0 0 0 0 0 0 0 0 0 0 0 0 0 0 055 Unspecified 0 0 228.54 0 19 0 248 12291 0 0 0 6472 0 0 18763 1901156 Deep sea fishing Sector 0 0 0 0 8421 0 8421 0 0 0 0 0 0 0 0 842157 Misc. 0 14791.04 55906.86 0 0 1,819 72517 0 0 15910 14791.04 0 0 276195 306896 379413
Total 604950 148021.98 498866.94 195549 39284 25,639 1512311 120430 695017 414348 148021.98 475668 21492 20774151 22649128 24161439Source : Director of Fisheries State Govt. / UTs Administration
TABLE A-5 : SPECIES WISE MARINE FISH LANDINGS BY COASTAL STATES AND UNION TERRITORIES, 2017
(In Tonnes)
17
HANDBOOK ON FISHERIES STATISTICS 2018
INDIAN OCEAN EAST INDIAN OCEAN WEST
S. No. Species Andhra
Pradesh Odisha Tamil Nadu
West Bengal
A&N Islands Pondicherry Total Goa Gujarat Karnataka Kerala Maharashtra Daman & Diu Lakshadweep Total Total for
India
39 Elasmobranches (Shark, Rays, Skates)
62985 5125.06 12337.01 12103 2253 816 95619 429 8693 5070 5125.06 8817 485 72248 100867 196486
40 Other Marine Fishes 0 3467.68 89399.75 10445 176 4,481 107969 2455 192496 55288 0 45795 0 763559 1059593 116756241 Decapods (a) Penaeid Prawn 107779 5097.35 36801.7 7093 0 1,736 158507 9652 10422 0 8565.03 44250 460 0 73349 231856
(b) Non-Penaeid Prawn 17545 2905.26 0 3575 0 1,049 25074 0 44285 0 2905.26 63719 139 0 111048 136123 (c) Other Crust Crab 2210 6598.19 0 360 0 156 9324 0 5105 3229 6598.19 1578 15 0 16525 25849
42 Natanian Decapods 0 0 0 0 0 0 0 2 0 0 0 0 14 0 16 1643 Marine Crust Crab 0 3633.99 16755.75 27 730 0 21147 1307 0 0 3633.99 2351 186 0 7478 2862544 Cephalopods (a) Squid & Cuttle Fish 1456 3050.68 4472.77 130 0 584 9693 1294 36097 33051 3050.68 25632 509 0 99634 109327
(b) Other Molluscs 0 323 4472.77 0 19 120 4935 0 842 235 323 0 0 0 1400 633545 Thunnus albacares (Yellowfin tuna) 14210 0 0 120 99 1,224 15653 0 2966 23250 0 0 40 4663872 4690128 470578146 Thunnus obesus (Bigeye tuna) 10812 0 0 0 11 200 11023 0 0 0 0 0 85 232367 232452 24347547 Istiophorus platypterus (Indo-Pacific
sailfish0 0 0 0 0 0 0 0 0 0 0 0 0 0 0 0
48 Xiphias gladius (Swordfish) 648 0 0 0 0 0 648 0 0 0 0 0 0 3115 3115 3763
49 Panaeus monodon (Giant tiger prawn)
0 0 1318.16 0 0 0 1318 0 0 0 0 0 0 0 0 1318
50 Panaeus spp (Panaeus shrimps nei) 0 0 1318.16 0 686 0 2004 0 0 18835 0 0 0 0 18835 2083951 Euphausia superba (Antarctic Krill) 0 0 0 0 0 0 0 0 0 0 0 0 0 0 0 052 Crustacea (Marine crustaceans) 3500 8 0 0 0 625 4133 0 0 36861 8 0 0 0 36869 4100253 Rana spp (Frogs) 0 0 0 0 0 0 0 0 0 0 0 0 0 0 0 054 Ascidiacea (Sea squirts) 0 0 0 0 0 0 0 0 0 0 0 0 0 0 0 055 Unspecified 0 0 228.54 0 19 0 248 12291 0 0 0 6472 0 0 18763 1901156 Deep sea fishing Sector 0 0 0 0 8421 0 8421 0 0 0 0 0 0 0 0 842157 Misc. 0 14791.04 55906.86 0 0 1,819 72517 0 0 15910 14791.04 0 0 276195 306896 379413
Total 604950 148021.98 498866.94 195549 39284 25,639 1512311 120430 695017 414348 148021.98 475668 21492 20774151 22649128 24161439Source : Director of Fisheries State Govt. / UTs Administration
TABLE A-5 : SPECIES WISE MARINE FISH LANDINGS BY COASTAL STATES AND UNION TERRITORIES, 2017
(In Tonnes)
18
HANDBOOK ON FISHERIES STATISTICS 2018
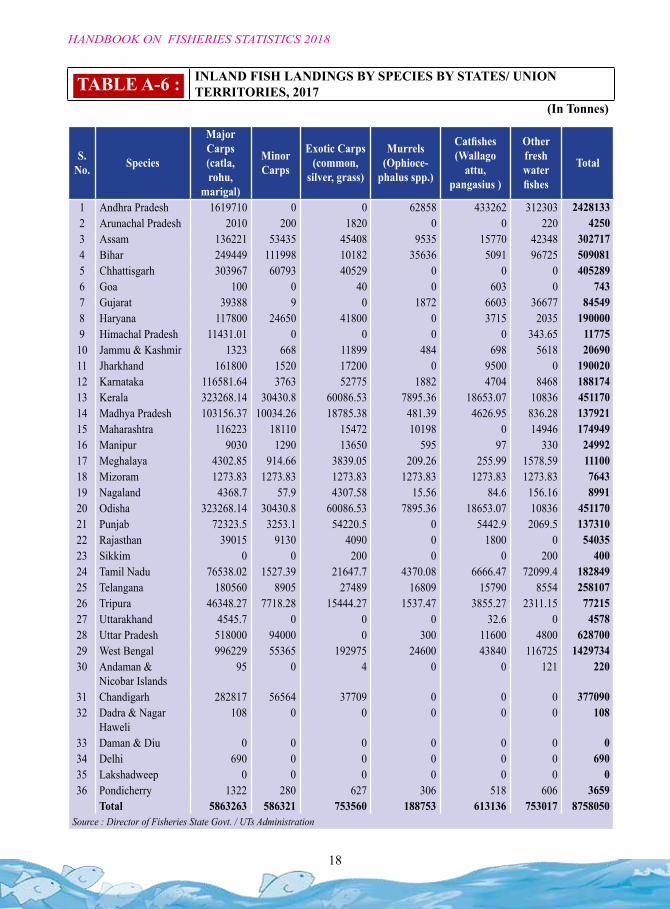
TABLE A-6 : INLAND FISH LANDINGS BY SPECIES BY STATES/ UNION TERRITORIES, 2017
(In Tonnes)
S. No. Species
Major Carps (catla, rohu,
marigal)
Minor Carps
Exotic Carps (common,
silver, grass)
Murrels (Ophioce-
phalus spp.)
Catfishes (Wallago
attu, pangasius )
Other fresh water fishes
Total
1 Andhra Pradesh 1619710 0 0 62858 433262 312303 24281332 Arunachal Pradesh 2010 200 1820 0 0 220 42503 Assam 136221 53435 45408 9535 15770 42348 3027174 Bihar 249449 111998 10182 35636 5091 96725 5090815 Chhattisgarh 303967 60793 40529 0 0 0 4052896 Goa 100 0 40 0 603 0 7437 Gujarat 39388 9 0 1872 6603 36677 845498 Haryana 117800 24650 41800 0 3715 2035 1900009 Himachal Pradesh 11431.01 0 0 0 0 343.65 11775
10 Jammu & Kashmir 1323 668 11899 484 698 5618 2069011 Jharkhand 161800 1520 17200 0 9500 0 19002012 Karnataka 116581.64 3763 52775 1882 4704 8468 18817413 Kerala 323268.14 30430.8 60086.53 7895.36 18653.07 10836 45117014 Madhya Pradesh 103156.37 10034.26 18785.38 481.39 4626.95 836.28 13792115 Maharashtra 116223 18110 15472 10198 0 14946 17494916 Manipur 9030 1290 13650 595 97 330 2499217 Meghalaya 4302.85 914.66 3839.05 209.26 255.99 1578.59 1110018 Mizoram 1273.83 1273.83 1273.83 1273.83 1273.83 1273.83 764319 Nagaland 4368.7 57.9 4307.58 15.56 84.6 156.16 899120 Odisha 323268.14 30430.8 60086.53 7895.36 18653.07 10836 45117021 Punjab 72323.5 3253.1 54220.5 0 5442.9 2069.5 13731022 Rajasthan 39015 9130 4090 0 1800 0 5403523 Sikkim 0 0 200 0 0 200 40024 Tamil Nadu 76538.02 1527.39 21647.7 4370.08 6666.47 72099.4 18284925 Telangana 180560 8905 27489 16809 15790 8554 25810726 Tripura 46348.27 7718.28 15444.27 1537.47 3855.27 2311.15 7721527 Uttarakhand 4545.7 0 0 0 32.6 0 457828 Uttar Pradesh 518000 94000 0 300 11600 4800 62870029 West Bengal 996229 55365 192975 24600 43840 116725 142973430 Andaman &
Nicobar Islands95 0 4 0 0 121 220
31 Chandigarh 282817 56564 37709 0 0 0 37709032 Dadra & Nagar
Haweli108 0 0 0 0 0 108
33 Daman & Diu 0 0 0 0 0 0 034 Delhi 690 0 0 0 0 0 69035 Lakshadweep 0 0 0 0 0 0 036 Pondicherry 1322 280 627 306 518 606 3659
Total 5863263 586321 753560 188753 613136 753017 8758050Source : Director of Fisheries State Govt. / UTs Administration
19
HANDBOOK ON FISHERIES STATISTICS 2018
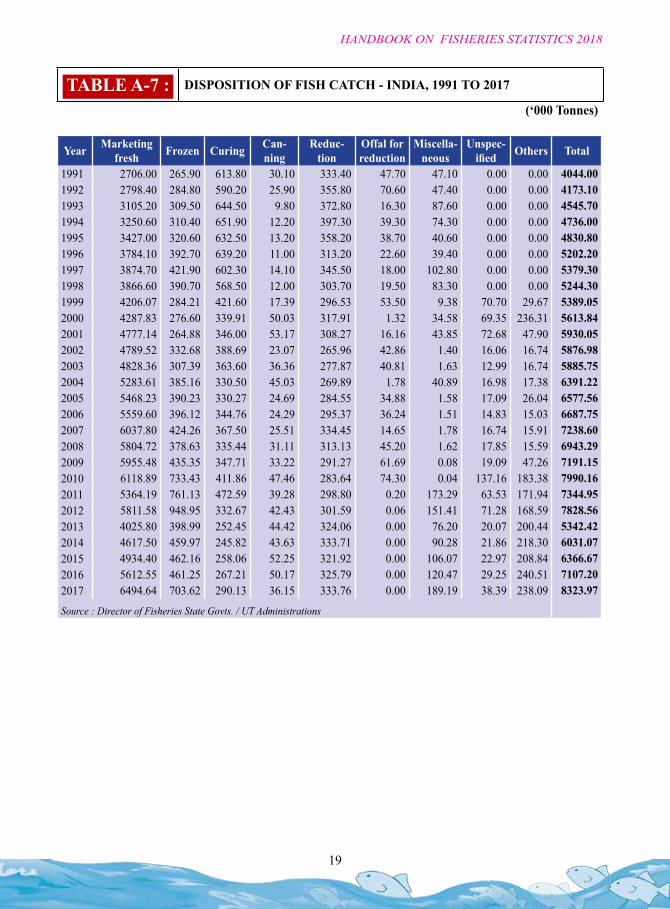
TABLE A-7 : DISPOSITION OF FISH CATCH - INDIA, 1991 TO 2017
(‘000 Tonnes)
Year Marketing fresh Frozen Curing Can-
ningReduc-
tionOffal for reduction
Miscella-neous
Unspec-ified Others Total
1991 2706.00 265.90 613.80 30.10 333.40 47.70 47.10 0.00 0.00 4044.001992 2798.40 284.80 590.20 25.90 355.80 70.60 47.40 0.00 0.00 4173.101993 3105.20 309.50 644.50 9.80 372.80 16.30 87.60 0.00 0.00 4545.701994 3250.60 310.40 651.90 12.20 397.30 39.30 74.30 0.00 0.00 4736.001995 3427.00 320.60 632.50 13.20 358.20 38.70 40.60 0.00 0.00 4830.801996 3784.10 392.70 639.20 11.00 313.20 22.60 39.40 0.00 0.00 5202.201997 3874.70 421.90 602.30 14.10 345.50 18.00 102.80 0.00 0.00 5379.301998 3866.60 390.70 568.50 12.00 303.70 19.50 83.30 0.00 0.00 5244.301999 4206.07 284.21 421.60 17.39 296.53 53.50 9.38 70.70 29.67 5389.052000 4287.83 276.60 339.91 50.03 317.91 1.32 34.58 69.35 236.31 5613.842001 4777.14 264.88 346.00 53.17 308.27 16.16 43.85 72.68 47.90 5930.052002 4789.52 332.68 388.69 23.07 265.96 42.86 1.40 16.06 16.74 5876.982003 4828.36 307.39 363.60 36.36 277.87 40.81 1.63 12.99 16.74 5885.752004 5283.61 385.16 330.50 45.03 269.89 1.78 40.89 16.98 17.38 6391.222005 5468.23 390.23 330.27 24.69 284.55 34.88 1.58 17.09 26.04 6577.562006 5559.60 396.12 344.76 24.29 295.37 36.24 1.51 14.83 15.03 6687.752007 6037.80 424.26 367.50 25.51 334.45 14.65 1.78 16.74 15.91 7238.602008 5804.72 378.63 335.44 31.11 313.13 45.20 1.62 17.85 15.59 6943.292009 5955.48 435.35 347.71 33.22 291.27 61.69 0.08 19.09 47.26 7191.152010 6118.89 733.43 411.86 47.46 283.64 74.30 0.04 137.16 183.38 7990.162011 5364.19 761.13 472.59 39.28 298.80 0.20 173.29 63.53 171.94 7344.952012 5811.58 948.95 332.67 42.43 301.59 0.06 151.41 71.28 168.59 7828.562013 4025.80 398.99 252.45 44.42 324.06 0.00 76.20 20.07 200.44 5342.422014 4617.50 459.97 245.82 43.63 333.71 0.00 90.28 21.86 218.30 6031.072015 4934.40 462.16 258.06 52.25 321.92 0.00 106.07 22.97 208.84 6366.672016 5612.55 461.25 267.21 50.17 325.79 0.00 120.47 29.25 240.51 7107.202017 6494.64 703.62 290.13 36.15 333.76 0.00 189.19 38.39 238.09 8323.97
Source : Director of Fisheries State Govts. / UT Administrations
20
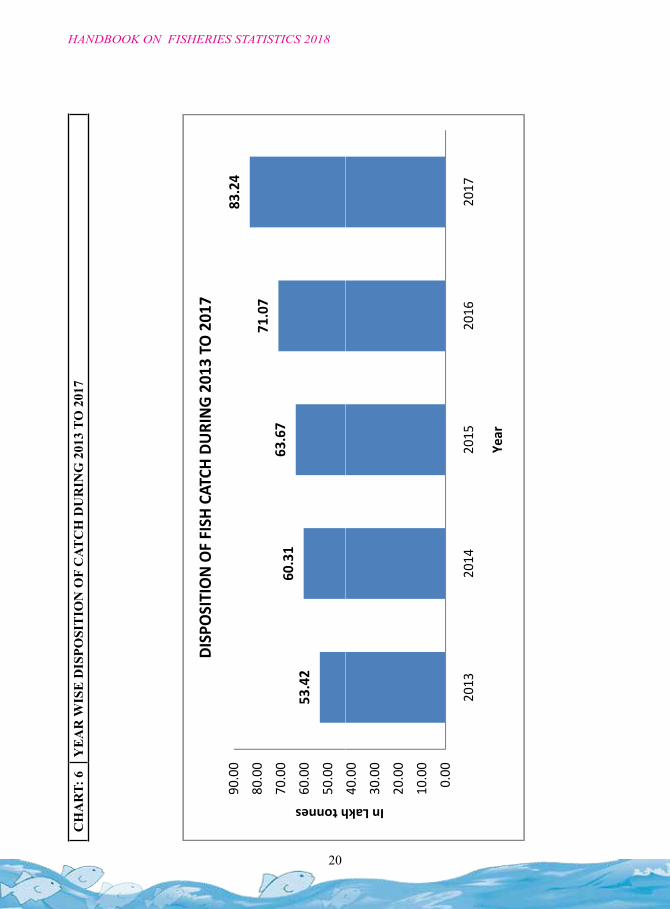
HANDBOOK ON FISHERIES STATISTICS 2018
CH
AR
T: 6
YE
AR
WIS
E D
ISPO
SIT
ION
OF
CAT
CH
DU
RIN
G 2
013
TO 2
017
CHAR
T ‐7 : YEAR
WISE DISPOSITION OF CA
TCH DURING 2013
TO 2017
8324
9000
DISPOSITION OF FISH
CATCH
DURING 2013
TO 2017
53.42
60.31
63.67
71.07
83.24
50.00
60.00
70.00
80.00
90.00
h tonnes
0.00
10.00
20.00
30.00
40.00
In Lakh
2013
2014
2015
2016
2017
Year
21
HANDBOOK ON FISHERIES STATISTICS 2018
Year Marketing fresh Frozen Curing Canning Reduction Offal for
reductionMiscella-
neousUnspec-
ified Others Total
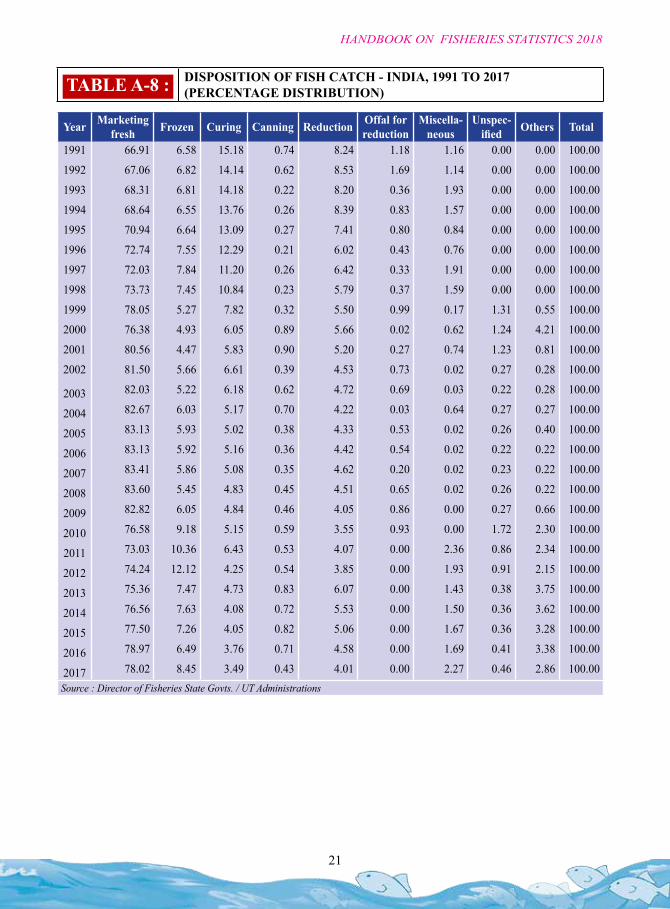
1991 66.91 6.58 15.18 0.74 8.24 1.18 1.16 0.00 0.00 100.00
1992 67.06 6.82 14.14 0.62 8.53 1.69 1.14 0.00 0.00 100.00
1993 68.31 6.81 14.18 0.22 8.20 0.36 1.93 0.00 0.00 100.00
1994 68.64 6.55 13.76 0.26 8.39 0.83 1.57 0.00 0.00 100.00
1995 70.94 6.64 13.09 0.27 7.41 0.80 0.84 0.00 0.00 100.00
1996 72.74 7.55 12.29 0.21 6.02 0.43 0.76 0.00 0.00 100.00
1997 72.03 7.84 11.20 0.26 6.42 0.33 1.91 0.00 0.00 100.00
1998 73.73 7.45 10.84 0.23 5.79 0.37 1.59 0.00 0.00 100.00
1999 78.05 5.27 7.82 0.32 5.50 0.99 0.17 1.31 0.55 100.00
2000 76.38 4.93 6.05 0.89 5.66 0.02 0.62 1.24 4.21 100.00
2001 80.56 4.47 5.83 0.90 5.20 0.27 0.74 1.23 0.81 100.00
2002 81.50 5.66 6.61 0.39 4.53 0.73 0.02 0.27 0.28 100.00
2003 82.03 5.22 6.18 0.62 4.72 0.69 0.03 0.22 0.28 100.00
2004 82.67 6.03 5.17 0.70 4.22 0.03 0.64 0.27 0.27 100.00
2005 83.13 5.93 5.02 0.38 4.33 0.53 0.02 0.26 0.40 100.00
2006 83.13 5.92 5.16 0.36 4.42 0.54 0.02 0.22 0.22 100.00
2007 83.41 5.86 5.08 0.35 4.62 0.20 0.02 0.23 0.22 100.00
2008 83.60 5.45 4.83 0.45 4.51 0.65 0.02 0.26 0.22 100.00
2009 82.82 6.05 4.84 0.46 4.05 0.86 0.00 0.27 0.66 100.00
2010 76.58 9.18 5.15 0.59 3.55 0.93 0.00 1.72 2.30 100.00
2011 73.03 10.36 6.43 0.53 4.07 0.00 2.36 0.86 2.34 100.00
2012 74.24 12.12 4.25 0.54 3.85 0.00 1.93 0.91 2.15 100.00
2013 75.36 7.47 4.73 0.83 6.07 0.00 1.43 0.38 3.75 100.00
2014 76.56 7.63 4.08 0.72 5.53 0.00 1.50 0.36 3.62 100.00
2015 77.50 7.26 4.05 0.82 5.06 0.00 1.67 0.36 3.28 100.00
2016 78.97 6.49 3.76 0.71 4.58 0.00 1.69 0.41 3.38 100.00
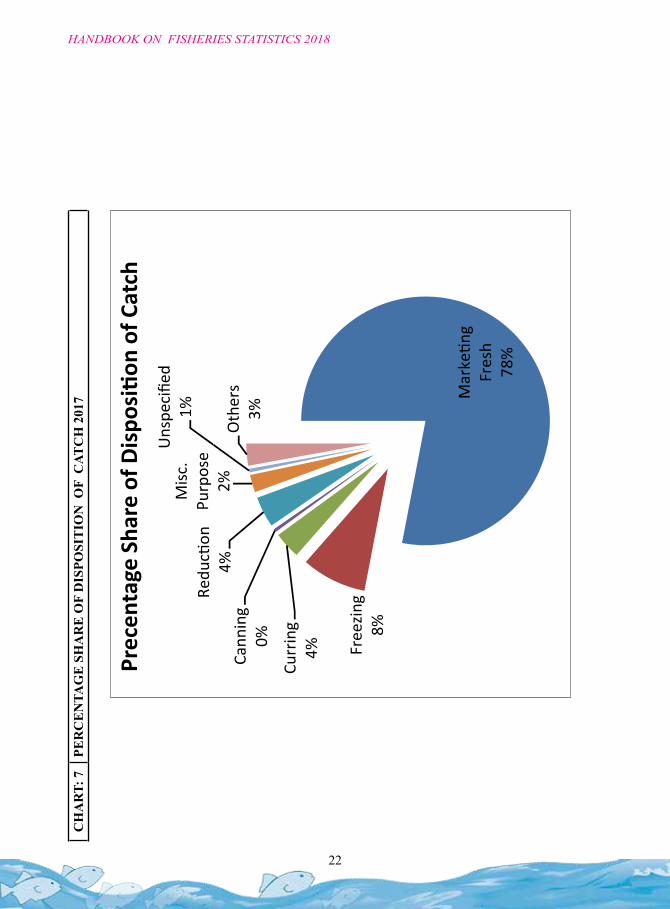
2017 78.02 8.45 3.49 0.43 4.01 0.00 2.27 0.46 2.86 100.00Source : Director of Fisheries State Govts. / UT Administrations
TABLE A-8 : DISPOSITION OF FISH CATCH - INDIA, 1991 TO 2017 (PERCENTAGE DISTRIBUTION)
22
HANDBOOK ON FISHERIES STATISTICS 2018
CH
AR
T: 7
PER
CE
NTA
GE
SH
AR
E O
F D
ISPO
SIT
ION
OF
CAT
CH
201
7
Redu
ction
Misc
. Pu
rpose
Unspe
cifie
d1%
Prec
enta
ge S
hare
of D
ispo
sition
of C
atch
Curr
ing
4%Cann
ing
0%
4%2%
Oth
ers
3%
Marketin
g
Free
zing
8%
Fres
h78
%
23
HANDBOOK ON FISHERIES STATISTICS 2018
TABL
E A
-9 :
DIS
POSI
TIO
N O
F FI
SH C
ATC
H B
Y S
TATE
S / U
NIO
N T
ERR
ITO
RIE
S, 2
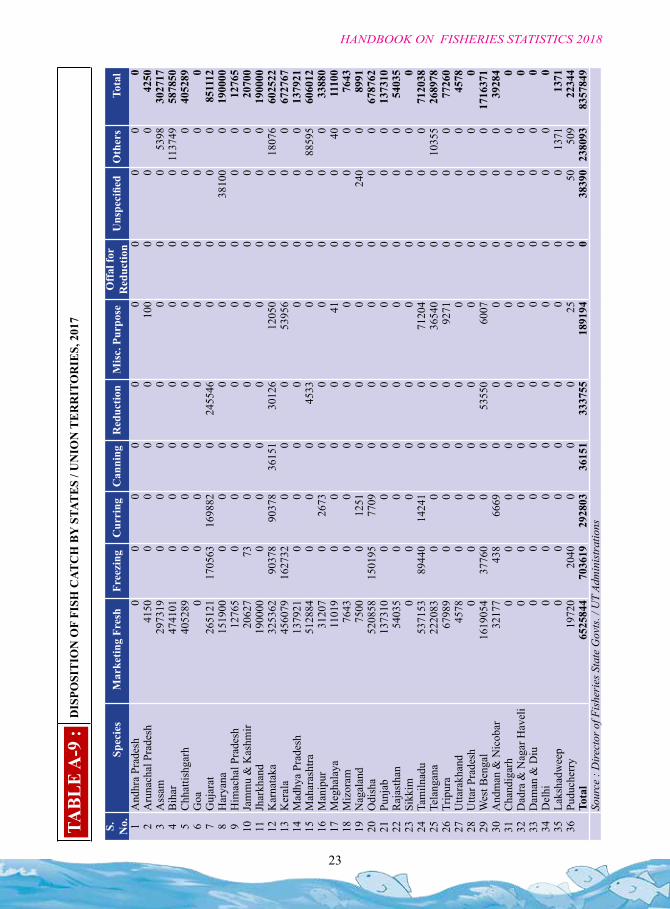
017
S.
No.
Spe
cies
Mar
ketin
g Fr
esh
Free
zing
Cur
ring
Can
ning
Red
uctio
nM
isc.
Pur
pose
Off
al fo
r R
educ
tion
Uns
peci
fied
Oth
ers
Tot
al1
And
hra
Prad
esh
00
00
00
00
00
2A
runa
chal
Pra
desh
4150
00
00
100
00
042
503
Ass
am29
7319
00
00
00
053
9830
2717
4B
ihar
4741
010
00
00
00
1137
4958
7850
5C
hhat
tishg
arh
4052
890
00
00
00
040
5289
6G
oa0
00
00
00
00
07
Guj
arat
2651
2117
0563
1698
820
2455
460
00
085
1112
8H
arya
na15
1900
00
00
00
3810
00
1900
009
Him
acha
l Pra
desh
1276
50
00
00
00
012
765
10Ja
mm
u &
Kas
hmir
2062
773
00
00
00
020
700
11Jh
arkh
and
1900
000
00
00
00
019
0000
12K
arna
taka
3253
6290
378
9037
836
151
3012
612
050
00
1807
660
2522
13K
eral
a45
6079
1627
320
00
5395
60
00
6727
6714
Mad
hya
Prad
esh
1379
210
00
00
00
013
7921
15M
ahar
asht
ra51
2884
00
045
330
00
8859
560
6012
16M
anip
ur31
207
026
730
00
00
033
880
17M
egha
laya
1101
90
00
041
00
4011
100
18M
izor
am76
430
00
00
00
076
4319
Nag
alan
d75
000
1251
00
00
240
089
9120
Odi
sha
5208
5815
0195
7709
00
00
00
6787
6221
Punj
ab13
7310
00
00
00
00
1373
1022
Raj
asth
an54
035
00
00
00
00
5403
523
Sikk
im0
00
00
00
00
024
Tam
ilnad
u53
7153
8944
014
241
00
7120
40
00
7120
3825
Tela
ngan
a22
2083
00
00
3654
00
010
355
2689
7826
Trip
ura
6798
90
00
092
710
00
7726
027
Utta
rakh
and
4578
00
00
00
00
4578
28U
ttar P
rade
sh0
00
00
00
00
029
Wes
t Ben
gal
1619
054
3776
00
053
550
6007
00
017
1637
130
And
man
& N
icob
ar32
177
438
6669
00
00
00
3928
431
Cha
ndig
arh
00
00
00
00
00
32D
adra
& N
agar
Hav
eli
00
00
00
00
00
33D
aman
& D
iu0
00
00
00
00
034
Del
hi0
00
00
00
00
035
Laks
hadw
eep
00
00
00
00
1371
1371
36Pu
duch
erry
1972
020
400
00
250
5050
922
344
Tota
l65
2584
470
3619
2928
0336
151
3337
5518
9194
038
390
2380
9383
5784
9So
urce
: D
irect
or o
f Fis
heri
es S
tate
Gov
ts. /
UT
Adm
inis
trat
ions
24
HANDBOOK ON FISHERIES STATISTICS 2018
S. No. States/Uts Tuna
Frozen
Marine Fish
Frozen
Fish Dried,
Unsalted
Fish Dried & Salted or smoked
Shark fins,
Dried, Salted
etc.
Frozen Whole cooked Lob-ster
Shrimp &
Prawn Frozen
Dried Prawn/ Shrimp
Fro-zen Cut-tle-fish
fillets
Frozen Cuttle-
fish fillets
Frozen Squids
Dried Squids
Yellowfin tuna,-frozen
Mack-erels,-frozen
Fish, salted
& dried
Lobsters, Whole, frozen
Jellyfish, dried, salted or in brine
Miscel-laneous Total
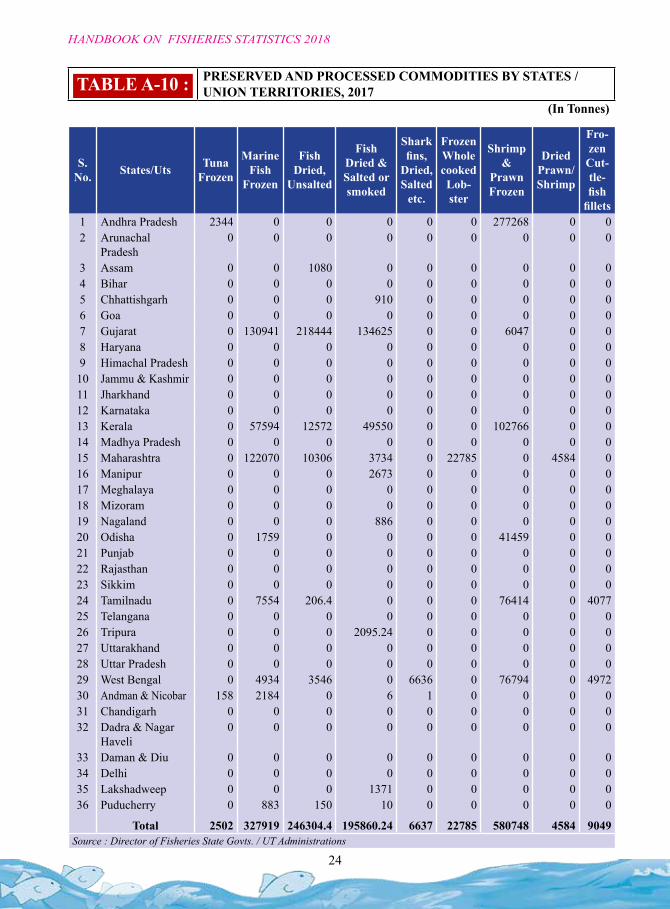
1 Andhra Pradesh 2344 0 0 0 0 0 277268 0 0 0 0 466 583 774 0 0 0 9086 2905212 Arunachal
Pradesh0 0 0 0 0 0 0 0 0 0 0 0 0 0 0 0 0 0 0
3 Assam 0 0 1080 0 0 0 0 0 0 0 0 0 0 0 0 0 0 0 10804 Bihar 0 0 0 0 0 0 0 0 0 0 0 0 0 0 0 0 0 0 05 Chhattishgarh 0 0 0 910 0 0 0 0 0 0 0 0 0 0 0 0 0 0 9106 Goa 0 0 0 0 0 0 0 0 0 0 0 0 0 0 0 0 0 0 07 Gujarat 0 130941 218444 134625 0 0 6047 0 0 0 0 0 0 0 0 0 0 55393 5454508 Haryana 0 0 0 0 0 0 0 0 0 0 0 0 0 0 0 0 0 0 09 Himachal Pradesh 0 0 0 0 0 0 0 0 0 0 0 0 0 0 0 0 0 0 010 Jammu & Kashmir 0 0 0 0 0 0 0 0 0 0 0 0 0 0 0 0 0 0 011 Jharkhand 0 0 0 0 0 0 0 0 0 0 0 0 0 0 0 0 0 0 012 Karnataka 0 0 0 0 0 0 0 0 0 0 0 0 0 0 0 0 0 0 013 Kerala 0 57594 12572 49550 0 0 102766 0 0 0 0 0 0 0 0 0 0 0 22248214 Madhya Pradesh 0 0 0 0 0 0 0 0 0 0 0 0 0 0 0 0 0 0 015 Maharashtra 0 122070 10306 3734 0 22785 0 4584 0 4426 11064 0 0 0 0 0 0 0 17896916 Manipur 0 0 0 2673 0 0 0 0 0 0 0 0 0 0 0 0 0 0 267317 Meghalaya 0 0 0 0 0 0 0 0 0 0 0 0 0 0 0 0 0 0 018 Mizoram 0 0 0 0 0 0 0 0 0 0 0 0 0 0 0 0 0 0 019 Nagaland 0 0 0 886 0 0 0 0 0 0 0 0 0 0 0 0 0 341 122720 Odisha 0 1759 0 0 0 0 41459 0 0 525 45 0 0 0 0 0 0 0 4378821 Punjab 0 0 0 0 0 0 0 0 0 0 0 0 0 0 0 0 0 0 022 Rajasthan 0 0 0 0 0 0 0 0 0 0 0 0 0 0 0 0 0 0 023 Sikkim 0 0 0 0 0 0 0 0 0 0 0 0 0 0 0 0 0 0 024 Tamilnadu 0 7554 206.4 0 0 0 76414 0 4077 0 4434 0 0 0 0 0 17819 4038 114542.425 Telangana 0 0 0 0 0 0 0 0 0 0 0 0 0 0 0 0 0 0 026 Tripura 0 0 0 2095.24 0 0 0 0 0 0 0 0 0 0 0 0 0 0 2095.2427 Uttarakhand 0 0 0 0 0 0 0 0 0 0 0 0 0 0 0 0 0 0 028 Uttar Pradesh 0 0 0 0 0 0 0 0 0 0 0 0 0 0 0 0 0 0 029 West Bengal 0 4934 3546 0 6636 0 76794 0 4972 0 201 0 0 0 0 0 0 14434 11151730 Andman & Nicobar 158 2184 0 6 1 0 0 0 0 0 0 0 0 0 6669 8 0 0 902631 Chandigarh 0 0 0 0 0 0 0 0 0 0 0 0 0 0 0 0 0 0 032 Dadra & Nagar
Haveli0 0 0 0 0 0 0 0 0 0 0 0 0 0 0 0 0 0 0
33 Daman & Diu 0 0 0 0 0 0 0 0 0 0 0 0 0 0 0 0 0 0 034 Delhi 0 0 0 0 0 0 0 0 0 0 0 0 0 0 0 0 0 0 035 Lakshadweep 0 0 0 1371 0 0 0 0 0 0 0 0 0 0 0 0 0 0 137136 Puducherry 0 883 150 10 0 0 0 0 0 0 0 0 0 0 496 0 0 0 1539
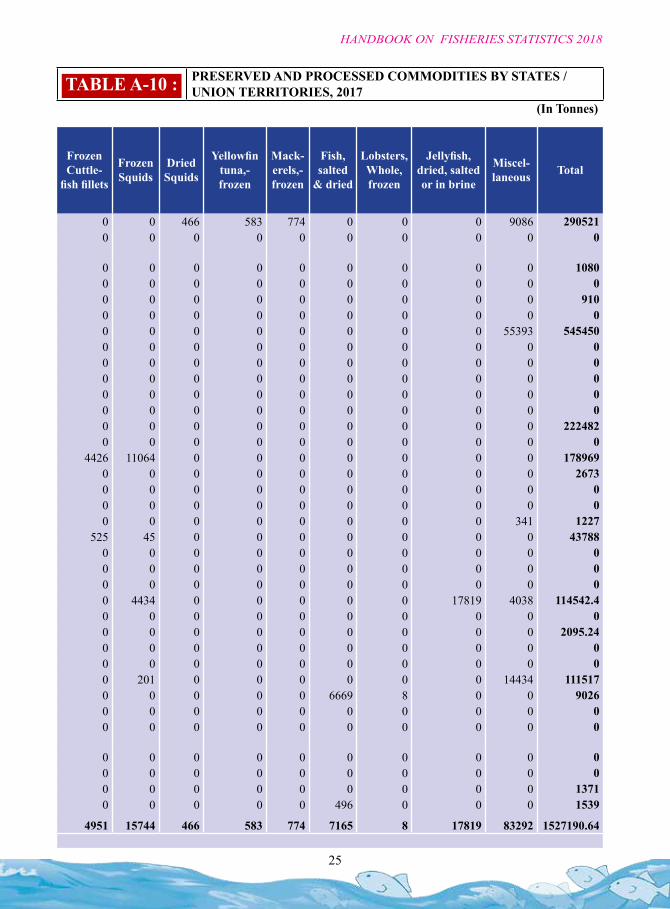
Total 2502 327919 246304.4 195860.24 6637 22785 580748 4584 9049 4951 15744 466 583 774 7165 8 17819 83292 1527190.64Source : Director of Fisheries State Govts. / UT Administrations
TABLE A-10 : PRESERVED AND PROCESSED COMMODITIES BY STATES / UNION TERRITORIES, 2017
(In Tonnes)
25
HANDBOOK ON FISHERIES STATISTICS 2018
S. No. States/Uts Tuna
Frozen
Marine Fish
Frozen
Fish Dried,
Unsalted
Fish Dried & Salted or smoked
Shark fins,
Dried, Salted
etc.
Frozen Whole cooked Lob-ster
Shrimp &
Prawn Frozen
Dried Prawn/ Shrimp
Fro-zen Cut-tle-fish
fillets
Frozen Cuttle-
fish fillets
Frozen Squids
Dried Squids
Yellowfin tuna,-frozen
Mack-erels,-frozen
Fish, salted
& dried
Lobsters, Whole, frozen
Jellyfish, dried, salted or in brine
Miscel-laneous Total
1 Andhra Pradesh 2344 0 0 0 0 0 277268 0 0 0 0 466 583 774 0 0 0 9086 2905212 Arunachal
Pradesh0 0 0 0 0 0 0 0 0 0 0 0 0 0 0 0 0 0 0
3 Assam 0 0 1080 0 0 0 0 0 0 0 0 0 0 0 0 0 0 0 10804 Bihar 0 0 0 0 0 0 0 0 0 0 0 0 0 0 0 0 0 0 05 Chhattishgarh 0 0 0 910 0 0 0 0 0 0 0 0 0 0 0 0 0 0 9106 Goa 0 0 0 0 0 0 0 0 0 0 0 0 0 0 0 0 0 0 07 Gujarat 0 130941 218444 134625 0 0 6047 0 0 0 0 0 0 0 0 0 0 55393 5454508 Haryana 0 0 0 0 0 0 0 0 0 0 0 0 0 0 0 0 0 0 09 Himachal Pradesh 0 0 0 0 0 0 0 0 0 0 0 0 0 0 0 0 0 0 010 Jammu & Kashmir 0 0 0 0 0 0 0 0 0 0 0 0 0 0 0 0 0 0 011 Jharkhand 0 0 0 0 0 0 0 0 0 0 0 0 0 0 0 0 0 0 012 Karnataka 0 0 0 0 0 0 0 0 0 0 0 0 0 0 0 0 0 0 013 Kerala 0 57594 12572 49550 0 0 102766 0 0 0 0 0 0 0 0 0 0 0 22248214 Madhya Pradesh 0 0 0 0 0 0 0 0 0 0 0 0 0 0 0 0 0 0 015 Maharashtra 0 122070 10306 3734 0 22785 0 4584 0 4426 11064 0 0 0 0 0 0 0 17896916 Manipur 0 0 0 2673 0 0 0 0 0 0 0 0 0 0 0 0 0 0 267317 Meghalaya 0 0 0 0 0 0 0 0 0 0 0 0 0 0 0 0 0 0 018 Mizoram 0 0 0 0 0 0 0 0 0 0 0 0 0 0 0 0 0 0 019 Nagaland 0 0 0 886 0 0 0 0 0 0 0 0 0 0 0 0 0 341 122720 Odisha 0 1759 0 0 0 0 41459 0 0 525 45 0 0 0 0 0 0 0 4378821 Punjab 0 0 0 0 0 0 0 0 0 0 0 0 0 0 0 0 0 0 022 Rajasthan 0 0 0 0 0 0 0 0 0 0 0 0 0 0 0 0 0 0 023 Sikkim 0 0 0 0 0 0 0 0 0 0 0 0 0 0 0 0 0 0 024 Tamilnadu 0 7554 206.4 0 0 0 76414 0 4077 0 4434 0 0 0 0 0 17819 4038 114542.425 Telangana 0 0 0 0 0 0 0 0 0 0 0 0 0 0 0 0 0 0 026 Tripura 0 0 0 2095.24 0 0 0 0 0 0 0 0 0 0 0 0 0 0 2095.2427 Uttarakhand 0 0 0 0 0 0 0 0 0 0 0 0 0 0 0 0 0 0 028 Uttar Pradesh 0 0 0 0 0 0 0 0 0 0 0 0 0 0 0 0 0 0 029 West Bengal 0 4934 3546 0 6636 0 76794 0 4972 0 201 0 0 0 0 0 0 14434 11151730 Andman & Nicobar 158 2184 0 6 1 0 0 0 0 0 0 0 0 0 6669 8 0 0 902631 Chandigarh 0 0 0 0 0 0 0 0 0 0 0 0 0 0 0 0 0 0 032 Dadra & Nagar
Haveli0 0 0 0 0 0 0 0 0 0 0 0 0 0 0 0 0 0 0
33 Daman & Diu 0 0 0 0 0 0 0 0 0 0 0 0 0 0 0 0 0 0 034 Delhi 0 0 0 0 0 0 0 0 0 0 0 0 0 0 0 0 0 0 035 Lakshadweep 0 0 0 1371 0 0 0 0 0 0 0 0 0 0 0 0 0 0 137136 Puducherry 0 883 150 10 0 0 0 0 0 0 0 0 0 0 496 0 0 0 1539
Total 2502 327919 246304.4 195860.24 6637 22785 580748 4584 9049 4951 15744 466 583 774 7165 8 17819 83292 1527190.64Source : Director of Fisheries State Govts. / UT Administrations
TABLE A-10 : PRESERVED AND PROCESSED COMMODITIES BY STATES / UNION TERRITORIES, 2017
(In Tonnes)
26
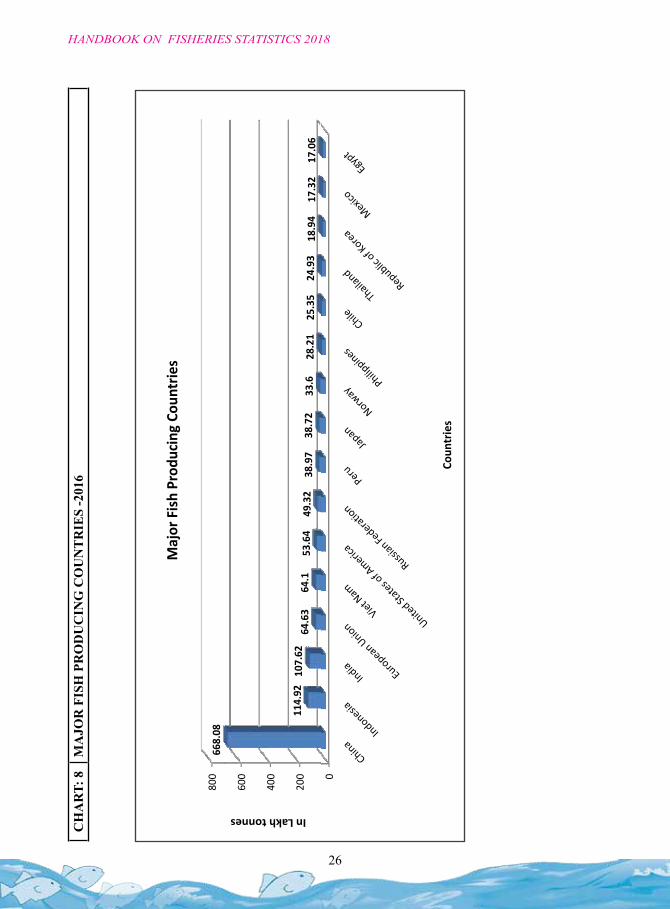
HANDBOOK ON FISHERIES STATISTICS 2018
CH
AR
T: 8
MA
JOR
FIS
H P
RO
DU
CIN
G C
OU
NTR
IES
-201
6
800
668.
08
Maj
or F
ish
Prod
ucin
g Co
untr
ies
200
400
600
114.
9210
7.62
64.6
364
.153
.64
49.3
238
.97
38.7
233
.628
.21
25.3
524
.93
18.9
417
.32
17.0
6
In Lakh tonnes
0
Coun
trie
s
27
HANDBOOK ON FISHERIES STATISTICS 2018
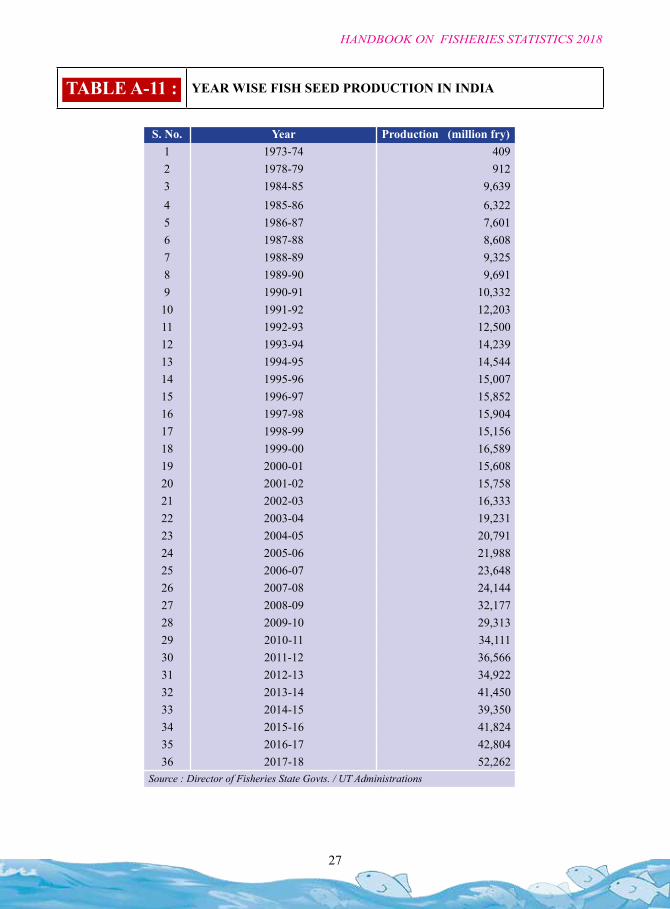
S. No. Year Production (million fry)1 1973-74 4092 1978-79 9123 1984-85 9,6394 1985-86 6,3225 1986-87 7,6016 1987-88 8,6087 1988-89 9,3258 1989-90 9,6919 1990-91 10,33210 1991-92 12,20311 1992-93 12,50012 1993-94 14,23913 1994-95 14,54414 1995-96 15,00715 1996-97 15,85216 1997-98 15,90417 1998-99 15,15618 1999-00 16,58919 2000-01 15,60820 2001-02 15,75821 2002-03 16,33322 2003-04 19,23123 2004-05 20,79124 2005-06 21,98825 2006-07 23,64826 2007-08 24,14427 2008-09 32,17728 2009-10 29,31329 2010-11 34,11130 2011-12 36,56631 2012-13 34,92232 2013-14 41,45033 2014-15 39,35034 2015-16 41,82435 2016-17 42,80436 2017-18 52,262
Source : Director of Fisheries State Govts. / UT Administrations
TABLE A-11 : YEAR WISE FISH SEED PRODUCTION IN INDIA
28
HANDBOOK ON FISHERIES STATISTICS 2018
(in million fry) (in million fry)S.
No. State/Union Territory 2005-06 2006-07 2007-08 2008-09 2009-10 2010-11 2011-12 2012-13 2013-14 2014-15 2015-16 2016-17 2017-18
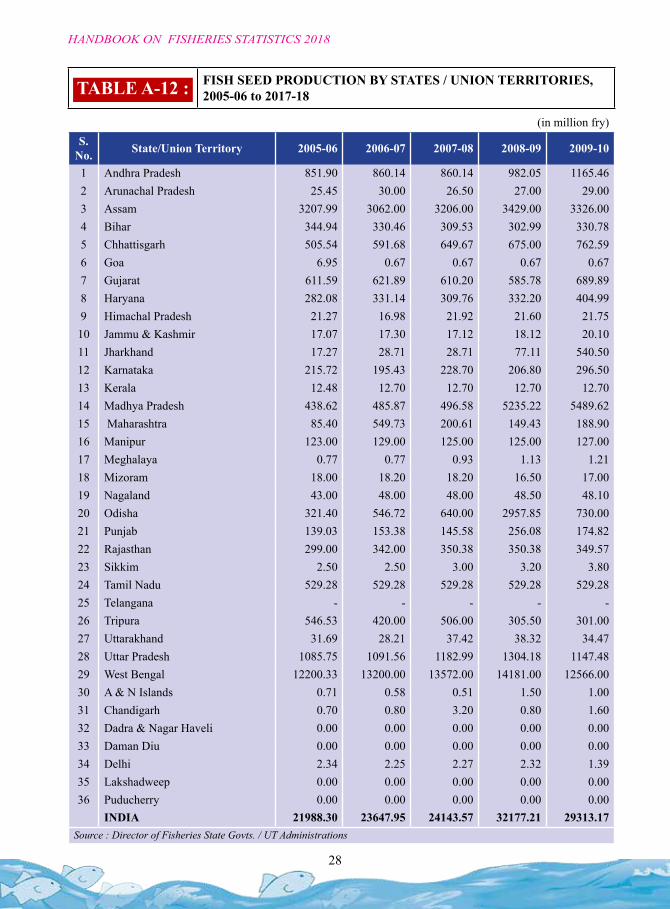
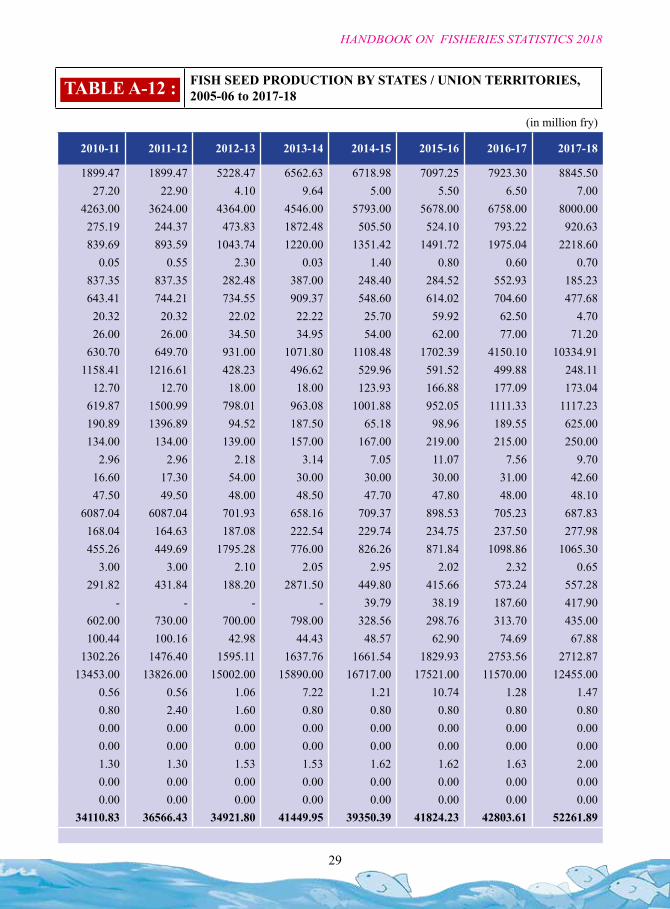
1 Andhra Pradesh 851.90 860.14 860.14 982.05 1165.46 1899.47 1899.47 5228.47 6562.63 6718.98 7097.25 7923.30 8845.502 Arunachal Pradesh 25.45 30.00 26.50 27.00 29.00 27.20 22.90 4.10 9.64 5.00 5.50 6.50 7.003 Assam 3207.99 3062.00 3206.00 3429.00 3326.00 4263.00 3624.00 4364.00 4546.00 5793.00 5678.00 6758.00 8000.004 Bihar 344.94 330.46 309.53 302.99 330.78 275.19 244.37 473.83 1872.48 505.50 524.10 793.22 920.635 Chhattisgarh 505.54 591.68 649.67 675.00 762.59 839.69 893.59 1043.74 1220.00 1351.42 1491.72 1975.04 2218.606 Goa 6.95 0.67 0.67 0.67 0.67 0.05 0.55 2.30 0.03 1.40 0.80 0.60 0.707 Gujarat 611.59 621.89 610.20 585.78 689.89 837.35 837.35 282.48 387.00 248.40 284.52 552.93 185.238 Haryana 282.08 331.14 309.76 332.20 404.99 643.41 744.21 734.55 909.37 548.60 614.02 704.60 477.689 Himachal Pradesh 21.27 16.98 21.92 21.60 21.75 20.32 20.32 22.02 22.22 25.70 59.92 62.50 4.7010 Jammu & Kashmir 17.07 17.30 17.12 18.12 20.10 26.00 26.00 34.50 34.95 54.00 62.00 77.00 71.2011 Jharkhand 17.27 28.71 28.71 77.11 540.50 630.70 649.70 931.00 1071.80 1108.48 1702.39 4150.10 10334.9112 Karnataka 215.72 195.43 228.70 206.80 296.50 1158.41 1216.61 428.23 496.62 529.96 591.52 499.88 248.1113 Kerala 12.48 12.70 12.70 12.70 12.70 12.70 12.70 18.00 18.00 123.93 166.88 177.09 173.0414 Madhya Pradesh 438.62 485.87 496.58 5235.22 5489.62 619.87 1500.99 798.01 963.08 1001.88 952.05 1111.33 1117.2315 Maharashtra 85.40 549.73 200.61 149.43 188.90 190.89 1396.89 94.52 187.50 65.18 98.96 189.55 625.0016 Manipur 123.00 129.00 125.00 125.00 127.00 134.00 134.00 139.00 157.00 167.00 219.00 215.00 250.0017 Meghalaya 0.77 0.77 0.93 1.13 1.21 2.96 2.96 2.18 3.14 7.05 11.07 7.56 9.7018 Mizoram 18.00 18.20 18.20 16.50 17.00 16.60 17.30 54.00 30.00 30.00 30.00 31.00 42.6019 Nagaland 43.00 48.00 48.00 48.50 48.10 47.50 49.50 48.00 48.50 47.70 47.80 48.00 48.1020 Odisha 321.40 546.72 640.00 2957.85 730.00 6087.04 6087.04 701.93 658.16 709.37 898.53 705.23 687.8321 Punjab 139.03 153.38 145.58 256.08 174.82 168.04 164.63 187.08 222.54 229.74 234.75 237.50 277.9822 Rajasthan 299.00 342.00 350.38 350.38 349.57 455.26 449.69 1795.28 776.00 826.26 871.84 1098.86 1065.3023 Sikkim 2.50 2.50 3.00 3.20 3.80 3.00 3.00 2.10 2.05 2.95 2.02 2.32 0.6524 Tamil Nadu 529.28 529.28 529.28 529.28 529.28 291.82 431.84 188.20 2871.50 449.80 415.66 573.24 557.2825 Telangana - - - - - - - - - 39.79 38.19 187.60 417.9026 Tripura 546.53 420.00 506.00 305.50 301.00 602.00 730.00 700.00 798.00 328.56 298.76 313.70 435.0027 Uttarakhand 31.69 28.21 37.42 38.32 34.47 100.44 100.16 42.98 44.43 48.57 62.90 74.69 67.8828 Uttar Pradesh 1085.75 1091.56 1182.99 1304.18 1147.48 1302.26 1476.40 1595.11 1637.76 1661.54 1829.93 2753.56 2712.8729 West Bengal 12200.33 13200.00 13572.00 14181.00 12566.00 13453.00 13826.00 15002.00 15890.00 16717.00 17521.00 11570.00 12455.0030 A & N Islands 0.71 0.58 0.51 1.50 1.00 0.56 0.56 1.06 7.22 1.21 10.74 1.28 1.4731 Chandigarh 0.70 0.80 3.20 0.80 1.60 0.80 2.40 1.60 0.80 0.80 0.80 0.80 0.8032 Dadra & Nagar Haveli 0.00 0.00 0.00 0.00 0.00 0.00 0.00 0.00 0.00 0.00 0.00 0.00 0.0033 Daman Diu 0.00 0.00 0.00 0.00 0.00 0.00 0.00 0.00 0.00 0.00 0.00 0.00 0.0034 Delhi 2.34 2.25 2.27 2.32 1.39 1.30 1.30 1.53 1.53 1.62 1.62 1.63 2.0035 Lakshadweep 0.00 0.00 0.00 0.00 0.00 0.00 0.00 0.00 0.00 0.00 0.00 0.00 0.0036 Puducherry 0.00 0.00 0.00 0.00 0.00 0.00 0.00 0.00 0.00 0.00 0.00 0.00 0.00
INDIA 21988.30 23647.95 24143.57 32177.21 29313.17 34110.83 36566.43 34921.80 41449.95 39350.39 41824.23 42803.61 52261.89Source : Director of Fisheries State Govts. / UT Administrations
TABLE A-12 : FISH SEED PRODUCTION BY STATES / UNION TERRITORIES, 2005-06 to 2017-18
29
HANDBOOK ON FISHERIES STATISTICS 2018
(in million fry) (in million fry)S.
No. State/Union Territory 2005-06 2006-07 2007-08 2008-09 2009-10 2010-11 2011-12 2012-13 2013-14 2014-15 2015-16 2016-17 2017-18
1 Andhra Pradesh 851.90 860.14 860.14 982.05 1165.46 1899.47 1899.47 5228.47 6562.63 6718.98 7097.25 7923.30 8845.502 Arunachal Pradesh 25.45 30.00 26.50 27.00 29.00 27.20 22.90 4.10 9.64 5.00 5.50 6.50 7.003 Assam 3207.99 3062.00 3206.00 3429.00 3326.00 4263.00 3624.00 4364.00 4546.00 5793.00 5678.00 6758.00 8000.004 Bihar 344.94 330.46 309.53 302.99 330.78 275.19 244.37 473.83 1872.48 505.50 524.10 793.22 920.635 Chhattisgarh 505.54 591.68 649.67 675.00 762.59 839.69 893.59 1043.74 1220.00 1351.42 1491.72 1975.04 2218.606 Goa 6.95 0.67 0.67 0.67 0.67 0.05 0.55 2.30 0.03 1.40 0.80 0.60 0.707 Gujarat 611.59 621.89 610.20 585.78 689.89 837.35 837.35 282.48 387.00 248.40 284.52 552.93 185.238 Haryana 282.08 331.14 309.76 332.20 404.99 643.41 744.21 734.55 909.37 548.60 614.02 704.60 477.689 Himachal Pradesh 21.27 16.98 21.92 21.60 21.75 20.32 20.32 22.02 22.22 25.70 59.92 62.50 4.7010 Jammu & Kashmir 17.07 17.30 17.12 18.12 20.10 26.00 26.00 34.50 34.95 54.00 62.00 77.00 71.2011 Jharkhand 17.27 28.71 28.71 77.11 540.50 630.70 649.70 931.00 1071.80 1108.48 1702.39 4150.10 10334.9112 Karnataka 215.72 195.43 228.70 206.80 296.50 1158.41 1216.61 428.23 496.62 529.96 591.52 499.88 248.1113 Kerala 12.48 12.70 12.70 12.70 12.70 12.70 12.70 18.00 18.00 123.93 166.88 177.09 173.0414 Madhya Pradesh 438.62 485.87 496.58 5235.22 5489.62 619.87 1500.99 798.01 963.08 1001.88 952.05 1111.33 1117.2315 Maharashtra 85.40 549.73 200.61 149.43 188.90 190.89 1396.89 94.52 187.50 65.18 98.96 189.55 625.0016 Manipur 123.00 129.00 125.00 125.00 127.00 134.00 134.00 139.00 157.00 167.00 219.00 215.00 250.0017 Meghalaya 0.77 0.77 0.93 1.13 1.21 2.96 2.96 2.18 3.14 7.05 11.07 7.56 9.7018 Mizoram 18.00 18.20 18.20 16.50 17.00 16.60 17.30 54.00 30.00 30.00 30.00 31.00 42.6019 Nagaland 43.00 48.00 48.00 48.50 48.10 47.50 49.50 48.00 48.50 47.70 47.80 48.00 48.1020 Odisha 321.40 546.72 640.00 2957.85 730.00 6087.04 6087.04 701.93 658.16 709.37 898.53 705.23 687.8321 Punjab 139.03 153.38 145.58 256.08 174.82 168.04 164.63 187.08 222.54 229.74 234.75 237.50 277.9822 Rajasthan 299.00 342.00 350.38 350.38 349.57 455.26 449.69 1795.28 776.00 826.26 871.84 1098.86 1065.3023 Sikkim 2.50 2.50 3.00 3.20 3.80 3.00 3.00 2.10 2.05 2.95 2.02 2.32 0.6524 Tamil Nadu 529.28 529.28 529.28 529.28 529.28 291.82 431.84 188.20 2871.50 449.80 415.66 573.24 557.2825 Telangana - - - - - - - - - 39.79 38.19 187.60 417.9026 Tripura 546.53 420.00 506.00 305.50 301.00 602.00 730.00 700.00 798.00 328.56 298.76 313.70 435.0027 Uttarakhand 31.69 28.21 37.42 38.32 34.47 100.44 100.16 42.98 44.43 48.57 62.90 74.69 67.8828 Uttar Pradesh 1085.75 1091.56 1182.99 1304.18 1147.48 1302.26 1476.40 1595.11 1637.76 1661.54 1829.93 2753.56 2712.8729 West Bengal 12200.33 13200.00 13572.00 14181.00 12566.00 13453.00 13826.00 15002.00 15890.00 16717.00 17521.00 11570.00 12455.0030 A & N Islands 0.71 0.58 0.51 1.50 1.00 0.56 0.56 1.06 7.22 1.21 10.74 1.28 1.4731 Chandigarh 0.70 0.80 3.20 0.80 1.60 0.80 2.40 1.60 0.80 0.80 0.80 0.80 0.8032 Dadra & Nagar Haveli 0.00 0.00 0.00 0.00 0.00 0.00 0.00 0.00 0.00 0.00 0.00 0.00 0.0033 Daman Diu 0.00 0.00 0.00 0.00 0.00 0.00 0.00 0.00 0.00 0.00 0.00 0.00 0.0034 Delhi 2.34 2.25 2.27 2.32 1.39 1.30 1.30 1.53 1.53 1.62 1.62 1.63 2.0035 Lakshadweep 0.00 0.00 0.00 0.00 0.00 0.00 0.00 0.00 0.00 0.00 0.00 0.00 0.0036 Puducherry 0.00 0.00 0.00 0.00 0.00 0.00 0.00 0.00 0.00 0.00 0.00 0.00 0.00
INDIA 21988.30 23647.95 24143.57 32177.21 29313.17 34110.83 36566.43 34921.80 41449.95 39350.39 41824.23 42803.61 52261.89Source : Director of Fisheries State Govts. / UT Administrations
TABLE A-12 : FISH SEED PRODUCTION BY STATES / UNION TERRITORIES, 2005-06 to 2017-18

SECTION : B
EXPORTS
33
HANDBOOK ON FISHERIES STATISTICS 2018
Year Quantity (Tonnes)
Value (` Crore)
Unit value (`/tonnes)
Unit value Index
Annual growth rate(%)
Quantity Value
1990-91 137667.00 856.00 62179.03 2495.41 24.20 34.81
1991-92 169875.00 1311.60 77209.71 3098.63 23.40 53.22
1992-93 206673.00 1713.70 82918.43 3327.74 21.66 30.66
1993-94 242505.00 2461.00 101482.44 4072.76 17.34 43.61
1994-95 307337.00 3575.30 116331.58 4668.70 26.73 45.28
1995-96 296277.26 3501.11 118169.95 4742.47 -3.60 -2.08
1996-07 378198.80 4121.36 108973.49 4373.40 27.65 17.72
1997-98 385818.15 4697.48 121753.61 4886.30 2.01 13.98
1998-99 302933.85 4626.86 152735.10 6129.66 -21.48 -1.50
1999-00 343030.53 5116.67 149160.83 5986.22 13.24 10.59
2000-01 440473.00 6443.89 146294.78 5871.20 28.41 25.94
2001-02 424470.00 5957.05 140340.90 5632.25 -3.63 -7.56
2002-03 467297.00 6881.31 147257.74 5909.84 10.09 15.52
2003-04 412017.00 6091.95 147856.76 5933.88 -11.83 -11.47
2004-05 461328.51 6646.69 144077.12 5782.20 11.97 9.11
2005-06 512163.56 7245.30 141464.52 5677.35 11.02 9.01
2006-07 612641.50 8363.53 136515.83 5478.74 19.62 15.43
2007-08 541700.83 7620.92 140685.00 5646.06 -11.58 -8.88
2008-09 602835.34 8607.94 142790.92 5730.58 11.29 12.95
2009-10 678436.07 10048.53 148113.14 5944.17 12.54 16.74
2010-11 813090.85 12901.47 158671.89 6367.92 19.85 28.39
2011-12 862021.41 16597.23 192538.46 7727.08 6.02 28.65
2012-13 928214.67 18856.26 203145.42 8152.76 7.68 13.61
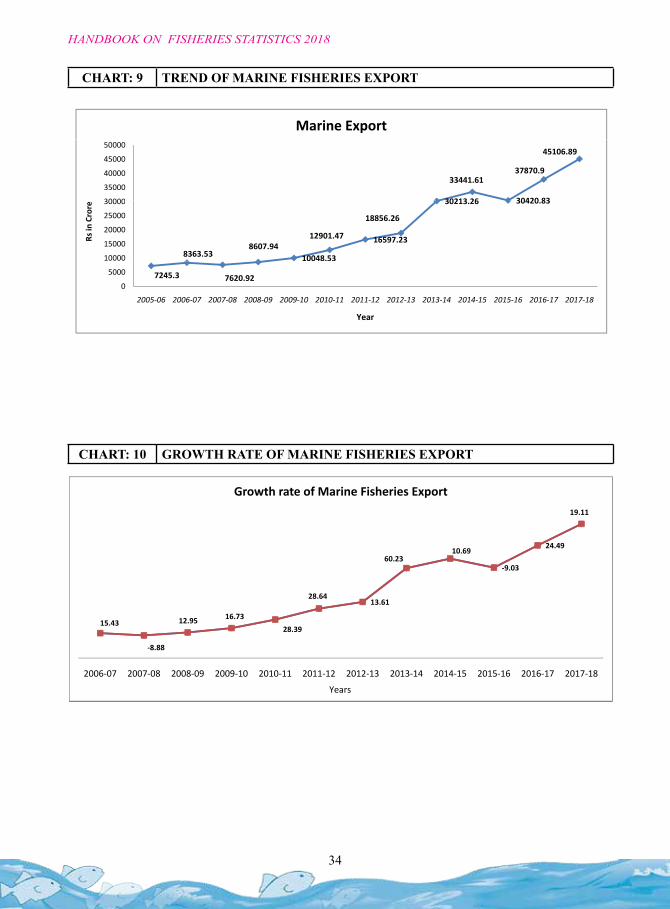
2013-14 983755.56 30213.26 307121.60 12325.60 5.98 60.23
2014-15 1051243.49 33441.61 318114.75 12766.79 6.86 10.69
2015-16 945891.90 30420.83 321609.99 12907.06 -10.02 -9.03
2016-17 1134948.09 37870.90 333679.62 13391.45 19.99 24.49
2017-18 1377243.70 45106.89 327515.69 13144.07 21.35 19.11
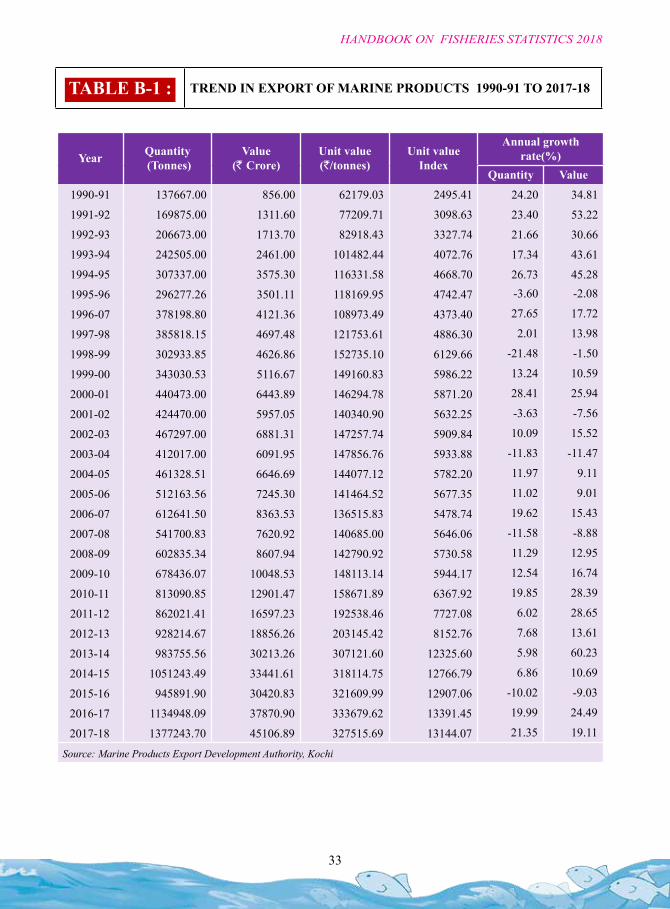
Source: Marine Products Export Development Authority, Kochi
TABLE B-1 : TREND IN EXPORT OF MARINE PRODUCTS 1990-91 TO 2017-18
34
HANDBOOK ON FISHERIES STATISTICS 2018
CHART: 9 TREND OF MARINE FISHERIES EXPORT
CHART: 10 GROWTH RATE OF MARINE FISHERIES EXPORT
CHART ‐10: TREND OF MARINE FISHERIES EXPORT
Marine Export
30213 26
33441.61
30420 83
37870.9
45106.89
30000
35000
40000
45000
50000
8363.538607.94
10048.53
12901.47 16597.23
18856.26
30213.26 30420.83
10000
15000
20000
25000
30000
Rs in
Crore
7245.3 7620.920
5000
2005‐06 2006‐07 2007‐08 2008‐09 2009‐10 2010‐11 2011‐12 2012‐13 2013‐14 2014‐15 2015‐16 2016‐17 2017‐18
Year
19.11
Growth rate of Marine Fisheries Export
60.2310.69
-9.03
24.49
15.43
-8.88
12.95 16.73
28.39
28.6413.61
2006-07 2007-08 2008-09 2009-10 2010-11 2011-12 2012-13 2013-14 2014-15 2015-16 2016-17 2017-18
Years
35
HANDBOOK ON FISHERIES STATISTICS 2018
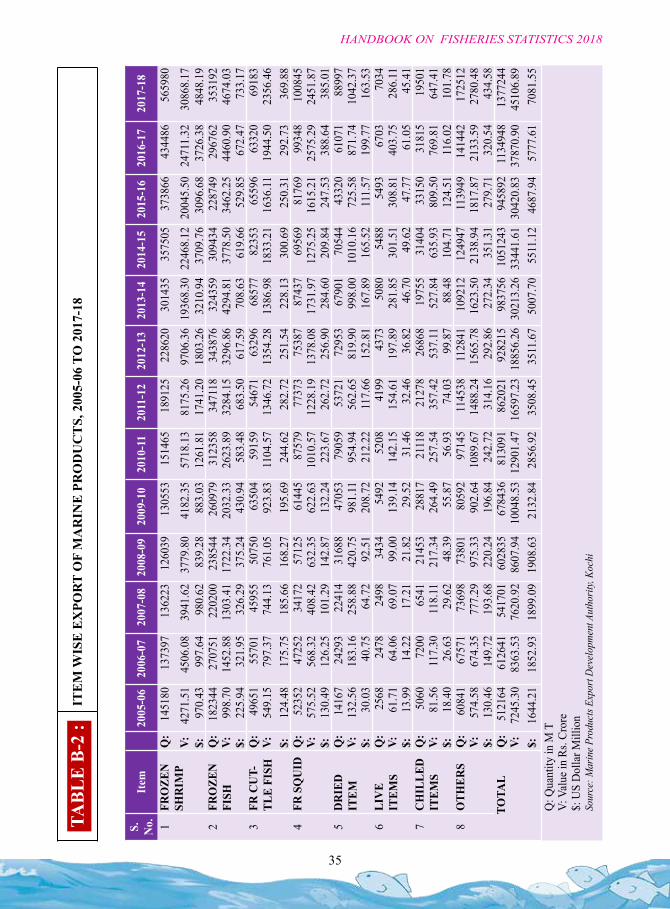
TABL
E B-
2 :
ITE
M W
ISE
EX
POR
T O
F M
AR
INE
PR
OD
UC
TS,
200
5-06
TO
201
7-18
S.
No.
Item
2005
-06
2006
-07
2007
-08
2008
-09
2009
-10
2010
-11
2011
-12
2012
-13
2013
-14
2014
-15
2015
-16
2016
-17
2017
-18
1FR
OZE
N
SHR
IMP
Q:
1451
8013
7397
1362
2312
6039
1305
5315
1465
1891
2522
8620
3014
3535
7505
3738
6643
4486
5659
80
V:42
71.5
145
06.0
839
41.6
237
79.8
041
82.3
557
18.1
381
75.2
697
06.3
619
368.
3022
468.
1220
045.
5024
711.
3230
868.
17$:
970.
4399
7.64
980.
6283
9.28
883.
0312
61.8
117
41.2
018
03.2
632
10.9
437
09.7
630
96.6
837
26.3
848
48.1
92
FRO
ZEN
FI
SHQ
:18
2344
2707
5122
0200
2385
4426
0979
3123
5834
7118
3438
7632
4359
3094
3422
8749
2967
6235
3192
V:99
8.70
1452
.88
1303
.41
1722
.34
2032
.33
2623
.89
3284
.15
3296
.86
4294
.81
3778
.50
3462
.25
4460
.90
4674
.03
$:22
5.94
321.
9532
6.29
375.
2443
0.94
583.
4868
3.50
617.
5970
8.63
619.
6652
9.85
672.
4773
3.17
3FR
CU
T -TL
E FI
SHQ
:49
651
5570
145
955
5075
063
504
5915
954
671
6329
668
577
8235
365
596
6332
069
183
V:54
9.15
797.
3774
4.13
761.
0592
3.83
1104
.57
1346
.72
1354
.28
1386
.98
1833
.21
1636
.11
1944
.50
2356
.46
$:12
4.48
175.
7518
5.66
168.
2719
5.69
244.
6228
2.72
251.
5422
8.13
300.
6925
0.31
292.
7336
9.88
4FR
SQ
UID
Q:
5235
247
252
3417
257
125
6144
587
579
7737
375
387
8743
769
569
8176
999
348
1008
45V:
575.
5256
8.32
408.
4263
2.35
622.
6310
10.5
712
28.1
913
78.0
817
31.9
712
75.2
516
15.2
125
75.2
924
51.8
7$:
130.
4912
6.25
101.
2914
2.87
132.
2422
3.67
262.
7225
6.90
284.
6020
9.84
247.
5338
8.64
385.
015
DR
IED
IT
EMQ
:14
167
2429
322
414
3168
847
053
7905
953
721
7295
367
901
7054
443
320
6107
188
997
V:13
2.56
183.
1625
8.88
420.
7598
1.11
954.
9456
2.65
819.
9099
8.00
1010
.16
725.
5887
1.74
1042
.37
$:30
.03
40.7
564
.72
92.5
120
8.72
212.
2211
7.66
152.
8116
7.89
165.
5211
1.57
199.
7716
3.53
6LI
VE
ITEM
SQ
:25
6824
7824
9834
3454
9252
0841
9943
7350
8054
8854
9367
0370
34V:
61.7
164
.06
69.0
799
.00
139.
1414
2.15
154.
6119
7.89
281.
8530
1.51
308.
8140
3.75
286.
11$:
13.9
914
.22
17.2
121
.82
29.5
231
.46
32.4
636
.82
46.7
049
.62
47.7
761
.05
45.4
17
CH
ILLE
D
ITEM
SQ
:50
6072
0065
4121
453
2881
721
118
2127
826
868
1975
531
404
3315
031
815
1950
1V:
81.5
611
7.30
118.
1121
7.34
264.
4925
7.54
357.
4253
7.11
527.
8463
5.93
809.
5076
9.81
647.
41$:
18.4
026
.63
29.6
248
.39
55.8
756
.93
74.0
399
.87
88.4
810
4.71
124.
5111
6.02
101.
788
OTH
ERS
Q:
6084
167
571
7369
873
801
8059
297
145
1145
3811
2841
1092
1212
4947
1139
4914
1442
1725
12V:
574.
5867
4.35
777.
2997
5.33
902.
6410
89.6
714
88.2
415
65.7
816
23.5
021
38.9
418
17.8
721
33.5
927
80.4
8$:
130.
4614
9.72
193.
6822
0.24
196.
8424
2.72
314.
1629
2.86
272.
3435
1.31
279.
7132
0.54
434.
58TO
TAL
Q:
5121
6461
2641
5417
0160
2835
6784
3681
3091
8620
2192
8215
9837
5610
5124
394
5892
1134
948
1377
244
V:72
45.3
083
63.5
376
20.9
286
07.9
410
048.
5312
901.
4716
597.
2318
856.
2630
213.
2633
441.
6130
420.
8337
870.
9045
106.
89$:
1644
.21
1852
.93
1899
.09
1908
.63
2132
.84
2856
.92
3508
.45
3511
.67
5007
.70
5511
.12
4687
.94
5777
.61
7081
.55
Q: Q
uant
ity in
M T
V: V
alue
in R
s. Cr
ore
$: U
S D
olla
r Mill
ion
Sour
ce: M
arin
e Pro
duct
s Exp
ort D
evel
opm
ent A
utho
rity,
Koch
i
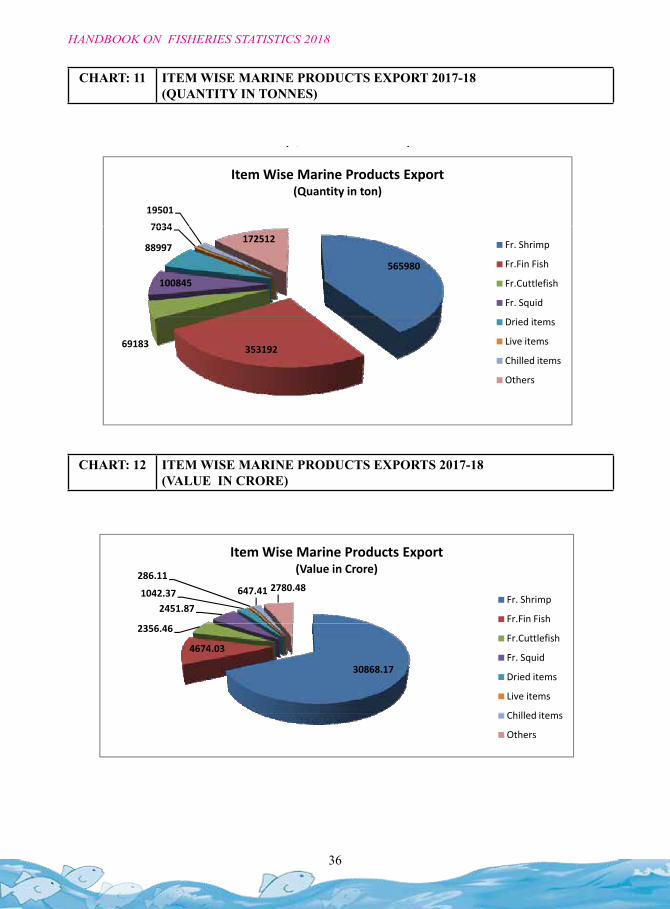
36
HANDBOOK ON FISHERIES STATISTICS 2018
CHART: 11 ITEM WISE MARINE PRODUCTS EXPORT 2017-18 (QUANTITY IN TONNES)
CHART: 12 ITEM WISE MARINE PRODUCTS EXPORTS 2017-18 (VALUE IN CRORE)
CHART ‐12: ITEM WISE MARINE PRODUCTS EXPORT 2017‐18(QUANTITY IN TONNES)(QUANTITY IN TONNES)
7034
19501
Item Wise Marine Products Export(Quantity in ton)
565980
100845
88997
7034172512 Fr. Shrimp
Fr.Fin Fish
Fr.Cuttlefish
Fr. Squid
35319269183
Dried items
Live items
Chilled items
Others
CHART ‐13: ITEM WISE MARINE PRODUCTS EXPORT 2017‐18 (VALUE IN CRORE)
2451.871042.37
286.11647.41 2780.48
Item Wise Marine Products Export(Value in Crore)
Fr. Shrimp
Fr.Fin Fish
30868.17
4674.03
2356.46Fr.Cuttlefish
Fr. Squid
Dried items
Live items
Chill d itChilled items
Others
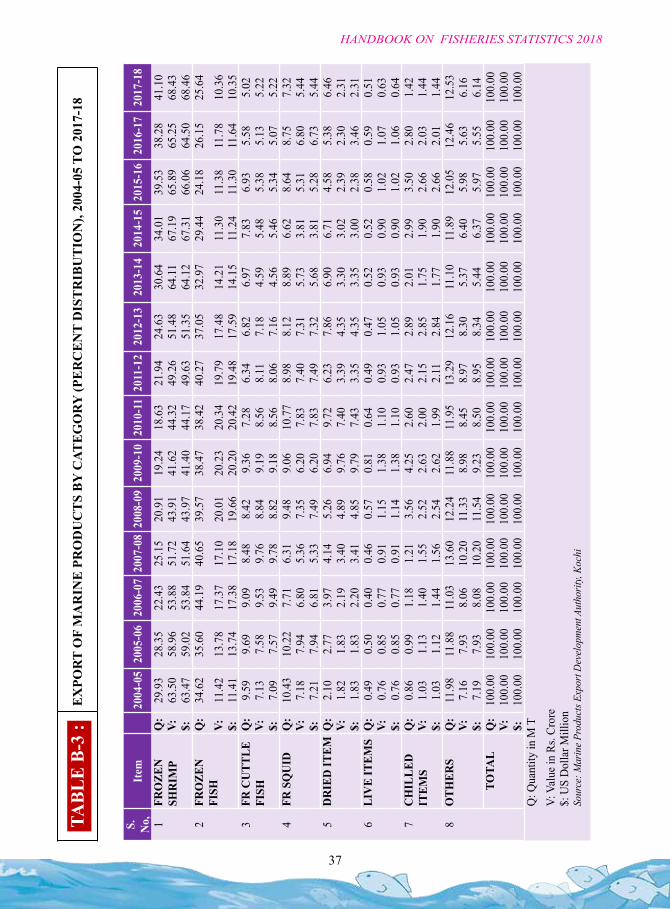
37
HANDBOOK ON FISHERIES STATISTICS 2018
S.
No,
It
em20
04-0
520
05-0
620
06-0
720
07-0
820
08-0
920
09-1
020
10-1
120
11-1
220
12-1
320
13-1
420
14-1
520
15-1
620
16-1
720
17-1
8
1FR
OZE
N
SHR
IMP
Q:
29.9
328
.35
22.4
325
.15
20.9
119
.24
18.6
321
.94
24.6
330
.64
34.0
139
.53
38.2
841
.10
V:63
.50
58.9
653
.88
51.7
243
.91
41.6
244
.32
49.2
651
.48
64.1
167
.19
65.8
965
.25
68.4
3$:
63.4
759
.02
53.8
451
.64
43.9
741
.40
44.1
749
.63
51.3
564
.12
67.3
166
.06
64.5
068
.46
2FR
OZE
N
FISH
Q:
34.6
235
.60
44.1
940
.65
39.5
738
.47
38.4
240
.27
37.0
532
.97
29.4
424
.18
26.1
525
.64
V:11
.42
13.7
817
.37
17.1
020
.01
20.2
320
.34
19.7
917
.48
14.2
111
.30
11.3
811
.78
10.3
6$:
11.4
113
.74
17.3
817
.18
19.6
620
.20
20.4
219
.48
17.5
914
.15
11.2
411
.30
11.6
410
.35
3FR
CU
TTLE
FI
SHQ
:9.
599.
699.
098.
488.
429.
367.
286.
346.
826.
977.
836.
935.
585.
02V:
7.13
7.58
9.53
9.76
8.84
9.19
8.56
8.11
7.18
4.59
5.48
5.38
5.13
5.22
$:7.
097.
579.
499.
788.
829.
188.
568.
067.
164.
565.
465.
345.
075.
224
FR S
QU
IDQ
:10
.43
10.2
27.
716.
319.
489.
0610
.77
8.98
8.12
8.89
6.62
8.64
8.75
7.32
V:7.
187.
946.
805.
367.
356.
207.
837.
407.
315.
733.
815.
316.
805.
44$:
7.21
7.94
6.81
5.33
7.49
6.20
7.83
7.49
7.32
5.68
3.81
5.28
6.73
5.44
5D
RIE
D IT
EMQ
:2.
102.
773.
974.
145.
266.
949.
726.
237.
866.
906.
714.
585.
386.
46V:
1.82
1.83
2.19
3.40
4.89
9.76
7.40
3.39
4.35
3.30
3.02
2.39
2.30
2.31
$:1.
831.
832.
203.
414.
859.
797.
433.
354.
353.
353.
002.
383.
462.
316
LIV
E IT
EMS
Q:
0.49
0.50
0.40
0.46
0.57
0.81
0.64
0.49
0.47
0.52
0.52
0.58
0.59
0.51
V:0.
760.
850.
770.
911.
151.
381.
100.
931.
050.
930.
901.
021.
070.
63$:
0.76
0.85
0.77
0.91
1.14
1.38
1.10
0.93
1.05
0.93
0.90
1.02
1.06
0.64
7C
HIL
LED
IT
EMS
Q:
0.86
0.99
1.18
1.21
3.56
4.25
2.60
2.47
2.89
2.01
2.99
3.50
2.80
1.42
V:1.
031.
131.
401.
552.
522.
632.
002.
152.
851.
751.
902.
662.
031.
44$:
1.03
1.12
1.44
1.56
2.54
2.62
1.99
2.11
2.84
1.77
1.90
2.66
2.01
1.44
8O
THER
SQ
:11
.98
11.8
811
.03
13.6
012
.24
11.8
811
.95
13.2
912
.16
11.1
011
.89
12.0
512
.46
12.5
3V:
7.16
7.93
8.06
10.2
011
.33
8.98
8.45
8.97
8.30
5.37
6.40
5.98
5.63
6.16
$:7.
197.
938.
0810
.20
11.5
49.
238.
508.
958.
345.
446.
375.
975.
556.
14TO
TAL
Q:
100.
0010
0.00
100.
0010
0.00
100.
0010
0.00
100.
0010
0.00
100.
0010
0.00
100.
0010
0.00
100.
0010
0.00
V:10
0.00
100.
0010
0.00
100.
0010
0.00
100.
0010
0.00
100.
0010
0.00
100.
0010
0.00
100.
0010
0.00
100.
00$:
100.
0010
0.00
100.
0010
0.00
100.
0010
0.00
100.
0010
0.00
100.
0010
0.00
100.
0010
0.00
100.
0010
0.00
Q: Q
uant
ity in
M T
V: V
alue
in R
s. Cr
ore
$: U
S D
olla
r Mill
ion
Sour
ce: M
arin
e Pro
duct
s Exp
ort D
evel
opm
ent A
utho
rity,
Koch
i
TABL
E B-
3 :
EX
POR
T O
F M
AR
INE
PR
OD
UC
TS
BY
CAT
EG
OR
Y (P
ER
CE
NT
DIS
TR
IBU
TIO
N),
2004
-05
TO 2
017-
18
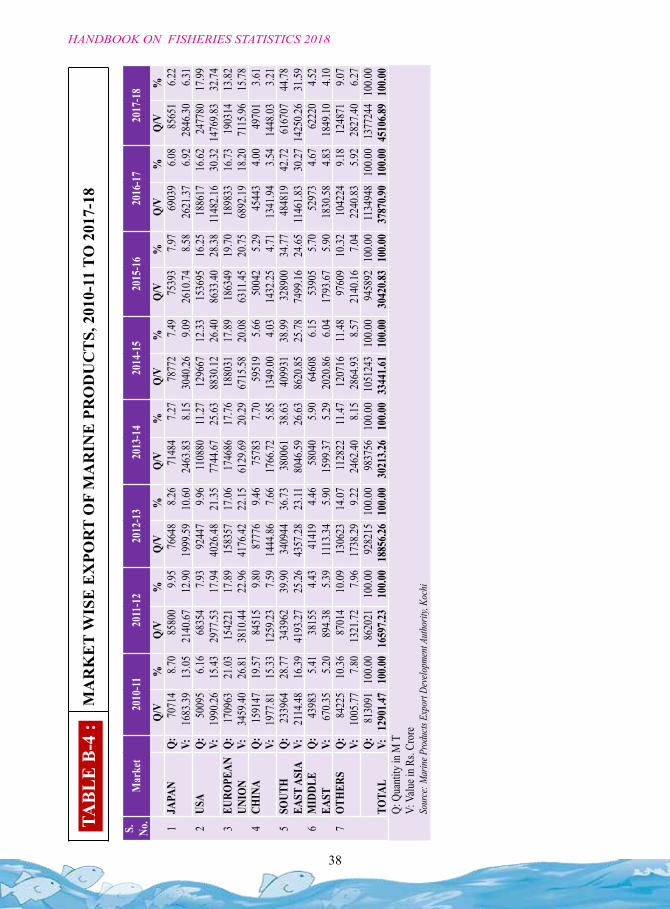
38
HANDBOOK ON FISHERIES STATISTICS 2018
TABL
E B-
4 :
MA
RK
ET
WIS
E E
XPO
RT
OF
MA
RIN
E P
RO
DU
CT
S, 2
010-
11 T
O 2
017-
18
S.
No.
Mar
ket
2010
-1120
11-1
220
12-1
320
13-1
420
14-1
520
15-1
620
16-1
720
17-1
8
Q/V
%Q/
V%
Q/V
%Q/
V%
Q/V
%Q/
V%
Q/V
%Q/
V%
1JA
PAN
Q:70
714
8.70
8580
09.9
576
648
8.26
7148
47.2
778
772
7.49
7539
37.9
769
039
6.08
8565
16.2
2V:
1683
.3913
.0521
40.67
12.90
1999
.5910
.6024
63.83
8.15
3040
.269.0
926
10.74
8.58
2621
.376.9
228
46.30
6.31
2US
AQ:
5009
56.1
668
354
7.93
9244
79.9
611
0880
11.27
1296
6712
.3315
3695
16.25
1886
1716
.6224
7780
17.99
V:19
90.26
15.43
2977
.5317
.9440
26.48
21.35
7744
.6725
.6388
30.12
26.40
8633
.4028
.3811
482.1
630
.3214
769.8
332
.743
EURO
PEAN
UN
ION
Q:17
0963
21.03
1542
2117
.8915
8357
17.06
1746
8617
.7618
8031
17.89
1863
4919
.7018
9833
16.73
1903
1413
.82V:
3459
.4026
.8138
10.44
22.96
4176
.4222
.1561
29.69
20.29
6715
.5820
.0863
11.45
20.75
6892
.1918
.2071
15.96
15.78
4CH
INA
Q:15
9147
19.57
8451
59.8
087
776
9.46
7578
37.7
059
519
5.66
5004
25.2
945
443
4.00
4970
13.6
1V:
1977
.8115
.3312
59.23
7.59
1444
.867.6
617
66.72
5.85
1349
.004.0
314
32.25
4.71
1341
.943.5
414
48.03
3.21
5SO
UTH
EAST
ASI
AQ:
2339
6428
.7734
3962
39.90
3409
4436
.7338
0061
38.63
4099
3138
.9932
8900
34.77
4848
1942
.7261
6707
44.78
V:21
14.48
16.39
4193
.2725
.2643
57.28
23.11
8046
.5926
.6386
20.85
25.78
7499
.1624
.6511
461.8
330
.2714
250.2
631
.596
MID
DLE
EAST
Q:43
983
5.41
3815
54.4
341
419
4.46
5804
05.9
064
608
6.15
5390
55.7
052
973
4.67
6222
04.5
2V:
670.3
55.2
089
4.38
5.39
1113
.345.9
015
99.37
5.29
2020
.866.0
417
93.67
5.90
1830
.584.8
318
49.10
4.10
7OT
HERS
Q:84
225
10.36
8701
410
.0913
0623
14.07
1128
2211
.4712
0716
11.48
9760
910
.3210
4224
9.18
1248
719.0
7V:
1005
.777.8
013
21.72
7.96
1738
.299.2
224
62.40
8.15
2864
.938.5
721
40.16
7.04
2240
.835.9
228
27.40
6.27
Q:81
3091
100.0
086
2021
100.0
092
8215
100.0
098
3756
100.0
010
5124
310
0.00
9458
9210
0.00
1134
948
100.0
013
7724
410
0.00
TOTA
LV:
1290
1.47
100.0
016
597.2
310
0.00
1885
6.26
100.0
030
213.2
610
0.00
3344
1.61
100.0
030
420.8
310
0.00
3787
0.90
100.0
045
106.8
910
0.00
Q: Q
uant
ity in
M T
V: V
alue i
n Rs.
Cror
eSo
urce
: Mar
ine P
rodu
cts E
xpor
t Dev
elopm
ent A
uthor
ity, K
ochi
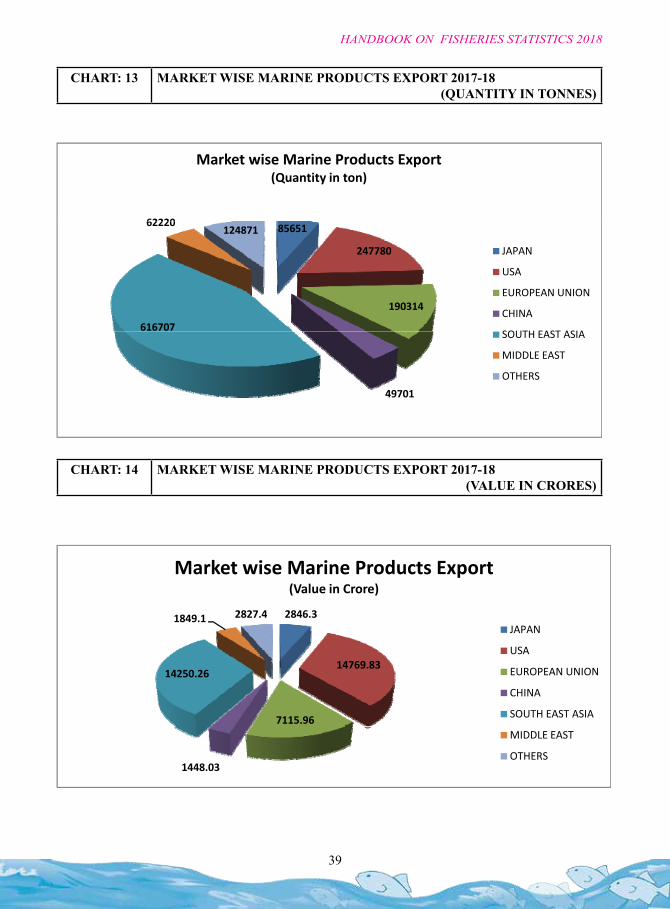
39
HANDBOOK ON FISHERIES STATISTICS 2018
CHART: 13 MARKET WISE MARINE PRODUCTS EXPORT 2017-18(QUANTITY IN TONNES)
CHART: 14 MARKET WISE MARINE PRODUCTS EXPORT 2017-18 (VALUE IN CRORES)
CHART ‐14: MARKET WISE MARINE PRODUCTS EXPORT 2017‐18
62220
Market wise Marine Products Export(Quantity in ton)
85651
247780
190314
616707
62220124871
JAPAN
USA
EUROPEAN UNION
CHINA
SOUTH EAST ASIA
49701
SOUTH EAST ASIA
MIDDLE EAST
OTHERS
CHART ‐15: MARKET WISE MARINE PRODUCTS EXPORT 2017‐18(VALUE IN CRORE)(VALUE IN CRORE)
2846 31849 1 2827 4
Market wise Marine Products Export(Value in Crore)
2846.3
14769.83
7115.96
14250.26
1849.1 2827.4JAPAN
USA
EUROPEAN UNION
CHINA
SOUTH EAST ASIA
1448.03
MIDDLE EAST
OTHERS
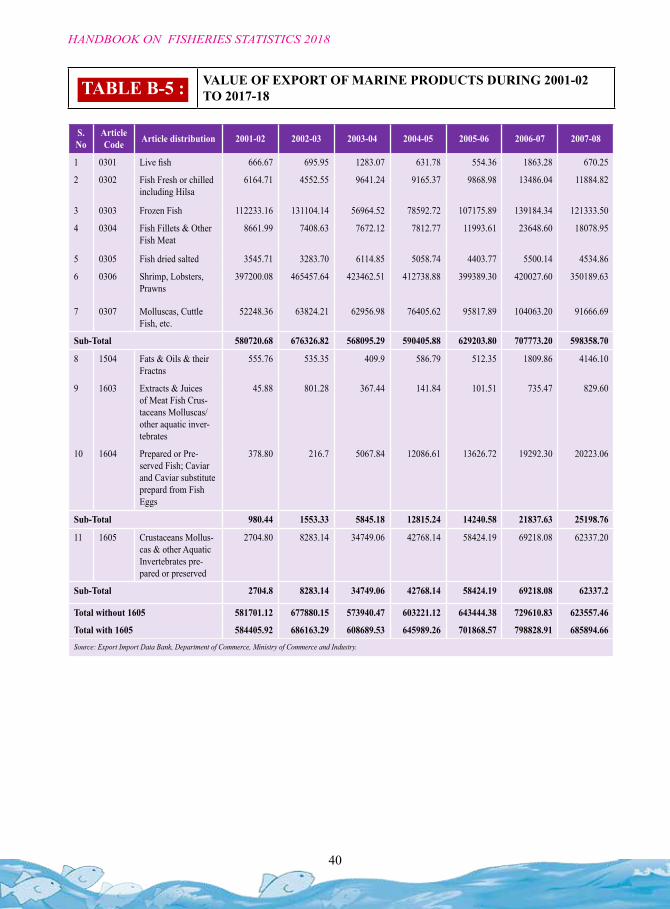
40
HANDBOOK ON FISHERIES STATISTICS 2018
S. No
Article Code Article distribution 2001-02 2002-03 2003-04 2004-05 2005-06 2006-07 2007-08 2008-09 2009-10 2010-11 2011-12 2012-13 2013-14 2014-15 2015-16 2016-17 2017-18
1 0301 Live fish 666.67 695.95 1283.07 631.78 554.36 1863.28 670.25 884.56 573.16 502.35 665.71 625.83 2023.25 931.75 750.00 1349.87 1305.59
2 0302 Fish Fresh or chilled including Hilsa
6164.71 4552.55 9641.24 9165.37 9868.98 13486.04 11884.82 13125.35 17030.78 16391.61 24931.60 40448.7 58585.16 54992.82 57401.20 50902.60 31206.04
3 0303 Frozen Fish 112233.16 131104.14 56964.52 78592.72 107175.89 139184.34 121333.50 97180.75 258339.52 277313.81 340250.43 347373.55 470331.01 407639.6 361378.18 455186.75 472764.75
4 0304 Fish Fillets & Other Fish Meat
8661.99 7408.63 7672.12 7812.77 11993.61 23648.60 18078.95 28961.75 49019.79 53362.34 90096.07 102915.16 78298.93 86183.09 101981.41 113780.94 161042.47
5 0305 Fish dried salted 3545.71 3283.70 6114.85 5058.74 4403.77 5500.14 4534.86 6701.66 10710.46 7515.44 11277.91 8345.35 21975.35 19841.68 34129.46 47678.15 48690.66
6 0306 Shrimp, Lobsters, Prawns
397200.08 465457.64 423462.51 412738.88 399389.30 420027.60 350189.63 352847.50 38644.94 513155.77 839100.40 1008157.32 1966830.54 2297262.2 2031775.80 2533135.96 3163349.69
7 0307 Molluscas, Cuttle Fish, etc.
52248.36 63824.21 62956.98 76405.62 95817.89 104063.20 91666.69 96120.93 136075.94 186652.54 277367.45 299261.64 341956.21 339917.57 349776.63 487267.45 538617.54
Sub-Total 580720.68 676326.82 568095.29 590405.88 629203.80 707773.20 598358.70 595822.50 510394.59 1054893.86 1583689.57 1807127.55 2940000.45 3206768.71 2937192.68 3689301.72 4416976.74
8 1504 Fats & Oils & their Fractns
555.76 535.35 409.9 586.79 512.35 1809.86 4146.10 3688.55 4500.60 6487.22 11815.64 18854.62 19752.52 25686.82 16659.15 13506.18 20688.11
9 1603 Extracts & Juices of Meat Fish Crus-taceans Molluscas/ other aquatic inver-tebrates
45.88 801.28 367.44 141.84 101.51 735.47 829.60 1703.89 9153.72 19849.15 8369.82 224.90 178.19 78.36 380.63 836.88 286.49
10 1604 Prepared or Pre-served Fish; Caviar and Caviar substitute prepard from Fish Eggs
378.80 216.7 5067.84 12086.61 13626.72 19292.30 20223.06 27618.40 25263.76 31321.90 26446.25 16971.79 20040.22 19582.94 22362.66 25674.41 27205.98
Sub-Total 980.44 1553.33 5845.18 12815.24 14240.58 21837.63 25198.76 33010.84 38918.08 57658.27 46631.71 36051.31 39970.93 45348.12 39402.44 40017.47 48180.58
11 1605 Crustaceans Mollus-cas & other Aquatic Invertebrates pre-pared or preserved
2704.80 8283.14 34749.06 42768.14 58424.19 69218.08 62337.20 74126.05 83953.05 72802.47 22219.70 33181.49 51729.27 74167.15 115665.00 185774.98 243779.54
Sub-Total 2704.8 8283.14 34749.06 42768.14 58424.19 69218.08 62337.2 74126.05 83953.05 72802.47 22219.70 33181.49 51729.27 74167.15 115665.00 185774.98 243779.54
Total without 1605 581701.12 677880.15 573940.47 603221.12 643444.38 729610.83 623557.46 628833.34 549312.67 1112552.13 1630321.28 1843178.86 2979971.38 3252116.83 2976595.12 3729319.19 4465157.32
Total with 1605 584405.92 686163.29 608689.53 645989.26 701868.57 798828.91 685894.66 702959.39 633265.72 1185354.6 1652540.98 1876360.35 3031700.65 3326283.98 3092260.12 3915094.17 4708936.86Source: Export Import Data Bank, Department of Commerce, Ministry of Commerce and Industry.
TABLE B-5 : VALUE OF EXPORT OF MARINE PRODUCTS DURING 2001-02 TO 2017-18
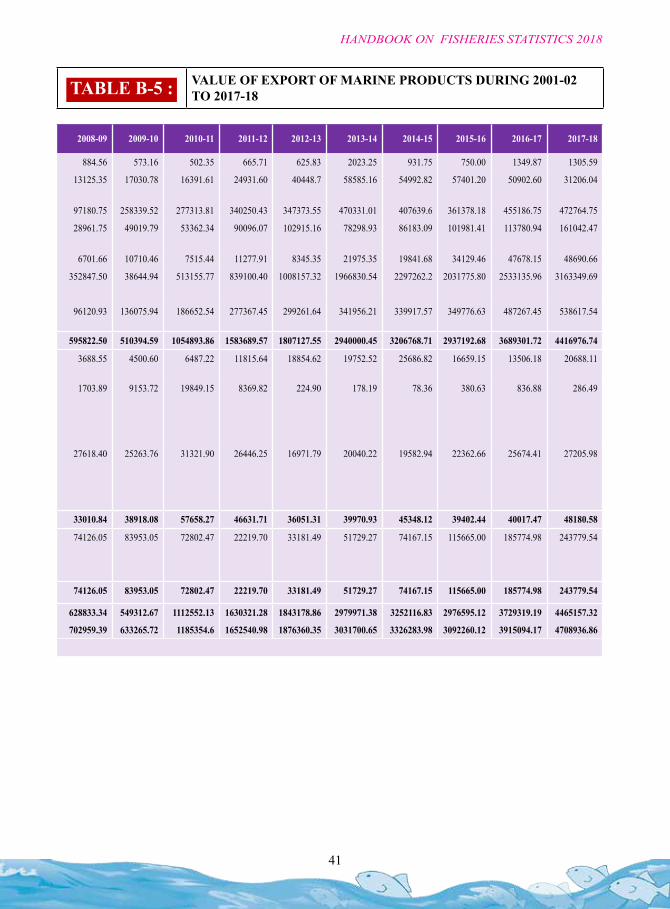
41
HANDBOOK ON FISHERIES STATISTICS 2018
S. No
Article Code Article distribution 2001-02 2002-03 2003-04 2004-05 2005-06 2006-07 2007-08 2008-09 2009-10 2010-11 2011-12 2012-13 2013-14 2014-15 2015-16 2016-17 2017-18
1 0301 Live fish 666.67 695.95 1283.07 631.78 554.36 1863.28 670.25 884.56 573.16 502.35 665.71 625.83 2023.25 931.75 750.00 1349.87 1305.59
2 0302 Fish Fresh or chilled including Hilsa
6164.71 4552.55 9641.24 9165.37 9868.98 13486.04 11884.82 13125.35 17030.78 16391.61 24931.60 40448.7 58585.16 54992.82 57401.20 50902.60 31206.04
3 0303 Frozen Fish 112233.16 131104.14 56964.52 78592.72 107175.89 139184.34 121333.50 97180.75 258339.52 277313.81 340250.43 347373.55 470331.01 407639.6 361378.18 455186.75 472764.75
4 0304 Fish Fillets & Other Fish Meat
8661.99 7408.63 7672.12 7812.77 11993.61 23648.60 18078.95 28961.75 49019.79 53362.34 90096.07 102915.16 78298.93 86183.09 101981.41 113780.94 161042.47
5 0305 Fish dried salted 3545.71 3283.70 6114.85 5058.74 4403.77 5500.14 4534.86 6701.66 10710.46 7515.44 11277.91 8345.35 21975.35 19841.68 34129.46 47678.15 48690.66
6 0306 Shrimp, Lobsters, Prawns
397200.08 465457.64 423462.51 412738.88 399389.30 420027.60 350189.63 352847.50 38644.94 513155.77 839100.40 1008157.32 1966830.54 2297262.2 2031775.80 2533135.96 3163349.69
7 0307 Molluscas, Cuttle Fish, etc.
52248.36 63824.21 62956.98 76405.62 95817.89 104063.20 91666.69 96120.93 136075.94 186652.54 277367.45 299261.64 341956.21 339917.57 349776.63 487267.45 538617.54
Sub-Total 580720.68 676326.82 568095.29 590405.88 629203.80 707773.20 598358.70 595822.50 510394.59 1054893.86 1583689.57 1807127.55 2940000.45 3206768.71 2937192.68 3689301.72 4416976.74
8 1504 Fats & Oils & their Fractns
555.76 535.35 409.9 586.79 512.35 1809.86 4146.10 3688.55 4500.60 6487.22 11815.64 18854.62 19752.52 25686.82 16659.15 13506.18 20688.11
9 1603 Extracts & Juices of Meat Fish Crus-taceans Molluscas/ other aquatic inver-tebrates
45.88 801.28 367.44 141.84 101.51 735.47 829.60 1703.89 9153.72 19849.15 8369.82 224.90 178.19 78.36 380.63 836.88 286.49
10 1604 Prepared or Pre-served Fish; Caviar and Caviar substitute prepard from Fish Eggs
378.80 216.7 5067.84 12086.61 13626.72 19292.30 20223.06 27618.40 25263.76 31321.90 26446.25 16971.79 20040.22 19582.94 22362.66 25674.41 27205.98
Sub-Total 980.44 1553.33 5845.18 12815.24 14240.58 21837.63 25198.76 33010.84 38918.08 57658.27 46631.71 36051.31 39970.93 45348.12 39402.44 40017.47 48180.58
11 1605 Crustaceans Mollus-cas & other Aquatic Invertebrates pre-pared or preserved
2704.80 8283.14 34749.06 42768.14 58424.19 69218.08 62337.20 74126.05 83953.05 72802.47 22219.70 33181.49 51729.27 74167.15 115665.00 185774.98 243779.54
Sub-Total 2704.8 8283.14 34749.06 42768.14 58424.19 69218.08 62337.2 74126.05 83953.05 72802.47 22219.70 33181.49 51729.27 74167.15 115665.00 185774.98 243779.54
Total without 1605 581701.12 677880.15 573940.47 603221.12 643444.38 729610.83 623557.46 628833.34 549312.67 1112552.13 1630321.28 1843178.86 2979971.38 3252116.83 2976595.12 3729319.19 4465157.32
Total with 1605 584405.92 686163.29 608689.53 645989.26 701868.57 798828.91 685894.66 702959.39 633265.72 1185354.6 1652540.98 1876360.35 3031700.65 3326283.98 3092260.12 3915094.17 4708936.86Source: Export Import Data Bank, Department of Commerce, Ministry of Commerce and Industry.
TABLE B-5 : VALUE OF EXPORT OF MARINE PRODUCTS DURING 2001-02 TO 2017-18
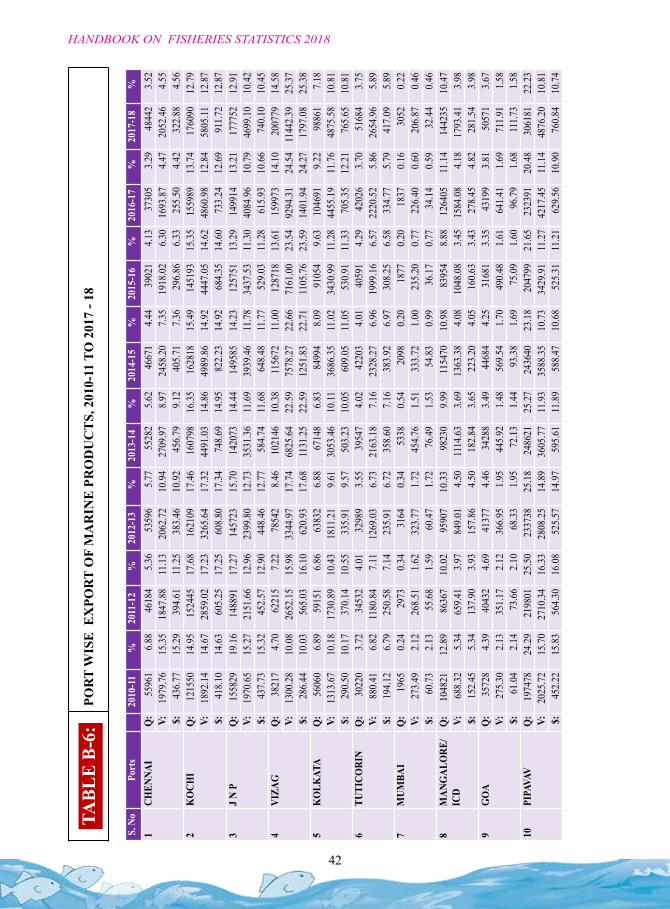
42
HANDBOOK ON FISHERIES STATISTICS 2018
S. N
oPo
rts
2010
-11
%20
11-1
2 %
2012
-13
%20
13-1
4 %
2014
-15
%20
15-1
6 %
2016
-17
%20
17-1
8 %
1CH
ENNA
IQ
:55
961
6.88
4618
45.
3653
596
5.77
5528
25.
6246
671
4.44
3902
14.
1337
305
3.29
4844
23.
52V:
1979
.76
15.3
518
47.8
811
.13
2062
.72
10.9
427
09.9
78.
9724
58.2
07.
3519
18.0
26.
3016
93.8
74.
4720
52.4
64.
55$:
436.
7715
.29
394.
6111
.25
383.
4610
.92
456.
799.
1240
5.71
7.36
296.
866.
3325
5.50
4.42
322.
884.
562
KO
CHI
Q:
1215
5014
.95
1524
4517
.68
1621
0917
.46
1607
9816
.35
1628
1815
.49
1451
9315
.35
1559
8913
.74
1760
9012
.79
V:18
92.1
414
.67
2859
.02
17.2
332
65.6
417
.32
4491
.03
14.8
649
89.8
614
.92
4447
.05
14.6
248
60.9
812
.84
5805
.1112
.87
$:41
8.10
14.6
360
5.25
17.2
560
8.80
17.3
474
8.69
14.9
582
2.23
14.9
268
4.35
14.6
073
3.24
12.6
991
1.72
12.8
73
J N
PQ
:15
5829
19.1
614
8891
17.2
714
5723
15.7
014
2073
14.4
414
9585
14.2
312
5751
13.2
914
9914
13.2
117
7752
12.9
1V:
1970
.65
15.2
721
51.6
612
.96
2399
.80
12.7
335
31.3
611
.69
3939
.46
11.7
834
37.5
311
.30
4084
.96
10.7
946
99.1
010
.42
$:43
7.73
15.3
245
2.57
12.9
044
8.46
12.7
758
4.74
11.6
864
8.48
11.7
752
9.03
11.2
861
5.93
10.6
674
0.10
10.4
54
VIZA
GQ
:38
217
4.70
6221
57.
2278
542
8.46
1021
4610
.38
1156
7211
.00
1287
1813
.61
1599
7314
.10
2007
7914
.58
V:13
00.2
810
.08
2652
.15
15.9
833
44.9
717
.74
6825
.64
22.5
975
78.2
722
.66
7161
.00
23.5
492
94.3
124
.54
1144
2.39
25.3
7$:
286.
4410
.03
565.
0316
.10
620.
9317
.68
1131
.25
22.5
912
51.8
322
.71
1105
.76
23.5
914
01.9
424
.27
1797
.08
25.3
85
KO
LKAT
AQ
:56
060
6.89
5915
16.
8663
832
6.88
6714
86.
8384
994
8.09
9105
49.
6310
4691
9.22
9886
17.
18V:
1313
.67
10.1
817
30.8
910
.43
1811
.21
9.61
3053
.46
10.11
3686
.35
11.0
234
30.9
911
.28
4455
.19
11.7
648
75.5
810
.81
$:29
0.50
10.1
737
0.14
10.5
533
5.91
9.57
503.
2310
.05
609.
0511
.05
530.
9111
.33
705.
3512
.21
765.
6510
.81
6TU
TICO
RIN
Q:
3022
03.
7234
532
4.01
3298
93.
5539
547
4.02
4220
34.
0140
591
4.29
4202
63.
7051
684
3.75
V:88
0.41
6.82
1180
.84
7.11
1269
.03
6.73
2163
.18
7.16
2328
.27
6.96
1999
.16
6.57
2220
.52
5.86
2654
.96
5.89
$:19
4.12
6.79
250.
587.
1423
5.91
6.72
358.
607.
1638
3.92
6.97
308.
256.
5833
4.77
5.79
417.
095.
897
MUM
BAI
Q:
1965
0.24
2973
0.34
3164
0.34
5338
0.54
2098
0.20
1877
0.20
1837
0.16
3052
0.22
V:27
3.49
2.12
268.
511.
6232
3.77
1.72
454.
761.
5133
3.72
1.00
235.
200.
7722
6.40
0.60
206.
870.
46$:
60.7
32.
1355
.68
1.59
60.4
71.
7276
.49
1.53
54.8
30.
9936
.17
0.77
34.1
40.
5932
.44
0.46
8M
ANG
ALO
RE/
ICD
Q:
1048
2112
.89
8636
710
.02
9590
710
.33
9823
09.
9911
5470
10.9
883
954
8.88
1264
0511
.14
1442
3510
.47
V:68
8.32
5.34
659.
413.
9784
9.01
4.50
1114
.63
3.69
1363
.38
4.08
1048
.08
3.45
1584
.08
4.18
1793
.41
3.98
$:15
2.45
5.34
137.
903.
9315
7.86
4.50
182.
843.
6522
3.20
4.05
160.
633.
4327
8.45
4.82
281.
543.
989
GO
AQ
:35
728
4.39
4043
24.
6941
377
4.46
3428
83.
4944
684
4.25
3168
13.
3543
199
3.81
5057
13.
67V:
275.
302.
1335
1.17
2.12
366.
951.
9544
5.92
1.48
569.
541.
7049
0.48
1.61
641.
411.
6971
1.91
1.58
$:61
.04
2.14
73.6
62.
1068
.33
1.95
72.1
31.
4493
.38
1.69
75.0
91.
6096
.79
1.68
111.
731.
5810
PIPA
VAV
Q:
1974
7824
.29
2198
0125
.50
2337
3825
.18
2486
2125
.27
2436
4023
.18
2047
9921
.65
2323
9120
.48
3061
8122
.23
V:20
25.7
215
.70
2710
.34
16.3
328
08.2
514
.89
3605
.77
11.9
335
88.3
510
.73
3429
.91
11.2
742
17.4
511
.14
4876
.20
10.8
1$:
452.
2215
.83
564.
3016
.08
525.
5714
.97
595.
6111
.89
588.
4710
.68
525.
3111
.21
629.
5610
.90
760.
8410
.74
TABL
E B-
6:
POR
T W
ISE
EX
POR
T O
F M
AR
INE
PR
OD
UC
TS,
201
0-11
TO
201
7 - 1
8
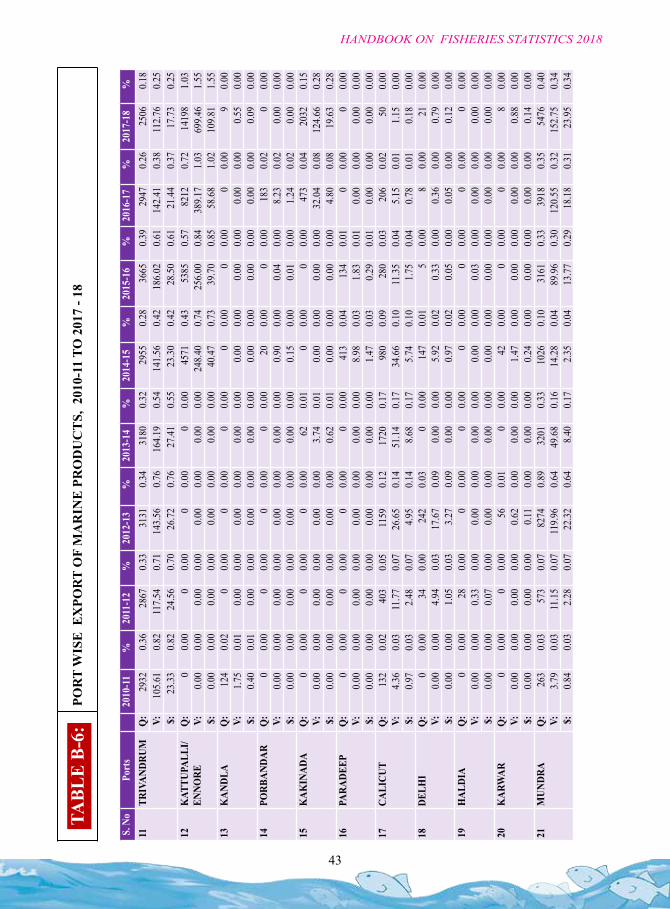
43
HANDBOOK ON FISHERIES STATISTICS 2018
TABL
E B-
6:
POR
T W
ISE
EX
POR
T O
F M
AR
INE
PR
OD
UC
TS,
201
0-11
TO
201
7 - 1
8
S. N
oPo
rts
2010
-11
%20
11-1
2 %
2012
-13
%20
13-1
4 %
2014
-15
%20
15-1
6 %
2016
-17
%20
17-1
8 %
11TR
IVAN
DRUM
Q:
2932
0.36
2867
0.33
3131
0.34
3180
0.32
2955
0.28
3665
0.39
2947
0.26
2506
0.18
V:10
5.61
0.82
117.
540.
7114
3.56
0.76
164.
190.
5414
1.56
0.42
186.
020.
6114
2.41
0.38
112.
760.
25$:
23.3
30.
8224
.56
0.70
26.7
20.
7627
.41
0.55
23.3
00.
4228
.50
0.61
21.4
40.
3717
.73
0.25
12K
ATTU
PALL
I/EN
NORE
Q:
00.
000
0.00
00.
000
0.00
4571
0.43
5385
0.57
8212
0.72
1419
81.
03V:
0.00
0.00
0.00
0.00
0.00
0.00
0.00
0.00
248.
400.
7425
6.00
0.84
389.
171.
0369
9.46
1.55
$:0.
000.
000.
000.
000.
000.
000.
000.
0040
.47
0.73
39.7
00.
8558
.68
1.02
109.
811.
5513
KAN
DLA
Q:
124
0.02
00.
000
0.00
00.
000
0.00
00.
000
0.00
90.
00V:
1.75
0.01
0.00
0.00
0.00
0.00
0.00
0.00
0.00
0.00
0.00
0.00
0.00
0.00
0.55
0.00
$:0.
400.
010.
000.
000.
000.
000.
000.
000.
000.
000.
000.
000.
000.
000.
090.
0014
PORB
ANDA
RQ
:0
0.00
00.
000
0.00
00.
0020
0.00
00.
0018
30.
020
0.00
V:0.
000.
000.
000.
000.
000.
000.
000.
000.
900.
000.
040.
008.
230.
020.
000.
00$:
0.00
0.00
0.00
0.00
0.00
0.00
0.00
0.00
0.15
0.00
0.01
0.00
1.24
0.02
0.00
0.00
15K
AKIN
ADA
Q:
00.
000
0.00
00.
0062
0.01
00.
000
0.00
473
0.04
2032
0.15
V:0.
000.
000.
000.
000.
000.
003.
740.
010.
000.
000.
000.
0032
.04
0.08
124.
660.
28$:
0.00
0.00
0.00
0.00
0.00
0.00
0.62
0.01
0.00
0.00
0.00
0.00
4.80
0.08
19.6
30.
2816
PARA
DEEP
Q:
00.
000
0.00
00.
000
0.00
413
0.04
134
0.01
00.
000
0.00
V:0.
000.
000.
000.
000.
000.
000.
000.
008.
980.
031.
830.
010.
000.
000.
000.
00$:
0.00
0.00
0.00
0.00
0.00
0.00
0.00
0.00
1.47
0.03
0.29
0.01
0.00
0.00
0.00
0.00
17CA
LICU
TQ
:13
20.
0240
30.
0511
590.
1217
200.
1798
00.
0928
00.
0320
60.
0250
0.00
V:4.
360.
0311
.77
0.07
26.6
50.
1451
.14
0.17
34.6
60.
1011
.35
0.04
5.15
0.01
1.15
0.00
$:0.
970.
032.
480.
074.
950.
148.
680.
175.
740.
101.
750.
040.
780.
010.
180.
0018
DELH
IQ
:0
0.00
340.
0024
20.
030
0.00
147
0.01
50.
008
0.00
210.
00V:
0.00
0.00
4.94
0.03
17.6
70.
090.
000.
005.
920.
020.
330.
000.
360.
000.
790.
00$:
0.00
0.00
1.05
0.03
3.27
0.09
0.00
0.00
0.97
0.02
0.05
0.00
0.05
0.00
0.12
0.00
19H
ALDI
AQ
:0
0.00
280.
000
0.00
00.
000
0.00
00.
000
0.00
00.
00V:
0.00
0.00
0.33
0.00
0.00
0.00
0.00
0.00
0.00
0.00
0.03
0.00
0.00
0.00
0.00
0.00
$:0.
000.
000.
070.
000.
000.
000.
000.
000.
000.
000.
000.
000.
000.
000.
000.
0020
KAR
WAR
Q:
00.
000
0.00
560.
010
0.00
420.
000
0.00
00.
008
0.00
V:0.
000.
000.
000.
000.
620.
000.
000.
001.
470.
000.
000.
000.
000.
000.
880.
00$:
0.00
0.00
0.00
0.00
0.11
0.00
0.00
0.00
0.24
0.00
0.00
0.00
0.00
0.00
0.14
0.00
21M
UNDR
AQ
:26
30.
0357
30.
0782
740.
8932
010.
3310
260.
1031
610.
3339
180.
3554
760.
40V:
3.79
0.03
11.1
50.
0711
9.96
0.64
49.6
80.
1614
.28
0.04
89.9
60.
3012
0.55
0.32
152.
750.
34$:
0.84
0.03
2.28
0.07
22.3
20.
648.
400.
172.
350.
0413
.77
0.29
18.1
80.
3123
.95
0.34
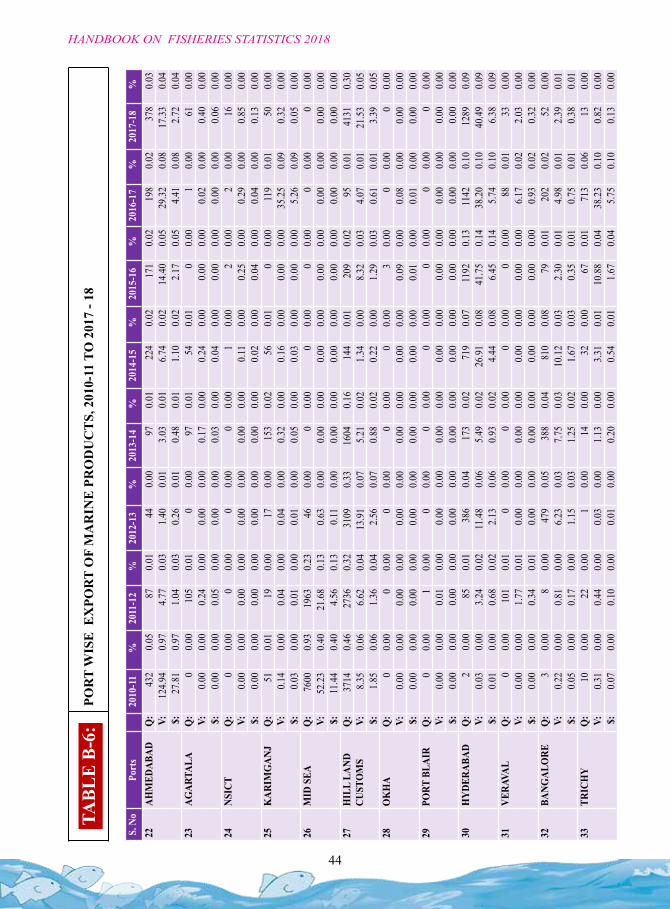
44
HANDBOOK ON FISHERIES STATISTICS 2018
S. N
oPo
rts
2010
-11
%20
11-1
2 %
2012
-13
%20
13-1
4 %
2014
-15
%20
15-1
6 %
2016
-17
%20
17-1
8 %
22AH
MED
ABAD
Q:
432
0.05
870.
0144
0.00
970.
0122
40.
0217
10.
0219
80.
0237
80.
03V:
124.
940.
974.
770.
031.
400.
013.
030.
016.
740.
0214
.40
0.05
29.3
20.
0817
.33
0.04
$:27
.81
0.97
1.04
0.03
0.26
0.01
0.48
0.01
1.10
0.02
2.17
0.05
4.41
0.08
2.72
0.04
23AG
ARTA
LAQ
:0
0.00
105
0.01
00.
0097
0.01
540.
010
0.00
10.
0061
0.00
V:0.
000.
000.
240.
000.
000.
000.
170.
000.
240.
000.
000.
000.
020.
000.
400.
00$:
0.00
0.00
0.05
0.00
0.00
0.00
0.03
0.00
0.04
0.00
0.00
0.00
0.00
0.00
0.06
0.00
24NS
ICT
Q:
00.
000
0.00
00.
000
0.00
10.
002
0.00
20.
0016
0.00
V:0.
000.
000.
000.
000.
000.
000.
000.
000.
110.
000.
250.
000.
290.
000.
850.
00$:
0.00
0.00
0.00
0.00
0.00
0.00
0.00
0.00
0.02
0.00
0.04
0.00
0.04
0.00
0.13
0.00
25K
ARIM
GAN
JQ
:51
0.01
190.
0017
0.00
153
0.02
560.
010
0.00
119
0.01
500.
00V:
0.14
0.00
0.04
0.00
0.04
0.00
0.32
0.00
0.16
0.00
0.00
0.00
35.2
50.
090.
320.
00$:
0.03
0.00
0.01
0.00
0.01
0.00
0.05
0.00
0.03
0.00
0.00
0.00
5.26
0.09
0.05
0.00
26M
ID S
EAQ
:76
000.
9319
630.
2346
0.00
00.
000
0.00
00.
000
0.00
00.
00V:
52.2
30.
4021
.68
0.13
0.63
0.00
0.00
0.00
0.00
0.00
0.00
0.00
0.00
0.00
0.00
0.00
$:11
.44
0.40
4.56
0.13
0.11
0.00
0.00
0.00
0.00
0.00
0.00
0.00
0.00
0.00
0.00
0.00
27H
ILL
LAND
CU
STO
MS
Q:
3714
0.46
2736
0.32
3109
0.33
1604
0.16
144
0.01
209
0.02
950.
0141
310.
30V:
8.35
0.06
6.62
0.04
13.9
10.
075.
210.
021.
340.
008.
320.
034.
070.
0121
.53
0.05
$:1.
850.
061.
360.
042.
560.
070.
880.
020.
220.
001.
290.
030.
610.
013.
390.
0528
OK
HA
Q:
00.
000
0.00
00.
000
0.00
00.
003
0.00
00.
000
0.00
V:0.
000.
000.
000.
000.
000.
000.
000.
000.
000.
000.
090.
000.
080.
000.
000.
00$:
0.00
0.00
0.00
0.00
0.00
0.00
0.00
0.00
0.00
0.00
0.01
0.00
0.01
0.00
0.00
0.00
29PO
RT B
LAIR
Q:
00.
001
0.00
00.
000
0.00
00.
000
0.00
00.
000
0.00
V:0.
000.
000.
010.
000.
000.
000.
000.
000.
000.
000.
000.
000.
000.
000.
000.
00$:
0.00
0.00
0.00
0.00
0.00
0.00
0.00
0.00
0.00
0.00
0.00
0.00
0.00
0.00
0.00
0.00
30H
YDER
ABAD
Q:
20.
0085
0.01
386
0.04
173
0.02
719
0.07
1192
0.13
1142
0.10
1289
0.09
V:0.
030.
003.
240.
0211
.48
0.06
5.49
0.02
26.9
10.
0841
.75
0.14
38.2
00.
1040
.49
0.09
$:0.
010.
000.
680.
022.
130.
060.
930.
024.
440.
086.
450.
145.
740.
106.
380.
0931
VERA
VAL
Q:
00.
0010
10.
010
0.00
00.
000
0.00
00.
0088
0.01
330.
00V:
0.00
0.00
1.77
0.01
0.00
0.00
0.00
0.00
0.00
0.00
0.00
0.00
6.17
0.02
2.03
0.00
$:0.
000.
000.
340.
010.
000.
000.
000.
000.
000.
000.
000.
000.
930.
020.
320.
0032
BANG
ALO
REQ
:3
0.00
80.
0047
90.
0538
80.
0481
00.
0879
0.01
202
0.02
520.
00V:
0.22
0.00
0.81
0.00
6.23
0.03
7.75
0.03
10.1
20.
032.
300.
014.
980.
012.
390.
01$:
0.05
0.00
0.17
0.00
1.15
0.03
1.25
0.02
1.67
0.03
0.35
0.01
0.75
0.01
0.38
0.01
33TR
ICH
YQ
:10
0.00
220.
001
0.00
140.
0032
0.00
670.
0171
30.
0613
0.00
V:0.
310.
000.
440.
000.
030.
001.
130.
003.
310.
0110
.88
0.04
38.2
30.
100.
820.
00$:
0.07
0.00
0.10
0.00
0.01
0.00
0.20
0.00
0.54
0.01
1.67
0.04
5.75
0.10
0.13
0.00
TABL
E B-
6:
POR
T W
ISE
EX
POR
T O
F M
AR
INE
PR
OD
UC
TS,
201
0-11
TO
201
7 - 1
8
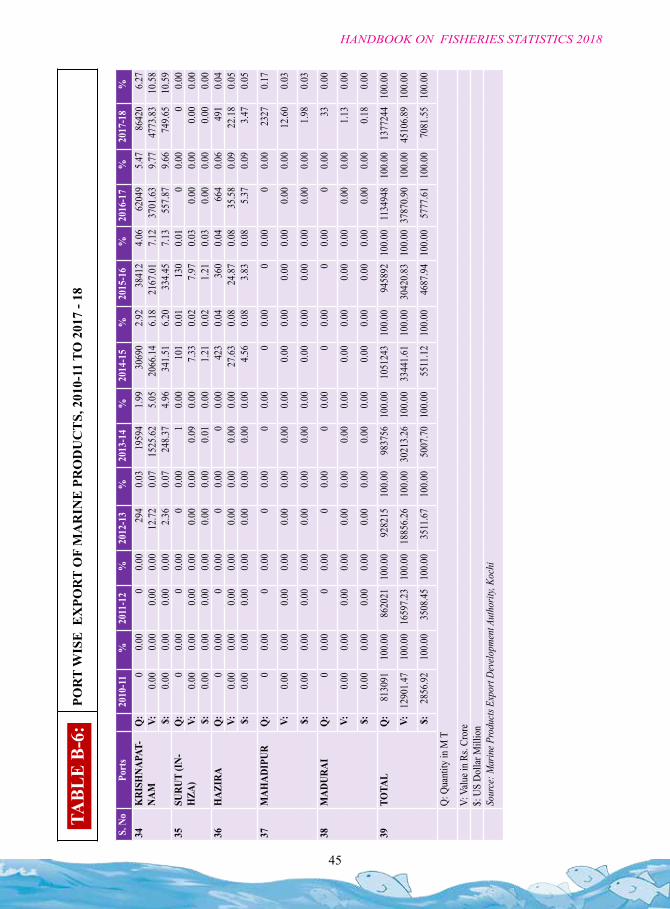
45
HANDBOOK ON FISHERIES STATISTICS 2018
TABL
E B-
6:
POR
T W
ISE
EX
POR
T O
F M
AR
INE
PR
OD
UC
TS,
201
0-11
TO
201
7 - 1
8
S. N
oPo
rts
2010
-11
%20
11-1
2 %
2012
-13
%20
13-1
4 %
2014
-15
%20
15-1
6 %
2016
-17
%20
17-1
8 %
34K
RISH
NAPA
T-NA
MQ
:0
0.00
00.
0029
40.
0319
594
1.99
3069
02.
9238
412
4.06
6204
95.
4786
420
6.27
V:0.
000.
000.
000.
0012
.72
0.07
1525
.62
5.05
2066
.14
6.18
2167
.01
7.12
3701
.63
9.77
4773
.83
10.5
8$:
0.00
0.00
0.00
0.00
2.36
0.07
248.
374.
9634
1.51
6.20
334.
457.
1355
7.87
9.66
749.
6510
.59
35SU
RUT
(IN-
HZA
)Q
:0
0.00
00.
000
0.00
10.
0010
10.
0113
00.
010
0.00
00.
00V:
0.00
0.00
0.00
0.00
0.00
0.00
0.09
0.00
7.33
0.02
7.97
0.03
0.00
0.00
0.00
0.00
$:0.
000.
000.
000.
000.
000.
000.
010.
001.
210.
021.
210.
030.
000.
000.
000.
0036
HAZ
IRA
Q:
00.
000
0.00
00.
000
0.00
423
0.04
360
0.04
664
0.06
491
0.04
V:0.
000.
000.
000.
000.
000.
000.
000.
0027
.63
0.08
24.8
70.
0835
.58
0.09
22.1
80.
05$:
0.00
0.00
0.00
0.00
0.00
0.00
0.00
0.00
4.56
0.08
3.83
0.08
5.37
0.09
3.47
0.05
37M
AHAD
IPUR
Q:
00.
000
0.00
00.
000
0.00
00.
000
0.00
00.
0023
270.
17
V:0.
000.
000.
000.
000.
000.
000.
000.
000.
000.
000.
000.
000.
000.
0012
.60
0.03
$:0.
000.
000.
000.
000.
000.
000.
000.
000.
000.
000.
000.
000.
000.
001.
980.
03
38M
ADUR
AIQ
:0
0.00
00.
000
0.00
00.
000
0.00
00.
000
0.00
330.
00
V:0.
000.
000.
000.
000.
000.
000.
000.
000.
000.
000.
000.
000.
000.
001.
130.
00
$:0.
000.
000.
000.
000.
000.
000.
000.
000.
000.
000.
000.
000.
000.
000.
180.
00
39TO
TAL
Q:
8130
9110
0.00
8620
2110
0.00
9282
1510
0.00
9837
5610
0.00
1051
243
100.
0094
5892
100.
0011
3494
810
0.00
1377
244
100.
00
V:12
901.
4710
0.00
1659
7.23
100.
0018
856.
2610
0.00
3021
3.26
100.
0033
441.
6110
0.00
3042
0.83
100.
0037
870.
9010
0.00
4510
6.89
100.
00
$:28
56.9
210
0.00
3508
.45
100.
0035
11.6
710
0.00
5007
.70
100.
0055
11.1
210
0.00
4687
.94
100.
0057
77.6
110
0.00
7081
.55
100.
00
Q: Q
uant
ity in
M T
V: V
alue i
n Rs
. Cro
re$:
US
Dolla
r Mill
ion
Sour
ce: M
arin
e Pro
ducts
Exp
ort D
evelo
pmen
t Aut
horit
y, Ko
chi

SECTION : CFISHING
HARBOURS
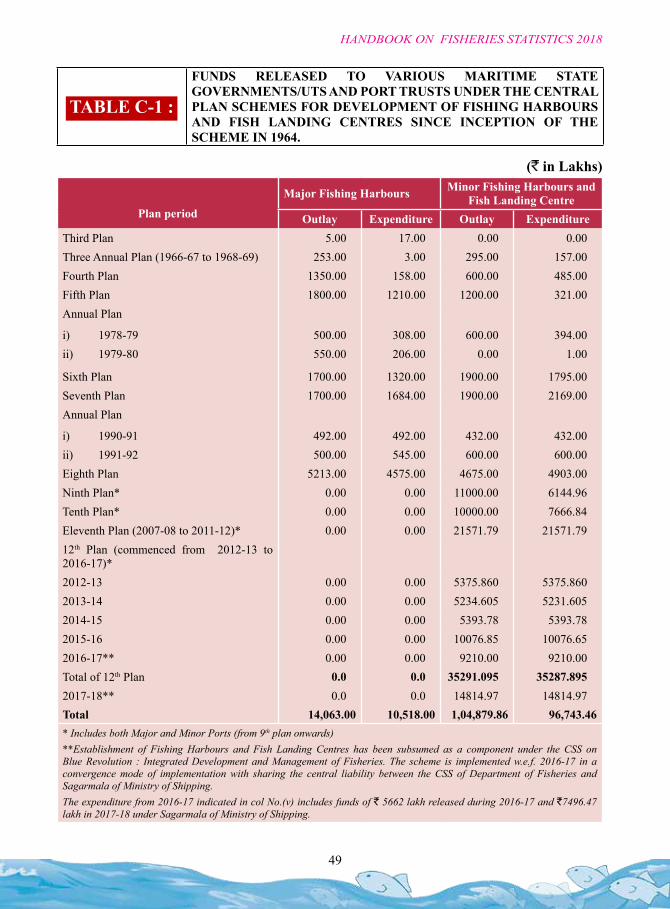
49
HANDBOOK ON FISHERIES STATISTICS 2018
TABLE C-1 :
FUNDS RELEASED TO VARIOUS MARITIME STATE GOVERNMENTS/UTS AND PORT TRUSTS UNDER THE CENTRAL PLAN SCHEMES FOR DEVELOPMENT OF FISHING HARBOURS AND FISH LANDING CENTRES SINCE INCEPTION OF THE SCHEME IN 1964.
( in Lakhs)
Plan period
Major Fishing Harbours Minor Fishing Harbours and Fish Landing Centre
Outlay Expenditure Outlay ExpenditureThird Plan 5.00 17.00 0.00 0.00Three Annual Plan (1966-67 to 1968-69) 253.00 3.00 295.00 157.00Fourth Plan 1350.00 158.00 600.00 485.00Fifth Plan 1800.00 1210.00 1200.00 321.00Annual Plan
i) 1978-79 500.00 308.00 600.00 394.00ii) 1979-80 550.00 206.00 0.00 1.00
Sixth Plan 1700.00 1320.00 1900.00 1795.00Seventh Plan 1700.00 1684.00 1900.00 2169.00Annual Plan
i) 1990-91 492.00 492.00 432.00 432.00ii) 1991-92 500.00 545.00 600.00 600.00Eighth Plan 5213.00 4575.00 4675.00 4903.00Ninth Plan* 0.00 0.00 11000.00 6144.96Tenth Plan* 0.00 0.00 10000.00 7666.84Eleventh Plan (2007-08 to 2011-12)* 0.00 0.00 21571.79 21571.7912th Plan (commenced from 2012-13 to 2016-17)*2012-13 0.00 0.00 5375.860 5375.8602013-14 0.00 0.00 5234.605 5231.6052014-15 0.00 0.00 5393.78 5393.782015-16 0.00 0.00 10076.85 10076.652016-17** 0.00 0.00 9210.00 9210.00Total of 12th Plan 0.0 0.0 35291.095 35287.8952017-18** 0.0 0.0 14814.97 14814.97Total 14,063.00 10,518.00 1,04,879.86 96,743.46* Includes both Major and Minor Ports (from 9th plan onwards)**Establishment of Fishing Harbours and Fish Landing Centres has been subsumed as a component under the CSS on Blue Revolution : Integrated Development and Management of Fisheries. The scheme is implemented w.e.f. 2016-17 in a convergence mode of implementation with sharing the central liability between the CSS of Department of Fisheries and Sagarmala of Ministry of Shipping.The expenditure from 2016-17 indicated in col No.(v) includes funds of ` 5662 lakh released during 2016-17 and `7496.47 lakh in 2017-18 under Sagarmala of Ministry of Shipping.
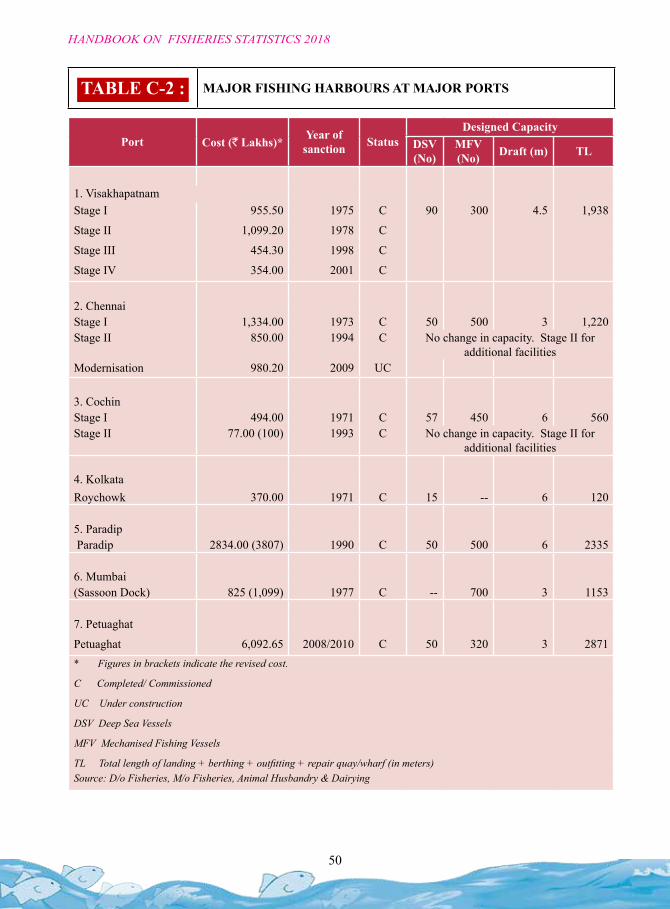
50
HANDBOOK ON FISHERIES STATISTICS 2018
Port Cost (` Lakhs)* Year of sanction Status
Designed CapacityDSV (No)
MFV (No) Draft (m) TL
1. VisakhapatnamStage I 955.50 1975 C 90 300 4.5 1,938
Stage II 1,099.20 1978 C
Stage III 454.30 1998 C
Stage IV 354.00 2001 C
2. ChennaiStage I 1,334.00 1973 C 50 500 3 1,220Stage II 850.00 1994 C No change in capacity. Stage II for
additional facilities Modernisation 980.20 2009 UC
3. CochinStage I 494.00 1971 C 57 450 6 560Stage II 77.00 (100) 1993 C No change in capacity. Stage II for
additional facilities
4. Kolkata Roychowk 370.00 1971 C 15 -- 6 120
5. Paradip Paradip 2834.00 (3807) 1990 C 50 500 6 2335
6. Mumbai (Sassoon Dock) 825 (1,099) 1977 C -- 700 3 1153
7. Petuaghat
Petuaghat 6,092.65 2008/2010 C 50 320 3 2871* Figures in brackets indicate the revised cost.
C Completed/ Commissioned
UC Under construction
DSV Deep Sea Vessels
MFV Mechanised Fishing Vessels
TL Total length of landing + berthing + outfitting + repair quay/wharf (in meters)Source: D/o Fisheries, M/o Fisheries, Animal Husbandry & Dairying
TABLE C-2 : MAJOR FISHING HARBOURS AT MAJOR PORTS
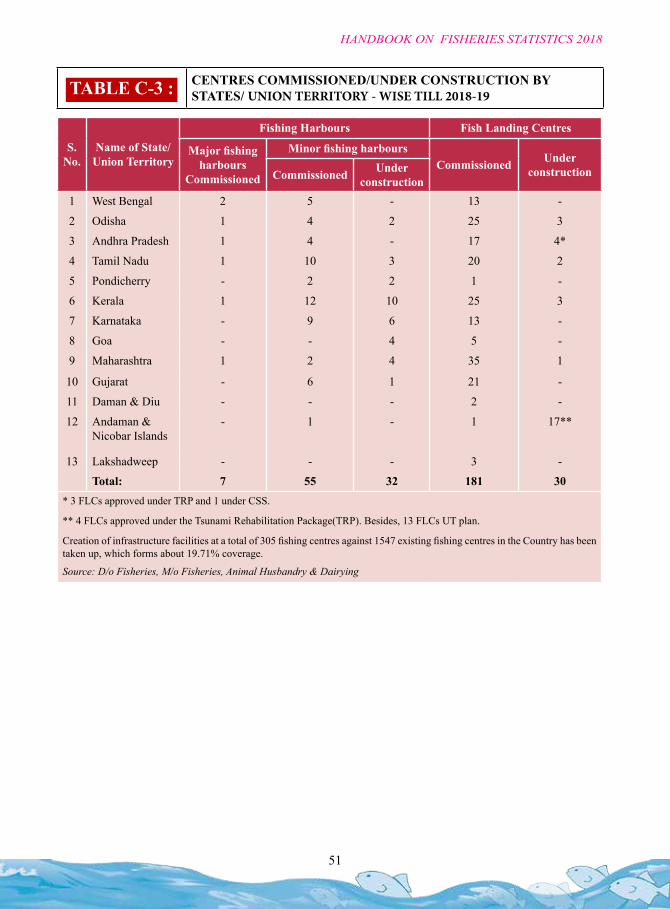
51
HANDBOOK ON FISHERIES STATISTICS 2018
TABLE C-3 : CENTRES COMMISSIONED/UNDER CONSTRUCTION BY STATES/ UNION TERRITORY - WISE TILL 2018-19
S. No.
Name of State/ Union Territory
Fishing Harbours Fish Landing Centres
Major fishing harbours
Commissioned
Minor fishing harbours Commissioned Under
constructionCommissioned Under construction
1 West Bengal 2 5 - 13 -
2 Odisha 1 4 2 25 3
3 Andhra Pradesh 1 4 - 17 4*
4 Tamil Nadu 1 10 3 20 2
5 Pondicherry - 2 2 1 -
6 Kerala 1 12 10 25 3
7 Karnataka - 9 6 13 -
8 Goa - - 4 5 -
9 Maharashtra 1 2 4 35 1
10 Gujarat - 6 1 21 -
11 Daman & Diu - - - 2 -
12 Andaman & Nicobar Islands
- 1 - 1 17**
13 Lakshadweep - - - 3 -
Total: 7 55 32 181 30* 3 FLCs approved under TRP and 1 under CSS.
** 4 FLCs approved under the Tsunami Rehabilitation Package(TRP). Besides, 13 FLCs UT plan.
Creation of infrastructure facilities at a total of 305 fishing centres against 1547 existing fishing centres in the Country has been taken up, which forms about 19.71% coverage.
Source: D/o Fisheries, M/o Fisheries, Animal Husbandry & Dairying
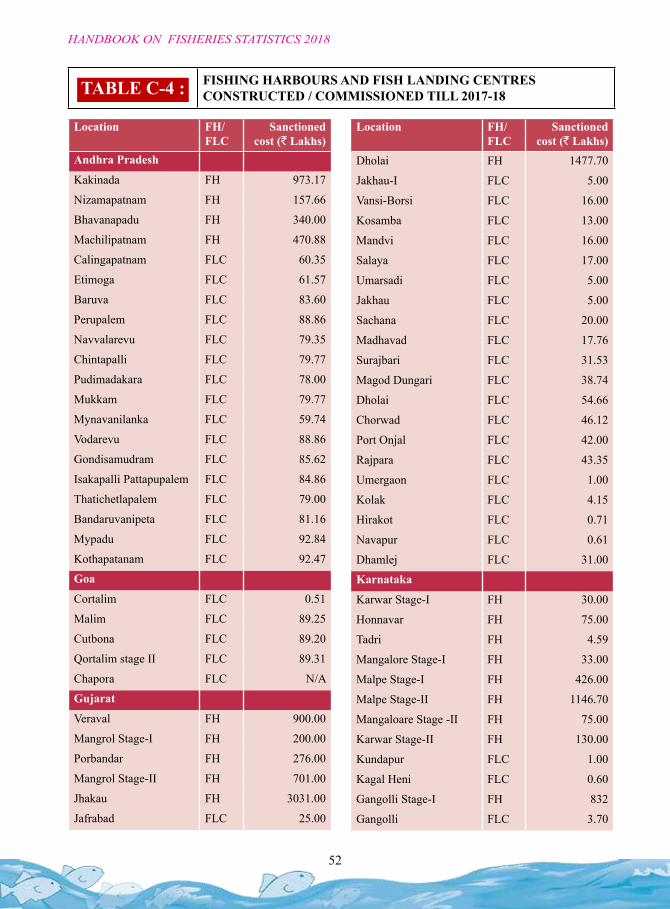
52
HANDBOOK ON FISHERIES STATISTICS 2018
TABLE C-4 : FISHING HARBOURS AND FISH LANDING CENTRES CONSTRUCTED / COMMISSIONED TILL 2017-18
Location FH/ FLC
Sanctioned cost (` Lakhs)
Andhra Pradesh
Kakinada FH 973.17
Nizamapatnam FH 157.66
Bhavanapadu FH 340.00
Machilipatnam FH 470.88
Calingapatnam FLC 60.35
Etimoga FLC 61.57
Baruva FLC 83.60
Perupalem FLC 88.86
Navvalarevu FLC 79.35
Chintapalli FLC 79.77
Pudimadakara FLC 78.00
Mukkam FLC 79.77
Mynavanilanka FLC 59.74
Vodarevu FLC 88.86
Gondisamudram FLC 85.62
Isakapalli Pattapupalem FLC 84.86
Thatichetlapalem FLC 79.00
Bandaruvanipeta FLC 81.16
Mypadu FLC 92.84
Kothapatanam FLC 92.47
Goa
Cortalim FLC 0.51
Malim FLC 89.25
Cutbona FLC 89.20
Qortalim stage II FLC 89.31
Chapora FLC N/A
Gujarat
Veraval FH 900.00
Mangrol Stage-I FH 200.00
Porbandar FH 276.00
Mangrol Stage-II FH 701.00
Jhakau FH 3031.00
Jafrabad FLC 25.00
Location FH/ FLC
Sanctioned cost (` Lakhs)
Dholai FH 1477.70
Jakhau-I FLC 5.00
Vansi-Borsi FLC 16.00
Kosamba FLC 13.00
Mandvi FLC 16.00
Salaya FLC 17.00
Umarsadi FLC 5.00
Jakhau FLC 5.00
Sachana FLC 20.00
Madhavad FLC 17.76
Surajbari FLC 31.53
Magod Dungari FLC 38.74
Dholai FLC 54.66
Chorwad FLC 46.12
Port Onjal FLC 42.00
Rajpara FLC 43.35
Umergaon FLC 1.00
Kolak FLC 4.15
Hirakot FLC 0.71
Navapur FLC 0.61
Dhamlej FLC 31.00
Karnataka
Karwar Stage-I FH 30.00
Honnavar FH 75.00
Tadri FH 4.59
Mangalore Stage-I FH 33.00
Malpe Stage-I FH 426.00
Malpe Stage-II FH 1146.70
Mangaloare Stage -II FH 75.00
Karwar Stage-II FH 130.00
Kundapur FLC 1.00
Kagal Heni FLC 0.60
Gangolli Stage-I FH 832
Gangolli FLC 3.70
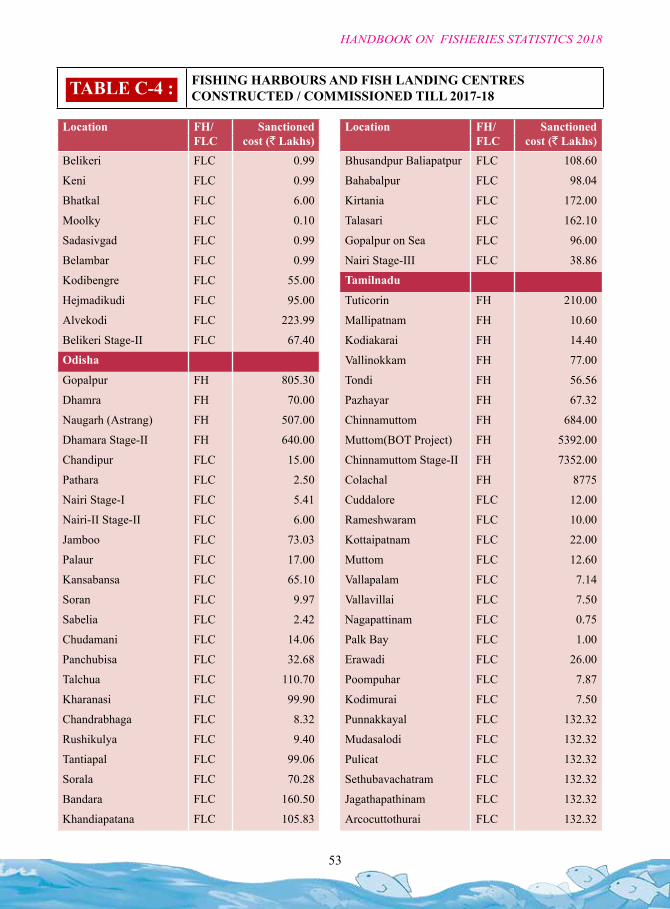
53
HANDBOOK ON FISHERIES STATISTICS 2018
TABLE C-4 : FISHING HARBOURS AND FISH LANDING CENTRES CONSTRUCTED / COMMISSIONED TILL 2017-18
Location FH/ FLC
Sanctioned cost (` Lakhs)
Belikeri FLC 0.99
Keni FLC 0.99
Bhatkal FLC 6.00
Moolky FLC 0.10
Sadasivgad FLC 0.99
Belambar FLC 0.99
Kodibengre FLC 55.00
Hejmadikudi FLC 95.00
Alvekodi FLC 223.99
Belikeri Stage-II FLC 67.40
Odisha
Gopalpur FH 805.30
Dhamra FH 70.00
Naugarh (Astrang) FH 507.00
Dhamara Stage-II FH 640.00
Chandipur FLC 15.00
Pathara FLC 2.50
Nairi Stage-I FLC 5.41
Nairi-II Stage-II FLC 6.00
Jamboo FLC 73.03
Palaur FLC 17.00
Kansabansa FLC 65.10
Soran FLC 9.97
Sabelia FLC 2.42
Chudamani FLC 14.06
Panchubisa FLC 32.68
Talchua FLC 110.70
Kharanasi FLC 99.90
Chandrabhaga FLC 8.32
Rushikulya FLC 9.40
Tantiapal FLC 99.06
Sorala FLC 70.28
Bandara FLC 160.50
Khandiapatana FLC 105.83
Location FH/ FLC
Sanctioned cost (` Lakhs)
Bhusandpur Baliapatpur FLC 108.60
Bahabalpur FLC 98.04
Kirtania FLC 172.00
Talasari FLC 162.10
Gopalpur on Sea FLC 96.00
Nairi Stage-III FLC 38.86
Tamilnadu
Tuticorin FH 210.00
Mallipatnam FH 10.60
Kodiakarai FH 14.40
Vallinokkam FH 77.00
Tondi FH 56.56
Pazhayar FH 67.32
Chinnamuttom FH 684.00
Muttom(BOT Project) FH 5392.00
Chinnamuttom Stage-II FH 7352.00
Colachal FH 8775
Cuddalore FLC 12.00
Rameshwaram FLC 10.00
Kottaipatnam FLC 22.00
Muttom FLC 12.60
Vallapalam FLC 7.14
Vallavillai FLC 7.50
Nagapattinam FLC 0.75
Palk Bay FLC 1.00
Erawadi FLC 26.00
Poompuhar FLC 7.87
Kodimurai FLC 7.50
Punnakkayal FLC 132.32
Mudasalodi FLC 132.32
Pulicat FLC 132.32
Sethubavachatram FLC 132.32
Jagathapathinam FLC 132.32
Arcocuttothurai FLC 132.32
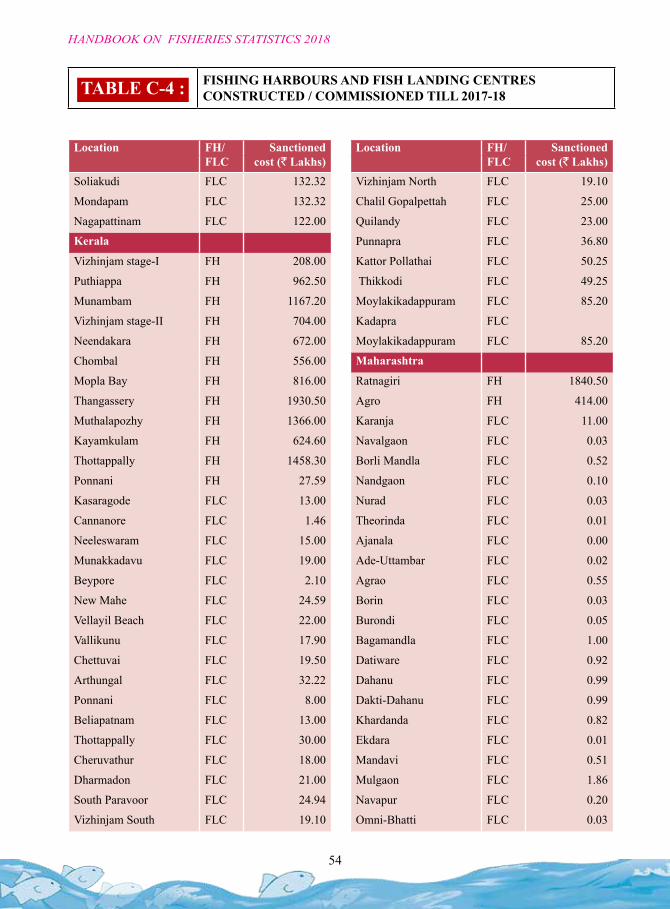
54
HANDBOOK ON FISHERIES STATISTICS 2018
TABLE C-4 : FISHING HARBOURS AND FISH LANDING CENTRES CONSTRUCTED / COMMISSIONED TILL 2017-18
Location FH/ FLC
Sanctioned cost (` Lakhs)
Soliakudi FLC 132.32
Mondapam FLC 132.32
Nagapattinam FLC 122.00
Kerala
Vizhinjam stage-I FH 208.00
Puthiappa FH 962.50
Munambam FH 1167.20
Vizhinjam stage-II FH 704.00
Neendakara FH 672.00
Chombal FH 556.00
Mopla Bay FH 816.00
Thangassery FH 1930.50
Muthalapozhy FH 1366.00
Kayamkulam FH 624.60
Thottappally FH 1458.30
Ponnani FH 27.59
Kasaragode FLC 13.00
Cannanore FLC 1.46
Neeleswaram FLC 15.00
Munakkadavu FLC 19.00
Beypore FLC 2.10
New Mahe FLC 24.59
Vellayil Beach FLC 22.00
Vallikunu FLC 17.90
Chettuvai FLC 19.50
Arthungal FLC 32.22
Ponnani FLC 8.00
Beliapatnam FLC 13.00
Thottappally FLC 30.00
Cheruvathur FLC 18.00
Dharmadon FLC 21.00
South Paravoor FLC 24.94
Vizhinjam South FLC 19.10
Location FH/ FLC
Sanctioned cost (` Lakhs)
Vizhinjam North FLC 19.10
Chalil Gopalpettah FLC 25.00
Quilandy FLC 23.00
Punnapra FLC 36.80
Kattor Pollathai FLC 50.25
Thikkodi FLC 49.25
Moylakikadappuram FLC 85.20
Kadapra FLC
Moylakikadappuram FLC 85.20
Maharashtra
Ratnagiri FH 1840.50
Agro FH 414.00
Karanja FLC 11.00
Navalgaon FLC 0.03
Borli Mandla FLC 0.52
Nandgaon FLC 0.10
Nurad FLC 0.03
Theorinda FLC 0.01
Ajanala FLC 0.00
Ade-Uttambar FLC 0.02
Agrao FLC 0.55
Borin FLC 0.03
Burondi FLC 0.05
Bagamandla FLC 1.00
Datiware FLC 0.92
Dahanu FLC 0.99
Dakti-Dahanu FLC 0.99
Khardanda FLC 0.82
Ekdara FLC 0.01
Mandavi FLC 0.51
Mulgaon FLC 1.86
Navapur FLC 0.20
Omni-Bhatti FLC 0.03
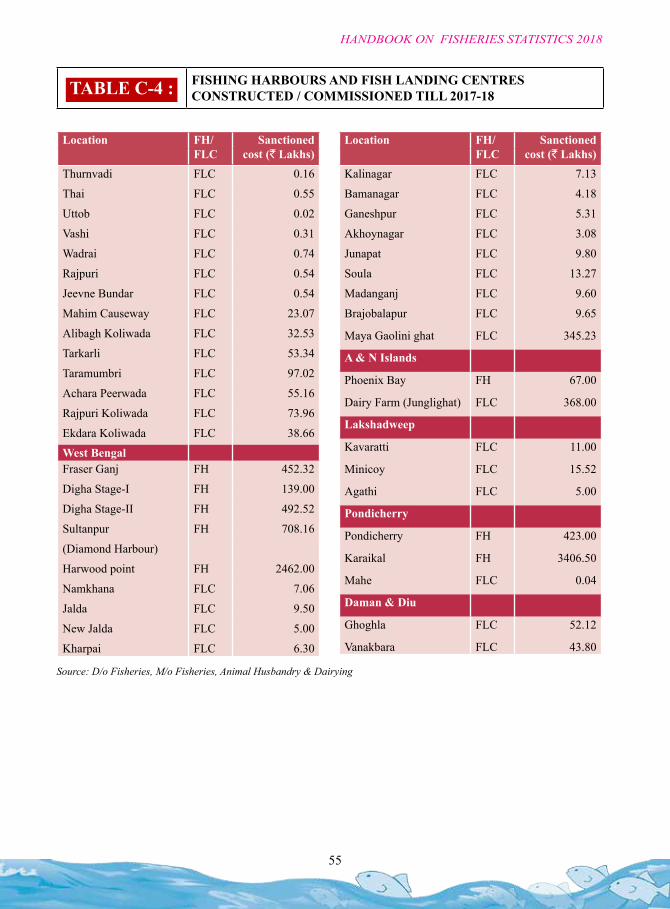
55
HANDBOOK ON FISHERIES STATISTICS 2018
TABLE C-4 : FISHING HARBOURS AND FISH LANDING CENTRES CONSTRUCTED / COMMISSIONED TILL 2017-18
Location FH/ FLC
Sanctioned cost (` Lakhs)
Thurnvadi FLC 0.16
Thai FLC 0.55
Uttob FLC 0.02
Vashi FLC 0.31
Wadrai FLC 0.74
Rajpuri FLC 0.54
Jeevne Bundar FLC 0.54
Mahim Causeway FLC 23.07
Alibagh Koliwada FLC 32.53
Tarkarli FLC 53.34
Taramumbri FLC 97.02
Achara Peerwada FLC 55.16
Rajpuri Koliwada FLC 73.96
Ekdara Koliwada FLC 38.66
West BengalFraser Ganj FH 452.32
Digha Stage-I FH 139.00
Digha Stage-II FH 492.52
Sultanpur FH 708.16
(Diamond Harbour)
Harwood point FH 2462.00
Namkhana FLC 7.06
Jalda FLC 9.50
New Jalda FLC 5.00
Kharpai FLC 6.30
Location FH/ FLC
Sanctioned cost (` Lakhs)
Kalinagar FLC 7.13
Bamanagar FLC 4.18
Ganeshpur FLC 5.31
Akhoynagar FLC 3.08
Junapat FLC 9.80
Soula FLC 13.27
Madanganj FLC 9.60
Brajobalapur FLC 9.65
Maya Gaolini ghat FLC 345.23
A & N Islands
Phoenix Bay FH 67.00
Dairy Farm (Junglighat) FLC 368.00
Lakshadweep
Kavaratti FLC 11.00
Minicoy FLC 15.52
Agathi FLC 5.00
Pondicherry
Pondicherry FH 423.00
Karaikal FH 3406.50
Mahe FLC 0.04
Daman & Diu
Ghoghla FLC 52.12
Vanakbara FLC 43.80
Source: D/o Fisheries, M/o Fisheries, Animal Husbandry & Dairying
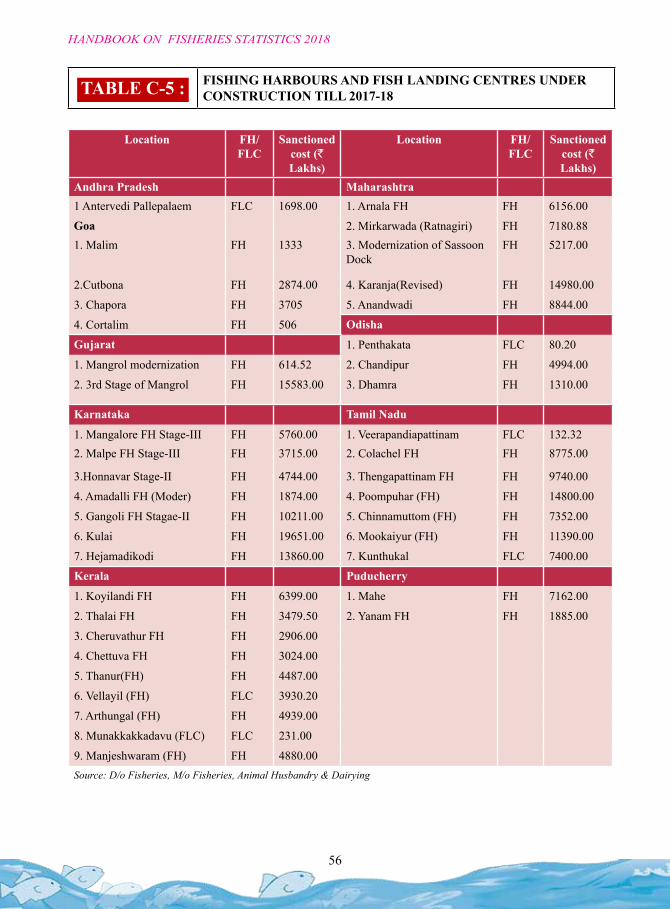
56
HANDBOOK ON FISHERIES STATISTICS 2018
Location FH/ FLC
Sanctioned cost (` Lakhs)
Location FH/ FLC
Sanctioned cost (` Lakhs)
Andhra Pradesh Maharashtra1 Antervedi Pallepalaem FLC 1698.00 1. Arnala FH FH 6156.00
Goa 2. Mirkarwada (Ratnagiri) FH 7180.881. Malim FH 1333 3. Modernization of Sassoon
Dock FH 5217.00
2.Cutbona FH 2874.00 4. Karanja(Revised) FH 14980.00
3. Chapora FH 3705 5. Anandwadi FH 8844.00
4. Cortalim FH 506 Odisha
Gujarat 1. Penthakata FLC 80.20
1. Mangrol modernization FH 614.52 2. Chandipur FH 4994.00
2. 3rd Stage of Mangrol FH 15583.00 3. Dhamra FH 1310.00
Karnataka Tamil Nadu
1. Mangalore FH Stage-III FH 5760.00 1. Veerapandiapattinam FLC 132.322. Malpe FH Stage-III FH 3715.00 2. Colachel FH FH 8775.00
3.Honnavar Stage-II FH 4744.00 3. Thengapattinam FH FH 9740.00
4. Amadalli FH (Moder) FH 1874.00 4. Poompuhar (FH) FH 14800.00
5. Gangoli FH Stagae-II FH 10211.00 5. Chinnamuttom (FH) FH 7352.00
6. Kulai FH 19651.00 6. Mookaiyur (FH) FH 11390.00
7. Hejamadikodi FH 13860.00 7. Kunthukal FLC 7400.00
Kerala Puducherry
1. Koyilandi FH FH 6399.00 1. Mahe FH 7162.00
2. Thalai FH FH 3479.50 2. Yanam FH FH 1885.00
3. Cheruvathur FH FH 2906.00
4. Chettuva FH FH 3024.00
5. Thanur(FH) FH 4487.00
6. Vellayil (FH) FLC 3930.20
7. Arthungal (FH) FH 4939.00
8. Munakkakkadavu (FLC) FLC 231.00
9. Manjeshwaram (FH) FH 4880.00Source: D/o Fisheries, M/o Fisheries, Animal Husbandry & Dairying
TABLE C-5 : FISHING HARBOURS AND FISH LANDING CENTRES UNDER CONSTRUCTION TILL 2017-18
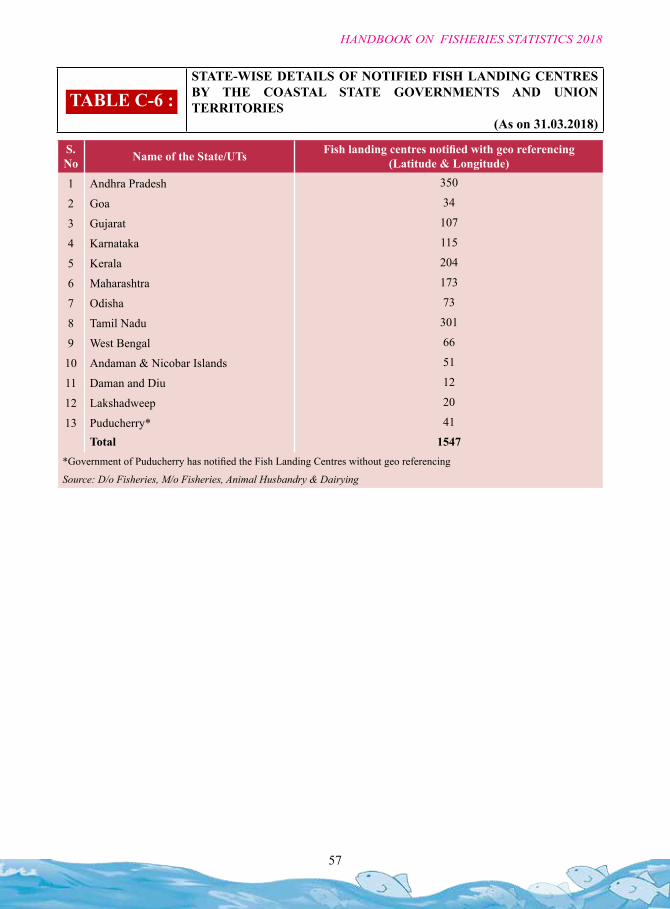
57
HANDBOOK ON FISHERIES STATISTICS 2018
TABLE C-6 : STATE-WISE DETAILS OF NOTIFIED FISH LANDING CENTRES BY THE COASTAL STATE GOVERNMENTS AND UNION TERRITORIES
(As on 31.03.2018)
S. No Name of the State/UTs Fish landing centres notified with geo referencing
(Latitude & Longitude)
1 Andhra Pradesh 350
2 Goa 34
3 Gujarat 107
4 Karnataka 115
5 Kerala 204
6 Maharashtra 173
7 Odisha 73
8 Tamil Nadu 301
9 West Bengal 66
10 Andaman & Nicobar Islands 51
11 Daman and Diu 12
12 Lakshadweep 20
13 Puducherry* 41
Total 1547*Government of Puducherry has notified the Fish Landing Centres without geo referencing
Source: D/o Fisheries, M/o Fisheries, Animal Husbandry & Dairying

SECTION : D
FISHERIESINSTITUTES
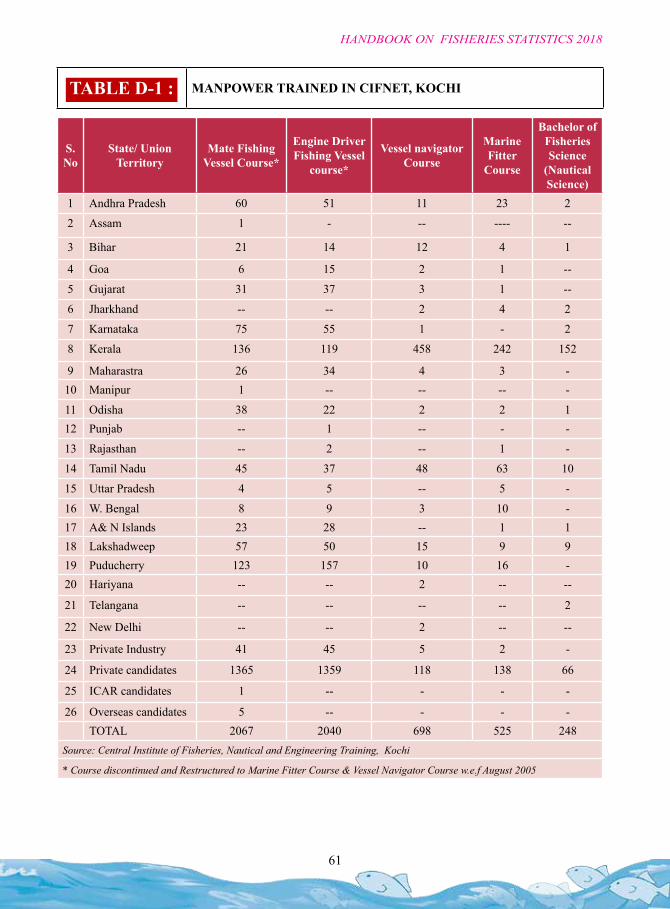
61
HANDBOOK ON FISHERIES STATISTICS 2018
S. No
State/ Union Territory
Mate Fishing Vessel Course*
Engine Driver Fishing Vessel
course*
Vessel navigator Course
Marine Fitter
Course
Bachelor of Fisheries Science
(Nautical Science)
1 Andhra Pradesh 60 51 11 23 2
2 Assam 1 - -- ---- --
3 Bihar 21 14 12 4 1
4 Goa 6 15 2 1 --
5 Gujarat 31 37 3 1 --
6 Jharkhand -- -- 2 4 2
7 Karnataka 75 55 1 - 2
8 Kerala 136 119 458 242 152
9 Maharastra 26 34 4 3 -10 Manipur 1 -- -- -- -
11 Odisha 38 22 2 2 112 Punjab -- 1 -- - -
13 Rajasthan -- 2 -- 1 -
14 Tamil Nadu 45 37 48 63 10
15 Uttar Pradesh 4 5 -- 5 -
16 W. Bengal 8 9 3 10 -17 A& N Islands 23 28 -- 1 118 Lakshadweep 57 50 15 9 919 Puducherry 123 157 10 16 -20 Hariyana -- -- 2 -- --
21 Telangana -- -- -- -- 2
22 New Delhi -- -- 2 -- --
23 Private Industry 41 45 5 2 -
24 Private candidates 1365 1359 118 138 66
25 ICAR candidates 1 -- - - -
26 Overseas candidates 5 -- - - -TOTAL 2067 2040 698 525 248
Source: Central Institute of Fisheries, Nautical and Engineering Training, Kochi
* Course discontinued and Restructured to Marine Fitter Course & Vessel Navigator Course w.e.f August 2005
TABLE D-1 : MANPOWER TRAINED IN CIFNET, KOCHI
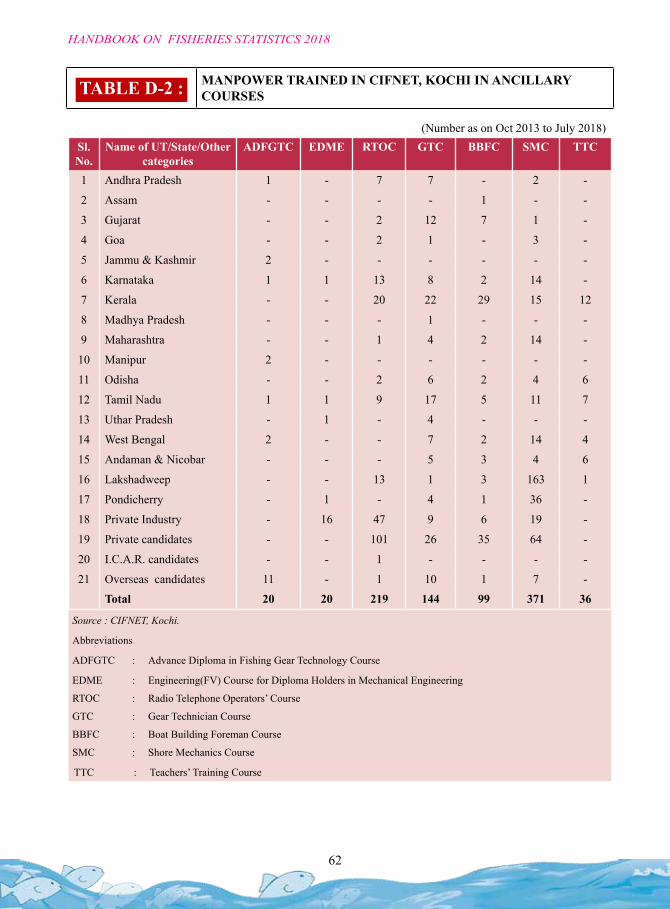
62
HANDBOOK ON FISHERIES STATISTICS 2018
TABLE D-2 : MANPOWER TRAINED IN CIFNET, KOCHI IN ANCILLARY COURSES
(Number as on Oct 2013 to July 2018)Sl. No.
Name of UT/State/Other categories
ADFGTC EDME RTOC GTC BBFC SMC TTC
1 Andhra Pradesh 1 - 7 7 - 2 -
2 Assam - - - - 1 - -
3 Gujarat - - 2 12 7 1 -
4 Goa - - 2 1 - 3 -
5 Jammu & Kashmir 2 - - - - - -
6 Karnataka 1 1 13 8 2 14 -
7 Kerala - - 20 22 29 15 12
8 Madhya Pradesh - - - 1 - - -
9 Maharashtra - - 1 4 2 14 -
10 Manipur 2 - - - - - -
11 Odisha - - 2 6 2 4 6
12 Tamil Nadu 1 1 9 17 5 11 7
13 Uthar Pradesh - 1 - 4 - - -
14 West Bengal 2 - - 7 2 14 4
15 Andaman & Nicobar - - - 5 3 4 6
16 Lakshadweep - - 13 1 3 163 1
17 Pondicherry - 1 - 4 1 36 -
18 Private Industry - 16 47 9 6 19 -
19 Private candidates - - 101 26 35 64 -
20 I.C.A.R. candidates - - 1 - - - -
21 Overseas candidates 11 - 1 10 1 7 -
Total 20 20 219 144 99 371 36
Source : CIFNET, Kochi.
Abbreviations
ADFGTC : Advance Diploma in Fishing Gear Technology Course
EDME : Engineering(FV) Course for Diploma Holders in Mechanical Engineering
RTOC : Radio Telephone Operators’ Course
GTC : Gear Technician Course
BBFC : Boat Building Foreman Course
SMC : Shore Mechanics Course
TTC : Teachers’ Training Course
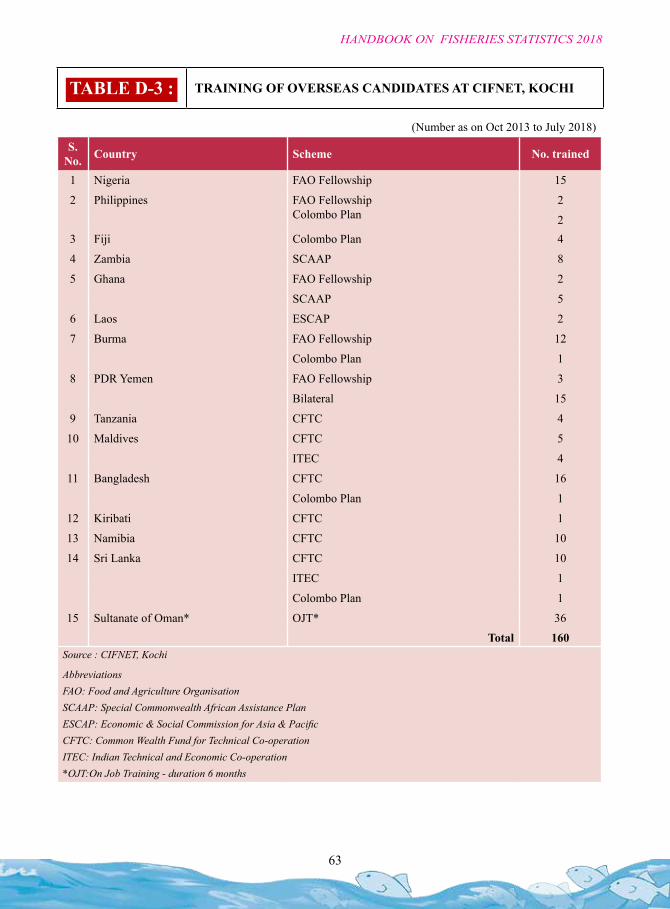
63
HANDBOOK ON FISHERIES STATISTICS 2018
TABLE D-3 : TRAINING OF OVERSEAS CANDIDATES AT CIFNET, KOCHI
(Number as on Oct 2013 to July 2018)
S. No. Country Scheme No. trained
1 Nigeria FAO Fellowship 15
2 Philippines FAO Fellowship Colombo Plan
2
23 Fiji Colombo Plan 4
4 Zambia SCAAP 8
5 Ghana FAO Fellowship 2
SCAAP 5
6 Laos ESCAP 2
7 Burma FAO Fellowship 12
Colombo Plan 1
8 PDR Yemen FAO Fellowship 3
Bilateral 15
9 Tanzania CFTC 4
10 Maldives CFTC 5
ITEC 4
11 Bangladesh CFTC 16
Colombo Plan 1
12 Kiribati CFTC 1
13 Namibia CFTC 10
14 Sri Lanka CFTC 10
ITEC 1
Colombo Plan 1
15 Sultanate of Oman* OJT* 36
Total 160Source : CIFNET, Kochi
AbbreviationsFAO: Food and Agriculture OrganisationSCAAP: Special Commonwealth African Assistance PlanESCAP: Economic & Social Commission for Asia & PacificCFTC: Common Wealth Fund for Technical Co-operationITEC: Indian Technical and Economic Co-operation*OJT:On Job Training - duration 6 months
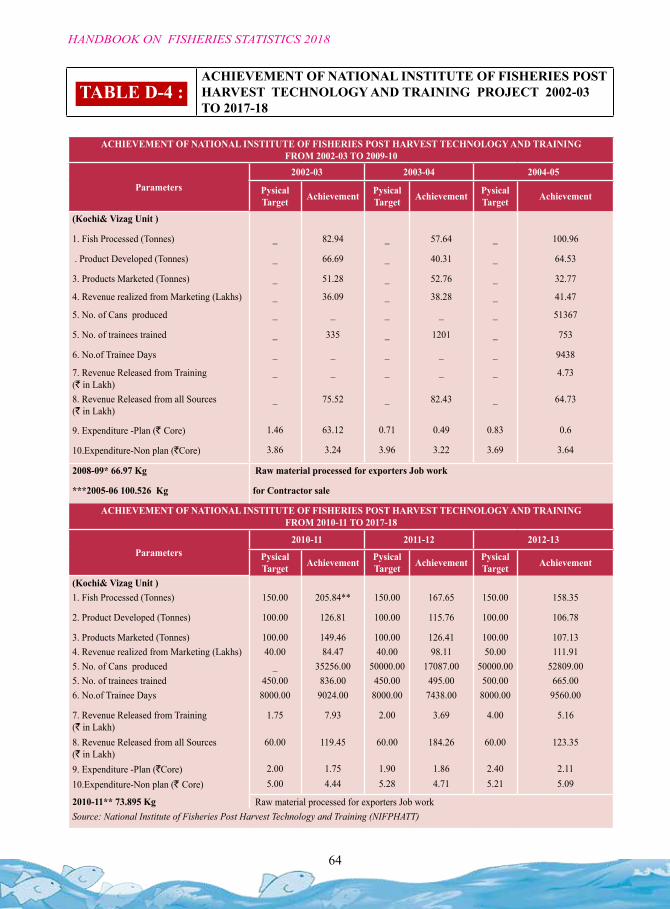
64
HANDBOOK ON FISHERIES STATISTICS 2018
TABLE D-4 : ACHIEVEMENT OF NATIONAL INSTITUTE OF FISHERIES POST HARVEST TECHNOLOGY AND TRAINING PROJECT 2002-03 TO 2017-18
ACHIEVEMENT OF NATIONAL INSTITUTE OF FISHERIES POST HARVEST TECHNOLOGY AND TRAINING FROM 2002-03 TO 2009-10
ACHIEVEMENT OF NATIONAL INSTITUTE OF FISHERIES POST HARVEST TECHNOLOGY AND TRAINING FROM 2002-03 TO 2009-10
Parameters2002-03 2003-04 2004-05 2005-06 2006-07 2007-08 2008-09 2009-10
Pysical Target Achievement Pysical
Target Achievement Pysical Target Achievement Pysical
Target Achievement Pysical Target Achievement Pysical
Target Achievement Pysical Target Achievement Pysical
Target Achieve-
ment(Kochi& Vizag Unit )
1. Fish Processed (Tonnes) _ 82.94 _ 57.64 _ 100.96 110.5 100.74 111.00 109.58 120.00 124.13 150.00 221.26* 150.00 146.19
. Product Developed (Tonnes) _ 66.69 _ 40.31 _ 64.53 67.96 57.50 68.00 79.19 72.00 93.76 100.00 118.71 100.00 90.18
3. Products Marketed (Tonnes) _ 51.28 _ 52.76 _ 32.77 66.96 160.059*** 67.00 102.54 84.00 116.27 100.00 140.66 100.00 103.26
4. Revenue realized from Marketing (Lakhs) _ 36.09 _ 38.28 _ 41.47 32.32 41.86 32.50 47.50 33.00 55.54 40.00 60.76 38.00 57.68
5. No. of Cans produced _ _ _ _ _ 51367 _ 83527 _ 53765.00 _ 12834.00 _ 46028.00 _ 32000.00
5. No. of trainees trained _ 335 _ 1201 _ 753 379 431 379.00 570.00 300.00 951.00 450.00 522.00 450.00 832.00
6. No.of Trainee Days _ _ _ _ _ 9438 4500 7031 4500.00 8173.00 4160.00 11381.00 8000.00 8183.00 8000.00 9376.00
7. Revenue Released from Training (` in Lakh)
_ _ _ _ _ 4.73 2.78 2.49 2.78 2.96 1.75 5.00 1.75 3.95 2.00 6.70
8. Revenue Released from all Sources (` in Lakh)
_ 75.52 _ 82.43 _ 64.73 80 79.47 40.00 72.66 40.00 84.62 60.00 109.72 60.00 102.09
9. Expenditure -Plan (` Core) 1.46 63.12 0.71 0.49 0.83 0.6 0.98 0.97 2.43 2.06 1.50 1.39 1.97 1.94 1.97 1.94
10.Expenditure-Non plan (`Core) 3.86 3.24 3.96 3.22 3.69 3.64 3.38 3.24 2.47 2.07 2.60 2.44 4.21 3.97 5.03 4.53
2008-09* 66.97 Kg Raw material processed for exporters Job work
***2005-06 100.526 Kg for Contractor sale
ACHIEVEMENT OF NATIONAL INSTITUTE OF FISHERIES POST HARVEST TECHNOLOGY AND TRAINING FROM 2010-11 TO 2017-18
ACHIEVEMENT OF NATIONAL INSTITUTE OF FISHERIES POST HARVEST TECHNOLOGY AND TRAINING FROM 2010-11 TO 2017-18
Parameters2010-11 2011-12 2012-13 2013-14 2014-15 2015-16 2016-17 2017-18
Pysical Target Achievement Pysical
Target Achievement Pysical Target Achievement Pysical
Target Achievement Pysical Target Achievement Pysical
Target Achievement Pysical Target Achievement Pysical
Target Achieve-
ment(Kochi& Vizag Unit )1. Fish Processed (Tonnes) 150.00 205.84** 150.00 167.65 150.00 158.35 150.00 112.51 150.00 149.58 150.00 131.07 150.00 123.57 150.00 110.46
2. Product Developed (Tonnes) 100.00 126.81 100.00 115.76 100.00 106.78 100.00 81.97 100.00 114.45 100.00 109.76 100.00 103.09 100.00 125.06
3. Products Marketed (Tonnes) 100.00 149.46 100.00 126.41 100.00 107.13 100.00 101.33 100.00 109.44 100.00 87.16 100.00 89.48 100.00 104.624. Revenue realized from Marketing (Lakhs) 40.00 84.47 40.00 98.11 50.00 111.91 70.00 125.41 70.00 136.42 70.00 128.46 70.00 157.75 90.00 154.725. No. of Cans produced _ 35256.00 50000.00 17087.00 50000.00 52809.00 50000.00 50914.00 50000.00 51317.00 50000.00 50063.00 50000.00 20776.00 50000.00 39352.005. No. of trainees trained 450.00 836.00 450.00 495.00 500.00 665.00 500.00 777.00 500.00 809.00 500.00 731.00 500.00 758.00 500.00 1374.006. No.of Trainee Days 8000.00 9024.00 8000.00 7438.00 8000.00 9560.00 8000.00 7893.00 8000.00 10150.00 8000.00 10782.00 8000.00 11341.00 8000.00 13057.00
7. Revenue Released from Training (` in Lakh)
1.75 7.93 2.00 3.69 4.00 5.16 4.00 4.75 4.00 5.06 4.00 5.25 4.00 5.17 4.00 6.77
8. Revenue Released from all Sources (` in Lakh)
60.00 119.45 60.00 184.26 60.00 123.35 80.00 187.15 80.00 216.52 80.00 315.47 90.00 255.90 120.00 231.27
9. Expenditure -Plan (`Core) 2.00 1.75 1.90 1.86 2.40 2.11 2.35 1.93 2.37 1.96 2.15 2.11 0.00 0.00 0.00 0.0010.Expenditure-Non plan (` Core) 5.00 4.44 5.28 4.71 5.21 5.09 4.95 4.88 5.26 5.51 6.52 6.47 100.45 95.43 91.63 89.59
2010-11** 73.895 Kg Raw material processed for exporters Job work Source: National Institute of Fisheries Post Harvest Technology and Training (NIFPHATT)
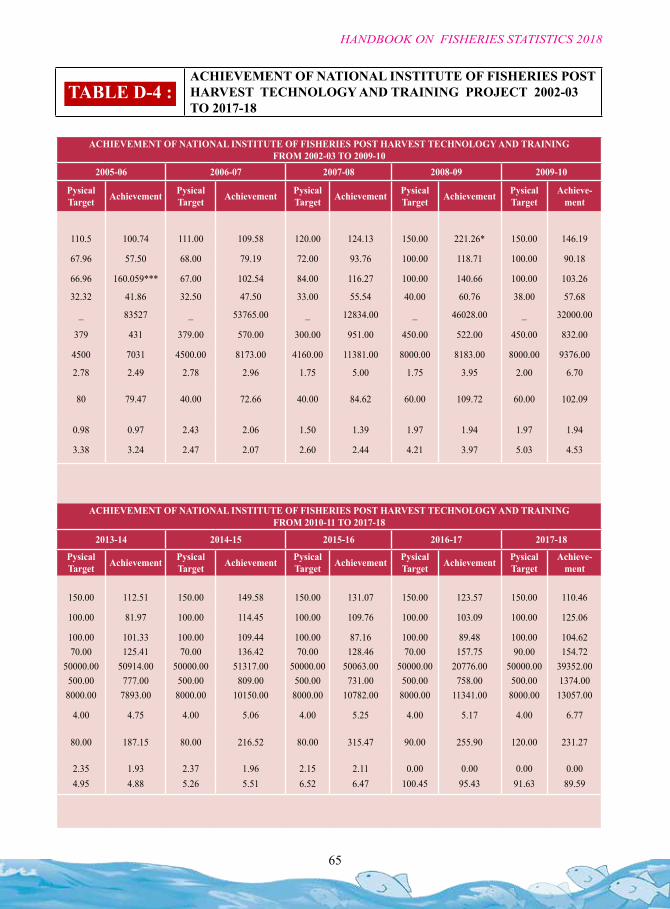
65
HANDBOOK ON FISHERIES STATISTICS 2018
TABLE D-4 : ACHIEVEMENT OF NATIONAL INSTITUTE OF FISHERIES POST HARVEST TECHNOLOGY AND TRAINING PROJECT 2002-03 TO 2017-18
ACHIEVEMENT OF NATIONAL INSTITUTE OF FISHERIES POST HARVEST TECHNOLOGY AND TRAINING FROM 2002-03 TO 2009-10
ACHIEVEMENT OF NATIONAL INSTITUTE OF FISHERIES POST HARVEST TECHNOLOGY AND TRAINING FROM 2002-03 TO 2009-10
Parameters2002-03 2003-04 2004-05 2005-06 2006-07 2007-08 2008-09 2009-10
Pysical Target Achievement Pysical
Target Achievement Pysical Target Achievement Pysical
Target Achievement Pysical Target Achievement Pysical
Target Achievement Pysical Target Achievement Pysical
Target Achieve-
ment(Kochi& Vizag Unit )
1. Fish Processed (Tonnes) _ 82.94 _ 57.64 _ 100.96 110.5 100.74 111.00 109.58 120.00 124.13 150.00 221.26* 150.00 146.19
. Product Developed (Tonnes) _ 66.69 _ 40.31 _ 64.53 67.96 57.50 68.00 79.19 72.00 93.76 100.00 118.71 100.00 90.18
3. Products Marketed (Tonnes) _ 51.28 _ 52.76 _ 32.77 66.96 160.059*** 67.00 102.54 84.00 116.27 100.00 140.66 100.00 103.26
4. Revenue realized from Marketing (Lakhs) _ 36.09 _ 38.28 _ 41.47 32.32 41.86 32.50 47.50 33.00 55.54 40.00 60.76 38.00 57.68
5. No. of Cans produced _ _ _ _ _ 51367 _ 83527 _ 53765.00 _ 12834.00 _ 46028.00 _ 32000.00
5. No. of trainees trained _ 335 _ 1201 _ 753 379 431 379.00 570.00 300.00 951.00 450.00 522.00 450.00 832.00
6. No.of Trainee Days _ _ _ _ _ 9438 4500 7031 4500.00 8173.00 4160.00 11381.00 8000.00 8183.00 8000.00 9376.00
7. Revenue Released from Training (` in Lakh)
_ _ _ _ _ 4.73 2.78 2.49 2.78 2.96 1.75 5.00 1.75 3.95 2.00 6.70
8. Revenue Released from all Sources (` in Lakh)
_ 75.52 _ 82.43 _ 64.73 80 79.47 40.00 72.66 40.00 84.62 60.00 109.72 60.00 102.09
9. Expenditure -Plan (` Core) 1.46 63.12 0.71 0.49 0.83 0.6 0.98 0.97 2.43 2.06 1.50 1.39 1.97 1.94 1.97 1.94
10.Expenditure-Non plan (`Core) 3.86 3.24 3.96 3.22 3.69 3.64 3.38 3.24 2.47 2.07 2.60 2.44 4.21 3.97 5.03 4.53
2008-09* 66.97 Kg Raw material processed for exporters Job work
***2005-06 100.526 Kg for Contractor sale
ACHIEVEMENT OF NATIONAL INSTITUTE OF FISHERIES POST HARVEST TECHNOLOGY AND TRAINING FROM 2010-11 TO 2017-18
ACHIEVEMENT OF NATIONAL INSTITUTE OF FISHERIES POST HARVEST TECHNOLOGY AND TRAINING FROM 2010-11 TO 2017-18
Parameters2010-11 2011-12 2012-13 2013-14 2014-15 2015-16 2016-17 2017-18
Pysical Target Achievement Pysical
Target Achievement Pysical Target Achievement Pysical
Target Achievement Pysical Target Achievement Pysical
Target Achievement Pysical Target Achievement Pysical
Target Achieve-
ment(Kochi& Vizag Unit )1. Fish Processed (Tonnes) 150.00 205.84** 150.00 167.65 150.00 158.35 150.00 112.51 150.00 149.58 150.00 131.07 150.00 123.57 150.00 110.46
2. Product Developed (Tonnes) 100.00 126.81 100.00 115.76 100.00 106.78 100.00 81.97 100.00 114.45 100.00 109.76 100.00 103.09 100.00 125.06
3. Products Marketed (Tonnes) 100.00 149.46 100.00 126.41 100.00 107.13 100.00 101.33 100.00 109.44 100.00 87.16 100.00 89.48 100.00 104.624. Revenue realized from Marketing (Lakhs) 40.00 84.47 40.00 98.11 50.00 111.91 70.00 125.41 70.00 136.42 70.00 128.46 70.00 157.75 90.00 154.725. No. of Cans produced _ 35256.00 50000.00 17087.00 50000.00 52809.00 50000.00 50914.00 50000.00 51317.00 50000.00 50063.00 50000.00 20776.00 50000.00 39352.005. No. of trainees trained 450.00 836.00 450.00 495.00 500.00 665.00 500.00 777.00 500.00 809.00 500.00 731.00 500.00 758.00 500.00 1374.006. No.of Trainee Days 8000.00 9024.00 8000.00 7438.00 8000.00 9560.00 8000.00 7893.00 8000.00 10150.00 8000.00 10782.00 8000.00 11341.00 8000.00 13057.00
7. Revenue Released from Training (` in Lakh)
1.75 7.93 2.00 3.69 4.00 5.16 4.00 4.75 4.00 5.06 4.00 5.25 4.00 5.17 4.00 6.77
8. Revenue Released from all Sources (` in Lakh)
60.00 119.45 60.00 184.26 60.00 123.35 80.00 187.15 80.00 216.52 80.00 315.47 90.00 255.90 120.00 231.27
9. Expenditure -Plan (`Core) 2.00 1.75 1.90 1.86 2.40 2.11 2.35 1.93 2.37 1.96 2.15 2.11 0.00 0.00 0.00 0.0010.Expenditure-Non plan (` Core) 5.00 4.44 5.28 4.71 5.21 5.09 4.95 4.88 5.26 5.51 6.52 6.47 100.45 95.43 91.63 89.59
2010-11** 73.895 Kg Raw material processed for exporters Job work Source: National Institute of Fisheries Post Harvest Technology and Training (NIFPHATT)
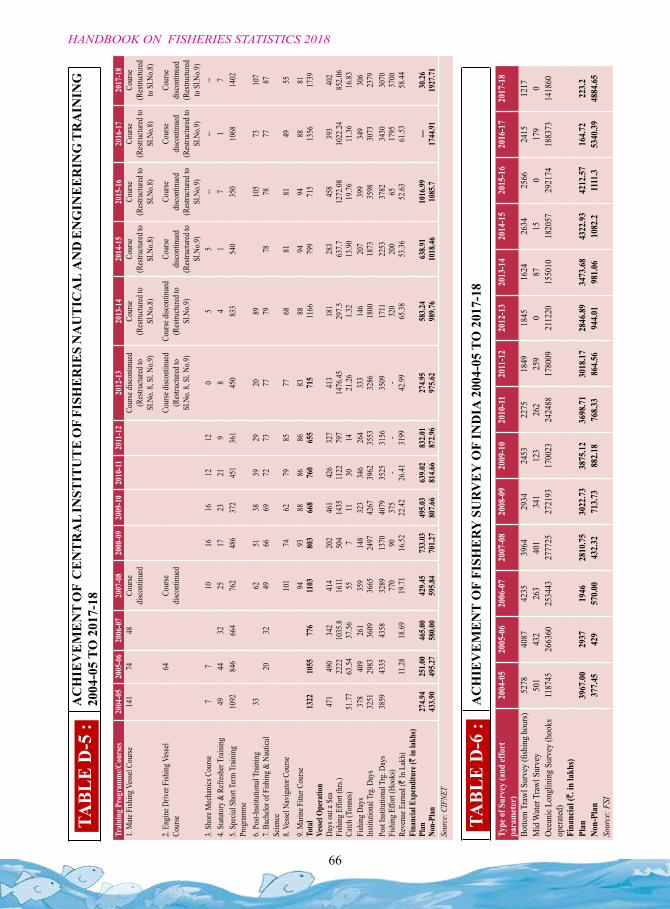
66
HANDBOOK ON FISHERIES STATISTICS 2018
TABL
E D
-5 :
AC
HIE
VE
ME
NT
OF
CE
NT
RA
L IN
STIT
UT
E O
F FI
SHE
RIE
S N
AU
TIC
AL
AN
D E
NG
INE
ER
ING
TR
AIN
ING
20
04-0
5 TO
201
7-18
TABL
E D
-6 :
AC
HIE
VE
ME
NT
OF
FISH
ER
Y S
UR
VE
Y O
F IN
DIA
200
4-05
TO
201
7-18
Train
ing P
rogr
amm
e/Cou
rses
2004
-05
2005
-06
2006
-07
2007
-08
2008
-09
2009
-10
2010
-1120
11-1
220
12-1
320
13-1
420
14-1
520
15-1
620
16-1
720
17-1
81.
Mate
Fish
ing V
esse
l Cou
rse14
174
48Co
urse
di
scon
tinue
dCo
urse
disc
ontin
ued
(Res
tructu
red t
o Sl
.No.
8, Sl
. No.9
)
Cour
se
(Res
tructu
red t
o Sl
.No.8
)
Cour
se
(Res
tructu
red t
o Sl
.No.8
)
Cour
se
(Res
tructu
red t
o Sl
.No.8
)
Cour
se
(Res
tructu
red t
o Sl
.No.8
)
Cour
se
(Res
tructu
red
to S
l.No.8
)
2. En
gine
Driv
er F
ishin
g Ves
sel
Cour
se64
Cour
se
disc
ontin
ued
Cour
se di
scon
tinue
d (R
estru
cture
d to
Sl.N
o. 8,
Sl. N
o.9)
Cour
se di
scon
tinue
d (R
estru
cture
d to
Sl.N
o.9)
Cour
se
disc
ontin
ued
(Res
tructu
red t
o Sl
.No.9
)
Cour
se
disc
ontin
ued
(Res
tructu
red t
o Sl
.No.9
)
Cour
se
disc
ontin
ued
(Res
tructu
red t
o Sl
.No.9
)
Cour
se
disc
ontin
ued
(Res
tructu
red
to S
l.No.9
)3.
Shor
e Mec
hani
cs C
ourse
77
1016
1612
120
55
----
--4.
Statu
tory
& R
efre
sher
Tra
inin
g49
4432
2517
2321
98
41
71
75.
Spec
ial S
hort
Term
Tra
inin
g Pr
ogra
mm
e10
9284
666
476
248
637
245
136
145
083
354
035
010
6814
02
6. Po
st-In
stitu
tiona
l Tra
inin
g33
6251
3839
2920
8910
573
107
7. Ba
chelo
r of F
ishin
g & N
autic
al Sc
ience
2032
4966
6972
7377
7978
7877
87
8. Ve
ssel
Navi
gato
r Cou
rse10
174
6279
8577
6881
8149
559.
Mar
ine F
itter
Cou
rse94
9388
8686
8388
9494
8881
Tota
l13
2210
5577
611
0380
366
876
065
571
511
6679
971
513
5617
39Ve
ssel O
pera
tion
Days
out a
Sea
471
490
342
414
202
461
426
327
413
181
283
458
393
402
Fish
ing E
ffort
(hrs.
)22
2210
35.8
1611
504
1435
1122
797
1476
.4529
7.563
7.712
72.08
1022
.2485
2.06
Catch
(Ton
nes)
51.77
63.54
37.56
557
1130
1421
.261.3
213
.9019
.7611
.3616
.83Fi
shin
g Day
s37
840
926
135
914
832
334
626
433
314
620
739
934
930
6In
stitu
tiona
l Trg
. Day
s32
5129
8336
0936
6524
9742
6739
6235
5332
8618
0018
7335
9830
7323
79Po
st In
stitu
tiona
l Trg
. Day
s38
5943
3543
5832
8913
7040
7935
2531
5635
0917
1122
5337
8234
3030
70Fi
shin
g Effo
rt (H
ooks
)77
090
375
--
-32
020
065
1795
3700
Reve
nue E
arne
d (`
In L
akh)
11.28
18.69
19.71
16.52
22.42
26.41
3199
42.99
65.38
53.36
52.63
61.53
58.44
Fina
ncial
Exp
endi
ture
(` in
lakh
s)Pl
an27
4.94
251.0
046
5.00
429.4
573
3.03
495.0
363
9.02
832.0
127
4.95
583.2
463
8.91
1016
.99---
30.26
Non-
Plan
433.9
049
5.27
580.0
059
5.84
701.2
780
7.66
814.6
687
2.96
975.6
298
9.76
1018
.4610
85.7
1744
.9119
27.71
Sour
ce: C
IFNE
T
Type
of S
urve
y (a
nd ef
fort
pa
ram
eter
)20
04-0
520
05-0
620
06-0
720
07-0
820
08-0
920
09-1
020
10-1
120
11-1
220
12-1
320
13-1
420
14-1
520
15-1
620
16-1
720
17-1
8
Botto
m T
rawl
Sur
vey
(fish
ing
hour
s)52
7840
8742
3539
6429
3424
5322
7518
4918
4516
2426
3425
6624
1512
17M
id W
ater T
rawl
Sur
vey
501
432
263
401
341
123
262
259
087
150
179
0Oc
eani
c Lon
glin
ing
Surv
ey (h
ooks
op
erate
d)11
8745
2663
6025
3443
2777
2527
2193
1700
2324
2488
1780
0921
1220
1550
1018
2057
2921
7418
8373
1418
60
Fina
ncia
l (`.
in la
khs)
Plan
39
67.0
029
3719
4628
10.7
530
22.7
338
75.1
236
98.7
130
18.1
728
46.8
934
73.6
843
22.9
342
12.5
716
4.72
223.
2No
n-Pl
an37
7.45
429
570.
0043
2.32
713.
7388
2.18
768.
3386
4.56
944.
0198
1.06
1082
.211
11.3
5340
.39
4884
.65
Sour
ce: F
SI
SECTION : E
EXPENDITUREON
FISHERIES SECTOR
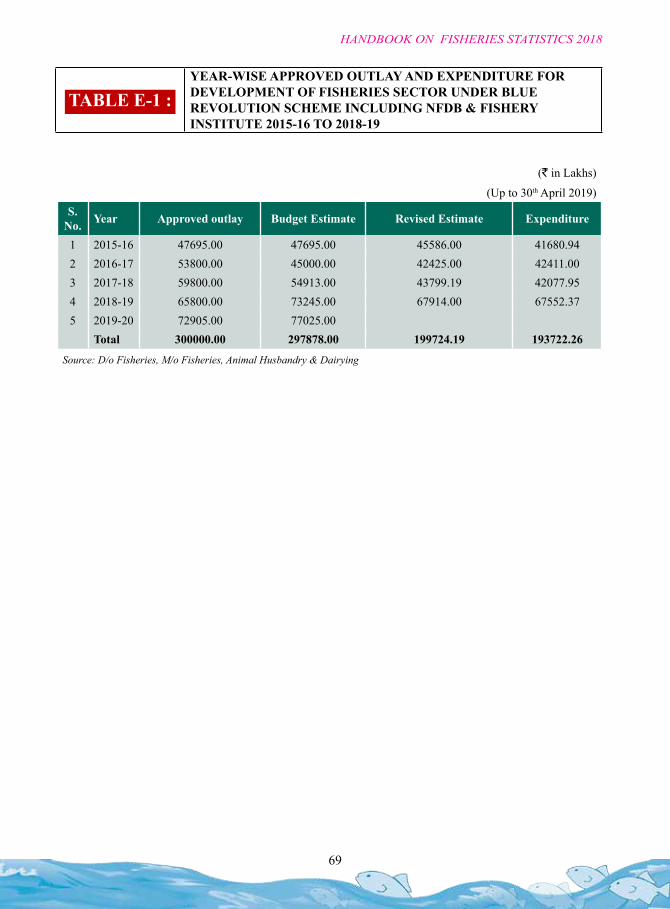
69
HANDBOOK ON FISHERIES STATISTICS 2018
(` in Lakhs)
(Up to 30th April 2019)S.
No. Year Approved outlay Budget Estimate Revised Estimate Expenditure
1 2015-16 47695.00 47695.00 45586.00 41680.942 2016-17 53800.00 45000.00 42425.00 42411.003 2017-18 59800.00 54913.00 43799.19 42077.954 2018-19 65800.00 73245.00 67914.00 67552.375 2019-20 72905.00 77025.00
Total 300000.00 297878.00 199724.19 193722.26
Source: D/o Fisheries, M/o Fisheries, Animal Husbandry & Dairying
TABLE E-1 : YEAR-WISE APPROVED OUTLAY AND EXPENDITURE FOR DEVELOPMENT OF FISHERIES SECTOR UNDER BLUE REVOLUTION SCHEME INCLUDING NFDB & FISHERY INSTITUTE 2015-16 TO 2018-19
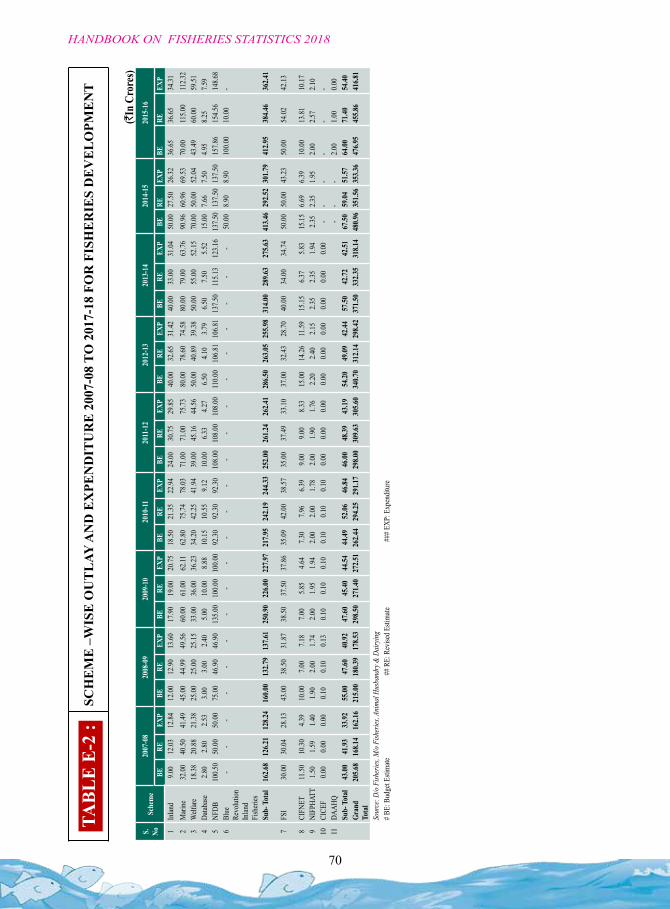
70
HANDBOOK ON FISHERIES STATISTICS 2018
(`In
Cro
res)
S.
NoSc
hem
e20
07-0
820
08-0
920
09-1
020
10-11
2011
-12
2012
-13
2013
-14
2014
-15
2015
-16
BERE
EXP
BERE
EXP
BERE
EXP
BERE
EXP
BERE
EXP
BERE
EXP
BERE
EXP
BERE
EXP
BERE
EXP
1In
land
9.00
12.03
12.84
12.00
12.90
13.60
17.90
19.00
20.75
18.50
21.35
22.94
24.00
30.75
29.85
40.00
32.65
31.42
40.00
33.00
31.04
50.00
27.50
26.32
36.65
36.65
34.31
2M
arin
e32
.0040
.5041
.4945
.0044
.9949
.5660
.0061
.0062
.1162
.8075
.7478
.0371
.0071
.0075
.7380
.0078
.6074
.5880
.0079
.0063
.7690
.9660
.9669
.5370
.0011
5.00
112.3
23
Welf
are
18.38
20.88
21.38
25.00
25.00
25.15
33.00
36.00
36.23
34.20
42.25
41.94
39.00
45.16
44.56
50.00
40.89
39.38
50.00
55.00
52.15
70.00
50.00
52.04
43.49
60.00
59.51
4Da
tabas
e2.8
02.8
02.5
33.0
03.0
02.4
05.0
010
.008.8
810
.1510
.559.1
210
.006.3
34.2
76.5
04.1
03.7
96.5
07.5
05.5
215
.007.6
67.5
04.9
58.2
57.5
95
NFDB
100.5
050
.0050
.0075
.0046
.9046
.9013
5.00
100.0
010
0.00
92.30
92.30
92.30
108.0
010
8.00
108.0
011
0.00
106.8
110
6.81
137.5
011
5.13
123.1
613
7.50
137.5
013
7.50
157.8
615
4.56
148.6
86
Blue
Re
volu
tion
Inlan
d Fi
sher
ies
--
--
--
--
--
--
--
--
--
--
-50
.008.9
08.9
010
0.00
10.00
-
Sub-
Tot
al16
2.68
126.2
112
8.24
160.0
013
2.79
137.6
125
0.90
226.0
022
7.97
217.9
524
2.19
244.3
325
2.00
261.2
426
2.41
286.5
026
3.05
255.9
831
4.00
289.6
327
5.63
413.4
629
2.52
301.7
941
2.95
384.4
636
2.41
7FS
I30
.0030
.0428
.1343
.0038
.5031
.8738
.5037
.5037
.8635
.0942
.0038
.5735
.0037
.4933
.1037
.0032
.4328
.7040
.0034
.0034
.7450
.0050
.0043
.2350
.0054
.0242
.13
8CI
FNET
11.50
10.30
4.39
10.00
7.00
7.18
7.00
5.85
4.64
7.30
7.96
6.39
9.00
9.00
8.33
15.00
14.26
11.59
15.15
6.37
5.83
15.15
6.69
6.39
10.00
13.81
10.17
9NI
FPHA
TT1.5
01.5
91.4
01.9
02.0
01.7
42.0
01.9
51.9
42.0
02.0
01.7
82.0
01.9
01.7
62.2
02.4
02.1
52.3
52.3
51.9
42.3
52.3
51.9
52.0
02.5
72.1
010
CICE
F0.0
00.0
00.0
00.1
00.1
00.1
30.1
00.1
00.1
00.1
00.1
00.1
00.0
00.0
00.0
00.0
00.0
00.0
00.0
00.0
00.0
0-
--
--
-11
DAAH
Q-
--
2.00
1.00
0.00
Sub-
Tot
al43
.0041
.9333
.9255
.0047
.6040
.9247
.6045
.4044
.5444
.4952
.0646
.8446
.0048
.3943
.1954
.2049
.0942
.4457
.5042
.7242
.5167
.5059
.0451
.5764
.0071
.4054
.40Gr
and
Tota
l20
5.68
168.1
416
2.16
215.0
018
0.39
178.5
329
8.50
271.4
027
2.51
262.4
429
4.25
291.1
729
8.00
309.6
330
5.60
340.7
031
2.14
298.4
237
1.50
332.3
531
8.14
480.9
635
1.56
353.3
647
6.95
455.8
641
6.81
Sour
ce: D
/o Fi
sher
ies, M
/o Fi
sher
ies, A
nimal
Husb
andr
y & D
airyin
g# B
E: B
udge
t Esti
mate
## R
E: R
evise
d Esti
mate
### E
XP: E
xpen
ditu
re
TABL
E E-
2 :
SCH
EM
E –
WIS
E O
UT
LAY
AN
D E
XPE
ND
ITU
RE
200
7-08
TO
201
7-18
FO
R F
ISH
ER
IES
DE
VE
LO
PME
NT
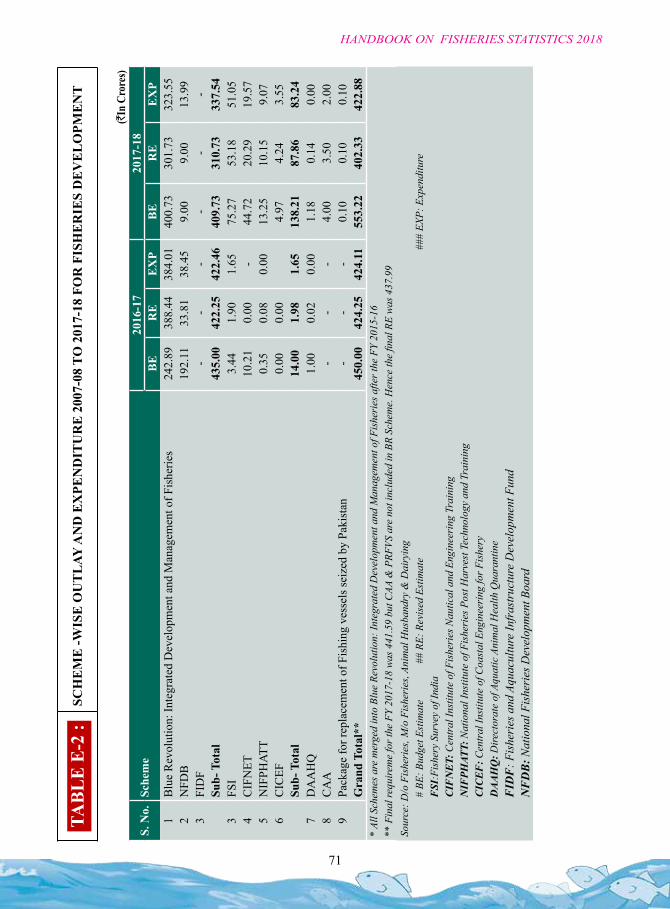
71
HANDBOOK ON FISHERIES STATISTICS 2018
(`In
Cro
res)
S. N
o.Sc
hem
e20
16-1
720
17-1
8B
ER
EE
XP
BE
RE
EX
P1
Blu
e R
evol
utio
n: In
tegr
ated
Dev
elop
men
t and
Man
agem
ent o
f Fis
herie
s24
2.89
388.
4438
4.01
400.
7330
1.73
323.
552
NFD
B19
2.11
33.8
138
.45
9.00
9.00
13.9
93
FID
F-
--
--
-Su
b- T
otal
435.
0042
2.25
422.
4640
9.73
310.
7333
7.54
3FS
I3.
441.
901.
6575
.27
53.1
851
.05
4C
IFN
ET10
.21
0.00
-44
.72
20.2
919
.57
5N
IFPH
ATT
0.35
0.08
0.00
13.2
510
.15
9.07
6C
ICEF
0.00
0.00
4.97
4.24
3.55
Sub-
Tot
al14
.00
1.98
1.65
138.
2187
.86
83.2
47
DA
AH
Q1.
000.
020.
001.
180.
140.
008
CA
A-
--
4.00
3.50
2.00
9Pa
ckag
e fo
r rep
lace
men
t of F
ishi
ng v
esse
ls se
ized
by
Paki
stan
--
-0.
100.
100.
10G
rand
Tot
al**
450.
0042
4.25
424.
1155
3.22
402.
3342
2.88
* Al
l Sch
emes
are
mer
ged
into
Blu
e Re
volu
tion:
Inte
grat
ed D
evel
opm
ent a
nd M
anag
emen
t of F
ishe
ries
afte
r the
FY
2015
-16
** F
inal
requ
irem
e fo
r the
FY
2017
-18
was
441
.59
but C
AA &
PRF
VS a
re n
ot in
clud
ed in
BR
Sche
me.
Hen
ce th
e fin
al R
E w
as 4
37.9
9So
urce
: D/o
Fis
heri
es, M
/o F
ishe
ries
, Ani
mal
Hus
band
ry &
Dai
ryin
g#
BE: B
udge
t Est
imat
e##
RE:
Rev
ised
Est
imat
e##
# EX
P: E
xpen
ditu
reF
SI:F
ishe
ry S
urve
y of
Indi
aC
IFN
ET:
Cen
tral
Inst
itute
of F
ishe
ries
Nau
tical
and
Eng
inee
ring
Tra
inin
gN
IFPH
ATT:
Nat
iona
l Ins
titut
e of
Fis
heri
es P
ost H
arve
st T
echn
olog
y an
d Tr
aini
ngC
ICE
F: C
entr
al In
stitu
te o
f Coa
stal
Eng
inee
ring
for F
ishe
ryD
AA
HQ
: Dire
ctor
ate
of A
quat
ic A
nim
al H
ealth
Qua
rant
ine
FID
F: F
ishe
ries
and
Aqu
acul
ture
Infr
astr
uctu
re D
evel
opm
ent F
und
NF
DB
: Nat
iona
l Fis
heri
es D
evel
opm
ent B
oard
TABL
E E-
2 :
SCH
EM
E -W
ISE
OU
TL
AY A
ND
EX
PEN
DIT
UR
E 2
007-
08 T
O 2
017-
18 F
OR
FIS
HE
RIE
S D
EV
EL
OPM
EN
T
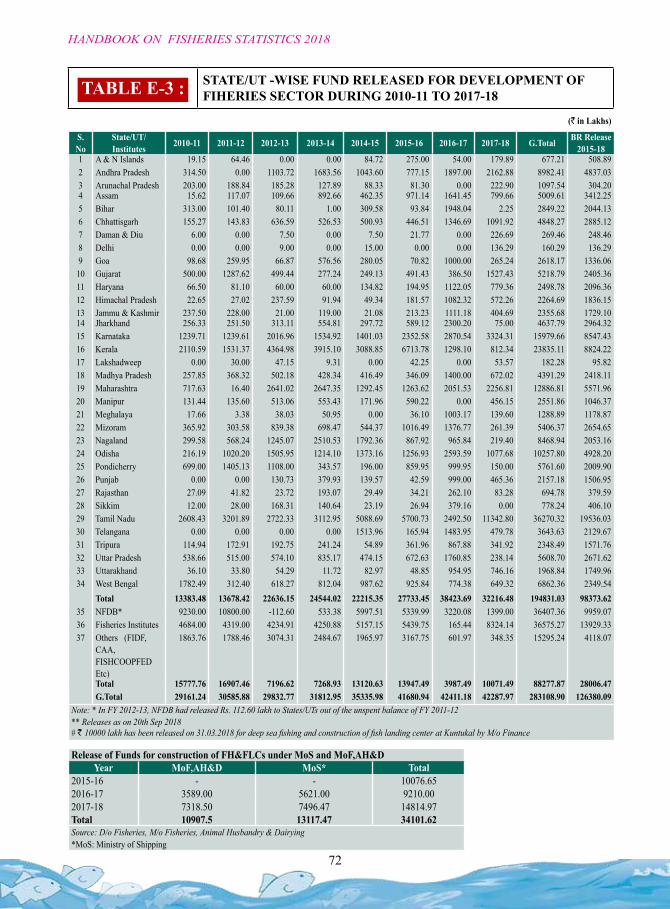
72
HANDBOOK ON FISHERIES STATISTICS 2018
(` in Lakhs)
S. No
State/UT/Institutes 2010-11 2011-12 2012-13 2013-14 2014-15 2015-16 2016-17 2017-18 G.Total BR Release
2015-181 A & N Islands 19.15 64.46 0.00 0.00 84.72 275.00 54.00 179.89 677.21 508.892 Andhra Pradesh 314.50 0.00 1103.72 1683.56 1043.60 777.15 1897.00 2162.88 8982.41 4837.033 Arunachal Pradesh 203.00 188.84 185.28 127.89 88.33 81.30 0.00 222.90 1097.54 304.204 Assam 15.62 117.07 109.66 892.66 462.35 971.14 1641.45 799.66 5009.61 3412.255 Bihar 313.00 101.40 80.11 1.00 309.58 93.84 1948.04 2.25 2849.22 2044.136 Chhattisgarh 155.27 143.83 636.59 526.53 500.93 446.51 1346.69 1091.92 4848.27 2885.127 Daman & Diu 6.00 0.00 7.50 0.00 7.50 21.77 0.00 226.69 269.46 248.468 Delhi 0.00 0.00 9.00 0.00 15.00 0.00 0.00 136.29 160.29 136.299 Goa 98.68 259.95 66.87 576.56 280.05 70.82 1000.00 265.24 2618.17 1336.06
10 Gujarat 500.00 1287.62 499.44 277.24 249.13 491.43 386.50 1527.43 5218.79 2405.3611 Haryana 66.50 81.10 60.00 60.00 134.82 194.95 1122.05 779.36 2498.78 2096.3612 Himachal Pradesh 22.65 27.02 237.59 91.94 49.34 181.57 1082.32 572.26 2264.69 1836.1513 Jammu & Kashmir 237.50 228.00 21.00 119.00 21.08 213.23 1111.18 404.69 2355.68 1729.1014 Jharkhand 256.33 251.50 313.11 554.81 297.72 589.12 2300.20 75.00 4637.79 2964.3215 Karnataka 1239.71 1239.61 2016.96 1534.92 1401.03 2352.58 2870.54 3324.31 15979.66 8547.4316 Kerala 2110.59 1531.37 4364.98 3915.10 3088.85 6713.78 1298.10 812.34 23835.11 8824.2217 Lakshadweep 0.00 30.00 47.15 9.31 0.00 42.25 0.00 53.57 182.28 95.8218 Madhya Pradesh 257.85 368.32 502.18 428.34 416.49 346.09 1400.00 672.02 4391.29 2418.1119 Maharashtra 717.63 16.40 2641.02 2647.35 1292.45 1263.62 2051.53 2256.81 12886.81 5571.9620 Manipur 131.44 135.60 513.06 553.43 171.96 590.22 0.00 456.15 2551.86 1046.3721 Meghalaya 17.66 3.38 38.03 50.95 0.00 36.10 1003.17 139.60 1288.89 1178.8722 Mizoram 365.92 303.58 839.38 698.47 544.37 1016.49 1376.77 261.39 5406.37 2654.6523 Nagaland 299.58 568.24 1245.07 2510.53 1792.36 867.92 965.84 219.40 8468.94 2053.1624 Odisha 216.19 1020.20 1505.95 1214.10 1373.16 1256.93 2593.59 1077.68 10257.80 4928.2025 Pondicherry 699.00 1405.13 1108.00 343.57 196.00 859.95 999.95 150.00 5761.60 2009.9026 Punjab 0.00 0.00 130.73 379.93 139.57 42.59 999.00 465.36 2157.18 1506.9527 Rajasthan 27.09 41.82 23.72 193.07 29.49 34.21 262.10 83.28 694.78 379.5928 Sikkim 12.00 28.00 168.31 140.64 23.19 26.94 379.16 0.00 778.24 406.1029 Tamil Nadu 2608.43 3201.89 2722.33 3112.95 5088.69 5700.73 2492.50 11342.80 36270.32 19536.0330 Telangana 0.00 0.00 0.00 0.00 1513.96 165.94 1483.95 479.78 3643.63 2129.6731 Tripura 114.94 172.91 192.75 241.24 54.89 361.96 867.88 341.92 2348.49 1571.7632 Uttar Pradesh 538.66 515.00 574.10 835.17 474.15 672.63 1760.85 238.14 5608.70 2671.6233 Uttarakhand 36.10 33.80 54.29 11.72 82.97 48.85 954.95 746.16 1968.84 1749.9634 West Bengal 1782.49 312.40 618.27 812.04 987.62 925.84 774.38 649.32 6862.36 2349.54
Total 13383.48 13678.42 22636.15 24544.02 22215.35 27733.45 38423.69 32216.48 194831.03 98373.6235 NFDB* 9230.00 10800.00 -112.60 533.38 5997.51 5339.99 3220.08 1399.00 36407.36 9959.0736 Fisheries Institutes 4684.00 4319.00 4234.91 4250.88 5157.15 5439.75 165.44 8324.14 36575.27 13929.3337 Others (FIDF,
CAA, FISHCOOPFED Etc)
1863.76 1788.46 3074.31 2484.67 1965.97 3167.75 601.97 348.35 15295.24 4118.07
Total 15777.76 16907.46 7196.62 7268.93 13120.63 13947.49 3987.49 10071.49 88277.87 28006.47G.Total 29161.24 30585.88 29832.77 31812.95 35335.98 41680.94 42411.18 42287.97 283108.90 126380.09
Note: * In FY 2012-13, NFDB had released Rs. 112.60 lakh to States/UTs out of the unspent balance of FY 2011-12 ** Releases as on 20th Sep 2018# ` 10000 lakh has been released on 31.03.2018 for deep sea fishing and construction of fish landing center at Kuntukal by M/o Finance
TABLE E-3 : STATE/UT -WISE FUND RELEASED FOR DEVELOPMENT OF FIHERIES SECTOR DURING 2010-11 TO 2017-18
Release of Funds for construction of FH&FLCs under MoS and MoF,AH&DYear MoF,AH&D MoS* Total
2015-16 - - 10076.652016-17 3589.00 5621.00 9210.002017-18 7318.50 7496.47 14814.97Total 10907.5 13117.47 34101.62Source: D/o Fisheries, M/o Fisheries, Animal Husbandry & Dairying*MoS: Ministry of Shipping
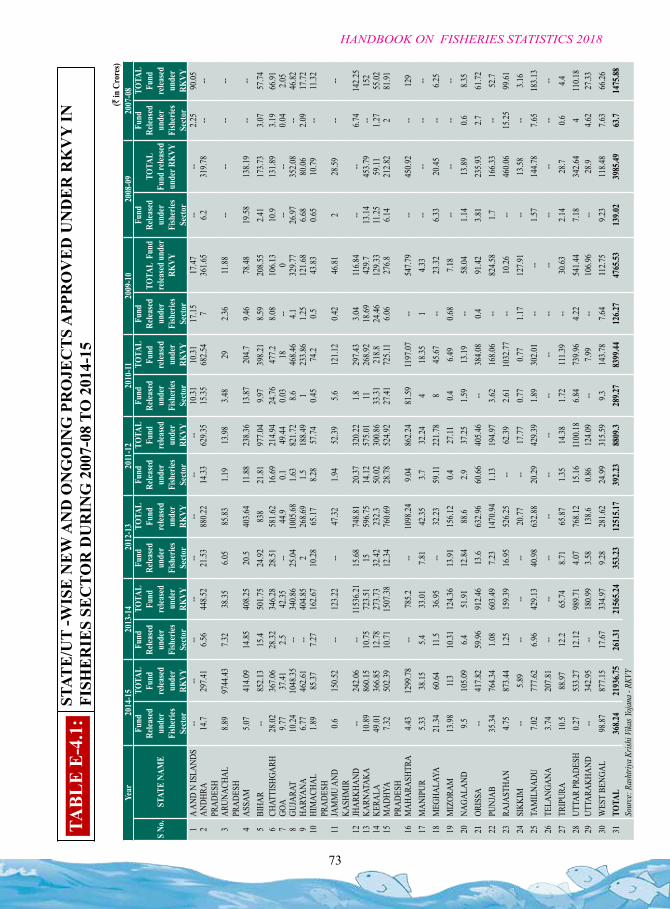
73
HANDBOOK ON FISHERIES STATISTICS 2018
(`
in C
rore
s)Ye
ar20
14-1
520
13-1
420
12-1
320
11-1
220
10-11
2009
-10
2008
-09
2007
-08
S No
.ST
ATE
NAM
E
Fund
Re
lease
d un
der
Fish
eries
Se
ctor
TOTA
L
Fund
re
lease
d un
der
RKVY
Fund
Re
lease
d un
der
Fish
eries
Se
ctor
TOTA
L
Fund
re
lease
d un
der
RKVY
Fund
Re
lease
d un
der
Fish
eries
Se
ctor
TOTA
L
Fund
re
lease
d un
der
RKVY
Fund
Re
lease
d un
der
Fish
eries
Se
ctor
TOTA
L
Fund
re
lease
d un
der
RKVY
Fund
Re
lease
d un
der
Fish
eries
Se
ctor
TOTA
L
Fund
re
lease
d un
der
RKVY
Fund
Re
lease
d un
der
Fish
eries
Se
ctor
TOTA
L F
und
relea
sed
unde
r RK
VY
Fund
Re
lease
d un
der
Fish
eries
Se
ctor
TOTA
L
Fund
relea
sed
unde
r RKV
Y
Fund
Re
lease
d un
der
Fish
eries
Se
ctor
TOTA
L
Fund
re
lease
d un
der
RKVY
1A
AND
N IS
LAND
S--
----
----
----
--10
.3110
.3117
.1517
.47--
--2.2
590
.052
ANDH
RA
PRAD
ESH
14.7
297.4
16.5
644
8.52
21.53
880.2
214
.3362
9.35
15.35
682.5
47
361.6
56.2
319.7
8--
--
3AR
UNAC
HAL
PRAD
ESH
8.89
9744
.437.3
238
.356.0
585
.831.1
913
.983.4
829
2.36
11.88
----
----
4AS
SAM
5.07
414.0
914
.8540
8.25
20.5
403.6
411
.8823
8.36
13.87
204.7
9.46
78.48
19.58
138.1
9--
--5
BIHA
R--
852.1
315
.450
1.75
24.92
838
21.81
977.0
49.9
739
8.21
8.59
208.5
52.4
117
3.73
3.07
57.74
6CH
ATTI
SHGA
RH28
.0236
7.06
28.32
346.2
828
.5158
1.62
16.69
214.9
424
.7647
7.28.0
810
6.13
10.9
131.8
93.1
966
.917
GOA
9.77
37.41
2.542
.35--
44.9
0.149
.440.0
318
--0
----
0.04
2.05
8GU
JARA
T10
.2410
48.35
--34
0.86
25.04
1005
.681.6
382
1.72
8.646
8.46
4.132
9.77
26.97
352.0
8--
46.82
9HA
RYAN
A6.7
746
2.61
--40
4.85
226
8.69
1.518
8.49
123
3.86
1.25
121.6
86.6
880
.062.0
917
.7210
HIM
ACHA
L PR
ADES
H1.8
985
.377.2
716
2.67
10.28
65.17
8.28
57.74
0.45
74.2
0.543
.830.6
510
.79--
11.32
11JA
MM
U AN
D KA
SHM
IR0.6
150.5
2--
123.2
2--
47.32
1.94
52.39
5.612
1.12
0.42
46.81
228
.59--
--
12JH
ARKH
AND
--24
2.06
--11
536.2
115
.6874
8.81
20.37
320.2
21.8
297.4
33.0
411
6.84
----
6.74
142.2
513
KARN
ATAK
A10
.8986
0.15
10.75
723.5
115
596.7
514
.1257
5.01
1126
8.92
18.69
429.7
13.14
453.7
9--
152
14KE
RALA
49.01
366.8
512
.7827
3.73
32.42
232.3
50.02
300.8
633
.3121
8.824
.4612
9.33
11.25
59.11
1.27
55.02
15M
ADHY
A PR
ADES
H7.3
250
2.39
10.71
1507
.3812
.3476
0.69
28.78
524.9
227
.4172
5.11
6.06
276.8
6.14
212.8
22
81.91
16M
AHAR
ASHT
RA4.4
312
99.78
--78
5.2--
1098
.249.0
486
2.24
81.59
1197
.07--
547.7
9--
450.9
2--
129
17M
ANIP
UR5.3
338
.155.4
33.01
7.81
42.35
3.732
.244
18.35
14.3
3--
----
--18
MEG
HALA
YA21
.3460
.6411
.536
.95--
32.23
59.11
221.7
88
45.67
--23
.326.3
320
.45--
6.25
19M
IZOR
AM13
.9811
310
.3112
4.36
13.91
156.1
20.4
27.11
0.46.4
90.6
87.1
8--
----
--20
NAGA
LAND
9.510
5.09
6.451
.9112
.8488
.62.9
37.25
1.59
13.19
--58
.041.1
413
.890.6
8.35
21OR
ISSA
--41
7.82
59.96
912.4
613
.663
2.96
60.66
405.4
6--
384.0
80.4
91.42
3.81
235.9
32.7
61.72
22PU
NJAB
35.34
764.3
41.0
860
3.49
7.23
1470
.941.1
319
4.97
3.62
168.0
6--
824.5
81.7
166.3
3--
52.7
23RA
JAST
HAN
4.75
873.4
41.2
515
9.39
16.95
526.2
5--
62.39
2.61
1032
.77--
10.26
--46
0.06
15.25
99.61
24SI
KKIM
--5.8
9--
----
20.77
--17
.770.7
70.7
71.1
712
7.91
--13
.58--
3.16
25TA
MIL
NADU
7.02
777.6
26.9
642
9.13
40.98
632.8
820
.2942
9.39
1.89
302.0
1--
--1.5
714
4.78
7.65
183.1
326
TELA
NGAN
A3.7
420
7.81
----
----
----
----
----
----
----
27TR
IPUR
A10
.588
.9712
.265
.748.7
165
.871.3
514
.381.7
211
1.39
--30
.632.1
428
.70.6
4.428
UTTA
R PR
ADES
H0.2
753
3.27
12.12
989.7
14.0
776
8.12
15.16
1100
.186.8
473
9.96
4.22
541.4
47.1
834
2.64
411
0.18
29UT
TARA
KHAN
D--
342.9
5--
180.9
93.5
813
8.60.8
612
4.09
--7.9
9--
106.9
6--
28.9
4.62
27.33
30W
EST
BENG
AL98
.8787
7.15
17.67
334.9
79.2
828
1.62
24.99
315.5
99.3
143.7
87.6
411
2.75
9.23
118.4
87.6
366
.2631
TOTA
L36
8.24
2193
6.75
261.3
121
565.2
435
3.23
1251
5.17
392.2
388
09.3
289.2
783
99.44
126.2
747
65.53
139.0
239
85.49
63.7
1475
.88So
urce
: Ras
htriya
Kris
hi Vi
kas Y
ojana
- RK
VY
TABL
E E-
4.1:
ST
ATE
/UT
-WIS
E N
EW
AN
D O
NG
OIN
G P
RO
JEC
TS
APP
RO
VE
D U
ND
ER
RK
VY
IN
FISH
ER
IES
SEC
TOR
DU
RIN
G 2
007-
08 T
O 2
014-
15
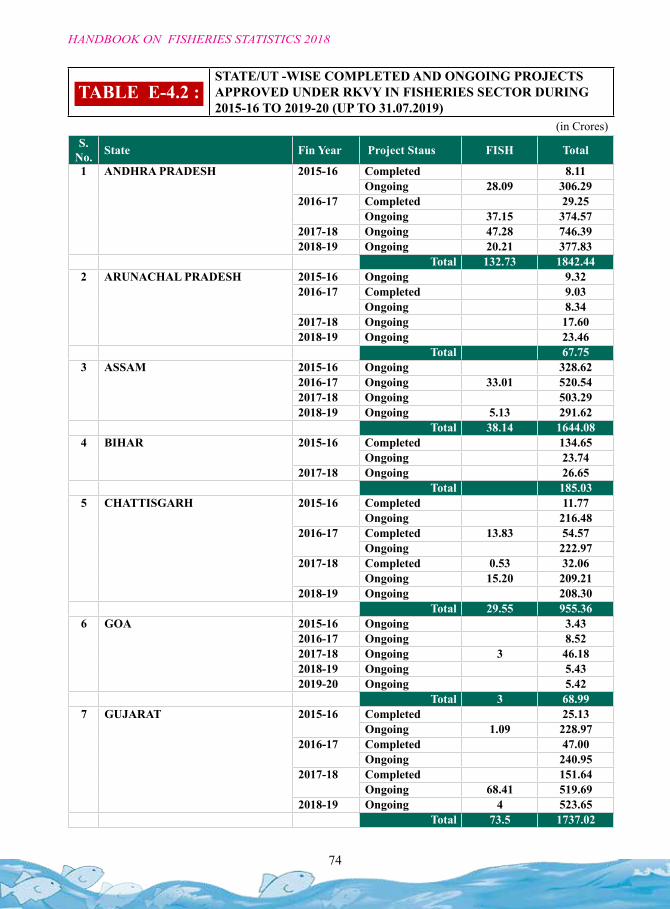
74
HANDBOOK ON FISHERIES STATISTICS 2018
(in Crores)S.
No. State Fin Year Project Staus FISH Total
1 ANDHRA PRADESH 2015-16 Completed 8.11Ongoing 28.09 306.29
2016-17 Completed 29.25Ongoing 37.15 374.57
2017-18 Ongoing 47.28 746.392018-19 Ongoing 20.21 377.83
Total 132.73 1842.442 ARUNACHAL PRADESH 2015-16 Ongoing 9.32
2016-17 Completed 9.03Ongoing 8.34
2017-18 Ongoing 17.602018-19 Ongoing 23.46
Total 67.753 ASSAM 2015-16 Ongoing 328.62
2016-17 Ongoing 33.01 520.542017-18 Ongoing 503.292018-19 Ongoing 5.13 291.62
Total 38.14 1644.084 BIHAR 2015-16 Completed 134.65
Ongoing 23.742017-18 Ongoing 26.65
Total 185.035 CHATTISGARH 2015-16 Completed 11.77
Ongoing 216.482016-17 Completed 13.83 54.57
Ongoing 222.972017-18 Completed 0.53 32.06
Ongoing 15.20 209.212018-19 Ongoing 208.30
Total 29.55 955.366 GOA 2015-16 Ongoing 3.43
2016-17 Ongoing 8.522017-18 Ongoing 3 46.182018-19 Ongoing 5.432019-20 Ongoing 5.42
Total 3 68.997 GUJARAT 2015-16 Completed 25.13
Ongoing 1.09 228.972016-17 Completed 47.00
Ongoing 240.952017-18 Completed 151.64
Ongoing 68.41 519.692018-19 Ongoing 4 523.65
Total 73.5 1737.02
TABLE E-4.2 : STATE/UT -WISE COMPLETED AND ONGOING PROJECTS APPROVED UNDER RKVY IN FISHERIES SECTOR DURING 2015-16 TO 2019-20 (UP TO 31.07.2019)
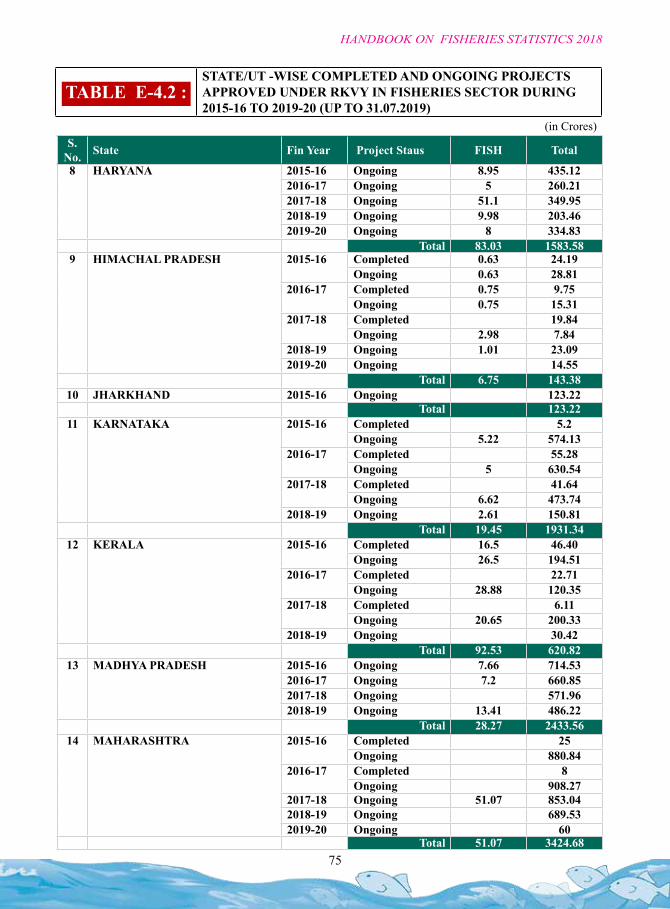
75
HANDBOOK ON FISHERIES STATISTICS 2018
(in Crores)S.
No. State Fin Year Project Staus FISH Total
8 HARYANA 2015-16 Ongoing 8.95 435.122016-17 Ongoing 5 260.212017-18 Ongoing 51.1 349.952018-19 Ongoing 9.98 203.462019-20 Ongoing 8 334.83
Total 83.03 1583.589 HIMACHAL PRADESH 2015-16 Completed 0.63 24.19
Ongoing 0.63 28.812016-17 Completed 0.75 9.75
Ongoing 0.75 15.312017-18 Completed 19.84
Ongoing 2.98 7.842018-19 Ongoing 1.01 23.092019-20 Ongoing 14.55
Total 6.75 143.3810 JHARKHAND 2015-16 Ongoing 123.22
Total 123.2211 KARNATAKA 2015-16 Completed 5.2
Ongoing 5.22 574.132016-17 Completed 55.28
Ongoing 5 630.542017-18 Completed 41.64
Ongoing 6.62 473.742018-19 Ongoing 2.61 150.81
Total 19.45 1931.3412 KERALA 2015-16 Completed 16.5 46.40
Ongoing 26.5 194.512016-17 Completed 22.71
Ongoing 28.88 120.352017-18 Completed 6.11
Ongoing 20.65 200.332018-19 Ongoing 30.42
Total 92.53 620.8213 MADHYA PRADESH 2015-16 Ongoing 7.66 714.53
2016-17 Ongoing 7.2 660.852017-18 Ongoing 571.962018-19 Ongoing 13.41 486.22
Total 28.27 2433.5614 MAHARASHTRA 2015-16 Completed 25
Ongoing 880.842016-17 Completed 8
Ongoing 908.272017-18 Ongoing 51.07 853.042018-19 Ongoing 689.532019-20 Ongoing 60
Total 51.07 3424.68
TABLE E-4.2 : STATE/UT -WISE COMPLETED AND ONGOING PROJECTS APPROVED UNDER RKVY IN FISHERIES SECTOR DURING 2015-16 TO 2019-20 (UP TO 31.07.2019)
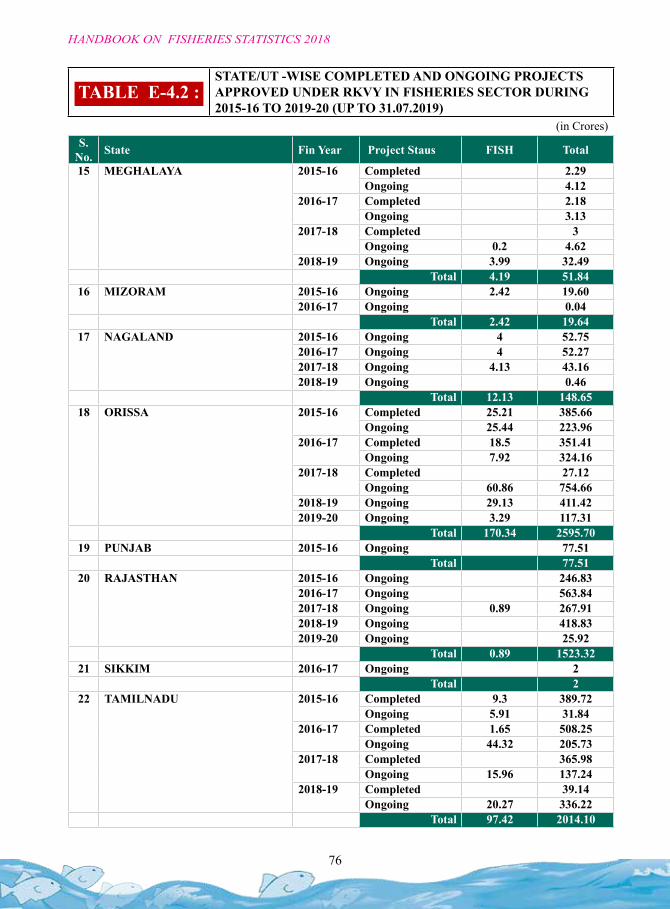
76
HANDBOOK ON FISHERIES STATISTICS 2018
(in Crores)S.
No. State Fin Year Project Staus FISH Total
15 MEGHALAYA 2015-16 Completed 2.29Ongoing 4.12
2016-17 Completed 2.18Ongoing 3.13
2017-18 Completed 3Ongoing 0.2 4.62
2018-19 Ongoing 3.99 32.49Total 4.19 51.84
16 MIZORAM 2015-16 Ongoing 2.42 19.602016-17 Ongoing 0.04
Total 2.42 19.6417 NAGALAND 2015-16 Ongoing 4 52.75
2016-17 Ongoing 4 52.272017-18 Ongoing 4.13 43.162018-19 Ongoing 0.46
Total 12.13 148.6518 ORISSA 2015-16 Completed 25.21 385.66
Ongoing 25.44 223.962016-17 Completed 18.5 351.41
Ongoing 7.92 324.162017-18 Completed 27.12
Ongoing 60.86 754.662018-19 Ongoing 29.13 411.422019-20 Ongoing 3.29 117.31
Total 170.34 2595.7019 PUNJAB 2015-16 Ongoing 77.51
Total 77.5120 RAJASTHAN 2015-16 Ongoing 246.83
2016-17 Ongoing 563.842017-18 Ongoing 0.89 267.912018-19 Ongoing 418.832019-20 Ongoing 25.92
Total 0.89 1523.3221 SIKKIM 2016-17 Ongoing 2
Total 222 TAMILNADU 2015-16 Completed 9.3 389.72
Ongoing 5.91 31.842016-17 Completed 1.65 508.25
Ongoing 44.32 205.732017-18 Completed 365.98
Ongoing 15.96 137.242018-19 Completed 39.14
Ongoing 20.27 336.22Total 97.42 2014.10
TABLE E-4.2 : STATE/UT -WISE COMPLETED AND ONGOING PROJECTS APPROVED UNDER RKVY IN FISHERIES SECTOR DURING 2015-16 TO 2019-20 (UP TO 31.07.2019)
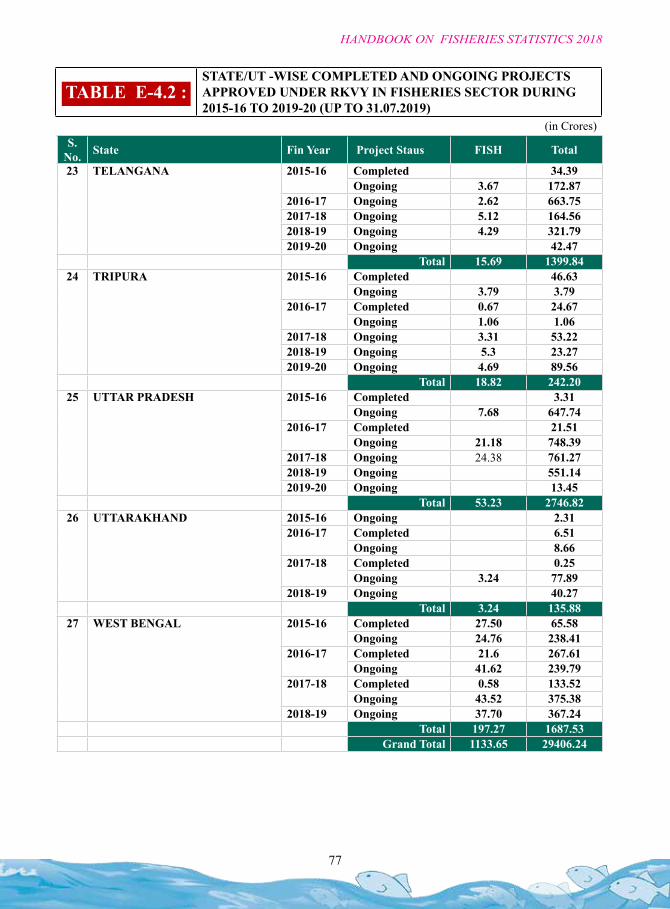
77
HANDBOOK ON FISHERIES STATISTICS 2018
(in Crores)S.
No. State Fin Year Project Staus FISH Total
23 TELANGANA 2015-16 Completed 34.39Ongoing 3.67 172.87
2016-17 Ongoing 2.62 663.752017-18 Ongoing 5.12 164.562018-19 Ongoing 4.29 321.792019-20 Ongoing 42.47
Total 15.69 1399.8424 TRIPURA 2015-16 Completed 46.63
Ongoing 3.79 3.792016-17 Completed 0.67 24.67
Ongoing 1.06 1.062017-18 Ongoing 3.31 53.222018-19 Ongoing 5.3 23.272019-20 Ongoing 4.69 89.56
Total 18.82 242.2025 UTTAR PRADESH 2015-16 Completed 3.31
Ongoing 7.68 647.742016-17 Completed 21.51
Ongoing 21.18 748.392017-18 Ongoing 24.38 761.272018-19 Ongoing 551.142019-20 Ongoing 13.45
Total 53.23 2746.8226 UTTARAKHAND 2015-16 Ongoing 2.31
2016-17 Completed 6.51Ongoing 8.66
2017-18 Completed 0.25Ongoing 3.24 77.89
2018-19 Ongoing 40.27Total 3.24 135.88
27 WEST BENGAL 2015-16 Completed 27.50 65.58Ongoing 24.76 238.41
2016-17 Completed 21.6 267.61Ongoing 41.62 239.79
2017-18 Completed 0.58 133.52Ongoing 43.52 375.38
2018-19 Ongoing 37.70 367.24Total 197.27 1687.53
Grand Total 1133.65 29406.24
TABLE E-4.2 : STATE/UT -WISE COMPLETED AND ONGOING PROJECTS APPROVED UNDER RKVY IN FISHERIES SECTOR DURING 2015-16 TO 2019-20 (UP TO 31.07.2019)
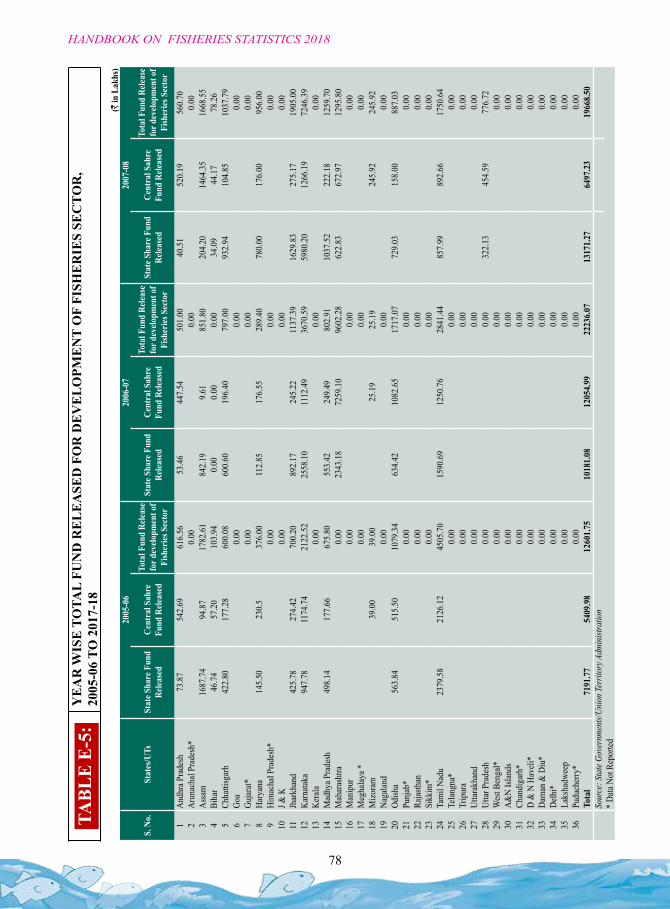
78
HANDBOOK ON FISHERIES STATISTICS 2018
TABL
E E-
5:
YE
AR
WIS
E T
OTA
L FU
ND
RE
LE
ASE
D F
OR
DE
VE
LO
PME
NT
OF
FISH
ER
IES
SEC
TOR
, 20
05-0
6 TO
201
7-18
(` in
Lak
hs)
S. N
o.St
ates
/UTs
2005
-06
2006
-07
2007
-08
Stat
e Sha
re F
und
Relea
sed
Cent
ral S
ahre
Fu
nd R
eleas
ed
Tota
l Fun
d Re
lease
fo
r dev
elopm
ent o
f Fi
sher
ies S
ecto
r
Stat
e Sha
re F
und
Relea
sed
Cent
ral S
ahre
Fu
nd R
eleas
ed
Tota
l Fun
d Re
lease
fo
r dev
elopm
ent o
f Fi
sher
ies S
ecto
r
Stat
e Sha
re F
und
Relea
sed
Cent
ral S
ahre
Fu
nd R
eleas
ed
Tota
l Fun
d Re
lease
fo
r dev
elopm
ent o
f Fi
sher
ies S
ecto
r
1An
dhra
Pra
desh
73.8
754
2.69
616.
5653
.46
447.
5450
1.00
40.5
152
0.19
560.
702
Arun
acha
l Pra
desh
*0.
000.
000.
003
Assa
m16
87.7
494
.87
1782
.61
842.
199.
6185
1.80
204.
2014
64.3
516
68.5
54
Biha
r46
.74
57.2
010
3.94
0.00
0.00
0.00
34.0
944
.17
78.2
65
Chha
ttisg
arh
422.
8017
7.28
600.
0860
0.60
196.
4079
7.00
932.
9410
4.85
1037
.79
6Go
a0.
000.
000.
007
Gujar
at*0.
000.
000.
008
Hary
ana
145.
5023
0.5
376.
0011
2.85
176.
5528
9.40
780.
0017
6.00
956.
009
Him
acha
l Pra
desh
*0.
000.
000.
0010
J & K
0.00
0.00
0.00
11Jh
arkh
and
425.
7827
4.42
700.
2089
2.17
245.
2211
37.3
916
29.8
327
5.17
1905
.00
12Ka
rnata
ka94
7.78
1174
.74
2122
.52
2558
.10
1112
.49
3670
.59
5980
.20
1266
.19
7246
.39
13Ke
rala
0.00
0.00
0.00
14M
adhy
a Pra
desh
498.
1417
7.66
675.
8055
3.42
249.
4980
2.91
1037
.52
222.
1812
59.7
015
Mah
aras
htra
0.00
2343
.18
7259
.10
9602
.28
622.
8367
2.97
1295
.80
16M
anip
ur0.
000.
000.
0017
Meg
halay
a *0.
000.
000.
0018
Mizo
ram
39.0
039
.00
25.1
925
.19
245.
9224
5.92
19Na
galan
d0.
000.
000.
0020
Odish
a56
3.84
515.
5010
79.3
463
4.42
1082
.65
1717
.07
729.
0315
8.00
887.
0321
Punj
ab*
0.00
0.00
0.00
22Ra
jasth
an0.
000.
000.
0023
Sikk
im*
0.00
0.00
0.00
24Ta
mil
Nadu
2379
.58
2126
.12
4505
.70
1590
.69
1250
.76
2841
.44
857.
9989
2.66
1750
.64
25Te
langn
a*0.
000.
000.
0026
Trip
ura
0.00
0.00
0.00
27Ut
tarak
hand
0.00
0.00
0.00
28Ut
tar P
rade
sh0.
000.
0032
2.13
454.
5977
6.72
29W
est B
enga
l*0.
000.
000.
0030
A&N
Islan
ds0.
000.
000.
0031
Chan
diga
rh*
0.
000.
000.
0032
D &
N H
aveli
*0.
000.
000.
0033
Dam
an &
Diu
*0.
000.
000.
0034
Delh
i*0.
000.
000.
0035
Laks
hadw
eep
0.00
0.00
0.00
36Pu
duch
erry
*0.
000.
000.
00
Tota
l 71
91.7
754
09.9
812
601.
7510
181.
0812
054.
9922
236.
0713
171.
2764
97.2
319
668.
50So
urce
: Sta
te Go
vern
ment
s/Uni
on Te
rrito
ry A
dmin
istra
tion
* Da
ta No
t Rep
orted
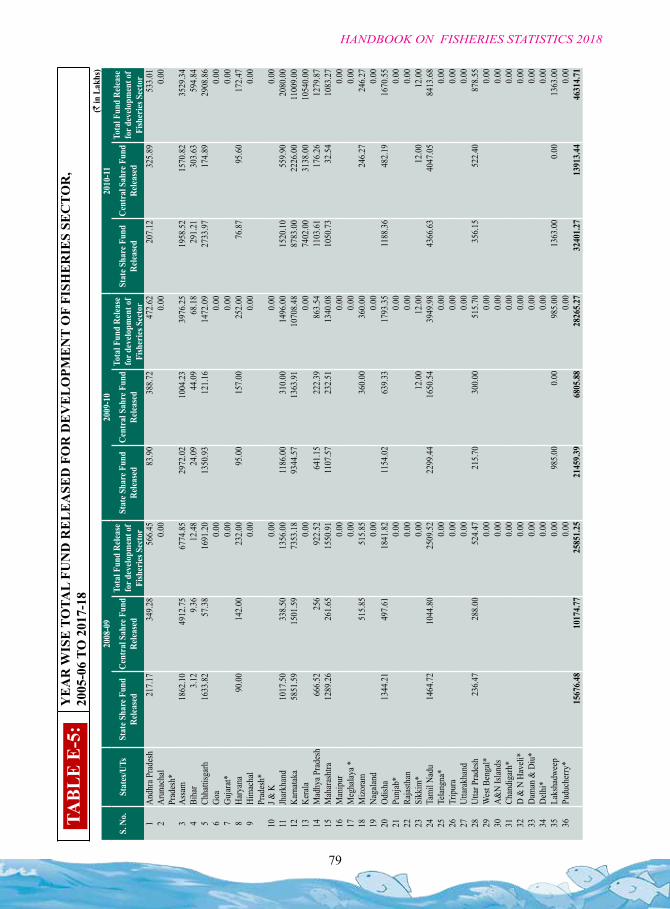
79
HANDBOOK ON FISHERIES STATISTICS 2018
(` in
Lak
hs)
S. N
o.St
ates
/UTs
2008
-09
2009
-10
2010
-11
Stat
e Sha
re F
und
Relea
sed
Cent
ral S
ahre
Fun
d Re
lease
d
Tota
l Fun
d Re
lease
fo
r dev
elopm
ent o
f Fi
sher
ies S
ecto
r
Stat
e Sha
re F
und
Relea
sed
Cent
ral S
ahre
Fun
d Re
lease
d
Tota
l Fun
d Re
lease
fo
r dev
elopm
ent o
f Fi
sher
ies S
ecto
r
Stat
e Sha
re F
und
Relea
sed
Cent
ral S
ahre
Fun
d Re
lease
d
Tota
l Fun
d Re
lease
fo
r dev
elopm
ent o
f Fi
sher
ies S
ecto
r1
Andh
ra P
rade
sh21
7.17
349.
2856
6.45
83.9
038
8.72
472.
6220
7.12
325.
8953
3.01
2Ar
unac
hal
Prad
esh*
0.00
0.00
0.00
3As
sam
1862
.10
4912
.75
6774
.85
2972
.02
1004
.23
3976
.25
1958
.52
1570
.82
3529
.34
4Bi
har
3.12
9.36
12.4
824
.09
44.0
968
.18
291.
2130
3.63
594.
845
Chha
ttisg
arh
1633
.82
57.3
816
91.2
013
50.9
312
1.16
1472
.09
2733
.97
174.
8929
08.8
66
Goa
0.00
0.00
0.00
7Gu
jarat*
0.00
0.00
0.00
8Ha
ryan
a90
.00
142.
0023
2.00
95.0
015
7.00
252.
0076
.87
95.6
017
2.47
9Hi
mac
hal
Prad
esh*
0.00
0.00
0.00
10J &
K0.
000.
000.
0011
Jhar
khan
d10
17.5
033
8.50
1356
.00
1186
.00
310.
0014
96.0
015
20.1
055
9.90
2080
.00
12Ka
rnata
ka58
51.5
915
01.5
973
53.1
893
44.5
713
63.9
110
708.
4887
83.0
022
26.0
011
009.
0013
Kera
la0.
000.
0074
02.0
031
38.0
010
540.
0014
Mad
hya P
rade
sh66
6.52
256
922.
5264
1.15
222.
3986
3.54
1103
.61
176.
2612
79.8
715
Mah
aras
htra
1289
.26
261.
6515
50.9
111
07.5
723
2.51
1340
.08
1050
.73
32.5
410
83.2
716
Man
ipur
0.00
0.00
0.00
17M
egha
laya *
0.00
0.00
0.00
18M
izora
m51
5.85
515.
8536
0.00
360.
0024
6.27
246.
2719
Naga
land
0.00
0.00
0.00
20Od
isha
1344
.21
497.
6118
41.8
211
54.0
263
9.33
1793
.35
1188
.36
482.
1916
70.5
521
Punj
ab*
0.00
0.00
0.00
22Ra
jasth
an0.
000.
000.
0023
Sikk
im*
0.00
12.0
012
.00
12.0
012
.00
24Ta
mil
Nadu
1464
.72
1044
.80
2509
.52
2299
.44
1650
.54
3949
.98
4366
.63
4047
.05
8413
.68
25Te
langn
a*0.
000.
000.
0026
Trip
ura
0.00
0.00
0.00
27Ut
tarak
hand
0.00
0.00
0.00
28Ut
tar P
rade
sh23
6.47
288.
0052
4.47
215.
7030
0.00
515.
7035
6.15
522.
4087
8.55
29W
est B
enga
l*0.
000.
000.
0030
A&N
Islan
ds0.
000.
000.
0031
Chan
diga
rh*
0.
000.
000.
0032
D &
N H
aveli
*0.
000.
000.
0033
Dam
an &
Diu
*0.
000.
000.
0034
Delh
i*0.
000.
000.
0035
Laks
hadw
eep
0.00
985.
000.
0098
5.00
1363
.00
0.00
1363
.00
36Pu
duch
erry
*0.
000.
000.
0015
676.
4810
174.
7725
851.
2521
459.
3968
05.8
828
265.
2732
401.
2713
913.
4446
314.
71
TABL
E E-
5:
YE
AR
WIS
E T
OTA
L FU
ND
RE
LE
ASE
D F
OR
DE
VE
LO
PME
NT
OF
FISH
ER
IES
SEC
TOR
, 20
05-0
6 TO
201
7-18
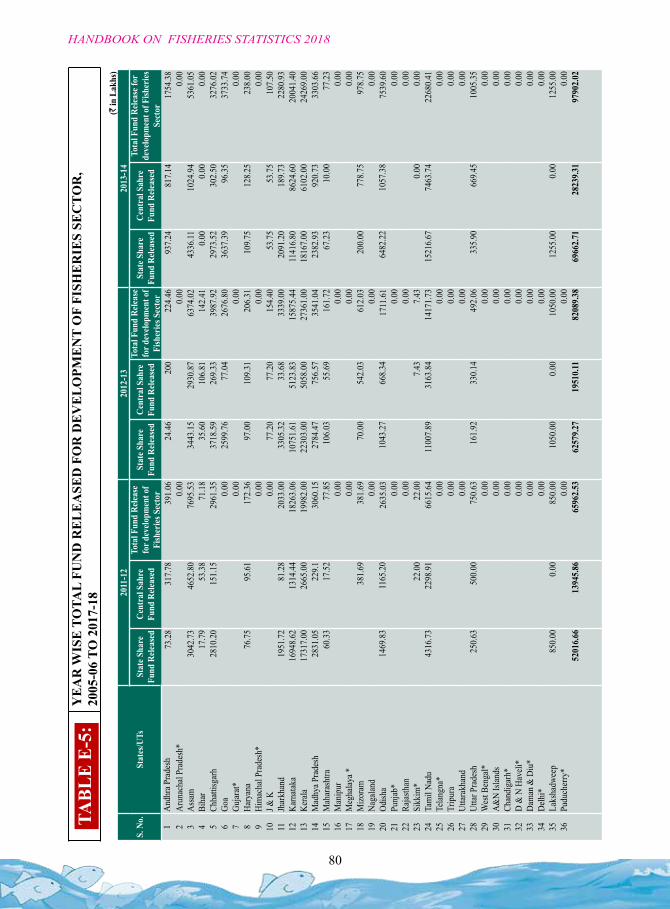
80
HANDBOOK ON FISHERIES STATISTICS 2018
(` in
Lak
hs)
S. N
o.St
ates
/UTs
2011
-12
2012
-13
2013
-14
Stat
e Sha
re
Fund
Rele
ased
Cent
ral S
ahre
Fu
nd R
eleas
ed
Tota
l Fun
d Re
lease
fo
r dev
elopm
ent o
f Fi
sher
ies S
ecto
r
Stat
e Sha
re
Fund
Rele
ased
Cent
ral S
ahre
Fu
nd R
eleas
ed
Tota
l Fun
d Re
lease
fo
r dev
elopm
ent o
f Fi
sher
ies S
ecto
r
Stat
e Sha
re
Fund
Rele
ased
Cent
ral S
ahre
Fu
nd R
eleas
ed
Tota
l Fun
d Re
lease
for
deve
lopm
ent o
f Fish
eries
Se
ctor
1An
dhra
Pra
desh
73.2
831
7.78
391.
0624
.46
200
224.
4693
7.24
817.
1417
54.3
82
Arun
acha
l Pra
desh
*0.
000.
000.
003
Assa
m30
42.7
346
52.8
076
95.5
334
43.1
529
30.8
763
74.0
243
36.11
1024
.94
5361
.05
4Bi
har
17.7
953
.38
71.1
835
.60
106.
8114
2.41
0.00
0.00
0.00
5Ch
hatti
sgar
h28
10.2
015
1.15
2961
.35
3718
.59
269.
3339
87.9
229
73.5
230
2.50
3276
.02
6Go
a0.
0025
99.7
677
.04
2676
.80
3637
.39
96.3
537
33.7
47
Gujar
at*0.
000.
000.
008
Hary
ana
76.7
595
.61
172.
3697
.00
109.
3120
6.31
109.
7512
8.25
238.
009
Him
acha
l Pra
desh
*0.
000.
000.
0010
J & K
0.00
77.2
077
.20
154.
4053
.75
53.7
510
7.50
11Jh
arkh
and
1951
.72
81.2
820
33.0
033
05.3
233
.68
3339
.00
2091
.20
189.
7322
80.9
312
Karn
ataka
1694
8.62
1314
.44
1826
3.06
1075
1.61
5123
.83
1587
5.44
1141
6.80
8624
.60
2004
1.40
13Ke
rala
1731
7.00
2665
.00
1998
2.00
2230
3.00
5058
.00
2736
1.00
1816
7.00
6102
.00
2426
9.00
14M
adhy
a Pra
desh
2831
.05
229.
130
60.1
527
84.4
775
6.57
3541
.04
2382
.93
920.
7333
03.6
615
Mah
aras
htra
60.3
317
.52
77.8
510
6.03
55.6
916
1.72
67.2
310
.00
77.2
316
Man
ipur
0.00
0.00
0.00
17M
egha
laya *
0.00
0.00
0.00
18M
izora
m38
1.69
381.
6970
.00
542.
0361
2.03
200.
0077
8.75
978.
7519
Naga
land
0.00
0.00
0.00
20Od
isha
1469
.83
1165
.20
2635
.03
1043
.27
668.
3417
11.6
164
82.2
210
57.3
875
39.6
021
Punj
ab*
0.00
0.00
0.00
22Ra
jasth
an0.
000.
000.
0023
Sikk
im*
22.0
022
.00
7.43
7.43
0.00
0.00
24Ta
mil
Nadu
4316
.73
2298
.91
6615
.64
1100
7.89
3163
.84
1417
1.73
1521
6.67
7463
.74
2268
0.41
25Te
langn
a*0.
000.
000.
0026
Trip
ura
0.00
0.00
0.00
27Ut
tarak
hand
0.00
0.00
0.00
28Ut
tar P
rade
sh25
0.63
500.
0075
0.63
161.
9233
0.14
492.
0633
5.90
669.
4510
05.3
529
Wes
t Ben
gal*
0.00
0.00
0.00
30A&
N Isl
ands
0.00
0.00
0.00
31Ch
andi
garh
*
0.00
0.00
0.00
32D
& N
Hav
eli*
0.00
0.00
0.00
33Da
man
& D
iu*
0.00
0.00
0.00
34De
lhi*
0.00
0.00
0.00
35La
ksha
dwee
p85
0.00
0.00
850.
0010
50.0
00.
0010
50.0
012
55.0
00.
0012
55.0
036
Pudu
cher
ry*
0.00
0.00
0.00
5201
6.66
1394
5.86
6596
2.53
6257
9.27
1951
0.11
8208
9.38
6966
2.71
2823
9.31
9790
2.02
TABL
E E-
5:
YE
AR
WIS
E T
OTA
L FU
ND
RE
LE
ASE
D F
OR
DE
VE
LO
PME
NT
OF
FISH
ER
IES
SEC
TOR
, 20
05-0
6 TO
201
7-18
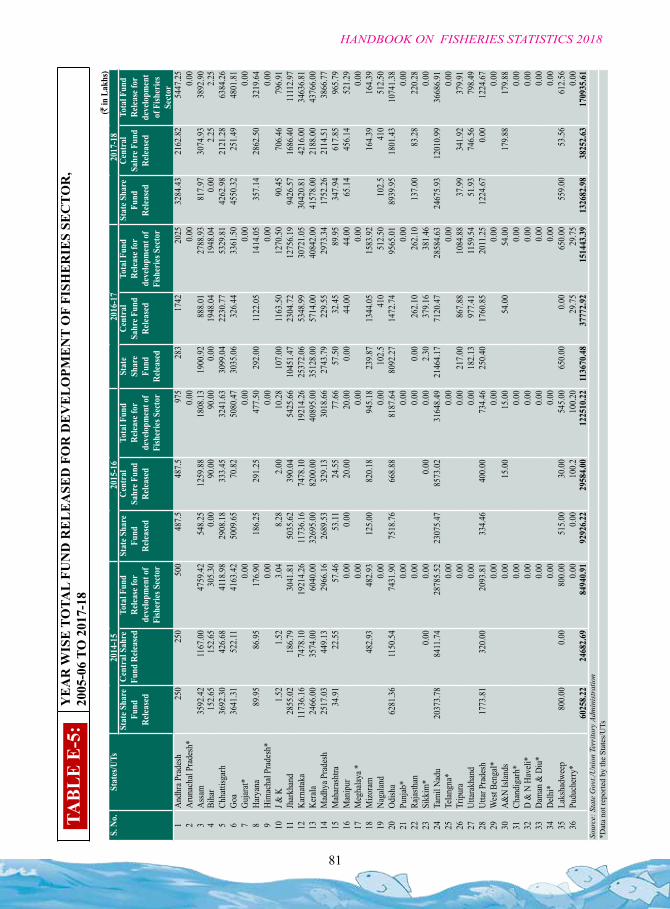
81
HANDBOOK ON FISHERIES STATISTICS 2018
TABL
E E-
5:
YE
AR
WIS
E T
OTA
L FU
ND
RE
LE
ASE
D F
OR
DE
VE
LO
PME
NT
OF
FISH
ER
IES
SEC
TOR
, 20
05-0
6 TO
201
7-18
(` in
Lak
hs)
S. N
o.St
ates
/UTs
2014
-15
2015
-16
2016
-17
2017
-18
Stat
e Sha
re
Fund
Re
lease
d
Cent
ral S
ahre
Fu
nd R
eleas
edTo
tal F
und
Relea
se fo
r de
velo
pmen
t of
Fish
eries
Sec
tor
Stat
e Sha
re
Fund
Re
lease
d
Cent
ral
Sahr
e Fun
d Re
lease
d
Tota
l Fun
d Re
lease
for
deve
lopm
ent o
f Fi
sher
ies S
ecto
r
Stat
e Sh
are
Fund
Re
lease
d
Cent
ral
Sahr
e Fun
d Re
lease
d
Tota
l Fun
d Re
lease
for
deve
lopm
ent o
f Fi
sher
ies S
ecto
r
Stat
e Sha
re
Fund
Re
lease
d
Cent
ral
Sahr
e Fun
d Re
lease
d
Tota
l Fun
d Re
lease
for
deve
lopm
ent
of F
isher
ies
Sect
or1
Andh
ra P
rade
sh25
025
050
048
7.5
487.
597
528
317
4220
2532
84.4
321
62.8
254
47.2
52
Arun
acha
l Pra
desh
*0.
000.
000.
003
Assa
m35
92.4
211
67.0
047
59.4
254
8.25
1259
.88
1808
.13
1900
.92
888.
0127
88.9
381
7.97
3074
.93
3892
.90
4Bi
har
152.
6515
2.65
305.
300.
0090
.00
90.0
00.
0019
48.0
419
48.0
40.
002.
252.
255
Chha
ttisg
arh
3692
.30
426.
6841
18.9
829
08.1
833
3.45
3241
.63
3099
.04
2230
.77
5329
.81
4262
.98
2121
.28
6384
.26
6Go
a36
41.3
152
2.11
4163
.42
5009
.65
70.8
250
80.4
730
35.0
632
6.44
3361
.50
4550
.32
251.
4948
01.8
17
Gujar
at*0.
000.
000.
000.
008
Hary
ana
89.9
586
.95
176.
9018
6.25
291.
2547
7.50
292.
0011
22.0
514
14.0
535
7.14
2862
.50
3219
.64
9Hi
mac
hal P
rade
sh*
0.00
0.00
0.00
0.00
10J &
K1.
521.
523.
048.
282.
0010
.28
107.
0011
63.5
012
70.5
090
.45
706.
4679
6.91
11Jh
arkh
and
2855
.02
186.
7930
41.8
150
35.6
239
0.04
5425
.66
1045
1.47
2304
.72
1275
6.19
9426
.57
1686
.40
1111
2.97
12Ka
rnata
ka11
736.
1674
78.1
019
214.
2611
736.
1674
78.1
019
214.
2625
372.
0653
48.9
930
721.
0530
420.
8142
16.0
034
636.
8113
Kera
la24
66.0
035
74.0
060
40.0
032
695.
0082
00.0
040
895.
0035
128.
0057
14.0
040
842.
0041
578.
0021
88.0
043
766.
0014
Mad
hya P
rade
sh25
17.0
344
9.13
2966
.16
2689
.53
329.
1330
18.6
627
43.7
922
9.55
2973
.34
1752
.26
2114
.51
3866
.77
15M
ahar
asht
ra34
.91
22.5
557
.46
53.11
24.5
577
.66
57.5
032
.45
89.9
534
7.94
617.
8596
5.79
16M
anip
ur0.
000.
0020
.00
20.0
00.
0044
.00
44.0
065
.14
456.
1452
1.29
17M
egha
laya *
0.00
0.00
0.00
0.00
18M
izora
m48
2.93
482.
9312
5.00
820.
1894
5.18
239.
8713
44.0
515
83.9
216
4.39
164.
3919
Naga
land
0.00
0.00
102.
541
051
2.50
102.
541
051
2.50
20Od
isha
6281
.36
1150
.54
7431
.90
7518
.76
668.
8881
87.6
480
92.2
714
72.7
495
65.0
189
39.9
518
01.4
310
741.
3821
Punj
ab*
0.00
0.00
0.00
0.00
22Ra
jasth
an0.
000.
000.
0026
2.10
262.
1013
7.00
83.2
822
0.28
23Si
kkim
*0.
000.
000.
000.
002.
3037
9.16
381.
460.
0024
Tam
il Na
du20
373.
7884
11.7
428
785.
5223
075.
4785
73.0
231
648.
4921
464.
1771
20.4
728
584.
6324
675.
9312
010.
9936
686.
9125
Telan
gna*
0.00
0.00
0.00
0.00
26Tr
ipur
a0.
000.
0021
7.00
867.
8810
84.8
837
.99
341.
9237
9.91
27Ut
tarak
hand
0.00
0.00
182.
1397
7.41
1159
.54
51.9
374
6.56
798.
4928
Uttar
Pra
desh
1773
.81
320.
0020
93.8
133
4.46
400.
0073
4.46
250.
4017
60.8
520
11.2
512
24.6
70.
0012
24.6
729
Wes
t Ben
gal*
0.00
0.00
0.00
0.00
30A&
N Isl
ands
0.00
15.0
015
.00
54.0
054
.00
179.
8817
9.88
31Ch
andi
garh
*
0.00
0.00
0.00
0.00
32D
& N
Hav
eli*
0.00
0.00
0.00
0.00
33Da
man
& D
iu*
0.00
0.00
0.00
0.00
34De
lhi*
0.00
0.00
0.00
0.00
35La
ksha
dwee
p80
0.00
0.00
800.
0051
5.00
30.0
054
5.00
650.
000.
0065
0.00
559.
0053
.56
612.
5636
Pudu
cher
ry*
0.00
0.00
100.
210
0.20
29.7
529
.75
0.00
6025
8.22
2468
2.69
8494
0.91
9292
6.22
2958
4.00
1225
10.2
211
3670
.48
3777
2.92
1514
43.3
913
2682
.98
3825
2.63
1709
35.6
1So
urce
: Sta
te G
ovt./
Uni
on T
erri
tory
Adm
inis
trat
ion
*Dat
a no
t rep
orte
d by
the
Stat
es/U
Ts
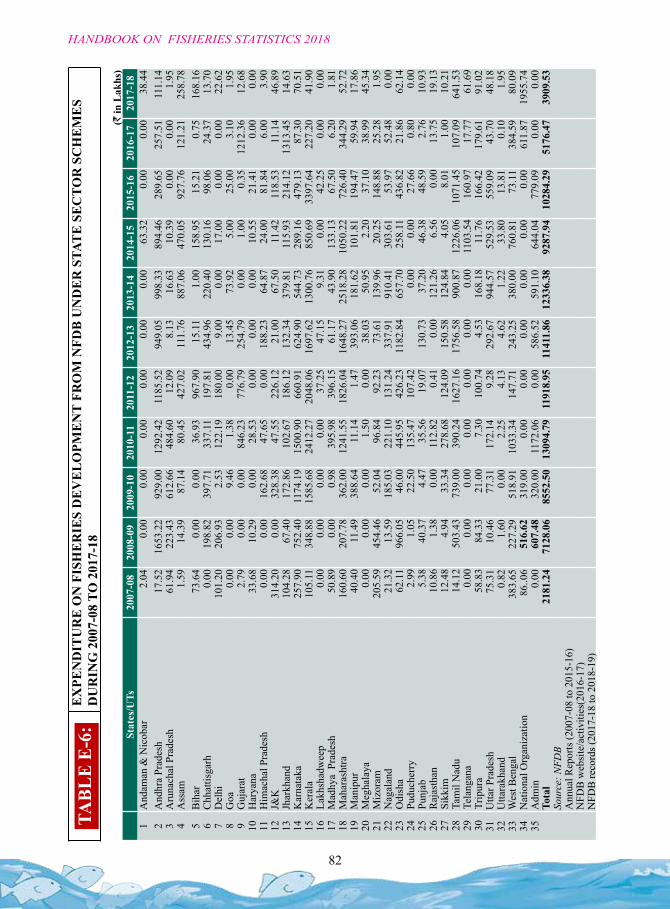
82
HANDBOOK ON FISHERIES STATISTICS 2018
(` in
Lak
hs)
Stat
es/U
Ts20
07-0
820
08-0
920
09-1
020
10-1
120
11-1
220
12-1
320
13-1
420
14-1
520
15-1
620
16-1
720
17-1
81
And
aman
& N
icob
ar2.
040.
000.
000.
000.
000.
000.
0063
.32
0.00
0.00
38.4
42
And
hra
Prad
esh
17.5
216
53.2
292
9.00
1292
.42
1185
.52
949.
0599
8.33
894.
4628
9.65
257.
5111
1.14
3A
runa
chal
Pra
desh
61.9
422
3.43
612.
6648
4.60
12.0
98.
1316
.63
10.3
90.
000.
001.
954
Ass
am1.
5914
.39
87.1
480
.45
427.
0211
1.76
887.
0647
0.05
927.
7612
1.21
258.
785
Bih
ar73
.64
0.00
0.00
36.9
396
7.90
15.1
11.
0015
8.95
15.2
10.
7516
8.16
6C
hhat
tisga
rh0.
0019
8.82
397.
7133
7.11
197.
8143
4.96
220.
4013
0.16
98.0
624
.37
13.7
07
Del
hi10
1.20
206.
932.
5312
2.19
180.
009.
000.
0017
.00
0.00
0.00
22.6
28
Goa
0.00
0.00
9.46
1.38
0.00
13.4
573
.92
5.00
25.0
03.
101.
959
Guj
arat
2.79
0.00
0.00
846.
2377
6.79
254.
790.
001.
000.
3512
12.3
612
.68
10H
arya
na33
.68
10.2
90.
0028
.53
0.00
0.00
0.00
10.5
521
.41
0.00
0.00
11H
imac
hal P
rade
sh0.
000.
0016
2.68
47.6
50.
0018
8.23
64.8
724
.00
81.8
46.
003.
9012
J&K
314.
200.
0032
8.38
47.5
522
6.12
21.0
067
.50
11.4
211
8.53
11.1
446
.89
13Jh
arkh
and
104.
2867
.40
172.
8610
2.67
186.
1213
2.34
379.
8111
5.93
214.
1213
13.4
514
.63
14K
arna
taka
257.
9075
2.40
1174
.19
1500
.90
660.
9162
4.90
544.
7328
9.16
479.
1387
.30
70.5
115
Ker
ala
105.
1134
8.88
1585
.68
2412
.27
2048
.06
1697
.62
1300
.76
850.
6933
97.6
422
7.20
41.9
016
Lakh
shad
wee
p0.
000.
000.
000.
0037
.25
47.1
59.
310.
0042
.25
0.00
0.00
17M
adhy
a P
rade
sh50
.89
0.00
0.98
395.
9839
6.15
61.1
743
.90
133.
1367
.50
6.20
1.81
18M
ahar
asht
ra16
0.60
207.
7836
2.00
1241
.55
1826
.04
1648
.27
2518
.28
1050
.22
726.
4034
4.29
52.7
219
Man
ipur
40.4
011
.49
388.
6411
.14
1.47
393.
0618
1.62
101.
8119
4.47
59.9
417
.86
20M
egha
laya
0.00
0.00
0.00
1.50
0.00
38.0
350
.95
2.20
37.1
038
.99
45.3
421
Miz
oram
205.
5945
4.46
52.0
496
.84
92.2
373
.61
139.
9620
.25
148.
8825
.28
1.95
22N
agal
and
21.3
213
.59
185.
0322
1.10
131.
2433
7.91
910.
4130
3.61
53.9
752
.48
0.00
23O
dish
a62
.11
966.
0546
.00
445.
9542
6.23
1182
.84
657.
7025
8.11
436.
8221
.86
62.1
424
Pudu
cher
ry2.
991.
0522
.50
135.
4710
7.42
0.00
0.00
27.6
60.
800.
0025
Punj
ab5.
3840
.37
4.47
35.5
619
.07
130.
7337
.20
46.3
848
.59
2.76
10.9
326
Raj
asth
an10
.86
1.38
0.00
112.
820.
410.
0012
1.26
6.56
0.00
13.7
519
.13
27Si
kkim
12.4
84.
9433
.34
278.
6812
4.09
150.
5812
4.84
4.05
8.01
1.00
10.2
128
Tam
il N
adu
14.1
250
3.43
739.
0039
0.24
1627
.16
1756
.58
900.
8712
26.0
610
71.4
510
7.09
641.
5329
Tela
ngan
a0.
000.
000.
000.
000.
000.
000.
0011
03.5
416
0.97
17.7
761
.69
30Tr
ipur
a58
.83
84.3
321
.00
7.30
100.
744.
5316
8.18
11.7
616
6.42
179.
6191
.02
31U
ttar P
rade
sh75
.31
10.4
677
.31
172.
149.
2829
2.67
944.
5752
9.53
559.
0943
.70
48.1
832
Utta
rakh
and
0.82
1.60
0.00
2.25
4.13
4.62
1.22
33.8
013
.81
0.10
1.95
33W
est B
enga
l38
3.65
227.
2951
8.91
1033
.34
147.
7124
3.25
380.
0076
0.81
73.1
138
4.59
80.0
934
Nat
iona
l Org
aniz
atio
n86
..06
516.
6231
9.00
0.00
0.00
0.00
0.00
0.00
0.00
611.
8719
55.7
435
Adm
in
0.00
607.
4832
0.00
1172
.06
0.00
586.
5259
1.10
644.
0477
9.09
0.00
0.00
Tota
l21
81.2
471
28.0
685
52.5
013
094.
7911
918.
9511
411.
8612
336.
3892
87.9
410
284.
2951
76.4
739
09.5
3So
urce
: NFD
BA
nnua
l Rep
orts
(200
7-08
to 2
015-
16)
NFD
B w
ebsi
te/a
ctiv
ities
(201
6-17
)N
FDB
reco
rds (
2017
-18
to 2
018-
19)
TABL
E E-
6:
EX
PEN
DIT
UR
E O
N F
ISH
ER
IES
DE
VE
LO
PME
NT
FRO
M N
FDB
UN
DE
R S
TAT
E S
EC
TOR
SC
HE
ME
S D
UR
ING
200
7-08
TO
201
7-18
SECTION : F
FISHERIESRESOURCES
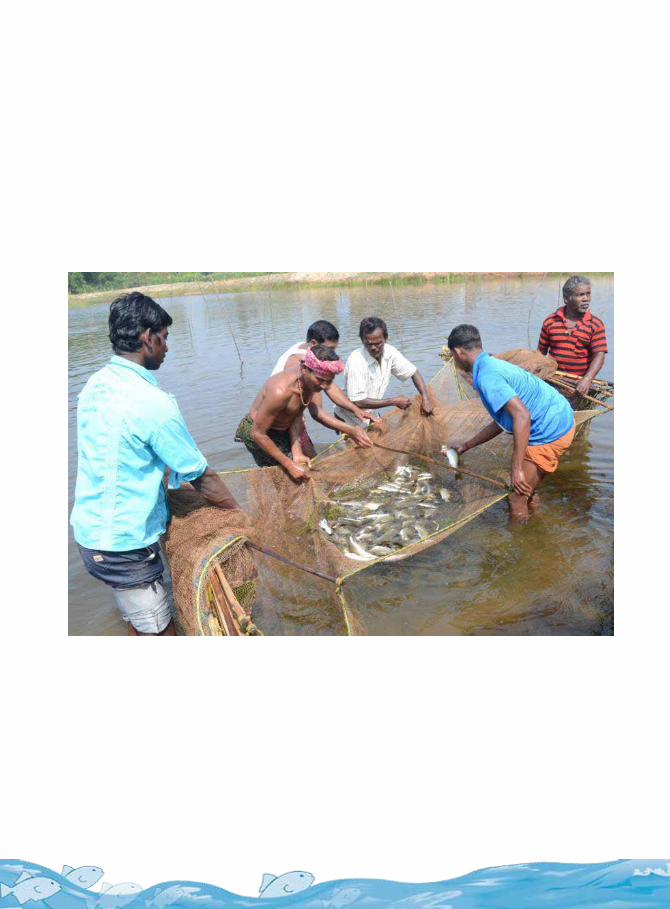
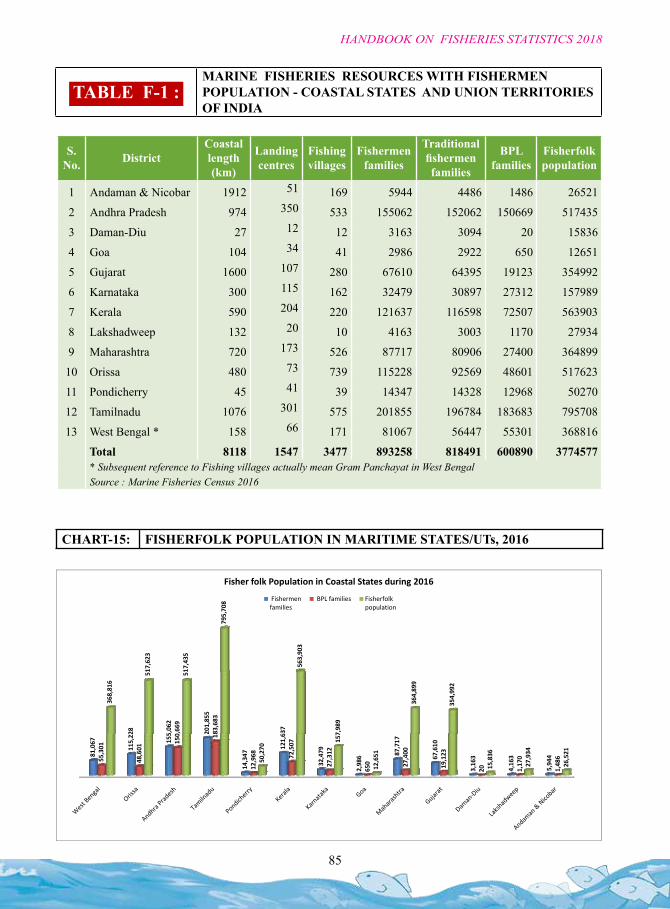
85
HANDBOOK ON FISHERIES STATISTICS 2018
S. No. District
Coastal length (km)
Landing centres
Fishing villages
Fishermen families
Traditional fishermen families
BPL families
Fisherfolk population
1 Andaman & Nicobar 1912 51 169 5944 4486 1486 26521
2 Andhra Pradesh 974 350 533 155062 152062 150669 517435
3 Daman-Diu 27 12 12 3163 3094 20 15836
4 Goa 104 34 41 2986 2922 650 12651
5 Gujarat 1600 107 280 67610 64395 19123 354992
6 Karnataka 300 115 162 32479 30897 27312 157989
7 Kerala 590 204 220 121637 116598 72507 563903
8 Lakshadweep 132 20 10 4163 3003 1170 27934
9 Maharashtra 720 173 526 87717 80906 27400 364899
10 Orissa 480 73 739 115228 92569 48601 517623
11 Pondicherry 45 41 39 14347 14328 12968 50270
12 Tamilnadu 1076 301 575 201855 196784 183683 795708
13 West Bengal * 158 66 171 81067 56447 55301 368816
Total 8118 1547 3477 893258 818491 600890 3774577* Subsequent reference to Fishing villages actually mean Gram Panchayat in West BengalSource : Marine Fisheries Census 2016
TABLE F-1 : MARINE FISHERIES RESOURCES WITH FISHERMEN POPULATION - COASTAL STATES AND UNION TERRITORIES OF INDIA
CHART‐16: FISHERFOLK POPULATION IN MARITIME STATES/UTs, 2016
08
Fisher folk Population in Coastal States during 2016
Fishermen families
BPL families Fisherfolk population
17,623
17,435
795,7
563,903
families population
28 5,062
201,855
637
0,669
83,683
368,816
5 1 51
7,989
364,899
354,992
81,067
115,2 2
155 2
14,347
121,6
32,479
2,986 87
,717
67,610
3,163
4,163
5,94455,301
48,601
150 18
12,968 72,507
27,312
650 27,400
19,123
20 1,170
1,48650,270
157
12,651
15,836
27,934
26,521
CHART-15: FISHERFOLK POPULATION IN MARITIME STATES/UTs, 2016
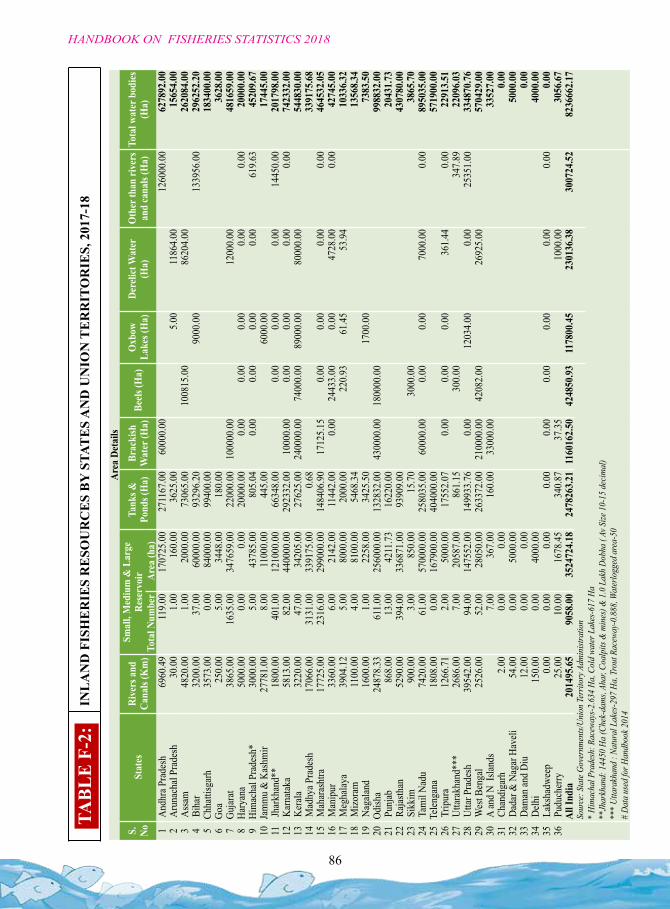
86
HANDBOOK ON FISHERIES STATISTICS 2018
TABL
E F-
2:
INL
AN
D F
ISH
ER
IES
RE
SOU
RC
ES
BY
STA
TE
S A
ND
UN
ION
TE
RR
ITO
RIE
S, 2
017-
18
Area
Det
ails
S.
NoSt
ates
Rive
rs a
nd
Cana
ls (K
m)
Smal
l, M
ediu
m &
Lar
ge
Rese
rvoi
rTa
nks &
Po
nds (
Ha)
Brac
kish
W
ater
(Ha)
Beels
(Ha)
Oxb
ow
Lake
s (H
a)De
relic
t Wat
er
(Ha)
Oth
er th
an ri
vers
an
d ca
nals
(Ha)
Tota
l wat
er b
odies
(H
a)To
tal N
umbe
rAr
ea (h
a)1
And
hra P
rade
sh69
60.4
911
9.00
1707
25.0
027
1167
.00
6000
0.00
1260
00.0
062
7892
.00
2 A
runa
chal
Prad
esh
30.0
01.
0016
0.00
3625
.00
5.00
1186
4.00
1565
4.00
3 A
ssam
4820
.00
1.00
2000
.00
7306
5.00
1008
15.0
086
204.
0026
2084
.00
4 B
ihar
3200
.00
37.0
060
000.
0093
296.
2090
00.0
013
3956
.00
2962
52.2
05
Chha
ttisg
arh
3573
.00
0.00
8400
0.00
9940
0.00
1834
00.0
06
Goa
250.
005.
0034
48.0
018
0.00
3628
.00
7Gu
jarat
3865
.00
1635
.00
3476
59.0
022
000.
0010
0000
.00
1200
0.00
4816
59.0
08
Hary
ana
5000
.00
0.00
0.00
2000
0.00
0.00
0.00
0.00
0.00
0.00
2000
0.00
9Hi
mac
hal P
rade
sh*
3000
.00
5.00
4378
5.00
805.
040.
000.
000.
000.
0061
9.63
4520
9.67
10Ja
mm
u &
Kas
hmir
2778
1.00
8.00
1100
0.00
445.
0060
00.0
017
445.
0011
Jhar
khan
d**
1800
.00
401.
0012
1000
.00
6634
8.00
0.00
0.00
0.00
1445
0.00
2017
98.0
012
Kar
natak
a58
13.0
082
.00
4400
00.0
029
2332
.00
1000
0.00
0.00
0.00
0.00
0.00
7423
32.0
013
Ker
ala32
20.0
047
.00
3420
5.00
2762
5.00
2400
00.0
074
000.
0089
000.
0080
000.
0054
4830
.00
14 M
adhy
a Pra
desh
1706
6.00
3131
.00
3391
75.0
00.
6833
9175
.68
15 M
ahar
asht
ra17
725.
0023
16.0
029
9000
.00
1484
06.9
017
125.
150.
000.
000.
000.
0046
4532
.05
16 M
anip
ur33
60.0
06.
0021
42.0
011
442.
000.
0024
433.
000.
0047
28.0
00.
0042
745.
0017
Meg
halay
a39
04.1
25.
0080
00.0
020
00.0
022
0.93
61.4
553
.94
1033
6.32
18 M
izora
m11
00.0
04.
0081
00.0
054
68.3
413
568.
3419
Nag
aland
1600
.00
1.00
2258
.00
3425
.50
1700
.00
7383
.50
20Od
isha
2487
8.33
611.
0025
6000
.00
1328
32.0
043
0000
.00
1800
00.0
099
8832
.00
21 P
unjab
868.
0013
.00
4211
.73
1622
0.00
2043
1.73
22 R
ajasth
an52
90.0
039
4.00
3368
71.0
093
909.
0043
0780
.00
23 S
ikki
m90
0.00
3.00
850.
0015
.70
3000
.00
3865
.70
24 T
amil
Nadu
7420
.00
61.0
057
0000
.00
2580
35.0
060
000.
000.
000.
0070
00.0
00.
0089
5035
.00
25Te
lenga
na18
08.0
00.
0016
7900
.00
4040
00.0
057
1900
.00
26 T
ripur
a12
66.7
12.
0050
00.0
017
552.
070.
000.
000.
0036
1.44
0.00
2291
3.51
27 U
ttara
khan
d***
2686
.00
7.00
2058
7.00
861.
1530
0.00
347.
8922
096.
0328
Utta
r Pra
desh
3954
2.00
94.0
014
7552
.00
1499
33.7
60.
0012
034.
000.
0025
351.
0033
4870
.76
29 W
est B
enga
l25
26.0
052
.00
2805
0.00
2633
72.0
021
0000
.00
4208
2.00
2692
5.00
5704
29.0
030
A an
d N
Islan
ds7.
0036
7.00
160.
0033
000.
0033
527.
0031
Cha
ndig
arh
2.00
0.00
0.00
0.00
32 D
adar
& N
agar
Hav
eli54
.00
0.00
5000
.00
5000
.00
33 D
aman
and
Diu
12.0
00.
000.
000.
0034
Delh
i15
0.00
0.00
4000
.00
4000
.00
35 L
aksh
adwe
ep0.
000.
000.
000.
000.
000.
000.
000.
000.
000.
0036
Pud
uche
rry25
.00
10.0
016
78.4
534
0.87
37.3
510
00.0
030
56.6
7Al
l Ind
ia20
1495
.65
9058
.00
3524
724.
1824
7826
3.21
1160
162.
5042
4850
.93
1178
00.4
523
0136
.38
3007
24.5
282
3666
2.17
Sour
ce: S
tate
Gove
rnme
nts/U
nion
Terr
itory
Adm
inist
ratio
n*
Hima
chal
Pra
desh
: Rac
eway
s-2.6
34 H
a, C
old
water
Lak
es-6
17 H
a**
Jhar
khan
d: 1
4450
Ha
(Che
k-da
ms, A
har,
Coal
pits
& m
ines
) & 1
.0 L
akh
Dobh
a ( A
v Size
10-
15 d
ecim
al)
***
Utta
rakh
and
: Nat
ural
Lak
es-2
97 H
a, T
rout
Rac
eway
-0.8
88, W
ater
logg
ed a
rea-
50#
Data
use
d fo
r Han
dboo
k 201
4
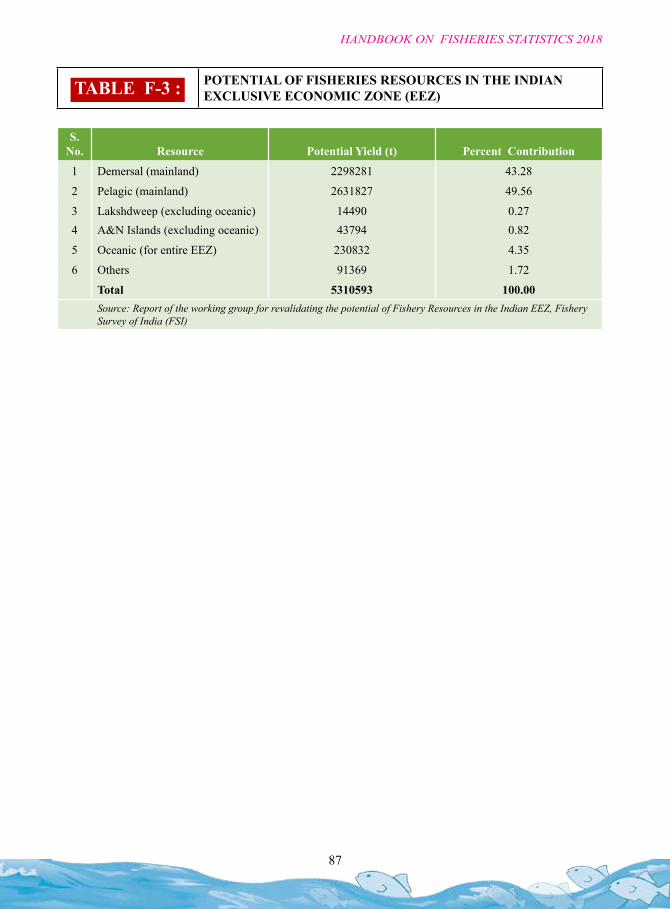
87
HANDBOOK ON FISHERIES STATISTICS 2018
S. No. Resource Potential Yield (t) Percent Contribution
1 Demersal (mainland) 2298281 43.28
2 Pelagic (mainland) 2631827 49.56
3 Lakshdweep (excluding oceanic) 14490 0.274 A&N Islands (excluding oceanic) 43794 0.82
5 Oceanic (for entire EEZ) 230832 4.35
6 Others 91369 1.72
Total 5310593 100.00Source: Report of the working group for revalidating the potential of Fishery Resources in the Indian EEZ, Fishery Survey of India (FSI)
TABLE F-3 : POTENTIAL OF FISHERIES RESOURCES IN THE INDIAN EXCLUSIVE ECONOMIC ZONE (EEZ)

89
HANDBOOK ON FISHERIES STATISTICS 2018
SECTION : G
INTERNATIONALSCENARIO
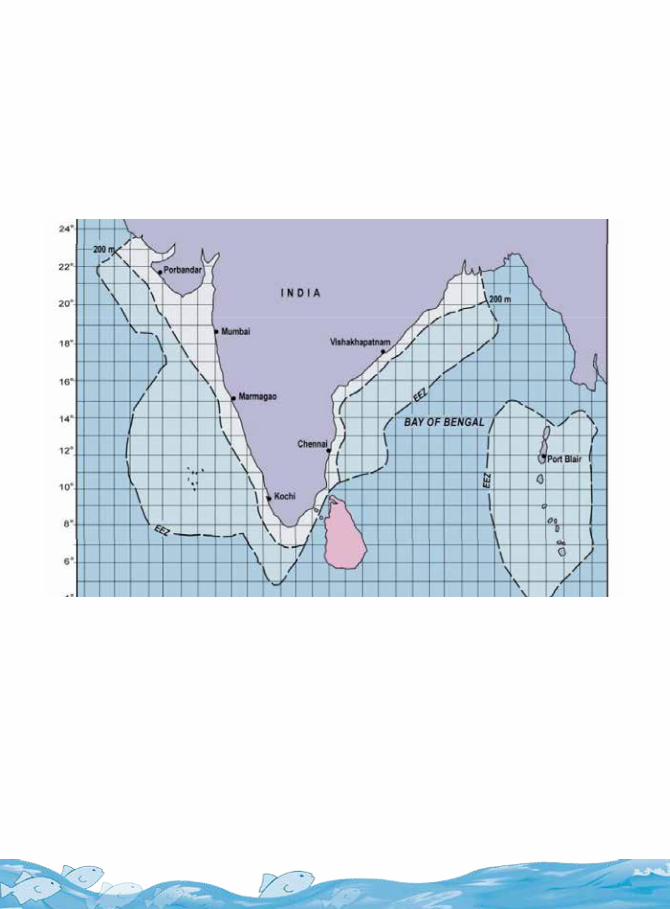
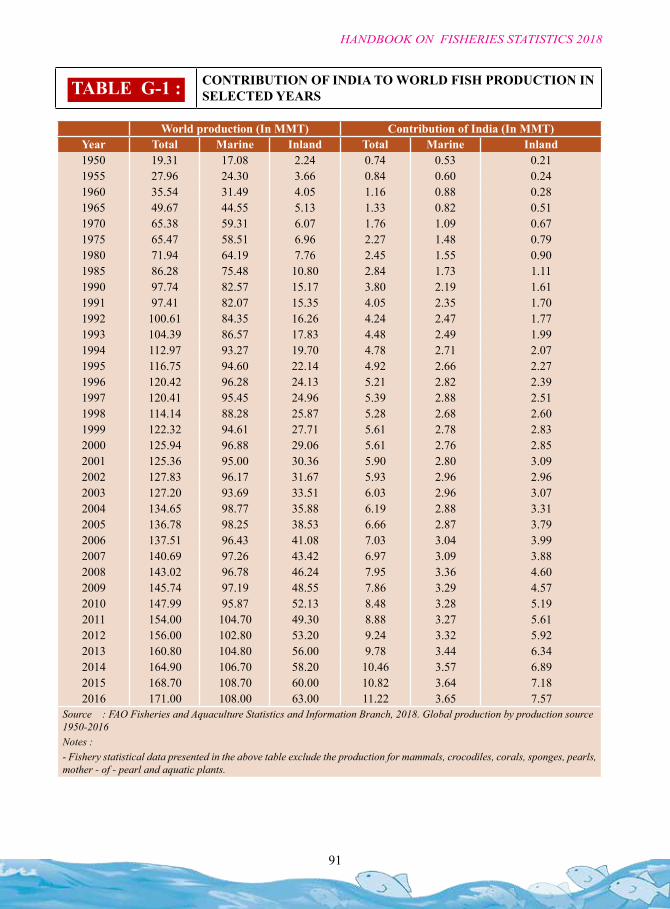
91
HANDBOOK ON FISHERIES STATISTICS 2018
World production (In MMT) Contribution of India (In MMT)Year Total Marine Inland Total Marine Inland1950 19.31 17.08 2.24 0.74 0.53 0.211955 27.96 24.30 3.66 0.84 0.60 0.241960 35.54 31.49 4.05 1.16 0.88 0.281965 49.67 44.55 5.13 1.33 0.82 0.511970 65.38 59.31 6.07 1.76 1.09 0.671975 65.47 58.51 6.96 2.27 1.48 0.791980 71.94 64.19 7.76 2.45 1.55 0.901985 86.28 75.48 10.80 2.84 1.73 1.111990 97.74 82.57 15.17 3.80 2.19 1.611991 97.41 82.07 15.35 4.05 2.35 1.701992 100.61 84.35 16.26 4.24 2.47 1.771993 104.39 86.57 17.83 4.48 2.49 1.991994 112.97 93.27 19.70 4.78 2.71 2.071995 116.75 94.60 22.14 4.92 2.66 2.271996 120.42 96.28 24.13 5.21 2.82 2.391997 120.41 95.45 24.96 5.39 2.88 2.511998 114.14 88.28 25.87 5.28 2.68 2.601999 122.32 94.61 27.71 5.61 2.78 2.832000 125.94 96.88 29.06 5.61 2.76 2.852001 125.36 95.00 30.36 5.90 2.80 3.092002 127.83 96.17 31.67 5.93 2.96 2.962003 127.20 93.69 33.51 6.03 2.96 3.072004 134.65 98.77 35.88 6.19 2.88 3.312005 136.78 98.25 38.53 6.66 2.87 3.792006 137.51 96.43 41.08 7.03 3.04 3.992007 140.69 97.26 43.42 6.97 3.09 3.882008 143.02 96.78 46.24 7.95 3.36 4.602009 145.74 97.19 48.55 7.86 3.29 4.572010 147.99 95.87 52.13 8.48 3.28 5.192011 154.00 104.70 49.30 8.88 3.27 5.612012 156.00 102.80 53.20 9.24 3.32 5.922013 160.80 104.80 56.00 9.78 3.44 6.342014 164.90 106.70 58.20 10.46 3.57 6.892015 168.70 108.70 60.00 10.82 3.64 7.182016 171.00 108.00 63.00 11.22 3.65 7.57
Source : FAO Fisheries and Aquaculture Statistics and Information Branch, 2018. Global production by production source 1950-2016Notes :- Fishery statistical data presented in the above table exclude the production for mammals, crocodiles, corals, sponges, pearls, mother - of - pearl and aquatic plants.
TABLE G-1 : CONTRIBUTION OF INDIA TO WORLD FISH PRODUCTION IN SELECTED YEARS
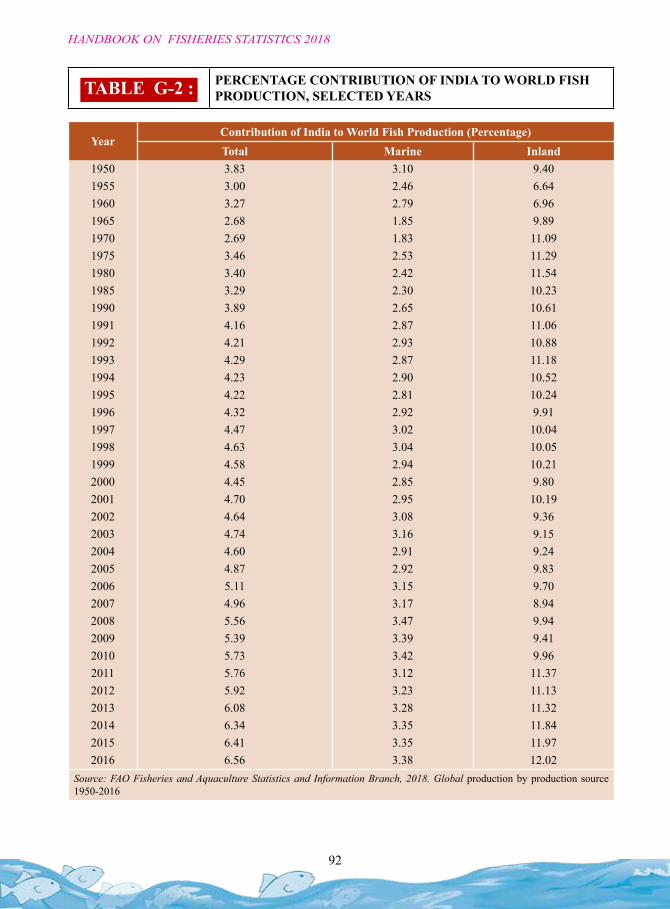
92
HANDBOOK ON FISHERIES STATISTICS 2018
YearContribution of India to World Fish Production (Percentage)Total Marine Inland
1950 3.83 3.10 9.401955 3.00 2.46 6.641960 3.27 2.79 6.961965 2.68 1.85 9.891970 2.69 1.83 11.091975 3.46 2.53 11.291980 3.40 2.42 11.541985 3.29 2.30 10.231990 3.89 2.65 10.611991 4.16 2.87 11.061992 4.21 2.93 10.881993 4.29 2.87 11.181994 4.23 2.90 10.521995 4.22 2.81 10.241996 4.32 2.92 9.911997 4.47 3.02 10.041998 4.63 3.04 10.051999 4.58 2.94 10.212000 4.45 2.85 9.802001 4.70 2.95 10.192002 4.64 3.08 9.362003 4.74 3.16 9.152004 4.60 2.91 9.242005 4.87 2.92 9.832006 5.11 3.15 9.702007 4.96 3.17 8.942008 5.56 3.47 9.942009 5.39 3.39 9.412010 5.73 3.42 9.962011 5.76 3.12 11.372012 5.92 3.23 11.132013 6.08 3.28 11.322014 6.34 3.35 11.842015 6.41 3.35 11.972016 6.56 3.38 12.02
Source: FAO Fisheries and Aquaculture Statistics and Information Branch, 2018. Global production by production source 1950-2016
TABLE G-2 : PERCENTAGE CONTRIBUTION OF INDIA TO WORLD FISH PRODUCTION, SELECTED YEARS
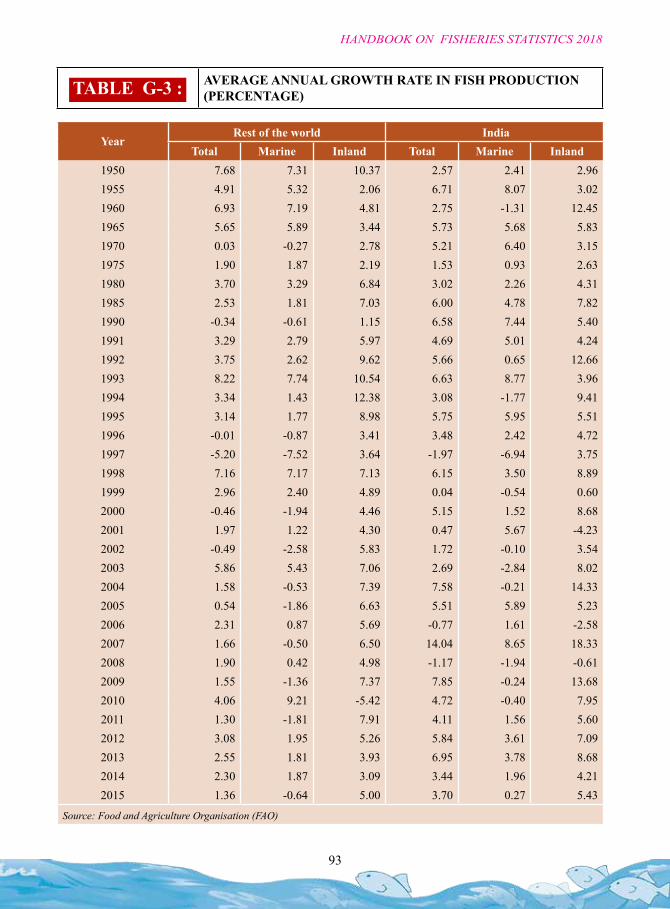
93
HANDBOOK ON FISHERIES STATISTICS 2018
TABLE G-3 : AVERAGE ANNUAL GROWTH RATE IN FISH PRODUCTION (PERCENTAGE)
YearRest of the world India
Total Marine Inland Total Marine Inland1950 7.68 7.31 10.37 2.57 2.41 2.961955 4.91 5.32 2.06 6.71 8.07 3.021960 6.93 7.19 4.81 2.75 -1.31 12.451965 5.65 5.89 3.44 5.73 5.68 5.831970 0.03 -0.27 2.78 5.21 6.40 3.151975 1.90 1.87 2.19 1.53 0.93 2.631980 3.70 3.29 6.84 3.02 2.26 4.311985 2.53 1.81 7.03 6.00 4.78 7.821990 -0.34 -0.61 1.15 6.58 7.44 5.401991 3.29 2.79 5.97 4.69 5.01 4.241992 3.75 2.62 9.62 5.66 0.65 12.661993 8.22 7.74 10.54 6.63 8.77 3.961994 3.34 1.43 12.38 3.08 -1.77 9.411995 3.14 1.77 8.98 5.75 5.95 5.511996 -0.01 -0.87 3.41 3.48 2.42 4.721997 -5.20 -7.52 3.64 -1.97 -6.94 3.751998 7.16 7.17 7.13 6.15 3.50 8.891999 2.96 2.40 4.89 0.04 -0.54 0.602000 -0.46 -1.94 4.46 5.15 1.52 8.682001 1.97 1.22 4.30 0.47 5.67 -4.232002 -0.49 -2.58 5.83 1.72 -0.10 3.542003 5.86 5.43 7.06 2.69 -2.84 8.022004 1.58 -0.53 7.39 7.58 -0.21 14.332005 0.54 -1.86 6.63 5.51 5.89 5.232006 2.31 0.87 5.69 -0.77 1.61 -2.582007 1.66 -0.50 6.50 14.04 8.65 18.332008 1.90 0.42 4.98 -1.17 -1.94 -0.612009 1.55 -1.36 7.37 7.85 -0.24 13.682010 4.06 9.21 -5.42 4.72 -0.40 7.952011 1.30 -1.81 7.91 4.11 1.56 5.602012 3.08 1.95 5.26 5.84 3.61 7.092013 2.55 1.81 3.93 6.95 3.78 8.682014 2.30 1.87 3.09 3.44 1.96 4.212015 1.36 -0.64 5.00 3.70 0.27 5.43
Source: Food and Agriculture Organisation (FAO)
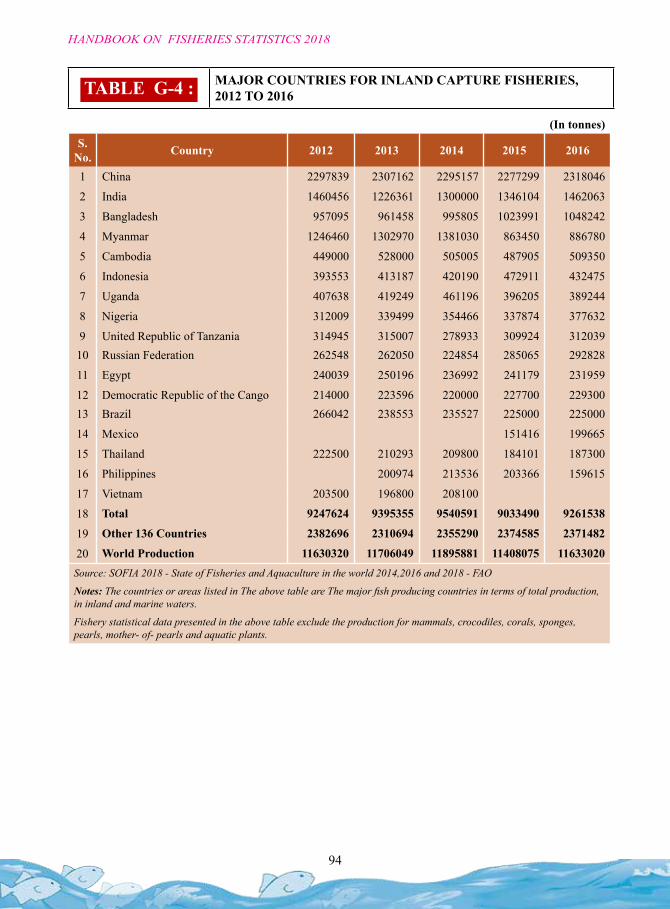
94
HANDBOOK ON FISHERIES STATISTICS 2018
(In tonnes)S.
No. Country 2012 2013 2014 2015 2016
1 China 2297839 2307162 2295157 2277299 2318046
2 India 1460456 1226361 1300000 1346104 1462063
3 Bangladesh 957095 961458 995805 1023991 1048242
4 Myanmar 1246460 1302970 1381030 863450 886780
5 Cambodia 449000 528000 505005 487905 509350
6 Indonesia 393553 413187 420190 472911 432475
7 Uganda 407638 419249 461196 396205 389244
8 Nigeria 312009 339499 354466 337874 377632
9 United Republic of Tanzania 314945 315007 278933 309924 31203910 Russian Federation 262548 262050 224854 285065 292828
11 Egypt 240039 250196 236992 241179 231959
12 Democratic Republic of the Cango 214000 223596 220000 227700 22930013 Brazil 266042 238553 235527 225000 225000
14 Mexico 151416 199665
15 Thailand 222500 210293 209800 184101 187300
16 Philippines 200974 213536 203366 159615
17 Vietnam 203500 196800 208100
18 Total 9247624 9395355 9540591 9033490 9261538
19 Other 136 Countries 2382696 2310694 2355290 2374585 2371482
20 World Production 11630320 11706049 11895881 11408075 11633020Source: SOFIA 2018 - State of Fisheries and Aquaculture in the world 2014,2016 and 2018 - FAO
Notes: The countries or areas listed in The above table are The major fish producing countries in terms of total production, in inland and marine waters.
Fishery statistical data presented in the above table exclude the production for mammals, crocodiles, corals, sponges, pearls, mother- of- pearls and aquatic plants.
TABLE G-4 : MAJOR COUNTRIES FOR INLAND CAPTURE FISHERIES, 2012 TO 2016
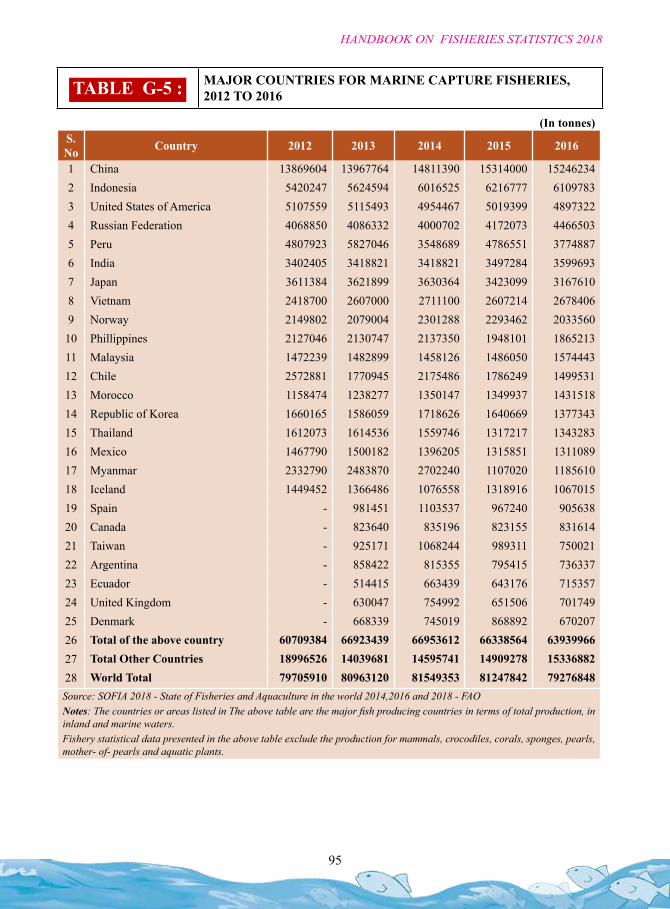
95
HANDBOOK ON FISHERIES STATISTICS 2018
(In tonnes)S. No Country 2012 2013 2014 2015 2016
1 China 13869604 13967764 14811390 15314000 152462342 Indonesia 5420247 5624594 6016525 6216777 61097833 United States of America 5107559 5115493 4954467 5019399 48973224 Russian Federation 4068850 4086332 4000702 4172073 44665035 Peru 4807923 5827046 3548689 4786551 37748876 India 3402405 3418821 3418821 3497284 35996937 Japan 3611384 3621899 3630364 3423099 31676108 Vietnam 2418700 2607000 2711100 2607214 26784069 Norway 2149802 2079004 2301288 2293462 203356010 Phillippines 2127046 2130747 2137350 1948101 186521311 Malaysia 1472239 1482899 1458126 1486050 157444312 Chile 2572881 1770945 2175486 1786249 149953113 Morocco 1158474 1238277 1350147 1349937 143151814 Republic of Korea 1660165 1586059 1718626 1640669 137734315 Thailand 1612073 1614536 1559746 1317217 134328316 Mexico 1467790 1500182 1396205 1315851 131108917 Myanmar 2332790 2483870 2702240 1107020 118561018 Iceland 1449452 1366486 1076558 1318916 106701519 Spain - 981451 1103537 967240 90563820 Canada - 823640 835196 823155 83161421 Taiwan - 925171 1068244 989311 75002122 Argentina - 858422 815355 795415 73633723 Ecuador - 514415 663439 643176 71535724 United Kingdom - 630047 754992 651506 70174925 Denmark - 668339 745019 868892 67020726 Total of the above country 60709384 66923439 66953612 66338564 6393996627 Total Other Countries 18996526 14039681 14595741 14909278 1533688228 World Total 79705910 80963120 81549353 81247842 79276848Source: SOFIA 2018 - State of Fisheries and Aquaculture in the world 2014,2016 and 2018 - FAONotes: The countries or areas listed in The above table are the major fish producing countries in terms of total production, in inland and marine waters.Fishery statistical data presented in the above table exclude the production for mammals, crocodiles, corals, sponges, pearls, mother- of- pearls and aquatic plants.
TABLE G-5 : MAJOR COUNTRIES FOR MARINE CAPTURE FISHERIES, 2012 TO 2016
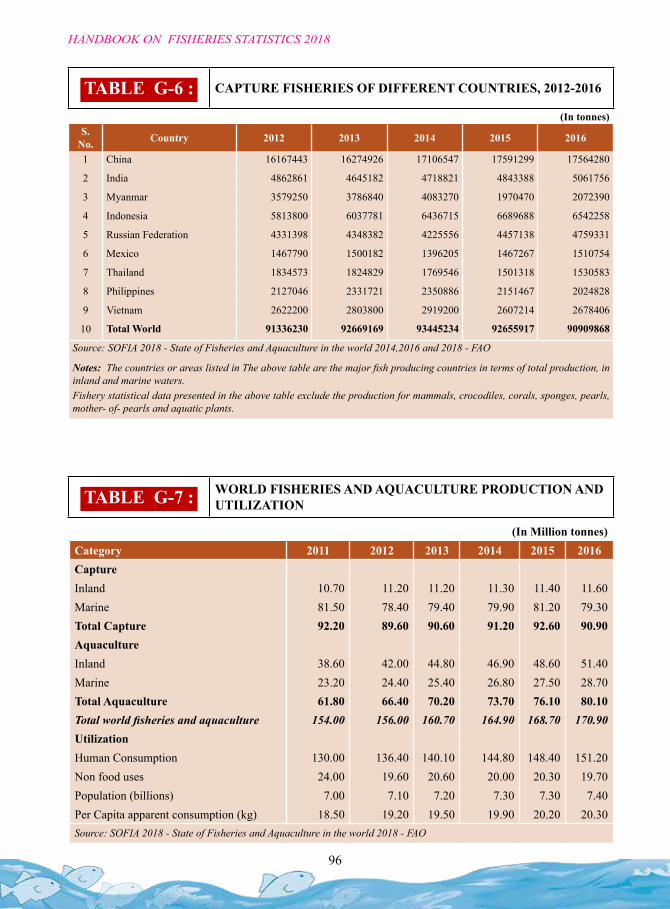
96
HANDBOOK ON FISHERIES STATISTICS 2018
(In tonnes) S.
No. Country 2012 2013 2014 2015 2016
1 China 16167443 16274926 17106547 17591299 17564280
2 India 4862861 4645182 4718821 4843388 5061756
3 Myanmar 3579250 3786840 4083270 1970470 2072390
4 Indonesia 5813800 6037781 6436715 6689688 6542258
5 Russian Federation 4331398 4348382 4225556 4457138 4759331
6 Mexico 1467790 1500182 1396205 1467267 1510754
7 Thailand 1834573 1824829 1769546 1501318 1530583
8 Philippines 2127046 2331721 2350886 2151467 2024828
9 Vietnam 2622200 2803800 2919200 2607214 2678406
10 Total World 91336230 92669169 93445234 92655917 90909868
Source: SOFIA 2018 - State of Fisheries and Aquaculture in the world 2014,2016 and 2018 - FAO
Notes: The countries or areas listed in The above table are the major fish producing countries in terms of total production, in inland and marine waters.Fishery statistical data presented in the above table exclude the production for mammals, crocodiles, corals, sponges, pearls, mother- of- pearls and aquatic plants.
(In Million tonnes)Category 2011 2012 2013 2014 2015 2016CaptureInland 10.70 11.20 11.20 11.30 11.40 11.60Marine 81.50 78.40 79.40 79.90 81.20 79.30Total Capture 92.20 89.60 90.60 91.20 92.60 90.90AquacultureInland 38.60 42.00 44.80 46.90 48.60 51.40Marine 23.20 24.40 25.40 26.80 27.50 28.70Total Aquaculture 61.80 66.40 70.20 73.70 76.10 80.10Total world fisheries and aquaculture 154.00 156.00 160.70 164.90 168.70 170.90UtilizationHuman Consumption 130.00 136.40 140.10 144.80 148.40 151.20Non food uses 24.00 19.60 20.60 20.00 20.30 19.70Population (billions) 7.00 7.10 7.20 7.30 7.30 7.40Per Capita apparent consumption (kg) 18.50 19.20 19.50 19.90 20.20 20.30Source: SOFIA 2018 - State of Fisheries and Aquaculture in the world 2018 - FAO
TABLE G-6 : CAPTURE FISHERIES OF DIFFERENT COUNTRIES, 2012-2016
TABLE G-7 : WORLD FISHERIES AND AQUACULTURE PRODUCTION AND UTILIZATION
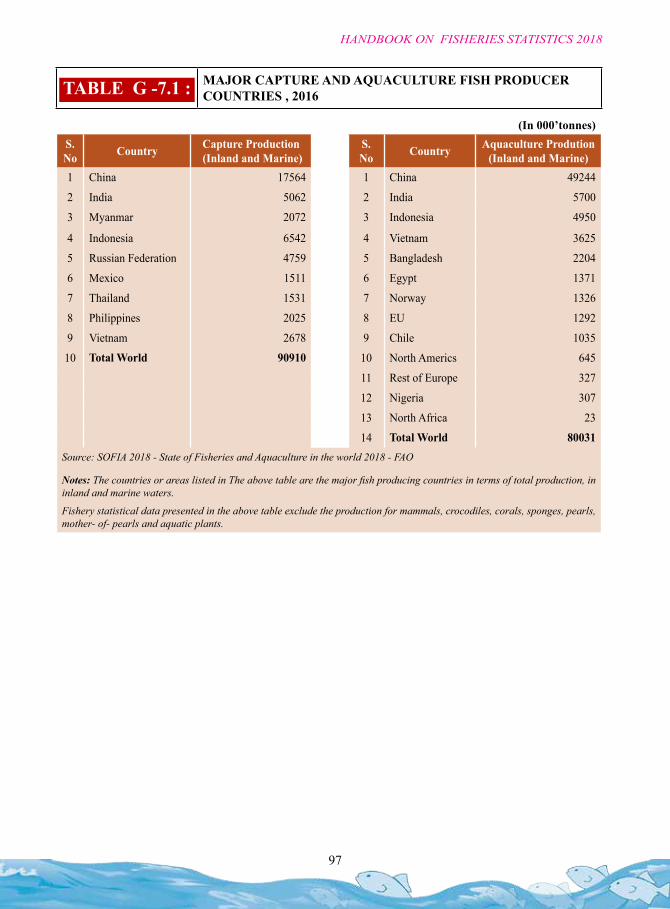
97
HANDBOOK ON FISHERIES STATISTICS 2018
TABLE G -7.1 : MAJOR CAPTURE AND AQUACULTURE FISH PRODUCER COUNTRIES , 2016
(In 000’tonnes) S. No Country Capture Production
(Inland and Marine)S. No Country Aquaculture Prodution
(Inland and Marine)1 China 17564 1 China 49244
2 India 5062 2 India 5700
3 Myanmar 2072 3 Indonesia 4950
4 Indonesia 6542 4 Vietnam 3625
5 Russian Federation 4759 5 Bangladesh 2204
6 Mexico 1511 6 Egypt 1371
7 Thailand 1531 7 Norway 1326
8 Philippines 2025 8 EU 1292
9 Vietnam 2678 9 Chile 1035
10 Total World 90910 10 North Americs 645
11 Rest of Europe 327
12 Nigeria 307
13 North Africa 23
14 Total World 80031Source: SOFIA 2018 - State of Fisheries and Aquaculture in the world 2018 - FAO
Notes: The countries or areas listed in The above table are the major fish producing countries in terms of total production, in inland and marine waters.
Fishery statistical data presented in the above table exclude the production for mammals, crocodiles, corals, sponges, pearls, mother- of- pearls and aquatic plants.
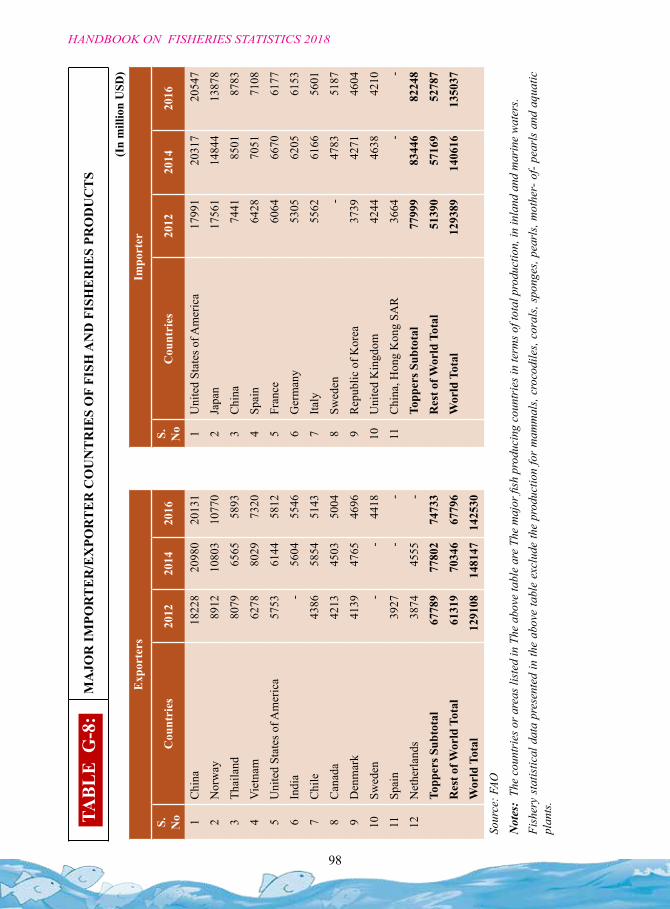
98
HANDBOOK ON FISHERIES STATISTICS 2018
(In
mill
ion
USD
)E
xpor
ters
Impo
rter
S.
No
Cou
ntri
es20
1220
1420
16S.
N
oC
ount
ries
2012
2014
2016
1C
hina
1822
820
980
2013
11
Uni
ted
Stat
es o
f Am
eric
a17
991
2031
720
547
2N
orw
ay89
1210
803
1077
02
Japa
n17
561
1484
413
878
3Th
aila
nd80
7965
6558
933
Chi
na74
4185
0187
83
4V
ietn
am62
7880
2973
204
Spai
n64
2870
5171
08
5U
nite
d St
ates
of A
mer
ica
5753
6144
5812
5Fr
ance
6064
6670
6177
6In
dia
-56
0455
466
Ger
man
y53
0562
0561
53
7C
hile
4386
5854
5143
7Ita
ly55
6261
6656
01
8C
anad
a42
1345
0350
048
Swed
en-
4783
5187
9D
enm
ark
4139
4765
4696
9R
epub
lic o
f Kor
ea37
3942
7146
04
10Sw
eden
--
4418
10U
nite
d K
ingd
om42
4446
3842
10
11Sp
ain
3927
--
11C
hina
, Hon
g K
ong
SAR
3664
--
12N
ethe
rland
s38
7445
55-
Topp
ers S
ubto
tal
7799
983
446
8224
8
Topp
ers S
ubto
tal
6778
977
802
7473
3R
est o
f Wor
ld T
otal
5139
057
169
5278
7
Res
t of W
orld
Tot
al61
319
7034
667
796
Wor
ld T
otal
1293
8914
0616
1350
37
Wor
ld T
otal
1291
0814
8147
1425
30
Sour
ce: F
AO
Not
es:
The
coun
trie
s or a
reas
list
ed in
The
abo
ve ta
ble
are
The
maj
or fi
sh p
rodu
cing
cou
ntri
es in
term
s of t
otal
pro
duct
ion,
in in
land
and
mar
ine
wat
ers.
Fish
ery
stat
istic
al d
ata
pres
ente
d in
the
abov
e ta
ble
excl
ude
the
prod
uctio
n fo
r m
amm
als,
croc
odile
s, co
rals
, spo
nges
, pea
rls,
mot
her-
of-
pear
ls a
nd a
quat
ic
plan
ts.
TABL
E G
-8:
MA
JOR
IMPO
RT
ER
/EX
POR
TE
R C
OU
NT
RIE
S O
F FI
SH A
ND
FIS
HE
RIE
S PR
OD
UC
TS
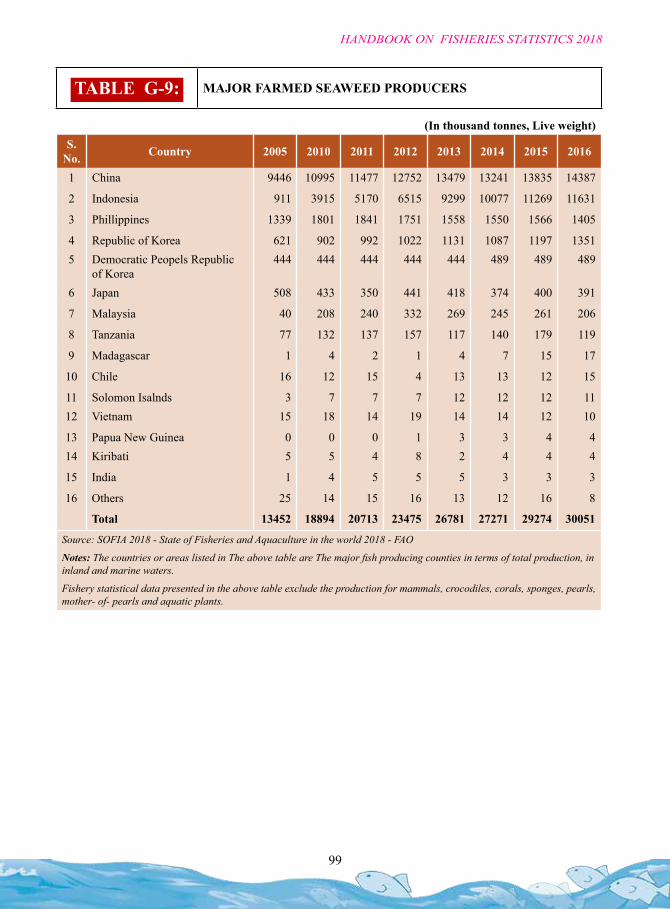
99
HANDBOOK ON FISHERIES STATISTICS 2018
(In thousand tonnes, Live weight)S.
No. Country 2005 2010 2011 2012 2013 2014 2015 2016
1 China 9446 10995 11477 12752 13479 13241 13835 14387
2 Indonesia 911 3915 5170 6515 9299 10077 11269 11631
3 Phillippines 1339 1801 1841 1751 1558 1550 1566 1405
4 Republic of Korea 621 902 992 1022 1131 1087 1197 13515 Democratic Peopels Republic
of Korea444 444 444 444 444 489 489 489
6 Japan 508 433 350 441 418 374 400 391
7 Malaysia 40 208 240 332 269 245 261 206
8 Tanzania 77 132 137 157 117 140 179 119
9 Madagascar 1 4 2 1 4 7 15 17
10 Chile 16 12 15 4 13 13 12 15
11 Solomon Isalnds 3 7 7 7 12 12 12 1112 Vietnam 15 18 14 19 14 14 12 10
13 Papua New Guinea 0 0 0 1 3 3 4 414 Kiribati 5 5 4 8 2 4 4 4
15 India 1 4 5 5 5 3 3 3
16 Others 25 14 15 16 13 12 16 8
Total 13452 18894 20713 23475 26781 27271 29274 30051
Source: SOFIA 2018 - State of Fisheries and Aquaculture in the world 2018 - FAO
Notes: The countries or areas listed in The above table are The major fish producing counties in terms of total production, in inland and marine waters.
Fishery statistical data presented in the above table exclude the production for mammals, crocodiles, corals, sponges, pearls, mother- of- pearls and aquatic plants.
TABLE G-9: MAJOR FARMED SEAWEED PRODUCERS

SECTION : HPRICE
INDICES
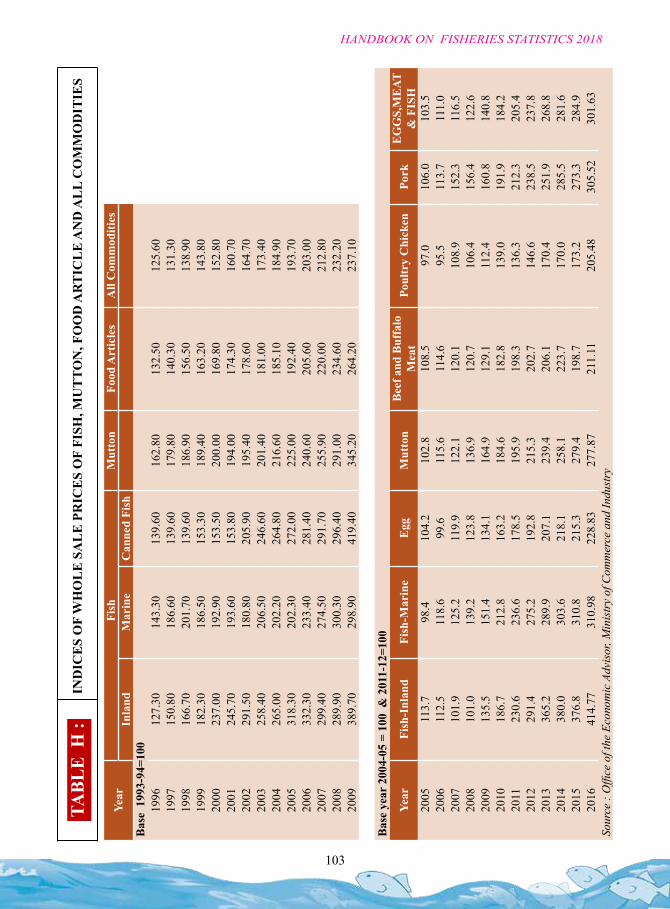
103
HANDBOOK ON FISHERIES STATISTICS 2018
Year
F
ish
Mut
ton
Food
Art
icle
sA
ll C
omm
oditi
esIn
land
Mar
ine
Can
ned
Fish
Bas
e 1
993-
94=1
0019
9612
7.30
143.
3013
9.60
162.
8013
2.50
125.
6019
9715
0.80
186.
6013
9.60
179.
8014
0.30
131.
3019
9816
6.70
201.
7013
9.60
186.
9015
6.50
138.
9019
9918
2.30
186.
5015
3.30
189.
4016
3.20
143.
8020
0023
7.00
192.
9015
3.50
200.
0016
9.80
152.
8020
0124
5.70
193.
6015
3.80
194.
0017
4.30
160.
7020
0229
1.50
180.
8020
5.90
195.
4017
8.60
164.
7020
0325
8.40
206.
5024
6.60
201.
4018
1.00
173.
4020
0426
5.00
202.
2026
4.80
216.
6018
5.10
184.
9020
0531
8.30
202.
3027
2.00
225.
0019
2.40
193.
7020
0633
2.30
233.
4028
1.40
240.
6020
5.60
203.
0020
0729
9.40
274.
5029
1.70
255.
9022
0.00
212.
8020
0828
9.90
300.
3029
6.40
291.
0023
4.60
232.
2020
0938
9.70
298.
9041
9.40
345.
2026
4.20
237.
10
Bas
e ye
ar 2
004-
05 =
100
& 2
011-
12=1
00
Year
Fish
-Inl
and
Fish
-Mar
ine
Egg
Mut
ton
Bee
f and
Buf
falo
M
eat
Poul
try
Chi
cken
Pork
EG
GS,
ME
AT
& F
ISH
2005
113.
798
.410
4.2
102.
810
8.5
97.0
106.
010
3.5
2006
112.
511
8.6
99.6
115.
611
4.6
95.5
113.
711
1.0
2007
101.
912
5.2
119.
912
2.1
120.
110
8.9
152.
311
6.5
2008
101.
013
9.2
123.
813
6.9
120.
710
6.4
156.
412
2.6
2009
135.
515
1.4
134.
116
4.9
129.
111
2.4
160.
814
0.8
2010
186.
721
2.8
163.
218
4.6
182.
813
9.0
191.
918
4.2
2011
230.
623
6.6
178.
519
5.9
198.
313
6.3
212.
320
5.4
2012
291.
427
5.2
192.
821
5.3
202.
714
6.6
238.
523
7.8
2013
365.
228
9.9
207.
123
9.4
206.
117
0.4
251.
926
8.8
2014
380.
030
3.6
218.
125
8.1
223.
717
0.0
285.
528
1.6
2015
376.
831
0.8
215.
327
9.4
198.
717
3.2
273.
328
4.9
2016
414.
7731
0.98
228.
8327
7.87
211.
1120
5.48
305.
5230
1.63
Sour
ce :
Offi
ce o
f the
Eco
nom
ic A
dvis
or, M
inis
try
of C
omm
erce
and
Indu
stry
TABL
E H
: IN
DIC
ES
OF
WH
OL
E S
AL
E P
RIC
ES
OF
FISH
, MU
TTO
N, F
OO
D A
RT
ICL
E A
ND
AL
L C
OM
MO
DIT
IES

105
HANDBOOK ON FISHERIES STATISTICS 2018
SECTION : I
LIST OF DISTRICTSSTATES/UTs WITH
THEIR CODES
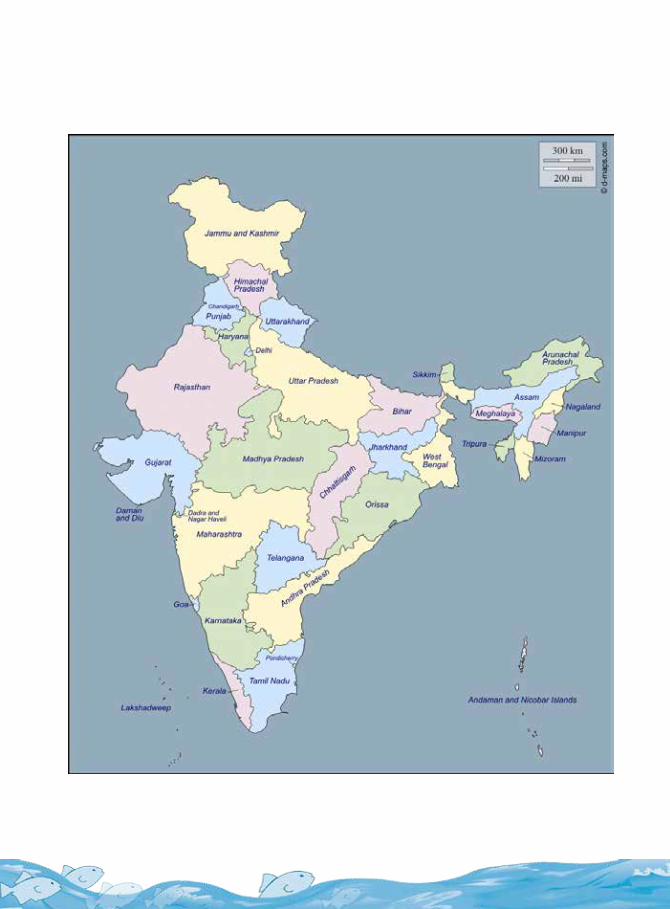
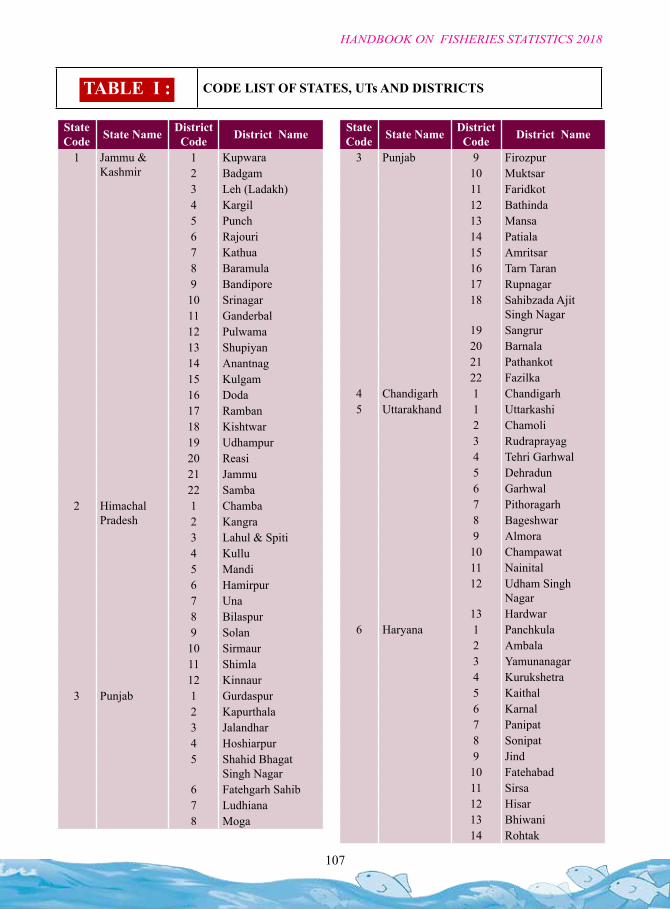
107
HANDBOOK ON FISHERIES STATISTICS 2018
TABLE I : CODE LIST OF STATES, UTs AND DISTRICTS
State Code State Name District
Code District Name
1 Jammu & Kashmir
1 Kupwara2 Badgam3 Leh (Ladakh)4 Kargil5 Punch6 Rajouri7 Kathua8 Baramula9 Bandipore10 Srinagar11 Ganderbal12 Pulwama13 Shupiyan14 Anantnag15 Kulgam16 Doda17 Ramban18 Kishtwar19 Udhampur20 Reasi21 Jammu22 Samba
2 Himachal Pradesh
1 Chamba2 Kangra3 Lahul & Spiti4 Kullu5 Mandi6 Hamirpur7 Una8 Bilaspur9 Solan10 Sirmaur11 Shimla12 Kinnaur
3 Punjab 1 Gurdaspur2 Kapurthala3 Jalandhar4 Hoshiarpur5 Shahid Bhagat
Singh Nagar6 Fatehgarh Sahib7 Ludhiana8 Moga
State Code State Name District
Code District Name
3 Punjab 9 Firozpur10 Muktsar11 Faridkot12 Bathinda13 Mansa14 Patiala15 Amritsar16 Tarn Taran17 Rupnagar18 Sahibzada Ajit
Singh Nagar19 Sangrur20 Barnala21 Pathankot22 Fazilka
4 Chandigarh 1 Chandigarh5 Uttarakhand 1 Uttarkashi
2 Chamoli3 Rudraprayag4 Tehri Garhwal5 Dehradun6 Garhwal7 Pithoragarh8 Bageshwar9 Almora10 Champawat11 Nainital12 Udham Singh
Nagar13 Hardwar
6 Haryana 1 Panchkula2 Ambala3 Yamunanagar4 Kurukshetra5 Kaithal6 Karnal7 Panipat8 Sonipat9 Jind10 Fatehabad11 Sirsa12 Hisar13 Bhiwani14 Rohtak
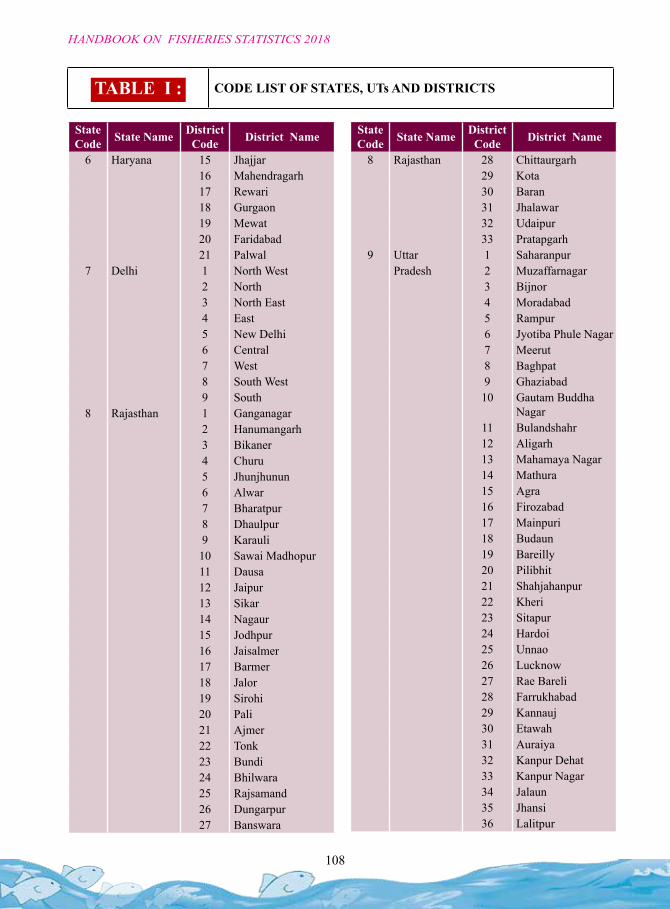
108
HANDBOOK ON FISHERIES STATISTICS 2018
TABLE I : CODE LIST OF STATES, UTs AND DISTRICTS
State Code State Name District
Code District Name
6 Haryana 15 Jhajjar16 Mahendragarh17 Rewari18 Gurgaon19 Mewat20 Faridabad21 Palwal
7 Delhi 1 North West2 North3 North East4 East5 New Delhi6 Central7 West8 South West9 South
8 Rajasthan 1 Ganganagar2 Hanumangarh3 Bikaner4 Churu5 Jhunjhunun6 Alwar7 Bharatpur8 Dhaulpur9 Karauli10 Sawai Madhopur11 Dausa12 Jaipur13 Sikar14 Nagaur15 Jodhpur16 Jaisalmer17 Barmer18 Jalor19 Sirohi20 Pali21 Ajmer22 Tonk23 Bundi24 Bhilwara25 Rajsamand26 Dungarpur27 Banswara
State Code State Name District
Code District Name
8 Rajasthan 28 Chittaurgarh29 Kota30 Baran31 Jhalawar32 Udaipur33 Pratapgarh
9 Uttar 1 SaharanpurPradesh 2 Muzaffarnagar
3 Bijnor4 Moradabad5 Rampur6 Jyotiba Phule Nagar7 Meerut8 Baghpat9 Ghaziabad10 Gautam Buddha
Nagar11 Bulandshahr12 Aligarh13 Mahamaya Nagar14 Mathura15 Agra16 Firozabad17 Mainpuri18 Budaun19 Bareilly20 Pilibhit21 Shahjahanpur22 Kheri23 Sitapur24 Hardoi25 Unnao26 Lucknow27 Rae Bareli28 Farrukhabad29 Kannauj30 Etawah31 Auraiya32 Kanpur Dehat33 Kanpur Nagar34 Jalaun35 Jhansi36 Lalitpur
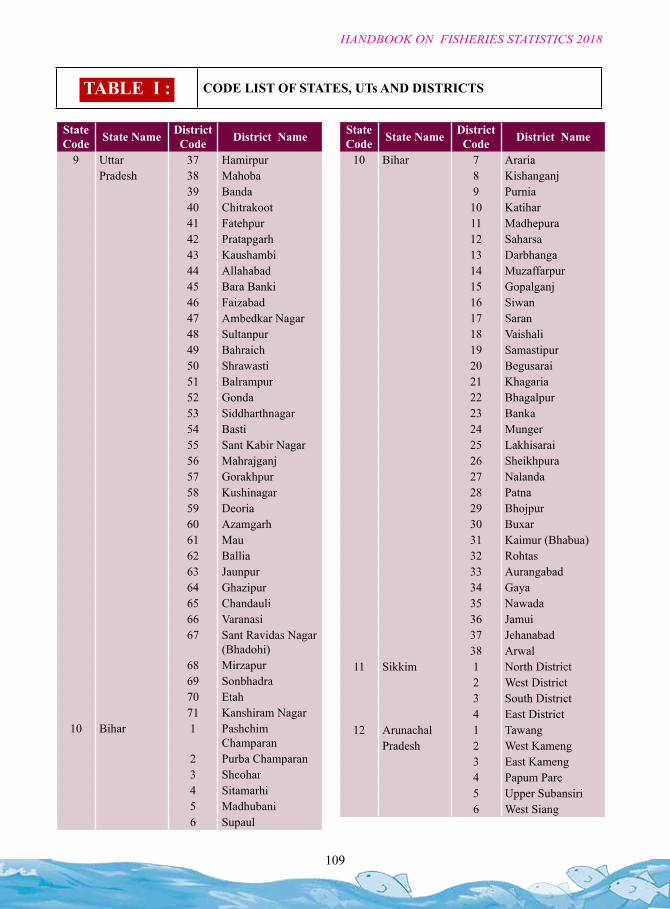
109
HANDBOOK ON FISHERIES STATISTICS 2018
TABLE I : CODE LIST OF STATES, UTs AND DISTRICTS
State Code State Name District
Code District Name
9 Uttar 37 HamirpurPradesh 38 Mahoba
39 Banda40 Chitrakoot41 Fatehpur42 Pratapgarh43 Kaushambi44 Allahabad45 Bara Banki46 Faizabad47 Ambedkar Nagar48 Sultanpur49 Bahraich50 Shrawasti51 Balrampur52 Gonda53 Siddharthnagar54 Basti55 Sant Kabir Nagar56 Mahrajganj57 Gorakhpur58 Kushinagar59 Deoria60 Azamgarh61 Mau62 Ballia63 Jaunpur64 Ghazipur65 Chandauli66 Varanasi67 Sant Ravidas Nagar
(Bhadohi)68 Mirzapur69 Sonbhadra70 Etah71 Kanshiram Nagar
10 Bihar 1 Pashchim Champaran
2 Purba Champaran3 Sheohar4 Sitamarhi5 Madhubani6 Supaul
State Code State Name District
Code District Name
10 Bihar 7 Araria8 Kishanganj9 Purnia10 Katihar11 Madhepura12 Saharsa13 Darbhanga14 Muzaffarpur15 Gopalganj16 Siwan17 Saran18 Vaishali19 Samastipur20 Begusarai21 Khagaria22 Bhagalpur23 Banka24 Munger25 Lakhisarai26 Sheikhpura27 Nalanda28 Patna29 Bhojpur30 Buxar31 Kaimur (Bhabua)32 Rohtas33 Aurangabad34 Gaya35 Nawada36 Jamui37 Jehanabad38 Arwal
11 Sikkim 1 North District2 West District3 South District4 East District
12 Arunachal 1 TawangPradesh 2 West Kameng
3 East Kameng4 Papum Pare5 Upper Subansiri6 West Siang
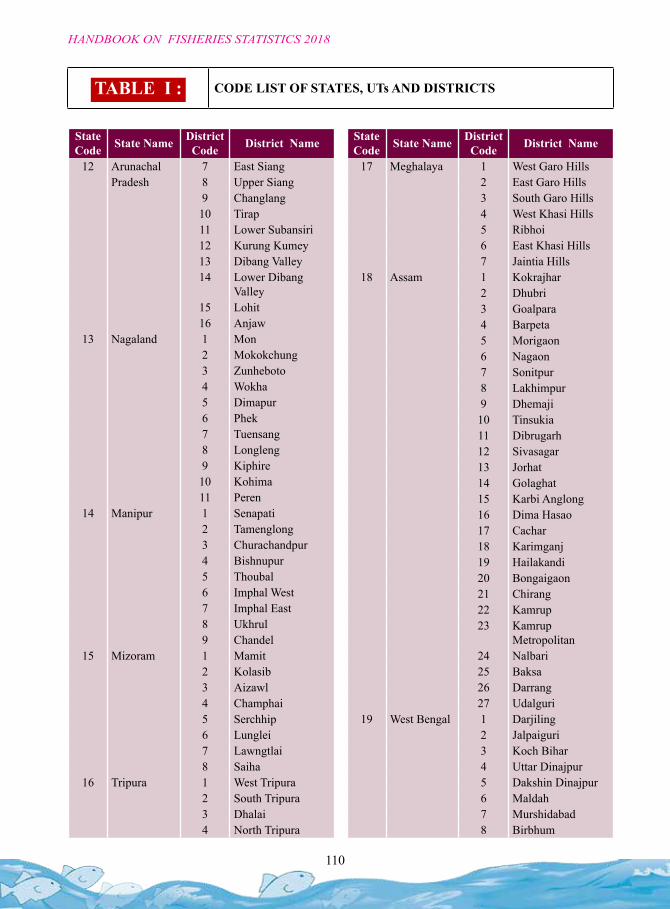
110
HANDBOOK ON FISHERIES STATISTICS 2018
State Code State Name District
Code District Name
12 Arunachal 7 East SiangPradesh 8 Upper Siang
9 Changlang10 Tirap11 Lower Subansiri12 Kurung Kumey13 Dibang Valley14 Lower Dibang
Valley15 Lohit16 Anjaw
13 Nagaland 1 Mon2 Mokokchung3 Zunheboto4 Wokha5 Dimapur6 Phek7 Tuensang8 Longleng9 Kiphire10 Kohima11 Peren
14 Manipur 1 Senapati2 Tamenglong3 Churachandpur4 Bishnupur5 Thoubal6 Imphal West7 Imphal East8 Ukhrul9 Chandel
15 Mizoram 1 Mamit2 Kolasib3 Aizawl4 Champhai5 Serchhip6 Lunglei7 Lawngtlai8 Saiha
16 Tripura 1 West Tripura2 South Tripura3 Dhalai4 North Tripura
TABLE I : CODE LIST OF STATES, UTs AND DISTRICTS
State Code State Name District
Code District Name
17 Meghalaya 1 West Garo Hills2 East Garo Hills3 South Garo Hills4 West Khasi Hills5 Ribhoi6 East Khasi Hills7 Jaintia Hills
18 Assam 1 Kokrajhar2 Dhubri3 Goalpara4 Barpeta5 Morigaon6 Nagaon7 Sonitpur8 Lakhimpur9 Dhemaji10 Tinsukia11 Dibrugarh12 Sivasagar13 Jorhat14 Golaghat15 Karbi Anglong16 Dima Hasao17 Cachar18 Karimganj19 Hailakandi20 Bongaigaon21 Chirang22 Kamrup23 Kamrup
Metropolitan24 Nalbari25 Baksa26 Darrang27 Udalguri
19 West Bengal 1 Darjiling2 Jalpaiguri3 Koch Bihar4 Uttar Dinajpur5 Dakshin Dinajpur6 Maldah7 Murshidabad8 Birbhum

111
HANDBOOK ON FISHERIES STATISTICS 2018
TABLE I : CODE LIST OF STATES, UTs AND DISTRICTS
State Code State Name District
Code District Name
19 West Bengal 9 Barddhaman10 Nadia11 North Twenty Four
Parganas12 Hugli13 Bankura14 Puruliya15 Haora16 Kolkata17 South Twenty Four
Parganas18 Paschim Medinipur19 Purba Medinipur
20 Jharkhand 1 Garhwa2 Chatra3 Kodarma4 Giridih5 Deoghar6 Godda7 Sahibganj8 Pakur9 Dhanbad10 Bokaro11 Lohardaga12 Purbi Singhbhum13 Palamu14 Latehar15 Hazaribagh16 Ramgarh17 Dumka18 Jamtara19 Ranchi20 Khunti21 Gumla22 Simdega23 Pashchimi
Singhbhum24 Saraikela-
Kharsawan21 Odisha 1 Bargarh
2 Jharsuguda3 Sambalpur
State Code State Name District
Code District Name
21 Odisha 4 Debagarh5 Sundargarh6 Kendujhar7 Mayurbhanj8 Baleshwar9 Bhadrak10 Kendrapara11 Jagatsinghapur12 Cuttack13 Jajapur14 Dhenkanal15 Anugul16 Nayagarh17 Khordha18 Puri19 Ganjam20 Gajapati21 Kandhamal22 Baudh23 Subarnapur24 Balangir25 Nuapada26 Kalahandi27 Rayagada28 Nabarangapur29 Koraput30 Malkangiri
22 Chhattisgarh 1 Koriya2 Surguja3 Jashpur4 Raigarh5 Korba6 Janjgir-Champa7 Bilaspur8 Kabeerdham9 Rajnandgaon10 Durg11 Raipur12 Mahasamund13 Dhamtari14 Uttar Bastar Kanker15 Bastar
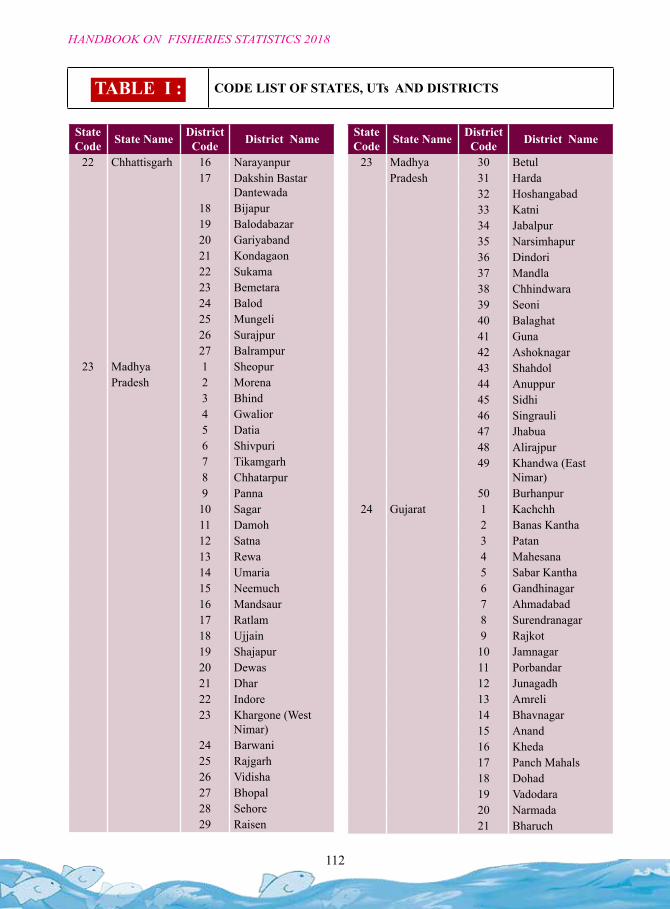
112
HANDBOOK ON FISHERIES STATISTICS 2018
State Code State Name District
Code District Name
22 Chhattisgarh 16 Narayanpur17 Dakshin Bastar
Dantewada18 Bijapur19 Balodabazar20 Gariyaband21 Kondagaon22 Sukama23 Bemetara24 Balod25 Mungeli26 Surajpur27 Balrampur
23 Madhya 1 SheopurPradesh 2 Morena
3 Bhind4 Gwalior5 Datia6 Shivpuri7 Tikamgarh8 Chhatarpur9 Panna10 Sagar11 Damoh12 Satna13 Rewa14 Umaria15 Neemuch16 Mandsaur17 Ratlam18 Ujjain19 Shajapur20 Dewas21 Dhar22 Indore23 Khargone (West
Nimar)24 Barwani25 Rajgarh26 Vidisha27 Bhopal28 Sehore29 Raisen
TABLE I : CODE LIST OF STATES, UTs AND DISTRICTS
State Code State Name District
Code District Name
23 Madhya 30 BetulPradesh 31 Harda
32 Hoshangabad33 Katni34 Jabalpur35 Narsimhapur36 Dindori37 Mandla38 Chhindwara39 Seoni40 Balaghat41 Guna42 Ashoknagar43 Shahdol44 Anuppur45 Sidhi46 Singrauli47 Jhabua48 Alirajpur49 Khandwa (East
Nimar)50 Burhanpur
24 Gujarat 1 Kachchh2 Banas Kantha3 Patan4 Mahesana5 Sabar Kantha6 Gandhinagar7 Ahmadabad8 Surendranagar9 Rajkot10 Jamnagar11 Porbandar12 Junagadh13 Amreli14 Bhavnagar15 Anand16 Kheda17 Panch Mahals18 Dohad19 Vadodara20 Narmada21 Bharuch
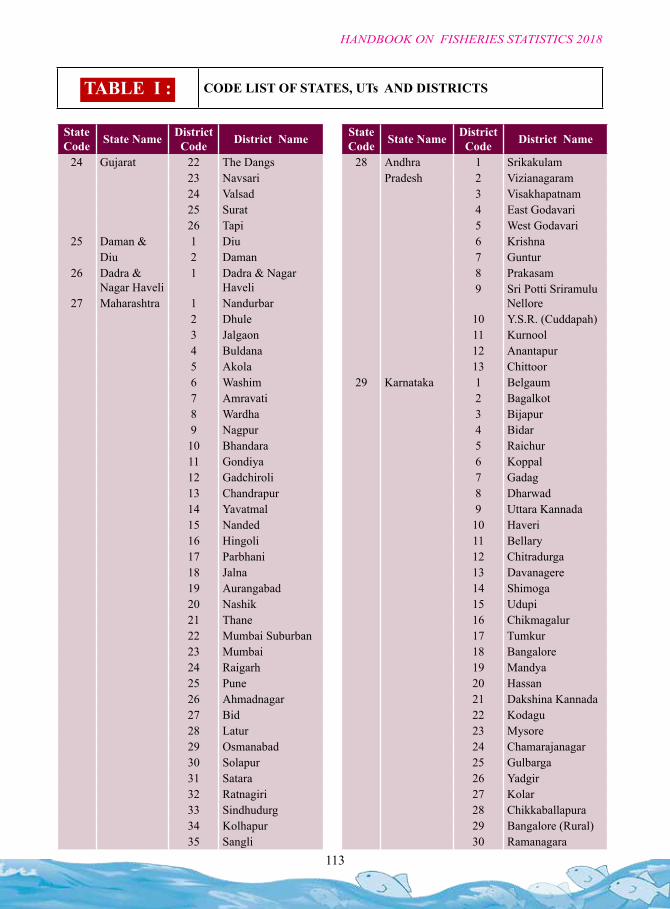
113
HANDBOOK ON FISHERIES STATISTICS 2018
TABLE I : CODE LIST OF STATES, UTs AND DISTRICTS
State Code State Name District
Code District Name
24 Gujarat 22 The Dangs23 Navsari24 Valsad25 Surat26 Tapi
25 Daman & 1 DiuDiu 2 Daman
26 Dadra & Nagar Haveli
1 Dadra & Nagar Haveli
27 Maharashtra 1 Nandurbar2 Dhule3 Jalgaon4 Buldana5 Akola6 Washim7 Amravati8 Wardha9 Nagpur10 Bhandara11 Gondiya12 Gadchiroli13 Chandrapur14 Yavatmal15 Nanded16 Hingoli17 Parbhani18 Jalna19 Aurangabad20 Nashik21 Thane22 Mumbai Suburban23 Mumbai24 Raigarh25 Pune26 Ahmadnagar27 Bid28 Latur29 Osmanabad30 Solapur31 Satara32 Ratnagiri33 Sindhudurg34 Kolhapur35 Sangli
State Code State Name District
Code District Name
28 Andhra 1 SrikakulamPradesh 2 Vizianagaram
3 Visakhapatnam4 East Godavari5 West Godavari6 Krishna7 Guntur8 Prakasam9 Sri Potti Sriramulu
Nellore10 Y.S.R. (Cuddapah)11 Kurnool12 Anantapur13 Chittoor
29 Karnataka 1 Belgaum2 Bagalkot3 Bijapur4 Bidar5 Raichur6 Koppal7 Gadag8 Dharwad9 Uttara Kannada10 Haveri11 Bellary12 Chitradurga13 Davanagere14 Shimoga15 Udupi16 Chikmagalur17 Tumkur18 Bangalore19 Mandya20 Hassan21 Dakshina Kannada22 Kodagu23 Mysore24 Chamarajanagar25 Gulbarga26 Yadgir27 Kolar28 Chikkaballapura29 Bangalore (Rural)30 Ramanagara
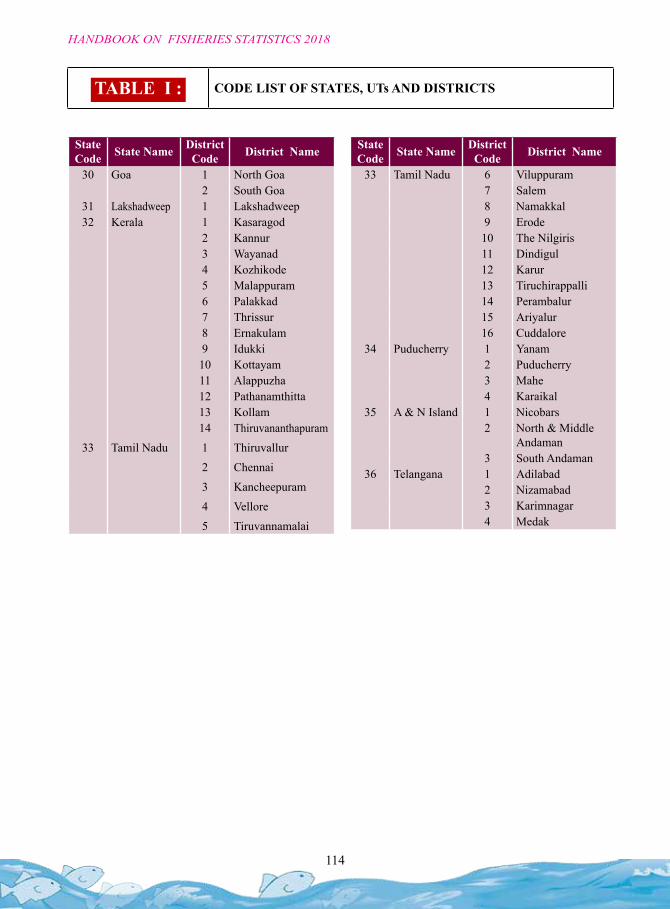
114
HANDBOOK ON FISHERIES STATISTICS 2018
State Code State Name District
Code District Name
30 Goa 1 North Goa2 South Goa
31 Lakshadweep 1 Lakshadweep32 Kerala 1 Kasaragod
2 Kannur3 Wayanad4 Kozhikode5 Malappuram6 Palakkad7 Thrissur8 Ernakulam9 Idukki10 Kottayam11 Alappuzha12 Pathanamthitta13 Kollam14 Thiruvananthapuram
33 Tamil Nadu 1 Thiruvallur2 Chennai3 Kancheepuram4 Vellore5 Tiruvannamalai
TABLE I : CODE LIST OF STATES, UTs AND DISTRICTS
State Code State Name District
Code District Name
33 Tamil Nadu 6 Viluppuram7 Salem8 Namakkal9 Erode10 The Nilgiris11 Dindigul12 Karur13 Tiruchirappalli14 Perambalur15 Ariyalur16 Cuddalore
34 Puducherry 1 Yanam2 Puducherry3 Mahe4 Karaikal
35 A & N Island 1 Nicobars2 North & Middle
Andaman3 South Andaman
36 Telangana 1 Adilabad2 Nizamabad3 Karimnagar4 Medak
SECTION : J
FISHERIES WELFARE
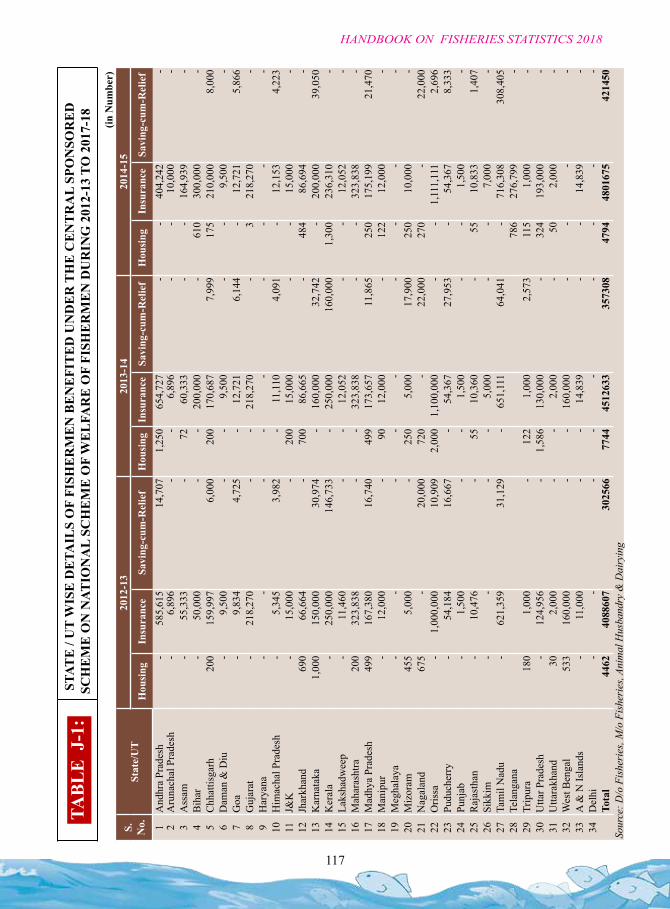
117
HANDBOOK ON FISHERIES STATISTICS 2018
TABL
E J
-1:
STA
TE
/ U
T W
ISE
DE
TAIL
S O
F FI
SHE
RM
EN
BE
NE
FIT
ED
UN
DE
R T
HE
CE
NT
RA
L SP
ON
SOR
ED
SC
HE
ME
ON
NAT
ION
AL
SCH
EM
E O
F W
EL
FAR
E O
F FI
SHE
RM
EN
DU
RIN
G 2
012-
13 T
O 2
017-
18 (in N
umbe
r)
S.
No.
Stat
e/U
T20
12-1
320
13-1
420
14-1
5
Hou
sing
Insu
ranc
eSa
ving
-cum
-Rel
ief
Hou
sing
Insu
ranc
eSa
ving
-cum
-Rel
ief
Hou
sing
Insu
ranc
eSa
ving
-cum
-Rel
ief
1A
ndhr
a Pr
ades
h-
585,
615
14,7
071,
250
654,
727
--
404,
242
-2
Aru
nach
al P
rade
sh-
6,89
6-
-6,
896
--
10,0
00-
3A
ssam
-55
,333
-72
60,3
33-
-16
4,93
9-
4B
ihar
-50
,000
--
200,
000
-61
030
0,00
0-
5C
hhat
tisga
rh20
015
9,99
76,
000
200
170,
687
7,99
917
521
0,00
08,
000
6D
aman
& D
iu-
9,50
0-
-9,
500
--
9,50
0-
7G
oa-
9,83
44,
725
-12
,721
6,14
4-
12,7
215,
866
8G
ujar
at-
218,
270
--
218,
270
-3
218,
270
-9
Har
yana
--
--
--
--
-10
Him
acha
l Pra
desh
-5,
345
3,98
2-
11,1
104,
091
-12
,153
4,22
311
J&K
-15
,000
-20
015
,000
--
15,0
00-
12Jh
arkh
and
690
66,6
64-
700
86,6
65-
484
86,6
94-
13K
arna
taka
1,00
015
0,00
030
,974
-16
0,00
032
,742
-20
0,00
039
,050
14K
eral
a-
250,
000
146,
733
-25
0,00
016
0,00
01,
300
236,
310
-15
Laks
hadw
eep
-11
,460
--
12,0
52-
-12
,052
-16
Mah
aras
htra
200
323,
838
--
323,
838
--
323,
838
-17
Mad
hya
Prad
esh
499
167,
380
16,7
4049
917
3,65
711
,865
250
175,
199
21,4
7018
Man
ipur
-12
,000
-90
12,0
00-
122
12,0
00-
19M
egha
laya
--
--
--
--
-20
Miz
oram
455
5,00
0-
250
5,00
017
,900
250
10,0
00-
21N
agal
and
675
-20
,000
720
-22
,000
270
-22
,000
22O
rissa
-1,
000,
000
10,9
092,
000
1,10
0,00
0-
-1,
111,
111
2,69
623
Pudu
cher
ry-
54,1
8416
,667
-54
,367
27,9
53-
54,3
678,
333
24Pu
njab
-1,
500
--
1,50
0-
-1,
500
-25
Raj
asth
an-
10,4
76-
5510
,360
-55
10,8
331,
407
26Si
kkim
--
--
5,00
0-
-7,
000
-27
Tam
il N
adu
-62
1,35
931
,129
-65
1,11
164
,041
-71
6,30
830
8,40
528
Tela
ngan
a78
627
6,79
9-
29Tr
ipur
a18
01,
000
-12
21,
000
2,57
311
51,
000
-30
Utta
r Pra
desh
-12
4,95
6-
1,58
613
0,00
0-
324
193,
000
-31
Utta
rakh
and
302,
000
--
2,00
0-
502,
000
-32
Wes
t Ben
gal
533
160,
000
--
160,
000
--
--
33A
& N
Isla
nds
-11
,000
--
14,8
39-
-14
,839
-34
Del
hi-
--
--
--
--
Tota
l44
6240
8860
730
2566
7744
4512
633
3573
0847
9448
0167
542
1450
Sour
ce: D
/o F
ishe
ries
, M/o
Fis
heri
es, A
nim
al H
usba
ndry
& D
airy
ing
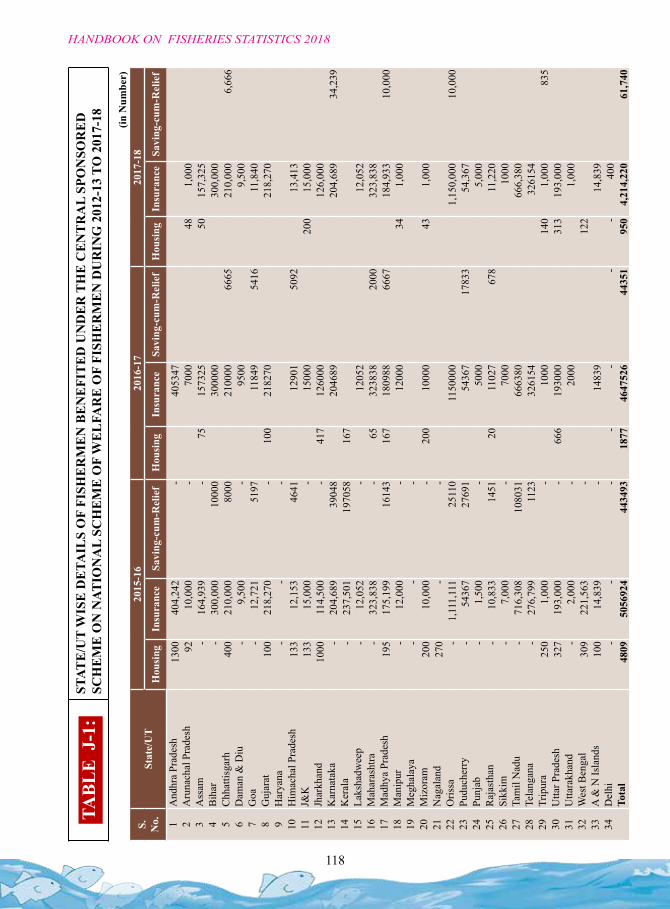
118
HANDBOOK ON FISHERIES STATISTICS 2018
(in N
umbe
r)
S.
No.
Stat
e/U
T20
15-1
620
16-1
720
17-1
8
Hou
sing
Insu
ranc
eSa
ving
-cum
-Rel
ief
Hou
sing
Insu
ranc
eSa
ving
-cum
-Rel
ief
Hou
sing
Insu
ranc
eSa
ving
-cum
-Rel
ief
1A
ndhr
a Pr
ades
h13
0040
4,24
2-
4053
472
Aru
nach
al P
rade
sh92
10,0
00-
7000
481,
000
3A
ssam
-16
4,93
9-
7515
7325
5015
7,32
54
Bih
ar-
300,
000
1000
030
0000
300,
000
5C
hhat
tisga
rh40
021
0,00
080
0021
0000
6665
210,
000
6,66
66
Dam
an &
Diu
-9,
500
-95
009,
500
7G
oa-
12,7
2151
9711
849
5416
11,8
408
Guj
arat
100
218,
270
-10
021
8270
218,
270
9H
arya
na-
--
10H
imac
hal P
rade
sh13
312
,153
4641
1290
150
9213
,413
11J&
K13
315
,000
-15
000
200
15,0
0012
Jhar
khan
d10
0011
4,50
0-
417
1260
0012
6,00
013
Kar
nata
ka-
204,
689
3904
820
4689
204,
689
34,2
3914
Ker
ala
-23
7,50
119
7058
167
15La
ksha
dwee
p-
12,0
52-
1205
212
,052
16M
ahar
asht
ra-
323,
838
-65
3238
3820
0032
3,83
817
Mad
hya
Prad
esh
195
175,
199
1614
316
718
0988
6667
184,
933
10,0
0018
Man
ipur
-12
,000
-12
000
341,
000
19M
egha
laya
--
-20
Miz
oram
200
10,0
00-
200
1000
043
1,00
021
Nag
alan
d27
0-
-22
Oris
sa-
1,11
1,11
125
110
1150
000
1,15
0,00
010
,000
23Pu
duch
erry
-54
367
2769
154
367
1783
354
,367
24Pu
njab
-1,
500
-50
005,
000
25R
ajas
than
-10
,833
1451
2011
027
678
11,2
2026
Sikk
im-
7,00
0-
7000
1000
27Ta
mil
Nad
u-
716,
308
1080
3166
6380
666,
380
28Te
lang
ana
-27
6,79
911
2332
6154
3261
5429
Trip
ura
250
1,00
0-
1000
140
1,00
083
530
Utta
r Pra
desh
327
193,
000
-66
619
3000
313
193,
000
31U
ttara
khan
d-
2,00
0-
2000
1,00
032
Wes
t Ben
gal
309
221,
563
-12
233
A &
N Is
land
s10
014
,839
-14
839
14,8
3934
Del
hi-
--
--
--
400
Tota
l48
0950
5692
444
3493
1877
4647
526
4435
195
04,
214,
220
61,7
40
TABL
E J
-1:
STAT
E/U
T W
ISE
DE
TAIL
S O
F FI
SHE
RM
EN
BE
NE
FIT
ED
UN
DE
R T
HE
CE
NT
RA
L SP
ON
SOR
ED
SC
HE
ME
ON
NAT
ION
AL
SCH
EM
E O
F W
EL
FAR
E O
F FI
SHE
RM
EN
DU
RIN
G 2
012-
13 T
O 2
017-
18
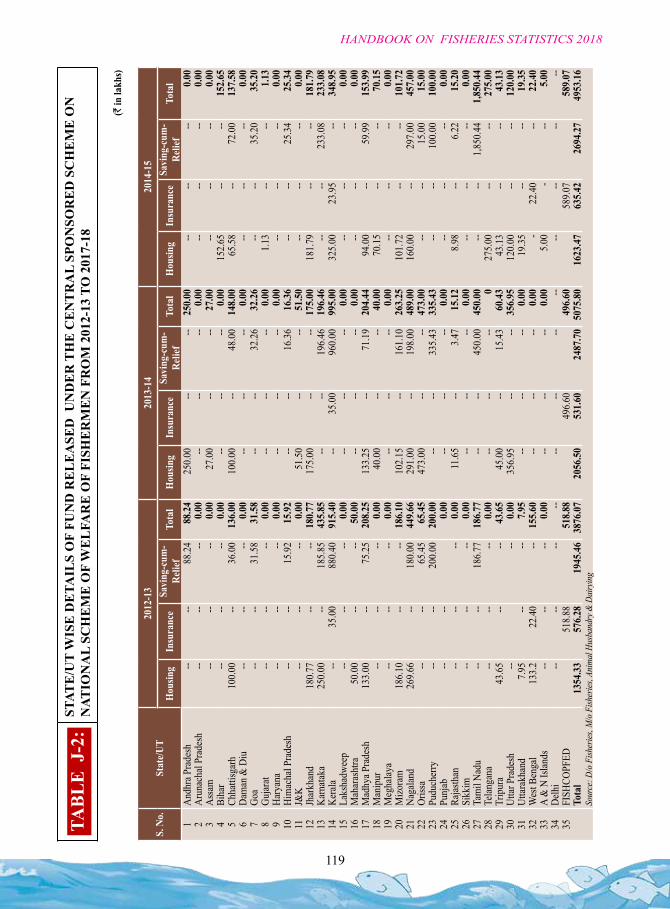
119
HANDBOOK ON FISHERIES STATISTICS 2018
TABL
E J
-2:
STAT
E/U
T W
ISE
DE
TAIL
S O
F FU
ND
RE
LE
ASE
D U
ND
ER
TH
E C
EN
TR
AL
SPO
NSO
RE
D S
CH
EM
E O
N
NAT
ION
AL
SCH
EM
E O
F W
EL
FAR
E O
F FI
SHE
RM
EN
FR
OM
201
2-13
TO
201
7-18
(` in
lakh
s)
S. N
o.St
ate/U
T20
12-1
320
13-1
420
14-1
5
Hou
sing
Insu
ranc
eSa
ving
-cum
-Re
lief
Tota
lH
ousin
gIn
sura
nce
Savi
ng-c
um-
Relie
fTo
tal
Hou
sing
Insu
ranc
eSa
ving
-cum
-Re
lief
Tota
l1
Andh
ra P
rade
sh--
--88
.24
88.2
425
0.00
----
250.
00--
----
0.00
2Ar
unac
hal P
rade
sh--
----
0.00
----
--0.
00--
----
0.00
3As
sam
----
--0.
0027
.00
----
27.0
0--
----
0.00
4Bi
har
----
--0.
00--
----
0.00
152.
65--
--15
2.65
5Ch
hatti
sgar
h10
0.00
--36
.00
136.
0010
0.00
--48
.00
148.
0065
.58
--72
.00
137.
586
Dam
an &
Diu
----
--0.
00--
----
0.00
----
--0.
007
Goa
----
31.5
831
.58
----
32.2
632
.26
----
35.2
035
.20
8Gu
jarat
----
--0.
00--
----
0.00
1.13
----
1.13
9Ha
ryan
a--
----
0.00
----
--0.
00--
----
0.00
10Hi
mac
hal P
rade
sh--
--15
.92
15.9
2--
--16
.36
16.3
6--
--25
.34
25.3
411
J&K
----
--0.
0051
.50
----
51.5
0--
----
0.00
12Jh
arkh
and
180.
77--
--18
0.77
175.
00--
--17
5.00
181.
79--
--18
1.79
13Ka
rnata
ka25
0.00
--18
5.85
435.
85--
--19
6.46
196.
46--
--23
3.08
233.
0814
Kera
la--
35.0
088
0.40
915.
40--
35.0
096
0.00
995.
0032
5.00
23.9
5--
348.
9515
Laks
hadw
eep
----
--0.
00--
----
0.00
----
--0.
0016
Mah
aras
htra
50.0
0--
--50
.00
----
--0.
00--
----
0.00
17M
adhy
a Pra
desh
133.
00--
75.2
520
8.25
133.
25--
71.1
920
4.44
94.0
0--
59.9
915
3.99
18M
anip
ur--
----
0.00
40.0
0--
--40
.00
70.1
5--
--70
.15
19M
egha
laya
----
--0.
00--
----
0.00
----
--0.
0020
Mizo
ram
186.
10--
--18
6.10
102.
15--
161.
1026
3.25
101.
72--
--10
1.72
21Na
galan
d26
9.66
--18
0.00
449.
6629
1.00
--19
8.00
489.
0016
0.00
--29
7.00
457.
0022
Oriss
a--
--65
.45
65.4
547
3.00
----
473.
00--
--15
.00
15.0
023
Pudu
cher
ry--
--20
0.00
200.
00--
--33
5.43
335.
43--
--10
0.00
100.
0024
Punj
ab--
--0.
00--
----
0.00
----
--0.
0025
Rajas
than
----
--0.
0011
.65
--3.
4715
.12
8.98
--6.
2215
.20
26Si
kkim
----
--0.
00--
----
0.00
----
--0.
0027
Tam
il Na
du--
--18
6.77
186.
77--
--45
0.00
450.
00--
--1,
850.
441,
850.
4428
Telan
gana
----
--0.
00--
----
027
5.00
----
275.
0029
Trip
ura
43.6
5--
--43
.65
45.0
0--
15.4
360
.43
43.1
3--
--43
.13
30Ut
tar P
rade
sh--
--0.
0035
6.95
----
356.
9512
0.00
----
120.
0031
Uttar
akha
nd7.
95--
--7.
95--
----
0.00
19.3
5--
--19
.35
32W
est B
enga
l13
3.2
22.4
0--
155.
60--
----
0.00
-22
.40
--22
.40
33A
& N
Islan
ds--
----
0.00
----
--0.
005.
00-
--5.
0034
Delh
i--
----
----
----
----
----
--35
FISH
COPF
ED51
8.88
518.
8849
6.60
496.
6058
9.07
589.
07To
tal
1354
.33
576.
2819
45.4
638
76.0
720
56.5
053
1.60
2487
.70
5075
.80
1623
.47
635.
4226
94.2
749
53.1
6So
urce
: D/o
Fish
eries
, M/o
Fish
eries
, Ani
mal H
usba
ndry
& D
airy
ing
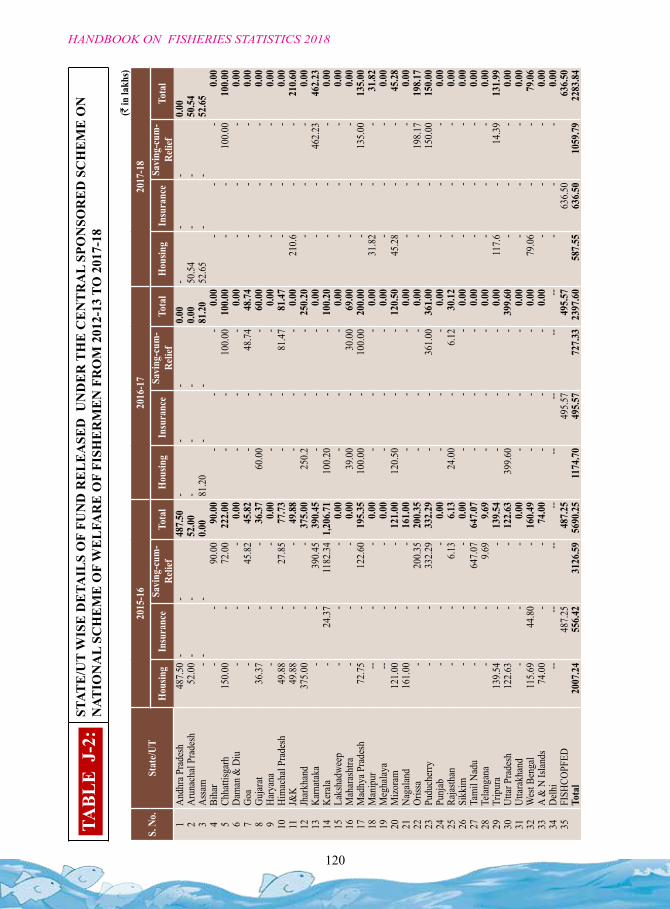
120
HANDBOOK ON FISHERIES STATISTICS 2018
(` in
lakh
s)
S. N
o.St
ate/U
T20
15-1
620
16-1
720
17-1
8
Hou
sing
Insu
ranc
eSa
ving
-cum
-Re
lief
Tota
lH
ousin
gIn
sura
nce
Savi
ng-c
um-
Relie
fTo
tal
Hou
sing
Insu
ranc
eSa
ving
-cum
-Re
lief
Tota
l
1An
dhra
Pra
desh
487.
50-
-48
7.50
--
-0.
00-
--
0.00
2Ar
unac
hal P
rade
sh52
.00
--
52.0
0-
--
0.00
50.5
4-
-50
.54
3As
sam
--
-0.
0081
.20
--
81.2
052
.65
--
52.6
54
Biha
r-
-90
.00
90.0
0-
--
0.00
--
-0.
005
Chha
ttisg
arh
150.
00-
72.0
022
2.00
--
100.
0010
0.00
--
100.
0010
0.00
6Da
man
& D
iu-
--
0.00
--
-0.
00-
--
0.00
7Go
a-
-45
.82
45.8
2-
-48
.74
48.7
4-
--
0.00
8Gu
jarat
36.3
7-
-36
.37
60.0
0-
-60
.00
--
-0.
009
Hary
ana
--
-0.
00-
--
0.00
--
-0.
0010
Him
acha
l Pra
desh
49.8
8-
27.8
577
.73
--
81.4
781
.47
--
-0.
0011
J&K
49.8
8-
-49
.88
--
-0.
0021
0.6
--
210.
6012
Jhar
khan
d37
5.00
--
375.
0025
0.2
--
250.
20-
--
0.00
13Ka
rnata
ka-
-39
0.45
390.
45-
--
0.00
--
462.
2346
2.23
14Ke
rala
-24
.37
1182
.34
1,20
6.71
100.
20-
-10
0.20
--
-0.
0015
Laks
hadw
eep
--
-0.
00-
--
0.00
--
-0.
0016
Mah
aras
htra
--
-0.
0039
.00
-30
.00
69.0
0-
--
0.00
17M
adhy
a Pra
desh
72.7
5-
122.
6019
5.35
100.
00-
100.
0020
0.00
--
135.
0013
5.00
18M
anip
ur--
--
0.00
--
-0.
0031
.82
--
31.8
219
Meg
halay
a--
--
0.00
--
-0.
00-
--
0.00
20M
izora
m12
1.00
--
121.
0012
0.50
--
120.
5045
.28
--
45.2
821
Naga
land
161.
00-
-16
1.00
--
-0.
00-
--
0.00
22Or
issa
--
200.
3520
0.35
--
-0.
00-
-19
8.17
198.
1723
Pudu
cher
ry-
-33
2.29
332.
29-
-36
1.00
361.
00-
-15
0.00
150.
0024
Punj
ab-
--
0.00
--
-0.
00-
--
0.00
25Ra
jasth
an-
-6.
136.
1324
.00
-6.
1230
.12
--
-0.
0026
Sikk
im-
--
0.00
--
-0.
00-
--
0.00
27Ta
mil
Nadu
--
647.
0764
7.07
--
-0.
00-
--
0.00
28Te
langa
na-
-9.
699.
69-
--
0.00
--
-0.
0029
Trip
ura
139.
54-
-13
9.54
--
-0.
0011
7.6
-14
.39
131.
9930
Uttar
Pra
desh
122.
63-
-12
2.63
399.
60-
-39
9.60
--
-0.
0031
Uttar
akha
nd-
--
0.00
--
-0.
00-
--
0.00
32W
est B
enga
l11
5.69
44.8
0-
160.
49-
--
0.00
79.0
6-
-79
.06
33A
& N
Islan
ds74
.00
--
74.0
0-
--
0.00
--
-0.
0034
Delh
i--
----
----
----
---
--
0.00
35FI
SHCO
PFED
487.
2548
7.25
495.
5749
5.57
636.
5063
6.50
Tota
l20
07.2
455
6.42
3126
.59
5690
.25
1174
.70
495.
5772
7.33
2397
.60
587.
5563
6.50
1059
.79
2283
.84
TABL
E J
-2:
STAT
E/U
T W
ISE
DE
TAIL
S O
F FU
ND
RE
LE
ASE
D U
ND
ER
TH
E C
EN
TR
AL
SPO
NSO
RE
D S
CH
EM
E O
N
NAT
ION
AL
SCH
EM
E O
F W
EL
FAR
E O
F FI
SHE
RM
EN
FR
OM
201
2-13
TO
201
7-18
SECTION : K
MISCELLANEOUS
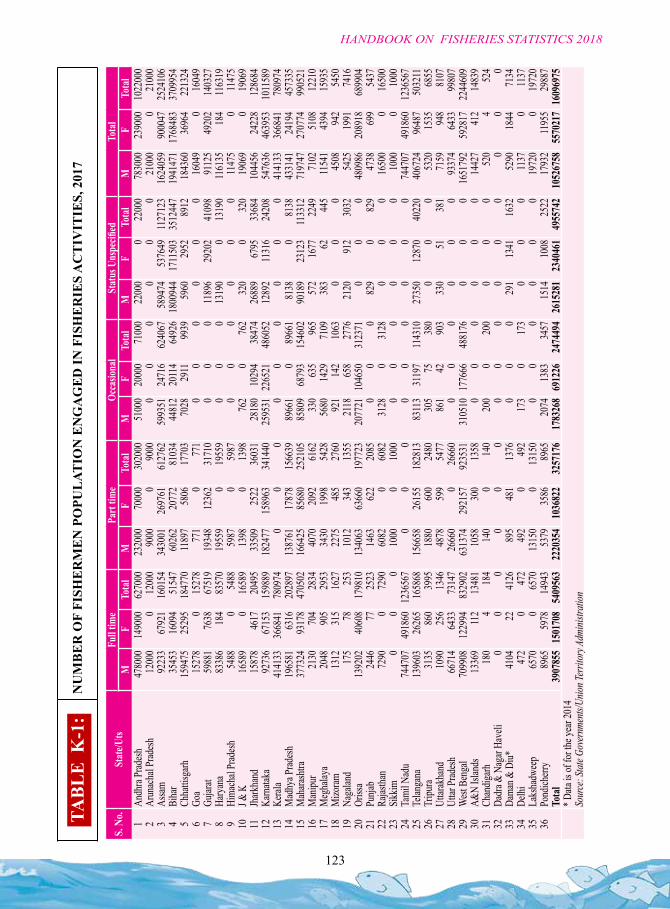
123
HANDBOOK ON FISHERIES STATISTICS 2018
S. N
o.St
ate/U
tsFu
ll tim
ePa
rt tim
eOc
casio
nal
Stat
us U
nspe
cified
Tota
lM
FTo
tal
MF
Tota
lM
FTo
tal
MF
Tota
lM
FTo
tal
1An
dhra
Prad
esh
4780
0014
9000
6270
0023
2000
7000
030
2000
5100
020
000
7100
022
000
022
000
7830
0023
9000
1022
000
2Ar
unac
hal P
rades
h12
000
012
000
9000
090
000
00
00
021
000
021
000
3As
sam
9223
367
921
1601
5434
3001
2697
6161
2762
5993
5124
716
6240
6758
9474
5376
4911
2712
316
2405
990
0047
2524
106
4Bi
har
3545
316
094
5154
760
262
2077
281
034
4481
220
114
6492
618
0094
417
1150
335
1244
719
4147
117
6848
337
0995
45
Chha
ttisg
arh15
9475
2529
518
4770
1189
758
0617
703
7028
2911
9939
5960
2952
8912
1843
6036
964
2213
246
Goa
1527
80
1527
877
10
771
00
00
00
1604
90
1604
97
Gujar
at59
881
7638
6751
919
348
1236
231
710
00
011
896
2920
241
098
9112
549
202
1403
278
Hary
ana
8338
618
483
570
1955
90
1955
90
00
1319
00
1319
011
6135
184
1163
199
Hima
chal
Prad
esh
5488
054
8859
870
5987
00
00
00
1147
50
1147
510
J & K
1658
90
1658
913
980
1398
762
076
232
00
320
1906
90
1906
911
Jhark
hand
1587
846
1720
495
3350
925
2236
031
2818
010
294
3847
426
889
6795
3368
410
4456
2422
812
8684
12Ka
rnata
ka92
736
6715
315
9889
1824
7715
8963
3414
4025
9531
2265
2148
6052
1289
211
316
2420
854
7636
4639
5310
1158
913
Keral
a 41
4133
3668
4178
0974
00
00
00
00
041
4133
3668
4178
0974
14M
adhy
a Prad
esh
1965
8163
1620
2897
1387
6117
878
1566
3989
661
089
661
8138
081
3843
3141
2419
445
7335
15M
ahara
shtra
37
7324
9317
847
0502
1664
2585
680
2521
0585
809
6879
315
4602
9018
923
123
1133
1271
9747
2707
7499
0521
16M
anipu
r21
3070
428
3440
7020
9261
6233
063
596
557
216
7722
4971
0251
0812
210
17M
egha
laya
2048
905
2953
3430
1998
5428
5680
1429
7109
383
6244
511
541
4394
1593
518
Mizo
ram13
1231
516
2722
7548
527
6092
114
210
630
00
4508
942
5450
19Na
galan
d17
578
253
1012
343
1355
2118
658
2776
2120
912
3032
5425
1991
7416
20Or
issa
13
9202
4060
817
9810
1340
6363
660
1977
2320
7721
1046
5031
2371
00
048
0986
2089
1868
9904
21Pu
njab
2446
7725
2314
6362
220
850
00
829
082
947
3869
954
3722
Rajas
than
7290
072
9060
820
6082
3128
031
280
00
1650
00
1650
023
Sikk
im0
00
1000
010
000
00
00
010
000
1000
24Ta
mil N
adu
7447
0749
1860
1236
567
00
00
00
00
074
4707
4918
6012
3656
725
Telan
gana
1396
0326
265
1658
6815
6658
2615
518
2813
8311
331
197
1143
1027
350
1287
040
220
4067
2496
487
5032
1126
Tripu
ra31
3586
039
9518
8060
024
8030
575
380
00
053
2015
3568
5527
Uttar
akha
nd10
9025
613
4648
7859
954
7786
142
903
330
5138
171
5994
881
0728
Uttar
Prad
esh
6671
464
3373
147
2666
00
2666
00
00
00
093
374
6433
9980
729
Wes
t Ben
gal
7099
0812
2994
8329
0263
1374
2921
5792
3531
3105
1017
7666
4881
760
00
1651
792
5928
1722
4460
930
A&N
Islan
ds13
369
112
1348
110
5830
013
580
00
00
014
427
412
1483
931
Chan
digarh
18
04
184
140
014
020
00
200
00
052
04
524
32Da
dra &
Nag
ar Ha
veli
00
00
00
00
00
00
00
033
Dama
n & D
iu*41
0422
4126
895
481
1376
00
029
113
4116
3252
9018
4471
3434
Delhi
472
047
249
20
492
173
017
30
00
1137
011
3735
Laks
hadw
eep
6570
065
7013
150
013
150
00
00
00
1972
00
1972
036
Pond
icherr
y89
6559
7814
943
5379
3586
8965
2074
1383
3457
1514
1008
2522
1793
211
955
2988
7To
tal
3907
855
1501
708
5409
563
2220
354
1036
822
3257
176
1783
268
6912
2624
7449
426
1528
123
4046
149
5574
210
5267
5855
7021
716
0969
75* D
ata is
of fo
r the
year
2014
Sour
ce: S
tate G
over
nmen
ts/Un
ion Te
rritor
y Adm
inistr
ation
TABL
E K
-1:
NU
MB
ER
OF
FISH
ER
ME
N P
OPU
LAT
ION
EN
GA
GE
D IN
FIS
HE
RIE
S A
CT
IVIT
IES,
201
7
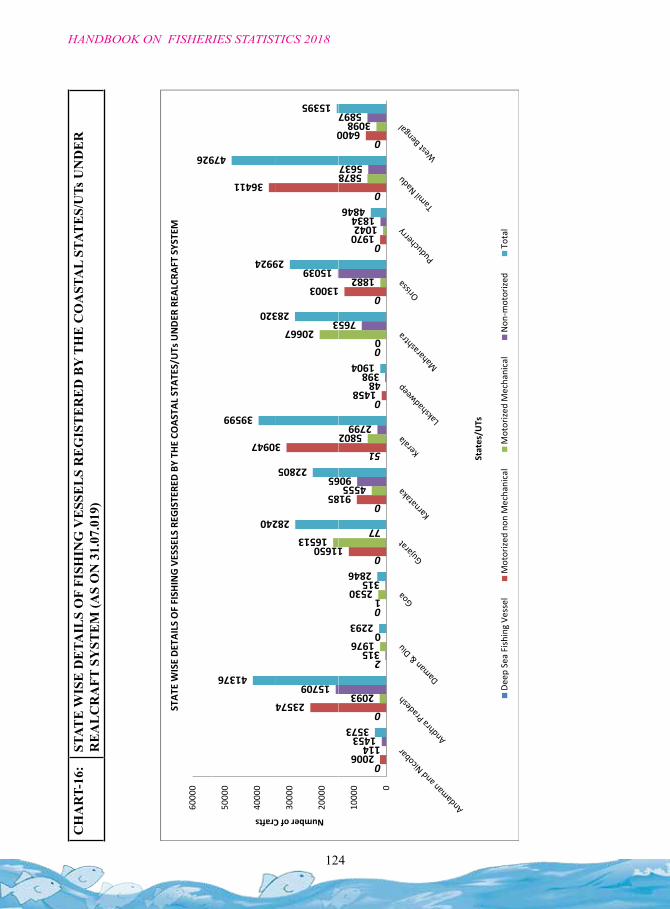
124
HANDBOOK ON FISHERIES STATISTICS 2018
926
6000
0
STAT
E WISE DETAILS OF FISH
ING VESSELS REG
ISTERE
D BY TH
E CO
ASTA
L STAT
ES/U
Ts UNDER
REA
LCRA
FT SYSTEM
0947
36411
41376
240
39599
320
9924
479
4000
0
5000
0
Crafts
23574
11650
85
3
13003
0
16513
20667
15709
65
3
15039
282
22805
283
29
15395
2000
0
3000
0
Number of C
0
0
2
0
0
0
51
0
0
0
0
0
0
2006
315
1
1
918
1458
0
1970
6400
114
2093
1976
2530
4555
5802
48
1882
1042
5878
3098
1453
0
315
77
906
2799
398
765
1834
5637
5897
3573
2293
2846
1904
4846
0
1000
0
States/U
Ts
Deep
Sea
Fish
ing Ve
ssel
Motorized
non
Mecha
nical
Motorized
Mecha
nical
Non
‐motorize
dTo
tal
CH
AR
T-16
: ST
ATE
WIS
E D
ETA
ILS
OF
FISH
ING
VE
SSE
LS
RE
GIS
TE
RE
D B
Y T
HE
CO
AST
AL
STAT
ES/
UTs
UN
DE
R
RE
AL
CR
AFT
SY
STE
M (A
S O
N 3
1.07
.019
)
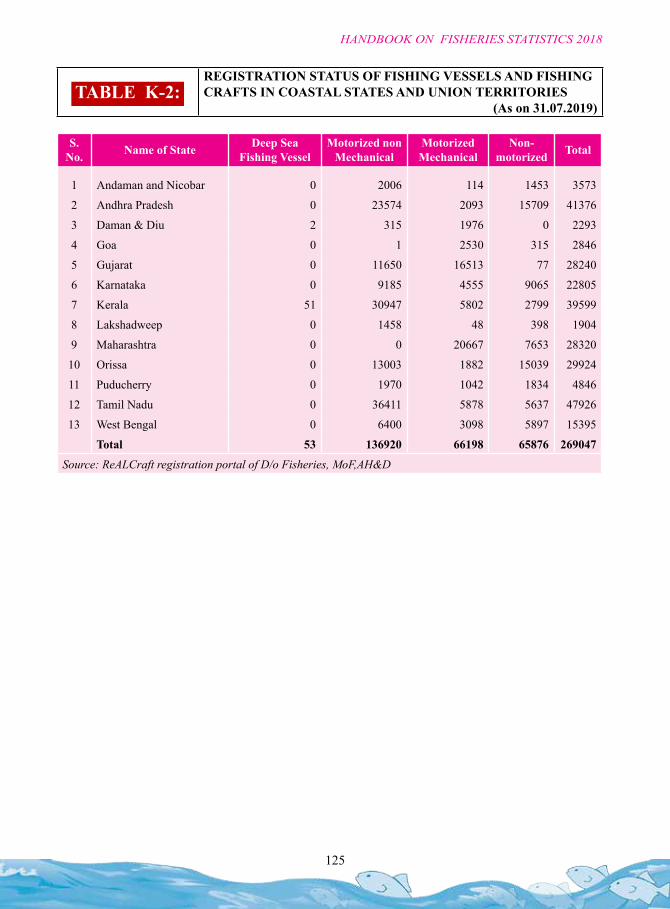
125
HANDBOOK ON FISHERIES STATISTICS 2018
S. No. Name of State Deep Sea
Fishing VesselMotorized non
MechanicalMotorized Mechanical
Non-motorized Total
1 Andaman and Nicobar 0 2006 114 1453 3573
2 Andhra Pradesh 0 23574 2093 15709 41376
3 Daman & Diu 2 315 1976 0 2293
4 Goa 0 1 2530 315 2846
5 Gujarat 0 11650 16513 77 28240
6 Karnataka 0 9185 4555 9065 22805
7 Kerala 51 30947 5802 2799 39599
8 Lakshadweep 0 1458 48 398 1904
9 Maharashtra 0 0 20667 7653 28320
10 Orissa 0 13003 1882 15039 29924
11 Puducherry 0 1970 1042 1834 4846
12 Tamil Nadu 0 36411 5878 5637 47926
13 West Bengal 0 6400 3098 5897 15395
Total 53 136920 66198 65876 269047
Source: ReALCraft registration portal of D/o Fisheries, MoF,AH&D
TABLE K-2: REGISTRATION STATUS OF FISHING VESSELS AND FISHING CRAFTS IN COASTAL STATES AND UNION TERRITORIES
(As on 31.07.2019)
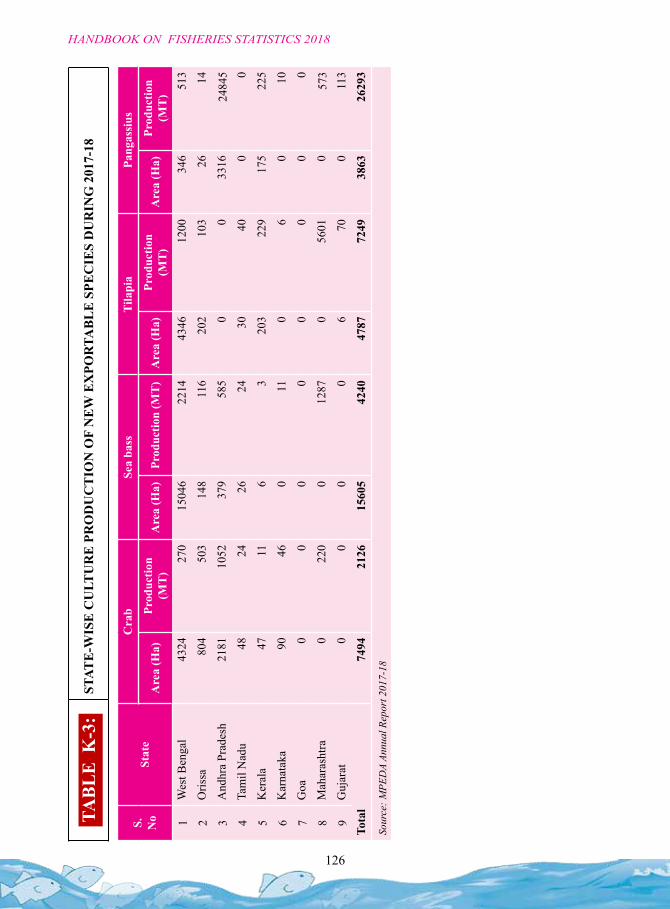
126
HANDBOOK ON FISHERIES STATISTICS 2018
S.
No
Stat
eC
rab
Sea
bass
Tila
pia
Pang
assi
us
Are
a (H
a)Pr
oduc
tion
(MT
)A
rea
(Ha)
Prod
uctio
n (M
T)
Are
a (H
a)Pr
oduc
tion
(MT
)A
rea
(Ha)
Prod
uctio
n (M
T)
1W
est B
enga
l43
2427
015
046
2214
4346
1200
346
513
2O
rissa
804
503
148
116
202
103
2614
3A
ndhr
a Pr
ades
h21
8110
5237
958
50
033
1624
845
4Ta
mil
Nad
u48
2426
2430
400
0
5K
eral
a47
116
320
322
917
522
5
6K
arna
taka
9046
011
06
010
7G
oa0
00
00
00
0
8M
ahar
asht
ra0
220
012
870
5601
057
3
9G
ujar
at0
00
06
700
113
Tota
l74
9421
2615
605
4240
4787
7249
3863
2629
3
Sour
ce: M
PED
A An
nual
Rep
ort 2
017-
18
TABL
E K
-3:
STAT
E-W
ISE
CU
LTU
RE
PR
OD
UC
TIO
N O
F N
EW
EX
POR
TAB
LE
SPE
CIE
S D
UR
ING
201
7-18
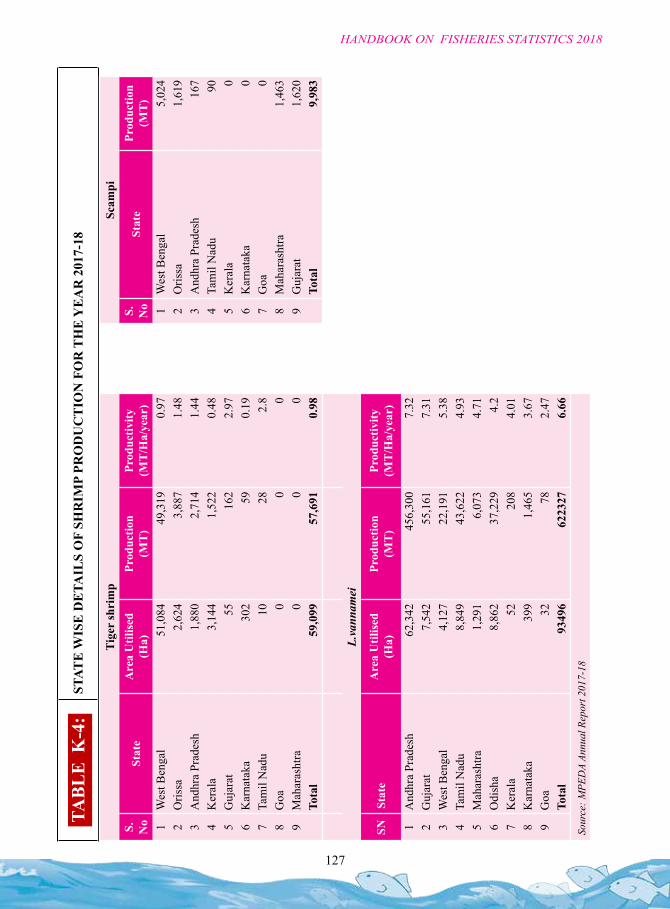
127
HANDBOOK ON FISHERIES STATISTICS 2018
TABL
E K
-4:
STAT
E W
ISE
DE
TAIL
S O
F SH
RIM
P PR
OD
UC
TIO
N F
OR
TH
E Y
EA
R 2
017-
18
Tige
r sh
rim
p Sc
ampi
S.
No
Stat
eA
rea
Util
ised
(H
a)Pr
oduc
tion
(MT
)Pr
oduc
tivity
(M
T/H
a/ye
ar)
S.
No
Stat
ePr
oduc
tion
(MT
)1
Wes
t Ben
gal
51,0
8449
,319
0.97
1W
est B
enga
l5,
024
2O
rissa
2,62
43,
887
1.48
2O
rissa
1,61
93
And
hra
Prad
esh
1,88
02,
714
1.44
3A
ndhr
a Pr
ades
h16
74
Ker
ala
3,14
41,
522
0.48
4Ta
mil
Nad
u90
5G
ujar
at55
162
2.97
5K
eral
a0
6K
arna
taka
302
590.
196
Kar
nata
ka0
7Ta
mil
Nad
u10
282.
87
Goa
08
Goa
00
08
Mah
aras
htra
1,46
39
Mah
aras
htra
00
09
Guj
arat
1,62
0To
tal
59,0
9957
,691
0.98
Tota
l9,
983
L.va
nnam
ei
SNSt
ate
Are
a U
tilis
ed
(Ha)
Prod
uctio
n (M
T)
Prod
uctiv
ity
(MT
/Ha/
year
)
1A
ndhr
a Pr
ades
h62
,342
456,
300
7.32
2G
ujar
at7,
542
55,1
617.
313
Wes
t Ben
gal
4,12
722
,191
5.38
4Ta
mil
Nad
u8,
849
43,6
224.
935
Mah
aras
htra
1,29
16,
073
4.71
6O
dish
a8,
862
37,2
294.
27
Ker
ala
5220
84.
018
Kar
nata
ka39
91,
465
3.67
9G
oa32
782.
47To
tal
9349
662
2327
6.66
Sour
ce: M
PED
A An
nual
Rep
ort 2
017-
18
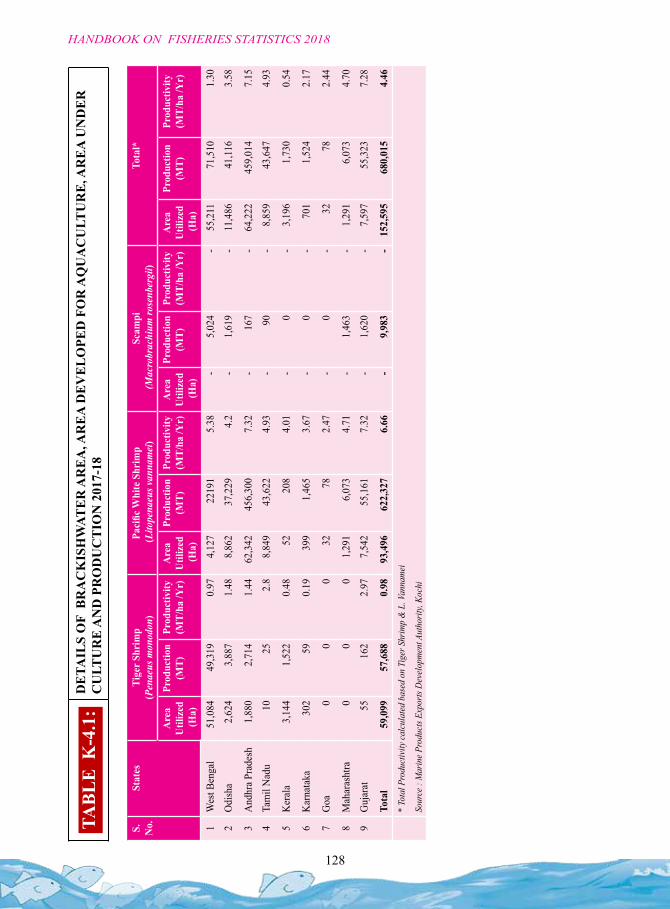
128
HANDBOOK ON FISHERIES STATISTICS 2018
S.
No.
Stat
esTi
ger S
hrim
p
(Pen
aeus
mon
odon
)Pa
cific
Whi
te S
hrim
p (L
itope
naeu
s van
nam
ei)
Scam
pi
(Mac
robr
achi
um ro
senb
ergi
i)To
tal*
Are
a U
tiliz
ed
(Ha)
Prod
uctio
n (M
T)Pr
oduc
tivity
(M
T/ha
/Yr)
Are
a U
tiliz
ed
(Ha)
Prod
uctio
n (M
T)Pr
oduc
tivity
(M
T/ha
/Yr)
Are
a U
tiliz
ed
(Ha)
Prod
uctio
n (M
T)Pr
oduc
tivity
(M
T/ha
/Yr)
Are
a U
tiliz
ed
(Ha)
Prod
uctio
n
(MT)
Prod
uctiv
ity
(MT/
ha /Y
r)
1W
est B
enga
l51
,084
49,3
190.
974,
127
2219
15.
38-
5,02
4-
55,2
1171
,510
1.30
2O
dish
a2,
624
3,88
71.
488,
862
37,2
294.
2-
1,61
9-
11,4
8641
,116
3.58
3A
ndhr
a Pr
ades
h1,
880
2,71
41.
4462
,342
456,
300
7.32
-16
7-
64,2
2245
9,01
47.
15
4Ta
mil
Nad
u10
252.
88,
849
43,6
224.
93-
90-
8,85
943
,647
4.93
5K
eral
a3,
144
1,52
20.
4852
208
4.01
-0
-3,
196
1,73
00.
54
6K
arna
taka
302
590.
1939
91,
465
3.67
-0
-70
11,
524
2.17
7G
oa0
00
3278
2.47
-0
-32
782.
44
8M
ahar
asht
ra0
00
1,29
16,
073
4.71
-1,
463
-1,
291
6,07
34.
70
9G
ujar
at55
162
2.97
7,54
255
,161
7.32
-1,
620
-7,
597
55,3
237.
28
Tota
l59
,099
57,6
880.
9893
,496
622,
327
6.66
-9,
983
-15
2,59
568
0,01
54.
46*
Tota
l Pro
duct
ivity
calc
ulat
ed b
ased
on
Tige
r Shr
imp
& L
. Van
nam
ei
Sour
ce :
Mar
ine P
rodu
cts E
xpor
ts D
evel
opm
ent A
utho
rity,
Koch
i
TABL
E K
-4.1
: D
ETA
ILS
OF
BR
AC
KIS
HW
ATE
R A
RE
A, A
RE
A D
EV
EL
OPE
D F
OR
AQ
UA
CU
LTU
RE
, AR
EA
UN
DE
R
CU
LTU
RE
AN
D P
RO
DU
CT
ION
201
7-18
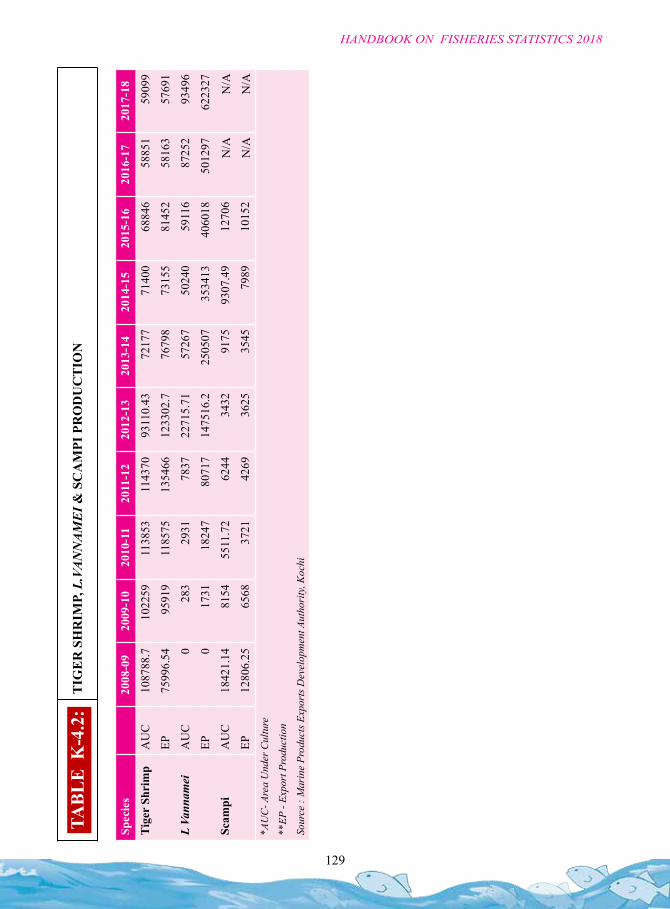
129
HANDBOOK ON FISHERIES STATISTICS 2018
Spec
ies
2008
-09
2009
-10
2010
-11
2011
-12
2012
-13
2013
-14
2014
-15
2015
-16
2016
-17
2017
-18
Tige
r Sh
rim
pA
UC
1087
88.7
1022
5911
3853
1143
7093
110.
4372
177
7140
068
846
5885
159
099
EP75
996.
5495
919
1185
7513
5466
1233
02.7
7679
873
155
8145
258
163
5769
1
L Va
nnam
eiA
UC
028
329
3178
3722
715.
7157
267
5024
059
116
8725
293
496
EP0
1731
1824
780
717
1475
16.2
2505
0735
3413
4060
1850
1297
6223
27
Scam
piA
UC
1842
1.14
8154
5511
.72
6244
3432
9175
9307
.49
1270
6N
/AN
/AEP
1280
6.25
6568
3721
4269
3625
3545
7989
1015
2N
/AN
/A*A
UC
- Are
a U
nder
Cul
ture
**EP
- Ex
port
Pro
duct
ion
Sour
ce :
Mar
ine
Prod
ucts
Exp
orts
Dev
elop
men
t Aut
hori
ty, K
ochi
TABL
E K
-4.2
: T
IGE
R S
HR
IMP,
L.V
AN
NA
ME
I & S
CA
MPI
PR
OD
UC
TIO
N
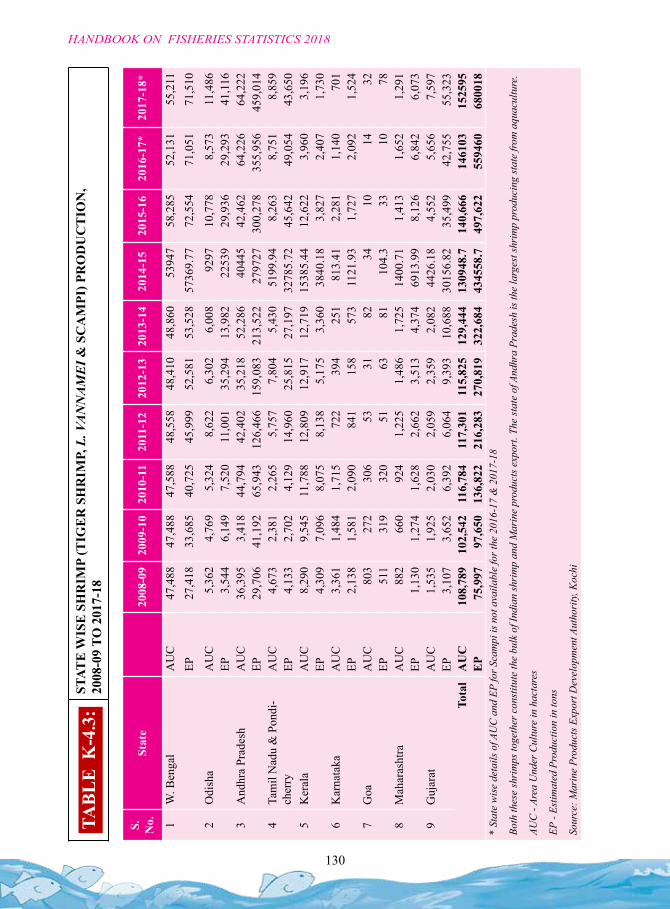
130
HANDBOOK ON FISHERIES STATISTICS 2018
S.
No.
Stat
e20
08-0
920
09-1
020
10-1
120
11-1
220
12-1
320
13-1
420
14-1
520
15-1
620
16-1
7*20
17-1
8*
1W
. Ben
gal
AU
C47
,488
47,4
8847
,588
48,5
5848
,410
48,8
6053
947
58,2
8552
,131
55,2
11EP
27,4
1833
,685
40,7
2545
,999
52,5
8153
,528
5736
9.77
72,5
5471
,051
71,5
10
2O
dish
aA
UC
5,36
24,
769
5,32
48,
622
6,30
26,
008
9297
10,7
788,
573
11,4
86EP
3,54
46,
149
7,52
011
,001
35,2
9413
,982
2253
929
,936
29,2
9341
,116
3A
ndhr
a Pr
ades
hA
UC
36,3
953,
418
44,7
9442
,402
35,2
1852
,286
4044
542
,462
64,2
2664
,222
EP29
,706
41,1
9265
,943
126,
466
159,
083
213,
522
2797
2730
0,27
835
5,95
645
9,01
44
Tam
il N
adu
& P
ondi
-ch
erry
AU
C4,
673
2,38
12,
265
5,75
77,
804
5,43
051
99.9
48,
263
8,75
18,
859
EP4,
133
2,70
24,
129
14,9
6025
,815
27,1
9732
785.
7245
,642
49,0
5443
,650
5K
eral
aA
UC
8,29
09,
545
11,7
8812
,809
12,9
1712
,719
1538
5.44
12,6
223,
960
3,19
6EP
4,30
97,
096
8,07
58,
138
5,17
53,
360
3840
.18
3,82
72,
407
1,73
06
Kar
nata
kaA
UC
3,36
11,
484
1,71
572
239
425
181
3.41
2,28
11,
140
701
EP2,
138
1,58
12,
090
841
158
573
1121
.93
1,72
72,
092
1,52
47
Goa
AU
C80
327
230
653
3182
3410
1432
EP51
131
932
051
6381
104.
333
1078
8M
ahar
asht
raA
UC
882
660
924
1,22
51,
486
1,72
514
00.7
11,
413
1,65
21,
291
EP1,
130
1,27
41,
628
2,66
23,
513
4,37
469
13.9
98,
126
6,84
26,
073
9G
ujar
atA
UC
1,53
51,
925
2,03
02,
059
2,35
92,
082
4426
.18
4,55
25,
656
7,59
7EP
3,10
73,
652
6,39
26,
064
9,39
310
,688
3015
6.82
35,4
9942
,755
55,3
23To
tal
AU
C10
8,78
910
2,54
211
6,78
411
7,30
111
5,82
512
9,44
413
0948
.714
0,66
614
6103
1525
95E
P75
,997
97,6
5013
6,82
221
6,28
327
0,81
932
2,68
443
4558
.749
7,62
255
9460
6800
18*
Stat
e w
ise
deta
ils o
f AU
C a
nd E
P fo
r Sca
mpi
is n
ot a
vaila
ble
for t
he 2
016-
17 &
201
7-18
Both
thes
e sh
rim
ps to
geth
er c
onst
itute
the
bulk
of I
ndia
n sh
rim
p an
d M
arin
e pr
oduc
ts e
xpor
t. Th
e st
ate
of A
ndhr
a Pr
ades
h is
the
larg
est s
hrim
p pr
oduc
ing
stat
e fro
m a
quac
ultu
re.
AUC
- Ar
ea U
nder
Cul
ture
in h
acta
res
EP -
Estim
ated
Pro
duct
ion
in to
ns
Sour
ce: M
arin
e Pr
oduc
ts E
xpor
t Dev
elop
men
t Aut
hori
ty, K
ochi
TABL
E K
-4.3
: ST
ATE
WIS
E S
HR
IMP
(TIG
ER
SH
RIM
P, L
. VA
NN
AM
EI &
SC
AM
PI) P
RO
DU
CT
ION
, 20
08-0
9 TO
201
7-18
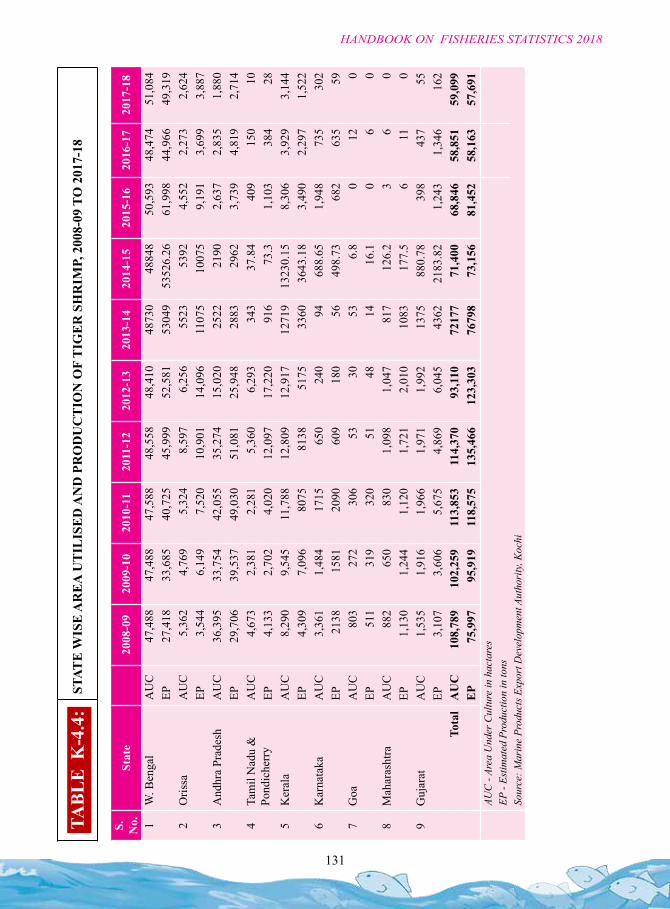
131
HANDBOOK ON FISHERIES STATISTICS 2018
TABL
E K
-4.4
: ST
ATE
WIS
E A
RE
A U
TIL
ISE
D A
ND
PR
OD
UC
TIO
N O
F T
IGE
R S
HR
IMP,
200
8-09
TO
201
7-18
S.
No.
Stat
e20
08-0
920
09-1
020
10-1
120
11-1
220
12-1
320
13-1
420
14-1
520
15-1
620
16-1
720
17-1
8
1W
. Ben
gal
AU
C47
,488
47,4
8847
,588
48,5
5848
,410
4873
048
848
50,5
9348
,474
51,0
84EP
27,4
1833
,685
40,7
2545
,999
52,5
8153
049
5352
6.26
61,9
9844
,966
49,3
192
Oris
saA
UC
5,36
24,
769
5,32
48,
597
6,25
655
2353
924,
552
2,27
32,
624
EP3,
544
6,14
97,
520
10,9
0114
,096
1107
510
075
9,19
13,
699
3,88
73
And
hra
Prad
esh
AU
C36
,395
33,7
5442
,055
35,2
7415
,020
2522
2190
2,63
72,
835
1,88
0EP
29,7
0639
,537
49,0
3051
,081
25,9
4828
8329
623,
739
4,81
92,
714
4Ta
mil
Nad
u &
Po
ndic
herr
yA
UC
4,67
32,
381
2,28
15,
360
6,29
334
337
.84
409
150
10EP
4,13
32,
702
4,02
012
,097
17,2
2091
673
.31,
103
384
285
Ker
ala
AU
C8,
290
9,54
511
,788
12,8
0912
,917
1271
913
230.
158,
306
3,92
93,
144
EP4,
309
7,09
680
7581
3851
7533
6036
43.1
83,
490
2,29
71,
522
6K
arna
taka
AU
C3,
361
1,48
417
1565
024
094
688.
651,
948
735
302
EP21
3815
8120
9060
918
056
498.
7368
263
559
7G
oaA
UC
803
272
306
5330
536.
80
120
EP51
131
932
051
4814
16.1
06
08
Mah
aras
htra
AU
C88
265
083
01,
098
1,04
781
712
6.2
36
0EP
1,13
01,
244
1,12
01,
721
2,01
010
8317
7.5
611
09
Guj
arat
AU
C1,
535
1,91
61,
966
1,97
11,
992
1375
880.
7839
843
755
EP3,
107
3,60
65,
675
4,86
96,
045
4362
2183
.82
1,24
31,
346
162
Tota
lA
UC
108,
789
102,
259
113,
853
114,
370
93,1
1072
177
71,4
0068
,846
58,8
5159
,099
EP
75,9
9795
,919
118,
575
135,
466
123,
303
7679
873
,156
81,4
5258
,163
57,6
91AU
C -
Area
Und
er C
ultu
re in
hac
tare
sEP
- Es
timat
ed P
rodu
ctio
n in
tons
Sour
ce: M
arin
e Pr
oduc
ts E
xpor
t Dev
elop
men
t Aut
hori
ty, K
ochi
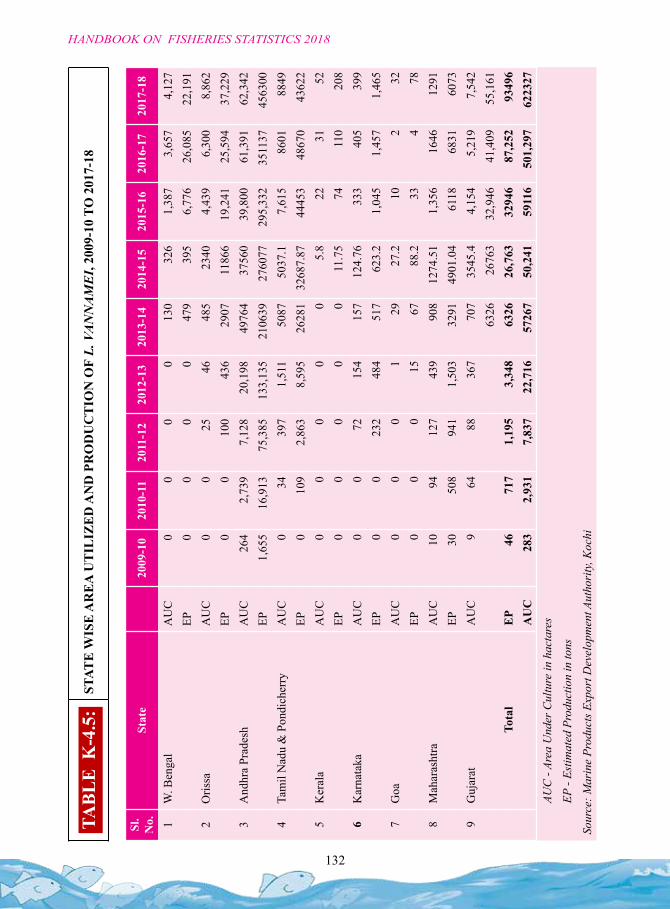
132
HANDBOOK ON FISHERIES STATISTICS 2018
TABL
E K
-4.5
: ST
ATE
WIS
E A
RE
A U
TIL
IZE
D A
ND
PR
OD
UC
TIO
N O
F L.
VA
NN
AM
EI,
2009
-10
TO 2
017-
18
Sl.
No.
Stat
e20
09-1
020
10-1
120
11-1
220
12-1
320
13-1
420
14-1
520
15-1
620
16-1
720
17-1
8
1W
. Ben
gal
AU
C0
00
013
032
61,
387
3,65
74,
127
EP0
00
047
939
56,
776
26,0
8522
,191
2O
rissa
AU
C0
025
4648
523
404,
439
6,30
08,
862
EP0
010
043
629
0711
866
19,2
4125
,594
37,2
293
And
hra
Prad
esh
AU
C26
42,
739
7,12
820
,198
4976
437
560
39,8
0061
,391
62,3
42EP
1,65
516
,913
75,3
8513
3,13
521
0639
2760
7729
5,33
235
1137
4563
004
Tam
il N
adu
& P
ondi
cher
ryA
UC
034
397
1,51
150
8750
37.1
7,61
586
0188
49EP
010
92,
863
8,59
526
281
3268
7.87
4445
348
670
4362
25
Ker
ala
AU
C0
00
00
5.8
2231
52EP
00
00
011
.75
7411
020
86
Kar
nata
kaA
UC
00
7215
415
712
4.76
333
405
399
EP0
023
248
451
762
3.2
1,04
51,
457
1,46
57
Goa
AU
C0
00
129
27.2
102
32EP
00
015
6788
.233
478
8M
ahar
asht
raA
UC
1094
127
439
908
1274
.51
1,35
616
4612
91EP
3050
894
11,
503
3291
4901
.04
6118
6831
6073
9G
ujar
atA
UC
964
8836
770
735
45.4
4,15
45,
219
7,54
263
2626
763
32,9
4641
,409
55,1
61To
tal
EP
4671
71,
195
3,34
863
2626
,763
3294
687
,252
9349
6A
UC
283
2,93
17,
837
22,7
1657
267
50,2
4159
116
501,
297
6223
27
AUC
- Ar
ea U
nder
Cul
ture
in h
acta
res
EP -
Estim
ated
Pro
duct
ion
in to
ns
Sour
ce: M
arin
e Pr
oduc
ts E
xpor
t Dev
elop
men
t Aut
hori
ty, K
ochi
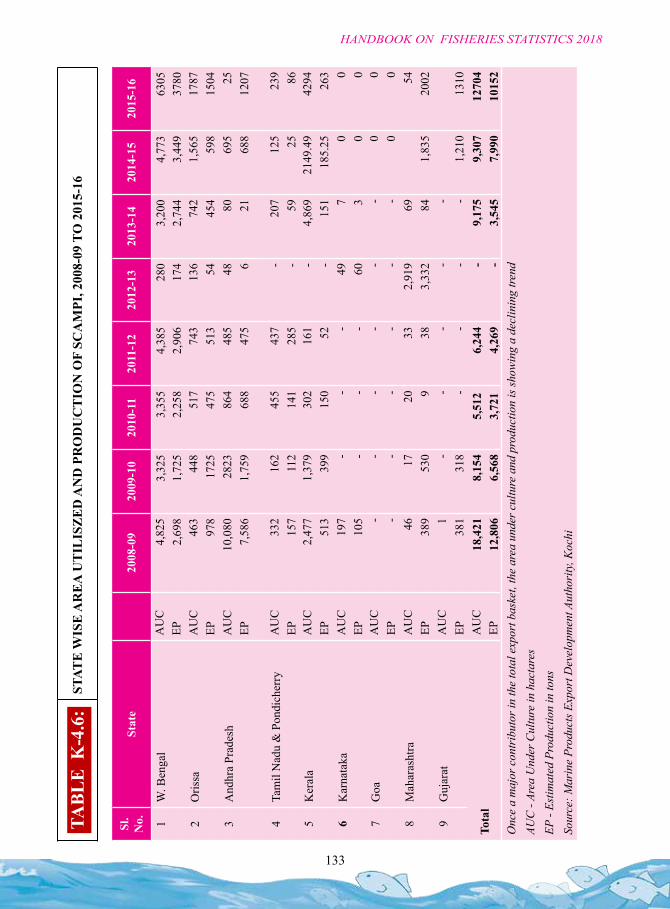
133
HANDBOOK ON FISHERIES STATISTICS 2018
Sl.
No.
Stat
e20
08-0
920
09-1
020
10-1
120
11-1
220
12-1
320
13-1
420
14-1
520
15-1
6
1W
. Ben
gal
AU
C
4,8
25
3,3
25
3,3
55
4,3
85
280
3,2
004,
773
6305
EP 2
,698
1,7
25
2,2
58 2
,906
174
2,7
443,
449
3780
2O
rissa
AU
C 4
63 4
4851
7 7
43 1
36 7
421,
565
1787
EP 9
7817
2547
5 5
13
54
454
598
1504
3A
ndhr
a Pr
ades
hA
UC
10,
080
2823
864
485
4
8
8069
525
EP7,
586
1
,759
688
475
6 2
168
812
07
4Ta
mil
Nad
u &
Pon
dich
erry
AU
C33
2
1
62
4
55
4
37
-
207
125
239
EP 1
57 1
12 1
41 2
85
-
59
2586
5K
eral
aA
UC
2,4
77
1
,379
302
161
-
4
,869
2149
.49
4294
EP 5
13
399
150
52
-
151
185.
2526
36
Kar
nata
kaA
UC
197
-
-
-
49
70
0EP
105
-
-
-
60
30
07
Goa
AU
C
-
-
-
-
-
-
0
0EP
-
-
-
-
-
-
00
8M
ahar
asht
raA
UC
4
6
17
2
0
33
2,9
19
69
54EP
389
530
9
38
3,3
32
841,
835
2002
9G
ujar
atA
UC
1
-
-
-
-
-
EP
381
318
-
-
-
-
1,21
013
10
Tota
lA
UC
1
8,42
1
8
,154
5,5
12
6
,244
-
9
,175
9,30
712
704
EP
12,
806
6,5
68
3
,721
4,2
69
-
3,5
457,
990
1015
2O
nce
a m
ajor
con
trib
utor
in th
e to
tal e
xpor
t bas
ket,
the
area
und
er c
ultu
re a
nd p
rodu
ctio
n is
show
ing
a de
clin
ing
trend
AUC
- Ar
ea U
nder
Cul
ture
in h
acta
res
EP -
Estim
ated
Pro
duct
ion
in to
nsSo
urce
: Mar
ine
Prod
ucts
Exp
ort D
evel
opm
ent A
utho
rity
, Koc
hi
TABL
E K
-4.6
: ST
ATE
WIS
E A
RE
A U
TIL
ISZ
ED
AN
D P
RO
DU
CT
ION
OF
SCA
MPI
, 200
8-09
TO
201
5-16
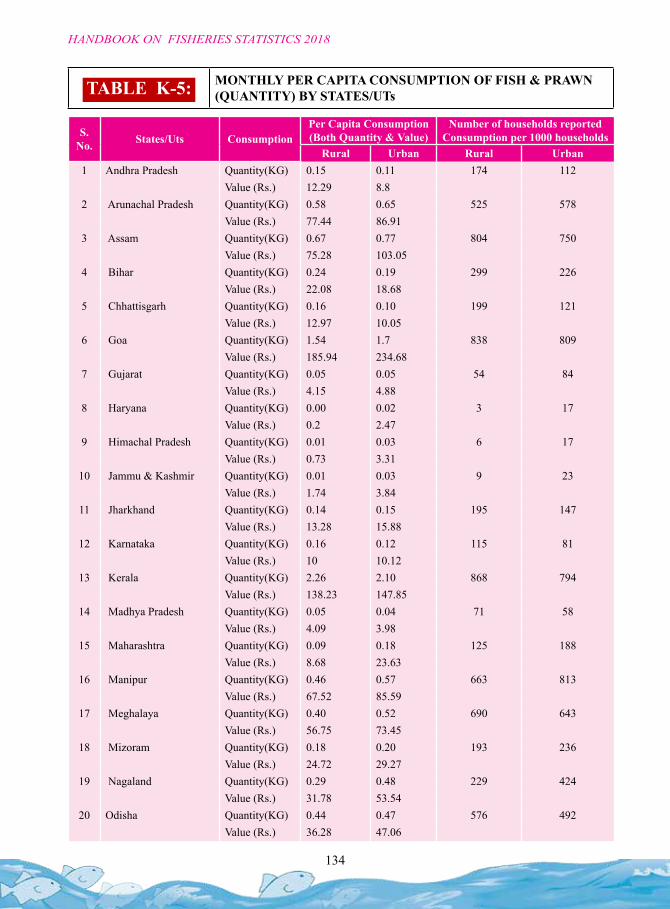
134
HANDBOOK ON FISHERIES STATISTICS 2018
S. No. States/Uts Consumption
Per Capita Consumption (Both Quantity & Value)
Number of households reported Consumption per 1000 households
Rural Urban Rural Urban1 Andhra Pradesh Quantity(KG) 0.15 0.11 174 112
Value (Rs.) 12.29 8.82 Arunachal Pradesh Quantity(KG) 0.58 0.65 525 578
Value (Rs.) 77.44 86.913 Assam Quantity(KG) 0.67 0.77 804 750
Value (Rs.) 75.28 103.054 Bihar Quantity(KG) 0.24 0.19 299 226
Value (Rs.) 22.08 18.685 Chhattisgarh Quantity(KG) 0.16 0.10 199 121
Value (Rs.) 12.97 10.056 Goa Quantity(KG) 1.54 1.7 838 809
Value (Rs.) 185.94 234.687 Gujarat Quantity(KG) 0.05 0.05 54 84
Value (Rs.) 4.15 4.888 Haryana Quantity(KG) 0.00 0.02 3 17
Value (Rs.) 0.2 2.479 Himachal Pradesh Quantity(KG) 0.01 0.03 6 17
Value (Rs.) 0.73 3.3110 Jammu & Kashmir Quantity(KG) 0.01 0.03 9 23
Value (Rs.) 1.74 3.8411 Jharkhand Quantity(KG) 0.14 0.15 195 147
Value (Rs.) 13.28 15.8812 Karnataka Quantity(KG) 0.16 0.12 115 81
Value (Rs.) 10 10.1213 Kerala Quantity(KG) 2.26 2.10 868 794
Value (Rs.) 138.23 147.8514 Madhya Pradesh Quantity(KG) 0.05 0.04 71 58
Value (Rs.) 4.09 3.9815 Maharashtra Quantity(KG) 0.09 0.18 125 188
Value (Rs.) 8.68 23.6316 Manipur Quantity(KG) 0.46 0.57 663 813
Value (Rs.) 67.52 85.5917 Meghalaya Quantity(KG) 0.40 0.52 690 643
Value (Rs.) 56.75 73.4518 Mizoram Quantity(KG) 0.18 0.20 193 236
Value (Rs.) 24.72 29.2719 Nagaland Quantity(KG) 0.29 0.48 229 424
Value (Rs.) 31.78 53.5420 Odisha Quantity(KG) 0.44 0.47 576 492
Value (Rs.) 36.28 47.06
TABLE K-5: MONTHLY PER CAPITA CONSUMPTION OF FISH & PRAWN (QUANTITY) BY STATES/UTs
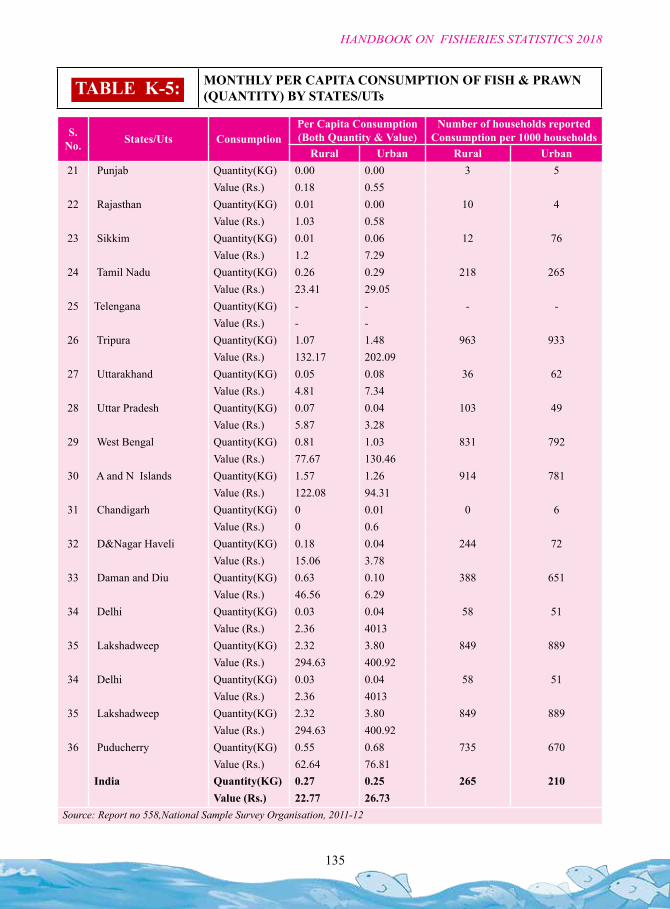
135
HANDBOOK ON FISHERIES STATISTICS 2018
TABLE K-5: MONTHLY PER CAPITA CONSUMPTION OF FISH & PRAWN (QUANTITY) BY STATES/UTs
S. No. States/Uts Consumption
Per Capita Consumption (Both Quantity & Value)
Number of households reported Consumption per 1000 households
Rural Urban Rural Urban21 Punjab Quantity(KG) 0.00 0.00 3 5
Value (Rs.) 0.18 0.5522 Rajasthan Quantity(KG) 0.01 0.00 10 4
Value (Rs.) 1.03 0.5823 Sikkim Quantity(KG) 0.01 0.06 12 76
Value (Rs.) 1.2 7.2924 Tamil Nadu Quantity(KG) 0.26 0.29 218 265
Value (Rs.) 23.41 29.0525 Telengana Quantity(KG) - - - -
Value (Rs.) - -26 Tripura Quantity(KG) 1.07 1.48 963 933
Value (Rs.) 132.17 202.0927 Uttarakhand Quantity(KG) 0.05 0.08 36 62
Value (Rs.) 4.81 7.3428 Uttar Pradesh Quantity(KG) 0.07 0.04 103 49
Value (Rs.) 5.87 3.2829 West Bengal Quantity(KG) 0.81 1.03 831 792
Value (Rs.) 77.67 130.4630 A and N Islands Quantity(KG) 1.57 1.26 914 781
Value (Rs.) 122.08 94.3131 Chandigarh Quantity(KG) 0 0.01 0 6
Value (Rs.) 0 0.632 D&Nagar Haveli Quantity(KG) 0.18 0.04 244 72
Value (Rs.) 15.06 3.7833 Daman and Diu Quantity(KG) 0.63 0.10 388 651
Value (Rs.) 46.56 6.2934 Delhi Quantity(KG) 0.03 0.04 58 51
Value (Rs.) 2.36 401335 Lakshadweep Quantity(KG) 2.32 3.80 849 889
Value (Rs.) 294.63 400.9234 Delhi Quantity(KG) 0.03 0.04 58 51
Value (Rs.) 2.36 401335 Lakshadweep Quantity(KG) 2.32 3.80 849 889
Value (Rs.) 294.63 400.9236 Puducherry Quantity(KG) 0.55 0.68 735 670
Value (Rs.) 62.64 76.81India Quantity(KG) 0.27 0.25 265 210
Value (Rs.) 22.77 26.73Source: Report no 558,National Sample Survey Organisation, 2011-12
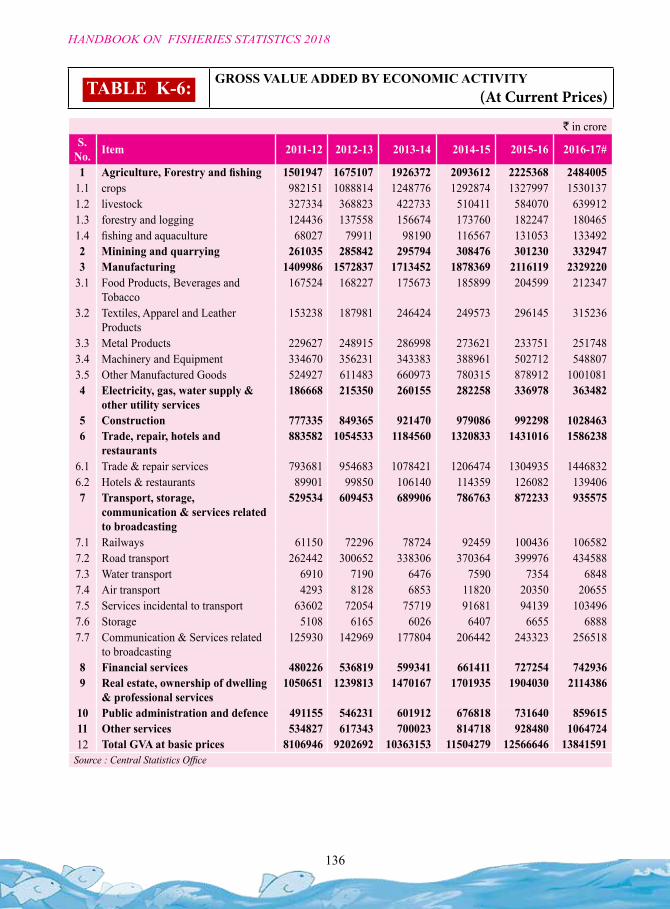
136
HANDBOOK ON FISHERIES STATISTICS 2018
TABLE K-6: GROSS VALUE ADDED BY ECONOMIC ACTIVITY(At Current Prices)
` in croreS.
No. Item 2011-12 2012-13 2013-14 2014-15 2015-16 2016-17#
1 Agriculture, Forestry and fishing 1501947 1675107 1926372 2093612 2225368 24840051.1 crops 982151 1088814 1248776 1292874 1327997 15301371.2 livestock 327334 368823 422733 510411 584070 6399121.3 forestry and logging 124436 137558 156674 173760 182247 1804651.4 fishing and aquaculture 68027 79911 98190 116567 131053 1334922 Minining and quarrying 261035 285842 295794 308476 301230 3329473 Manufacturing 1409986 1572837 1713452 1878369 2116119 2329220
3.1 Food Products, Beverages and Tobacco
167524 168227 175673 185899 204599 212347
3.2 Textiles, Apparel and Leather Products
153238 187981 246424 249573 296145 315236
3.3 Metal Products 229627 248915 286998 273621 233751 2517483.4 Machinery and Equipment 334670 356231 343383 388961 502712 5488073.5 Other Manufactured Goods 524927 611483 660973 780315 878912 10010814 Electricity, gas, water supply &
other utility services186668 215350 260155 282258 336978 363482
5 Construction 777335 849365 921470 979086 992298 10284636 Trade, repair, hotels and
restaurants 883582 1054533 1184560 1320833 1431016 1586238
6.1 Trade & repair services 793681 954683 1078421 1206474 1304935 14468326.2 Hotels & restaurants 89901 99850 106140 114359 126082 1394067 Transport, storage,
communication & services related to broadcasting
529534 609453 689906 786763 872233 935575
7.1 Railways 61150 72296 78724 92459 100436 1065827.2 Road transport 262442 300652 338306 370364 399976 4345887.3 Water transport 6910 7190 6476 7590 7354 68487.4 Air transport 4293 8128 6853 11820 20350 206557.5 Services incidental to transport 63602 72054 75719 91681 94139 1034967.6 Storage 5108 6165 6026 6407 6655 68887.7 Communication & Services related
to broadcasting 125930 142969 177804 206442 243323 256518
8 Financial services 480226 536819 599341 661411 727254 7429369 Real estate, ownership of dwelling
& professional services1050651 1239813 1470167 1701935 1904030 2114386
10 Public administration and defence 491155 546231 601912 676818 731640 85961511 Other services 534827 617343 700023 814718 928480 106472412 Total GVA at basic prices 8106946 9202692 10363153 11504279 12566646 13841591
Source : Central Statistics Office
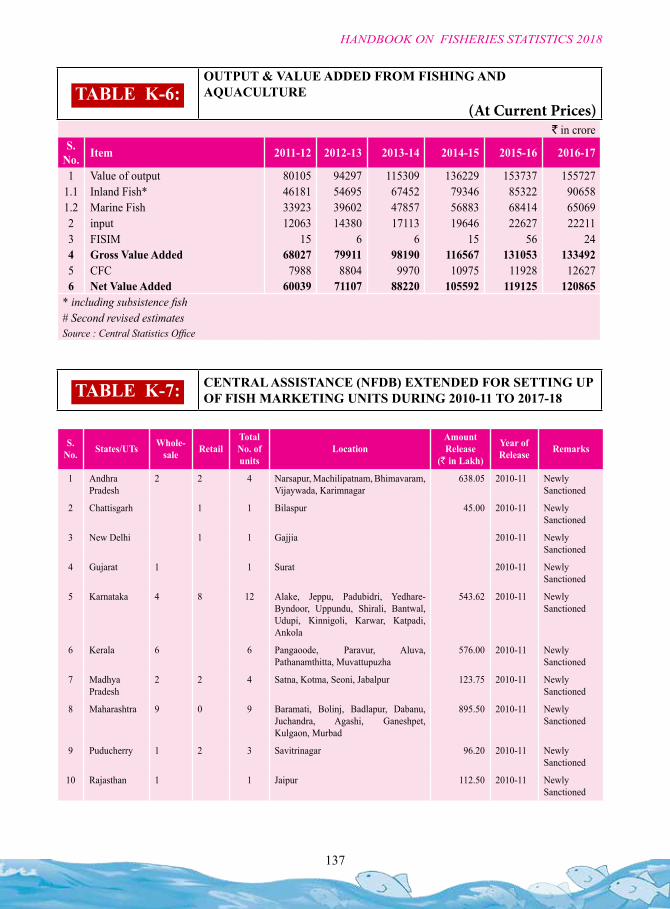
137
HANDBOOK ON FISHERIES STATISTICS 2018
TABLE K-6: OUTPUT & VALUE ADDED FROM FISHING AND AQUACULTURE
(At Current Prices)
TABLE K-7: CENTRAL ASSISTANCE (NFDB) EXTENDED FOR SETTING UP OF FISH MARKETING UNITS DURING 2010-11 TO 2017-18
` in croreS.
No. Item 2011-12 2012-13 2013-14 2014-15 2015-16 2016-17
1 Value of output 80105 94297 115309 136229 153737 1557271.1 Inland Fish* 46181 54695 67452 79346 85322 906581.2 Marine Fish 33923 39602 47857 56883 68414 650692 input 12063 14380 17113 19646 22627 222113 FISIM 15 6 6 15 56 244 Gross Value Added 68027 79911 98190 116567 131053 1334925 CFC 7988 8804 9970 10975 11928 126276 Net Value Added 60039 71107 88220 105592 119125 120865
* including subsistence fish# Second revised estimatesSource : Central Statistics Office
S. No. States/UTs Whole-
sale RetailTotal No. of units
LocationAmount Release
(` in Lakh)
Year of Release Remarks
1 Andhra Pradesh
2 2 4 Narsapur, Machilipatnam, Bhimavaram, Vijaywada, Karimnagar
638.05 2010-11 Newly Sanctioned
2 Chattisgarh 1 1 Bilaspur 45.00 2010-11 Newly Sanctioned
3 New Delhi 1 1 Gajjia 2010-11 Newly Sanctioned
4 Gujarat 1 1 Surat 2010-11 Newly Sanctioned
5 Karnataka 4 8 12 Alake, Jeppu, Padubidri, Yedhare-Byndoor, Uppundu, Shirali, Bantwal, Udupi, Kinnigoli, Karwar, Katpadi, Ankola
543.62 2010-11 Newly Sanctioned
6 Kerala 6 6 Pangaoode, Paravur, Aluva, Pathanamthitta, Muvattupuzha
576.00 2010-11 Newly Sanctioned
7 Madhya Pradesh
2 2 4 Satna, Kotma, Seoni, Jabalpur 123.75 2010-11 Newly Sanctioned
8 Maharashtra 9 0 9 Baramati, Bolinj, Badlapur, Dabanu, Juchandra, Agashi, Ganeshpet, Kulgaon, Murbad
895.50 2010-11 Newly Sanctioned
9 Puducherry 1 2 3 Savitrinagar 96.20 2010-11 Newly Sanctioned
10 Rajasthan 1 1 Jaipur 112.50 2010-11 Newly Sanctioned
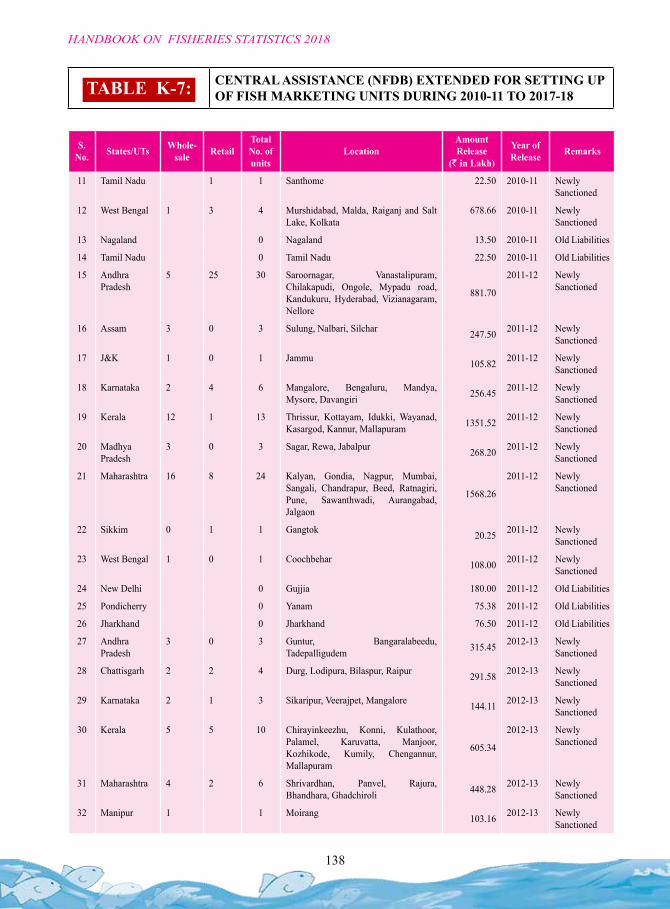
138
HANDBOOK ON FISHERIES STATISTICS 2018
S. No. States/UTs Whole-
sale RetailTotal No. of units
LocationAmount Release
(` in Lakh)
Year of Release Remarks
11 Tamil Nadu 1 1 Santhome 22.50 2010-11 Newly Sanctioned
12 West Bengal 1 3 4 Murshidabad, Malda, Raiganj and Salt Lake, Kolkata
678.66 2010-11 Newly Sanctioned
13 Nagaland 0 Nagaland 13.50 2010-11 Old Liabilities
14 Tamil Nadu 0 Tamil Nadu 22.50 2010-11 Old Liabilities
15 Andhra Pradesh
5 25 30 Saroornagar, Vanastalipuram, Chilakapudi, Ongole, Mypadu road, Kandukuru, Hyderabad, Vizianagaram, Nellore
881.70
2011-12 Newly Sanctioned
16 Assam 3 0 3 Sulung, Nalbari, Silchar 247.50 2011-12 Newly Sanctioned
17 J&K 1 0 1 Jammu 105.82 2011-12 Newly Sanctioned
18 Karnataka 2 4 6 Mangalore, Bengaluru, Mandya, Mysore, Davangiri 256.45 2011-12 Newly
Sanctioned
19 Kerala 12 1 13 Thrissur, Kottayam, Idukki, Wayanad, Kasargod, Kannur, Mallapuram 1351.52 2011-12 Newly
Sanctioned
20 Madhya Pradesh
3 0 3 Sagar, Rewa, Jabalpur 268.20 2011-12 Newly Sanctioned
21 Maharashtra 16 8 24 Kalyan, Gondia, Nagpur, Mumbai, Sangali, Chandrapur, Beed, Ratnagiri, Pune, Sawanthwadi, Aurangabad, Jalgaon
1568.26
2011-12 Newly Sanctioned
22 Sikkim 0 1 1 Gangtok 20.25 2011-12 Newly Sanctioned
23 West Bengal 1 0 1 Coochbehar 108.00 2011-12 Newly Sanctioned
24 New Delhi 0 Gujjia 180.00 2011-12 Old Liabilities
25 Pondicherry 0 Yanam 75.38 2011-12 Old Liabilities
26 Jharkhand 0 Jharkhand 76.50 2011-12 Old Liabilities
27 Andhra Pradesh
3 0 3 Guntur, Bangaralabeedu, Tadepalligudem 315.45 2012-13 Newly
Sanctioned
28 Chattisgarh 2 2 4 Durg, Lodipura, Bilaspur, Raipur 291.58 2012-13 Newly Sanctioned
29 Karnataka 2 1 3 Sikaripur, Veerajpet, Mangalore 144.11 2012-13 Newly Sanctioned
30 Kerala 5 5 10 Chirayinkeezhu, Konni, Kulathoor, Palamel, Karuvatta, Manjoor, Kozhikode, Kumily, Chengannur, Mallapuram
605.34
2012-13 Newly Sanctioned
31 Maharashtra 4 2 6 Shrivardhan, Panvel, Rajura, Bhandhara, Ghadchiroli 448.28 2012-13 Newly
Sanctioned
32 Manipur 1 1 Moirang 103.16 2012-13 Newly Sanctioned
TABLE K-7: CENTRAL ASSISTANCE (NFDB) EXTENDED FOR SETTING UP OF FISH MARKETING UNITS DURING 2010-11 TO 2017-18
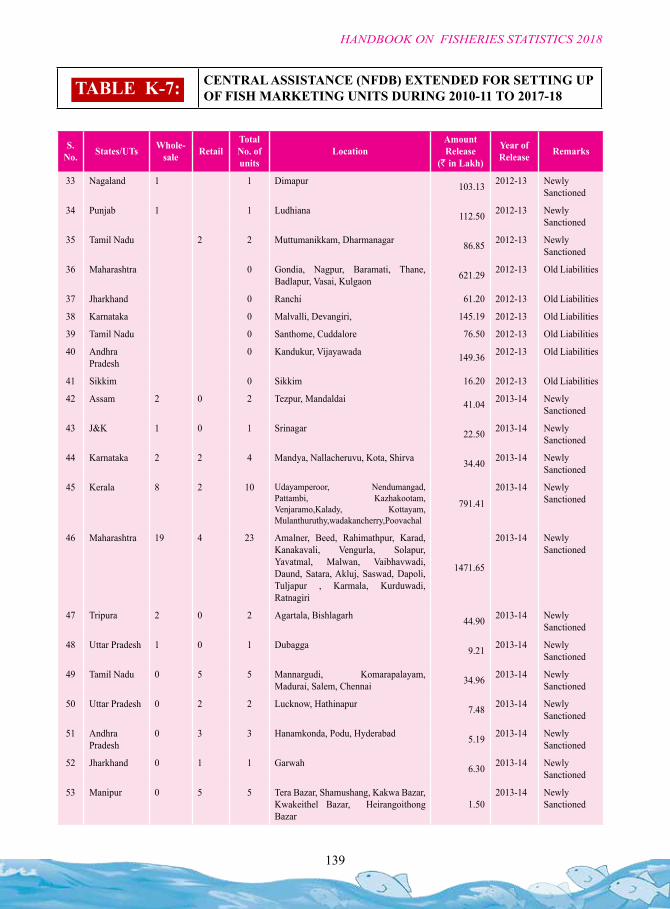
139
HANDBOOK ON FISHERIES STATISTICS 2018
TABLE K-7: CENTRAL ASSISTANCE (NFDB) EXTENDED FOR SETTING UP OF FISH MARKETING UNITS DURING 2010-11 TO 2017-18
S. No. States/UTs Whole-
sale RetailTotal No. of units
LocationAmount Release
(` in Lakh)
Year of Release Remarks
33 Nagaland 1 1 Dimapur 103.13 2012-13 Newly Sanctioned
34 Punjab 1 1 Ludhiana 112.50 2012-13 Newly Sanctioned
35 Tamil Nadu 2 2 Muttumanikkam, Dharmanagar 86.85 2012-13 Newly Sanctioned
36 Maharashtra 0 Gondia, Nagpur, Baramati, Thane, Badlapur, Vasai, Kulgaon 621.29 2012-13 Old Liabilities
37 Jharkhand 0 Ranchi 61.20 2012-13 Old Liabilities
38 Karnataka 0 Malvalli, Devangiri, 145.19 2012-13 Old Liabilities
39 Tamil Nadu 0 Santhome, Cuddalore 76.50 2012-13 Old Liabilities
40 Andhra Pradesh
0 Kandukur, Vijayawada 149.36 2012-13 Old Liabilities
41 Sikkim 0 Sikkim 16.20 2012-13 Old Liabilities
42 Assam 2 0 2 Tezpur, Mandaldai 41.04 2013-14 Newly Sanctioned
43 J&K 1 0 1 Srinagar 22.50 2013-14 Newly Sanctioned
44 Karnataka 2 2 4 Mandya, Nallacheruvu, Kota, Shirva 34.40 2013-14 Newly Sanctioned
45 Kerala 8 2 10 Udayamperoor, Nendumangad, Pattambi, Kazhakootam, Venjaramo,Kalady, Kottayam, Mulanthuruthy,wadakancherry,Poovachal
791.41
2013-14 Newly Sanctioned
46 Maharashtra 19 4 23 Amalner, Beed, Rahimathpur, Karad, Kanakavali, Vengurla, Solapur, Yavatmal, Malwan, Vaibhavwadi, Daund, Satara, Akluj, Saswad, Dapoli, Tuljapur , Karmala, Kurduwadi, Ratnagiri
1471.65
2013-14 Newly Sanctioned
47 Tripura 2 0 2 Agartala, Bishlagarh 44.90 2013-14 Newly Sanctioned
48 Uttar Pradesh 1 0 1 Dubagga 9.21 2013-14 Newly Sanctioned
49 Tamil Nadu 0 5 5 Mannargudi, Komarapalayam, Madurai, Salem, Chennai 34.96 2013-14 Newly
Sanctioned
50 Uttar Pradesh 0 2 2 Lucknow, Hathinapur 7.48 2013-14 Newly Sanctioned
51 Andhra Pradesh
0 3 3 Hanamkonda, Podu, Hyderabad 5.19 2013-14 Newly Sanctioned
52 Jharkhand 0 1 1 Garwah 6.30 2013-14 Newly Sanctioned
53 Manipur 0 5 5 Tera Bazar, Shamushang, Kakwa Bazar, Kwakeithel Bazar, Heirangoithong Bazar
1.502013-14 Newly
Sanctioned
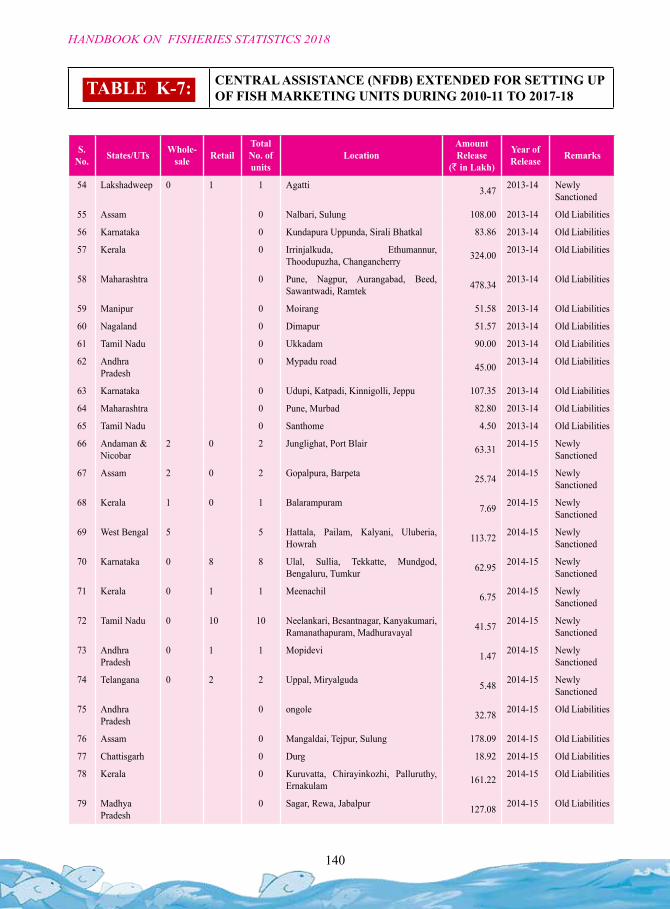
140
HANDBOOK ON FISHERIES STATISTICS 2018
S. No. States/UTs Whole-
sale RetailTotal No. of units
LocationAmount Release
(` in Lakh)
Year of Release Remarks
54 Lakshadweep 0 1 1 Agatti 3.47 2013-14 Newly Sanctioned
55 Assam 0 Nalbari, Sulung 108.00 2013-14 Old Liabilities
56 Karnataka 0 Kundapura Uppunda, Sirali Bhatkal 83.86 2013-14 Old Liabilities
57 Kerala 0 Irrinjalkuda, Ethumannur, Thoodupuzha, Changancherry 324.00 2013-14 Old Liabilities
58 Maharashtra 0 Pune, Nagpur, Aurangabad, Beed, Sawantwadi, Ramtek 478.34 2013-14 Old Liabilities
59 Manipur 0 Moirang 51.58 2013-14 Old Liabilities
60 Nagaland 0 Dimapur 51.57 2013-14 Old Liabilities
61 Tamil Nadu 0 Ukkadam 90.00 2013-14 Old Liabilities
62 Andhra Pradesh
0 Mypadu road 45.00 2013-14 Old Liabilities
63 Karnataka 0 Udupi, Katpadi, Kinnigolli, Jeppu 107.35 2013-14 Old Liabilities
64 Maharashtra 0 Pune, Murbad 82.80 2013-14 Old Liabilities
65 Tamil Nadu 0 Santhome 4.50 2013-14 Old Liabilities
66 Andaman & Nicobar
2 0 2 Junglighat, Port Blair 63.31 2014-15 Newly Sanctioned
67 Assam 2 0 2 Gopalpura, Barpeta 25.74 2014-15 Newly Sanctioned
68 Kerala 1 0 1 Balarampuram 7.69 2014-15 Newly Sanctioned
69 West Bengal 5 5 Hattala, Pailam, Kalyani, Uluberia, Howrah 113.72 2014-15 Newly
Sanctioned
70 Karnataka 0 8 8 Ulal, Sullia, Tekkatte, Mundgod, Bengaluru, Tumkur 62.95 2014-15 Newly
Sanctioned
71 Kerala 0 1 1 Meenachil 6.75 2014-15 Newly Sanctioned
72 Tamil Nadu 0 10 10 Neelankari, Besantnagar, Kanyakumari, Ramanathapuram, Madhuravayal 41.57 2014-15 Newly
Sanctioned
73 Andhra Pradesh
0 1 1 Mopidevi 1.47 2014-15 Newly Sanctioned
74 Telangana 0 2 2 Uppal, Miryalguda 5.48 2014-15 Newly Sanctioned
75 Andhra Pradesh
0 ongole 32.78 2014-15 Old Liabilities
76 Assam 0 Mangaldai, Tejpur, Sulung 178.09 2014-15 Old Liabilities
77 Chattisgarh 0 Durg 18.92 2014-15 Old Liabilities
78 Kerala 0 Kuruvatta, Chirayinkozhi, Palluruthy, Ernakulam 161.22 2014-15 Old Liabilities
79 Madhya Pradesh
0 Sagar, Rewa, Jabalpur 127.08 2014-15 Old Liabilities
TABLE K-7: CENTRAL ASSISTANCE (NFDB) EXTENDED FOR SETTING UP OF FISH MARKETING UNITS DURING 2010-11 TO 2017-18
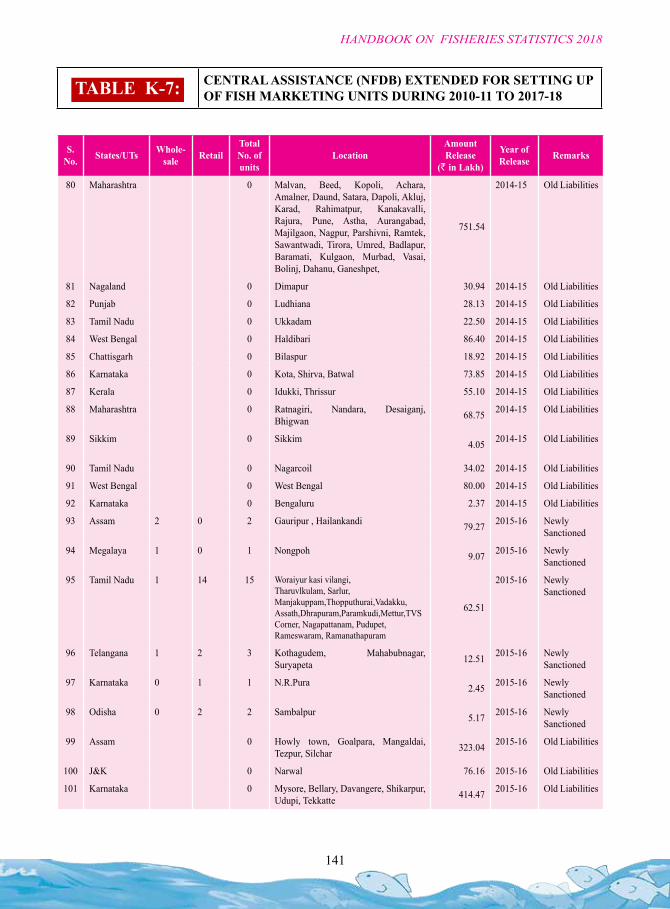
141
HANDBOOK ON FISHERIES STATISTICS 2018
S. No. States/UTs Whole-
sale RetailTotal No. of units
LocationAmount Release
(` in Lakh)
Year of Release Remarks
80 Maharashtra 0 Malvan, Beed, Kopoli, Achara, Amalner, Daund, Satara, Dapoli, Akluj, Karad, Rahimatpur, Kanakavalli, Rajura, Pune, Astha, Aurangabad, Majilgaon, Nagpur, Parshivni, Ramtek, Sawantwadi, Tirora, Umred, Badlapur, Baramati, Kulgaon, Murbad, Vasai, Bolinj, Dahanu, Ganeshpet,
751.54
2014-15 Old Liabilities
81 Nagaland 0 Dimapur 30.94 2014-15 Old Liabilities
82 Punjab 0 Ludhiana 28.13 2014-15 Old Liabilities
83 Tamil Nadu 0 Ukkadam 22.50 2014-15 Old Liabilities
84 West Bengal 0 Haldibari 86.40 2014-15 Old Liabilities
85 Chattisgarh 0 Bilaspur 18.92 2014-15 Old Liabilities
86 Karnataka 0 Kota, Shirva, Batwal 73.85 2014-15 Old Liabilities
87 Kerala 0 Idukki, Thrissur 55.10 2014-15 Old Liabilities
88 Maharashtra 0 Ratnagiri, Nandara, Desaiganj, Bhigwan 68.75 2014-15 Old Liabilities
89 Sikkim 0 Sikkim 4.05 2014-15 Old Liabilities
90 Tamil Nadu 0 Nagarcoil 34.02 2014-15 Old Liabilities
91 West Bengal 0 West Bengal 80.00 2014-15 Old Liabilities
92 Karnataka 0 Bengaluru 2.37 2014-15 Old Liabilities
93 Assam 2 0 2 Gauripur , Hailankandi 79.27 2015-16 Newly Sanctioned
94 Megalaya 1 0 1 Nongpoh 9.07 2015-16 Newly Sanctioned
95 Tamil Nadu 1 14 15 Woraiyur kasi vilangi, Tharuvlkulam, Sarlur, Manjakuppam,Thopputhurai,Vadakku, Assath,Dhrapuram,Paramkudi,Mettur,TVS Corner, Nagapattanam, Pudupet, Rameswaram, Ramanathapuram
62.51
2015-16 Newly Sanctioned
96 Telangana 1 2 3 Kothagudem, Mahabubnagar, Suryapeta 12.51 2015-16 Newly
Sanctioned
97 Karnataka 0 1 1 N.R.Pura 2.45 2015-16 Newly Sanctioned
98 Odisha 0 2 2 Sambalpur 5.17 2015-16 Newly Sanctioned
99 Assam 0 Howly town, Goalpara, Mangaldai, Tezpur, Silchar 323.04 2015-16 Old Liabilities
100 J&K 0 Narwal 76.16 2015-16 Old Liabilities
101 Karnataka 0 Mysore, Bellary, Davangere, Shikarpur, Udupi, Tekkatte 414.47 2015-16 Old Liabilities
TABLE K-7: CENTRAL ASSISTANCE (NFDB) EXTENDED FOR SETTING UP OF FISH MARKETING UNITS DURING 2010-11 TO 2017-18
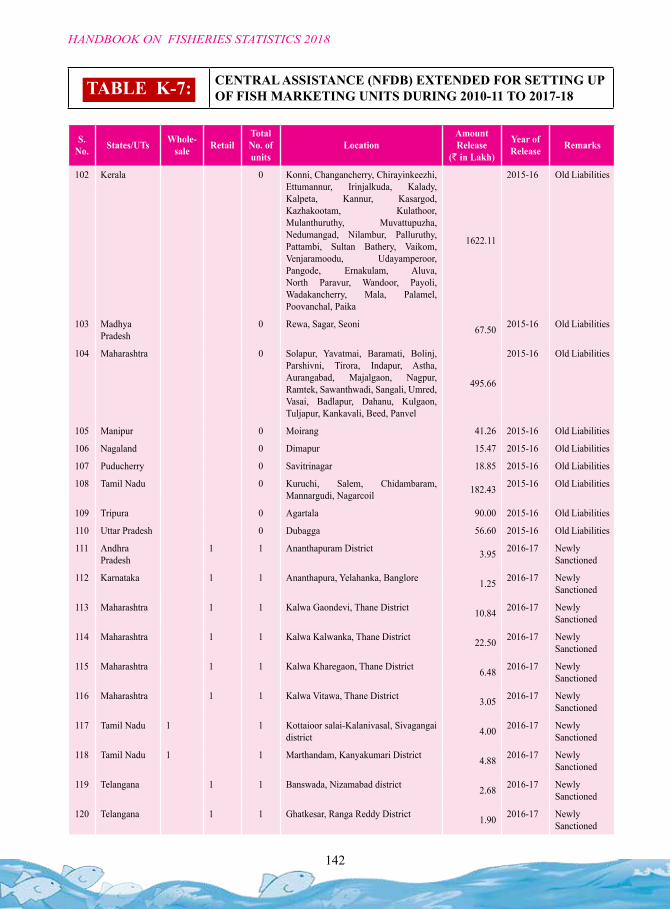
142
HANDBOOK ON FISHERIES STATISTICS 2018
S. No. States/UTs Whole-
sale RetailTotal No. of units
LocationAmount Release
(` in Lakh)
Year of Release Remarks
102 Kerala 0 Konni, Changancherry, Chirayinkeezhi, Ettumannur, Irinjalkuda, Kalady, Kalpeta, Kannur, Kasargod, Kazhakootam, Kulathoor, Mulanthuruthy, Muvattupuzha, Nedumangad, Nilambur, Palluruthy, Pattambi, Sultan Bathery, Vaikom, Venjaramoodu, Udayamperoor, Pangode, Ernakulam, Aluva, North Paravur, Wandoor, Payoli, Wadakancherry, Mala, Palamel, Poovanchal, Paika
1622.11
2015-16 Old Liabilities
103 Madhya Pradesh
0 Rewa, Sagar, Seoni 67.50 2015-16 Old Liabilities
104 Maharashtra 0 Solapur, Yavatmai, Baramati, Bolinj, Parshivni, Tirora, Indapur, Astha, Aurangabad, Majalgaon, Nagpur, Ramtek, Sawanthwadi, Sangali, Umred, Vasai, Badlapur, Dahanu, Kulgaon, Tuljapur, Kankavali, Beed, Panvel
495.66
2015-16 Old Liabilities
105 Manipur 0 Moirang 41.26 2015-16 Old Liabilities
106 Nagaland 0 Dimapur 15.47 2015-16 Old Liabilities
107 Puducherry 0 Savitrinagar 18.85 2015-16 Old Liabilities
108 Tamil Nadu 0 Kuruchi, Salem, Chidambaram, Mannargudi, Nagarcoil 182.43 2015-16 Old Liabilities
109 Tripura 0 Agartala 90.00 2015-16 Old Liabilities
110 Uttar Pradesh 0 Dubagga 56.60 2015-16 Old Liabilities
111 Andhra Pradesh
1 1 Ananthapuram District 3.95 2016-17 Newly Sanctioned
112 Karnataka 1 1 Ananthapura, Yelahanka, Banglore 1.25 2016-17 Newly Sanctioned
113 Maharashtra 1 1 Kalwa Gaondevi, Thane District 10.84 2016-17 Newly Sanctioned
114 Maharashtra 1 1 Kalwa Kalwanka, Thane District 22.50 2016-17 Newly Sanctioned
115 Maharashtra 1 1 Kalwa Kharegaon, Thane District 6.48 2016-17 Newly Sanctioned
116 Maharashtra 1 1 Kalwa Vitawa, Thane District 3.05 2016-17 Newly Sanctioned
117 Tamil Nadu 1 1 Kottaioor salai-Kalanivasal, Sivagangai district 4.00 2016-17 Newly
Sanctioned
118 Tamil Nadu 1 1 Marthandam, Kanyakumari District 4.88 2016-17 Newly Sanctioned
119 Telangana 1 1 Banswada, Nizamabad district 2.68 2016-17 Newly Sanctioned
120 Telangana 1 1 Ghatkesar, Ranga Reddy District 1.90 2016-17 Newly Sanctioned
TABLE K-7: CENTRAL ASSISTANCE (NFDB) EXTENDED FOR SETTING UP OF FISH MARKETING UNITS DURING 2010-11 TO 2017-18
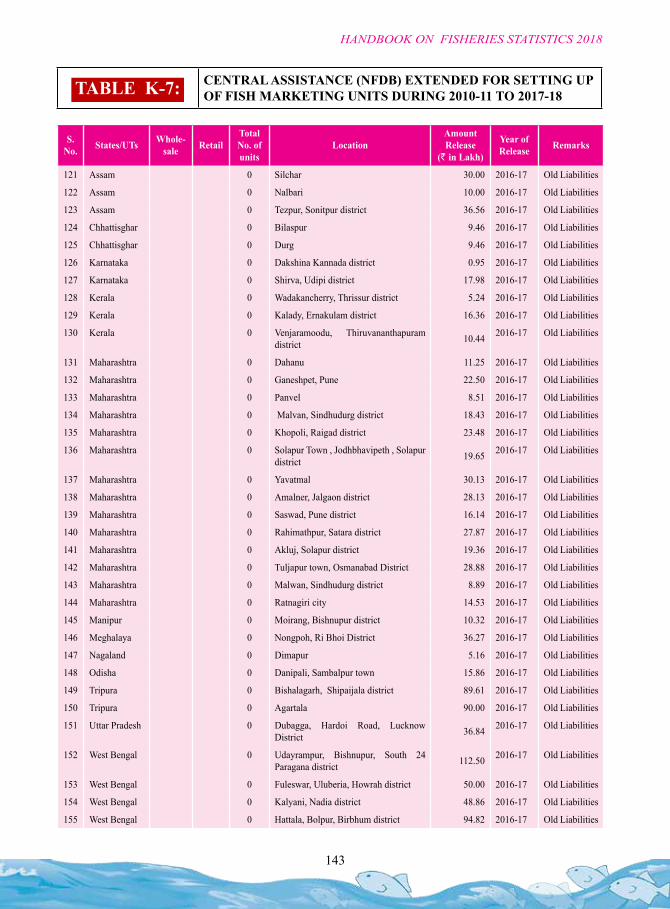
143
HANDBOOK ON FISHERIES STATISTICS 2018
TABLE K-7: CENTRAL ASSISTANCE (NFDB) EXTENDED FOR SETTING UP OF FISH MARKETING UNITS DURING 2010-11 TO 2017-18
S. No. States/UTs Whole-
sale RetailTotal No. of units
LocationAmount Release
(` in Lakh)
Year of Release Remarks
121 Assam 0 Silchar 30.00 2016-17 Old Liabilities
122 Assam 0 Nalbari 10.00 2016-17 Old Liabilities
123 Assam 0 Tezpur, Sonitpur district 36.56 2016-17 Old Liabilities
124 Chhattisghar 0 Bilaspur 9.46 2016-17 Old Liabilities
125 Chhattisghar 0 Durg 9.46 2016-17 Old Liabilities
126 Karnataka 0 Dakshina Kannada district 0.95 2016-17 Old Liabilities
127 Karnataka 0 Shirva, Udipi district 17.98 2016-17 Old Liabilities
128 Kerala 0 Wadakancherry, Thrissur district 5.24 2016-17 Old Liabilities
129 Kerala 0 Kalady, Ernakulam district 16.36 2016-17 Old Liabilities
130 Kerala 0 Venjaramoodu, Thiruvananthapuram district 10.44 2016-17 Old Liabilities
131 Maharashtra 0 Dahanu 11.25 2016-17 Old Liabilities
132 Maharashtra 0 Ganeshpet, Pune 22.50 2016-17 Old Liabilities
133 Maharashtra 0 Panvel 8.51 2016-17 Old Liabilities
134 Maharashtra 0 Malvan, Sindhudurg district 18.43 2016-17 Old Liabilities
135 Maharashtra 0 Khopoli, Raigad district 23.48 2016-17 Old Liabilities
136 Maharashtra 0 Solapur Town , Jodhbhavipeth , Solapur district 19.65 2016-17 Old Liabilities
137 Maharashtra 0 Yavatmal 30.13 2016-17 Old Liabilities
138 Maharashtra 0 Amalner, Jalgaon district 28.13 2016-17 Old Liabilities
139 Maharashtra 0 Saswad, Pune district 16.14 2016-17 Old Liabilities
140 Maharashtra 0 Rahimathpur, Satara district 27.87 2016-17 Old Liabilities
141 Maharashtra 0 Akluj, Solapur district 19.36 2016-17 Old Liabilities
142 Maharashtra 0 Tuljapur town, Osmanabad District 28.88 2016-17 Old Liabilities
143 Maharashtra 0 Malwan, Sindhudurg district 8.89 2016-17 Old Liabilities
144 Maharashtra 0 Ratnagiri city 14.53 2016-17 Old Liabilities
145 Manipur 0 Moirang, Bishnupur district 10.32 2016-17 Old Liabilities
146 Meghalaya 0 Nongpoh, Ri Bhoi District 36.27 2016-17 Old Liabilities
147 Nagaland 0 Dimapur 5.16 2016-17 Old Liabilities
148 Odisha 0 Danipali, Sambalpur town 15.86 2016-17 Old Liabilities
149 Tripura 0 Bishalagarh, Shipaijala district 89.61 2016-17 Old Liabilities
150 Tripura 0 Agartala 90.00 2016-17 Old Liabilities
151 Uttar Pradesh 0 Dubagga, Hardoi Road, Lucknow District 36.84 2016-17 Old Liabilities
152 West Bengal 0 Udayrampur, Bishnupur, South 24 Paragana district 112.50 2016-17 Old Liabilities
153 West Bengal 0 Fuleswar, Uluberia, Howrah district 50.00 2016-17 Old Liabilities
154 West Bengal 0 Kalyani, Nadia district 48.86 2016-17 Old Liabilities
155 West Bengal 0 Hattala, Bolpur, Birbhum district 94.82 2016-17 Old Liabilities
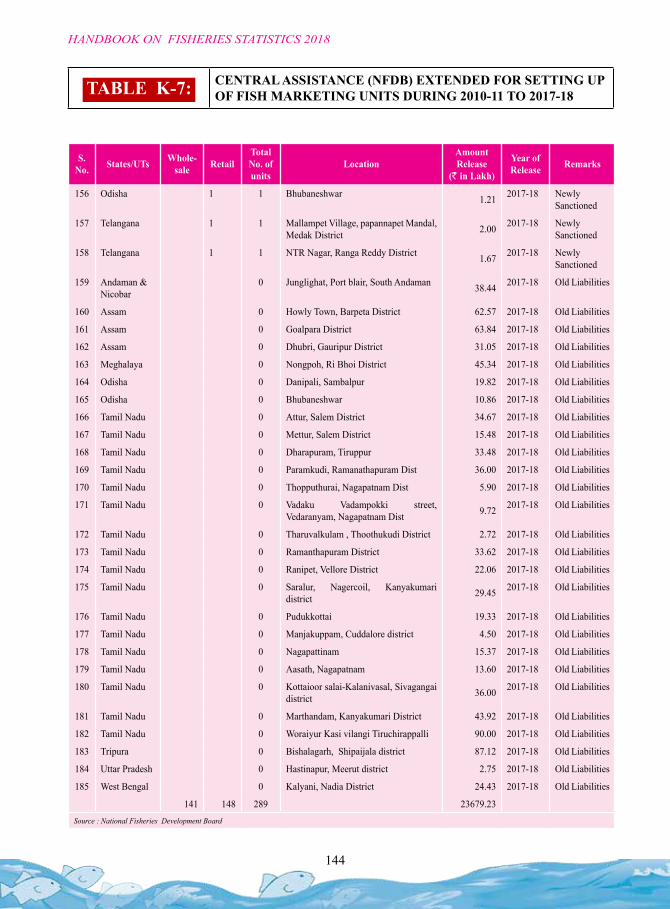
144
HANDBOOK ON FISHERIES STATISTICS 2018
S. No. States/UTs Whole-
sale RetailTotal No. of units
LocationAmount Release
(` in Lakh)
Year of Release Remarks
156 Odisha 1 1 Bhubaneshwar 1.21 2017-18 Newly Sanctioned
157 Telangana 1 1 Mallampet Village, papannapet Mandal, Medak District 2.00 2017-18 Newly
Sanctioned
158 Telangana 1 1 NTR Nagar, Ranga Reddy District 1.67 2017-18 Newly Sanctioned
159 Andaman & Nicobar
0 Junglighat, Port blair, South Andaman 38.44 2017-18 Old Liabilities
160 Assam 0 Howly Town, Barpeta District 62.57 2017-18 Old Liabilities
161 Assam 0 Goalpara District 63.84 2017-18 Old Liabilities
162 Assam 0 Dhubri, Gauripur District 31.05 2017-18 Old Liabilities
163 Meghalaya 0 Nongpoh, Ri Bhoi District 45.34 2017-18 Old Liabilities
164 Odisha 0 Danipali, Sambalpur 19.82 2017-18 Old Liabilities
165 Odisha 0 Bhubaneshwar 10.86 2017-18 Old Liabilities
166 Tamil Nadu 0 Attur, Salem District 34.67 2017-18 Old Liabilities
167 Tamil Nadu 0 Mettur, Salem District 15.48 2017-18 Old Liabilities
168 Tamil Nadu 0 Dharapuram, Tiruppur 33.48 2017-18 Old Liabilities
169 Tamil Nadu 0 Paramkudi, Ramanathapuram Dist 36.00 2017-18 Old Liabilities
170 Tamil Nadu 0 Thopputhurai, Nagapatnam Dist 5.90 2017-18 Old Liabilities
171 Tamil Nadu 0 Vadaku Vadampokki street, Vedaranyam, Nagapatnam Dist 9.72 2017-18 Old Liabilities
172 Tamil Nadu 0 Tharuvalkulam , Thoothukudi District 2.72 2017-18 Old Liabilities
173 Tamil Nadu 0 Ramanthapuram District 33.62 2017-18 Old Liabilities
174 Tamil Nadu 0 Ranipet, Vellore District 22.06 2017-18 Old Liabilities
175 Tamil Nadu 0 Saralur, Nagercoil, Kanyakumari district 29.45 2017-18 Old Liabilities
176 Tamil Nadu 0 Pudukkottai 19.33 2017-18 Old Liabilities
177 Tamil Nadu 0 Manjakuppam, Cuddalore district 4.50 2017-18 Old Liabilities
178 Tamil Nadu 0 Nagapattinam 15.37 2017-18 Old Liabilities
179 Tamil Nadu 0 Aasath, Nagapatnam 13.60 2017-18 Old Liabilities
180 Tamil Nadu 0 Kottaioor salai-Kalanivasal, Sivagangai district 36.00 2017-18 Old Liabilities
181 Tamil Nadu 0 Marthandam, Kanyakumari District 43.92 2017-18 Old Liabilities
182 Tamil Nadu 0 Woraiyur Kasi vilangi Tiruchirappalli 90.00 2017-18 Old Liabilities
183 Tripura 0 Bishalagarh, Shipaijala district 87.12 2017-18 Old Liabilities
184 Uttar Pradesh 0 Hastinapur, Meerut district 2.75 2017-18 Old Liabilities
185 West Bengal 0 Kalyani, Nadia District 24.43 2017-18 Old Liabilities
141 148 289 23679.23Source : National Fisheries Development Board
TABLE K-7: CENTRAL ASSISTANCE (NFDB) EXTENDED FOR SETTING UP OF FISH MARKETING UNITS DURING 2010-11 TO 2017-18
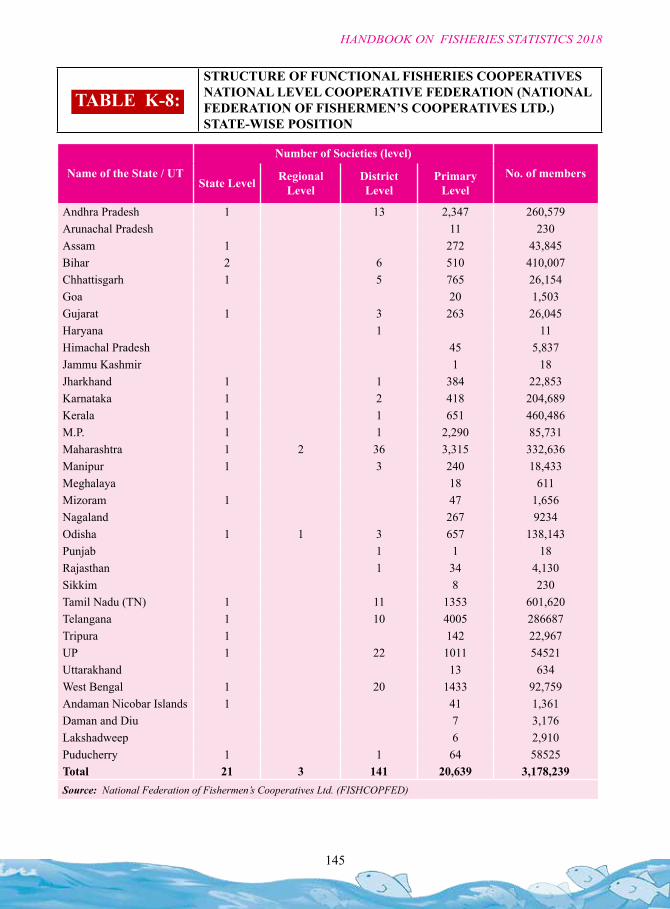
145
HANDBOOK ON FISHERIES STATISTICS 2018
TABLE K-8: STRUCTURE OF FUNCTIONAL FISHERIES COOPERATIVES NATIONAL LEVEL COOPERATIVE FEDERATION (NATIONAL FEDERATION OF FISHERMEN’S COOPERATIVES LTD.) STATE-WISE POSITION
Name of the State / UT
Number of Societies (level)
No. of membersState Level Regional
LevelDistrict Level
Primary Level
Andhra Pradesh 1 13 2,347 260,579Arunachal Pradesh 11 230Assam 1 272 43,845Bihar 2 6 510 410,007Chhattisgarh 1 5 765 26,154Goa 20 1,503Gujarat 1 3 263 26,045Haryana 1 11Himachal Pradesh 45 5,837Jammu Kashmir 1 18Jharkhand 1 1 384 22,853Karnataka 1 2 418 204,689Kerala 1 1 651 460,486M.P. 1 1 2,290 85,731Maharashtra 1 2 36 3,315 332,636Manipur 1 3 240 18,433Meghalaya 18 611Mizoram 1 47 1,656Nagaland 267 9234Odisha 1 1 3 657 138,143Punjab 1 1 18Rajasthan 1 34 4,130Sikkim 8 230Tamil Nadu (TN) 1 11 1353 601,620Telangana 1 10 4005 286687Tripura 1 142 22,967UP 1 22 1011 54521Uttarakhand 13 634West Bengal 1 20 1433 92,759Andaman Nicobar Islands 1 41 1,361Daman and Diu 7 3,176Lakshadweep 6 2,910Puducherry 1 1 64 58525Total 21 3 141 20,639 3,178,239Source: National Federation of Fishermen’s Cooperatives Ltd. (FISHCOPFED)
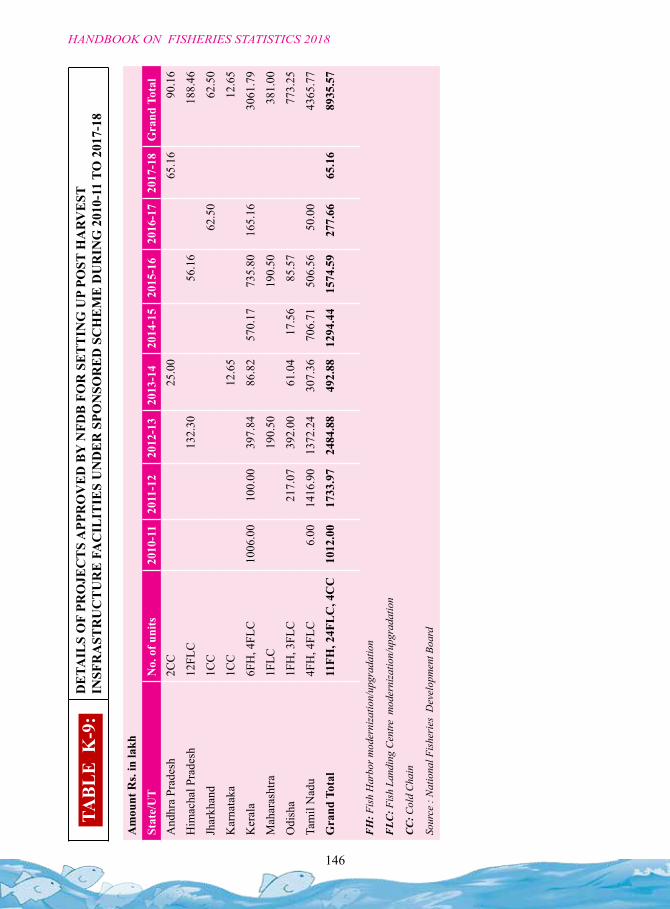
146
HANDBOOK ON FISHERIES STATISTICS 2018
TABL
E K
-9:
DE
TAIL
S O
F PR
OJE
CT
S A
PPR
OV
ED
BY
NFD
B F
OR
SE
TT
ING
UP
POST
HA
RV
EST
IN
SFR
AST
RU
CT
UR
E F
AC
ILIT
IES
UN
DE
R S
PON
SOR
ED
SC
HE
ME
DU
RIN
G 2
010-
11 T
O 2
017-
18
Am
ount
Rs.
in la
kh
Stat
e/U
TN
o. o
f uni
ts20
10-1
120
11-1
220
12-1
320
13-1
420
14-1
520
15-1
620
16-1
720
17-1
8G
rand
Tot
alA
ndhr
a Pr
ades
h2C
C25
.00
65.1
690
.16
Him
acha
l Pra
desh
12FL
C13
2.30
56.1
618
8.46
Jhar
khan
d1C
C62
.50
62.5
0
Kar
nata
ka1C
C12
.65
12.6
5
Ker
ala
6FH
, 4FL
C10
06.0
010
0.00
397.
8486
.82
570.
1773
5.80
165.
1630
61.7
9
Mah
aras
htra
1FLC
190.
5019
0.50
381.
00
Odi
sha
1FH
, 3FL
C21
7.07
392.
0061
.04
17.5
685
.57
773.
25
Tam
il N
adu
4FH
, 4FL
C6.
0014
16.9
013
72.2
430
7.36
706.
7150
6.56
50.0
043
65.7
7
Gra
nd T
otal
11FH
, 24F
LC
, 4C
C10
12.0
017
33.9
724
84.8
849
2.88
1294
.44
1574
.59
277.
6665
.16
8935
.57
FH
: Fis
h H
arbo
r mod
erni
zatio
n/up
grad
atio
n
FLC
: Fis
h La
ndin
g C
entre
mod
erni
zatio
n/up
grad
atio
n
CC
: Col
d C
hain
Sour
ce :
Nat
iona
l Fis
heri
es D
evel
opm
ent B
oard
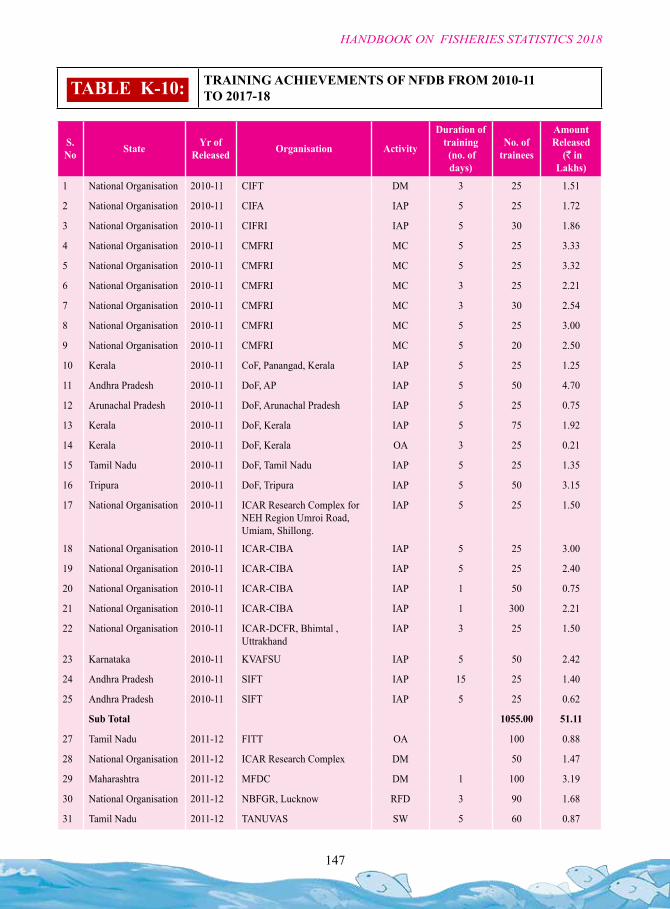
147
HANDBOOK ON FISHERIES STATISTICS 2018
S. No State Yr of
Released Organisation Activity
Duration of training (no. of days)
No. of trainees
Amount Released
(` in Lakhs)
1 National Organisation 2010-11 CIFT DM 3 25 1.51
2 National Organisation 2010-11 CIFA IAP 5 25 1.72
3 National Organisation 2010-11 CIFRI IAP 5 30 1.86
4 National Organisation 2010-11 CMFRI MC 5 25 3.33
5 National Organisation 2010-11 CMFRI MC 5 25 3.32
6 National Organisation 2010-11 CMFRI MC 3 25 2.21
7 National Organisation 2010-11 CMFRI MC 3 30 2.54
8 National Organisation 2010-11 CMFRI MC 5 25 3.00
9 National Organisation 2010-11 CMFRI MC 5 20 2.50
10 Kerala 2010-11 CoF, Panangad, Kerala IAP 5 25 1.25
11 Andhra Pradesh 2010-11 DoF, AP IAP 5 50 4.70
12 Arunachal Pradesh 2010-11 DoF, Arunachal Pradesh IAP 5 25 0.75
13 Kerala 2010-11 DoF, Kerala IAP 5 75 1.92
14 Kerala 2010-11 DoF, Kerala OA 3 25 0.21
15 Tamil Nadu 2010-11 DoF, Tamil Nadu IAP 5 25 1.35
16 Tripura 2010-11 DoF, Tripura IAP 5 50 3.15
17 National Organisation 2010-11 ICAR Research Complex for NEH Region Umroi Road, Umiam, Shillong.
IAP 5 25 1.50
18 National Organisation 2010-11 ICAR-CIBA IAP 5 25 3.00
19 National Organisation 2010-11 ICAR-CIBA IAP 5 25 2.40
20 National Organisation 2010-11 ICAR-CIBA IAP 1 50 0.75
21 National Organisation 2010-11 ICAR-CIBA IAP 1 300 2.21
22 National Organisation 2010-11 ICAR-DCFR, Bhimtal , Uttrakhand
IAP 3 25 1.50
23 Karnataka 2010-11 KVAFSU IAP 5 50 2.42
24 Andhra Pradesh 2010-11 SIFT IAP 15 25 1.40
25 Andhra Pradesh 2010-11 SIFT IAP 5 25 0.62
Sub Total 1055.00 51.11
27 Tamil Nadu 2011-12 FITT OA 100 0.88
28 National Organisation 2011-12 ICAR Research Complex DM 50 1.47
29 Maharashtra 2011-12 MFDC DM 1 100 3.19
30 National Organisation 2011-12 NBFGR, Lucknow RFD 3 90 1.68
31 Tamil Nadu 2011-12 TANUVAS SW 5 60 0.87
TABLE K-10: TRAINING ACHIEVEMENTS OF NFDB FROM 2010-11 TO 2017-18
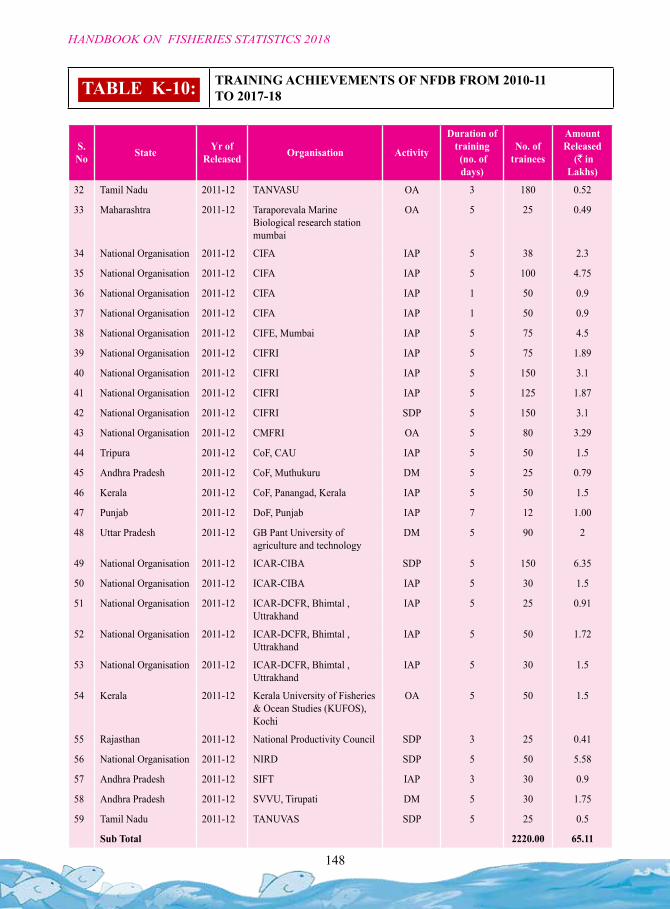
148
HANDBOOK ON FISHERIES STATISTICS 2018
S. No State Yr of
Released Organisation Activity
Duration of training (no. of days)
No. of trainees
Amount Released
(` in Lakhs)
32 Tamil Nadu 2011-12 TANVASU OA 3 180 0.52
33 Maharashtra 2011-12 Taraporevala Marine Biological research station mumbai
OA 5 25 0.49
34 National Organisation 2011-12 CIFA IAP 5 38 2.3
35 National Organisation 2011-12 CIFA IAP 5 100 4.75
36 National Organisation 2011-12 CIFA IAP 1 50 0.9
37 National Organisation 2011-12 CIFA IAP 1 50 0.9
38 National Organisation 2011-12 CIFE, Mumbai IAP 5 75 4.5
39 National Organisation 2011-12 CIFRI IAP 5 75 1.89
40 National Organisation 2011-12 CIFRI IAP 5 150 3.1
41 National Organisation 2011-12 CIFRI IAP 5 125 1.87
42 National Organisation 2011-12 CIFRI SDP 5 150 3.1
43 National Organisation 2011-12 CMFRI OA 5 80 3.29
44 Tripura 2011-12 CoF, CAU IAP 5 50 1.5
45 Andhra Pradesh 2011-12 CoF, Muthukuru DM 5 25 0.79
46 Kerala 2011-12 CoF, Panangad, Kerala IAP 5 50 1.5
47 Punjab 2011-12 DoF, Punjab IAP 7 12 1.00
48 Uttar Pradesh 2011-12 GB Pant University of agriculture and technology
DM 5 90 2
49 National Organisation 2011-12 ICAR-CIBA SDP 5 150 6.35
50 National Organisation 2011-12 ICAR-CIBA IAP 5 30 1.5
51 National Organisation 2011-12 ICAR-DCFR, Bhimtal , Uttrakhand
IAP 5 25 0.91
52 National Organisation 2011-12 ICAR-DCFR, Bhimtal , Uttrakhand
IAP 5 50 1.72
53 National Organisation 2011-12 ICAR-DCFR, Bhimtal , Uttrakhand
IAP 5 30 1.5
54 Kerala 2011-12 Kerala University of Fisheries & Ocean Studies (KUFOS), Kochi
OA 5 50 1.5
55 Rajasthan 2011-12 National Productivity Council SDP 3 25 0.41
56 National Organisation 2011-12 NIRD SDP 5 50 5.58
57 Andhra Pradesh 2011-12 SIFT IAP 3 30 0.9
58 Andhra Pradesh 2011-12 SVVU, Tirupati DM 5 30 1.75
59 Tamil Nadu 2011-12 TANUVAS SDP 5 25 0.5
Sub Total 2220.00 65.11
TABLE K-10: TRAINING ACHIEVEMENTS OF NFDB FROM 2010-11 TO 2017-18
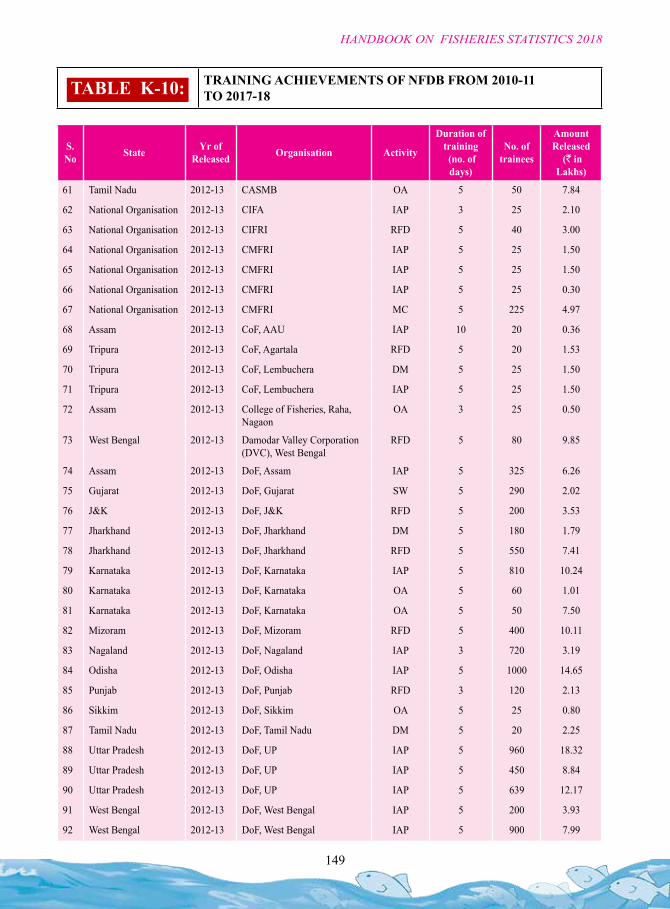
149
HANDBOOK ON FISHERIES STATISTICS 2018
S. No State Yr of
Released Organisation Activity
Duration of training (no. of days)
No. of trainees
Amount Released
(` in Lakhs)
61 Tamil Nadu 2012-13 CASMB OA 5 50 7.84
62 National Organisation 2012-13 CIFA IAP 3 25 2.10
63 National Organisation 2012-13 CIFRI RFD 5 40 3.00
64 National Organisation 2012-13 CMFRI IAP 5 25 1.50
65 National Organisation 2012-13 CMFRI IAP 5 25 1.50
66 National Organisation 2012-13 CMFRI IAP 5 25 0.30
67 National Organisation 2012-13 CMFRI MC 5 225 4.97
68 Assam 2012-13 CoF, AAU IAP 10 20 0.36
69 Tripura 2012-13 CoF, Agartala RFD 5 20 1.53
70 Tripura 2012-13 CoF, Lembuchera DM 5 25 1.50
71 Tripura 2012-13 CoF, Lembuchera IAP 5 25 1.50
72 Assam 2012-13 College of Fisheries, Raha, Nagaon
OA 3 25 0.50
73 West Bengal 2012-13 Damodar Valley Corporation (DVC), West Bengal
RFD 5 80 9.85
74 Assam 2012-13 DoF, Assam IAP 5 325 6.26
75 Gujarat 2012-13 DoF, Gujarat SW 5 290 2.02
76 J&K 2012-13 DoF, J&K RFD 5 200 3.53
77 Jharkhand 2012-13 DoF, Jharkhand DM 5 180 1.79
78 Jharkhand 2012-13 DoF, Jharkhand RFD 5 550 7.41
79 Karnataka 2012-13 DoF, Karnataka IAP 5 810 10.24
80 Karnataka 2012-13 DoF, Karnataka OA 5 60 1.01
81 Karnataka 2012-13 DoF, Karnataka OA 5 50 7.50
82 Mizoram 2012-13 DoF, Mizoram RFD 5 400 10.11
83 Nagaland 2012-13 DoF, Nagaland IAP 3 720 3.19
84 Odisha 2012-13 DoF, Odisha IAP 5 1000 14.65
85 Punjab 2012-13 DoF, Punjab RFD 3 120 2.13
86 Sikkim 2012-13 DoF, Sikkim OA 5 25 0.80
87 Tamil Nadu 2012-13 DoF, Tamil Nadu DM 5 20 2.25
88 Uttar Pradesh 2012-13 DoF, UP IAP 5 960 18.32
89 Uttar Pradesh 2012-13 DoF, UP IAP 5 450 8.84
90 Uttar Pradesh 2012-13 DoF, UP IAP 5 639 12.17
91 West Bengal 2012-13 DoF, West Bengal IAP 5 200 3.93
92 West Bengal 2012-13 DoF, West Bengal IAP 5 900 7.99
TABLE K-10: TRAINING ACHIEVEMENTS OF NFDB FROM 2010-11 TO 2017-18
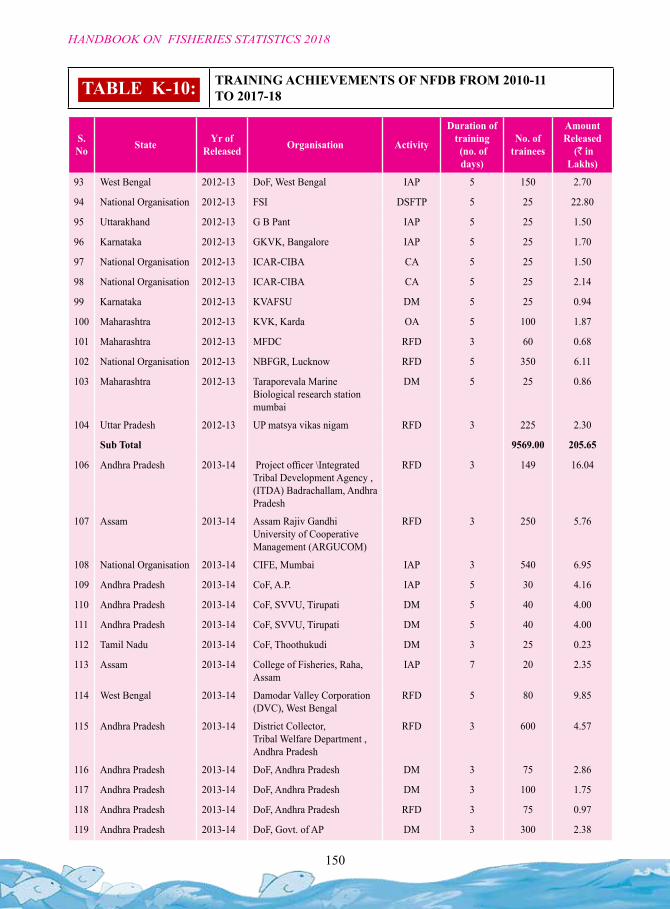
150
HANDBOOK ON FISHERIES STATISTICS 2018
S. No State Yr of
Released Organisation Activity
Duration of training (no. of days)
No. of trainees
Amount Released
(` in Lakhs)
93 West Bengal 2012-13 DoF, West Bengal IAP 5 150 2.70
94 National Organisation 2012-13 FSI DSFTP 5 25 22.80
95 Uttarakhand 2012-13 G B Pant IAP 5 25 1.50
96 Karnataka 2012-13 GKVK, Bangalore IAP 5 25 1.70
97 National Organisation 2012-13 ICAR-CIBA CA 5 25 1.50
98 National Organisation 2012-13 ICAR-CIBA CA 5 25 2.14
99 Karnataka 2012-13 KVAFSU DM 5 25 0.94
100 Maharashtra 2012-13 KVK, Karda OA 5 100 1.87
101 Maharashtra 2012-13 MFDC RFD 3 60 0.68
102 National Organisation 2012-13 NBFGR, Lucknow RFD 5 350 6.11
103 Maharashtra 2012-13 Taraporevala Marine Biological research station mumbai
DM 5 25 0.86
104 Uttar Pradesh 2012-13 UP matsya vikas nigam RFD 3 225 2.30
Sub Total 9569.00 205.65
106 Andhra Pradesh 2013-14 Project officer \Integrated Tribal Development Agency , (ITDA) Badrachallam, Andhra Pradesh
RFD 3 149 16.04
107 Assam 2013-14 Assam Rajiv Gandhi University of Cooperative Management (ARGUCOM)
RFD 3 250 5.76
108 National Organisation 2013-14 CIFE, Mumbai IAP 3 540 6.95
109 Andhra Pradesh 2013-14 CoF, A.P. IAP 5 30 4.16
110 Andhra Pradesh 2013-14 CoF, SVVU, Tirupati DM 5 40 4.00
111 Andhra Pradesh 2013-14 CoF, SVVU, Tirupati DM 5 40 4.00
112 Tamil Nadu 2013-14 CoF, Thoothukudi DM 3 25 0.23
113 Assam 2013-14 College of Fisheries, Raha, Assam
IAP 7 20 2.35
114 West Bengal 2013-14 Damodar Valley Corporation (DVC), West Bengal
RFD 5 80 9.85
115 Andhra Pradesh 2013-14 District Collector, Tribal Welfare Department , Andhra Pradesh
RFD 3 600 4.57
116 Andhra Pradesh 2013-14 DoF, Andhra Pradesh DM 3 75 2.86
117 Andhra Pradesh 2013-14 DoF, Andhra Pradesh DM 3 100 1.75
118 Andhra Pradesh 2013-14 DoF, Andhra Pradesh RFD 3 75 0.97
119 Andhra Pradesh 2013-14 DoF, Govt. of AP DM 3 300 2.38
TABLE K-10: TRAINING ACHIEVEMENTS OF NFDB FROM 2010-11 TO 2017-18
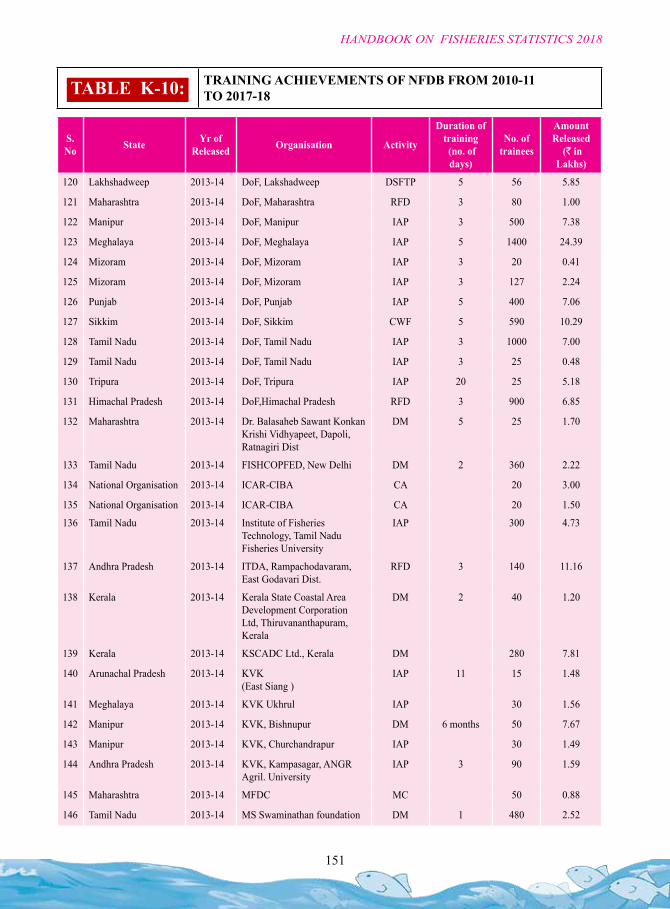
151
HANDBOOK ON FISHERIES STATISTICS 2018
S. No State Yr of
Released Organisation Activity
Duration of training (no. of days)
No. of trainees
Amount Released
(` in Lakhs)
120 Lakhshadweep 2013-14 DoF, Lakshadweep DSFTP 5 56 5.85
121 Maharashtra 2013-14 DoF, Maharashtra RFD 3 80 1.00
122 Manipur 2013-14 DoF, Manipur IAP 3 500 7.38
123 Meghalaya 2013-14 DoF, Meghalaya IAP 5 1400 24.39
124 Mizoram 2013-14 DoF, Mizoram IAP 3 20 0.41
125 Mizoram 2013-14 DoF, Mizoram IAP 3 127 2.24
126 Punjab 2013-14 DoF, Punjab IAP 5 400 7.06
127 Sikkim 2013-14 DoF, Sikkim CWF 5 590 10.29
128 Tamil Nadu 2013-14 DoF, Tamil Nadu IAP 3 1000 7.00
129 Tamil Nadu 2013-14 DoF, Tamil Nadu IAP 3 25 0.48
130 Tripura 2013-14 DoF, Tripura IAP 20 25 5.18
131 Himachal Pradesh 2013-14 DoF,Himachal Pradesh RFD 3 900 6.85
132 Maharashtra 2013-14 Dr. Balasaheb Sawant Konkan Krishi Vidhyapeet, Dapoli, Ratnagiri Dist
DM 5 25 1.70
133 Tamil Nadu 2013-14 FISHCOPFED, New Delhi DM 2 360 2.22
134 National Organisation 2013-14 ICAR-CIBA CA 20 3.00
135 National Organisation 2013-14 ICAR-CIBA CA 20 1.50
136 Tamil Nadu 2013-14 Institute of Fisheries Technology, Tamil Nadu Fisheries University
IAP 300 4.73
137 Andhra Pradesh 2013-14 ITDA, Rampachodavaram, East Godavari Dist.
RFD 3 140 11.16
138 Kerala 2013-14 Kerala State Coastal Area Development Corporation Ltd, Thiruvananthapuram, Kerala
DM 2 40 1.20
139 Kerala 2013-14 KSCADC Ltd., Kerala DM 280 7.81
140 Arunachal Pradesh 2013-14 KVK (East Siang )
IAP 11 15 1.48
141 Meghalaya 2013-14 KVK Ukhrul IAP 30 1.56
142 Manipur 2013-14 KVK, Bishnupur DM 6 months 50 7.67
143 Manipur 2013-14 KVK, Churchandrapur IAP 30 1.49
144 Andhra Pradesh 2013-14 KVK, Kampasagar, ANGR Agril. University
IAP 3 90 1.59
145 Maharashtra 2013-14 MFDC MC 50 0.88
146 Tamil Nadu 2013-14 MS Swaminathan foundation DM 1 480 2.52
TABLE K-10: TRAINING ACHIEVEMENTS OF NFDB FROM 2010-11 TO 2017-18
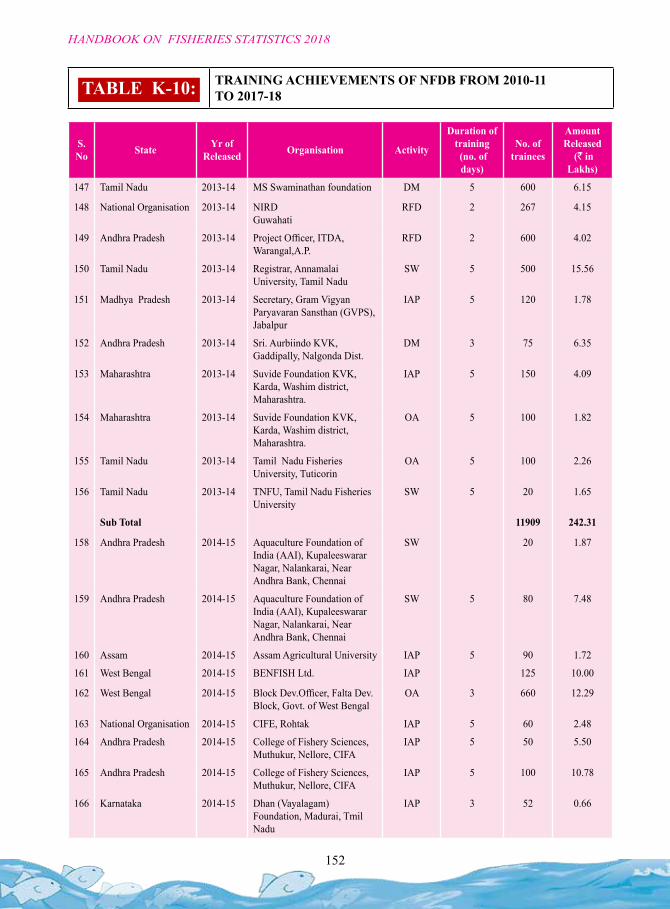
152
HANDBOOK ON FISHERIES STATISTICS 2018
S. No State Yr of
Released Organisation Activity
Duration of training (no. of days)
No. of trainees
Amount Released
(` in Lakhs)
147 Tamil Nadu 2013-14 MS Swaminathan foundation DM 5 600 6.15
148 National Organisation 2013-14 NIRD Guwahati
RFD 2 267 4.15
149 Andhra Pradesh 2013-14 Project Officer, ITDA, Warangal,A.P.
RFD 2 600 4.02
150 Tamil Nadu 2013-14 Registrar, Annamalai University, Tamil Nadu
SW 5 500 15.56
151 Madhya Pradesh 2013-14 Secretary, Gram Vigyan Paryavaran Sansthan (GVPS), Jabalpur
IAP 5 120 1.78
152 Andhra Pradesh 2013-14 Sri. Aurbiindo KVK, Gaddipally, Nalgonda Dist.
DM 3 75 6.35
153 Maharashtra 2013-14 Suvide Foundation KVK, Karda, Washim district, Maharashtra.
IAP 5 150 4.09
154 Maharashtra 2013-14 Suvide Foundation KVK, Karda, Washim district, Maharashtra.
OA 5 100 1.82
155 Tamil Nadu 2013-14 Tamil Nadu Fisheries University, Tuticorin
OA 5 100 2.26
156 Tamil Nadu 2013-14 TNFU, Tamil Nadu Fisheries University
SW 5 20 1.65
Sub Total 11909 242.31
158 Andhra Pradesh 2014-15 Aquaculture Foundation of India (AAI), Kupaleeswarar Nagar, Nalankarai, Near Andhra Bank, Chennai
SW 20 1.87
159 Andhra Pradesh 2014-15 Aquaculture Foundation of India (AAI), Kupaleeswarar Nagar, Nalankarai, Near Andhra Bank, Chennai
SW 5 80 7.48
160 Assam 2014-15 Assam Agricultural University IAP 5 90 1.72
161 West Bengal 2014-15 BENFISH Ltd. IAP 125 10.00
162 West Bengal 2014-15 Block Dev.Officer, Falta Dev.Block, Govt. of West Bengal
OA 3 660 12.29
163 National Organisation 2014-15 CIFE, Rohtak IAP 5 60 2.48
164 Andhra Pradesh 2014-15 College of Fishery Sciences, Muthukur, Nellore, CIFA
IAP 5 50 5.50
165 Andhra Pradesh 2014-15 College of Fishery Sciences, Muthukur, Nellore, CIFA
IAP 5 100 10.78
166 Karnataka 2014-15 Dhan (Vayalagam) Foundation, Madurai, Tmil Nadu
IAP 3 52 0.66
TABLE K-10: TRAINING ACHIEVEMENTS OF NFDB FROM 2010-11 TO 2017-18
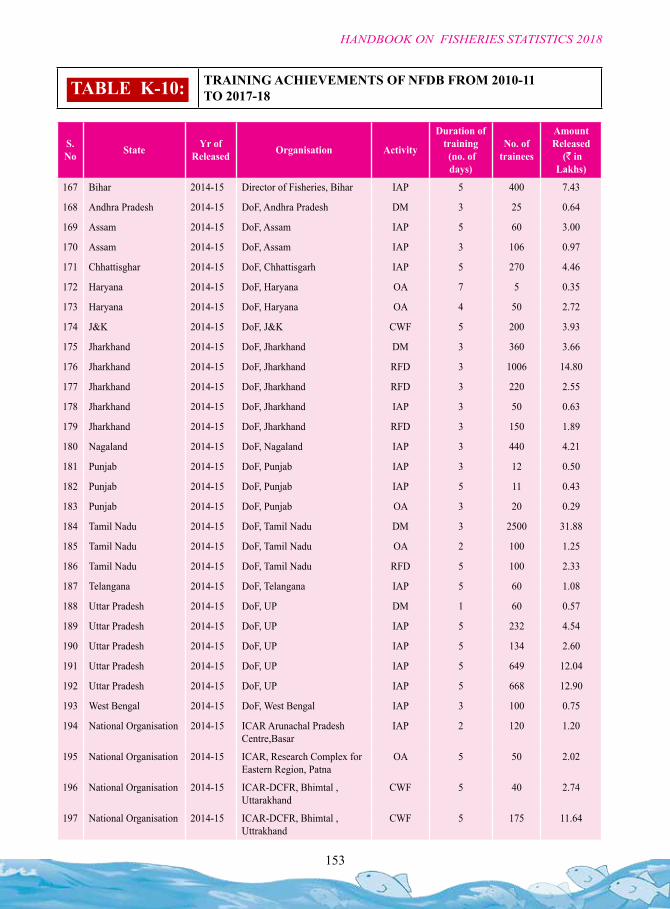
153
HANDBOOK ON FISHERIES STATISTICS 2018
S. No State Yr of
Released Organisation Activity
Duration of training (no. of days)
No. of trainees
Amount Released
(` in Lakhs)
167 Bihar 2014-15 Director of Fisheries, Bihar IAP 5 400 7.43
168 Andhra Pradesh 2014-15 DoF, Andhra Pradesh DM 3 25 0.64
169 Assam 2014-15 DoF, Assam IAP 5 60 3.00
170 Assam 2014-15 DoF, Assam IAP 3 106 0.97
171 Chhattisghar 2014-15 DoF, Chhattisgarh IAP 5 270 4.46
172 Haryana 2014-15 DoF, Haryana OA 7 5 0.35
173 Haryana 2014-15 DoF, Haryana OA 4 50 2.72
174 J&K 2014-15 DoF, J&K CWF 5 200 3.93
175 Jharkhand 2014-15 DoF, Jharkhand DM 3 360 3.66
176 Jharkhand 2014-15 DoF, Jharkhand RFD 3 1006 14.80
177 Jharkhand 2014-15 DoF, Jharkhand RFD 3 220 2.55
178 Jharkhand 2014-15 DoF, Jharkhand IAP 3 50 0.63
179 Jharkhand 2014-15 DoF, Jharkhand RFD 3 150 1.89
180 Nagaland 2014-15 DoF, Nagaland IAP 3 440 4.21
181 Punjab 2014-15 DoF, Punjab IAP 3 12 0.50
182 Punjab 2014-15 DoF, Punjab IAP 5 11 0.43
183 Punjab 2014-15 DoF, Punjab OA 3 20 0.29
184 Tamil Nadu 2014-15 DoF, Tamil Nadu DM 3 2500 31.88
185 Tamil Nadu 2014-15 DoF, Tamil Nadu OA 2 100 1.25
186 Tamil Nadu 2014-15 DoF, Tamil Nadu RFD 5 100 2.33
187 Telangana 2014-15 DoF, Telangana IAP 5 60 1.08
188 Uttar Pradesh 2014-15 DoF, UP DM 1 60 0.57
189 Uttar Pradesh 2014-15 DoF, UP IAP 5 232 4.54
190 Uttar Pradesh 2014-15 DoF, UP IAP 5 134 2.60
191 Uttar Pradesh 2014-15 DoF, UP IAP 5 649 12.04
192 Uttar Pradesh 2014-15 DoF, UP IAP 5 668 12.90
193 West Bengal 2014-15 DoF, West Bengal IAP 3 100 0.75
194 National Organisation 2014-15 ICAR Arunachal Pradesh Centre,Basar
IAP 2 120 1.20
195 National Organisation 2014-15 ICAR, Research Complex for Eastern Region, Patna
OA 5 50 2.02
196 National Organisation 2014-15 ICAR-DCFR, Bhimtal , Uttarakhand
CWF 5 40 2.74
197 National Organisation 2014-15 ICAR-DCFR, Bhimtal , Uttrakhand
CWF 5 175 11.64
TABLE K-10: TRAINING ACHIEVEMENTS OF NFDB FROM 2010-11 TO 2017-18
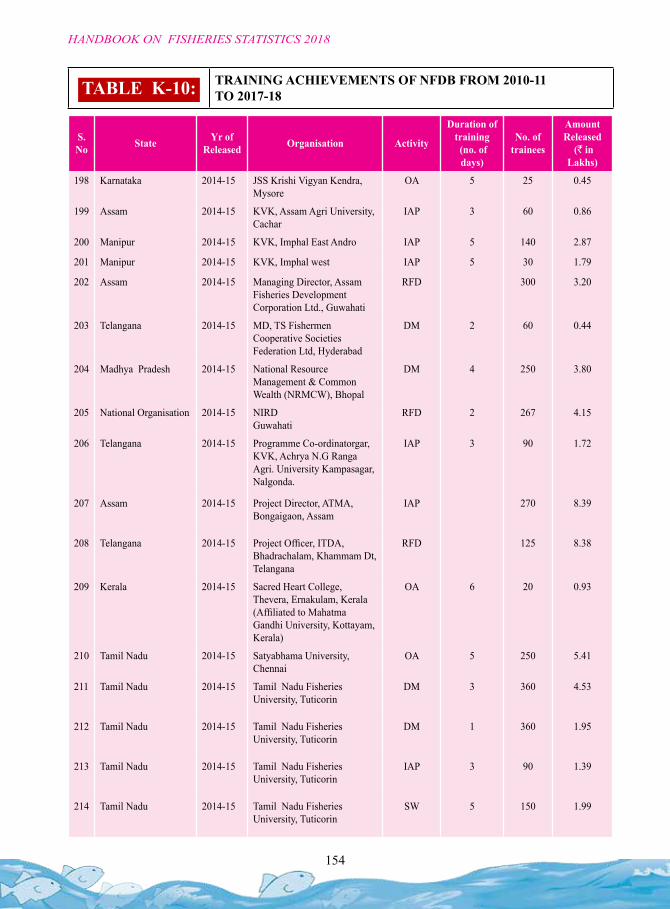
154
HANDBOOK ON FISHERIES STATISTICS 2018
S. No State Yr of
Released Organisation Activity
Duration of training (no. of days)
No. of trainees
Amount Released
(` in Lakhs)
198 Karnataka 2014-15 JSS Krishi Vigyan Kendra, Mysore
OA 5 25 0.45
199 Assam 2014-15 KVK, Assam Agri University, Cachar
IAP 3 60 0.86
200 Manipur 2014-15 KVK, Imphal East Andro IAP 5 140 2.87
201 Manipur 2014-15 KVK, Imphal west IAP 5 30 1.79
202 Assam 2014-15 Managing Director, Assam Fisheries Development Corporation Ltd., Guwahati
RFD 300 3.20
203 Telangana 2014-15 MD, TS Fishermen Cooperative Societies Federation Ltd, Hyderabad
DM 2 60 0.44
204 Madhya Pradesh 2014-15 National Resource Management & Common Wealth (NRMCW), Bhopal
DM 4 250 3.80
205 National Organisation 2014-15 NIRD Guwahati
RFD 2 267 4.15
206 Telangana 2014-15 Programme Co-ordinatorgar, KVK, Achrya N.G Ranga Agri. University Kampasagar, Nalgonda.
IAP 3 90 1.72
207 Assam 2014-15 Project Director, ATMA, Bongaigaon, Assam
IAP 270 8.39
208 Telangana 2014-15 Project Officer, ITDA, Bhadrachalam, Khammam Dt, Telangana
RFD 125 8.38
209 Kerala 2014-15 Sacred Heart College, Thevera, Ernakulam, Kerala (Affiliated to Mahatma Gandhi University, Kottayam, Kerala)
OA 6 20 0.93
210 Tamil Nadu 2014-15 Satyabhama University, Chennai
OA 5 250 5.41
211 Tamil Nadu 2014-15 Tamil Nadu Fisheries University, Tuticorin
DM 3 360 4.53
212 Tamil Nadu 2014-15 Tamil Nadu Fisheries University, Tuticorin
DM 1 360 1.95
213 Tamil Nadu 2014-15 Tamil Nadu Fisheries University, Tuticorin
IAP 3 90 1.39
214 Tamil Nadu 2014-15 Tamil Nadu Fisheries University, Tuticorin
SW 5 150 1.99
TABLE K-10: TRAINING ACHIEVEMENTS OF NFDB FROM 2010-11 TO 2017-18
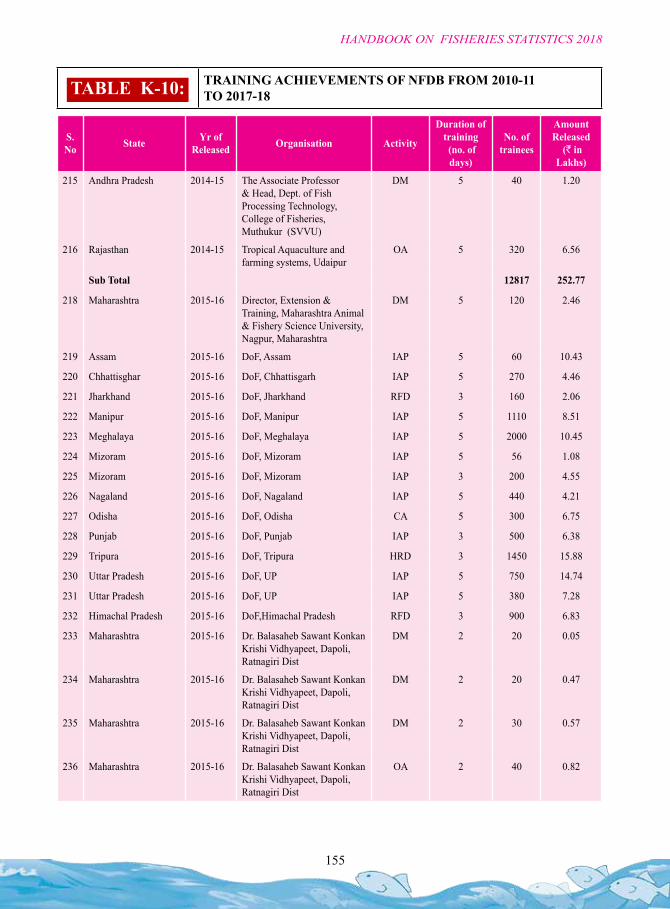
155
HANDBOOK ON FISHERIES STATISTICS 2018
S. No State Yr of
Released Organisation Activity
Duration of training (no. of days)
No. of trainees
Amount Released
(` in Lakhs)
215 Andhra Pradesh 2014-15 The Associate Professor & Head, Dept. of Fish Processing Technology, College of Fisheries, Muthukur (SVVU)
DM 5 40 1.20
216 Rajasthan 2014-15 Tropical Aquaculture and farming systems, Udaipur
OA 5 320 6.56
Sub Total 12817 252.77
218 Maharashtra 2015-16 Director, Extension & Training, Maharashtra Animal & Fishery Science University, Nagpur, Maharashtra
DM 5 120 2.46
219 Assam 2015-16 DoF, Assam IAP 5 60 10.43
220 Chhattisghar 2015-16 DoF, Chhattisgarh IAP 5 270 4.46
221 Jharkhand 2015-16 DoF, Jharkhand RFD 3 160 2.06
222 Manipur 2015-16 DoF, Manipur IAP 5 1110 8.51
223 Meghalaya 2015-16 DoF, Meghalaya IAP 5 2000 10.45
224 Mizoram 2015-16 DoF, Mizoram IAP 5 56 1.08
225 Mizoram 2015-16 DoF, Mizoram IAP 3 200 4.55
226 Nagaland 2015-16 DoF, Nagaland IAP 5 440 4.21
227 Odisha 2015-16 DoF, Odisha CA 5 300 6.75
228 Punjab 2015-16 DoF, Punjab IAP 3 500 6.38
229 Tripura 2015-16 DoF, Tripura HRD 3 1450 15.88
230 Uttar Pradesh 2015-16 DoF, UP IAP 5 750 14.74
231 Uttar Pradesh 2015-16 DoF, UP IAP 5 380 7.28
232 Himachal Pradesh 2015-16 DoF,Himachal Pradesh RFD 3 900 6.83
233 Maharashtra 2015-16 Dr. Balasaheb Sawant Konkan Krishi Vidhyapeet, Dapoli, Ratnagiri Dist
DM 2 20 0.05
234 Maharashtra 2015-16 Dr. Balasaheb Sawant Konkan Krishi Vidhyapeet, Dapoli, Ratnagiri Dist
DM 2 20 0.47
235 Maharashtra 2015-16 Dr. Balasaheb Sawant Konkan Krishi Vidhyapeet, Dapoli, Ratnagiri Dist
DM 2 30 0.57
236 Maharashtra 2015-16 Dr. Balasaheb Sawant Konkan Krishi Vidhyapeet, Dapoli, Ratnagiri Dist
OA 2 40 0.82
TABLE K-10: TRAINING ACHIEVEMENTS OF NFDB FROM 2010-11 TO 2017-18
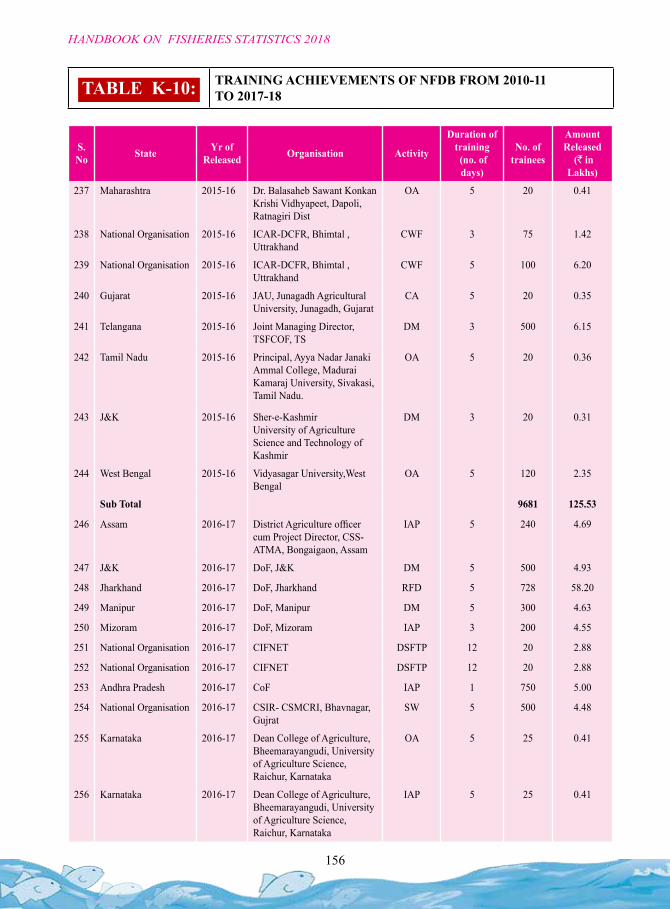
156
HANDBOOK ON FISHERIES STATISTICS 2018
S. No State Yr of
Released Organisation Activity
Duration of training (no. of days)
No. of trainees
Amount Released
(` in Lakhs)
237 Maharashtra 2015-16 Dr. Balasaheb Sawant Konkan Krishi Vidhyapeet, Dapoli, Ratnagiri Dist
OA 5 20 0.41
238 National Organisation 2015-16 ICAR-DCFR, Bhimtal , Uttrakhand
CWF 3 75 1.42
239 National Organisation 2015-16 ICAR-DCFR, Bhimtal , Uttrakhand
CWF 5 100 6.20
240 Gujarat 2015-16 JAU, Junagadh Agricultural University, Junagadh, Gujarat
CA 5 20 0.35
241 Telangana 2015-16 Joint Managing Director, TSFCOF, TS
DM 3 500 6.15
242 Tamil Nadu 2015-16 Principal, Ayya Nadar Janaki Ammal College, Madurai Kamaraj University, Sivakasi, Tamil Nadu.
OA 5 20 0.36
243 J&K 2015-16 Sher-e-Kashmir University of Agriculture Science and Technology of Kashmir
DM 3 20 0.31
244 West Bengal 2015-16 Vidyasagar University,West Bengal
OA 5 120 2.35
Sub Total 9681 125.53
246 Assam 2016-17 District Agriculture officer cum Project Director, CSS-ATMA, Bongaigaon, Assam
IAP 5 240 4.69
247 J&K 2016-17 DoF, J&K DM 5 500 4.93
248 Jharkhand 2016-17 DoF, Jharkhand RFD 5 728 58.20
249 Manipur 2016-17 DoF, Manipur DM 5 300 4.63
250 Mizoram 2016-17 DoF, Mizoram IAP 3 200 4.55
251 National Organisation 2016-17 CIFNET DSFTP 12 20 2.88
252 National Organisation 2016-17 CIFNET DSFTP 12 20 2.88
253 Andhra Pradesh 2016-17 CoF IAP 1 750 5.00
254 National Organisation 2016-17 CSIR- CSMCRI, Bhavnagar, Gujrat
SW 5 500 4.48
255 Karnataka 2016-17 Dean College of Agriculture, Bheemarayangudi, University of Agriculture Science, Raichur, Karnataka
OA 5 25 0.41
256 Karnataka 2016-17 Dean College of Agriculture, Bheemarayangudi, University of Agriculture Science, Raichur, Karnataka
IAP 5 25 0.41
TABLE K-10: TRAINING ACHIEVEMENTS OF NFDB FROM 2010-11 TO 2017-18
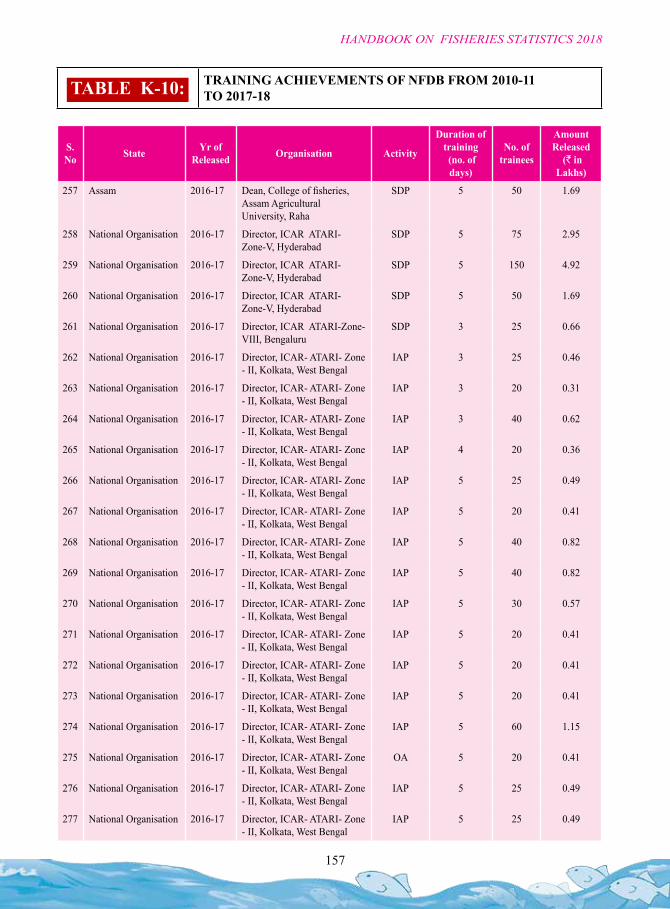
157
HANDBOOK ON FISHERIES STATISTICS 2018
S. No State Yr of
Released Organisation Activity
Duration of training (no. of days)
No. of trainees
Amount Released
(` in Lakhs)
257 Assam 2016-17 Dean, College of fisheries, Assam Agricultural University, Raha
SDP 5 50 1.69
258 National Organisation 2016-17 Director, ICAR ATARI-Zone-V, Hyderabad
SDP 5 75 2.95
259 National Organisation 2016-17 Director, ICAR ATARI-Zone-V, Hyderabad
SDP 5 150 4.92
260 National Organisation 2016-17 Director, ICAR ATARI-Zone-V, Hyderabad
SDP 5 50 1.69
261 National Organisation 2016-17 Director, ICAR ATARI-Zone-VIII, Bengaluru
SDP 3 25 0.66
262 National Organisation 2016-17 Director, ICAR- ATARI- Zone - II, Kolkata, West Bengal
IAP 3 25 0.46
263 National Organisation 2016-17 Director, ICAR- ATARI- Zone - II, Kolkata, West Bengal
IAP 3 20 0.31
264 National Organisation 2016-17 Director, ICAR- ATARI- Zone - II, Kolkata, West Bengal
IAP 3 40 0.62
265 National Organisation 2016-17 Director, ICAR- ATARI- Zone - II, Kolkata, West Bengal
IAP 4 20 0.36
266 National Organisation 2016-17 Director, ICAR- ATARI- Zone - II, Kolkata, West Bengal
IAP 5 25 0.49
267 National Organisation 2016-17 Director, ICAR- ATARI- Zone - II, Kolkata, West Bengal
IAP 5 20 0.41
268 National Organisation 2016-17 Director, ICAR- ATARI- Zone - II, Kolkata, West Bengal
IAP 5 40 0.82
269 National Organisation 2016-17 Director, ICAR- ATARI- Zone - II, Kolkata, West Bengal
IAP 5 40 0.82
270 National Organisation 2016-17 Director, ICAR- ATARI- Zone - II, Kolkata, West Bengal
IAP 5 30 0.57
271 National Organisation 2016-17 Director, ICAR- ATARI- Zone - II, Kolkata, West Bengal
IAP 5 20 0.41
272 National Organisation 2016-17 Director, ICAR- ATARI- Zone - II, Kolkata, West Bengal
IAP 5 20 0.41
273 National Organisation 2016-17 Director, ICAR- ATARI- Zone - II, Kolkata, West Bengal
IAP 5 20 0.41
274 National Organisation 2016-17 Director, ICAR- ATARI- Zone - II, Kolkata, West Bengal
IAP 5 60 1.15
275 National Organisation 2016-17 Director, ICAR- ATARI- Zone - II, Kolkata, West Bengal
OA 5 20 0.41
276 National Organisation 2016-17 Director, ICAR- ATARI- Zone - II, Kolkata, West Bengal
IAP 5 25 0.49
277 National Organisation 2016-17 Director, ICAR- ATARI- Zone - II, Kolkata, West Bengal
IAP 5 25 0.49
TABLE K-10: TRAINING ACHIEVEMENTS OF NFDB FROM 2010-11 TO 2017-18
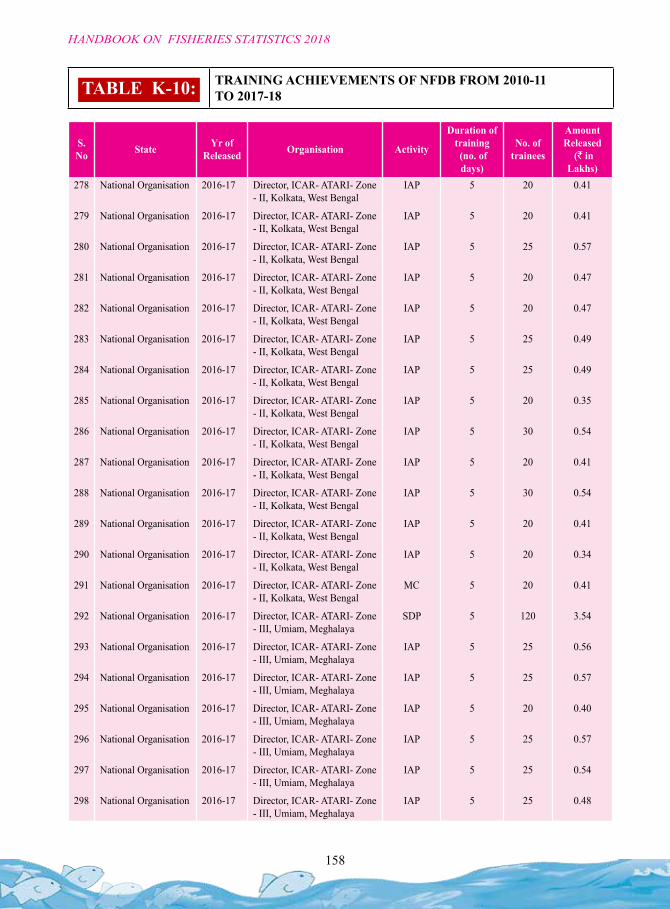
158
HANDBOOK ON FISHERIES STATISTICS 2018
S. No State Yr of
Released Organisation Activity
Duration of training (no. of days)
No. of trainees
Amount Released
(` in Lakhs)
278 National Organisation 2016-17 Director, ICAR- ATARI- Zone - II, Kolkata, West Bengal
IAP 5 20 0.41
279 National Organisation 2016-17 Director, ICAR- ATARI- Zone - II, Kolkata, West Bengal
IAP 5 20 0.41
280 National Organisation 2016-17 Director, ICAR- ATARI- Zone - II, Kolkata, West Bengal
IAP 5 25 0.57
281 National Organisation 2016-17 Director, ICAR- ATARI- Zone - II, Kolkata, West Bengal
IAP 5 20 0.47
282 National Organisation 2016-17 Director, ICAR- ATARI- Zone - II, Kolkata, West Bengal
IAP 5 20 0.47
283 National Organisation 2016-17 Director, ICAR- ATARI- Zone - II, Kolkata, West Bengal
IAP 5 25 0.49
284 National Organisation 2016-17 Director, ICAR- ATARI- Zone - II, Kolkata, West Bengal
IAP 5 25 0.49
285 National Organisation 2016-17 Director, ICAR- ATARI- Zone - II, Kolkata, West Bengal
IAP 5 20 0.35
286 National Organisation 2016-17 Director, ICAR- ATARI- Zone - II, Kolkata, West Bengal
IAP 5 30 0.54
287 National Organisation 2016-17 Director, ICAR- ATARI- Zone - II, Kolkata, West Bengal
IAP 5 20 0.41
288 National Organisation 2016-17 Director, ICAR- ATARI- Zone - II, Kolkata, West Bengal
IAP 5 30 0.54
289 National Organisation 2016-17 Director, ICAR- ATARI- Zone - II, Kolkata, West Bengal
IAP 5 20 0.41
290 National Organisation 2016-17 Director, ICAR- ATARI- Zone - II, Kolkata, West Bengal
IAP 5 20 0.34
291 National Organisation 2016-17 Director, ICAR- ATARI- Zone - II, Kolkata, West Bengal
MC 5 20 0.41
292 National Organisation 2016-17 Director, ICAR- ATARI- Zone - III, Umiam, Meghalaya
SDP 5 120 3.54
293 National Organisation 2016-17 Director, ICAR- ATARI- Zone - III, Umiam, Meghalaya
IAP 5 25 0.56
294 National Organisation 2016-17 Director, ICAR- ATARI- Zone - III, Umiam, Meghalaya
IAP 5 25 0.57
295 National Organisation 2016-17 Director, ICAR- ATARI- Zone - III, Umiam, Meghalaya
IAP 5 20 0.40
296 National Organisation 2016-17 Director, ICAR- ATARI- Zone - III, Umiam, Meghalaya
IAP 5 25 0.57
297 National Organisation 2016-17 Director, ICAR- ATARI- Zone - III, Umiam, Meghalaya
IAP 5 25 0.54
298 National Organisation 2016-17 Director, ICAR- ATARI- Zone - III, Umiam, Meghalaya
IAP 5 25 0.48
TABLE K-10: TRAINING ACHIEVEMENTS OF NFDB FROM 2010-11 TO 2017-18
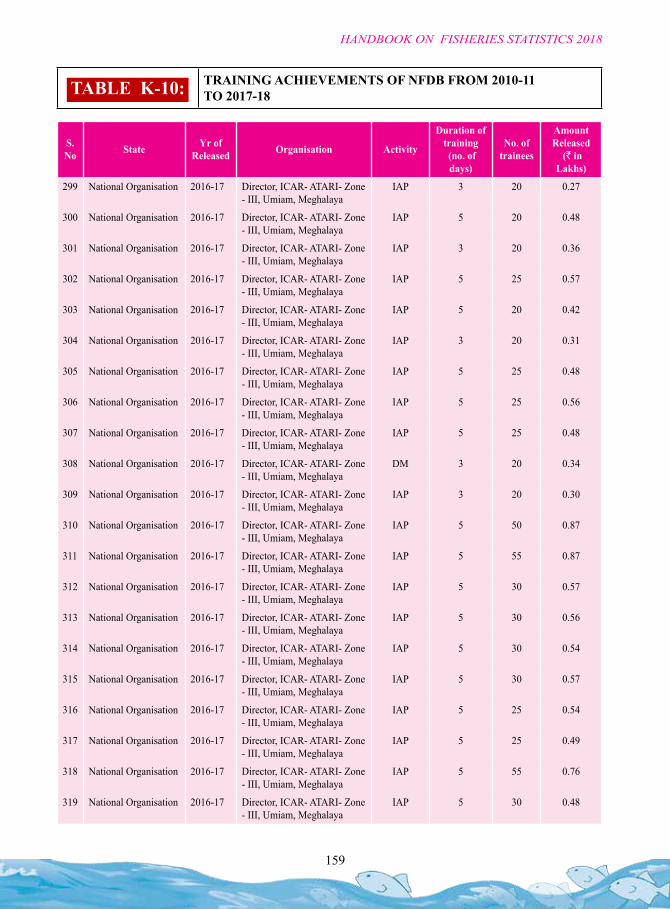
159
HANDBOOK ON FISHERIES STATISTICS 2018
S. No State Yr of
Released Organisation Activity
Duration of training (no. of days)
No. of trainees
Amount Released
(` in Lakhs)
299 National Organisation 2016-17 Director, ICAR- ATARI- Zone - III, Umiam, Meghalaya
IAP 3 20 0.27
300 National Organisation 2016-17 Director, ICAR- ATARI- Zone - III, Umiam, Meghalaya
IAP 5 20 0.48
301 National Organisation 2016-17 Director, ICAR- ATARI- Zone - III, Umiam, Meghalaya
IAP 3 20 0.36
302 National Organisation 2016-17 Director, ICAR- ATARI- Zone - III, Umiam, Meghalaya
IAP 5 25 0.57
303 National Organisation 2016-17 Director, ICAR- ATARI- Zone - III, Umiam, Meghalaya
IAP 5 20 0.42
304 National Organisation 2016-17 Director, ICAR- ATARI- Zone - III, Umiam, Meghalaya
IAP 3 20 0.31
305 National Organisation 2016-17 Director, ICAR- ATARI- Zone - III, Umiam, Meghalaya
IAP 5 25 0.48
306 National Organisation 2016-17 Director, ICAR- ATARI- Zone - III, Umiam, Meghalaya
IAP 5 25 0.56
307 National Organisation 2016-17 Director, ICAR- ATARI- Zone - III, Umiam, Meghalaya
IAP 5 25 0.48
308 National Organisation 2016-17 Director, ICAR- ATARI- Zone - III, Umiam, Meghalaya
DM 3 20 0.34
309 National Organisation 2016-17 Director, ICAR- ATARI- Zone - III, Umiam, Meghalaya
IAP 3 20 0.30
310 National Organisation 2016-17 Director, ICAR- ATARI- Zone - III, Umiam, Meghalaya
IAP 5 50 0.87
311 National Organisation 2016-17 Director, ICAR- ATARI- Zone - III, Umiam, Meghalaya
IAP 5 55 0.87
312 National Organisation 2016-17 Director, ICAR- ATARI- Zone - III, Umiam, Meghalaya
IAP 5 30 0.57
313 National Organisation 2016-17 Director, ICAR- ATARI- Zone - III, Umiam, Meghalaya
IAP 5 30 0.56
314 National Organisation 2016-17 Director, ICAR- ATARI- Zone - III, Umiam, Meghalaya
IAP 5 30 0.54
315 National Organisation 2016-17 Director, ICAR- ATARI- Zone - III, Umiam, Meghalaya
IAP 5 30 0.57
316 National Organisation 2016-17 Director, ICAR- ATARI- Zone - III, Umiam, Meghalaya
IAP 5 25 0.54
317 National Organisation 2016-17 Director, ICAR- ATARI- Zone - III, Umiam, Meghalaya
IAP 5 25 0.49
318 National Organisation 2016-17 Director, ICAR- ATARI- Zone - III, Umiam, Meghalaya
IAP 5 55 0.76
319 National Organisation 2016-17 Director, ICAR- ATARI- Zone - III, Umiam, Meghalaya
IAP 5 30 0.48
TABLE K-10: TRAINING ACHIEVEMENTS OF NFDB FROM 2010-11 TO 2017-18

160
HANDBOOK ON FISHERIES STATISTICS 2018
S. No State Yr of
Released Organisation Activity
Duration of training (no. of days)
No. of trainees
Amount Released
(` in Lakhs)
320 National Organisation 2016-17 Director, ICAR- ATARI- Zone - III, Umiam, Meghalaya
IAP 5 20 0.36
321 National Organisation 2016-17 Director, ICAR- ATARI- Zone - III, Umiam, Meghalaya
IAP 5 20 0.31
322 National Organisation 2016-17 Director, ICAR- ATARI- Zone - III, Umiam, Meghalaya
IAP 5 30 0.54
323 National Organisation 2016-17 Director, ICAR- ATARI- Zone - III, Umiam, Meghalaya
IAP 5 20 0.42
324 National Organisation 2016-17 Director, ICAR- ATARI- Zone - III, Umiam, Meghalaya
IAP 5 30 0.56
325 National Organisation 2016-17 Director, ICAR- ATARI- Zone - III, Umiam, Meghalaya
IAP 5 25 0.49
326 National Organisation 2016-17 Director, ICAR- ATARI- Zone - III, Umiam, Meghalaya
OA 5 25 0.52
327 National Organisation 2016-17 Director, ICAR- ATARI- Zone - III, Umiam, Meghalaya
IAP 5 20 0.41
328 National Organisation 2016-17 Director, ICAR- ATARI- Zone - III, Umiam, Meghalaya
DM 5 25 0.56
329 National Organisation 2016-17 Director, ICAR- ATARI- Zone - III, Umiam, Meghalaya
IAP 5 20 0.42
330 National Organisation 2016-17 Director, ICAR- ATARI- Zone - III, Umiam, Meghalaya
DM 5 25 0.54
331 National Organisation 2016-17 Director, ICAR- ATARI- Zone - III, Umiam, Meghalaya
IAP 5 20 0.40
332 National Organisation 2016-17 Director, ICAR- ATARI- Zone - III, Umiam, Meghalaya
SDP 5 25 0.92
333 National Organisation 2016-17 Director. ICAR-ATARI, Zone-I, Ludhiyana, Punjab
IAP 5 20 0.41
334 National Organisation 2016-17 Director. ICAR-ATARI, Zone-I, Ludhiyana, Punjab
IAP 5 20 0.36
335 National Organisation 2016-17 Director. ICAR-ATARI, Zone-I, Ludhiyana, Punjab
OA 5 45 0.77
336 National Organisation 2016-17 Director. ICAR-ATARI, Zone-I, Ludhiyana, Punjab
OA 5 20 0.39
337 National Organisation 2016-17 Director. ICAR-ATARI, Zone-VII, Jabalpur, Madhya Pradesh
IAP 5 350 7.62
338 National Organisation 2016-17 Director. ICAR-ATARI, Zone-VIII,M.R.S, H.A.Farm(P.O) Hebbal, Bengaluru
IAP 5 30 0.57
339 National Organisation 2016-17 Director. ICAR-ATARI, Zone-VIII,M.R.S, H.A.Farm(P.O) Hebbal, Bengaluru
IAP 5 20 0.31
TABLE K-10: TRAINING ACHIEVEMENTS OF NFDB FROM 2010-11 TO 2017-18
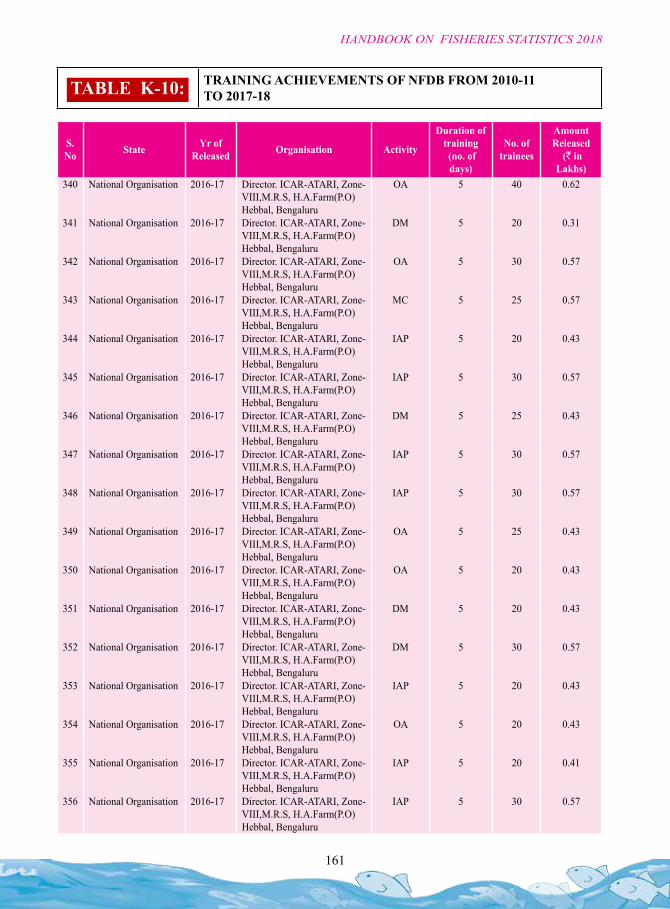
161
HANDBOOK ON FISHERIES STATISTICS 2018
S. No State Yr of
Released Organisation Activity
Duration of training (no. of days)
No. of trainees
Amount Released
(` in Lakhs)
340 National Organisation 2016-17 Director. ICAR-ATARI, Zone-VIII,M.R.S, H.A.Farm(P.O) Hebbal, Bengaluru
OA 5 40 0.62
341 National Organisation 2016-17 Director. ICAR-ATARI, Zone-VIII,M.R.S, H.A.Farm(P.O) Hebbal, Bengaluru
DM 5 20 0.31
342 National Organisation 2016-17 Director. ICAR-ATARI, Zone-VIII,M.R.S, H.A.Farm(P.O) Hebbal, Bengaluru
OA 5 30 0.57
343 National Organisation 2016-17 Director. ICAR-ATARI, Zone-VIII,M.R.S, H.A.Farm(P.O) Hebbal, Bengaluru
MC 5 25 0.57
344 National Organisation 2016-17 Director. ICAR-ATARI, Zone-VIII,M.R.S, H.A.Farm(P.O) Hebbal, Bengaluru
IAP 5 20 0.43
345 National Organisation 2016-17 Director. ICAR-ATARI, Zone-VIII,M.R.S, H.A.Farm(P.O) Hebbal, Bengaluru
IAP 5 30 0.57
346 National Organisation 2016-17 Director. ICAR-ATARI, Zone-VIII,M.R.S, H.A.Farm(P.O) Hebbal, Bengaluru
DM 5 25 0.43
347 National Organisation 2016-17 Director. ICAR-ATARI, Zone-VIII,M.R.S, H.A.Farm(P.O) Hebbal, Bengaluru
IAP 5 30 0.57
348 National Organisation 2016-17 Director. ICAR-ATARI, Zone-VIII,M.R.S, H.A.Farm(P.O) Hebbal, Bengaluru
IAP 5 30 0.57
349 National Organisation 2016-17 Director. ICAR-ATARI, Zone-VIII,M.R.S, H.A.Farm(P.O) Hebbal, Bengaluru
OA 5 25 0.43
350 National Organisation 2016-17 Director. ICAR-ATARI, Zone-VIII,M.R.S, H.A.Farm(P.O) Hebbal, Bengaluru
OA 5 20 0.43
351 National Organisation 2016-17 Director. ICAR-ATARI, Zone-VIII,M.R.S, H.A.Farm(P.O) Hebbal, Bengaluru
DM 5 20 0.43
352 National Organisation 2016-17 Director. ICAR-ATARI, Zone-VIII,M.R.S, H.A.Farm(P.O) Hebbal, Bengaluru
DM 5 30 0.57
353 National Organisation 2016-17 Director. ICAR-ATARI, Zone-VIII,M.R.S, H.A.Farm(P.O) Hebbal, Bengaluru
IAP 5 20 0.43
354 National Organisation 2016-17 Director. ICAR-ATARI, Zone-VIII,M.R.S, H.A.Farm(P.O) Hebbal, Bengaluru
OA 5 20 0.43
355 National Organisation 2016-17 Director. ICAR-ATARI, Zone-VIII,M.R.S, H.A.Farm(P.O) Hebbal, Bengaluru
IAP 5 20 0.41
356 National Organisation 2016-17 Director. ICAR-ATARI, Zone-VIII,M.R.S, H.A.Farm(P.O) Hebbal, Bengaluru
IAP 5 30 0.57
TABLE K-10: TRAINING ACHIEVEMENTS OF NFDB FROM 2010-11 TO 2017-18
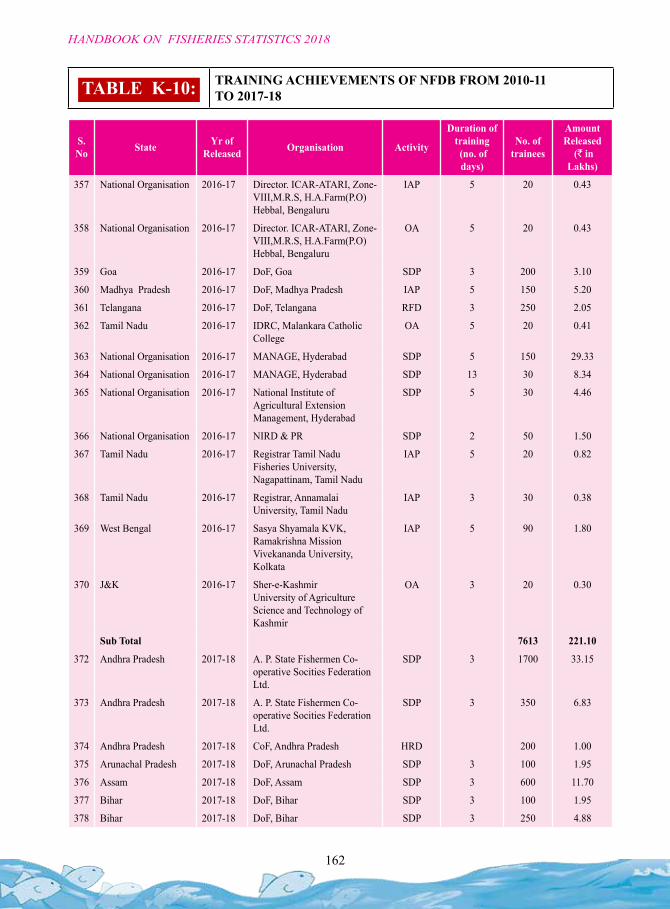
162
HANDBOOK ON FISHERIES STATISTICS 2018
S. No State Yr of
Released Organisation Activity
Duration of training (no. of days)
No. of trainees
Amount Released
(` in Lakhs)
357 National Organisation 2016-17 Director. ICAR-ATARI, Zone-VIII,M.R.S, H.A.Farm(P.O) Hebbal, Bengaluru
IAP 5 20 0.43
358 National Organisation 2016-17 Director. ICAR-ATARI, Zone-VIII,M.R.S, H.A.Farm(P.O) Hebbal, Bengaluru
OA 5 20 0.43
359 Goa 2016-17 DoF, Goa SDP 3 200 3.10
360 Madhya Pradesh 2016-17 DoF, Madhya Pradesh IAP 5 150 5.20
361 Telangana 2016-17 DoF, Telangana RFD 3 250 2.05
362 Tamil Nadu 2016-17 IDRC, Malankara Catholic College
OA 5 20 0.41
363 National Organisation 2016-17 MANAGE, Hyderabad SDP 5 150 29.33
364 National Organisation 2016-17 MANAGE, Hyderabad SDP 13 30 8.34
365 National Organisation 2016-17 National Institute of Agricultural Extension Management, Hyderabad
SDP 5 30 4.46
366 National Organisation 2016-17 NIRD & PR SDP 2 50 1.50
367 Tamil Nadu 2016-17 Registrar Tamil Nadu Fisheries University, Nagapattinam, Tamil Nadu
IAP 5 20 0.82
368 Tamil Nadu 2016-17 Registrar, Annamalai University, Tamil Nadu
IAP 3 30 0.38
369 West Bengal 2016-17 Sasya Shyamala KVK, Ramakrishna Mission Vivekananda University, Kolkata
IAP 5 90 1.80
370 J&K 2016-17 Sher-e-Kashmir University of Agriculture Science and Technology of Kashmir
OA 3 20 0.30
Sub Total 7613 221.10
372 Andhra Pradesh 2017-18 A. P. State Fishermen Co-operative Socities Federation Ltd.
SDP 3 1700 33.15
373 Andhra Pradesh 2017-18 A. P. State Fishermen Co-operative Socities Federation Ltd.
SDP 3 350 6.83
374 Andhra Pradesh 2017-18 CoF, Andhra Pradesh HRD 200 1.00
375 Arunachal Pradesh 2017-18 DoF, Arunachal Pradesh SDP 3 100 1.95
376 Assam 2017-18 DoF, Assam SDP 3 600 11.70
377 Bihar 2017-18 DoF, Bihar SDP 3 100 1.95
378 Bihar 2017-18 DoF, Bihar SDP 3 250 4.88
TABLE K-10: TRAINING ACHIEVEMENTS OF NFDB FROM 2010-11 TO 2017-18
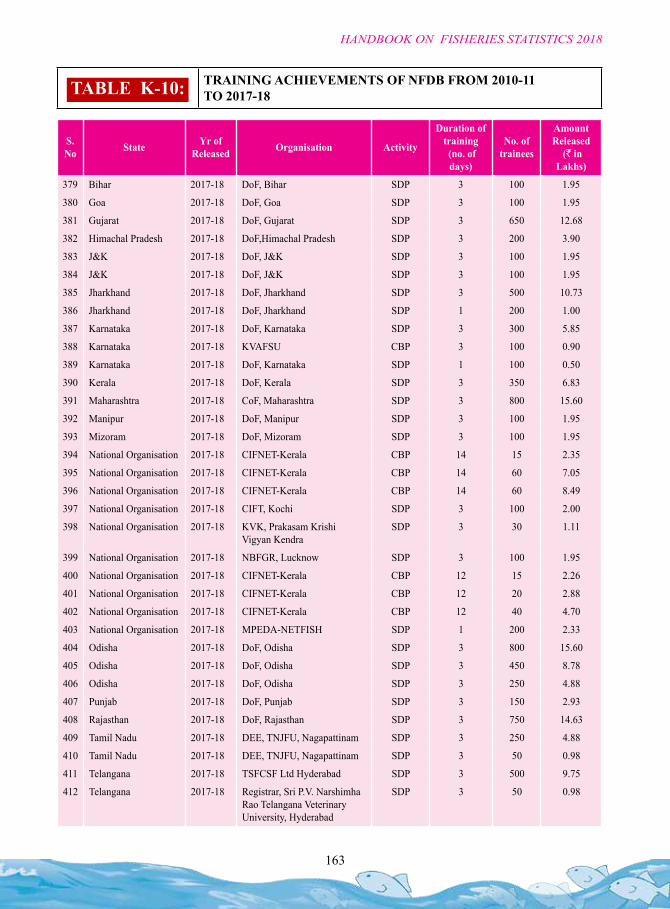
163
HANDBOOK ON FISHERIES STATISTICS 2018
S. No State Yr of
Released Organisation Activity
Duration of training (no. of days)
No. of trainees
Amount Released
(` in Lakhs)
379 Bihar 2017-18 DoF, Bihar SDP 3 100 1.95
380 Goa 2017-18 DoF, Goa SDP 3 100 1.95
381 Gujarat 2017-18 DoF, Gujarat SDP 3 650 12.68
382 Himachal Pradesh 2017-18 DoF,Himachal Pradesh SDP 3 200 3.90
383 J&K 2017-18 DoF, J&K SDP 3 100 1.95
384 J&K 2017-18 DoF, J&K SDP 3 100 1.95
385 Jharkhand 2017-18 DoF, Jharkhand SDP 3 500 10.73
386 Jharkhand 2017-18 DoF, Jharkhand SDP 1 200 1.00
387 Karnataka 2017-18 DoF, Karnataka SDP 3 300 5.85
388 Karnataka 2017-18 KVAFSU CBP 3 100 0.90
389 Karnataka 2017-18 DoF, Karnataka SDP 1 100 0.50
390 Kerala 2017-18 DoF, Kerala SDP 3 350 6.83
391 Maharashtra 2017-18 CoF, Maharashtra SDP 3 800 15.60
392 Manipur 2017-18 DoF, Manipur SDP 3 100 1.95
393 Mizoram 2017-18 DoF, Mizoram SDP 3 100 1.95
394 National Organisation 2017-18 CIFNET-Kerala CBP 14 15 2.35
395 National Organisation 2017-18 CIFNET-Kerala CBP 14 60 7.05
396 National Organisation 2017-18 CIFNET-Kerala CBP 14 60 8.49
397 National Organisation 2017-18 CIFT, Kochi SDP 3 100 2.00
398 National Organisation 2017-18 KVK, Prakasam Krishi Vigyan Kendra
SDP 3 30 1.11
399 National Organisation 2017-18 NBFGR, Lucknow SDP 3 100 1.95
400 National Organisation 2017-18 CIFNET-Kerala CBP 12 15 2.26
401 National Organisation 2017-18 CIFNET-Kerala CBP 12 20 2.88
402 National Organisation 2017-18 CIFNET-Kerala CBP 12 40 4.70
403 National Organisation 2017-18 MPEDA-NETFISH SDP 1 200 2.33
404 Odisha 2017-18 DoF, Odisha SDP 3 800 15.60
405 Odisha 2017-18 DoF, Odisha SDP 3 450 8.78
406 Odisha 2017-18 DoF, Odisha SDP 3 250 4.88
407 Punjab 2017-18 DoF, Punjab SDP 3 150 2.93
408 Rajasthan 2017-18 DoF, Rajasthan SDP 3 750 14.63
409 Tamil Nadu 2017-18 DEE, TNJFU, Nagapattinam SDP 3 250 4.88
410 Tamil Nadu 2017-18 DEE, TNJFU, Nagapattinam SDP 3 50 0.98
411 Telangana 2017-18 TSFCSF Ltd Hyderabad SDP 3 500 9.75
412 Telangana 2017-18 Registrar, Sri P.V. Narshimha Rao Telangana Veterinary University, Hyderabad
SDP 3 50 0.98
TABLE K-10: TRAINING ACHIEVEMENTS OF NFDB FROM 2010-11 TO 2017-18
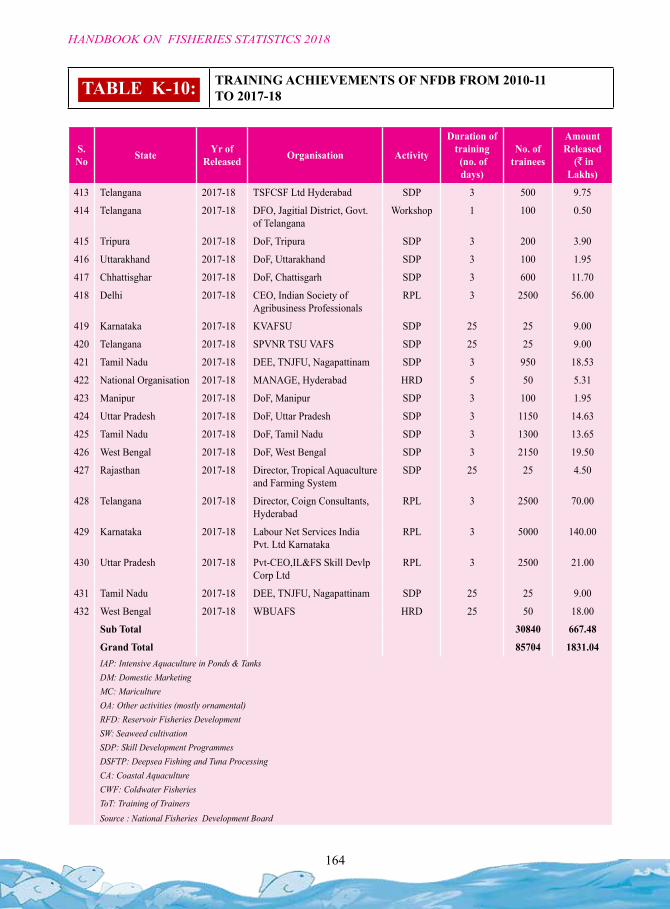
164
HANDBOOK ON FISHERIES STATISTICS 2018
S. No State Yr of
Released Organisation Activity
Duration of training (no. of days)
No. of trainees
Amount Released
(` in Lakhs)
413 Telangana 2017-18 TSFCSF Ltd Hyderabad SDP 3 500 9.75
414 Telangana 2017-18 DFO, Jagitial District, Govt. of Telangana
Workshop 1 100 0.50
415 Tripura 2017-18 DoF, Tripura SDP 3 200 3.90
416 Uttarakhand 2017-18 DoF, Uttarakhand SDP 3 100 1.95
417 Chhattisghar 2017-18 DoF, Chattisgarh SDP 3 600 11.70
418 Delhi 2017-18 CEO, Indian Society of Agribusiness Professionals
RPL 3 2500 56.00
419 Karnataka 2017-18 KVAFSU SDP 25 25 9.00
420 Telangana 2017-18 SPVNR TSU VAFS SDP 25 25 9.00
421 Tamil Nadu 2017-18 DEE, TNJFU, Nagapattinam SDP 3 950 18.53
422 National Organisation 2017-18 MANAGE, Hyderabad HRD 5 50 5.31
423 Manipur 2017-18 DoF, Manipur SDP 3 100 1.95
424 Uttar Pradesh 2017-18 DoF, Uttar Pradesh SDP 3 1150 14.63
425 Tamil Nadu 2017-18 DoF, Tamil Nadu SDP 3 1300 13.65
426 West Bengal 2017-18 DoF, West Bengal SDP 3 2150 19.50
427 Rajasthan 2017-18 Director, Tropical Aquaculture and Farming System
SDP 25 25 4.50
428 Telangana 2017-18 Director, Coign Consultants, Hyderabad
RPL 3 2500 70.00
429 Karnataka 2017-18 Labour Net Services India Pvt. Ltd Karnataka
RPL 3 5000 140.00
430 Uttar Pradesh 2017-18 Pvt-CEO,IL&FS Skill Devlp Corp Ltd
RPL 3 2500 21.00
431 Tamil Nadu 2017-18 DEE, TNJFU, Nagapattinam SDP 25 25 9.00
432 West Bengal 2017-18 WBUAFS HRD 25 50 18.00
Sub Total 30840 667.48
Grand Total 85704 1831.04IAP: Intensive Aquaculture in Ponds & TanksDM: Domestic MarketingMC: MaricultureOA: Other activities (mostly ornamental)RFD: Reservoir Fisheries DevelopmentSW: Seaweed cultivationSDP: Skill Development ProgrammesDSFTP: Deepsea Fishing and Tuna ProcessingCA: Coastal AquacultureCWF: Coldwater FisheriesToT: Training of TrainersSource : National Fisheries Development Board
TABLE K-10: TRAINING ACHIEVEMENTS OF NFDB FROM 2010-11 TO 2017-18
165
HANDBOOK ON FISHERIES STATISTICS 2018
SECTION : L
FISHERIES
DEVELOPMENT
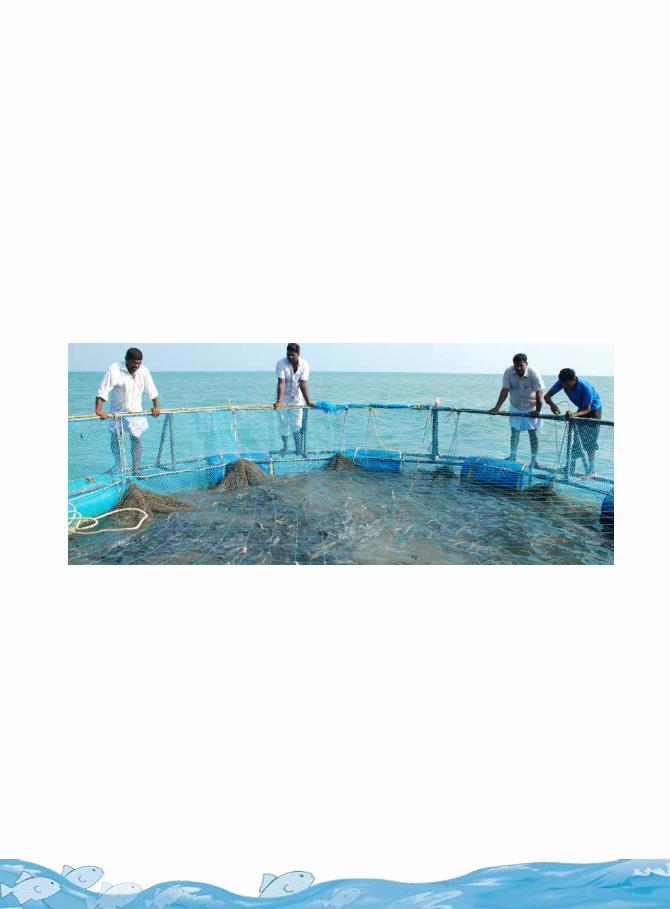
167
HANDBOOK ON FISHERIES STATISTICS 2018
Note on Fisheries Sector in the Country
1. Introduction
India is the second largest fish producing country in the world accounting for 6.56% of global production and contributing about 1% to the country’s Gross Value Added (GVA) and over 5.37% to the agricultural GVA, fisheries and aquaculture continue to be an important source of food, nutrition, income and livelihood to millions of people. Export earnings from the Fisheries sector has been `45106.89 crores during 2017-18 and has registered an impressive average annual growth rate of about 19.11%. The sector provides livelihood support to about 160 lakh people at the primary level and almost twice the number along the value chain and the annual average growth rate in the Fisheries sector has been over 7% over the last few years.
Fisheries and aquaculture remain an important source of food, nutrition, employment and income for millions, especially the rural populations. In fact, the sector provides livelihood to about 16 million people at the primary level and almost twice the number along the value chain. Fish being an affordable and rich source of animal protein, is one of the healthiest options to mitigate hunger and nutrient deficiency. The sector has immense potential to double the fishers and fish farmers’ incomes by 2022, as envisioned by the government. Hence it is essential that sustained and focused attention is given to the fisheries sector through policy and financial support to accelerate its development in a sustainable, responsible, inclusive and equitable manner.
Blue Revolution Scheme has made some vital contributions towards development of fisheries sector, especially enhancement of fish production from 10.26 MMT (in 2014-15) to 12.59 MMT (2017-18). The full potential of the fisheries sector is yet to be realised due to critical gaps in quality inputs, investment, infrastructure, value addition, technological know-how and skilled manpower. It is also essential to consolidate the sectoral gains and sustain growth by providing financial support for infrastructure creation and through targeted interventions aimed at harnessing the unrealized potential in a responsible and sustainable manner.
To utilize the dormant and untapped potential, there is need for enhanced investment in the sector and there is need for increased allocation for the sector which would provided the much needed thrust in the areas of enhancing Production and Productivity, Aquaculture Development, Post-Harvest and marketing infrastructure and other priority Interventions. There is an urgent need to modernize and strengthen the value chain in the sector. It is estimated that there is a huge post-harvest losses to the tune of 20-25% in the sector. It is therefore, essential to reduce to below the post harvest losses to less than 10% for enhancing the incomes of the stakeholders. This requires substantial investment in logistics, infrastructure and supply chain.
2. Fisheries Resources
The country has long coastline of 8118 km and equally large area under estuaries, backwater, lagoons etc., conductive for developing capture as well as culture fisheries with the declaration of the Exclusive
168
HANDBOOK ON FISHERIES STATISTICS 2018
Economic Zone (EEZ) in 1977, an area of 20.02 million sq km, (comprising of 0.86 million sq. km on the west coast, 0.56 million sq. km on the east coast and 0.60 sq.km around the Andaman & Nicobar Island) has come under our jurisdiction with absolute right of exploring, exploiting and natural utilization of living resources falling within it.
The inland fishery resources include 3.8 lakh kms stretch of rivers and canals 27.03 lakh hectare reservoirs, 24.7 lakh hectare pond and tanks, 4.3 lakh hectare of beels, 3.48 lakh hectare derelict water bodies/oxbow lakes and 9.65 lakh hectare brackish water areas.
3. Blue Revolution
The Department of Fisheries, Ministry of Fisheries, Animal Husbandry and Dairying accordingly restructured the scheme by merging all the ongoing schemes under an umbrella of Blue Revolution. The restructured scheme provides focussed development and management of fisheries, covering inland fisheries, aquaculture, marine fisheries including deep sea fishing, mariculture. The Central Sponsored Scheme on Blue Revolution: Integrated Development and Management of Fisheries formulated at a total Central outlay of 3000 crore with the following components: (a) National Fisheries Development Board (NFDB) and its activities, (b) Development of Inland Fisheries and Aquaculture,(c) Development of Marine Fisheries, Infrastructure and Post-Harvest Operations,(d) Strengthening of Database & Geographical Information System of the Fisheries Sector, (e) Institutional Arrangement for Fisheries Sector and (f) Monitoring, Control and Surveillance (MCS) and other need-based Interventions.
(g) National Scheme of Welfare of Fishermen
3.1 Funding Patterns
The subsidy sharing pattern especially beneficiary oriented components of the Inland and Marine Fisheries under the Centrally Sponsored Scheme on ‘Blue Revolution: Integrated Development and Management of Fisheries’ are as under:
For any proposal, the total admissible Government subsidy (Central+State) will be limited to 40% of the project cost for general category beneficiaries and 60% of the project cost for weaker sections like Scheduled Castes (SCs), Scheduled Tribes (STs), women and their co-operatives.
Of the admissible subsidy, the central and state share shall be as follows:
North East & Hilly States : 90% Central Share and 10% State Share
Union Territories : 100% Central ShareOther States : 60% Central Share and 40% State Share
3.2 Development of Inland Fisheries and Aquaculture
This component mainly focuses on increasing of fish productivity from the existing aquaculture farms and water bodies besides aquaculture area expansion and species diversification. The activities covered under this component are;
169
HANDBOOK ON FISHERIES STATISTICS 2018
(i) Ponds Aquaculture- construction of new ponds and renovation of existing ponds,
(ii) Establishment of hatcheries for Indian major carps and prawns/shrimps,
(iii) Development of fisheries in cold-waters,
(iv) Wetland-Productive utilization of wetland waterlogged areas and inland saline/alkaline waters for aquaculture,
(v) Reservoir Fisheries- integrated development of reservoirs,
(vi) Establishment of small scale and medium size feed mills/plants,
(vii) Encouragement of low cost Re-circulatory Aquaculture System,
(viii) Rejuvenation of urban/semi-urban/rural lakes/tanks for fish culture,
(ix) Renovation of MGNREGA ponds for fish culture etc.
3.3 Development of Marine Fisheries, Infrastructure and Post-Harvest Operations,
This component focuses on continuing harnessing of near shore fisheries resources on a sustainable & environmental friendly manner and up-gradation of technology to harness the untapped deep sea and oceanic fishery resources. It also includes capacity building and training in marine fishing and allied activities and encouragement of mariculture in open seas and creation of essential fisheries infrastructure facilities. The activities covered under this component are:
(i) Motorization of traditional craft,
(ii) Supply of safety kits to marine fishers to ensure their safety during fishing out at sea,
(iii) Assistance to traditional/artisan fishers for procurement of FRP boats and other associated fishing implements,
(iv) Promotion of non-conventional energy sources in marine fishers,
(v) Promotion of mari-culture in open seas, seaweed & bivalve cultivation and pearl culture,
(vi) Development of fishing harbours/fish landing centres and modernization of the existing ones, assistance for dredging to improve navigability of existing the fishing harbours/fish landing centres,
(vii) Strengthening of post harvest infrastructures comprising construction & modernization of ice plants, cold storage,
(viii) Development of whole sale and retail fish markets,
(ix) Strengthening of fish handling and transport infrastructure facilities etc.
3.4 National Scheme on Welfare of Fishermen
This component focuses some of the critical and essential welfare activities for fishers. The activities covered in this component are;
170
HANDBOOK ON FISHERIES STATISTICS 2018
(i) Construction of houses for fishermen,
(ii) Saving-cum-relief to both marine and inland fishers during the fishing lean/ban period,
(iii) Providing drinking water facilities,
(iv) Construction of community halls
(v) Insurance coverage to fishers etc.
3.5 Strengthening of Database & Geographical Information System of the Fisheries Sector
This component mainly focuses on creation of authenticated and reliable fisheries database that are essential for formulation of policies, programmes/schemes etc. The activities covered under this component are:
(i) Assistance to the State Governments/UTs for collection and supply of fisheries data regularly on a quarterly basis,
(ii) Development of suitable IT based system for collection, analysis and compilation of fisheries data,
(iii) Development of geographical information system,
(iv) Mapping of water-bodies to assess the fisheries resources potentials & their sustainable harnessing,
(v) Compilation/publication and dissemination of fisheries data-based to the needy organization/Departments/Ministries etc.
3.6 Monitoring, Control and Surveillance (MCS) and other need-based Interventions.
This component intends to create a Monitoring Control and Surveillance (MCS) Regime for marine fisheries towards compliance of various national and international obligations. The activities covered under this component are;
(i) Continuing issuing the biometric ID card to marine fishers,
(ii) Continue to implement the fishing vessels registration project (ReALCraft),
(iii) Up-gradation of the existing 166 registration centres into Fisheries Monitoring, Control and Surveillance Centres (FMCS) etc.
4. Institutional arrangements for the fisheries sector
In order to promote fisheries sector, Government of India has four Fisheries Institutes working under its administrative control. These institutes working under its administrative control. These institutes help in providing technical trainined manpower to the sector, preparation of the techno economical feasibility report for setting up fishing harbor/fish landing centres etc, training in fish processing and other related activities.
171
HANDBOOK ON FISHERIES STATISTICS 2018
4.1 Central Institute of Fisheries, Nautical & Engineering Training, (CIFNET)
Advancements in sea fishing necessitated great demand for qualified and certified personal for manning the fishing vessels. Considering the need and importance of organized fisheries training system at national level, Central Institute of Fisheries, Nautical & Engineering Training (CIFNET) was established in 1963 at Kochi. The major objectives of the institute are to create technical manpower for the operation of Ocean going fishing vessels and to run infrastructure establishments, to create trained manpower to manage fishery establishment, to provide training for technical teachers for manning the fishermen training centers attached to Maritime States and Union Territories, to conduct studies on fishing craft, fishing gears and equipments and provide extensive training to accelerate advancement in fishing technology for enhancing productivity of fishermen and increasing marine fish production and to provide technical consultancy service in all matters with special reference to technical manpower requirements.
The Institute conducts various courses including (i) Bachelor of Fisheries Science (Nautical Science)approved and affiliated by Cochin University of Science & Technology, Kochi recognized by UGC.(ii) Two trade courses ,Vessel Navigator Course(VNC) & Marine Fitter Course(MFC) of duration of 2 years approved by Ministry of Labour, affiliated to National Council for Vocational Training(NCVT) and (iii) Short term training programmes for the benefit of students from professional colleges, sister organizations, fisheries departments of the States Govt,coast guard officials etc. and Extension programmes for fishermen
4.2. National Institute of Fisheries Post Harvest Technology and Training (NIFPHATT)
The National Institute of Fisheries Post Harvest Technology and Training renamed its name from Integrated Fisheries Project during the year 2008 with the motto to spread the message of zero wastage or rather complete utilization, thereby reduction of the pressure on the available biomass, but the same time creating and meeting all our nutritional requirements. The main objective of the institute is to develop the value added products by way of process and product diversification from all varieties of fish including low value, unconventional species and seasonally abundant fishes. Human Resource Development in Fisheries sector is one of a major objective of the institute. The training programmes of NIFPHATT are sectoral specific and subject specific in different disciplines of the post harvest technology and refrigeration technology. The training programmes are designed in such a way that it provides intensive hands on experience to the students who are pursuing specialized education in fisheries science, biotechnology, food science, food microbiology, food engineering and professionals working in fisheries sector. The institute also focused on Business incubation centre for Promoting novel and nascent entrepreneurship in value added fish export.
4.3 Central Institute of Coastal Engineering for Fishery (CICEF),
The Central Institute of Coastal Engineering for Fishery (CICEF), was established in January 1968 under technical and manpower assistance from the Food and Agriculture Organisation (FAO) of the United Nations Development Programme (UNDP). The main objectives of establishing this Institute were to identify potential fishery harbour sites existing all along the coastline of the Country for the development of fishery harbours, to undertake engineering and economic investigations for the selected
172
HANDBOOK ON FISHERIES STATISTICS 2018
fishery harbour site and prepare Techno-Economic Feasibility Reports (TEFR) for the development of Fishery Harbours and Fish Landing Centres, Brackish water shrimp farms and Hatchery projects.
The Institute, till end of December 2018 has carried out investigations at 97 sites and prepared project reports for 103 sites for the development of Fishery Harbours/Fish Landing Centres. This Institute has also reconnoitred about 66,200 hectares of brackish water area and engineering investigations were carried out over 15,600 hectares in all the Maritime States and Union Territories for the development of aquaculture farms.
4.4 Fishery Survey of India (FSI)
The Fishery Survey of India is a nodal agency for carrying out the survey, assessment and monitoring of marine fishery resources in the Indian EEZ within the framework of a well-defined mandate. FSI has been bestowed with the responsibility of collecting tuna data and submit the same to the Indian Ocean Tuna Commission (IOTC) in the form of India’s National Report. The Institute also imparts training to the students sponsored by the CIFNET, Kochi onboard survey vessels on tenure basis. Presently, FSI has a fleet of 11 deep sea survey vessels with the state of art technology of which 2 are multifilament tuna longliners, 2 are monofilament tuna longliners and 7 Stern Trawlers which are being deployed from six operational Bases; Mumbai, Mormugao, Cochin, Chennai, Vishkhapatnam and Port Blairin order to accomplish the mandate of the Institute.
As a part of extension activities, the FSI has been organizing Regional Workshops, Open houses and marine Fisheries Exhibitions in order to disseminate the survey findings to the fishermen, fishing industry and other end users. Besides these, dissemination of information on marine fishery resources is also being done through various publications such as Resources Information Series, Meena News, Charts and Bulletins etc. During the year 08 workshops, 03 open houses, 02 marine fisheries exhibitions were organized in the maritime states of India and also participated various Fish Festivals organized by respective state Governments of Maritime states and other sister organizations. Under the capacity building, the institute also provides on-board training on tuna long lining to the fishermen of respective maritime states in order to provide awareness as well as developing skills in the technology.
4.5. Coastal Aquaculture Authority (CAA)
Coastal Aquaculture Authority was established under the Coastal Aquaculture Authority Act, 2005 for regulating activities connected with coastal aquaculture and ensures that responsible aquaculture does not cause any detriment to the coastal environment and to protect the livelihood of various stakeholders living in the coastal area.
The aims and objectives of the authority are to regulate ‘coastal aquaculture’ activities in the areas notified by the Central Government as ‘coastal areas’ and for matters associated therewith. The authority is empowered to make regulations for the construction, operation and registration of aquaculture hatchery and farms in coastal areas, inspection of farms and hatcheries of Litopenaeus vannamei to ascertain their environmental impact, removal or demolition of coastal aquaculture farms which cause pollution, fixing standards for all coastal aquaculture inputs, viz., seed, feed, growth supplements, chemicals, etc., used and management of shrimp aquaculture quarantine facility. Also in addition to the registration of
173
HANDBOOK ON FISHERIES STATISTICS 2018
farms and hatcheries, registration with CAA to produce seed and farming of other cultivable species including shrimps, crabs, molluscs, fishes, etc., in the country within the notified area with the Coastal Aquaculture Authority as per the Act and Rules is mandatory. Also CAA organizes awareness camps and publicity through print media, newspapers etc., to ensure sustainable coastal aquaculture development.
4.6. National Fisheries Development Board (NFDB)
The Ministry of Agriculture & Farmers Welfare had in July, 2006 set up National Fisheries Development Board (NFDB) with its head office at Hyderabad. NFDB has been registered under the Andhra Pradesh Societies Registration Act, 2001 with registration No 933 of 2006 and notified on 15th January, 2019.
The main objectives of NFDB are to (i) bring activities relating to fisheries and aquaculture for focused attention and professional management, (ii) enhance contribution of fish and fisheries towards food and nutritional security, (iii) improve production, processing, storage, transport and marketing of the products from capture and culture fisheries, (iv) achieve sustainable management and conservation of natural aquatic resources including the fish stocks, (v) apply modern tools of research and development including genetics and biotechnology for optimizing production and productivity from fisheries, (vi) provide modern infrastructure mechanisms for fisheries, (vii) generate substantial employment and (viii) train and empower women in fisheries sector.
4.7. Comprehensive Marine Fishing policy
The Committee constituted under the Chairpersonship of Dr. S. Ayyappan, former Director General of ICAR to suggest draft National Policy on Marine Fisheries had undertaken a wide range of consultations with the stakeholders including fishermen associations and has submitted the suggested Draft of the National Policy on Marine Fisheries, 2016 on 29.7.2016. After due consultation with the stakeholders and appraisal Ministries/Departments, the ‘National Policy on Marine Fisheries, 2017’ has been accepted by this Department and notified on 28.4.2017.
The main objective of NPMF, 2017 is to ensure the healthy and ecological integrity of the marine fisheries resources of India’s Exclusive Economic Zone (EEZ) through sustainable harvests for the benefit of present and future generations of the nation. The overall strategy of the NPMF, 2017 and salient features are sustainable fisheries development, socio-economic upliftment of fishers, principle of subsidiarity, partnership, inter-generational equity, gender justice and precautionary approach.
4.8. Long term leasing policy for inland water bodies
The Committee has submitted the Draft National Inland Fisheries and Aquaculture Policy (NIFAP) to this Department and the same was circulated among the State Government/ UTs and stakeholders for comments. The above policy document was approved by Hon’ble Minister of Agriculture and Farmers Welfare on 21.2.2019 and uploaded in the Department website on 27.2.2019. After receiving the comments from 11 various sources including State Fisheries Departments/ ICAR Institute and Organizations, the revised draft policy has been approved by Secretary (Fisheries) on 19.6.2019. This Department is in the process of initiating the next steps for notification of the National Inland Fisheries & Aquaculture Policy (NIFAP).
174
HANDBOOK ON FISHERIES STATISTICS 2018
4.9. Uniform Fishing ban in the country
The Department of Fisheries, Government of India implements uniform fishing ban during the monsoon period in the Indian Exclusive Economic Zone (EEZ) beyond territorial waters (12 nautical miles) for conservation and effective management of fishery resources and also for sea safety reasons.
The uniform fishing ban is implemented in the Indian EEZ for a period of 61 days, as per details given below:
(i) East Coast: From 15th April to 14th June (both days inclusive) (61days)
(ii) West Coast: From 1st June to 31st July, (both days inclusive) (61 days)
The traditional non-motorized fishing vessels are exempted from this uniform fishing ban imposed in the Indian EEZ beyond territorial waters.
5. Fisheries and Aquaculture Infrastructure Development Fund (FIDF)
In order to address the infrastructure requirement for fisheries sector, the Government of India during 2018-19 created dedicated fund namely Fisheries and Aquaculture Infrastructure Development Fund (FIDF) with a corpus size of `7522.48 crore with the objectives of creation and modernization of inland and marine fisheries, infrastructure for fisheries, infrastructure support for improving domestic marketing facilities and to bridge the resource gap and facilitate completion of ongoing infrastructure projects.
The infrastructure facilities envisaged under FIDF for the benefits of fisheries sector include establishment of fishing harbours and fish landing centres, ice plants, cold storages, fish transport and cold chain network infrastructure, modern fish markets, setting up of brood banks and hatcheries, development of aquaculture and mariculture, modernization of state fish seed farms, state of art fisheries training centres, fish processing units, fish feed mills/plants, establishment of cage culture in reservoirs, introduction of deep sea fishing vessels, establishment of disease diagnostic laboratories, and aquatic quarantine facilities etc.
FIDF aims to achieve a sustainable growth of 8-9 per cent, in a move to augment the country’s fish production and generate both direct and indirect employment opportunities to over 9 lakh persons in fishing and allied activities.
6. Kisan Credit Card (KCC)
Pursuant to the Budget Announcement 2018-19, the Government of India has extended Kisan Credit Card (KCC) facilities to fisheries and animal husbandry farmers with a purpose to help them meet their working capital requirements. The KCC facility will help fisheries and animal husbandry farmers to meet their short term credit requirements of rearing of animals, poultry birds, fish, shrimp, other aquatic organisms and capture of fish. Fishers, Fish Farmers (Individual & groups/partners/share croppers/tenant farmers), Self Help Groups, Joint Liability Groups and Women groups are eligible for availing the KCC facilities.
The fisheries related working capital components covered under KCC include recurring costs towards
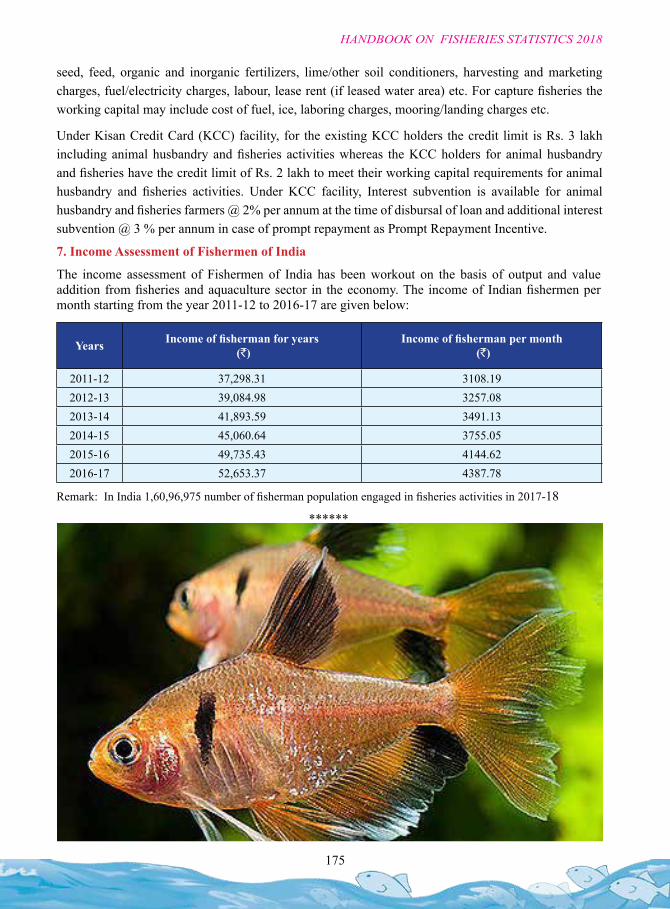
175
HANDBOOK ON FISHERIES STATISTICS 2018
seed, feed, organic and inorganic fertilizers, lime/other soil conditioners, harvesting and marketing charges, fuel/electricity charges, labour, lease rent (if leased water area) etc. For capture fisheries the working capital may include cost of fuel, ice, laboring charges, mooring/landing charges etc.
Under Kisan Credit Card (KCC) facility, for the existing KCC holders the credit limit is Rs. 3 lakh including animal husbandry and fisheries activities whereas the KCC holders for animal husbandry and fisheries have the credit limit of Rs. 2 lakh to meet their working capital requirements for animal husbandry and fisheries activities. Under KCC facility, Interest subvention is available for animal husbandry and fisheries farmers @ 2% per annum at the time of disbursal of loan and additional interest subvention @ 3 % per annum in case of prompt repayment as Prompt Repayment Incentive.
7. Income Assessment of Fishermen of India
The income assessment of Fishermen of India has been workout on the basis of output and value addition from fisheries and aquaculture sector in the economy. The income of Indian fishermen per month starting from the year 2011-12 to 2016-17 are given below:
Years Income of fisherman for years (`)
Income of fisherman per month (`)
2011-12 37,298.31 3108.192012-13 39,084.98 3257.082013-14 41,893.59 3491.132014-15 45,060.64 3755.052015-16 49,735.43 4144.622016-17 52,653.37 4387.78
Remark: In India 1,60,96,975 number of fisherman population engaged in fisheries activities in 2017-18
******

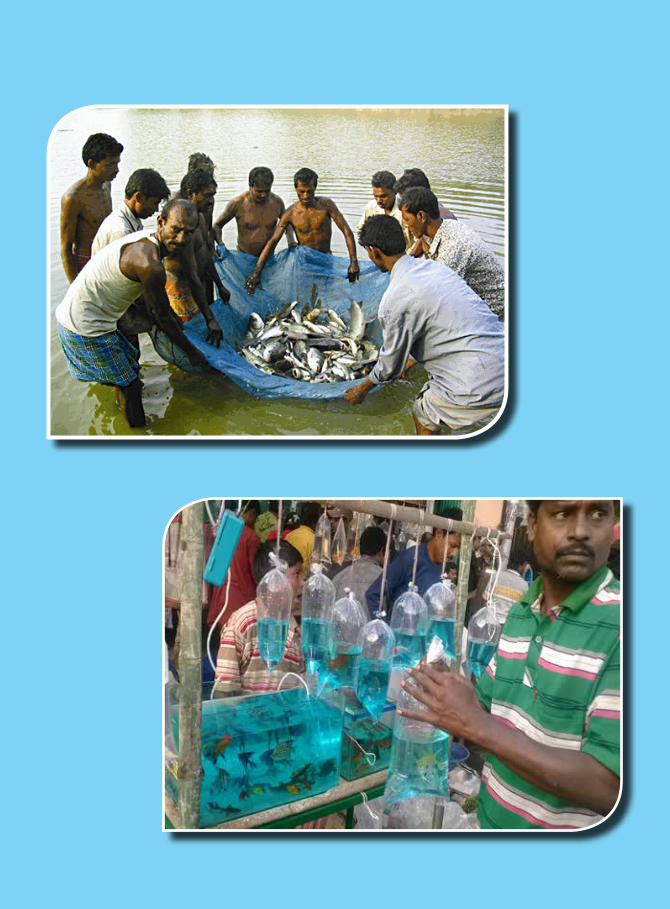
HA
ND
BO
OK
ON
FIS
HE
RIE
S S
TA
TIS
TIC
S 2
01
8
![YEARBOOK OF FISHERIES STATISTICS OF BANGLADESHfisheries.portal.gov.bd/sites/default/files/files/fisheries.portal.gov... · Yearbook of Fisheries Statistics of Bangladesh 2016-17 [iii]](https://img.pdfslide.net/doc/110x75/5e8d79cf75da9c52bf4e5b65/yearbook-of-fisheries-statistics-of-yearbook-of-fisheries-statistics-of-bangladesh.jpg)