Embed Size (px)
Citation preview
PNNL-23361
Hanford Sitewide Probabilistic Seismic Hazard Analysis
November 2014 Prepared for the U.S. Department of Energy, Under Contract DE-AC06076RL01830, and Energy Northwest
2
Printed versions of the front matter, including the Executive Summary, and Appendixes A and B of this document are receiving limited distribution to the client. The full report is being delivered on a CD, copies of which are included in the back cover of each truncated printed deliverable.
PNNL-23361
Hanford Sitewide Probabilistic Seismic Hazard Analysis
Project Technical Integrator and Seismic Source Characterization Team Lead
Ground Motion Technical Integration Team Lead
Seismic Source Characterization Team
Ground Motion Characterization Team
Hazard Analyst
November 2014
Prepared for the U.S. Department of Energy under Contract DE-AC05-76RL01830
Pacific Northwest National Laboratory Richland, Washington 99352
Hanford Sitewide Probabilistic Seismic Hazard Analysis 2014
iii
Abstract
This report presents the results of a Probabilistic Seismic Hazard Analysis (PSHA) of the Hanford Site in southeastern Washington State. It provides a detailed characterization of the vibratory ground motion hazard at the Hanford Site from potential future earthquakes. The study was conducted to fulfill the requirements for U.S. Department of Energy facilities and for the Columbia Generating Station to update the previous seismic hazard analysis. This PSHA was conducted using Level 3 procedures advanced by the Senior Seismic Hazard Analysis Committee (SSHAC) in detailed guidance published by the U.S. Nuclear Regulatory Commission, and provides results at five hazard calculation sites at Hanford. Project organization and the SSHAC Level 3 framework for the PSHA are described, followed by key project tasks and activities. The tectonic setting of the Hanford Site is described to provide context for the PSHA and potential seismic sources, prior to presenting a summary of new data collection and analytical activities conducted to reduce uncertainties in key aspects of the seismic source characterization (SSC) and ground motion characterization (GMC) models. Detailed descriptions are next provided of the elements of the SSC and GMC models and their technical justification. These models serve as input to the Hanford PSHA hazard calculations. The PSHA results are presented in the final chapter, which is followed by appendixes containing detailed supplemental information, including related studies and hazard input documents. The outputs of the PSHA can be used to establish the seismic design of new facilities and for safety reviews of existing facilities, by combining the PSHA results with site response analyses conducted using site-specific geotechnical information.

Hanford Sitewide Probabilistic Seismic Hazard Analysis 2014
v
Executive Summary
This report documents the sitewide probabilistic seismic hazard analysis (PSHA) of the Hanford Site (hereafter Hanford PSHA) in southeastern Washington State that was undertaken by Pacific Northwest National Laboratory (PNNL) and its contractors for the U.S. Department of Energy (DOE) Office of River Protection (ORP), DOE Richland Operations Office (RL), and Energy Northwest to provide a detailed characterization of the vibratory ground motion hazard at the Hanford Site from potential future earthquakes.
ES.1. Project Purpose, Scope, and Objectives
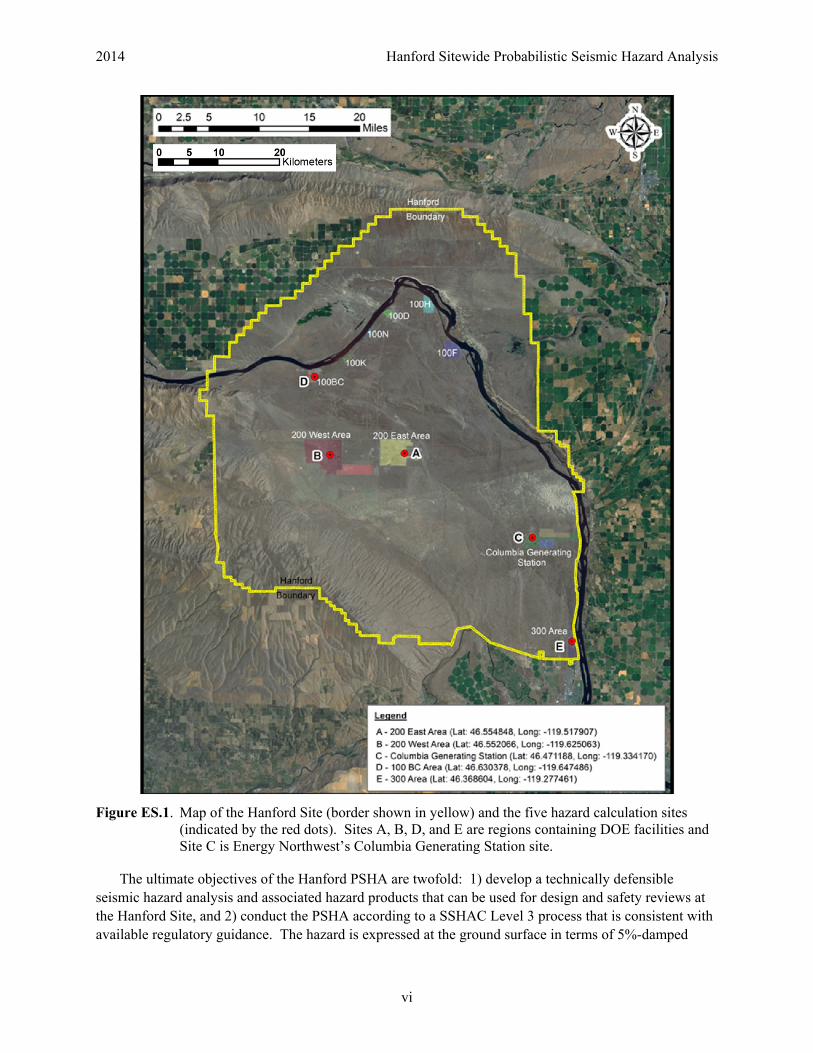
The study reported herein was conducted to fulfill the requirements for DOE facilities as well as those for commercial nuclear power plants, through a collaboration and joint sponsorship between DOE and Energy Northwest. The study fulfills the commitment made by DOE to update the PSHA, which was made after the review of the current PSHA required by DOE Order 420.1C (Facility Safety). In addition, the study fulfills the requirement from the U.S. Nuclear Regulatory Commission (NRC) that Energy Northwest conduct a PSHA using Senior Seismic Hazard Analysis Committee (SSHAC) Level 3 procedures for the Columbia Generating Station (CGS). Because the Hanford Site includes several facility sites, the PSHA has been conducted such that seismic hazard is calculated at five sites that are located across the Hanford Site (Figure ES.1); these are called “hazard calculation sites” in this document.
Earthquake-related studies have been conducted at the Hanford Site since the late 1970s when they were carried out for purposes of licensing of the Washington Public Power Supply System nuclear power plant sites. Likewise, studies for DOE were conducted over the past 40 years as part of a variety of activities, including the Basalt Waste Isolation Program. However, the most recent PSHA that followed conventional practice was the PSHA published by Geomatrix in 1996 for the Hanford Site. That study was sponsored by DOE and intended for use at the DOE nuclear facilities. The 1996 PSHA was conducted prior to the issuance of the SSHAC Guidelines, but the study corresponded generally to what would now be considered a SSHAC Level 2 study. From the time of its issuance, the results of the 1996 PSHA have provided the input “free field” ground motions for a variety of ground motion assessments for purposes of design or design review. These include DOE facilities such as the tank farm facilities, the Waste Treatment Plant (WTP), and the single-shell tank facilities. In all cases, the 1996 PSHA provided the input ground motions, at appropriate annual frequencies of exceedance, which were then modified to incorporate site-specific soil conditions and potential soil-structure interaction effects. Thus, although facility-specific seismic analyses have been conducted for many years at the Hanford Site since completion of the 1996 PSHA, the hazard analysis had not been updated since that time.
The decision by DOE to replace the 1996 PSHA was made in light of decision criteria that exist as DOE Orders and Standards that have been developed within the professional community. Similar decision criteria have more recently been put in place for NRC-regulated facilities. However, the decision by Energy Northwest to participate in the Hanford PSHA was also motivated by NRC directives that were developed in response to the Fukushima Daiichi nuclear power plant accident.
2014 Hanford Sitewide Probabilistic Seismic Hazard Analysis
vi
Figure ES.1. Map of the Hanford Site (border shown in yellow) and the five hazard calculation sites (indicated by the red dots). Sites A, B, D, and E are regions containing DOE facilities and Site C is Energy Northwest’s Columbia Generating Station site.
The ultimate objectives of the Hanford PSHA are twofold: 1) develop a technically defensible seismic hazard analysis and associated hazard products that can be used for design and safety reviews at the Hanford Site, and 2) conduct the PSHA according to a SSHAC Level 3 process that is consistent with available regulatory guidance. The hazard is expressed at the ground surface in terms of 5%-damped
Hanford Sitewide Probabilistic Seismic Hazard Analysis 2014
vii
horizontal response spectral ordinates at 20 oscillator frequencies between 0.01 and 10.0 sec. Because the near-surface materials are currently not characterized in sufficient detail for site response analyses at all of the facility locations (other than the WTP site and, to some extent, the CGS plant), the decision was made to limit the PSHA scope to the estimation of ground motions in a defined baserock horizon. These motions can be convolved with site amplification factors obtained from site response analyses at each location at which surface motions are required. Characterization of the near-surface sediment layers (above the basalts) and convolution of the baserock hazard with the site amplification functions are outside the scope of the PSHA project, but the project did include the characterization of all stratigraphic layers from the baserock horizon to the top of the basalts, and guidelines are provided for both the execution of the site response analyses and the convolution of the baserock motions with the site amplification functions. The scope of the PSHA project also included recommendations for vertical-to-horizontal (V/H) response spectral ratios to be applied to the surface motions in order to obtain vertical response spectra.
ES.1.1. Analytical Process: SSHAC Level 3
The Hanford PSHA was conducted using processes that are appropriate for a Study Level 3, as presented in the guidance advanced by the SSHAC in NUREG/CR-6372, Recommendations for Probabilistic Seismic Hazard Analysis: Guidance on Uncertainty and Use of Experts—known informally as the SSHAC Guidelines—as well as the detailed implementation guidance provided in NUREG-2117, Practical Implementation Guidelines for SSHAC Level 3 and 4 Hazard Studies.
The input to the PSHA to calculate the hazard at the baserock horizon consists of a seismic source characterization (SSC) model and a ground motion characterization (GMC) model. The SSC model defines the location and average rates of all potential future earthquakes of different magnitudes up to the maximum considered physically possible within each source. The GMC model predicts the expected distribution (defined by a logarithmic mean value and an associated logarithmic standard deviation) of spectral accelerations at a site due to a particular earthquake scenario. The PSHA calculations calculate the resulting ground motions from all possible earthquake scenarios and from sampling the full distribution of ground motion amplitudes, to obtain estimates of the total rate at which each level of acceleration is expected to be exceeded at the site.
The quantity of data available regarding earthquake occurrence and ground motion generation in any region is never sufficient to unambiguously define the SSC and GMC models. One reason for this is that the completeness of the data, and sometimes its quality as well, are such that different experts assessing the data arrive at diverse interpretations, all of which may be technically defensible. Another reason is that the PSHA calculations will always consider earthquake scenarios for which no data at all are available, such as large-magnitude earthquakes at short distances from the site. These are examples of what is referred to as epistemic uncertainty, which reflects lack of knowledge regarding earthquake processes in general and in the study region in particular. This uncertainty is incorporated in the PSHA calculations.
The SSHAC Level 3 process as given in current regulatory guidance defines clear roles and responsibilities for all participants. All technical assessments including the final hazard model and documentation are developed by Technical Integration (TI) Teams that perform this work in two stages: evaluation and integration. In the evaluation stage, the TI Teams assess available data, methods, and
2014 Hanford Sitewide Probabilistic Seismic Hazard Analysis
viii
models both for their inherent quality and reliability, and specifically for their applicability to the region and site under consideration. In the integration phase, the TI Teams construct logic trees that capture the center, the body, and the range of technically defensible interpretations. The work is conducted under the continuous observation of the Participatory Peer Review Panel (PPRP), which is charged with performing both technical and process reviews. The PPRP is responsible for reviewing the activities of the TI Teams to ensure that the project satisfactorily considers available data, methods, and models; captures the center, body, and range of technically defensible interpretations; and adequately documents the technical bases of all decisions. PPRP concurrence that these goals have been met is the key indicator of successful compliance with the requirements of a SSHAC Level 3 process.
The Hanford PSHA was conducted from April 2012 to October 2014. The project included a kick-off meeting in April 2012 conducted at PNNL facilities in Richland, Washington, and a tour of the Hanford region. Three workshops were held in Walnut Creek, California. Workshop 1 identified significant seismic hazard issues and data available to address those issues. Workshop 2 reviewed the databases assembled by the teams and discussed alternative models that related to the seismic source or ground motion models for the project. Workshop 3 provided an opportunity for the technical integration teams to present their preliminary SSC and GMC models to the PPRP and receive feedback. Hazard feedback based on hazard calculations using the preliminary models was also provided at Workshop 3. Seven working meetings (four for seismic source characterization and three for ground motion characterization) were held in Oakland, California, over the course of the project to facilitate interaction between the team members; due to family circumstance preventing travel, the first GMC Working Meeting was conducted as a conference call. As is typical of SSHAC Level 3 projects, the total number of participants entailed a large group of about 50 individuals.
ES.1.2. Hanford Site Tectonic Setting
The Hanford Site is located east of the region tectonically dominated by the Cascadia subduction zone, where the Juan de Fuca plate under-thrusts northern California and western Oregon and Washington along the Cascadia subduction zone. Magmatism related to the subduction zone is represented by the Cascade volcanoes, which lie to the west of the Hanford Site. Following establishment of the Cascadia subduction zone and related volcanic chain, the later geologic history of eastern Washington was dominated by eruption and deposition of the Columbia River basalts (CRBs). The CRB flows in eastern Washington are deformed in a series of generally east-west-trending anticlines underlain by reverse faults that are known collectively as the Yakima Fold Belt (YFB). The reverse faults of the YFB dominate the post-CRB tectonics and topography in eastern Washington. The Yakima folds are anticlines that have accommodated approximately north-south shortening. Seismicity and geodetic indicators of contemporary tectonics confirm that north-south stresses continue to be the dominant stress mechanism. However, the rates of shortening, uplift, and fault slip, as recorded by the deformation of various units of the CRB, show that rates of deformation are low relative to the slip rates of faults within active tectonic regions.
The Hanford Site is characterized by a relatively thin layer of supra-basalt sediments (mainly the Hanford and Ringold formations), which have thicknesses ranging from 60 to 200 m at the five hazard calculation sites. These sediments are underlain by the basalt flows of the Saddle Mountain basalts (SMB) sequence and interbedded Ellensburg formation sediments; the basalt-interbed stacks have a thickness of about 250 m at the hazard calculation sites. Below the SMB are the Wanapum basalts (WBs)
Hanford Sitewide Probabilistic Seismic Hazard Analysis 2014
ix
and Grande Ronde basalts, collectively forming the CRB, with a total thickness of 2 to 3 km at the hazard calculation sites. The CRB is underlain by a thick layer of pre-Miocene sediments, with the crystalline basement encountered at depths ranging from 7.5 to 9 km at the five hazard calculation sites.
Regional seismicity in the YFB region is dominated by small-magnitude earthquakes that occur within the CRB units in the upper 3 km, and more diffuse seismicity that extends to depths of about 20 km. Rates of moderate-to-large earthquakes are low relative to plate boundary regions. Within the YFB region, the largest observed earthquakes are the 1936 Milton-Freewater earthquake (M 6) and the 1872 Lake Chelan earthquake (M 6.5–7). To the west of the site region, earthquakes are mainly associated with the Cascadia subduction zone and Holocene crustal faults in the Puget Lowland.
ES.2. Technical Foundation for the PSHA
The technical foundation for the Hanford PSHA was developed through the SSHAC Level 3 processes of evaluation and integration. The evaluation phase of the project entails the identification, compilation, and review of data, models, and methods that exist within the larger technical community. During the integration phase of the project, the TI Teams develop their SSC and GMC models that represent the center, body, and range of technically defensible interpretations.
The evaluation phase of the Hanford PSHA entailed the gathering and reviewing of existing literature and data sets, collecting new data and information focused on key SSC and GMC issues, and assembling the earthquake catalog for the region. Data compilation began at the time of project authorization and continued to the point at which the final SSC and GMC models were developed. The data compiled by the project team include references from the literature, site-specific information developed for the Hanford Site, publicly available information developed by other agencies, and other hazard studies. As part of this evaluation activity, data focused on specific technical issues of interest were presented at Workshop 1, and alternative models and methods that were potentially applicable to the Hanford PSHA were presented and discussed at Workshop 2. As the project progressed, the database development activity included preparation of derivative maps and products that are directly applicable to the PSHA (e.g., seismicity maps) and conducting analyses that provided input information to the TI Teams (e.g., geochronology results, shear-wave velocity profiles).
Aspects of the data developed for the evaluation phase of the project that are specific to the SSC and GMC subprojects are described in the following sections.
ES.2.1. Seismic Source Characterization Data
The SSC component of the Hanford PSHA entailed the compilation and review of a wide range of data and information that exist within the technical community. Data sources included available information from the following sources: professional literature; data held in the public domain, such as studies conducted for facility sites at Hanford; private domain data such as those developed as part of oil exploration activities; and unpublished data including the results of ongoing investigations. To the extent possible, mapped information was compiled in geographic information system (GIS) formats that allowed the TI Team to superimpose various combinations of data layers for use in interpretations and developing the SSC model. In addition to the GIS database, a comprehensive bibliography of literature was compiled for use by the TI Team. This bibliography built upon the seismic/geologic bibliography already developed by PNNL.
2014 Hanford Sitewide Probabilistic Seismic Hazard Analysis
x
In addition to data existing within the community, the Hanford PSHA evaluation process also included the collection of new data that were focused specifically on the reduction of uncertainties in the key inputs to the SSC models. New data that were developed during these efforts are also included in the database and were used extensively by the SSC TI Team. Activities conducted to supplement existing data included the following:
Quaternary Geologic Studies: Field mapping, geomorphic analyses, and structural geologic data analyses were conducted to support the quantitative structural analysis of the Yakima folds. These analyses were conducted in conjunction with tectonic geomorphic analyses of the Yakima River terraces, geochronological analyses, and other geologic investigations designed to characterize the timing and rate of Quaternary uplift—or lack of uplift—associated with various folds. The structural analyses included limited field reconnaissance and topographic analyses to establish the relationship between topographic relief and structural relief associated with each Yakima fold in the site region. In turn, these data were used with fault models to assess the downdip geometry of the folds and faults, as well as the amount and rates of fault slip.
High-Resolution Seismicity Relocations: Using state-of-the-art double-difference relocation techniques, high-resolution three-dimensional (3-D) earthquake locations were determined using the programs HypoDD and TomoDD and existing high-quality seismicity data. This task also involved a review of the focal mechanisms and consideration of the spatial distribution of seismicity relative to hypocentral depth distributions and possible associations with faults.
The SSC data compilation activities also included the evaluation of the data, following the guidance provided by the NRC in NUREG–2117. The SSC TI Team developed data summary/evaluation tables that are appropriate for the types of data that were compiled for the Hanford Site. The purpose of the data tables was to clearly document all data that had been considered by the SSC TI Team and, for those data that were actually used to develop the SSC model, to document the degree of reliance afforded to specific data sets in the development of the SSC model.
ES.2.2. Earthquake Catalog
Like all seismic hazard analyses, the earthquake catalog provides an essential database needed in the development of an SSC model. For the Hanford PSHA, two earthquake catalogs were compiled: the crustal earthquake catalog and the Cascadia subduction zone catalog. These two earthquake sources have different characteristics, so for the purpose of calculating earthquake recurrence parameters for the crustal and subduction seismic sources, they were maintained in two separate catalogs. The process of compiling the two earthquake catalogs was the same as that given in Central and Eastern United States Seimic Source Characterization for Nuclear Facilities in NUREG-2115; records from multiple sources were merged, compared, and uniformly processed to obtain a complete catalog with a uniform size measure for all earthquakes. The purpose of merging earthquake records from different sources is to limit the effect of partial network coverage in time and space, and to obtain a data set of alternative magnitude measures for use in deriving magnitude conversion equations. The process of homogenizing the magnitudes to a uniform moment magnitude measure and calculating unbiased earthquake counts to be used in recurrence analysis allows proper treatment of the uncertainty in the magnitude estimates and in the magnitude conversions. For earthquake recurrence assessments, the catalog undergoes a declustering process to remove all foreshocks and aftershocks, the completeness of the catalogs is assessed as a function of location, time, and earthquake size.
Hanford Sitewide Probabilistic Seismic Hazard Analysis 2014
xi
ES.2.3. Ground Motion Characterization Data
Three components of the database were used to carry out the GMC model development for the Hanford PSHA: 1) a list of the ground motion prediction equations available worldwide that can potentially be applicable to the project, together with their characteristics; 2) data that can be used to constrain the applicability of any equation to the Hanford Site; and 3) characterization of the representative near-surface geological profiles at the Hanford Site that define the target site conditions to which the prediction equations will need to be adjusted. These profiles also define the dynamic site response models used to transfer the baserock hazard to the top of the basalts.
The GMC TI Team established exclusion criteria for ground motion prediction equations (GMPEs) for both crustal and subduction earthquakes, based on considerations of the state of the art in ground motion modeling and the specific conditions and requirements of the Hanford sitewide PSHA. These criteria were applied to global listings of GMPEs, which led to a small number of equations considered suitable for this application. For crustal earthquakes, the criteria included that the models should be well calibrated for reverse-faulting earthquakes, because the hazard was expected to be dominated by the YFB faults. In addition, it was decided that the equations should include the 30-m time-averaged shear-wave velocity, VS30, as an explicit parameter, in order to facilitate adjustments to the local site conditions. This led to the final selection of four of the Next Generation Attenuation Relationships for the Western United States (NGA-West2) GMPEs, although other equations from southern Europe, and other active crustal regions were retained for subsequent comparisons with the final GMC model.
For the subduction earthquakes, it was noted that the recent SSHAC Level 3 PSHA conducted for BC Hydro dams in British Columbia had evaluated existing GMPEs for subduction earthquakes and concluded that none of these were suitable for application to the Cascadia subduction zone. The new subduction GMPE developed by the BC Hydro study was therefore retained as the only candidate, although the GMC TI Team identified improvements that could be made to this model for application to the Hanford PSHA.
The usual starting point for deriving, assessing, or adjusting GMPEs for a region is the database of strong-motion (accelerograph) recordings from that area. In the Hanford Site region, such recordings are limited in number and in amplitude. Nevertheless, all available site ground motion data were cataloged in terms of the date, time, magnitude, depth, and location of the earthquake; the location and geological/geotechnical classification of the recording site; and the instrumental characteristics (component orientation, sampling rate, etc.). Strong-motion records from the broader region in which the site is located were also compiled.
To make meaningful inferences regarding potential differences in attenuation between the host regions from which the selected GMPEs had been obtained and the target application region, the data compilation and evaluation also included Q (crustal attenuation parameter) models for eastern Washington.
Profiles of shear-wave velocity, VS, and mass density (which together with damping are the three basic parameters required for site response characterization) were developed for all five hazard calculation sites. The stratigraphic information for sites other than WTP was inferred from various data sources, including boreholes, wells, and refraction studies. Velocities and densities measured at the WTP site were assumed to apply uniformly to each stratigraphic unit across the site.
2014 Hanford Sitewide Probabilistic Seismic Hazard Analysis
xii
The initial assumption was that the baserock elevation for the GMC model—and thus for the hazard calculations—would be defined at the top of the SMB. However, analyses demonstrated that the velocity inversions associated with the Ellensburg formation sedimentary interbeds would not be consistent with the assumption of an elastic half-space below the baserock horizon. For this reason, the baserock was defined as the top of the Lolo flow (but excluding the ~4 m of vesiculated and brecciated flowtop), which is the uppermost unit of the WB.
Recordings from the Hanford Site from sites with thin sedimentary cover, which could therefore be considered as analogs for either SMB or WB outcrops, were analyzed by Specialty Contractor Dr. Walt Silva in order to estimate kappa values for the Hanford Site. Spectral Analysis of Surface Waves measurements were conducted by the University of Texas at Austin at several of the recording sites to provide characterization of the sites in order to facilitate the kappa analyses. The GMC TI Team also performed its own analyses of the recordings, using the Anderson-Hough approach, to obtain additional estimates of kappa. The GMC TI Team evaluated all of the kappa estimates to obtain best estimate models for this key parameter and the associated epistemic uncertainty. The difference in kappa values at the top of the SMB stack and at the baserock horizon at the top of the WB was assigned as damping in the basalt and interbed layers of the SMB stack at each of the five hazard calculation sites.
The GMC TI Team commissioned Dr. Art Frankel of the U.S. Geological Survey to conduct simulations to explore the possibility of 3-D basin effects at the Hanford Site. The results of Dr. Frankel’s study were carefully considered by the GMC TI Team and the Team concluded that 3-D basin effects would be encountered at certain locations on the Hanford Site for particular earthquake scenarios but that these would not be exceptional in terms of amplification. The TI Team concluded that any 2-D and 3-D effects at the Hanford Site would be consistent with the basin effects captured in the sigma (standard deviation) values of GMPEs for soil sites in general.
Because there was also a requirement to provide V/H spectral ratios for application to the surface motions, criteria were established by the GMC TI Team for such ratios to be applicable to the Hanford project and available relationships for these ratios were evaluated in light of these criteria.
ES.3. Seismic Source Characterization Model
An SSC model in a PSHA defines the seismogenic potential, locations, sizes, and rates of future earthquakes. The SSC model-building process for the Hanford PSHA began with the identification of criteria that would be used by the TI Team to define seismic sources. These criteria were identified based on consideration of the tectonic regime, the types of seismic sources that might be present (e.g., fault sources and source zones), and precedent from recent SSC models developed for similar tectonic environments and for nuclear facilities. Based on these considerations, unique seismic sources are defined to account for distinct spatial differences in the following criteria: earthquake recurrence rate, maximum earthquake magnitude (Mmax), expected future earthquake characteristics (e.g., style of faulting, rupture orientation, seismogenic thickness), and probability that a fault is seismogenic.
Three sets of seismic sources are included in the SSC model: Cascadia subduction zone sources, seismic source zones, and fault sources. The SSC model is based on the notion that an appropriate SSC model should be one that is no more complex or detailed than required by the pertinent data. The process of identifying and characterizing seismic sources for the SSC model was hazard-informed such that
Hanford Sitewide Probabilistic Seismic Hazard Analysis 2014
xiii
highest priority was given to aspects of the model that had the highest potential hazard significance. Likewise, the level of complexity of the SSC model was consistent with current knowledge and importance to hazard. The region over which the SSC model was developed was designed to extend somewhat beyond the distances that would be expected to contribute significantly to the site hazard, based on the hazard sensitivity analyses conducted prior to Workshop 1 and confirmed by sensitivity analyses conducted using the preliminary SSC model prior to Workshop 3.
The basic elements of the SSC model that define and characterize the three types of seismic sources are given below. Given the large number of SSC characteristics assessed for the SSC model, the TI Team gave careful attention to the epistemic uncertainties associated with each characteristic, as well as the aleatory (random) variability that defines some of the characteristics. The former are given in the maps and logic trees that compose the SSC model; the latter are given as aleatory distributions of parameter values that are each associated with their relative frequency in the model.
Sensitivity analyses conducted early in the Hanford PSHA project showed that the plate interface seismic source of the Cascadia subduction zone could contribute to long-period ground motions at annual frequencies of exceedance of interest to the Hanford Site. For completeness, both the plate interface and the intraslab sources are included in the SSC model. Fortunately, the recently completed SSHAC Level 3 PSHA conducted by BC Hydro provided a technically defensible source model that includes a full characterization of uncertainties. In addition to reviewing the BC Hydro model, the activities associated with the Hanford PSHA included updating the earthquake catalog and the TI Team evaluating new data that have become available since completion of the BC Hydro PSHA in 2012. The revisions made in light of new data included the assessment of the landward extent of the plate interface source and the maximum depth of the intraslab source.
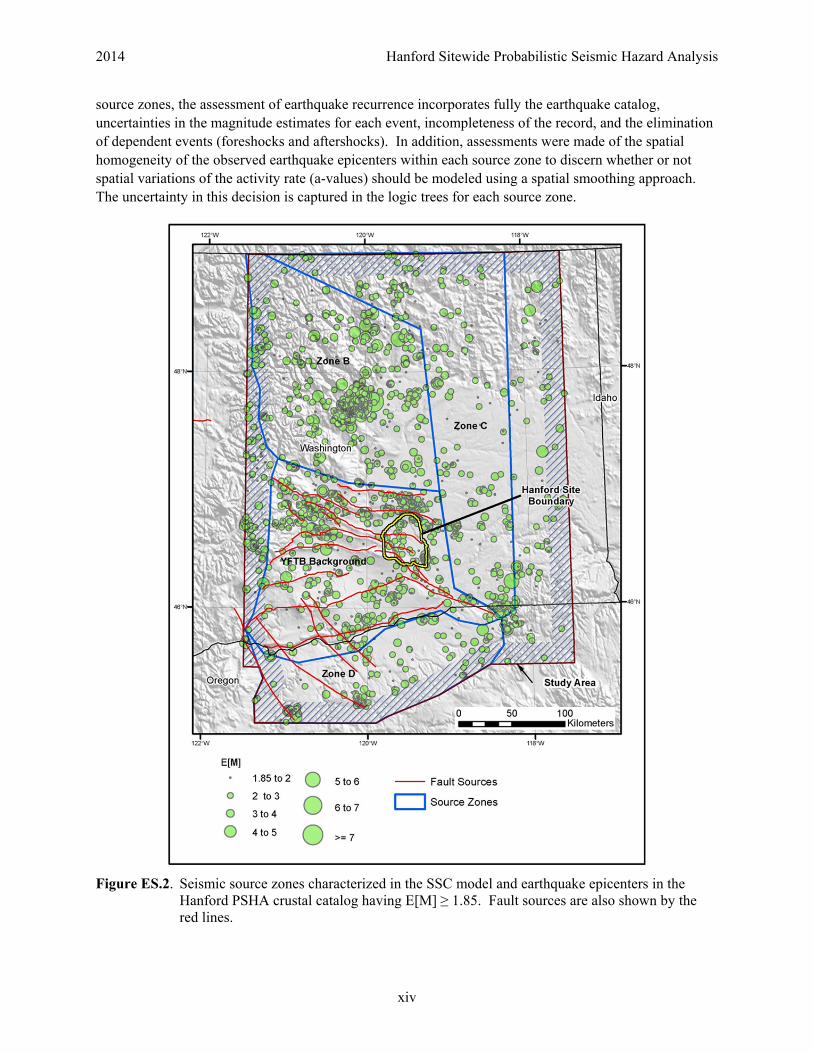
The seismic source zones identified in the site region by the TI Team are shown in Figure ES.2 together with the earthquake epicenters from the project crustal earthquake catalog. Two types of seismic source zones are identified: the Yakima Fold and Thrust Belt (YFTB) source zone is a “background” zone to the fault sources of the YFTB, and Zones B, C, and D are source zones that do not include identified fault sources. Because of their distance from the site, individual faults within Zones B, C, and D are not specifically identified and characterized.
Unlike fault sources, which must be evaluated for their seismogenic probability, seismic source zones are assessed to be seismogenic with a probability of unity. That is, all seismic source zones in the SSC model are judged to have the ability to generate moderate-to-large (M ≥ 5) earthquakes. Consistent with current SSC practice for PSHAs and consistent with the GMPEs developed for the Hanford PSHA, the occurrence of future earthquakes within seismic source zones is modeled by virtual faults that have random locations within the zone. In the SSC model, the future earthquake characteristics on the virtual faults are modeled by their style of faulting, 3-D rupture geometry, magnitude-dependent rupture dimensions, and relationship with zone boundaries. These characteristics of the modeled virtual faults within the zone incorporate source-specific seismotectonic information and uncertainties are included in logic trees.
Additional SSC characteristics assessed for each source zone are their Mmax, recurrence rates, and spatial variation in recurrence parameters. These assessments are source zone-specific and account for the specific data differences among the zones. An element in the logic tree for the YFTB source zone is whether or not the observed seismicity is associated with the fault sources or with the zone itself. For all
2014 Hanford Sitewide Probabilistic Seismic Hazard Analysis
xiv
source zones, the assessment of earthquake recurrence incorporates fully the earthquake catalog, uncertainties in the magnitude estimates for each event, incompleteness of the record, and the elimination of dependent events (foreshocks and aftershocks). In addition, assessments were made of the spatial homogeneity of the observed earthquake epicenters within each source zone to discern whether or not spatial variations of the activity rate (a-values) should be modeled using a spatial smoothing approach. The uncertainty in this decision is captured in the logic trees for each source zone.
Figure ES.2. Seismic source zones characterized in the SSC model and earthquake epicenters in the Hanford PSHA crustal catalog having E[M] ≥ 1.85. Fault sources are also shown by the red lines.
Hanford Sitewide Probabilistic Seismic Hazard Analysis 2014
xv
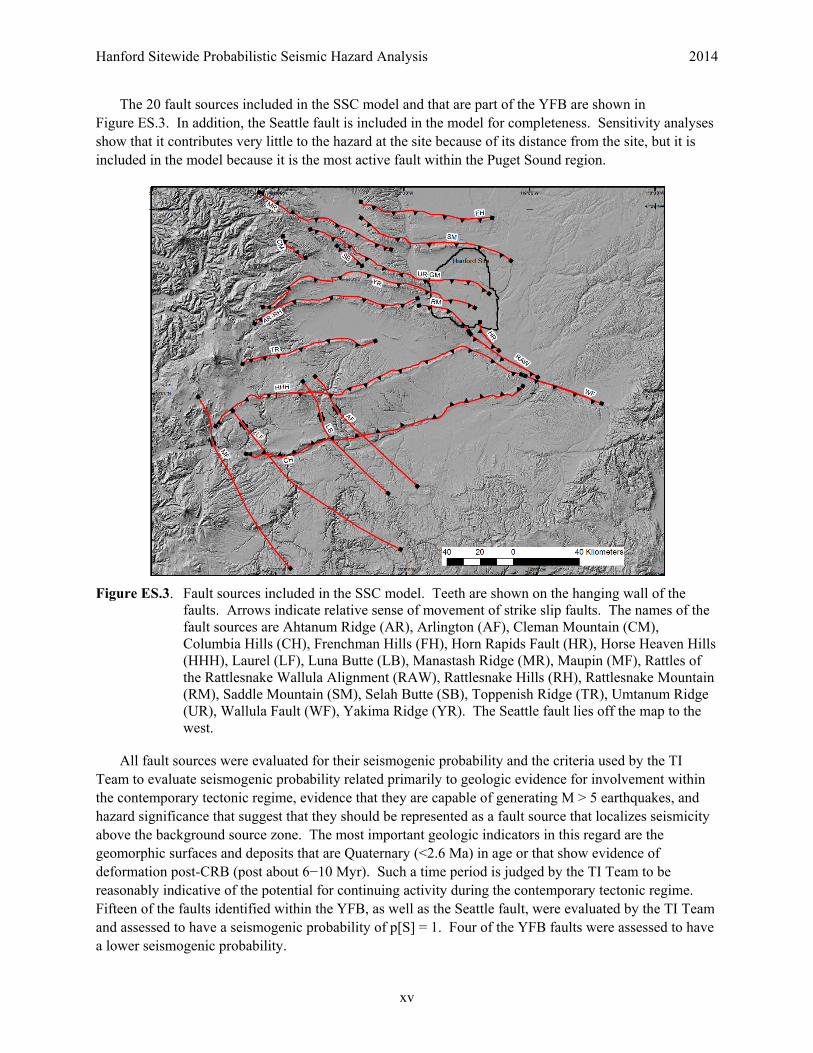
The 20 fault sources included in the SSC model and that are part of the YFB are shown in Figure ES.3. In addition, the Seattle fault is included in the model for completeness. Sensitivity analyses show that it contributes very little to the hazard at the site because of its distance from the site, but it is included in the model because it is the most active fault within the Puget Sound region.
Figure ES.3. Fault sources included in the SSC model. Teeth are shown on the hanging wall of the faults. Arrows indicate relative sense of movement of strike slip faults. The names of the fault sources are Ahtanum Ridge (AR), Arlington (AF), Cleman Mountain (CM), Columbia Hills (CH), Frenchman Hills (FH), Horn Rapids Fault (HR), Horse Heaven Hills (HHH), Laurel (LF), Luna Butte (LB), Manastash Ridge (MR), Maupin (MF), Rattles of the Rattlesnake Wallula Alignment (RAW), Rattlesnake Hills (RH), Rattlesnake Mountain (RM), Saddle Mountain (SM), Selah Butte (SB), Toppenish Ridge (TR), Umtanum Ridge (UR), Wallula Fault (WF), Yakima Ridge (YR). The Seattle fault lies off the map to the west.
All fault sources were evaluated for their seismogenic probability and the criteria used by the TI Team to evaluate seismogenic probability related primarily to geologic evidence for involvement within the contemporary tectonic regime, evidence that they are capable of generating M > 5 earthquakes, and hazard significance that suggest that they should be represented as a fault source that localizes seismicity above the background source zone. The most important geologic indicators in this regard are the geomorphic surfaces and deposits that are Quaternary (<2.6 Ma) in age or that show evidence of deformation post-CRB (post about 6−10 Myr). Such a time period is judged by the TI Team to be reasonably indicative of the potential for continuing activity during the contemporary tectonic regime. Fifteen of the faults identified within the YFB, as well as the Seattle fault, were evaluated by the TI Team and assessed to have a seismogenic probability of p[S] = 1. Four of the YFB faults were assessed to have a lower seismogenic probability.
2014 Hanford Sitewide Probabilistic Seismic Hazard Analysis
xvi
The fault sources within the SSC model are characterized using three logic trees that provide a full expression of the knowledge and uncertainties regarding important fault source characteristics. Given the nature of the available data, which show differences in the geometry and structural relief along the lengths of individual faults, the faults are characterized according to the segments identified along their lengths. The first logic tree includes the characteristics that define the 3-D geometry and net slip rate for each fault segment. Included are the seismogenic thickness, approach to assessing fault dip, seismogenic probability, sense of slip, start time, and net slip rate. The resulting distributions of net slip rate are then used as input to the logic tree related to earthquake recurrence rates. A few of the faults have documented evidence for Quaternary deformation and, as a result, Quaternary slip rates have also been assessed and these are combined in the logic tree with the long-term slip rates as weighted alternatives.
The second logic tree for fault sources includes the assessments that lead to a distribution of characteristic magnitudes, Mchar. The assessments relate to the expected dimensions of rupture, defined by the seismogenic thickness, rupture length, and average downdip width. Given estimates of rupture length and rupture area, alternative approaches to calculating Mchar are included in the logic tree as well as alternative rupture versus magnitude relationships for a given approach.
The third logic tree includes the assessments that lead to earthquake recurrence rates for each fault segment. The temporal scale factor accounts for the possibility of non-Poissonian behavior related to a renewal process of earthquake generation. The factor is multiplied by the Poissonian recurrence rate to account for the large uncertainties that exist for the timing of past earthquakes on these fault sources. For three fault sources, sufficient data exist to estimate earthquake recurrence intervals as well as slip rate; hence, these alternative approaches to recurrence estimation are included in the logic tree. For all fault segments the net slip rates combined with the dimensions of the fault define the seismic moment rate, which is input to a magnitude frequency distribution to arrive at the equivalent Poisson rate for all magnitudes up to the maximum, Mmax. The final distributions are then input directly into the seismic hazard model.
Special Studies Results Put to Good Use
As shown in Figure ES.1, the observed seismicity in the study region shows rather swarm-like spatial patterns of earthquake epicenters in the region within which faults were identified and evaluated for this study. This is especially true of the seismicity in the shallow crust that represents the CRBs. As part of the high-resolution seismicity relocation analyses performed for this study, the investigators considered the spatial distribution of earthquake hypocenters and evaluated whether or not the hypocenters showed alignments that could represent active faults. The general conclusion of these studies was that no such alignments were evident. Further, the TI Team evaluated whether spatial associations with mapped faults existed and generally concluded that such associations could not be made with confidence and this assessment is part of the logic trees for the fault sources.
The Quaternary geologic studies (QGS) were conducted with the specific intention of identifying Quaternary geological deposits and geomorphic surfaces that could be dated and mapped to define the presence or absence of fault displacement or other deformation. In this respect, the QGS greatly added to the applicable database needed to identify potentially seismogenic faults and to assess their recency of displacement. These studies provided a basis for comparing the Quaternary rates of deformation for some faults with the long-term rates assessed over the past 6–10 Myr. In doing so, the evidence clearly shows that the long-term rates are comparable and that the post-CRB deformation rates of the faults of the YFB have been relatively constant over that time period.
Many of the characteristics of the fault sources in the SSC model are defined by their structural geologic features. For example, the mapped location and spatial pattern of structural relief is used to identify potential lengths of rupture segments and, in turn, the range of characteristic magnitudes (Mchar) for the fault source. The mapped pattern of structural relief also provides information related to the dip of the fault at depth, and the amount of relief is used together with assessments of the deformation start time to assess the vertical and net rates of slip. The careful consideration of that type of local geologic evidence has provided a firm technical basis for assessing the characteristics of all of the fault sources within the YFB.
Hanford Sitewide Probabilistic Seismic Hazard Analysis 2014
xvii
ES.4. Ground Motion Characterization Model for Baserock Horizon
The ultimate goal of the Hanford sitewide PSHA is to enable the characterization of the ground-shaking hazard at the location of several surface facilities on the Hanford Site. The GMC model consists essentially of two logic trees, one for ground motions from crustal earthquakes and the other for motions caused by subduction earthquakes. In both cases, GMC models apply to the baserock elevation at the top of the WBs, which have a shear-wave velocity, Vs, very close to 3,000 m/s. For both the crustal and subduction logic trees, there are branches for the median motions and also for the associated aleatory variability (sigma). For the crustal earthquakes, one of the NGA-West2 models (CY14) was chosen to serve as a backbone and the ranges of alternative median predictions (reflecting epistemic uncertainty within the host region predictions) were inferred from the amplitudes obtained from other NGA-West2 equations, using slightly different subsets of these models for footwall and hanging-wall locations. The backbone equation was adjusted to be applicable to the top of WB baserock horizon through the application of factors to account for differences in host and target region VS profiles and site kappa values. The host VS profile was assumed to be a generic model for California and the host kappa values were inferred from the high-frequency portion of the predicted median response spectra for a number of earthquake scenarios. Scaling factors, reflecting inferred ranges of potential host-to-target region differences in stress drops, were then applied to the VS-kappa adjusted models to develop additional equations to occupy the logic-tree branches. One of the terms in the backbone GMPE is an explicit function of the parameter ZTOR (depth to top of rupture), which captures the influence of higher stress drops associated with buried fault ruptures. To capture the influence of ruptures in the strong basalt layers near the surface, which are unusual and could lead to higher than average stress drops for shallow ruptures, a condition was imposed that ZTOR would always take a value of at least 3 km, regardless of the actual depth to rupture (but this did not affect the calculation of rupture distances).
For the subduction earthquakes, a new GMPE was derived using an expanded version of the BC Hydro model database and a slightly modified functional form for the equation. One of several motivations for this change was the fact that the Hanford Site is located at distances of 250−300 km from the Cascadia subduction sources, leading to a requirement for well-constrained models at such distances in the backarc (beyond the volcanic arc associated with the subduction) region. Alternative models were developed considering different options for large-magnitude scaling and for the attenuation function, and then host-to-target scaling factors were applied to fully populate the logic-tree branches. For the subduction GMPE, the adjustment to the local site conditions was made only in terms of host-to-target differences in VS profiles because at such long distances the influence of kappa (which represents high-frequency attenuation in the uppermost part of the crust) is masked by crustal attenuation along the travel path. The host VS profile was based on Japanese recording sites, because Japanese data dominate the subduction data set, particularly for the larger magnitudes.
The multiple branches considered in the site-specific adjustments (for VS and VS-kappa) and the recommended capture of variability in the site response calculations, together meant that the site-to-site component of the ground motion variability (sigma) was accounted for, at least at higher response frequencies. Therefore, for the baserock model, single-station sigma models were developed, adapted from models developed in other SSHAC Level 3 and 4 projects in South Africa and Switzerland. The single-station sigma models were applied at all response frequencies, but these may not apply at intermediate and longer response periods. This is the result of the influence of 3-D basin effects being captured in the sigma value for intermediate response periods (0.5−1.0 sec), and the fact that variability in
2014 Hanford Sitewide Probabilistic Seismic Hazard Analysis
xviii
site response calculations having almost no impact at response periods much beyond 1 sec. However, because these effects are all associated with the suprabasalt sediments, it would not have been appropriate to modify the single-station sigma model at the baserock rock, where it was retained across the entire period range. Instead, the additional variability required at intermediate and longer response periods was made part of the specification for the convolution of the site amplification functions with the baserock hazard.
The GMC model also provides a recommendation for V/H response spectral ratios that may be used to transform the horizontal motions at the surface to the vertical component. The proposed V/H ratios are defined as a function of magnitude, distance, style of faulting and VS30, and can applied to the horizontal response spectra using magnitude-distance pairs obtained from disaggregation of the hazard. The suggested V/H ratios are derived from crustal earthquakes, but have been adjusted at longer periods to accommodate observed V/H ratios from large subduction earthquakes.
ES.5. Site Response Models and Combination with Baserock Hazard
The GMC model also provides a suite of models of the SMB stacks for use in subsequent site response analyses. These profiles include layered models with VS (giving low-strain stiffness), mass density, and low-strain damping in each layer. Damping curves and stiffness degradation curves are defined for the interbeds. Randomizations of the profiles are defined with suitable layer-to-layer correlations for use in the site response analyses, together with similar randomized profiles for the suprabasalt sediments (to be defined by those conducting the site response analyses). The recommended procedure for combining the site amplification functions with the baserock hazard is the Approach 3 convolution described in NUREG/CR-6728. Minimum values of the variability in the site amplification functions are specified at longer periods, with the clarification that these should not be obtained by adding greater uncertainty into the site response profiles but by simply increasing the variability if insufficiently large. The PSHA report provides detailed guidelines for the execution of the site response analyses, the convolution of the baserock hazard and the calculated site amplification factors, and a fully worked example for the WTP location.
ES.6. Hazard Calculations and Results
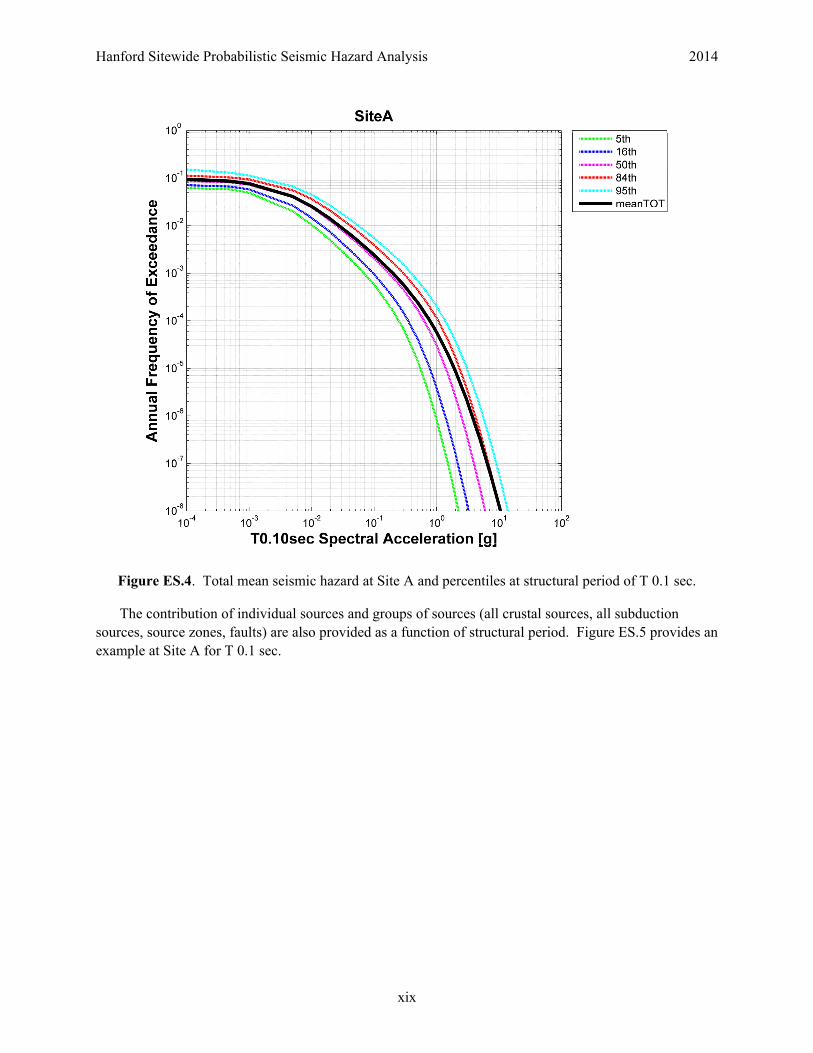
The implementation of the comprehensive seismic hazard model described above results in calculations of seismic hazard and seismic hazard sensitivity analyses at the five sites shown in Figure ES.1: Site A in the 200-East Area, Site B in the 200-West Area, Site C, the Columbia Generating Station, Site D in the 100 BC Area, and Site E in the 300 Area. In all cases, the baserock elevation for the hazard calculations was selected as being the top of the WBs (minus the ~4-m flowtop of the uppermost Lolo flow), which is encountered at depths of between 332 and 446 m at the hazard calculation Sites A−E. The results provided in this report are based on twenty structural periods (peak ground acceleration [PGA], and T 0.02, 0.03, 0.04, 0.05, 0.07, 0.1, 0.15, 0.20, 0.30, 0.40, 0.50, 0.75, 1.0, 1.5, 2.0, 3.0, 5.0, 7.5 and 10-sec spectral acceleration) and extend from annual frequencies of exceedance (AFEs) of 10-2 to 10-8. For each site, results are shown in the report as seismic hazard curves showing the mean total hazard and percentiles at each of the structural periods. An example at Site A for T 0.1 sec is shown in Figure ES.4.
Hanford Sitewide Probabilistic Seismic Hazard Analysis 2014
xix
Figure ES.4. Total mean seismic hazard at Site A and percentiles at structural period of T 0.1 sec.
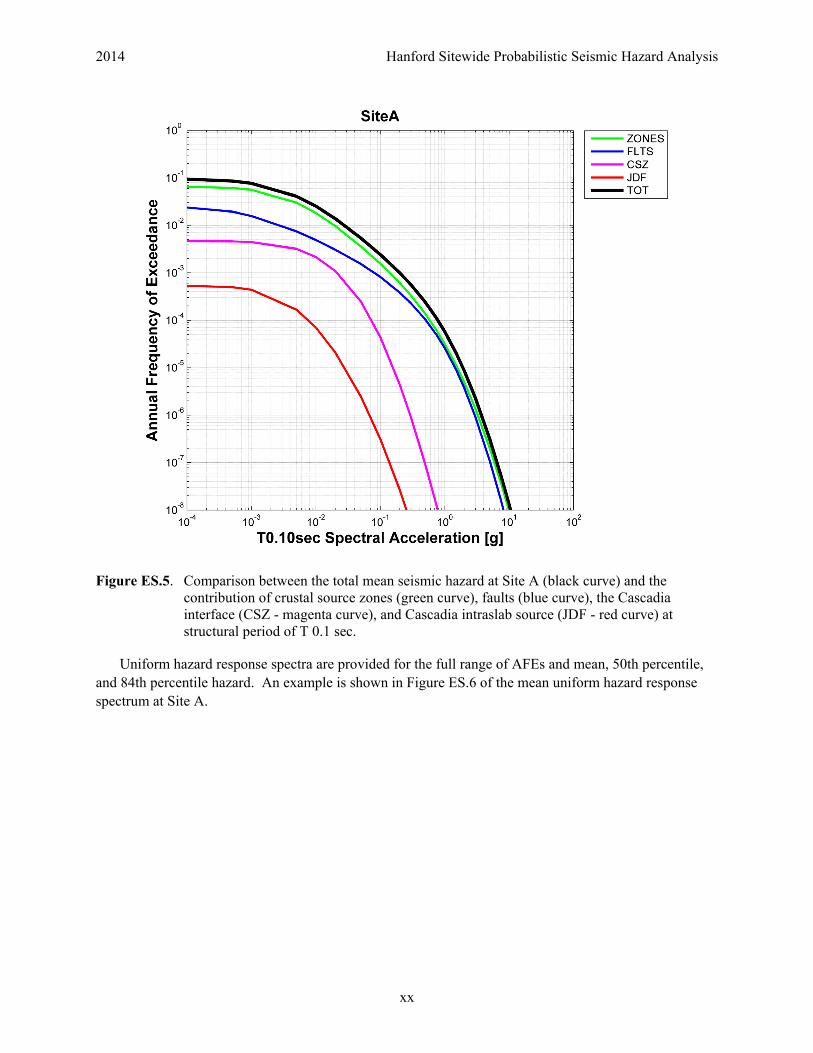
The contribution of individual sources and groups of sources (all crustal sources, all subduction sources, source zones, faults) are also provided as a function of structural period. Figure ES.5 provides an example at Site A for T 0.1 sec.
2014 Hanford Sitewide Probabilistic Seismic Hazard Analysis
xx
Figure ES.5. Comparison between the total mean seismic hazard at Site A (black curve) and the contribution of crustal source zones (green curve), faults (blue curve), the Cascadia interface (CSZ - magenta curve), and Cascadia intraslab source (JDF - red curve) at structural period of T 0.1 sec.
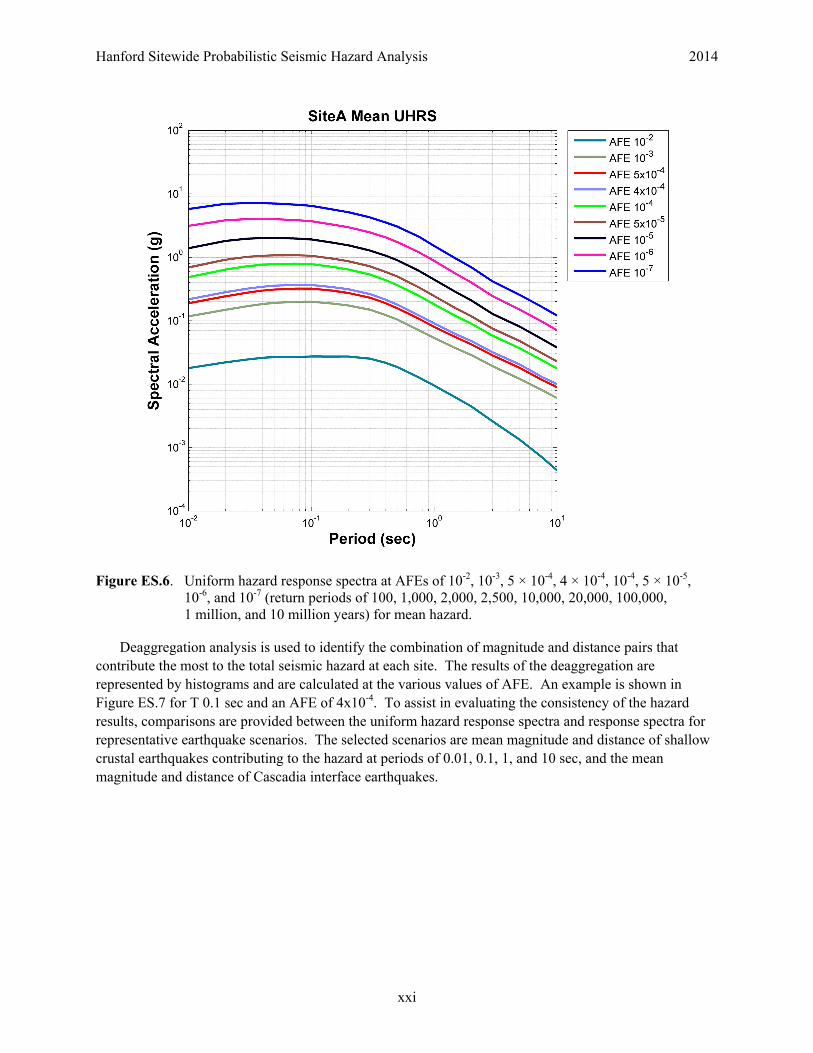
Uniform hazard response spectra are provided for the full range of AFEs and mean, 50th percentile, and 84th percentile hazard. An example is shown in Figure ES.6 of the mean uniform hazard response spectrum at Site A.
Hanford Sitewide Probabilistic Seismic Hazard Analysis 2014
xxi
Figure ES.6. Uniform hazard response spectra at AFEs of 10-2, 10-3, 5 × 10⁻⁴, 4 × 10⁻⁴, 10-4, 5 × 10⁻⁵, 10-6, and 10-7 (return periods of 100, 1,000, 2,000, 2,500, 10,000, 20,000, 100,000, 1 million, and 10 million years) for mean hazard.
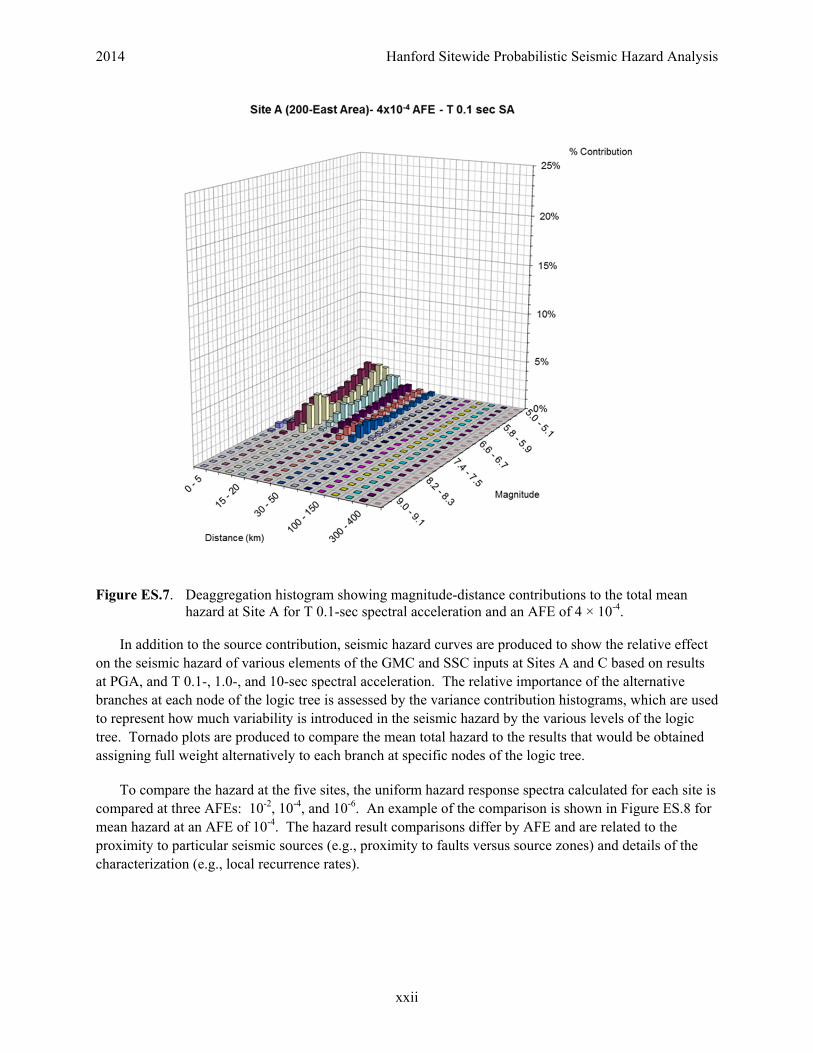
Deaggregation analysis is used to identify the combination of magnitude and distance pairs that contribute the most to the total seismic hazard at each site. The results of the deaggregation are represented by histograms and are calculated at the various values of AFE. An example is shown in Figure ES.7 for T 0.1 sec and an AFE of 4x10⁻⁴. To assist in evaluating the consistency of the hazard results, comparisons are provided between the uniform hazard response spectra and response spectra for representative earthquake scenarios. The selected scenarios are mean magnitude and distance of shallow crustal earthquakes contributing to the hazard at periods of 0.01, 0.1, 1, and 10 sec, and the mean magnitude and distance of Cascadia interface earthquakes.
2014 Hanford Sitewide Probabilistic Seismic Hazard Analysis
xxii
Figure ES.7. Deaggregation histogram showing magnitude-distance contributions to the total mean hazard at Site A for T 0.1-sec spectral acceleration and an AFE of 4 × 10⁻⁴.
In addition to the source contribution, seismic hazard curves are produced to show the relative effect on the seismic hazard of various elements of the GMC and SSC inputs at Sites A and C based on results at PGA, and T 0.1-, 1.0-, and 10-sec spectral acceleration. The relative importance of the alternative branches at each node of the logic tree is assessed by the variance contribution histograms, which are used to represent how much variability is introduced in the seismic hazard by the various levels of the logic tree. Tornado plots are produced to compare the mean total hazard to the results that would be obtained assigning full weight alternatively to each branch at specific nodes of the logic tree.
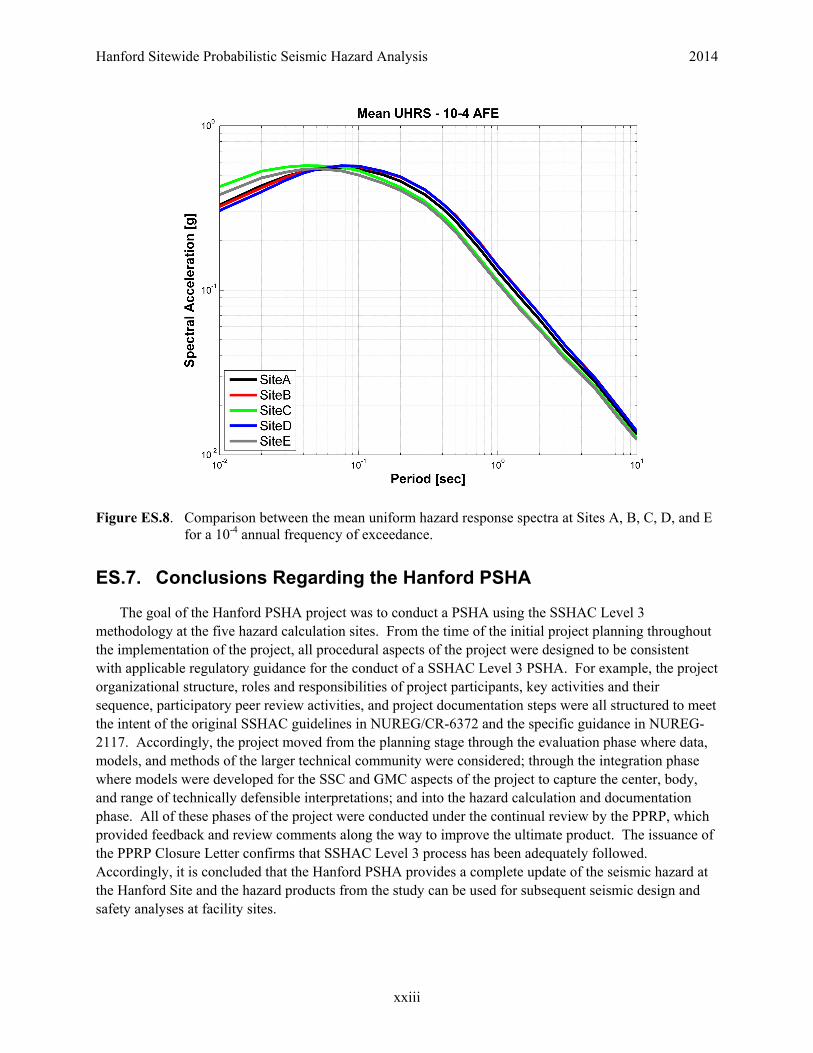
To compare the hazard at the five sites, the uniform hazard response spectra calculated for each site is compared at three AFEs: 10-2, 10-4, and 10-6. An example of the comparison is shown in Figure ES.8 for mean hazard at an AFE of 10-4. The hazard result comparisons differ by AFE and are related to the proximity to particular seismic sources (e.g., proximity to faults versus source zones) and details of the characterization (e.g., local recurrence rates).
Hanford Sitewide Probabilistic Seismic Hazard Analysis 2014
xxiii
Figure ES.8. Comparison between the mean uniform hazard response spectra at Sites A, B, C, D, and E for a 10-4 annual frequency of exceedance.
ES.7. Conclusions Regarding the Hanford PSHA
The goal of the Hanford PSHA project was to conduct a PSHA using the SSHAC Level 3 methodology at the five hazard calculation sites. From the time of the initial project planning throughout the implementation of the project, all procedural aspects of the project were designed to be consistent with applicable regulatory guidance for the conduct of a SSHAC Level 3 PSHA. For example, the project organizational structure, roles and responsibilities of project participants, key activities and their sequence, participatory peer review activities, and project documentation steps were all structured to meet the intent of the original SSHAC guidelines in NUREG/CR-6372 and the specific guidance in NUREG-2117. Accordingly, the project moved from the planning stage through the evaluation phase where data, models, and methods of the larger technical community were considered; through the integration phase where models were developed for the SSC and GMC aspects of the project to capture the center, body, and range of technically defensible interpretations; and into the hazard calculation and documentation phase. All of these phases of the project were conducted under the continual review by the PPRP, which provided feedback and review comments along the way to improve the ultimate product. The issuance of the PPRP Closure Letter confirms that SSHAC Level 3 process has been adequately followed. Accordingly, it is concluded that the Hanford PSHA provides a complete update of the seismic hazard at the Hanford Site and the hazard products from the study can be used for subsequent seismic design and safety analyses at facility sites.


Hanford Sitewide Probabilistic Seismic Hazard Analysis 2014
xxvii
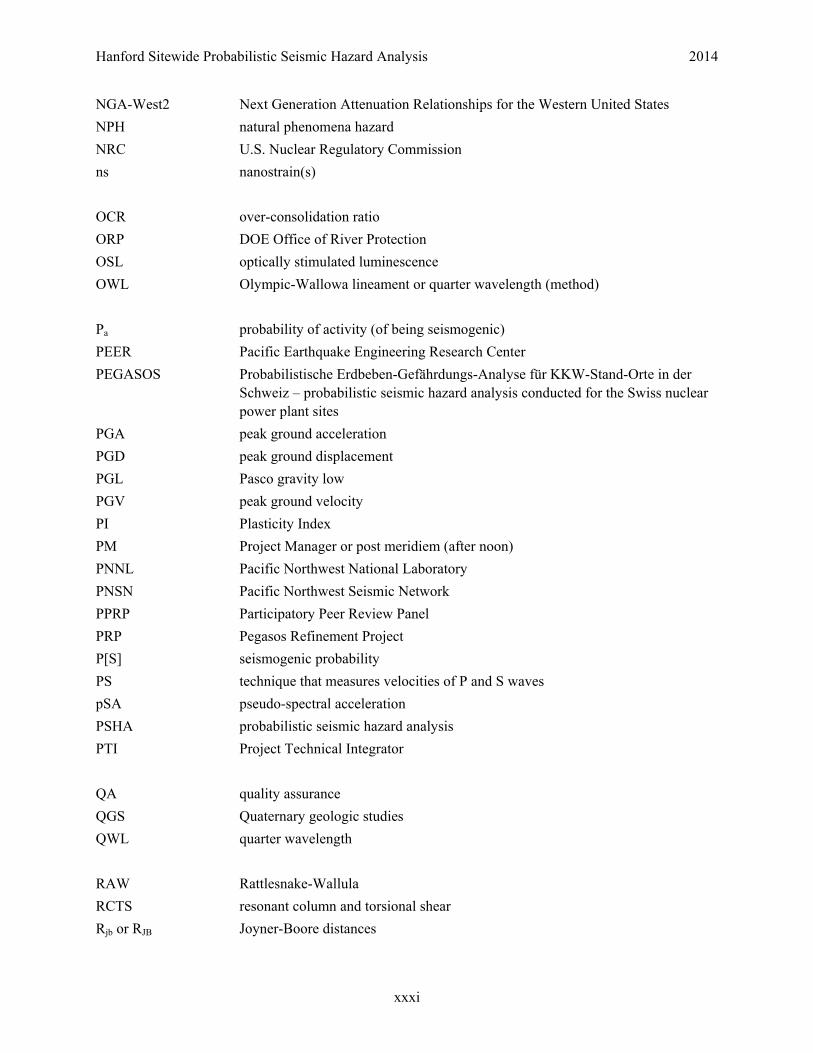
Abbreviations, Acronyms, and Symbols
ACR active crustal region
AD anno domini (in the year of the Lord)
AFE annual frequency of exceedance
AIC Akaike Information Criterion
AICc second-order AIC
AM ante meridiem (before noon)
AMEC E&I AMEC Environment and Infracture, Inc.
ANS American Nuclear Society
ANSI American National Standards Institute
ANSS (U.S.) Advanced National Seismic System
ARH Ahtanum-Rattlesnake Hills
ASBL Arlington-Shutler Buttes lineament
BC before Christ
BIC Bayesian Information Criterion
bgs below ground surface
BP before present
BPT Brownian Passage Time
cal. yr BP calendar years before present
CBR center, body, and range
CCU Cold Creek unit
CDF cumulative distribution function
CEUS central and eastern United States
CFR Code of Federal Regulations
CGS Columbia Generating Station (formerly WPN-2)
CI confidence interval
CLEW Cle Elum-Wallula lineament
cm centimeter(s)
CMS conditional mean spectra
CMT Centroid Moment Tensor
COV or CV coefficient of variation
CRB Columbia River Basalt
CRBG Columbia River Basalt Group
CSZ Cascadia subduction zone
CTZ coseismic transition zone
2014 Hanford Sitewide Probabilistic Seismic Hazard Analysis
xxviii
CURATE cumulative rate analysis
1-D one-dimensional
2-D two-dimensional
3-D three-dimensional
D90 the depth above which 90% of earthquakes occur
DD double difference
DE deaggregation earthquake
DEM digital elevation model
DFF directivity functional form
DNFSB Defense Nuclear Facilities Safety Board
DOE U.S. Department of Energy
DPP Direct Point Parameter
ECSZ eastern California shear zone
E[M] expected moment magnitude or expected value of moment magnitude
EN Energy Northwest
EPRI Electric Power Research Institute
EPRI-SOG Electric Power Research Institute–Seismicity Owners Group
EQID earthquake ID (identification)
ETS episodic tremor and slip
FAS Fourier amplitude spectra
FLTS Faults
FMC forearc mantel corner
ft foot(feet)
FW footwall
g gram(s)
g/cc gram(s) per cubic centimeter
G shear modulus
GIS geographic information system
GM ground motion or geometric mean
Gmax maximum shear modulus with very low deformation
GMC ground motion characterization (models)
GMPE ground motion prediction equation
GMRS ground motion response spectra
GMT Greenwich Mean Time
Hanford Sitewide Probabilistic Seismic Hazard Analysis 2014
xxix
GPS global positioning system
GR Grand Ronde
GSC Geological Survey of Canada
HAWA the seismograph at the Nike missile facility on Rattlesnake Mountain
HCMT Harvard Centroid Moment Tensor
HHH Horse Heaven Hills
HID hazard input document
HPSHA Hanford Probabilistic Seismic Hazard Analysis
HR Horn Rapids (fault)
H/V horizontal-to-vertical (ratio)
HW hanging-wall (factor)
Hz hertz
HZ-pga hertz-peak ground accleration
I0 maximum intensity or macroseismic intensity
IDC International Data Center
IF interface (earthquake)
InSAR interferometric synthetic aperture radar
IRIS Incorporated Research Institutions for Seismology
IRSL Infrared Stimulated Luminescence
IRVT Inverse Random Vibration Theory
IS intraslab (earthquake)
ISC International Seismological Centre
ISI Institute for Scientific Information
JBA Jack Benjamin & Associates
JDF Juan de Fuca
k kappa
ka thousand years ago
kHz kilohertz
km kilometer(s)
km2 square kilometer(s)
km3 cubic kilometer(s)
km/s kilometers per second
kyr thousand years
2014 Hanford Sitewide Probabilistic Seismic Hazard Analysis
xxx
LCI Lettis Consultants International, Inc.
LiDAR Light Detection and Ranging
m meter(s)
M magnitude
M moment magnitude
Ma millions of years ago (or before the present)
mb body-wave magnitude (short period)
mbLg body-wave magnitude determined from higher-mode (Lg) surface waves
MC coda-wave magnitude
Mchar characteristic magnitude
MD duration magnitude
MFD magnitude frequency distribution
MI magnitude from intensity
MI macroseismic intensity
MIS marine oxygen isotope stage (commonly referred to as oxygen marine isotope stage [OIS])
ML local magnitude
mm millimeter(s)
Mmax, Mmax maximum earthquake magnitude
Mmin lower bound magnitude
MMI modified Mercalli intensity
mm/yr millimeter(s) per year
MRE most recent event
m/s or m/sec meter(s) per second
MS surface-wave magnitude
msl mean sea level
MSZ surface-wave magnitude computed with vertical component
MW moment magnitude
Myr millions of years of duration
NA not applicable
NBR northern Basin and Range province
NED National Elevation Dataset
NEDB National Earthquake Database
NEHRP National Earthquake Hazards Reduction Program
NEIC National Earthquake Information Center
NGA next-generation attenuation
Hanford Sitewide Probabilistic Seismic Hazard Analysis 2014
xxxi
NGA-West2 Next Generation Attenuation Relationships for the Western United States
NPH natural phenomena hazard
NRC U.S. Nuclear Regulatory Commission
ns nanostrain(s)
OCR over-consolidation ratio
ORP DOE Office of River Protection
OSL optically stimulated luminescence
OWL Olympic-Wallowa lineament or quarter wavelength (method)
Pa probability of activity (of being seismogenic)
PEER Pacific Earthquake Engineering Research Center
PEGASOS Probabilistische Erdbeben-Gefährdungs-Analyse für KKW-Stand-Orte in der Schweiz – probabilistic seismic hazard analysis conducted for the Swiss nuclear power plant sites
PGA peak ground acceleration
PGD peak ground displacement
PGL Pasco gravity low
PGV peak ground velocity
PI Plasticity Index
PM Project Manager or post meridiem (after noon)
PNNL Pacific Northwest National Laboratory
PNSN Pacific Northwest Seismic Network
PPRP Participatory Peer Review Panel
PRP Pegasos Refinement Project
P[S] seismogenic probability
PS technique that measures velocities of P and S waves
pSA pseudo-spectral acceleration
PSHA probabilistic seismic hazard analysis
PTI Project Technical Integrator
QA quality assurance
QGS Quaternary geologic studies
QWL quarter wavelength
RAW Rattlesnake-Wallula
RCTS resonant column and torsional shear
Rjb or RJB Joyner-Boore distances
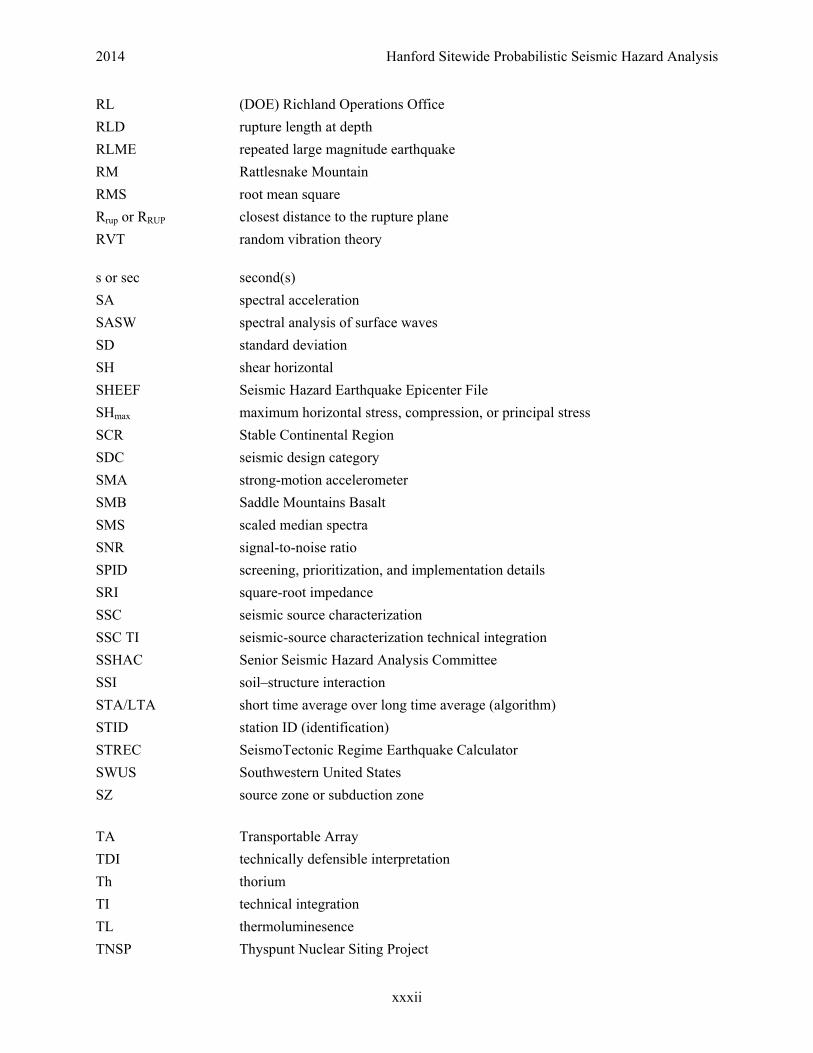
2014 Hanford Sitewide Probabilistic Seismic Hazard Analysis
xxxii
RL (DOE) Richland Operations Office
RLD rupture length at depth
RLME repeated large magnitude earthquake
RM Rattlesnake Mountain
RMS root mean square
Rrup or RRUP closest distance to the rupture plane
RVT random vibration theory
s or sec second(s)
SA spectral acceleration
SASW spectral analysis of surface waves
SD standard deviation
SH shear horizontal
SHEEF Seismic Hazard Earthquake Epicenter File
SHmax maximum horizontal stress, compression, or principal stress
SCR Stable Continental Region
SDC seismic design category
SMA strong-motion accelerometer
SMB Saddle Mountains Basalt
SMS scaled median spectra
SNR signal-to-noise ratio
SPID screening, prioritization, and implementation details
SRI square-root impedance
SSC seismic source characterization
SSC TI seismic-source characterization technical integration
SSHAC Senior Seismic Hazard Analysis Committee
SSI soil–structure interaction
STA/LTA short time average over long time average (algorithm)
STID station ID (identification)
STREC SeismoTectonic Regime Earthquake Calculator
SWUS Southwestern United States
SZ source zone or subduction zone
TA Transportable Array
TDI technically defensible interpretation
Th thorium
TI technical integration
TL thermoluminesence
TNSP Thyspunt Nuclear Siting Project
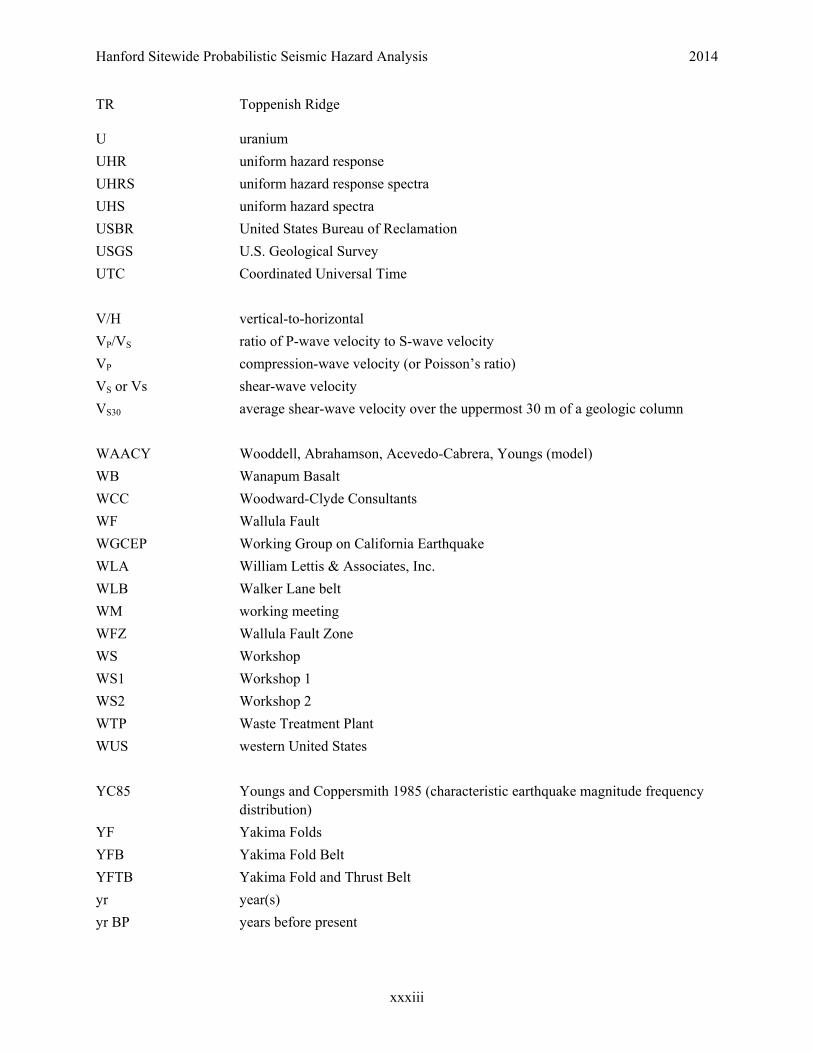
Hanford Sitewide Probabilistic Seismic Hazard Analysis 2014
xxxiii
TR Toppenish Ridge
U uranium
UHR uniform hazard response
UHRS uniform hazard response spectra
UHS uniform hazard spectra
USBR United States Bureau of Reclamation
USGS U.S. Geological Survey
UTC Coordinated Universal Time
V/H vertical-to-horizontal
VP/VS ratio of P-wave velocity to S-wave velocity
VP compression-wave velocity (or Poisson’s ratio)
VS or Vs shear-wave velocity
VS30 average shear-wave velocity over the uppermost 30 m of a geologic column
WAACY Wooddell, Abrahamson, Acevedo-Cabrera, Youngs (model)
WB Wanapum Basalt
WCC Woodward-Clyde Consultants
WF Wallula Fault
WGCEP Working Group on California Earthquake
WLA William Lettis & Associates, Inc.
WLB Walker Lane belt
WM working meeting
WFZ Wallula Fault Zone
WS Workshop
WS1 Workshop 1
WS2 Workshop 2
WTP Waste Treatment Plant
WUS western United States
YC85 Youngs and Coppersmith 1985 (characteristic earthquake magnitude frequency distribution)
YF Yakima Folds
YFB Yakima Fold Belt
YFTB Yakima Fold and Thrust Belt
yr year(s)
yr BP years before present

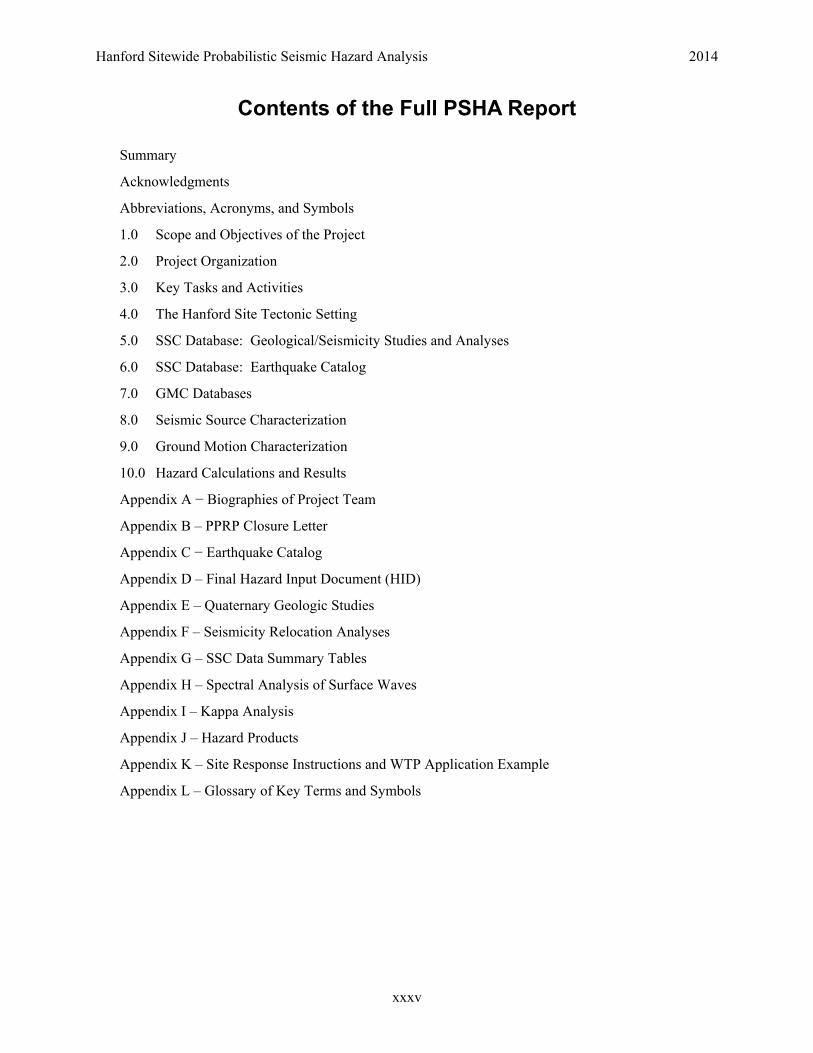
Hanford Sitewide Probabilistic Seismic Hazard Analysis 2014
xxxv
Contents of the Full PSHA Report
Summary
Acknowledgments
Abbreviations, Acronyms, and Symbols
1.0 Scope and Objectives of the Project
2.0 Project Organization
3.0 Key Tasks and Activities
4.0 The Hanford Site Tectonic Setting
5.0 SSC Database: Geological/Seismicity Studies and Analyses
6.0 SSC Database: Earthquake Catalog
7.0 GMC Databases
8.0 Seismic Source Characterization
9.0 Ground Motion Characterization
10.0 Hazard Calculations and Results
Appendix A − Biographies of Project Team
Appendix B – PPRP Closure Letter
Appendix C − Earthquake Catalog
Appendix D – Final Hazard Input Document (HID)
Appendix E – Quaternary Geologic Studies
Appendix F – Seismicity Relocation Analyses
Appendix G – SSC Data Summary Tables
Appendix H – Spectral Analysis of Surface Waves
Appendix I – Kappa Analysis
Appendix J – Hazard Products
Appendix K – Site Response Instructions and WTP Application Example
Appendix L – Glossary of Key Terms and Symbols