Embed Size (px)
Citation preview

Hawaii’s Imprisonment Policy
and the Performance of
Parolees Who Were Incarcerated
In-State and on the Mainland
Department of Sociology University of Hawaii at Manoa
&
Department of the Attorney General State of Hawaii
January 2011
Project funding from the U.S. Bureau of Justice Statistics’
State Justice Statistics Program for Statistical Analysis Centers
Award Number 2008-BJ-CX-K037
This report can be downloaded from the Crime Prevention & Justice Assistance Division web site:
hawaii.gov/ag/cpja
Hawaii’s Imprisonment Policy
and the Performance of Parolees
Who Were Incarcerated
In-State and on the Mainland
Principal Investigator:
David T. Johnson Professor of Sociology
University of Hawaii–Manoa
Consultant/Co-Author:
Janet T. Davidson Assistant Professor of Criminology & Criminal Justice
Chaminade University of Honolulu
Project Director/Editor:
Paul Perrone Chief of Research and Statistics
Hawaii Department of the Attorney General
January 2011

i
Table of Contents
Acknowledgements .................................................................................................................... ii
Executive Summary ................................................................................................................... 1
Introduction ................................................................................................................................. 4
Towards Evidence- and Value-Based Policymaking ............................................................. 9
Research Questions and Methods......................................................................................... 10
Who Are the Parolees? ........................................................................................................... 11
How Often Did Parolees Recidivate? .................................................................................... 23
Summary ................................................................................................................................... 32
Discussion..................................................................................................................... 33
Future Research ........................................................................................................... 36
References................................................................................................................................ 37
ii
Acknowledgments
The authors of this report have many people to thank for cooperating with this research. At the top of the list is Max Otani, Administrator of the Hawaii Paroling Authority, who was extremely generous with his time, knowledge, and insights. We also are grateful to the members of the HPA Parole Board—Chairperson Albert Tufono, Dane Oda, and Roy Reeber—who allowed us to observe parole hearings and patiently answered our ques-tions. Tommy Johnson, Deputy Director of Corrections in the Department of Public Safe-ty, kindly provided entree to several information sources, including Cheryl Rodrigues, who gave us electronic data, and Shari Kimoto, Heather Kimura, and Howard Komori, who provided access to inmates’ files and other assistance. Paul Perrone, Chief of Re-search and Statistics in the Crime Prevention and Justice Assistance Division of the De-partment of the Attorney General, shepherded this project from start to finish and facilitated our many requests for information, and Timothy Wong, Research Analyst, provided valuable data from the Level of Service Inventory-Revised (LSI-R). Linda Fong and David Matsuda at the University of Hawaii at Manoa helped administer the contract received from the Hawaii Department of the Attorney General to do research on “Com-parative Measurements of Public In-State versus Private Out-of-State Imprisonment for Hawaii’s Inmate Population.” And Kat Brady, Coordinator of the Community Alliance on Prisons, and Marilyn Brown, Assistant Professor of Sociology at the University of Hawaii at Hilo, read and reacted to a draft of this report in uncommonly generous ways. To them and to everyone else who has worked to further evidence- and value-based poli-cymaking in the State of Hawaii, mahalo.
1
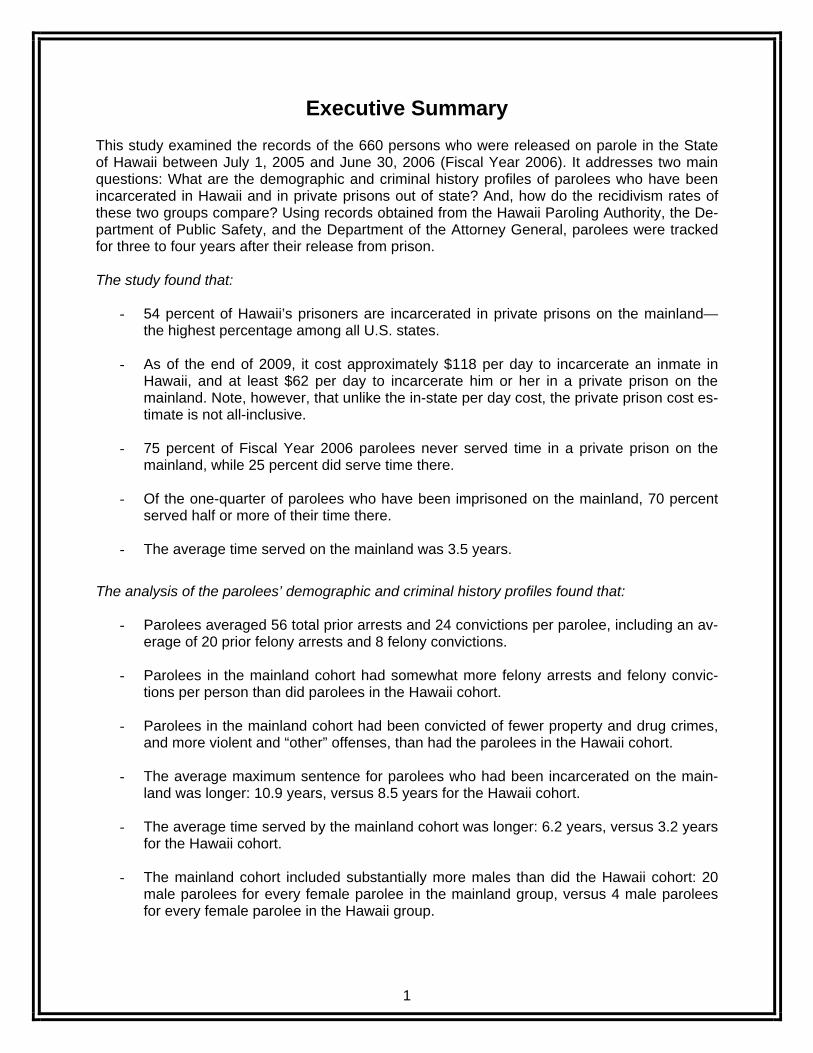
Executive Summary This study examined the records of the 660 persons who were released on parole in the State of Hawaii between July 1, 2005 and June 30, 2006 (Fiscal Year 2006). It addresses two main questions: What are the demographic and criminal history profiles of parolees who have been incarcerated in Hawaii and in private prisons out of state? And, how do the recidivism rates of these two groups compare? Using records obtained from the Hawaii Paroling Authority, the De-partment of Public Safety, and the Department of the Attorney General, parolees were tracked for three to four years after their release from prison. The study found that:
- 54 percent of Hawaii’s prisoners are incarcerated in private prisons on the mainland—the highest percentage among all U.S. states.
- As of the end of 2009, it cost approximately $118 per day to incarcerate an inmate in Hawaii, and at least $62 per day to incarcerate him or her in a private prison on the mainland. Note, however, that unlike the in-state per day cost, the private prison cost es-timate is not all-inclusive.
- 75 percent of Fiscal Year 2006 parolees never served time in a private prison on the mainland, while 25 percent did serve time there.
- Of the one-quarter of parolees who have been imprisoned on the mainland, 70 percent served half or more of their time there.
- The average time served on the mainland was 3.5 years.
The analysis of the parolees’ demographic and criminal history profiles found that:
- Parolees averaged 56 total prior arrests and 24 convictions per parolee, including an av-erage of 20 prior felony arrests and 8 felony convictions.
- Parolees in the mainland cohort had somewhat more felony arrests and felony convic-
tions per person than did parolees in the Hawaii cohort.
- Parolees in the mainland cohort had been convicted of fewer property and drug crimes, and more violent and “other” offenses, than had the parolees in the Hawaii cohort.
- The average maximum sentence for parolees who had been incarcerated on the main-land was longer: 10.9 years, versus 8.5 years for the Hawaii cohort.
- The average time served by the mainland cohort was longer: 6.2 years, versus 3.2 years
for the Hawaii cohort.
- The mainland cohort included substantially more males than did the Hawaii cohort: 20 male parolees for every female parolee in the mainland group, versus 4 male parolees for every female parolee in the Hawaii group.
2
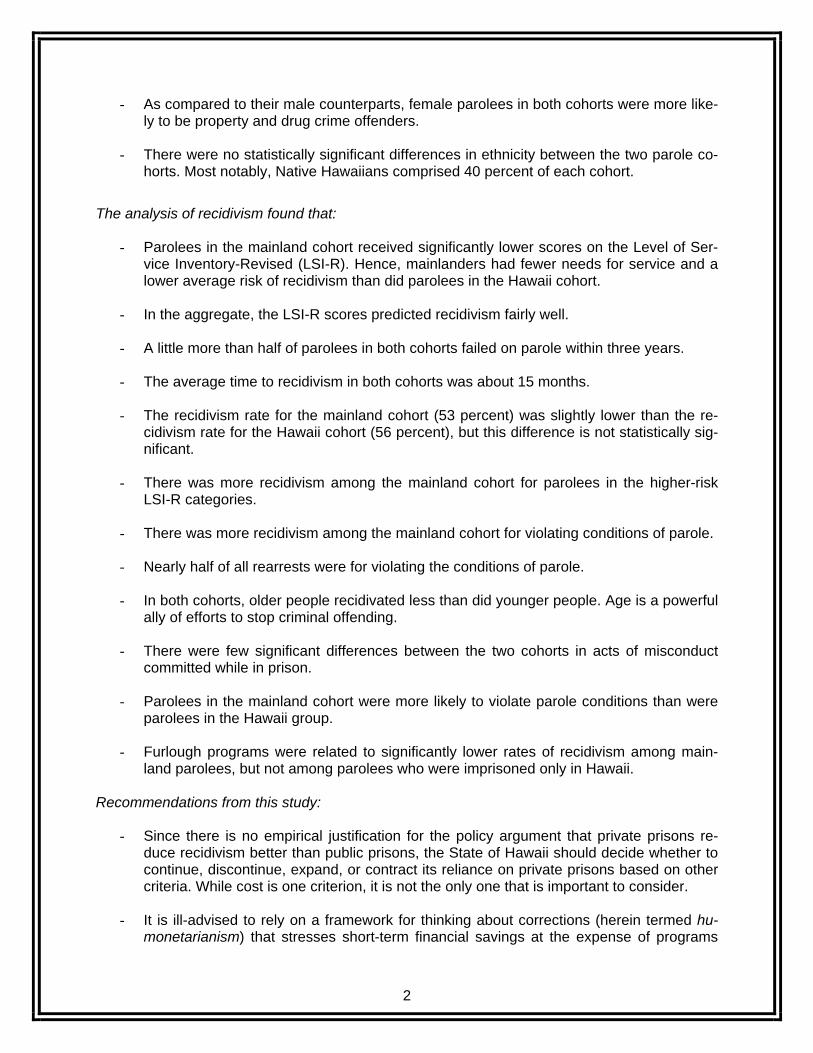
- As compared to their male counterparts, female parolees in both cohorts were more like-ly to be property and drug crime offenders.
- There were no statistically significant differences in ethnicity between the two parole co-
horts. Most notably, Native Hawaiians comprised 40 percent of each cohort.
The analysis of recidivism found that:
- Parolees in the mainland cohort received significantly lower scores on the Level of Ser-vice Inventory-Revised (LSI-R). Hence, mainlanders had fewer needs for service and a lower average risk of recidivism than did parolees in the Hawaii cohort.
- In the aggregate, the LSI-R scores predicted recidivism fairly well.
- A little more than half of parolees in both cohorts failed on parole within three years.
- The average time to recidivism in both cohorts was about 15 months.
- The recidivism rate for the mainland cohort (53 percent) was slightly lower than the re-cidivism rate for the Hawaii cohort (56 percent), but this difference is not statistically sig-nificant.
- There was more recidivism among the mainland cohort for parolees in the higher-risk LSI-R categories.
- There was more recidivism among the mainland cohort for violating conditions of parole.
- Nearly half of all rearrests were for violating the conditions of parole.
- In both cohorts, older people recidivated less than did younger people. Age is a powerful ally of efforts to stop criminal offending.
- There were few significant differences between the two cohorts in acts of misconduct committed while in prison.
- Parolees in the mainland cohort were more likely to violate parole conditions than were parolees in the Hawaii group.
- Furlough programs were related to significantly lower rates of recidivism among main-land parolees, but not among parolees who were imprisoned only in Hawaii.
Recommendations from this study:
- Since there is no empirical justification for the policy argument that private prisons re-duce recidivism better than public prisons, the State of Hawaii should decide whether to continue, discontinue, expand, or contract its reliance on private prisons based on other criteria. While cost is one criterion, it is not the only one that is important to consider.
- It is ill-advised to rely on a framework for thinking about corrections (herein termed hu-
monetarianism) that stresses short-term financial savings at the expense of programs
3
aimed at improving the prospects for offenders’ rehabilitation and the satisfaction of their basic needs and rights. Long-term savings are often found in forward-thinking policies and programs.
- The State of Hawaii needs to calculate more inclusive and accurate estimates of the cost
of incarceration in-state and in private prisons on the mainland.
- Much more research needs to be done in order to adequately describe the contours and consequences of Hawaii’s correctional policy. One high priority is a study that explores who gets sent to prison (and where). The present study examined only persons who were released on parole.
- The State of Hawaii should conduct more research about its correctional policies and outcomes, especially given a policy world that is increasingly evidence-based.
- The Department of Public Safety and the Hawaii Paroling Authority need an integrated
records management system. At present, inmates’ records are often incomplete, scat-tered, and difficult to locate.
4
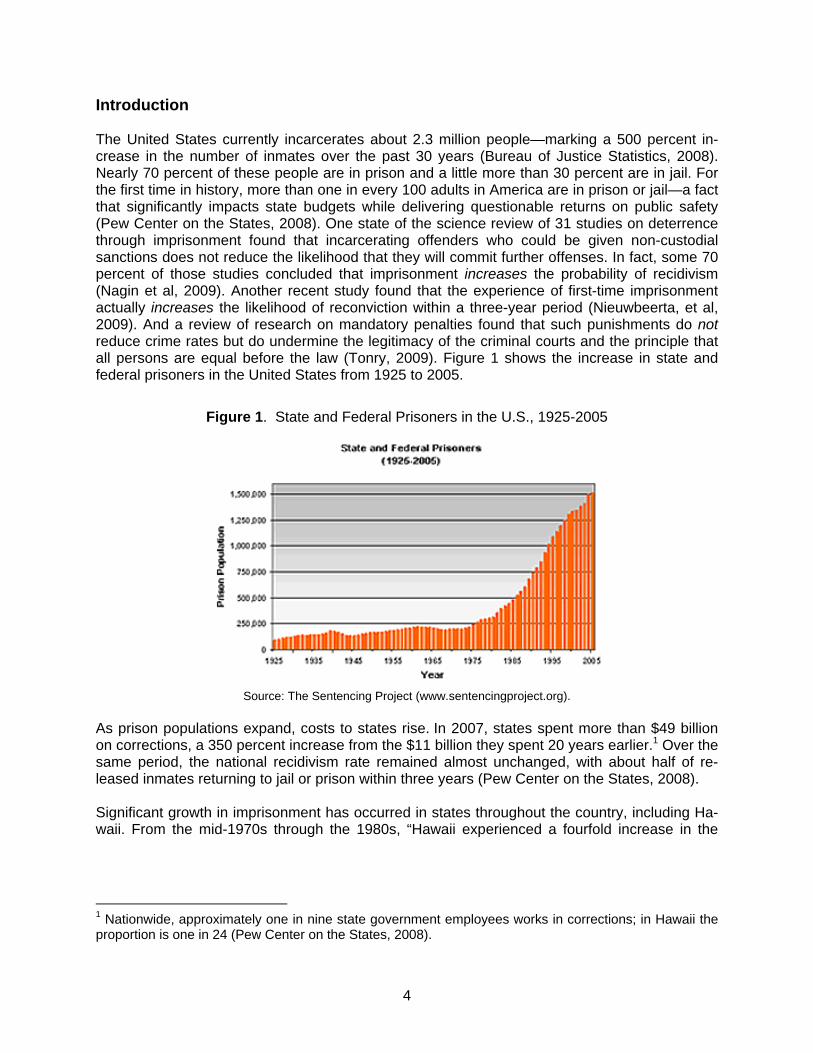
Introduction The United States currently incarcerates about 2.3 million people—marking a 500 percent in-crease in the number of inmates over the past 30 years (Bureau of Justice Statistics, 2008). Nearly 70 percent of these people are in prison and a little more than 30 percent are in jail. For the first time in history, more than one in every 100 adults in America are in prison or jail—a fact that significantly impacts state budgets while delivering questionable returns on public safety (Pew Center on the States, 2008). One state of the science review of 31 studies on deterrence through imprisonment found that incarcerating offenders who could be given non-custodial sanctions does not reduce the likelihood that they will commit further offenses. In fact, some 70 percent of those studies concluded that imprisonment increases the probability of recidivism (Nagin et al, 2009). Another recent study found that the experience of first-time imprisonment actually increases the likelihood of reconviction within a three-year period (Nieuwbeerta, et al, 2009). And a review of research on mandatory penalties found that such punishments do not reduce crime rates but do undermine the legitimacy of the criminal courts and the principle that all persons are equal before the law (Tonry, 2009). Figure 1 shows the increase in state and federal prisoners in the United States from 1925 to 2005.
Figure 1. State and Federal Prisoners in the U.S., 1925-2005
Source: The Sentencing Project (www.sentencingproject.org). As prison populations expand, costs to states rise. In 2007, states spent more than $49 billion on corrections, a 350 percent increase from the $11 billion they spent 20 years earlier.1 Over the same period, the national recidivism rate remained almost unchanged, with about half of re-leased inmates returning to jail or prison within three years (Pew Center on the States, 2008). Significant growth in imprisonment has occurred in states throughout the country, including Ha-waii. From the mid-1970s through the 1980s, “Hawaii experienced a fourfold increase in the
1 Nationwide, approximately one in nine state government employees works in corrections; in Hawaii the proportion is one in 24 (Pew Center on the States, 2008).
5
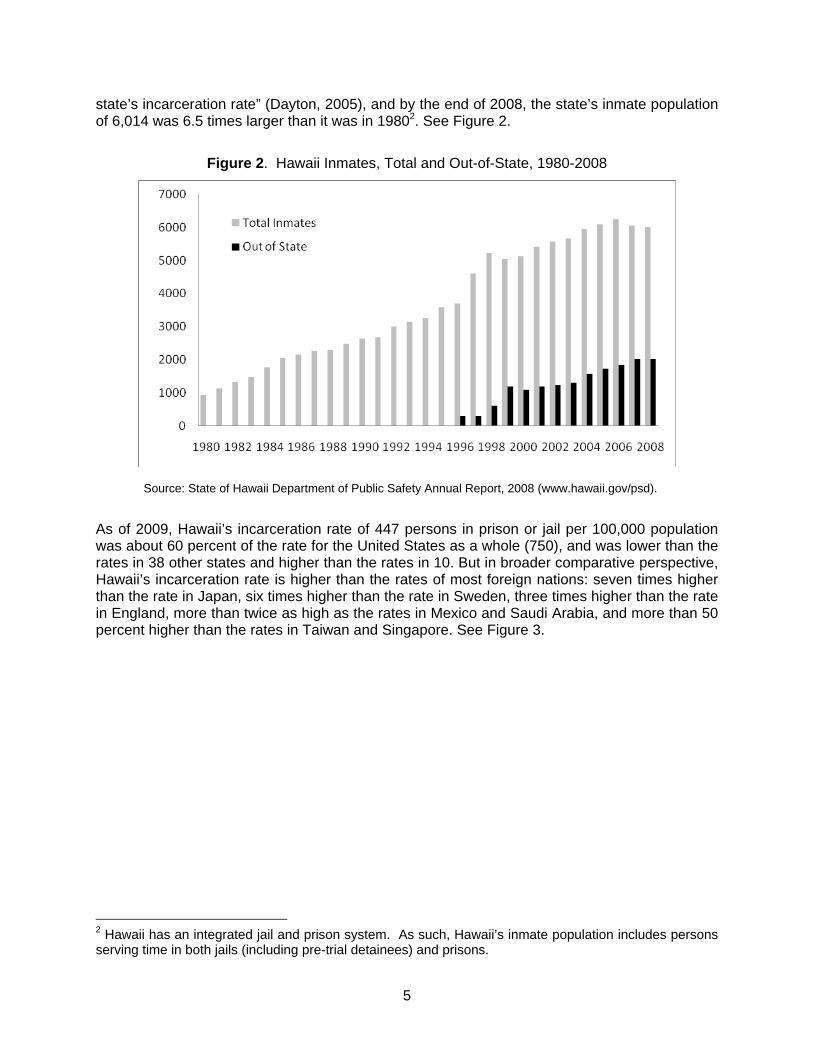
state’s incarceration rate” (Dayton, 2005), and by the end of 2008, the state’s inmate population of 6,014 was 6.5 times larger than it was in 19802. See Figure 2.
Figure 2. Hawaii Inmates, Total and Out-of-State, 1980-2008
Source: State of Hawaii Department of Public Safety Annual Report, 2008 (www.hawaii.gov/psd).
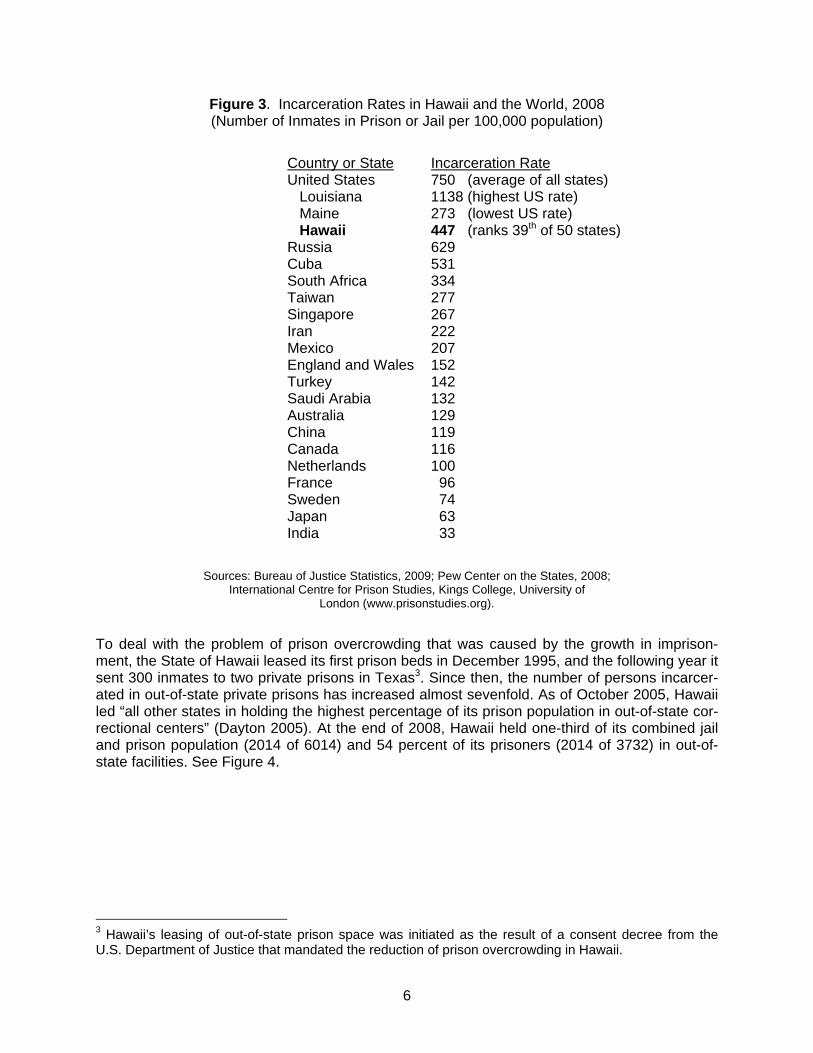
As of 2009, Hawaii’s incarceration rate of 447 persons in prison or jail per 100,000 population was about 60 percent of the rate for the United States as a whole (750), and was lower than the rates in 38 other states and higher than the rates in 10. But in broader comparative perspective, Hawaii’s incarceration rate is higher than the rates of most foreign nations: seven times higher than the rate in Japan, six times higher than the rate in Sweden, three times higher than the rate in England, more than twice as high as the rates in Mexico and Saudi Arabia, and more than 50 percent higher than the rates in Taiwan and Singapore. See Figure 3.
2 Hawaii has an integrated jail and prison system. As such, Hawaii’s inmate population includes persons serving time in both jails (including pre-trial detainees) and prisons.
6
Figure 3. Incarceration Rates in Hawaii and the World, 2008 (Number of Inmates in Prison or Jail per 100,000 population)
Country or State Incarceration Rate United States 750 (average of all states) Louisiana 1138 (highest US rate) Maine 273 (lowest US rate) Hawaii 447 (ranks 39th of 50 states) Russia 629 Cuba 531 South Africa 334 Taiwan 277 Singapore 267 Iran 222 Mexico 207 England and Wales 152 Turkey 142 Saudi Arabia 132 Australia 129 China 119 Canada 116 Netherlands 100 France 96 Sweden 74 Japan 63 India 33
Sources: Bureau of Justice Statistics, 2009; Pew Center on the States, 2008; International Centre for Prison Studies, Kings College, University of
London (www.prisonstudies.org).
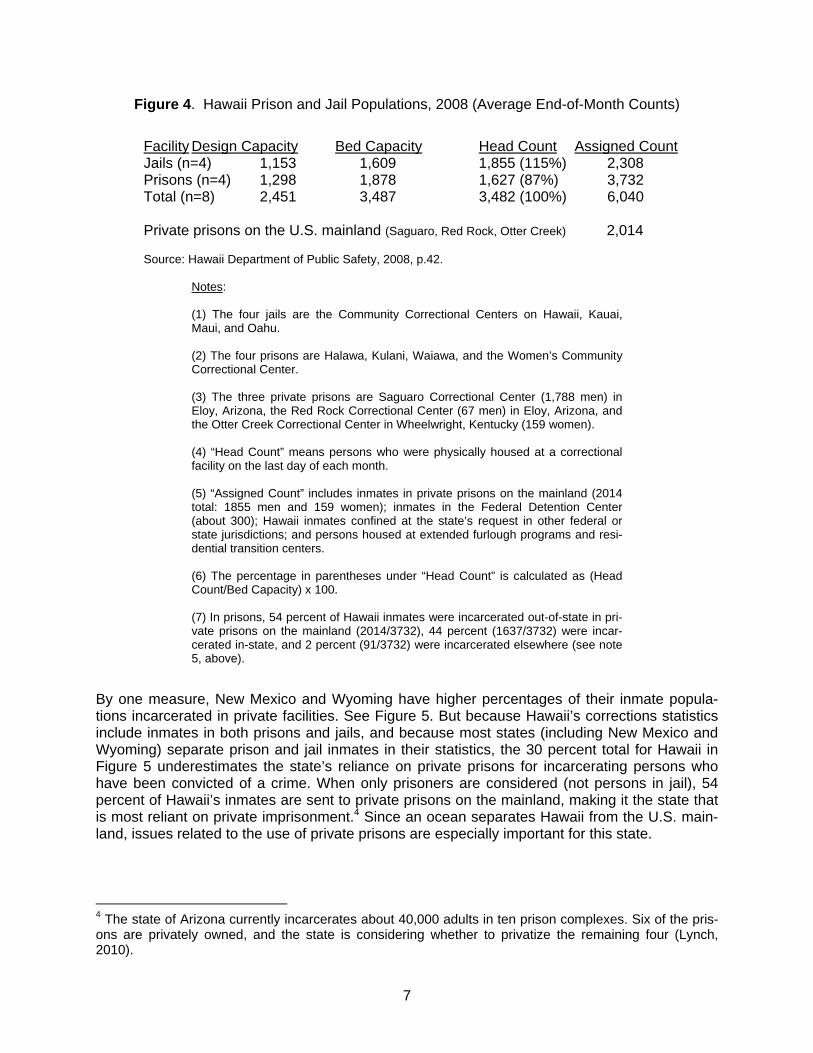
To deal with the problem of prison overcrowding that was caused by the growth in imprison-ment, the State of Hawaii leased its first prison beds in December 1995, and the following year it sent 300 inmates to two private prisons in Texas3. Since then, the number of persons incarcer-ated in out-of-state private prisons has increased almost sevenfold. As of October 2005, Hawaii led “all other states in holding the highest percentage of its prison population in out-of-state cor-rectional centers” (Dayton 2005). At the end of 2008, Hawaii held one-third of its combined jail and prison population (2014 of 6014) and 54 percent of its prisoners (2014 of 3732) in out-of-state facilities. See Figure 4.
3 Hawaii’s leasing of out-of-state prison space was initiated as the result of a consent decree from the U.S. Department of Justice that mandated the reduction of prison overcrowding in Hawaii.
7
Figure 4. Hawaii Prison and Jail Populations, 2008 (Average End-of-Month Counts)
Facility Design Capacity Bed Capacity Head Count Assigned Count Jails (n=4) 1,153 1,609 1,855 (115%) 2,308 Prisons (n=4) 1,298 1,878 1,627 (87%) 3,732 Total (n=8) 2,451 3,487 3,482 (100%) 6,040
Private prisons on the U.S. mainland (Saguaro, Red Rock, Otter Creek) 2,014
Source: Hawaii Department of Public Safety, 2008, p.42.
Notes: (1) The four jails are the Community Correctional Centers on Hawaii, Kauai, Maui, and Oahu. (2) The four prisons are Halawa, Kulani, Waiawa, and the Women’s Community Correctional Center. (3) The three private prisons are Saguaro Correctional Center (1,788 men) in Eloy, Arizona, the Red Rock Correctional Center (67 men) in Eloy, Arizona, and the Otter Creek Correctional Center in Wheelwright, Kentucky (159 women). (4) “Head Count” means persons who were physically housed at a correctional facility on the last day of each month. (5) “Assigned Count” includes inmates in private prisons on the mainland (2014 total: 1855 men and 159 women); inmates in the Federal Detention Center (about 300); Hawaii inmates confined at the state’s request in other federal or state jurisdictions; and persons housed at extended furlough programs and resi-dential transition centers. (6) The percentage in parentheses under “Head Count” is calculated as (Head Count/Bed Capacity) x 100. (7) In prisons, 54 percent of Hawaii inmates were incarcerated out-of-state in pri-vate prisons on the mainland (2014/3732), 44 percent (1637/3732) were incar-cerated in-state, and 2 percent (91/3732) were incarcerated elsewhere (see note 5, above).
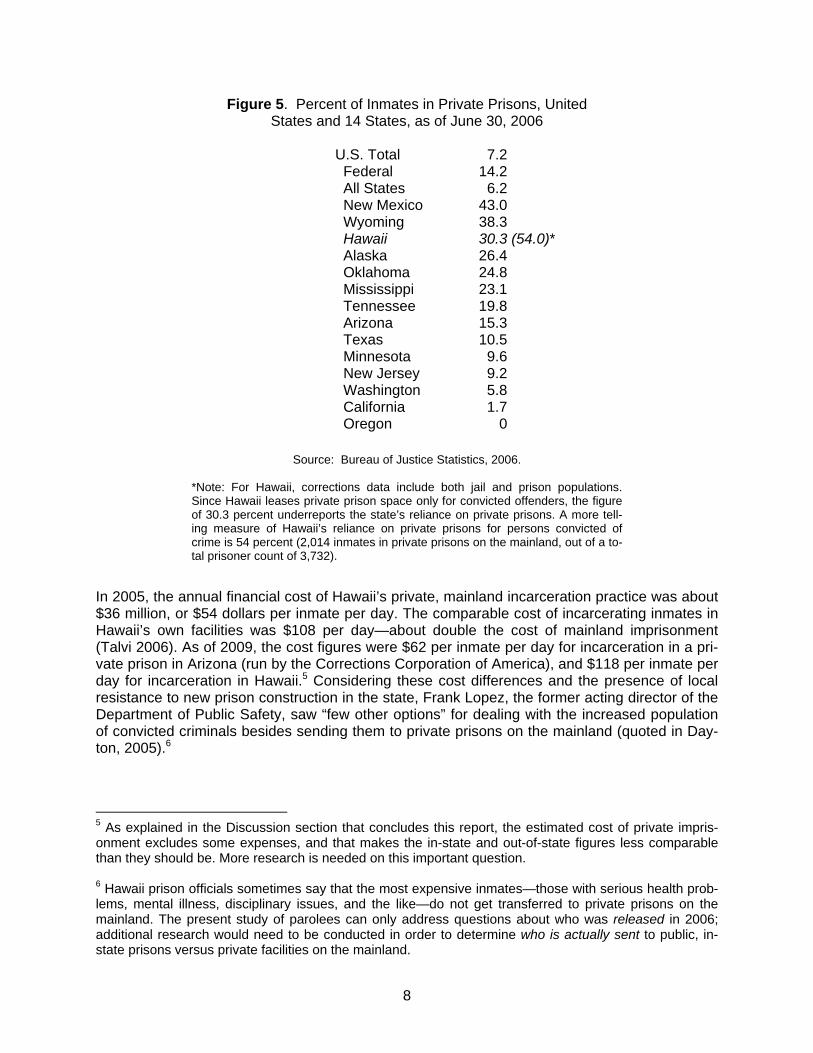
By one measure, New Mexico and Wyoming have higher percentages of their inmate popula-tions incarcerated in private facilities. See Figure 5. But because Hawaii’s corrections statistics include inmates in both prisons and jails, and because most states (including New Mexico and Wyoming) separate prison and jail inmates in their statistics, the 30 percent total for Hawaii in Figure 5 underestimates the state’s reliance on private prisons for incarcerating persons who have been convicted of a crime. When only prisoners are considered (not persons in jail), 54 percent of Hawaii’s inmates are sent to private prisons on the mainland, making it the state that is most reliant on private imprisonment.4 Since an ocean separates Hawaii from the U.S. main-land, issues related to the use of private prisons are especially important for this state.
4 The state of Arizona currently incarcerates about 40,000 adults in ten prison complexes. Six of the pris-ons are privately owned, and the state is considering whether to privatize the remaining four (Lynch, 2010).
8
Figure 5. Percent of Inmates in Private Prisons, United States and 14 States, as of June 30, 2006
U.S. Total 7.2 Federal 14.2 All States 6.2 New Mexico 43.0 Wyoming 38.3 Hawaii 30.3 (54.0)* Alaska 26.4 Oklahoma 24.8 Mississippi 23.1 Tennessee 19.8 Arizona 15.3 Texas 10.5 Minnesota 9.6 New Jersey 9.2 Washington 5.8 California 1.7 Oregon 0
Source: Bureau of Justice Statistics, 2006.
*Note: For Hawaii, corrections data include both jail and prison populations. Since Hawaii leases private prison space only for convicted offenders, the figure of 30.3 percent underreports the state’s reliance on private prisons. A more tell-ing measure of Hawaii’s reliance on private prisons for persons convicted of crime is 54 percent (2,014 inmates in private prisons on the mainland, out of a to-tal prisoner count of 3,732).
In 2005, the annual financial cost of Hawaii’s private, mainland incarceration practice was about $36 million, or $54 dollars per inmate per day. The comparable cost of incarcerating inmates in Hawaii’s own facilities was $108 per day—about double the cost of mainland imprisonment (Talvi 2006). As of 2009, the cost figures were $62 per inmate per day for incarceration in a pri-vate prison in Arizona (run by the Corrections Corporation of America), and $118 per inmate per day for incarceration in Hawaii.5 Considering these cost differences and the presence of local resistance to new prison construction in the state, Frank Lopez, the former acting director of the Department of Public Safety, saw “few other options” for dealing with the increased population of convicted criminals besides sending them to private prisons on the mainland (quoted in Day-ton, 2005).6
5 As explained in the Discussion section that concludes this report, the estimated cost of private impris-onment excludes some expenses, and that makes the in-state and out-of-state figures less comparable than they should be. More research is needed on this important question. 6 Hawaii prison officials sometimes say that the most expensive inmates—those with serious health prob-lems, mental illness, disciplinary issues, and the like—do not get transferred to private prisons on the mainland. The present study of parolees can only address questions about who was released in 2006; additional research would need to be conducted in order to determine who is actually sent to public, in-state prisons versus private facilities on the mainland.
9
On the other hand, some observers contend that the costs of private imprisonment are more than merely financial, because relying on mainland prisons severs an inmate’s family ties, un-dermines rehabilitation, and decreases the odds of successful employment after release. In ad-dition, some observers (such as Ted Sakai, who ran the state’s prison system from 1998 to 2002) believe the financial savings may be illusory because keeping prison enterprises and jobs in state would have a “multiplier effect” in the local economy (quoted in Dayton, 2005; see also Lengyel and Brown, 2009). More broadly, studies of Hawaii’s imprisonment policy have found that the social cost of incarcerating some offenders—in state or out—“greatly exceeds the cor-responding social benefit” (Lengyel and Brown, 2009). This point is often overlooked in policy discussions because most of the costs of incarceration are “debits against future accounts and social welfare that are not budgeted” for in the present (Lengyel and Brown, 2009). Hawaii needs more studies that assess the economics of the State’s current corrections policy. At the political level, too, some state leaders have expressed concern about the non-financial costs of private imprisonment. One poll, conducted before the start of the state Legislature’s 2003 session, found that a majority of state lawmakers oppose the mainland imprisonment prac-tice. And in the local media, Hawaii’s largest newspaper published a three-day series called “Sent Away,” about the practice of incarcerating inmates on the mainland in order to save mon-ey and relieve overcrowding (Honolulu Advertiser, October 2-3-4, 2005). On the first day of that series, the lead editorial was titled “Prison System Failure Leaves Lasting Scars,” and the newspaper took a strong stand against Hawaii’s reliance on private prisons:
“The incarceration of inmates on the Mainland, at first a stopgap measure to deal with crowded prisons, has become a disgracefully dominant feature of the state’s correctional policy. Prison conditions don’t rise very high on the scale of voter concerns, and so policymakers have not felt pressed to find long-term solutions. Elected officials have never confronted the true social costs of crowding in Ha-waii prisons, the effects on families of constant transfers to Mainland prisons and the inadequate preparation for their return. It’s time to face up to those costs, and find some sensible solutions.”
Although criticisms such as these are common, there is reason to wonder whether they are sound (Talvi 2006; Brown 2005; Gellatly and Brady 2005; Johnson and Chesney-Lind 1999). For one thing, some observers believe rehabilitative programming is better and more available in private prisons on the mainland than in in-state facilities. For another, some inmates seem to prefer imprisonment on the mainland—though it is presently unknown how many hold that view. Most fundamentally, so little is known about how incarceration in Hawaii compares with incar-ceration in private prisons on the mainland that many concerns about this policy rest, at best, on anecdotes and ideology, not on the sort of systematic evidence that should inform public policy. Towards Evidence- and Value-Based Policymaking In order to evaluate Hawaii’s imprisonment policy, one first needs to understand its contours and consequences. Such knowledge is sorely deficient. The result is that policymakers, pundits, and the public frequently make assumptions and assertions about Hawaii’s imprisonment policy that lack a solid foundation. The shortage of facts about Hawaii’s imprisonment policy is problematic for at least two rea-sons: because many convicted felons must be incarcerated somewhere (without overcrowding), and because the performance of public prisons in the United States has often been abysmal
10
(see Austin 1998; Camp and Gaes 2002; Camp, Gaes, and Saylor 2002; Chen and Shapiro 2004; Farabee 2005; Gaes et al 2004; Hallinan 2001; Harding 1997; Harding 2001; Logan 1993; Page 2004; Peterselia 2003; Schlosser 1998; Sherman et al 1998; Shichor and Gilbert 2001; Thomas 2005). At present, the processes and outcomes associated with Hawaii’s imprisonment policy have not been rigorously evaluated.7 Until more of the requisite knowledge is acquired, it might be wise to consider the counsel of Malcolm M. Feeley, a Professor of Law at the Univer-sity of California at Berkeley’s Boalt Hall School of Law:
“One wonders why there is not a somewhat more charitable stance or at least a wait-and-see attitude toward recent privatization experiments…Conditions in ex-isting [public institutions of] criminal justice are so bad, the contemporary [privati-zation] experiment so new, the privatization efforts to date so puny, and the assessments so tentative, that the impulsive stance against privatization seems unwarranted and almost unscholarly…Given the embarrassing record of tradi-tional public criminal justice institutions, one might reasonably welcome some experimentation of just about any sort” (Feeley 2002b: 397).
Hawaii’s private prison policy is more than a decade old, and it seems likely to continue for some time to come unless a conscious change is made. The time is therefore ripe to undertake the see part of the “wait-and-see attitude” recommended by Professor Feeley – and to do the seeing in a reasonably systematic way.8 Through a comparative analysis of the 660 inmates who were incarcerated in state prisons or in private prisons on the Mainland and who were re-leased on parole in Fiscal Year 2006 (July 1, 2005 to June 30, 2006), this study aims to sketch some of the basic contours of the state’s incarceration policy. This study is far from exhaustive or definitive—much more research is needed—but it does describe a few important patterns in addition to identifying some questions for future research. Research Questions and Methods One observer has said that “for $40 million a year, it seems like we should know a lot more about how the Mainland compares with Hawaii incarceration in every area” (former Honolulu Advertiser reporter Kevin Dayton, email to the authors, May 8, 2006). Indeed, the answers to many fundamental questions about Hawaii’s imprisonment policy remain unknown. This study aims to answer two basic questions. First, what are the demographic and crime history profiles of parolees who have been incarcerated in Hawaii and out-of-state? Second, how do the recidi-vism rates of these two groups compare? To answer these questions, data were examined from several sources, including the Depart-ment of Public Safety, the Department of the Attorney General, and the Hawaii Paroling Author-ity. The core of this report is an analysis of data for the 660 inmates who were released on
7 This lack of knowledge is one of the main reasons why we support efforts in the state House and Senate to pass legislation that would authorize and fund an audit of the Department of Public Safety’s contract with the Corrections Corporation of America. 8 A recent study of private prisons by researchers in the Federal Bureau of Prisons found that private prisons experience significant problems in three areas: staff turnover, escapes, and drug use. The policy implication is that “public sector agencies contracting for private prisons need to develop incentives or other means to ensure that private sector operators retain experienced custody staff” (Camp and Gaes, 2002, p.427).
11
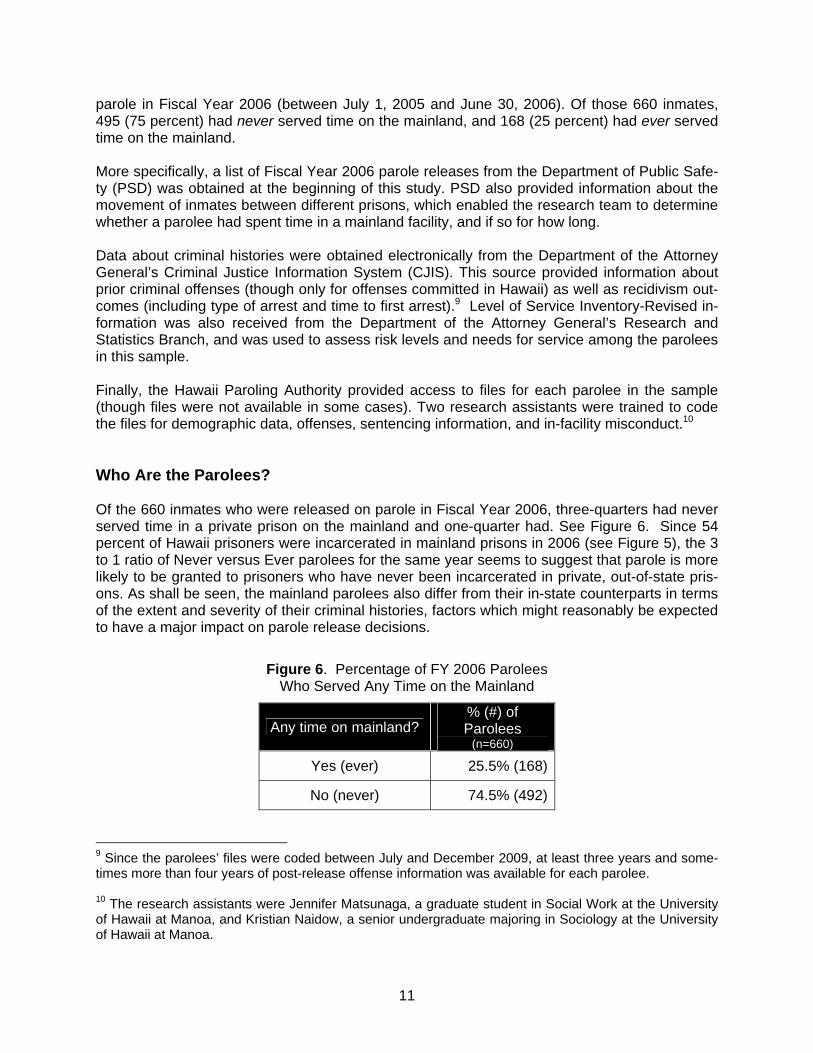
parole in Fiscal Year 2006 (between July 1, 2005 and June 30, 2006). Of those 660 inmates, 495 (75 percent) had never served time on the mainland, and 168 (25 percent) had ever served time on the mainland. More specifically, a list of Fiscal Year 2006 parole releases from the Department of Public Safe-ty (PSD) was obtained at the beginning of this study. PSD also provided information about the movement of inmates between different prisons, which enabled the research team to determine whether a parolee had spent time in a mainland facility, and if so for how long. Data about criminal histories were obtained electronically from the Department of the Attorney General’s Criminal Justice Information System (CJIS). This source provided information about prior criminal offenses (though only for offenses committed in Hawaii) as well as recidivism out-comes (including type of arrest and time to first arrest).9 Level of Service Inventory-Revised in-formation was also received from the Department of the Attorney General’s Research and Statistics Branch, and was used to assess risk levels and needs for service among the parolees in this sample. Finally, the Hawaii Paroling Authority provided access to files for each parolee in the sample (though files were not available in some cases). Two research assistants were trained to code the files for demographic data, offenses, sentencing information, and in-facility misconduct.10 Who Are the Parolees? Of the 660 inmates who were released on parole in Fiscal Year 2006, three-quarters had never served time in a private prison on the mainland and one-quarter had. See Figure 6. Since 54 percent of Hawaii prisoners were incarcerated in mainland prisons in 2006 (see Figure 5), the 3 to 1 ratio of Never versus Ever parolees for the same year seems to suggest that parole is more likely to be granted to prisoners who have never been incarcerated in private, out-of-state pris-ons. As shall be seen, the mainland parolees also differ from their in-state counterparts in terms of the extent and severity of their criminal histories, factors which might reasonably be expected to have a major impact on parole release decisions.
Figure 6. Percentage of FY 2006 Parolees Who Served Any Time on the Mainland
Any time on mainland? % (#) of Parolees
(n=660)
Yes (ever) 25.5% (168)
No (never) 74.5% (492) 9 Since the parolees’ files were coded between July and December 2009, at least three years and some-times more than four years of post-release offense information was available for each parolee. 10 The research assistants were Jennifer Matsunaga, a graduate student in Social Work at the University of Hawaii at Manoa, and Kristian Naidow, a senior undergraduate majoring in Sociology at the University of Hawaii at Manoa.
12
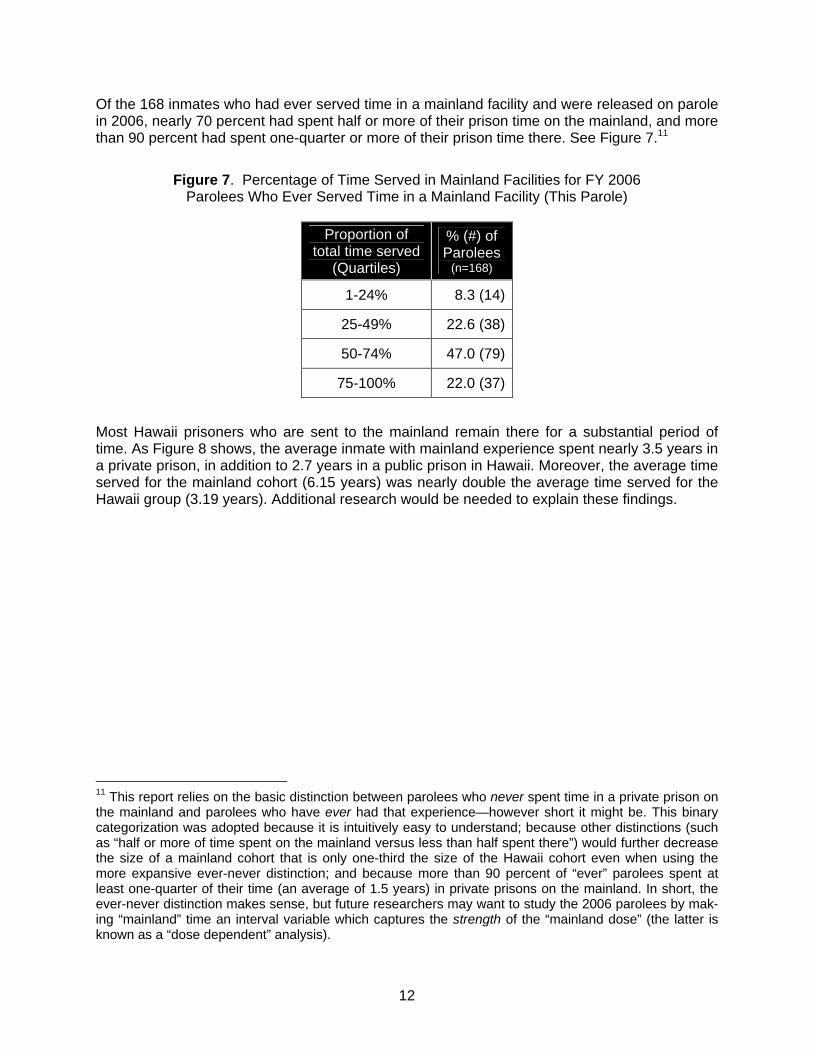
Of the 168 inmates who had ever served time in a mainland facility and were released on parole in 2006, nearly 70 percent had spent half or more of their prison time on the mainland, and more than 90 percent had spent one-quarter or more of their prison time there. See Figure 7.11
Figure 7. Percentage of Time Served in Mainland Facilities for FY 2006 Parolees Who Ever Served Time in a Mainland Facility (This Parole)
Proportion of
total time served (Quartiles)
% (#) of Parolees
(n=168)
1-24% 8.3 (14)
25-49% 22.6 (38)
50-74% 47.0 (79)
75-100% 22.0 (37)
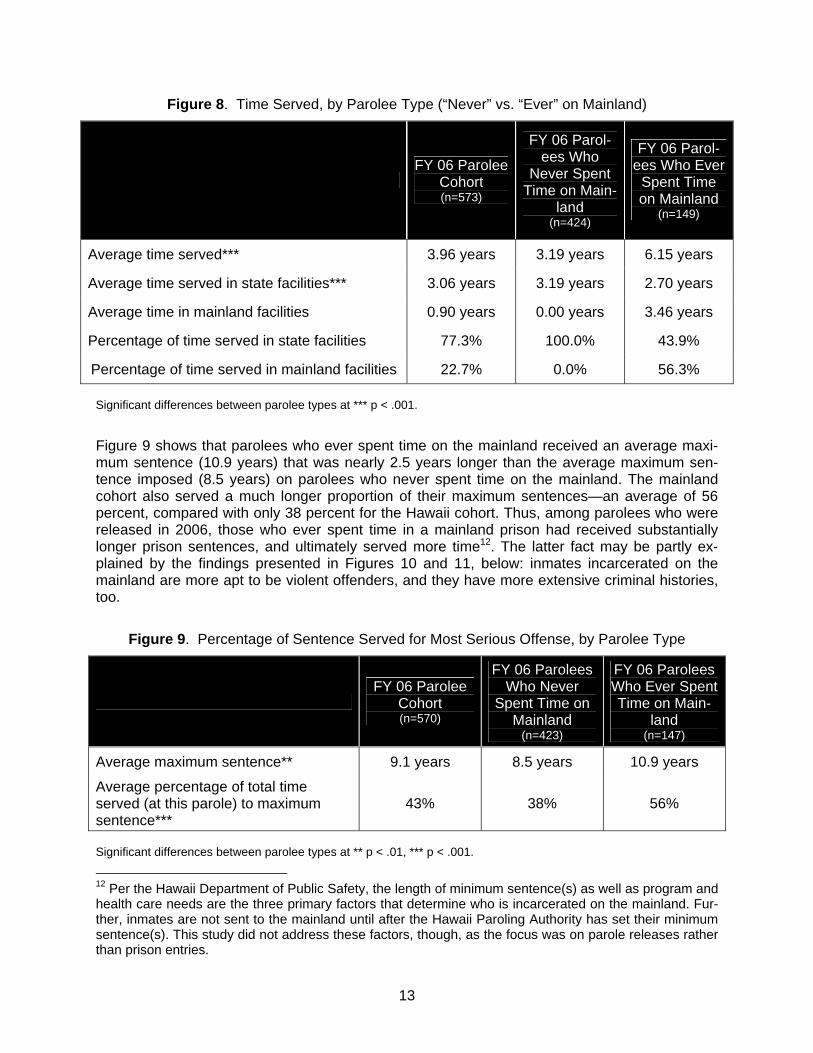
Most Hawaii prisoners who are sent to the mainland remain there for a substantial period of time. As Figure 8 shows, the average inmate with mainland experience spent nearly 3.5 years in a private prison, in addition to 2.7 years in a public prison in Hawaii. Moreover, the average time served for the mainland cohort (6.15 years) was nearly double the average time served for the Hawaii group (3.19 years). Additional research would be needed to explain these findings.
11 This report relies on the basic distinction between parolees who never spent time in a private prison on the mainland and parolees who have ever had that experience—however short it might be. This binary categorization was adopted because it is intuitively easy to understand; because other distinctions (such as “half or more of time spent on the mainland versus less than half spent there”) would further decrease the size of a mainland cohort that is only one-third the size of the Hawaii cohort even when using the more expansive ever-never distinction; and because more than 90 percent of “ever” parolees spent at least one-quarter of their time (an average of 1.5 years) in private prisons on the mainland. In short, the ever-never distinction makes sense, but future researchers may want to study the 2006 parolees by mak-ing “mainland” time an interval variable which captures the strength of the “mainland dose” (the latter is known as a “dose dependent” analysis).
13
Figure 8. Time Served, by Parolee Type (“Never” vs. “Ever” on Mainland)
FY 06 Parolee
Cohort (n=573)
FY 06 Parol-ees Who
Never Spent Time on Main-
land (n=424)
FY 06 Parol-ees Who Ever
Spent Time on Mainland
(n=149)
Average time served*** 3.96 years 3.19 years 6.15 years
Average time served in state facilities*** 3.06 years 3.19 years 2.70 years
Average time in mainland facilities 0.90 years 0.00 years 3.46 years
Percentage of time served in state facilities 77.3% 100.0% 43.9%
Percentage of time served in mainland facilities 22.7% 0.0% 56.3% Significant differences between parolee types at *** p < .001.
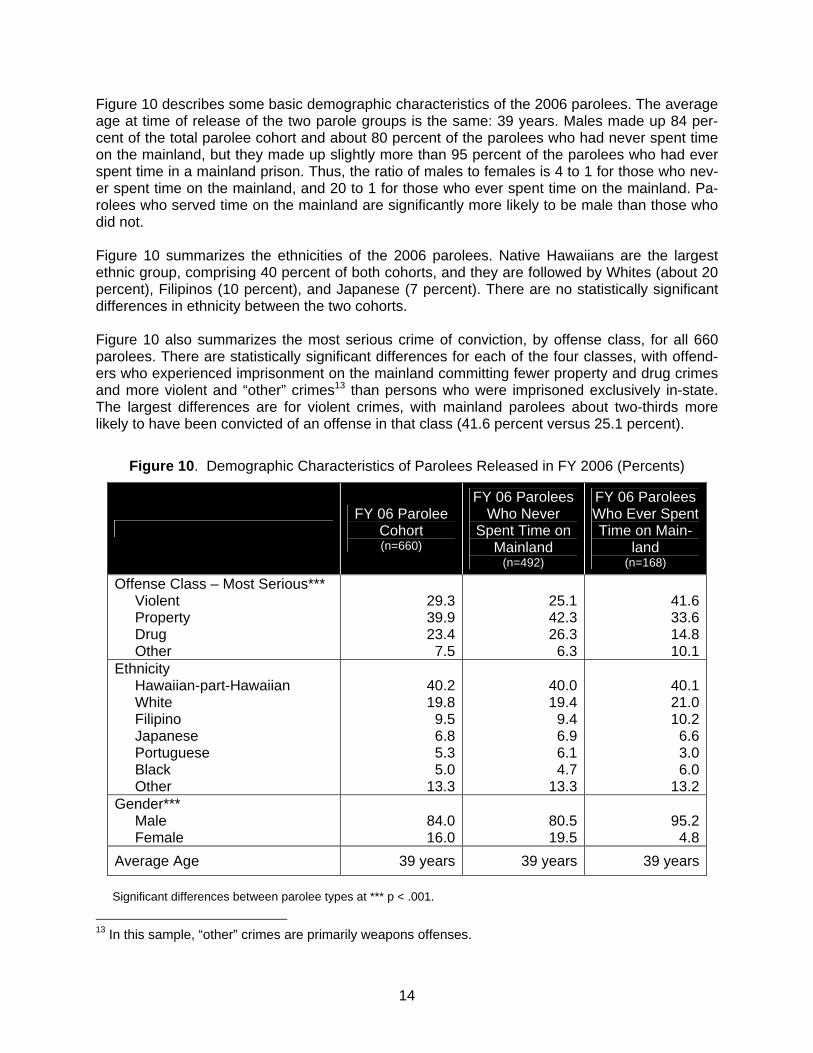
Figure 9 shows that parolees who ever spent time on the mainland received an average maxi-mum sentence (10.9 years) that was nearly 2.5 years longer than the average maximum sen-tence imposed (8.5 years) on parolees who never spent time on the mainland. The mainland cohort also served a much longer proportion of their maximum sentences—an average of 56 percent, compared with only 38 percent for the Hawaii cohort. Thus, among parolees who were released in 2006, those who ever spent time in a mainland prison had received substantially longer prison sentences, and ultimately served more time12. The latter fact may be partly ex-plained by the findings presented in Figures 10 and 11, below: inmates incarcerated on the mainland are more apt to be violent offenders, and they have more extensive criminal histories, too.
Figure 9. Percentage of Sentence Served for Most Serious Offense, by Parolee Type
FY 06 Parolee
Cohort (n=570)
FY 06 Parolees Who Never
Spent Time on Mainland
(n=423)
FY 06 Parolees Who Ever Spent Time on Main-
land (n=147)
Average maximum sentence** 9.1 years 8.5 years 10.9 years
Average percentage of total time served (at this parole) to maximum sentence***
43% 38% 56%
Significant differences between parolee types at ** p < .01, *** p < .001.
12 Per the Hawaii Department of Public Safety, the length of minimum sentence(s) as well as program and health care needs are the three primary factors that determine who is incarcerated on the mainland. Fur-ther, inmates are not sent to the mainland until after the Hawaii Paroling Authority has set their minimum sentence(s). This study did not address these factors, though, as the focus was on parole releases rather than prison entries.
14
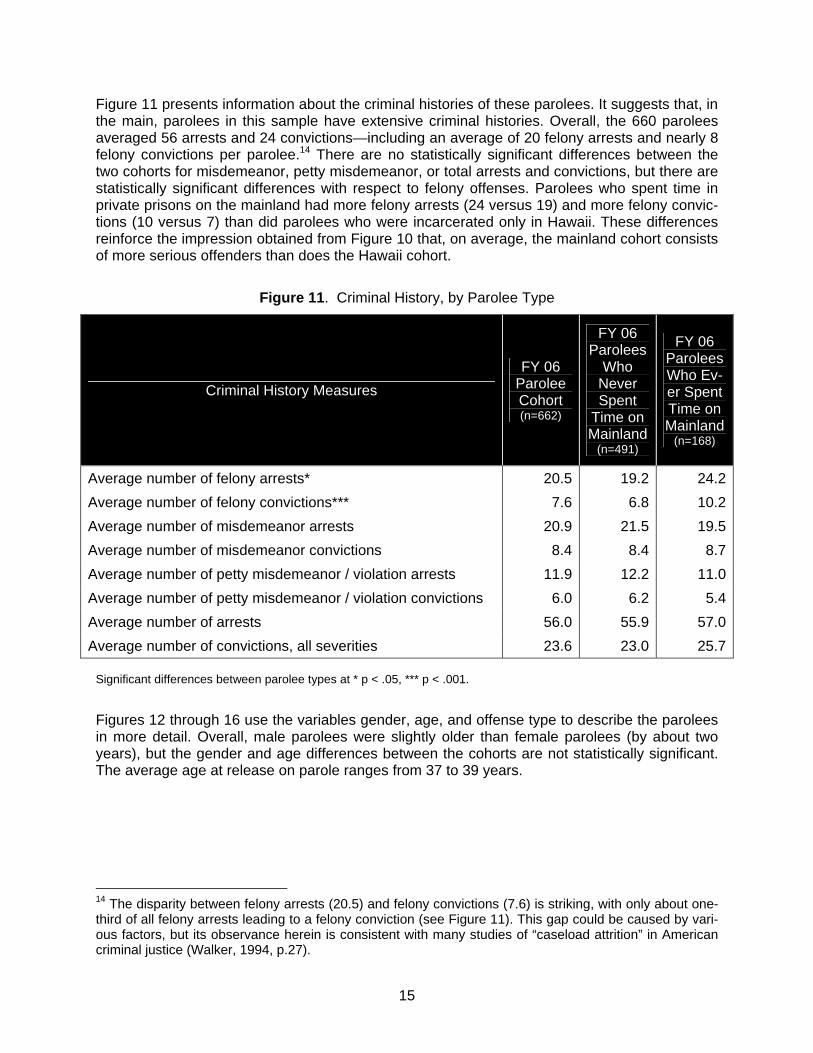
Figure 10 describes some basic demographic characteristics of the 2006 parolees. The average age at time of release of the two parole groups is the same: 39 years. Males made up 84 per-cent of the total parolee cohort and about 80 percent of the parolees who had never spent time on the mainland, but they made up slightly more than 95 percent of the parolees who had ever spent time in a mainland prison. Thus, the ratio of males to females is 4 to 1 for those who nev-er spent time on the mainland, and 20 to 1 for those who ever spent time on the mainland. Pa-rolees who served time on the mainland are significantly more likely to be male than those who did not. Figure 10 summarizes the ethnicities of the 2006 parolees. Native Hawaiians are the largest ethnic group, comprising 40 percent of both cohorts, and they are followed by Whites (about 20 percent), Filipinos (10 percent), and Japanese (7 percent). There are no statistically significant differences in ethnicity between the two cohorts. Figure 10 also summarizes the most serious crime of conviction, by offense class, for all 660 parolees. There are statistically significant differences for each of the four classes, with offend-ers who experienced imprisonment on the mainland committing fewer property and drug crimes and more violent and “other” crimes13 than persons who were imprisoned exclusively in-state. The largest differences are for violent crimes, with mainland parolees about two-thirds more likely to have been convicted of an offense in that class (41.6 percent versus 25.1 percent).
Figure 10. Demographic Characteristics of Parolees Released in FY 2006 (Percents)
FY 06 Parolee
Cohort (n=660)
FY 06 Parolees Who Never
Spent Time on Mainland
(n=492)
FY 06 Parolees Who Ever Spent Time on Main-
land (n=168)
Offense Class – Most Serious*** Violent Property Drug Other
29.339.923.4
7.5
25.1 42.3 26.3
6.3
41.633.614.810.1
Ethnicity Hawaiian-part-Hawaiian White Filipino Japanese Portuguese Black Other
40.219.8
9.56.85.35.0
13.3
40.0 19.4
9.4 6.9 6.1 4.7
13.3
40.121.010.2
6.63.06.0
13.2Gender*** Male Female
84.016.0
80.5 19.5
95.24.8
Average Age 39 years 39 years 39 years Significant differences between parolee types at *** p < .001.
13 In this sample, “other” crimes are primarily weapons offenses.
15
Figure 11 presents information about the criminal histories of these parolees. It suggests that, in the main, parolees in this sample have extensive criminal histories. Overall, the 660 parolees averaged 56 arrests and 24 convictions—including an average of 20 felony arrests and nearly 8 felony convictions per parolee.14 There are no statistically significant differences between the two cohorts for misdemeanor, petty misdemeanor, or total arrests and convictions, but there are statistically significant differences with respect to felony offenses. Parolees who spent time in private prisons on the mainland had more felony arrests (24 versus 19) and more felony convic-tions (10 versus 7) than did parolees who were incarcerated only in Hawaii. These differences reinforce the impression obtained from Figure 10 that, on average, the mainland cohort consists of more serious offenders than does the Hawaii cohort.
Figure 11. Criminal History, by Parolee Type
Criminal History Measures FY 06
Parolee Cohort (n=662)
FY 06 Parolees
Who Never Spent
Time on Mainland
(n=491)
FY 06 Parolees Who Ev-er Spent Time on Mainland
(n=168)
Average number of felony arrests* 20.5 19.2 24.2Average number of felony convictions*** 7.6 6.8 10.2Average number of misdemeanor arrests 20.9 21.5 19.5Average number of misdemeanor convictions 8.4 8.4 8.7Average number of petty misdemeanor / violation arrests 11.9 12.2 11.0Average number of petty misdemeanor / violation convictions 6.0 6.2 5.4Average number of arrests 56.0 55.9 57.0Average number of convictions, all severities 23.6 23.0 25.7
Significant differences between parolee types at * p < .05, *** p < .001.
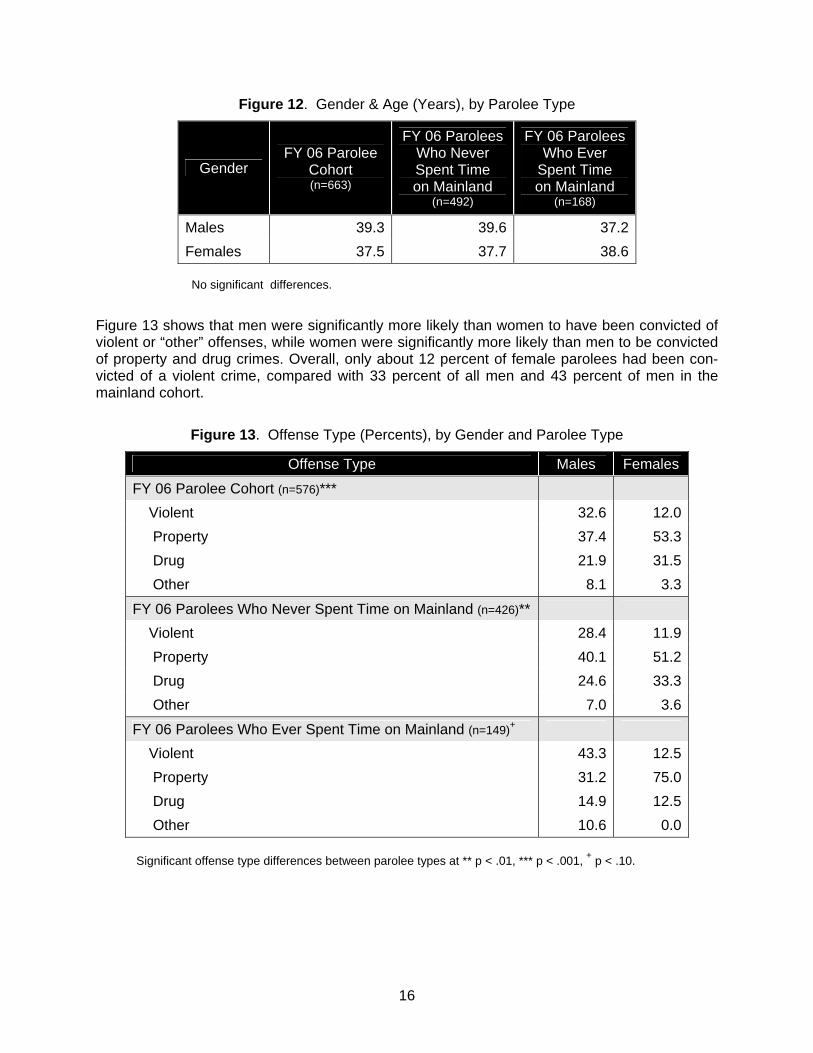
Figures 12 through 16 use the variables gender, age, and offense type to describe the parolees in more detail. Overall, male parolees were slightly older than female parolees (by about two years), but the gender and age differences between the cohorts are not statistically significant. The average age at release on parole ranges from 37 to 39 years.
14 The disparity between felony arrests (20.5) and felony convictions (7.6) is striking, with only about one-third of all felony arrests leading to a felony conviction (see Figure 11). This gap could be caused by vari-ous factors, but its observance herein is consistent with many studies of “caseload attrition” in American criminal justice (Walker, 1994, p.27).
16
Figure 12. Gender & Age (Years), by Parolee Type
Gender FY 06 Parolee
Cohort (n=663)
FY 06 Parolees Who Never Spent Time on Mainland
(n=492)
FY 06 Parolees Who Ever
Spent Time on Mainland
(n=168)
Males 39.3 39.6 37.2 Females 37.5 37.7 38.6
No significant differences.
Figure 13 shows that men were significantly more likely than women to have been convicted of violent or “other” offenses, while women were significantly more likely than men to be convicted of property and drug crimes. Overall, only about 12 percent of female parolees had been con-victed of a violent crime, compared with 33 percent of all men and 43 percent of men in the mainland cohort.
Figure 13. Offense Type (Percents), by Gender and Parolee Type
Offense Type Males Females
FY 06 Parolee Cohort (n=576)*** Violent 32.6 12.0 Property 37.4 53.3 Drug 21.9 31.5 Other 8.1 3.3
FY 06 Parolees Who Never Spent Time on Mainland (n=426)** Violent 28.4 11.9 Property 40.1 51.2 Drug 24.6 33.3 Other 7.0 3.6
FY 06 Parolees Who Ever Spent Time on Mainland (n=149)+ Violent 43.3 12.5 Property 31.2 75.0 Drug 14.9 12.5 Other 10.6 0.0
Significant offense type differences between parolee types at ** p < .01, *** p < .001, + p < .10.
17
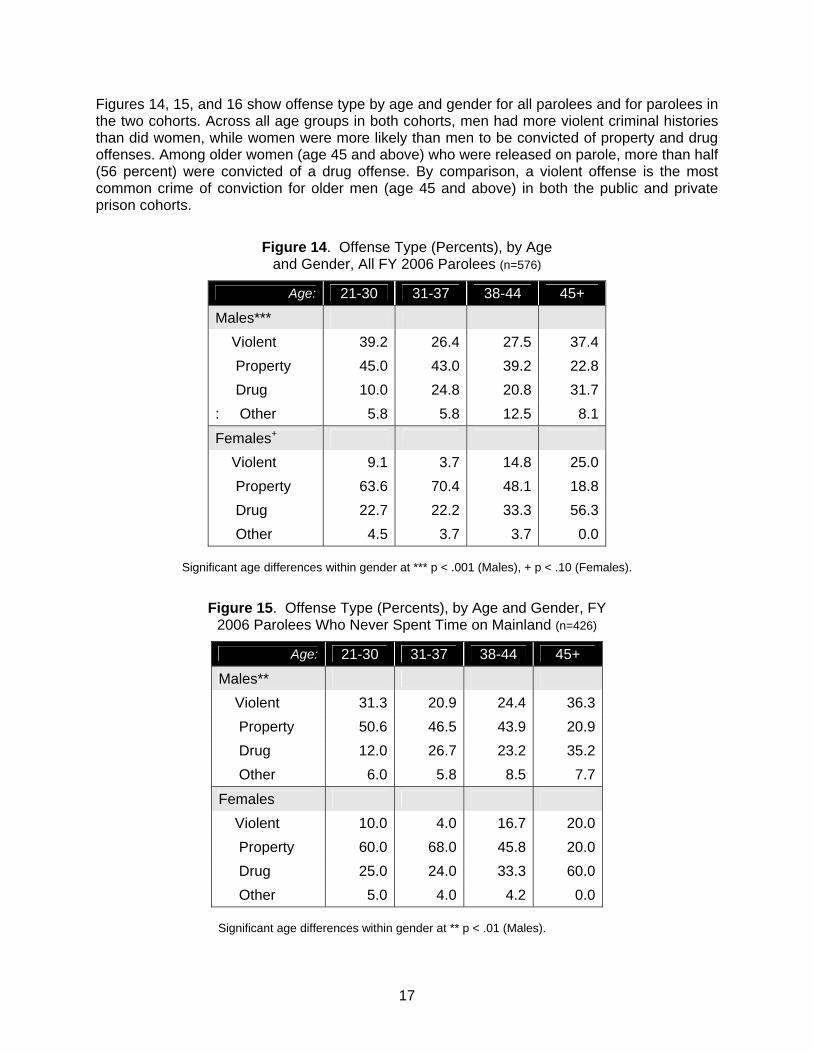
Figures 14, 15, and 16 show offense type by age and gender for all parolees and for parolees in the two cohorts. Across all age groups in both cohorts, men had more violent criminal histories than did women, while women were more likely than men to be convicted of property and drug offenses. Among older women (age 45 and above) who were released on parole, more than half (56 percent) were convicted of a drug offense. By comparison, a violent offense is the most common crime of conviction for older men (age 45 and above) in both the public and private prison cohorts.
Figure 14. Offense Type (Percents), by Age
and Gender, All FY 2006 Parolees (n=576)
Age: 21-30 31-37 38-44 45+
Males*** Violent 39.2 26.4 27.5 37.4 Property 45.0 43.0 39.2 22.8 Drug 10.0 24.8 20.8 31.7 : Other 5.8 5.8 12.5 8.1
Females+ Violent 9.1 3.7 14.8 25.0 Property 63.6 70.4 48.1 18.8 Drug 22.7 22.2 33.3 56.3 Other 4.5 3.7 3.7 0.0
Significant age differences within gender at *** p < .001 (Males), + p < .10 (Females).
Figure 15. Offense Type (Percents), by Age and Gender, FY 2006 Parolees Who Never Spent Time on Mainland (n=426)
Age: 21-30 31-37 38-44 45+
Males** Violent 31.3 20.9 24.4 36.3 Property 50.6 46.5 43.9 20.9 Drug 12.0 26.7 23.2 35.2 Other 6.0 5.8 8.5 7.7
Females Violent 10.0 4.0 16.7 20.0 Property 60.0 68.0 45.8 20.0 Drug 25.0 24.0 33.3 60.0 Other 5.0 4.0 4.2 0.0
Significant age differences within gender at ** p < .01 (Males).
18
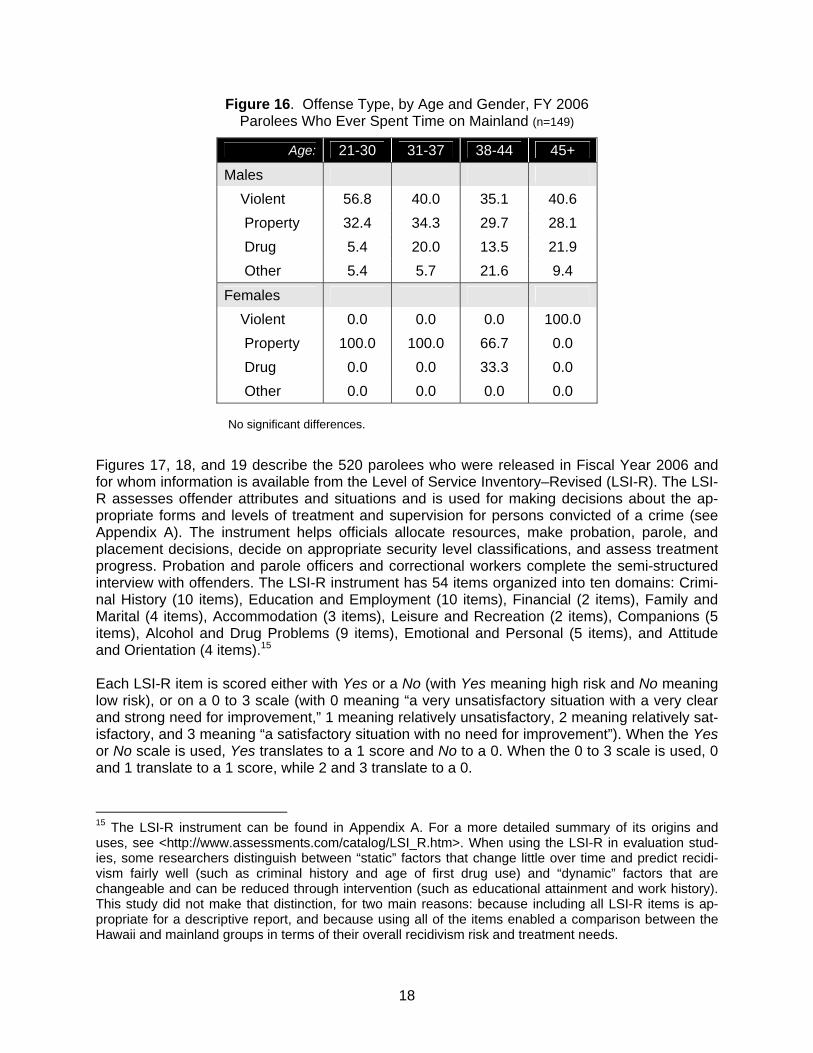
Figure 16. Offense Type, by Age and Gender, FY 2006 Parolees Who Ever Spent Time on Mainland (n=149)
Age: 21-30 31-37 38-44 45+
Males Violent 56.8 40.0 35.1 40.6 Property 32.4 34.3 29.7 28.1 Drug 5.4 20.0 13.5 21.9 Other 5.4 5.7 21.6 9.4
Females Violent 0.0 0.0 0.0 100.0 Property 100.0 100.0 66.7 0.0 Drug 0.0 0.0 33.3 0.0 Other 0.0 0.0 0.0 0.0
No significant differences.
Figures 17, 18, and 19 describe the 520 parolees who were released in Fiscal Year 2006 and for whom information is available from the Level of Service Inventory–Revised (LSI-R). The LSI-R assesses offender attributes and situations and is used for making decisions about the ap-propriate forms and levels of treatment and supervision for persons convicted of a crime (see Appendix A). The instrument helps officials allocate resources, make probation, parole, and placement decisions, decide on appropriate security level classifications, and assess treatment progress. Probation and parole officers and correctional workers complete the semi-structured interview with offenders. The LSI-R instrument has 54 items organized into ten domains: Crimi-nal History (10 items), Education and Employment (10 items), Financial (2 items), Family and Marital (4 items), Accommodation (3 items), Leisure and Recreation (2 items), Companions (5 items), Alcohol and Drug Problems (9 items), Emotional and Personal (5 items), and Attitude and Orientation (4 items).15 Each LSI-R item is scored either with Yes or a No (with Yes meaning high risk and No meaning low risk), or on a 0 to 3 scale (with 0 meaning “a very unsatisfactory situation with a very clear and strong need for improvement,” 1 meaning relatively unsatisfactory, 2 meaning relatively sat-isfactory, and 3 meaning “a satisfactory situation with no need for improvement”). When the Yes or No scale is used, Yes translates to a 1 score and No to a 0. When the 0 to 3 scale is used, 0 and 1 translate to a 1 score, while 2 and 3 translate to a 0.
15 The LSI-R instrument can be found in Appendix A. For a more detailed summary of its origins and uses, see <http://www.assessments.com/catalog/LSI_R.htm>. When using the LSI-R in evaluation stud-ies, some researchers distinguish between “static” factors that change little over time and predict recidi-vism fairly well (such as criminal history and age of first drug use) and “dynamic” factors that are changeable and can be reduced through intervention (such as educational attainment and work history). This study did not make that distinction, for two main reasons: because including all LSI-R items is ap-propriate for a descriptive report, and because using all of the items enabled a comparison between the Hawaii and mainland groups in terms of their overall recidivism risk and treatment needs.
19
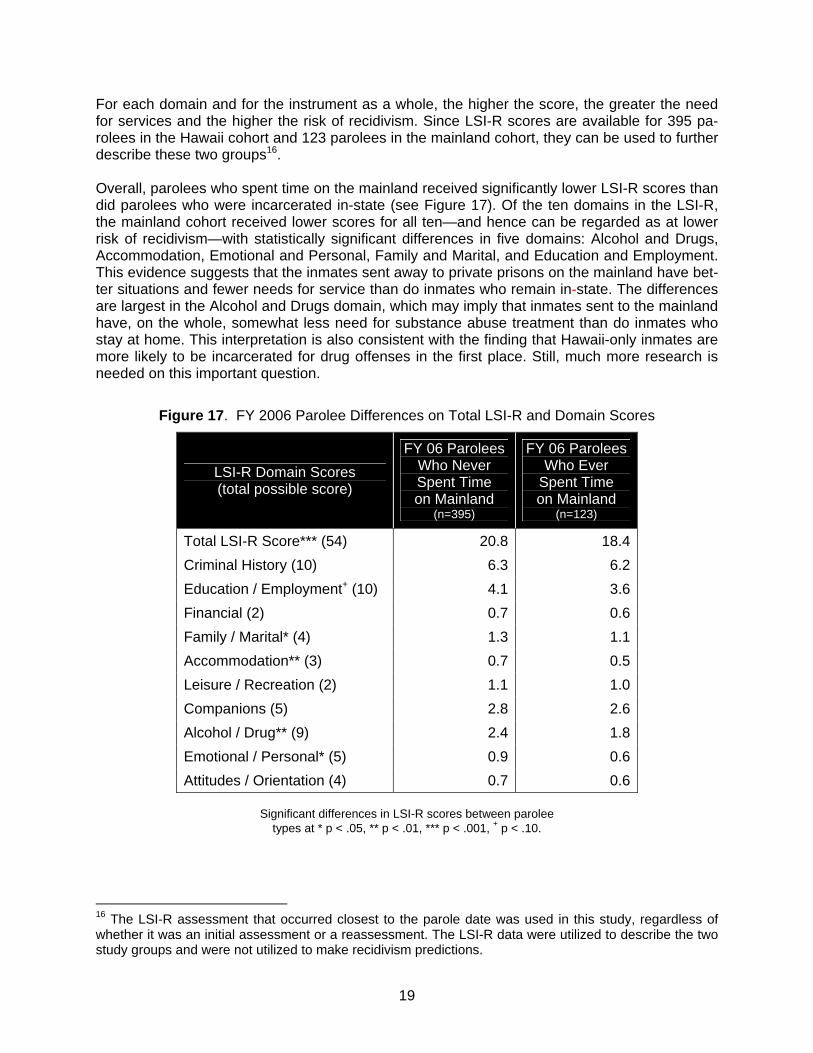
For each domain and for the instrument as a whole, the higher the score, the greater the need for services and the higher the risk of recidivism. Since LSI-R scores are available for 395 pa-rolees in the Hawaii cohort and 123 parolees in the mainland cohort, they can be used to further describe these two groups16. Overall, parolees who spent time on the mainland received significantly lower LSI-R scores than did parolees who were incarcerated in-state (see Figure 17). Of the ten domains in the LSI-R, the mainland cohort received lower scores for all ten—and hence can be regarded as at lower risk of recidivism—with statistically significant differences in five domains: Alcohol and Drugs, Accommodation, Emotional and Personal, Family and Marital, and Education and Employment. This evidence suggests that the inmates sent away to private prisons on the mainland have bet-ter situations and fewer needs for service than do inmates who remain in-state. The differences are largest in the Alcohol and Drugs domain, which may imply that inmates sent to the mainland have, on the whole, somewhat less need for substance abuse treatment than do inmates who stay at home. This interpretation is also consistent with the finding that Hawaii-only inmates are more likely to be incarcerated for drug offenses in the first place. Still, much more research is needed on this important question.
Figure 17. FY 2006 Parolee Differences on Total LSI-R and Domain Scores
LSI-R Domain Scores (total possible score)
FY 06 Parolees Who Never Spent Time on Mainland
(n=395)
FY 06 Parolees Who Ever
Spent Time on Mainland
(n=123)
Total LSI-R Score*** (54) 20.8 18.4 Criminal History (10) 6.3 6.2 Education / Employment+ (10) 4.1 3.6 Financial (2) 0.7 0.6 Family / Marital* (4) 1.3 1.1 Accommodation** (3) 0.7 0.5 Leisure / Recreation (2) 1.1 1.0 Companions (5) 2.8 2.6 Alcohol / Drug** (9) 2.4 1.8 Emotional / Personal* (5) 0.9 0.6 Attitudes / Orientation (4) 0.7 0.6
Significant differences in LSI-R scores between parolee
types at * p < .05, ** p < .01, *** p < .001, + p < .10.
16 The LSI-R assessment that occurred closest to the parole date was used in this study, regardless of whether it was an initial assessment or a reassessment. The LSI-R data were utilized to describe the two study groups and were not utilized to make recidivism predictions.
20
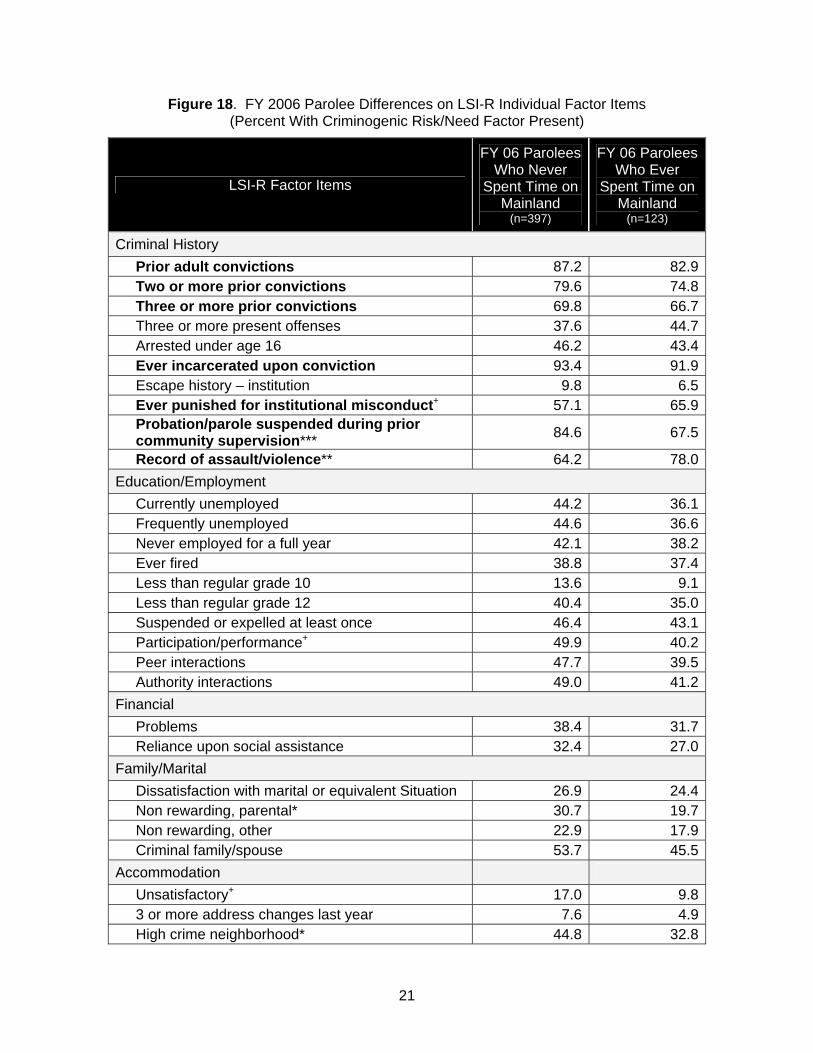
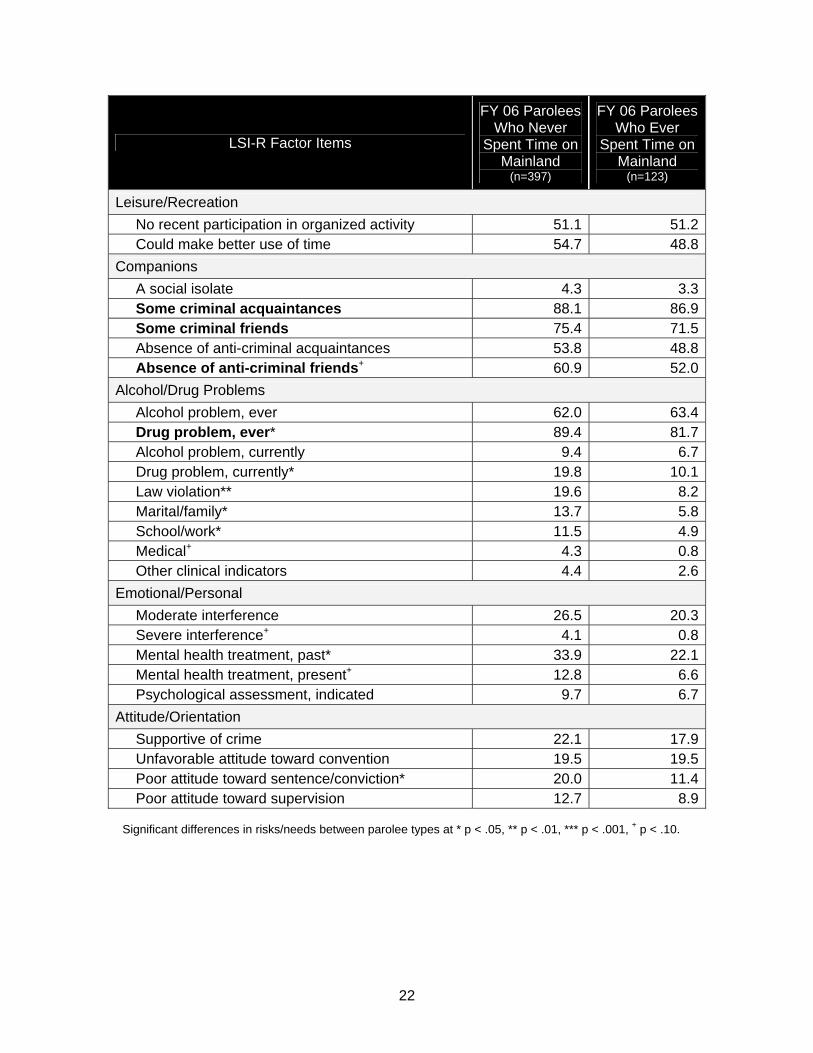
Figure 18 displays LSI-R information in more detail by showing the percentage of parolees with each of the criminogenic risk/need factors “present” for all 54 items in the assessment. A risk factor is defined to be present if the person received a 0 or 1 on the scoring scale (“very unsatis-factory” or “unsatisfactory”). Conversely, a risk factor is deemed absent if the score is 2 or 3 (“relatively satisfactory” or “satisfactory”). Three major inferences can be made from Figure 18. First, for both parolee cohorts, the highest level of risk and need by far is found in the Criminal History domain (and the risk/need differ-ence is not statistically significant between the two cohorts). In this domain, half or more of the parolees in both cohorts had the risk factor present for 7 of the 10 items. By contrast, half or more of both cohorts had a risk factor present for only seven of the other 44 items in the sur-vey.17 Based on the LSI-R, the clearest sign of the need for treatment and service among parol-ees in both cohorts is their own criminal history. The next clearest needs for treatment and service are found in the domains of Companions, Alcohol and Drugs, and Education and Em-ployment. A second sign of similarity between the two cohorts concerns the LSI-R items for which the highest percentages of parolees had a risk factor present. Nine of the top ten risk factors for each cohort are also found in the other cohort’s top ten. In Figure 18, the top ten risk factors for each cohort are highlighted in boldface. If the first two inferences from Figure 18 caution against exaggeration of the differences be-tween the Hawaii and mainland cohorts, the third inference is that the Hawaii parolees had many more needs for treatment and service than did parolees in the Mainland cohort. Figure 18 reveals that the in-state cohort scored higher for risk and need on 48 of the 54 items in the sur-vey (nearly 90 percent of the items), while the mainland cohort showed more risk and need for only 5 of those 54 items. (The percentage at risk was the same in both cohorts for one item: “unfavorable attitude toward convention.”) In other words, if we were to ask 100 focused ques-tions were asked about who has a higher need for treatment and service, about 90 times the answer would be the parolee who was incarcerated only in Hawaii. This may help explain why the cost of imprisonment in Hawaii is higher than the cost of private imprisonment on the main-land. In addition, the lower LSI-R scores for mainland prisoners (who are more likely to be vio-lent offenders than are prisoners who remain in Hawaii) are consistent with other research that shows violent offenders tend to have lower risks and needs for service than do non-violent of-fenders, and lower rates of recidivism as well (Langan & Levin, 2002). The third inference from the LSI-R data is that, all else equal, one should expect to find more recidivism among the Hawaii-only parolees than among those who spent time on the mainland. But all else is not equal. As explained earlier in this report, parolees in the mainland cohort had received longer maximum sentences, served more time, and had more serious criminal histories than did parolees who served time only in Hawaii. The next section of this report presents evi-dence about recidivism in these two cohorts.
17 The seven other items for which half or more of both cohorts had a risk factor present are: (1) no recent participation in organized activity; (2) some criminal acquaintances; (3) some criminal friends; (4) absence of anti-criminal acquaintances; (5) absence of anti-criminal friends; (6) ever had an alcohol problem; and (7) ever had a drug problem.
21
Figure 18. FY 2006 Parolee Differences on LSI-R Individual Factor Items (Percent With Criminogenic Risk/Need Factor Present)
LSI-R Factor Items
FY 06 Parolees Who Never
Spent Time on Mainland
(n=397)
FY 06 Parolees Who Ever
Spent Time on Mainland
(n=123)
Criminal History Prior adult convictions 87.2 82.9 Two or more prior convictions 79.6 74.8 Three or more prior convictions 69.8 66.7 Three or more present offenses 37.6 44.7 Arrested under age 16 46.2 43.4 Ever incarcerated upon conviction 93.4 91.9 Escape history – institution 9.8 6.5 Ever punished for institutional misconduct+ 57.1 65.9 Probation/parole suspended during prior community supervision*** 84.6 67.5
Record of assault/violence** 64.2 78.0Education/Employment Currently unemployed 44.2 36.1 Frequently unemployed 44.6 36.6 Never employed for a full year 42.1 38.2 Ever fired 38.8 37.4 Less than regular grade 10 13.6 9.1 Less than regular grade 12 40.4 35.0 Suspended or expelled at least once 46.4 43.1 Participation/performance+ 49.9 40.2 Peer interactions 47.7 39.5 Authority interactions 49.0 41.2Financial Problems 38.4 31.7 Reliance upon social assistance 32.4 27.0Family/Marital Dissatisfaction with marital or equivalent Situation 26.9 24.4 Non rewarding, parental* 30.7 19.7 Non rewarding, other 22.9 17.9 Criminal family/spouse 53.7 45.5Accommodation Unsatisfactory+ 17.0 9.8 3 or more address changes last year 7.6 4.9 High crime neighborhood* 44.8 32.8
22
LSI-R Factor Items
FY 06 Parolees Who Never
Spent Time on Mainland
(n=397)
FY 06 Parolees Who Ever
Spent Time on Mainland
(n=123)
Leisure/Recreation No recent participation in organized activity 51.1 51.2 Could make better use of time 54.7 48.8Companions A social isolate 4.3 3.3 Some criminal acquaintances 88.1 86.9 Some criminal friends 75.4 71.5 Absence of anti-criminal acquaintances 53.8 48.8 Absence of anti-criminal friends+ 60.9 52.0Alcohol/Drug Problems Alcohol problem, ever 62.0 63.4 Drug problem, ever* 89.4 81.7 Alcohol problem, currently 9.4 6.7 Drug problem, currently* 19.8 10.1 Law violation** 19.6 8.2 Marital/family* 13.7 5.8 School/work* 11.5 4.9 Medical+ 4.3 0.8 Other clinical indicators 4.4 2.6Emotional/Personal Moderate interference 26.5 20.3 Severe interference+ 4.1 0.8 Mental health treatment, past* 33.9 22.1 Mental health treatment, present+ 12.8 6.6 Psychological assessment, indicated 9.7 6.7Attitude/Orientation Supportive of crime 22.1 17.9 Unfavorable attitude toward convention 19.5 19.5 Poor attitude toward sentence/conviction* 20.0 11.4 Poor attitude toward supervision 12.7 8.9
Significant differences in risks/needs between parolee types at * p < .05, ** p < .01, *** p < .001, + p < .10.
23
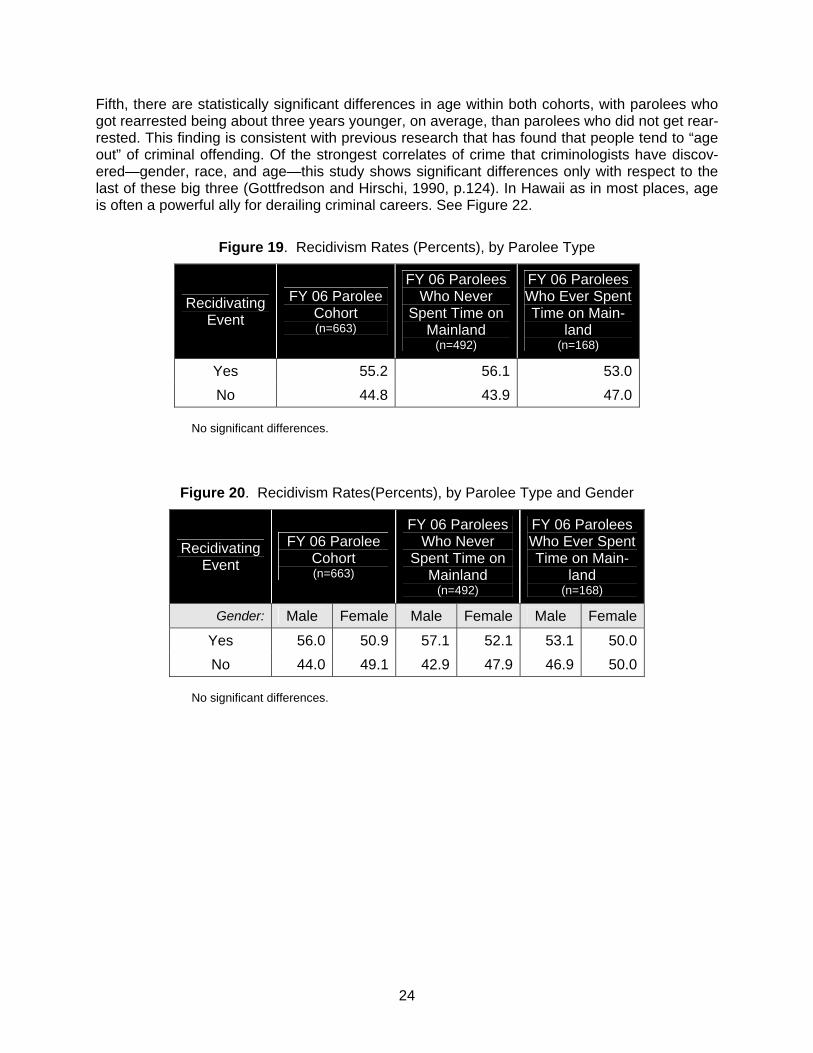
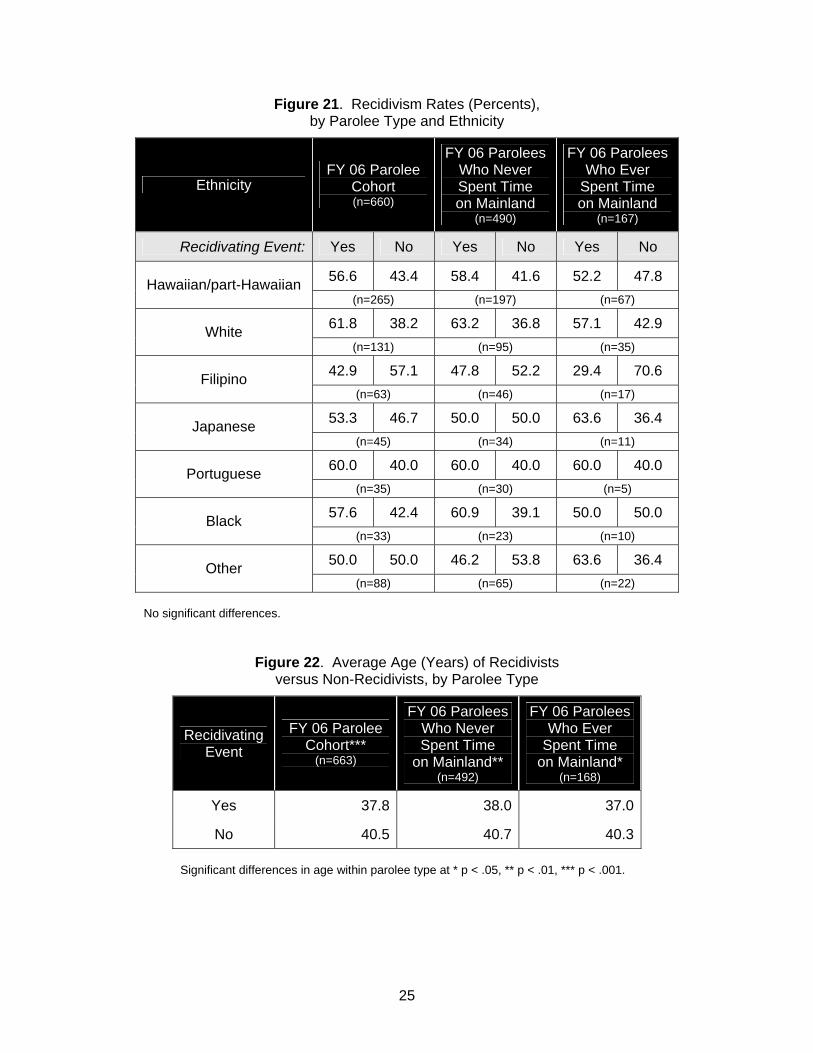
How Often Did Parolees Recidivate? Many observers regard recidivism as the single most important criterion in measuring the per-formance of a prison or prison system. When one conceptualizes corrections as a process that potentially leads to reductions in criminality, one would like to be able to attribute reductions in criminality to specific program or prison effects. Which is to say, criminal desistance is a compli-cated process, and in order to make sense of recidivism results, one would like to disentangle the effects of various programs, such as cognitive skills training, education, drug treatment, vo-cational instruction, or the effects of punishment itself (Gaes et al, 2004, p.20). Unfortunately, the data available for this report do not enable the desired decompositions. It is possible, how-ever, to describe in broad terms the recidivism outcomes of the 660 inmates who were released on parole in Fiscal Year 2006. For each person in the sample, at least three years and some-times a little more than four years of post-release offense information were obtained. This sec-tion summarizes the main recidivism findings. Figures 19 to 22 reveal five main facts. First, more than half of all parolees in both cohorts were rearrested within three years. The recidivism rate for the whole sample (both cohorts combined) is 55 percent, which is lower than the recidivism rates—62.5 percent and 67.5 percent, respec-tively—that have been found in two national studies conducted by the U.S. Bureau of Justice Statistics (based on three-year follow-ups of prisoners released on parole in 1983 and 1994, respectively; see Farabee, 2005, p.6). Hawaii’s recidivism rate of 55 percent is also lower than the 70 percent rate recently reported for California (McGreevy, 2010; Archiboild, 2010). See Figure 19.18 Second, the recidivism rate for the mainland group (53 percent) is slightly lower than the recidi-vism rate for the Hawaii group (56 percent), but the difference is not statistically significant. Thus, persons who have been imprisoned out of state fail on parole at about the same rate as persons who have been imprisoned only in Hawaii19. See Figure 19. Third, the recidivism rates for women in both cohorts are a little lower than the recidivism rates for men, but the differences are not statistically significant. In this sample, men and women are rearrested at similar rates. See Figure 20. Fourth, there are not any statistically significant differences between ethnicities in the two groups and the likelihood of being rearrested while on parole. Whites have the highest recidi-vism rate overall (62 percent) and in the Hawaii sample as well (63 percent), while Japanese (64 percent) and “other ethnicities” (64 percent) have the highest recidivism rates in the mainland sample. The most striking race and ethnicity-related finding in this study is that all sub-groups in both cohorts have recidivism rates that approach or surpass 50 percent, with only one exception: Filipinos who have been incarcerated on the mainland, whose recidivism rate is 29 percent. See Figure 21.
19 According to the administrator of the Hawaii Paroling Authority, a majority of the inmates who have fed-eral or immigration detainers are sent to the mainland, as their custody status does not allow them to be incarcerated in a minimum security facility. There is a possibility that this would affect recidivism rates for the mainland group. However, the authors had insufficient information on immigration detainers and were thus unable to control for that variable in this study. This consideration should be addressed in future re-search efforts.
24
Fifth, there are statistically significant differences in age within both cohorts, with parolees who got rearrested being about three years younger, on average, than parolees who did not get rear-rested. This finding is consistent with previous research that has found that people tend to “age out” of criminal offending. Of the strongest correlates of crime that criminologists have discov-ered—gender, race, and age—this study shows significant differences only with respect to the last of these big three (Gottfredson and Hirschi, 1990, p.124). In Hawaii as in most places, age is often a powerful ally for derailing criminal careers. See Figure 22.
Figure 19. Recidivism Rates (Percents), by Parolee Type
Recidivating Event
FY 06 Parolee Cohort (n=663)
FY 06 Parolees Who Never
Spent Time on Mainland
(n=492)
FY 06 Parolees Who Ever Spent Time on Main-
land (n=168)
Yes 55.2 56.1 53.0 No 44.8 43.9 47.0
No significant differences.
Figure 20. Recidivism Rates(Percents), by Parolee Type and Gender
Recidivating Event
FY 06 Parolee Cohort (n=663)
FY 06 Parolees Who Never
Spent Time on Mainland
(n=492)
FY 06 Parolees Who Ever Spent Time on Main-
land (n=168)
Gender: Male Female Male Female Male Female
Yes 56.0 50.9 57.1 52.1 53.1 50.0 No 44.0 49.1 42.9 47.9 46.9 50.0
No significant differences.
25
Figure 21. Recidivism Rates (Percents), by Parolee Type and Ethnicity
Ethnicity FY 06 Parolee
Cohort (n=660)
FY 06 Parolees Who Never Spent Time on Mainland
(n=490)
FY 06 Parolees Who Ever
Spent Time on Mainland
(n=167)
Recidivating Event: Yes No Yes No Yes No
56.6 43.4 58.4 41.6 52.2 47.8 Hawaiian/part-Hawaiian (n=265) (n=197) (n=67)
61.8 38.2 63.2 36.8 57.1 42.9 White (n=131) (n=95) (n=35)
42.9 57.1 47.8 52.2 29.4 70.6 Filipino (n=63) (n=46) (n=17)
53.3 46.7 50.0 50.0 63.6 36.4 Japanese (n=45) (n=34) (n=11)
60.0 40.0 60.0 40.0 60.0 40.0 Portuguese (n=35) (n=30) (n=5)
57.6 42.4 60.9 39.1 50.0 50.0 Black (n=33) (n=23) (n=10)
50.0 50.0 46.2 53.8 63.6 36.4 Other (n=88) (n=65) (n=22)
No significant differences.
Figure 22. Average Age (Years) of Recidivists versus Non-Recidivists, by Parolee Type
Recidivating Event
FY 06 Parolee Cohort***
(n=663)
FY 06 Parolees Who Never Spent Time
on Mainland** (n=492)
FY 06 Parolees Who Ever
Spent Time on Mainland*
(n=168)
Yes 37.8 38.0 37.0
No 40.5 40.7 40.3
Significant differences in age within parolee type at * p < .05, ** p < .01, *** p < .001.
26
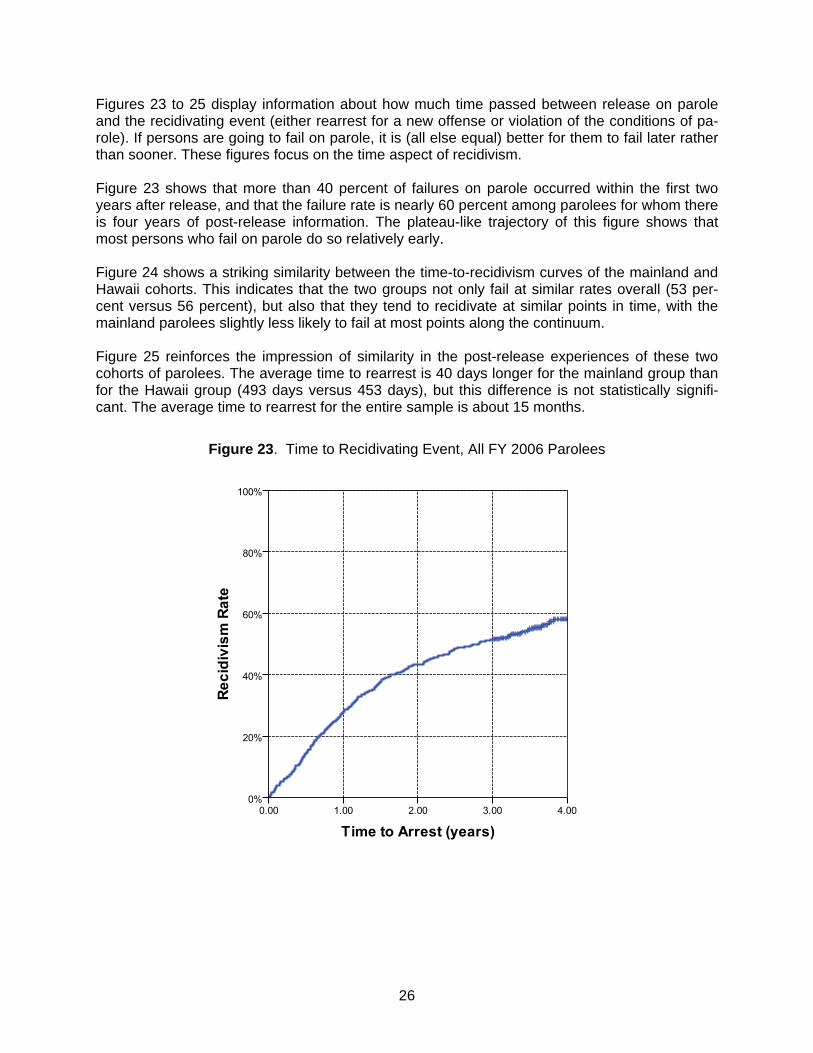
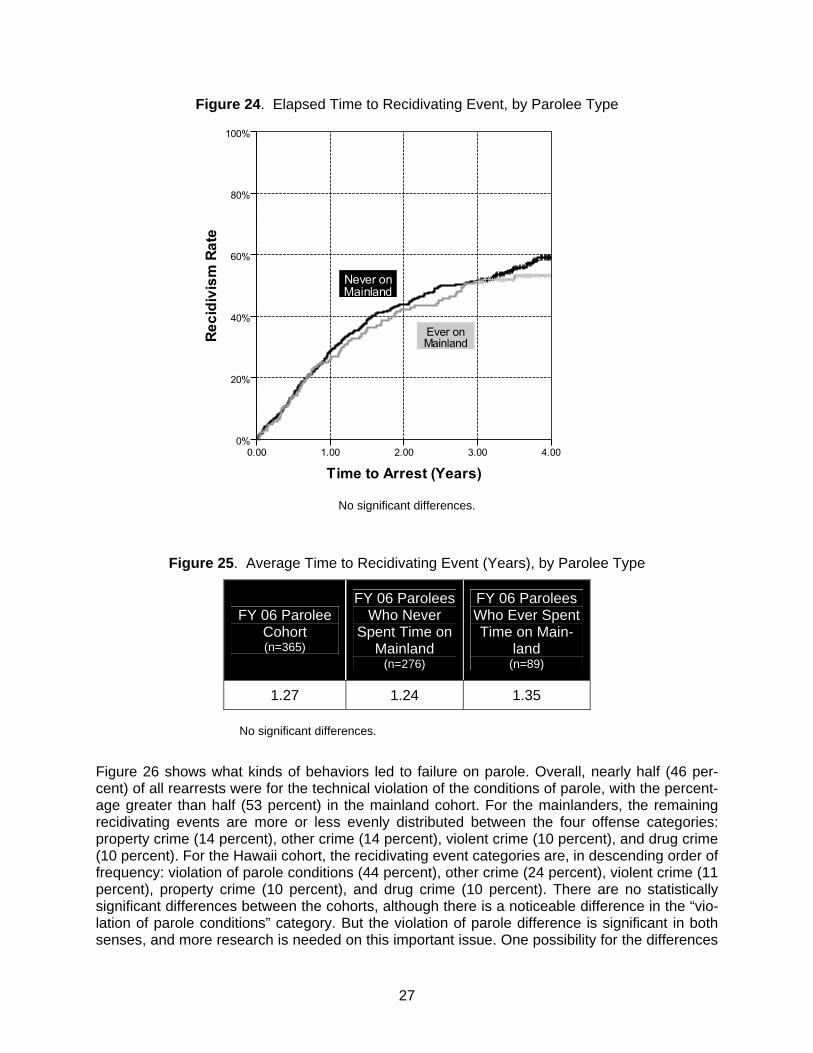
Figures 23 to 25 display information about how much time passed between release on parole and the recidivating event (either rearrest for a new offense or violation of the conditions of pa-role). If persons are going to fail on parole, it is (all else equal) better for them to fail later rather than sooner. These figures focus on the time aspect of recidivism. Figure 23 shows that more than 40 percent of failures on parole occurred within the first two years after release, and that the failure rate is nearly 60 percent among parolees for whom there is four years of post-release information. The plateau-like trajectory of this figure shows that most persons who fail on parole do so relatively early. Figure 24 shows a striking similarity between the time-to-recidivism curves of the mainland and Hawaii cohorts. This indicates that the two groups not only fail at similar rates overall (53 per-cent versus 56 percent), but also that they tend to recidivate at similar points in time, with the mainland parolees slightly less likely to fail at most points along the continuum. Figure 25 reinforces the impression of similarity in the post-release experiences of these two cohorts of parolees. The average time to rearrest is 40 days longer for the mainland group than for the Hawaii group (493 days versus 453 days), but this difference is not statistically signifi-cant. The average time to rearrest for the entire sample is about 15 months.
Figure 23. Time to Recidivating Event, All FY 2006 Parolees
27
Figure 24. Elapsed Time to Recidivating Event, by Parolee Type
No significant differences.
Figure 25. Average Time to Recidivating Event (Years), by Parolee Type
FY 06 Parolee Cohort (n=365)
FY 06 Parolees Who Never
Spent Time on Mainland
(n=276)
FY 06 Parolees Who Ever Spent Time on Main-
land (n=89)
1.27 1.24 1.35
No significant differences.
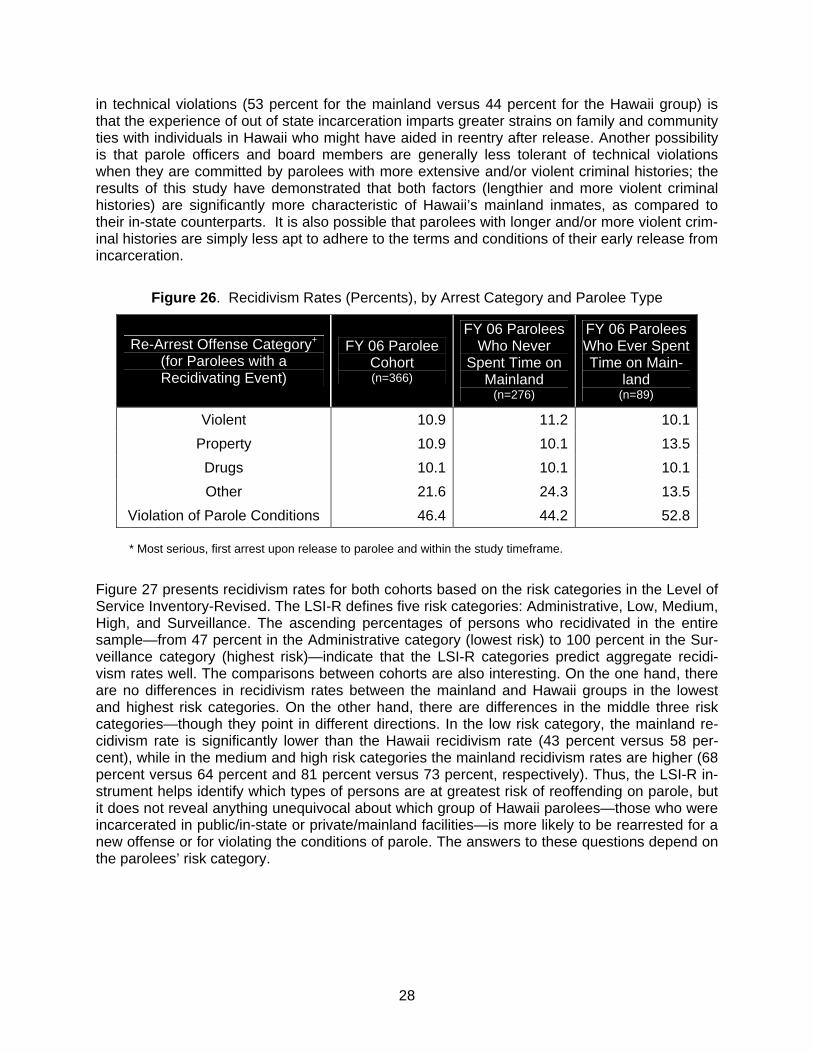
Figure 26 shows what kinds of behaviors led to failure on parole. Overall, nearly half (46 per-cent) of all rearrests were for the technical violation of the conditions of parole, with the percent-age greater than half (53 percent) in the mainland cohort. For the mainlanders, the remaining recidivating events are more or less evenly distributed between the four offense categories: property crime (14 percent), other crime (14 percent), violent crime (10 percent), and drug crime (10 percent). For the Hawaii cohort, the recidivating event categories are, in descending order of frequency: violation of parole conditions (44 percent), other crime (24 percent), violent crime (11 percent), property crime (10 percent), and drug crime (10 percent). There are no statistically significant differences between the cohorts, although there is a noticeable difference in the “vio-lation of parole conditions” category. But the violation of parole difference is significant in both senses, and more research is needed on this important issue. One possibility for the differences
28
in technical violations (53 percent for the mainland versus 44 percent for the Hawaii group) is that the experience of out of state incarceration imparts greater strains on family and community ties with individuals in Hawaii who might have aided in reentry after release. Another possibility is that parole officers and board members are generally less tolerant of technical violations when they are committed by parolees with more extensive and/or violent criminal histories; the results of this study have demonstrated that both factors (lengthier and more violent criminal histories) are significantly more characteristic of Hawaii’s mainland inmates, as compared to their in-state counterparts. It is also possible that parolees with longer and/or more violent crim-inal histories are simply less apt to adhere to the terms and conditions of their early release from incarceration.
Figure 26. Recidivism Rates (Percents), by Arrest Category and Parolee Type
Re-Arrest Offense Category+
(for Parolees with a Recidivating Event)
FY 06 Parolee Cohort (n=366)
FY 06 Parolees Who Never
Spent Time on Mainland
(n=276)
FY 06 Parolees Who Ever Spent Time on Main-
land (n=89)
Violent 10.9 11.2 10.1Property 10.9 10.1 13.5
Drugs 10.1 10.1 10.1Other 21.6 24.3 13.5
Violation of Parole Conditions 46.4 44.2 52.8
* Most serious, first arrest upon release to parolee and within the study timeframe.
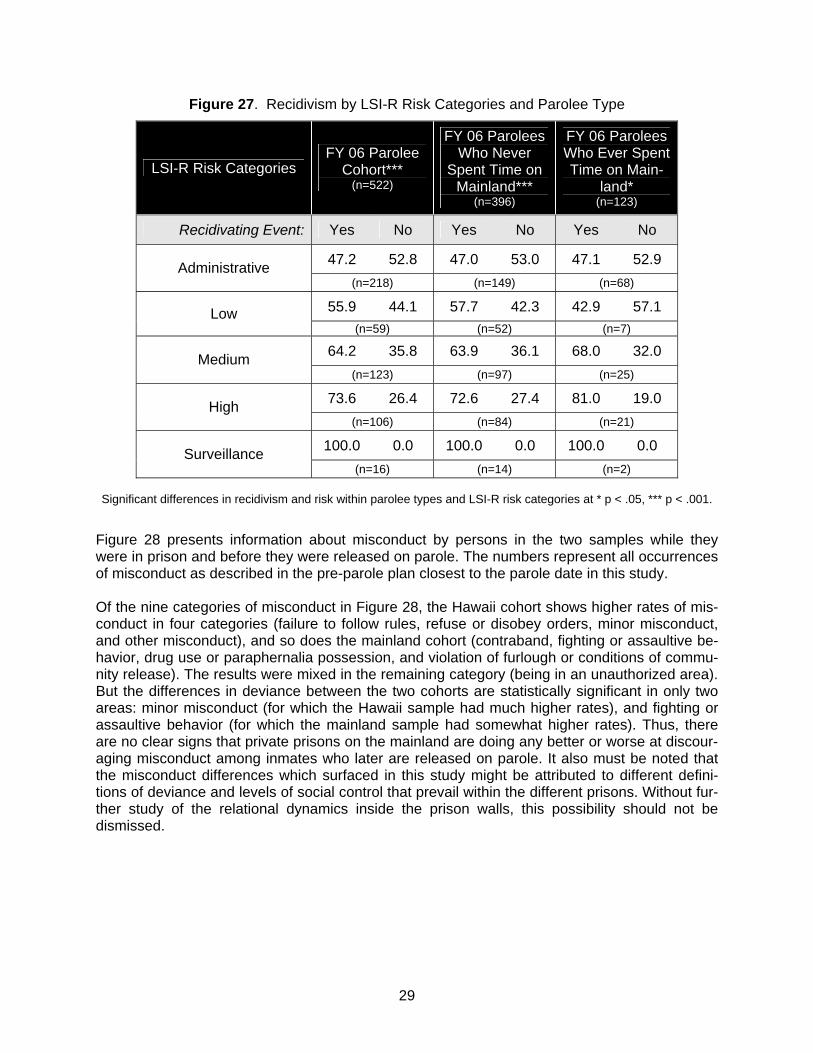
Figure 27 presents recidivism rates for both cohorts based on the risk categories in the Level of Service Inventory-Revised. The LSI-R defines five risk categories: Administrative, Low, Medium, High, and Surveillance. The ascending percentages of persons who recidivated in the entire sample—from 47 percent in the Administrative category (lowest risk) to 100 percent in the Sur-veillance category (highest risk)—indicate that the LSI-R categories predict aggregate recidi-vism rates well. The comparisons between cohorts are also interesting. On the one hand, there are no differences in recidivism rates between the mainland and Hawaii groups in the lowest and highest risk categories. On the other hand, there are differences in the middle three risk categories—though they point in different directions. In the low risk category, the mainland re-cidivism rate is significantly lower than the Hawaii recidivism rate (43 percent versus 58 per-cent), while in the medium and high risk categories the mainland recidivism rates are higher (68 percent versus 64 percent and 81 percent versus 73 percent, respectively). Thus, the LSI-R in-strument helps identify which types of persons are at greatest risk of reoffending on parole, but it does not reveal anything unequivocal about which group of Hawaii parolees—those who were incarcerated in public/in-state or private/mainland facilities—is more likely to be rearrested for a new offense or for violating the conditions of parole. The answers to these questions depend on the parolees’ risk category.
29
Figure 27. Recidivism by LSI-R Risk Categories and Parolee Type
LSI-R Risk Categories FY 06 Parolee
Cohort*** (n=522)
FY 06 Parolees Who Never
Spent Time on Mainland***
(n=396)
FY 06 Parolees Who Ever Spent Time on Main-
land* (n=123)
Recidivating Event: Yes No Yes No Yes No
47.2 52.8 47.0 53.0 47.1 52.9 Administrative (n=218) (n=149) (n=68)
55.9 44.1 57.7 42.3 42.9 57.1 Low (n=59) (n=52) (n=7)
64.2 35.8 63.9 36.1 68.0 32.0 Medium (n=123) (n=97) (n=25)
73.6 26.4 72.6 27.4 81.0 19.0 High (n=106) (n=84) (n=21)
100.0 0.0 100.0 0.0 100.0 0.0 Surveillance (n=16) (n=14) (n=2)
Significant differences in recidivism and risk within parolee types and LSI-R risk categories at * p < .05, *** p < .001.
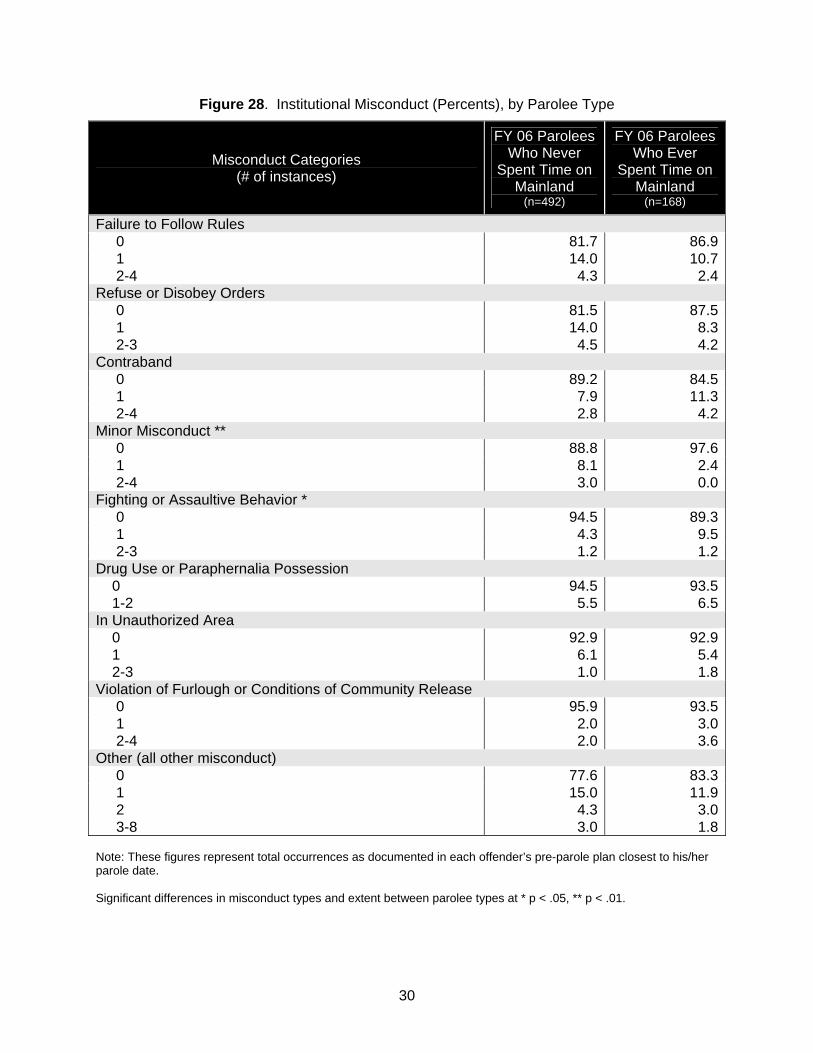
Figure 28 presents information about misconduct by persons in the two samples while they were in prison and before they were released on parole. The numbers represent all occurrences of misconduct as described in the pre-parole plan closest to the parole date in this study. Of the nine categories of misconduct in Figure 28, the Hawaii cohort shows higher rates of mis-conduct in four categories (failure to follow rules, refuse or disobey orders, minor misconduct, and other misconduct), and so does the mainland cohort (contraband, fighting or assaultive be-havior, drug use or paraphernalia possession, and violation of furlough or conditions of commu-nity release). The results were mixed in the remaining category (being in an unauthorized area). But the differences in deviance between the two cohorts are statistically significant in only two areas: minor misconduct (for which the Hawaii sample had much higher rates), and fighting or assaultive behavior (for which the mainland sample had somewhat higher rates). Thus, there are no clear signs that private prisons on the mainland are doing any better or worse at discour-aging misconduct among inmates who later are released on parole. It also must be noted that the misconduct differences which surfaced in this study might be attributed to different defini-tions of deviance and levels of social control that prevail within the different prisons. Without fur-ther study of the relational dynamics inside the prison walls, this possibility should not be dismissed.
30
Figure 28. Institutional Misconduct (Percents), by Parolee Type
Misconduct Categories (# of instances)
FY 06 Parolees Who Never
Spent Time on Mainland
(n=492)
FY 06 Parolees Who Ever
Spent Time on Mainland
(n=168)
Failure to Follow Rules 0 81.7 86.9 1 14.0 10.7 2-4 4.3 2.4Refuse or Disobey Orders 0 81.5 87.5 1 14.0 8.3 2-3 4.5 4.2Contraband 0 89.2 84.5 1 7.9 11.3 2-4 2.8 4.2Minor Misconduct ** 0 88.8 97.6 1 8.1 2.4 2-4 3.0 0.0Fighting or Assaultive Behavior * 0 94.5 89.3 1 4.3 9.5 2-3 1.2 1.2Drug Use or Paraphernalia Possession 0 94.5 93.5 1-2 5.5 6.5In Unauthorized Area 0 92.9 92.9 1 6.1 5.4 2-3 1.0 1.8Violation of Furlough or Conditions of Community Release 0 95.9 93.5 1 2.0 3.0 2-4 2.0 3.6Other (all other misconduct) 0 77.6 83.3 1 15.0 11.9 2 4.3 3.0 3-8 3.0 1.8 Note: These figures represent total occurrences as documented in each offender’s pre-parole plan closest to his/her parole date. Significant differences in misconduct types and extent between parolee types at * p < .05, ** p < .01.
31
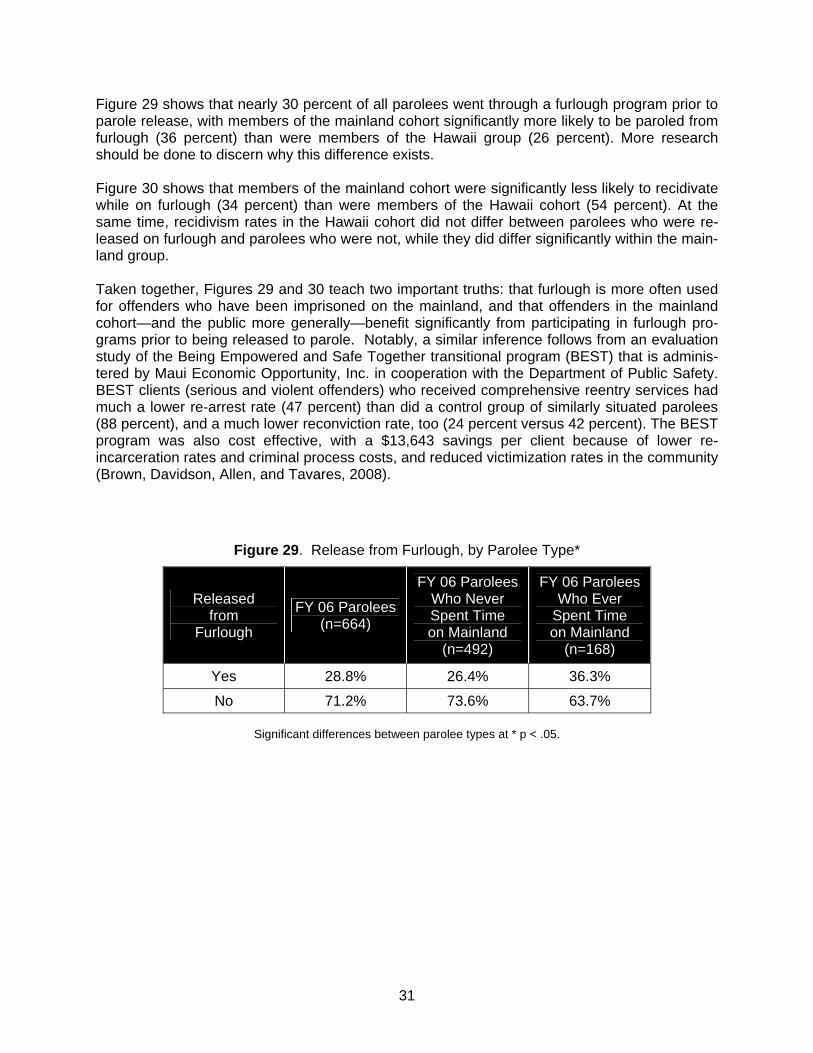
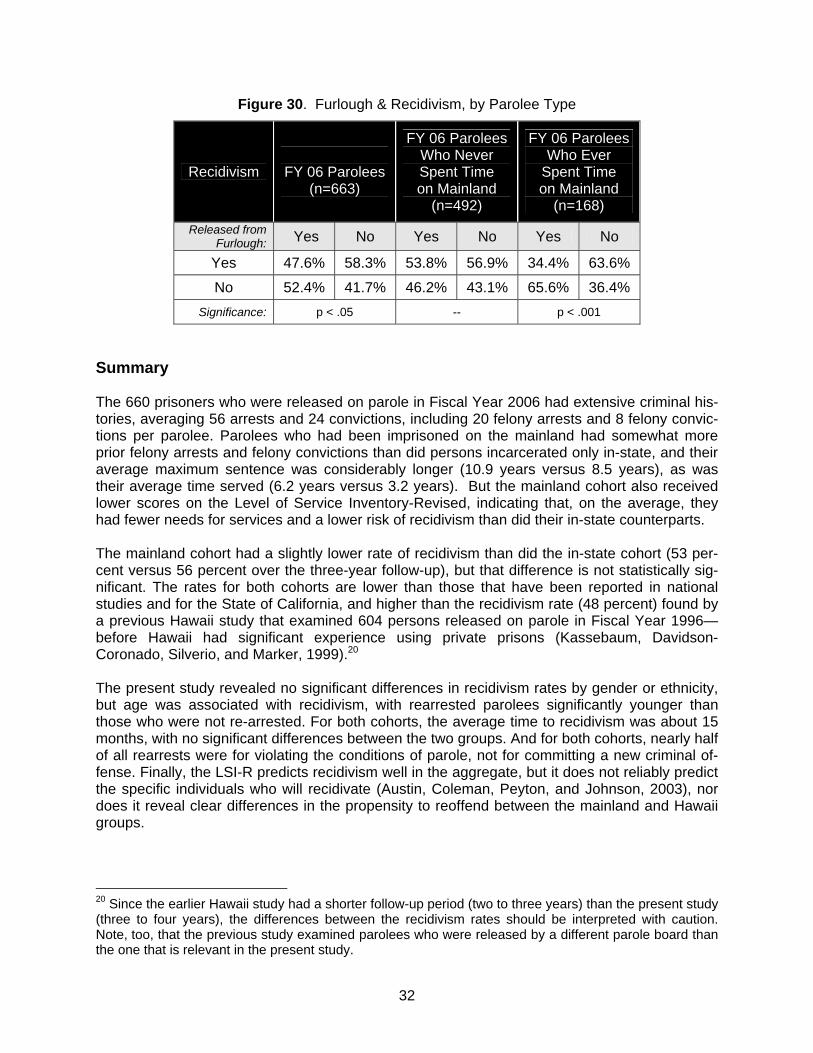
Figure 29 shows that nearly 30 percent of all parolees went through a furlough program prior to parole release, with members of the mainland cohort significantly more likely to be paroled from furlough (36 percent) than were members of the Hawaii group (26 percent). More research should be done to discern why this difference exists. Figure 30 shows that members of the mainland cohort were significantly less likely to recidivate while on furlough (34 percent) than were members of the Hawaii cohort (54 percent). At the same time, recidivism rates in the Hawaii cohort did not differ between parolees who were re-leased on furlough and parolees who were not, while they did differ significantly within the main-land group. Taken together, Figures 29 and 30 teach two important truths: that furlough is more often used for offenders who have been imprisoned on the mainland, and that offenders in the mainland cohort—and the public more generally—benefit significantly from participating in furlough pro-grams prior to being released to parole. Notably, a similar inference follows from an evaluation study of the Being Empowered and Safe Together transitional program (BEST) that is adminis-tered by Maui Economic Opportunity, Inc. in cooperation with the Department of Public Safety. BEST clients (serious and violent offenders) who received comprehensive reentry services had much a lower re-arrest rate (47 percent) than did a control group of similarly situated parolees (88 percent), and a much lower reconviction rate, too (24 percent versus 42 percent). The BEST program was also cost effective, with a $13,643 savings per client because of lower re-incarceration rates and criminal process costs, and reduced victimization rates in the community (Brown, Davidson, Allen, and Tavares, 2008).
Figure 29. Release from Furlough, by Parolee Type*
Released from
Furlough
FY 06 Parolees (n=664)
FY 06 Parolees Who Never Spent Time on Mainland
(n=492)
FY 06 Parolees Who Ever
Spent Time on Mainland
(n=168)
Yes 28.8% 26.4% 36.3%
No 71.2% 73.6% 63.7%
Significant differences between parolee types at * p < .05.
32
Figure 30. Furlough & Recidivism, by Parolee Type
Recidivism
FY 06 Parolees (n=663)
FY 06 Parolees Who Never Spent Time on Mainland
(n=492)
FY 06 Parolees Who Ever
Spent Time on Mainland
(n=168) Released from
Furlough: Yes No Yes No Yes No
Yes 47.6% 58.3% 53.8% 56.9% 34.4% 63.6%
No 52.4% 41.7% 46.2% 43.1% 65.6% 36.4% Significance: p < .05 -- p < .001
Summary The 660 prisoners who were released on parole in Fiscal Year 2006 had extensive criminal his-tories, averaging 56 arrests and 24 convictions, including 20 felony arrests and 8 felony convic-tions per parolee. Parolees who had been imprisoned on the mainland had somewhat more prior felony arrests and felony convictions than did persons incarcerated only in-state, and their average maximum sentence was considerably longer (10.9 years versus 8.5 years), as was their average time served (6.2 years versus 3.2 years). But the mainland cohort also received lower scores on the Level of Service Inventory-Revised, indicating that, on the average, they had fewer needs for services and a lower risk of recidivism than did their in-state counterparts. The mainland cohort had a slightly lower rate of recidivism than did the in-state cohort (53 per-cent versus 56 percent over the three-year follow-up), but that difference is not statistically sig-nificant. The rates for both cohorts are lower than those that have been reported in national studies and for the State of California, and higher than the recidivism rate (48 percent) found by a previous Hawaii study that examined 604 persons released on parole in Fiscal Year 1996—before Hawaii had significant experience using private prisons (Kassebaum, Davidson-Coronado, Silverio, and Marker, 1999).20 The present study revealed no significant differences in recidivism rates by gender or ethnicity, but age was associated with recidivism, with rearrested parolees significantly younger than those who were not re-arrested. For both cohorts, the average time to recidivism was about 15 months, with no significant differences between the two groups. And for both cohorts, nearly half of all rearrests were for violating the conditions of parole, not for committing a new criminal of-fense. Finally, the LSI-R predicts recidivism well in the aggregate, but it does not reliably predict the specific individuals who will recidivate (Austin, Coleman, Peyton, and Johnson, 2003), nor does it reveal clear differences in the propensity to reoffend between the mainland and Hawaii groups.
20 Since the earlier Hawaii study had a shorter follow-up period (two to three years) than the present study (three to four years), the differences between the recidivism rates should be interpreted with caution. Note, too, that the previous study examined parolees who were released by a different parole board than the one that is relevant in the present study.
33
Discussion What do these findings imply about the propriety of Hawaii’s imprisonment and parole policies? More specifically, what does this study suggest about Hawaii’s reliance on private prisons in other states? Although this study has not provided definitive answers to these questions (no single study could), it addresses them in several ways. First, the overall recidivism rate among persons who ever served time on the mainland was slightly lower (albeit a statistically insignificant difference) from the recidivism rate for persons imprisoned solely in Hawaii. This finding is consistent with a study that compared recidivism rates among persons released from private and public prisons in Florida and found that reof-fense rates were very similar for adults (males and females) released from the two types of prisons, while reoffense rates among young offenders were lower among parolees from the pri-vate facilities (Bales et al, 2005). The conclusion of the Florida study stated that there is “no empirical justification for the policy argument that private prisons reduce recidivism rates better than public prisons,” and the practical implication was that “public policy debate on the value of private prisons should focus on cost-savings or other arguments, not on recidivism-reduction claims.”21 The parallel finding from this Hawaii study may suggest a similar implication for policy discussions in this state. Second, there are problems inherent in using recidivism as a measure of prison performance, not least because prisons should not be held accountable for outcomes over which they have little control. Nonetheless, “just as we hold individuals accountable for their failures, so should we hold prison administrators accountable for the efforts they make in insuring successful rein-tegration” (Gaes et al, 2004, p.183). This study found high rates of recidivism in both the main-land and Hawaii samples. It also found that, on the whole, experience in a private prison neither increased nor decreased recidivism rates among parolees. If incarceration on the mainland is less expensive than incarceration in state, then it might appear that by sending inmates to serve time on the mainland, Hawaii is getting equivalent rehabilitation benefits for less money. For some observers, this might be considered an effective and attractive policy. But the foregoing assertion must be qualified in three important ways. First, the proposition that imprisonment on the mainland is financially less costly should be researched, not assumed. No matter how often it is said that “private prisons are cheaper,” merely saying it does not make it so. The present estimate of the cost of private imprisonment ($62 per inmate per day, versus $118 per inmate per day for incarceration in Hawaii) is far from all-inclusive, for it does not in-clude several hidden costs, including transportation to and from the mainland, the lower rates of correctional employment in Hawaii that result from sending inmates to mainland facilities, lower levels of staffing and service in private prisons that may be preoccupied with the “bottom line,” 21 There were two written responses to the Bales et al. (2005) study, both demonstrating the complexity of these issues. One, by Charles W. Thomas (2005), formerly of the University of Florida’s Private Correc-tions Project and the boards of Prison Realty Trust and Corrections Corporation of America and later of Avalon Correctional Services and the Homeland Security Corporation, expressed “grave reservations about the wisdom of evaluating either private or public prisons on the basis of the weak quality of the re-cidivism data that are typically available. To do so creates a real risk that either blame or credit will be allocated in a way that is fundamentally unfair.” The other response, by Gerald Gaes (2005), former direc-tor of the Office of Research and Evaluation in the Federal Bureau of Prisons, concludes by stating that the Bales et al. study shows that both “the promise” that prison privatization would reduce recidivism and “the premise” that privatization would introduce efficiencies previously unknown in the public prison sys-tem are incorrect.
34
increased expenditures on inmates’ phone conversations and in-person visits with family and friends, and losses in federal funding that come because the U.S. census counts persons ac-cording to the states in which they are incarcerated.22 It is beyond the scope of the present study to provide a more reliable estimate of the true cost of private imprisonment; that should be a high priority for future research. The second qualification is that the present study says nothing about persons who remained in prison and were not released on parole. The extent to which inmates released to parole from in-state or mainland facilities accurately represents the populations actually serving time in those respective locales is unknown. If, for whatever reasons (e.g., longer and/or more violent criminal histories among the mainland cohort, the lack of face-to-face parole hearings, etc.) it were found that release to parole is more difficult to obtain by persons incarcerated in private prisons on the mainland—a possibility suggested by observations of parole board hearings on November 18, 2009 (in person at Halawa Correctional Facility) and November 23, 2009 (by video conferencing with inmates in Arizona)23—then this study is not comparing otherwise equivalent study groups; the mainland sample would consist of persons who passed a more rigorous parole release re-view and may therefore be less likely to recidivate than are the parolees in the in-state group. If this were the case—and, again, more research is needed—then even though the recidivism rate for the mainland sample is similar to that for the Hawaii group, it may overstate how well the mainland inmates did on parole, because they are failing at rates similar to inmates in the Ha-waii sample even though they are disproportionately the “cream of the mainland crop.” This possibility is further reinforced because LSI-R scores revealed that the mainland sample had fewer needs for service and a lower average risk of recidivism than did parolees from the Hawaii cohort. For the mainland group to fail on parole as often as the Hawaii sample raises the possi-bility that imprisonment on the mainland is less rehabilitative than is imprisonment in Hawaii. This possibility should be one focus of future research, which also ought to explore who is actu-ally sent to which type of prison, and how close the alignment is to official policy. The present study only examines persons released to parole. The third qualification to assertions that Hawaii’s reliance on private prisons might be reaping equivalent rehabilitation returns for less money concerns the limits of a frame of analysis that focuses only on these two measures (Aviram, 2010). Humonetarianism refers to the growing trend in the United States to approach questions about criminal risk and rehabilitation mainly through the prism of cost. Claims about cost now dominate public discourse and drive correc-tional policy in many American states. For those who care about the quality of correctional pol-
22 Conservative estimates put the cost (in lost federal funding) of each uncounted prisoner at about $1,200 per year, although Momi Fernandez, director of the Data and Information/Census Information Center at the Native Hawaiian group Papa Ola Lokahi, says a more likely figure is $2,500. The latter es-timate generates a total in lost federal funding for Hawaii of almost $5 million per year, which is enough money to incarcerate 116 inmates in Hawaii for one year. Michael Tsai, “Prisons Skewing Census,” Hono-lulu Advertiser, May 15, 2010, pp.A1, A6. 23 The authors of this study observed 20 parole hearings in person at Halawa Correctional Facility on No-vember 18, 2009, and 22 parole hearings by video link with inmates in Saguaro Correctional Center (Ari-zona) on November 23, 2009. It is important to be cautious about making inferences from this limited experience, but the impression of both authors is that, on the whole, it seemed more difficult for inmates on the mainland to obtain parole (via video conferencing) than it was for inmates who met face-to-face with the HPA in Hawaii. This possibility was acknowledged by members of the HPA, who suggested that a “live,” faced-to-face connection with candidates for parole facilitates interpersonal communication and thus may raise the likelihood of release. The authors are grateful to the HPA for their willingness to dis-cuss this issue.
35
icy in Hawaii, this discourse provides both promise and pitfalls. The chief promise is that hu-monetarian frameworks sometimes recognize how expensive it is to rely on prisons to control crime and punish offenders. In some circumstances, the result of that recognition is a willing-ness to consider less expensive and less punitive policies, such as drug treatment, intermediate sanctions, and community supervision. But the humonetarian discourse also harbors considerable peril (Aviram, 2010). For one thing, its focus on short-term financial costs often deflects attention away from deeper problems that plague the correctional system, such as inconsistent sentencing policies, the provision of decent medical care, the protection of inmates from sexual assault and other forms of custodial vio-lence, and the overrepresentation of racial minorities and the poor at all stages of the criminal justice system. Native Hawaiians are significantly overrepresented in Hawaii’s prison system, and some 60 percent of those released on parole in 2006 were sent back to prison within four years (see Figure 21). In addition, the cost-centered arguments of humonetarianism can be a double-edged sword that cuts not only ineffective and inefficient correctional programs, but also programs that curb crime or inmates deserve (or both). According to the Vera Institute of Justice, at least 20 American states have tried to save correctional funds by cutting rehabilitative programs (Scott-Hayward, 2009). California slashed its commitment to medical care for inmates so severely that a federal court threatened to take over management of that state’s 33 prisons and 155,000 prisoners.24 And three days a week in Georgia, prison inmates receive only two meals. Adequate meals, medical care, and rehabilitation programs should be nonnegotiable parts of a civilized penal system. So, too, should decent access to family support systems—a prospect that is difficult from a distance of 3,000 miles.25 In Hawaii and elsewhere, problems such as these suggest the shortsightedness of relying on a perspective that stresses short-term savings at the expense of policies and programs aimed at improving the prospects for offenders’ rehabilitation and the satisfaction of their basic needs and rights (Aviram, 2010, p.50). States and their leaders have a responsibility to care not only about crime control and the costs of incarceration but also about the present welfare and future well-being of criminal offenders and the communities from which they come. The vast majority of of-fenders will come home one day, and they will be our neighbors.
24 In 2009, California also passed a law aimed at cutting its prison population. By February 2010, more than 1,500 inmates had been released from county jails around the state, “prompting an outcry from some law enforcement officials” (Blankstein and Winton, 2010). State officials expect that the new law will reduce the prison population by 6,500 “low-level” offenders in the first year (about 4 percent of the state’s total prison population), but further reductions will be “a hard sell” because lengthening sentences and spending more on incarceration are “politically popular notions” (Archibold, 2010). 25 One interesting question (though not a pivotal policy question) is where persons convicted in Hawaii prefer to be imprisoned. As stated in the Introduction of this report, there is anecdotal evidence that some inmates prefer to be incarcerated on the mainland. The authors of this report have also heard people ac-tive in Hawaii’s Community Alliance on Prisons (CAP) say that single men convicted of crime may prefer a private prison on the mainland (in part because of the perception that the food may be better and there may be more freedom in a CCA facility than in a Hawaii prison), while convicts with significant family con-nections seem to prefer in-state prisons. If this is true—and the evidence is only impressionistic—it may be as much a commentary on the conditions in Hawaii’s own prisons as it is a reflection of what prisoners want.
36
Future Research In terms of both scope and distance, Hawaii is uniquely reliant on private, mainland prisons. At present, more than half of the state’s convicted felons are in private prisons on the mainland—the highest percentage among all American states. Hawaii is also uniquely situated in that no other state that uses private prisons has to send its inmates across an ocean to cells 3,000 miles removed from the place where their crimes and convictions occurred. Many claims have been made about the wisdom of Hawaii’s present imprisonment policy, but there have been few efforts to determine precisely how the state’s incarceration policy is being implemented, or what its consequences are. The immediate necessity of dealing with prison overcrowding gave rise to the use of Hawaii’s mainland incarceration policy. Since its initiation, however, the policy has been deficient in em-pirical analyses. This study has tried to discern a few of the contours and consequences of Ha-waii’s imprisonment policy, and this report presents the most central findings. In concluding this discussion, it is stressed—more than anything else in this report—that much more research needs to be done about the subjects explored here. Hawaii needs to know more about the implementation and outcomes of its imprisonment policy. For that learning to occur, the State needs to conduct the requisite research and evaluation. The pressures to be penny-wise-and-pound-foolish are especially strong in this time of fiscal crisis, and that is another reason why they must be resisted.
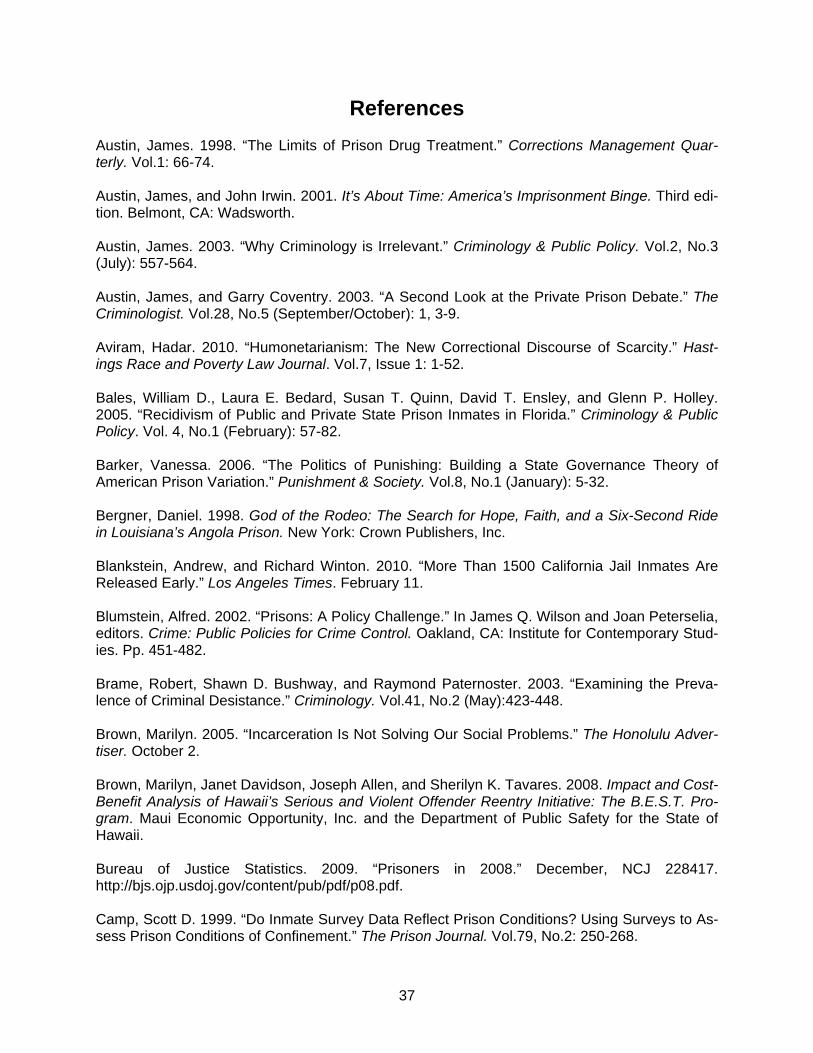
37
References Austin, James. 1998. “The Limits of Prison Drug Treatment.” Corrections Management Quar-terly. Vol.1: 66-74. Austin, James, and John Irwin. 2001. It’s About Time: America’s Imprisonment Binge. Third edi-tion. Belmont, CA: Wadsworth. Austin, James. 2003. “Why Criminology is Irrelevant.” Criminology & Public Policy. Vol.2, No.3 (July): 557-564. Austin, James, and Garry Coventry. 2003. “A Second Look at the Private Prison Debate.” The Criminologist. Vol.28, No.5 (September/October): 1, 3-9. Aviram, Hadar. 2010. “Humonetarianism: The New Correctional Discourse of Scarcity.” Hast-ings Race and Poverty Law Journal. Vol.7, Issue 1: 1-52. Bales, William D., Laura E. Bedard, Susan T. Quinn, David T. Ensley, and Glenn P. Holley. 2005. “Recidivism of Public and Private State Prison Inmates in Florida.” Criminology & Public Policy. Vol. 4, No.1 (February): 57-82. Barker, Vanessa. 2006. “The Politics of Punishing: Building a State Governance Theory of American Prison Variation.” Punishment & Society. Vol.8, No.1 (January): 5-32. Bergner, Daniel. 1998. God of the Rodeo: The Search for Hope, Faith, and a Six-Second Ride in Louisiana’s Angola Prison. New York: Crown Publishers, Inc. Blankstein, Andrew, and Richard Winton. 2010. “More Than 1500 California Jail Inmates Are Released Early.” Los Angeles Times. February 11. Blumstein, Alfred. 2002. “Prisons: A Policy Challenge.” In James Q. Wilson and Joan Peterselia, editors. Crime: Public Policies for Crime Control. Oakland, CA: Institute for Contemporary Stud-ies. Pp. 451-482. Brame, Robert, Shawn D. Bushway, and Raymond Paternoster. 2003. “Examining the Preva-lence of Criminal Desistance.” Criminology. Vol.41, No.2 (May):423-448. Brown, Marilyn. 2005. “Incarceration Is Not Solving Our Social Problems.” The Honolulu Adver-tiser. October 2. Brown, Marilyn, Janet Davidson, Joseph Allen, and Sherilyn K. Tavares. 2008. Impact and Cost-Benefit Analysis of Hawaii’s Serious and Violent Offender Reentry Initiative: The B.E.S.T. Pro-gram. Maui Economic Opportunity, Inc. and the Department of Public Safety for the State of Hawaii. Bureau of Justice Statistics. 2009. “Prisoners in 2008.” December, NCJ 228417. http://bjs.ojp.usdoj.gov/content/pub/pdf/p08.pdf. Camp, Scott D. 1999. “Do Inmate Survey Data Reflect Prison Conditions? Using Surveys to As-sess Prison Conditions of Confinement.” The Prison Journal. Vol.79, No.2: 250-268.
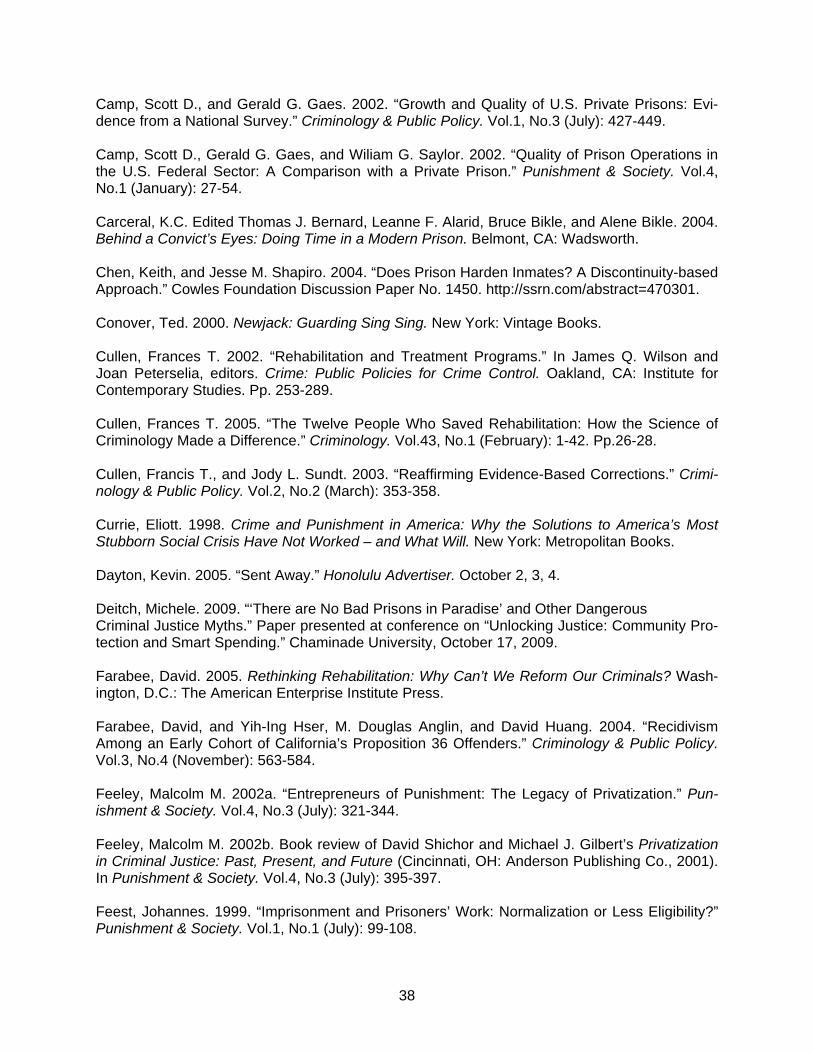
38
Camp, Scott D., and Gerald G. Gaes. 2002. “Growth and Quality of U.S. Private Prisons: Evi-dence from a National Survey.” Criminology & Public Policy. Vol.1, No.3 (July): 427-449. Camp, Scott D., Gerald G. Gaes, and Wiliam G. Saylor. 2002. “Quality of Prison Operations in the U.S. Federal Sector: A Comparison with a Private Prison.” Punishment & Society. Vol.4, No.1 (January): 27-54. Carceral, K.C. Edited Thomas J. Bernard, Leanne F. Alarid, Bruce Bikle, and Alene Bikle. 2004. Behind a Convict’s Eyes: Doing Time in a Modern Prison. Belmont, CA: Wadsworth. Chen, Keith, and Jesse M. Shapiro. 2004. “Does Prison Harden Inmates? A Discontinuity-based Approach.” Cowles Foundation Discussion Paper No. 1450. http://ssrn.com/abstract=470301. Conover, Ted. 2000. Newjack: Guarding Sing Sing. New York: Vintage Books. Cullen, Frances T. 2002. “Rehabilitation and Treatment Programs.” In James Q. Wilson and Joan Peterselia, editors. Crime: Public Policies for Crime Control. Oakland, CA: Institute for Contemporary Studies. Pp. 253-289. Cullen, Frances T. 2005. “The Twelve People Who Saved Rehabilitation: How the Science of Criminology Made a Difference.” Criminology. Vol.43, No.1 (February): 1-42. Pp.26-28. Cullen, Francis T., and Jody L. Sundt. 2003. “Reaffirming Evidence-Based Corrections.” Crimi-nology & Public Policy. Vol.2, No.2 (March): 353-358. Currie, Eliott. 1998. Crime and Punishment in America: Why the Solutions to America’s Most Stubborn Social Crisis Have Not Worked – and What Will. New York: Metropolitan Books. Dayton, Kevin. 2005. “Sent Away.” Honolulu Advertiser. October 2, 3, 4. Deitch, Michele. 2009. “‘There are No Bad Prisons in Paradise’ and Other Dangerous Criminal Justice Myths.” Paper presented at conference on “Unlocking Justice: Community Pro-tection and Smart Spending.” Chaminade University, October 17, 2009. Farabee, David. 2005. Rethinking Rehabilitation: Why Can’t We Reform Our Criminals? Wash-ington, D.C.: The American Enterprise Institute Press. Farabee, David, and Yih-Ing Hser, M. Douglas Anglin, and David Huang. 2004. “Recidivism Among an Early Cohort of California’s Proposition 36 Offenders.” Criminology & Public Policy. Vol.3, No.4 (November): 563-584. Feeley, Malcolm M. 2002a. “Entrepreneurs of Punishment: The Legacy of Privatization.” Pun-ishment & Society. Vol.4, No.3 (July): 321-344. Feeley, Malcolm M. 2002b. Book review of David Shichor and Michael J. Gilbert’s Privatization in Criminal Justice: Past, Present, and Future (Cincinnati, OH: Anderson Publishing Co., 2001). In Punishment & Society. Vol.4, No.3 (July): 395-397. Feest, Johannes. 1999. “Imprisonment and Prisoners’ Work: Normalization or Less Eligibility?” Punishment & Society. Vol.1, No.1 (July): 99-108.
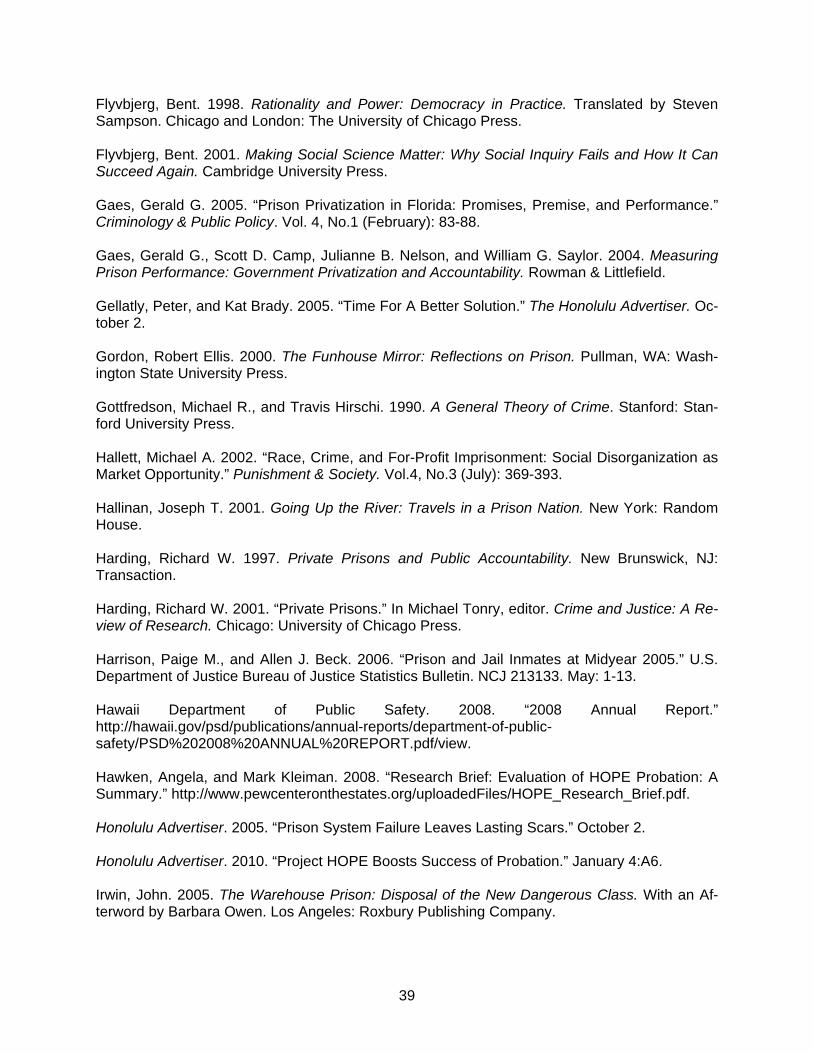
39
Flyvbjerg, Bent. 1998. Rationality and Power: Democracy in Practice. Translated by Steven Sampson. Chicago and London: The University of Chicago Press. Flyvbjerg, Bent. 2001. Making Social Science Matter: Why Social Inquiry Fails and How It Can Succeed Again. Cambridge University Press. Gaes, Gerald G. 2005. “Prison Privatization in Florida: Promises, Premise, and Performance.” Criminology & Public Policy. Vol. 4, No.1 (February): 83-88. Gaes, Gerald G., Scott D. Camp, Julianne B. Nelson, and William G. Saylor. 2004. Measuring Prison Performance: Government Privatization and Accountability. Rowman & Littlefield. Gellatly, Peter, and Kat Brady. 2005. “Time For A Better Solution.” The Honolulu Advertiser. Oc-tober 2. Gordon, Robert Ellis. 2000. The Funhouse Mirror: Reflections on Prison. Pullman, WA: Wash-ington State University Press. Gottfredson, Michael R., and Travis Hirschi. 1990. A General Theory of Crime. Stanford: Stan-ford University Press. Hallett, Michael A. 2002. “Race, Crime, and For-Profit Imprisonment: Social Disorganization as Market Opportunity.” Punishment & Society. Vol.4, No.3 (July): 369-393. Hallinan, Joseph T. 2001. Going Up the River: Travels in a Prison Nation. New York: Random House. Harding, Richard W. 1997. Private Prisons and Public Accountability. New Brunswick, NJ: Transaction. Harding, Richard W. 2001. “Private Prisons.” In Michael Tonry, editor. Crime and Justice: A Re-view of Research. Chicago: University of Chicago Press. Harrison, Paige M., and Allen J. Beck. 2006. “Prison and Jail Inmates at Midyear 2005.” U.S. Department of Justice Bureau of Justice Statistics Bulletin. NCJ 213133. May: 1-13. Hawaii Department of Public Safety. 2008. “2008 Annual Report.” http://hawaii.gov/psd/publications/annual-reports/department-of-public-safety/PSD%202008%20ANNUAL%20REPORT.pdf/view. Hawken, Angela, and Mark Kleiman. 2008. “Research Brief: Evaluation of HOPE Probation: A Summary.” http://www.pewcenteronthestates.org/uploadedFiles/HOPE_Research_Brief.pdf. Honolulu Advertiser. 2005. “Prison System Failure Leaves Lasting Scars.” October 2. Honolulu Advertiser. 2010. “Project HOPE Boosts Success of Probation.” January 4:A6. Irwin, John. 2005. The Warehouse Prison: Disposal of the New Dangerous Class. With an Af-terword by Barbara Owen. Los Angeles: Roxbury Publishing Company.
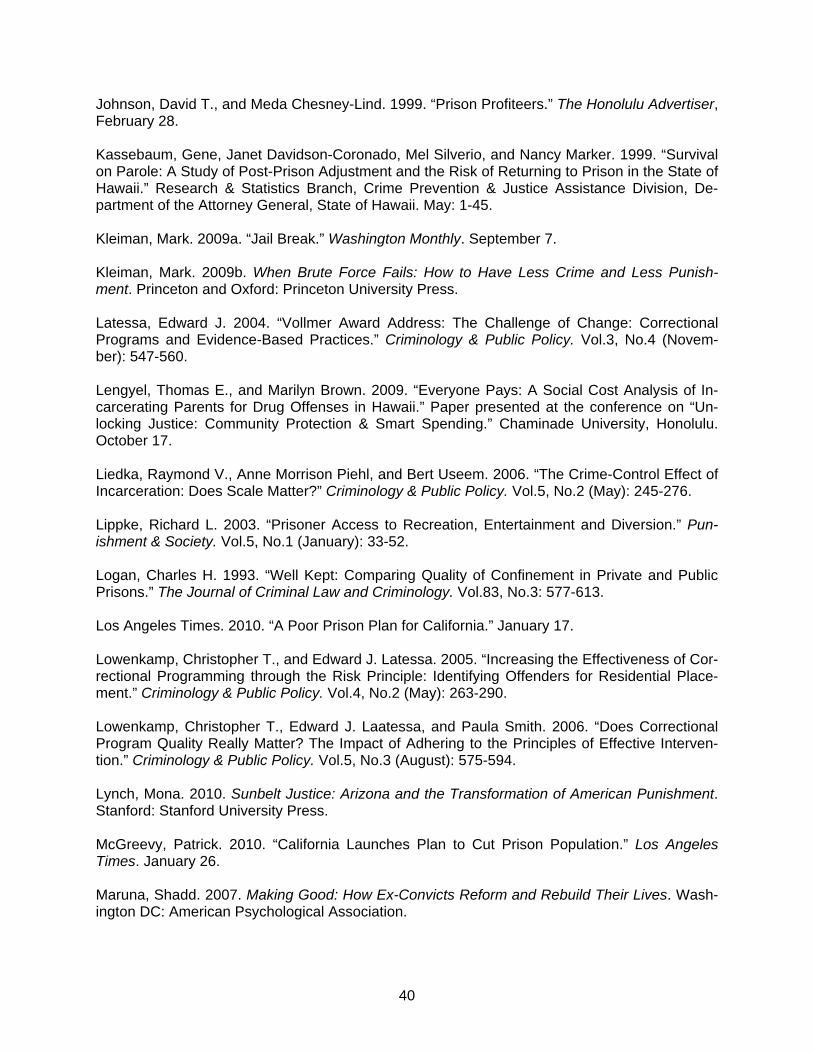
40
Johnson, David T., and Meda Chesney-Lind. 1999. “Prison Profiteers.” The Honolulu Advertiser, February 28. Kassebaum, Gene, Janet Davidson-Coronado, Mel Silverio, and Nancy Marker. 1999. “Survival on Parole: A Study of Post-Prison Adjustment and the Risk of Returning to Prison in the State of Hawaii.” Research & Statistics Branch, Crime Prevention & Justice Assistance Division, De-partment of the Attorney General, State of Hawaii. May: 1-45. Kleiman, Mark. 2009a. “Jail Break.” Washington Monthly. September 7. Kleiman, Mark. 2009b. When Brute Force Fails: How to Have Less Crime and Less Punish-ment. Princeton and Oxford: Princeton University Press. Latessa, Edward J. 2004. “Vollmer Award Address: The Challenge of Change: Correctional Programs and Evidence-Based Practices.” Criminology & Public Policy. Vol.3, No.4 (Novem-ber): 547-560. Lengyel, Thomas E., and Marilyn Brown. 2009. “Everyone Pays: A Social Cost Analysis of In-carcerating Parents for Drug Offenses in Hawaii.” Paper presented at the conference on “Un-locking Justice: Community Protection & Smart Spending.” Chaminade University, Honolulu. October 17. Liedka, Raymond V., Anne Morrison Piehl, and Bert Useem. 2006. “The Crime-Control Effect of Incarceration: Does Scale Matter?” Criminology & Public Policy. Vol.5, No.2 (May): 245-276. Lippke, Richard L. 2003. “Prisoner Access to Recreation, Entertainment and Diversion.” Pun-ishment & Society. Vol.5, No.1 (January): 33-52. Logan, Charles H. 1993. “Well Kept: Comparing Quality of Confinement in Private and Public Prisons.” The Journal of Criminal Law and Criminology. Vol.83, No.3: 577-613. Los Angeles Times. 2010. “A Poor Prison Plan for California.” January 17. Lowenkamp, Christopher T., and Edward J. Latessa. 2005. “Increasing the Effectiveness of Cor-rectional Programming through the Risk Principle: Identifying Offenders for Residential Place-ment.” Criminology & Public Policy. Vol.4, No.2 (May): 263-290. Lowenkamp, Christopher T., Edward J. Laatessa, and Paula Smith. 2006. “Does Correctional Program Quality Really Matter? The Impact of Adhering to the Principles of Effective Interven-tion.” Criminology & Public Policy. Vol.5, No.3 (August): 575-594. Lynch, Mona. 2010. Sunbelt Justice: Arizona and the Transformation of American Punishment. Stanford: Stanford University Press. McGreevy, Patrick. 2010. “California Launches Plan to Cut Prison Population.” Los Angeles Times. January 26. Maruna, Shadd. 2007. Making Good: How Ex-Convicts Reform and Rebuild Their Lives. Wash-ington DC: American Psychological Association.
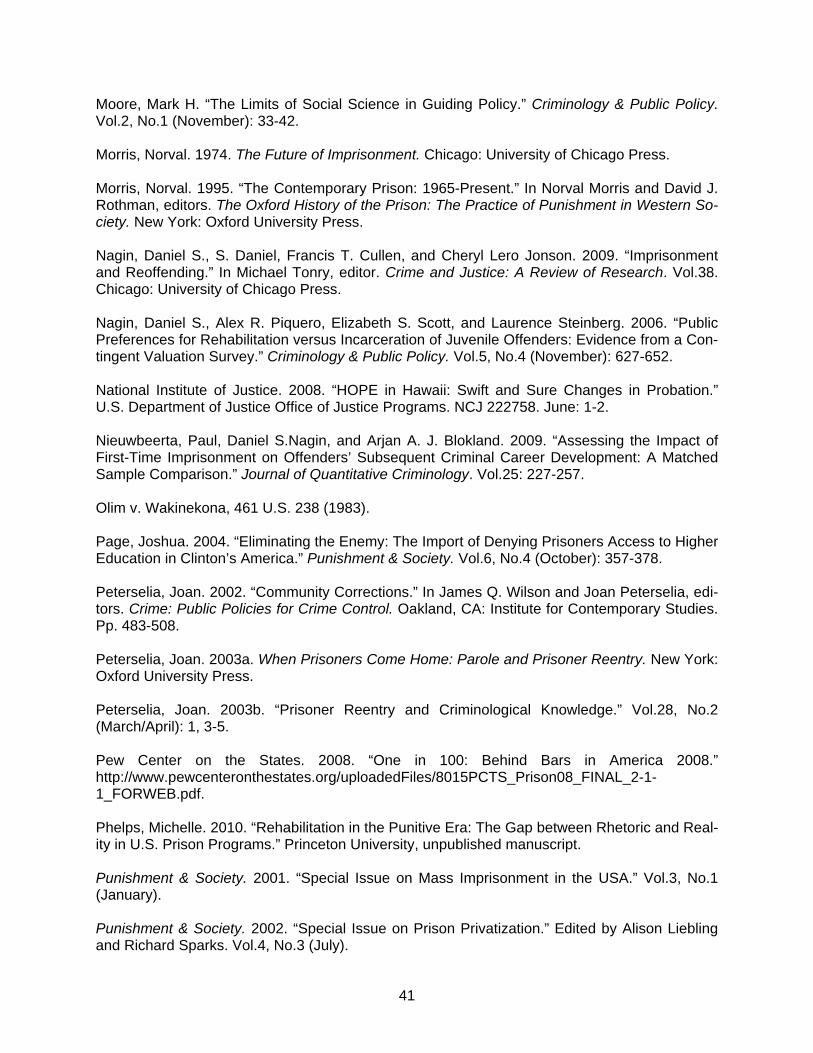
41
Moore, Mark H. “The Limits of Social Science in Guiding Policy.” Criminology & Public Policy. Vol.2, No.1 (November): 33-42. Morris, Norval. 1974. The Future of Imprisonment. Chicago: University of Chicago Press. Morris, Norval. 1995. “The Contemporary Prison: 1965-Present.” In Norval Morris and David J. Rothman, editors. The Oxford History of the Prison: The Practice of Punishment in Western So-ciety. New York: Oxford University Press. Nagin, Daniel S., S. Daniel, Francis T. Cullen, and Cheryl Lero Jonson. 2009. “Imprisonment and Reoffending.” In Michael Tonry, editor. Crime and Justice: A Review of Research. Vol.38. Chicago: University of Chicago Press. Nagin, Daniel S., Alex R. Piquero, Elizabeth S. Scott, and Laurence Steinberg. 2006. “Public Preferences for Rehabilitation versus Incarceration of Juvenile Offenders: Evidence from a Con-tingent Valuation Survey.” Criminology & Public Policy. Vol.5, No.4 (November): 627-652. National Institute of Justice. 2008. “HOPE in Hawaii: Swift and Sure Changes in Probation.” U.S. Department of Justice Office of Justice Programs. NCJ 222758. June: 1-2. Nieuwbeerta, Paul, Daniel S.Nagin, and Arjan A. J. Blokland. 2009. “Assessing the Impact of First-Time Imprisonment on Offenders’ Subsequent Criminal Career Development: A Matched Sample Comparison.” Journal of Quantitative Criminology. Vol.25: 227-257. Olim v. Wakinekona, 461 U.S. 238 (1983). Page, Joshua. 2004. “Eliminating the Enemy: The Import of Denying Prisoners Access to Higher Education in Clinton’s America.” Punishment & Society. Vol.6, No.4 (October): 357-378. Peterselia, Joan. 2002. “Community Corrections.” In James Q. Wilson and Joan Peterselia, edi-tors. Crime: Public Policies for Crime Control. Oakland, CA: Institute for Contemporary Studies. Pp. 483-508. Peterselia, Joan. 2003a. When Prisoners Come Home: Parole and Prisoner Reentry. New York: Oxford University Press. Peterselia, Joan. 2003b. “Prisoner Reentry and Criminological Knowledge.” Vol.28, No.2 (March/April): 1, 3-5. Pew Center on the States. 2008. “One in 100: Behind Bars in America 2008.” http://www.pewcenteronthestates.org/uploadedFiles/8015PCTS_Prison08_FINAL_2-1-1_FORWEB.pdf. Phelps, Michelle. 2010. “Rehabilitation in the Punitive Era: The Gap between Rhetoric and Real-ity in U.S. Prison Programs.” Princeton University, unpublished manuscript. Punishment & Society. 2001. “Special Issue on Mass Imprisonment in the USA.” Vol.3, No.1 (January). Punishment & Society. 2002. “Special Issue on Prison Privatization.” Edited by Alison Liebling and Richard Sparks. Vol.4, No.3 (July).
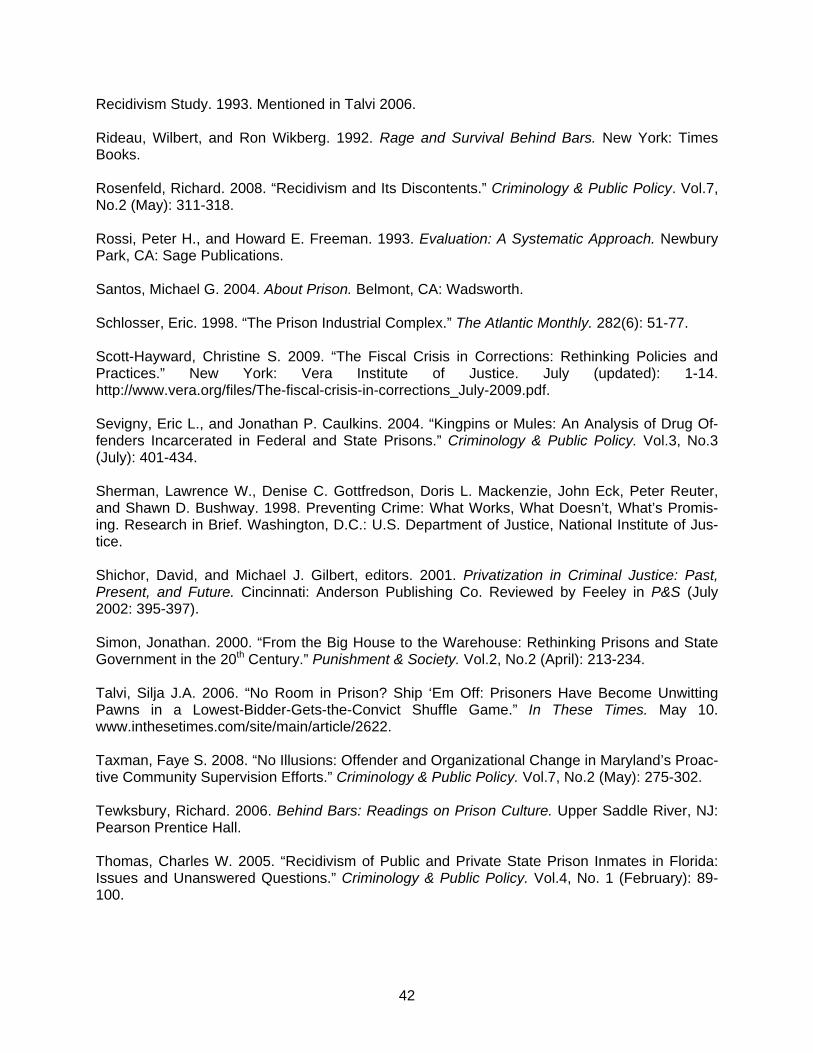
42
Recidivism Study. 1993. Mentioned in Talvi 2006. Rideau, Wilbert, and Ron Wikberg. 1992. Rage and Survival Behind Bars. New York: Times Books. Rosenfeld, Richard. 2008. “Recidivism and Its Discontents.” Criminology & Public Policy. Vol.7, No.2 (May): 311-318. Rossi, Peter H., and Howard E. Freeman. 1993. Evaluation: A Systematic Approach. Newbury Park, CA: Sage Publications. Santos, Michael G. 2004. About Prison. Belmont, CA: Wadsworth. Schlosser, Eric. 1998. “The Prison Industrial Complex.” The Atlantic Monthly. 282(6): 51-77. Scott-Hayward, Christine S. 2009. “The Fiscal Crisis in Corrections: Rethinking Policies and Practices.” New York: Vera Institute of Justice. July (updated): 1-14. http://www.vera.org/files/The-fiscal-crisis-in-corrections_July-2009.pdf. Sevigny, Eric L., and Jonathan P. Caulkins. 2004. “Kingpins or Mules: An Analysis of Drug Of-fenders Incarcerated in Federal and State Prisons.” Criminology & Public Policy. Vol.3, No.3 (July): 401-434. Sherman, Lawrence W., Denise C. Gottfredson, Doris L. Mackenzie, John Eck, Peter Reuter, and Shawn D. Bushway. 1998. Preventing Crime: What Works, What Doesn’t, What’s Promis-ing. Research in Brief. Washington, D.C.: U.S. Department of Justice, National Institute of Jus-tice. Shichor, David, and Michael J. Gilbert, editors. 2001. Privatization in Criminal Justice: Past, Present, and Future. Cincinnati: Anderson Publishing Co. Reviewed by Feeley in P&S (July 2002: 395-397). Simon, Jonathan. 2000. “From the Big House to the Warehouse: Rethinking Prisons and State Government in the 20th Century.” Punishment & Society. Vol.2, No.2 (April): 213-234. Talvi, Silja J.A. 2006. “No Room in Prison? Ship ‘Em Off: Prisoners Have Become Unwitting Pawns in a Lowest-Bidder-Gets-the-Convict Shuffle Game.” In These Times. May 10. www.inthesetimes.com/site/main/article/2622. Taxman, Faye S. 2008. “No Illusions: Offender and Organizational Change in Maryland’s Proac-tive Community Supervision Efforts.” Criminology & Public Policy. Vol.7, No.2 (May): 275-302. Tewksbury, Richard. 2006. Behind Bars: Readings on Prison Culture. Upper Saddle River, NJ: Pearson Prentice Hall. Thomas, Charles W. 2005. “Recidivism of Public and Private State Prison Inmates in Florida: Issues and Unanswered Questions.” Criminology & Public Policy. Vol.4, No. 1 (February): 89-100.
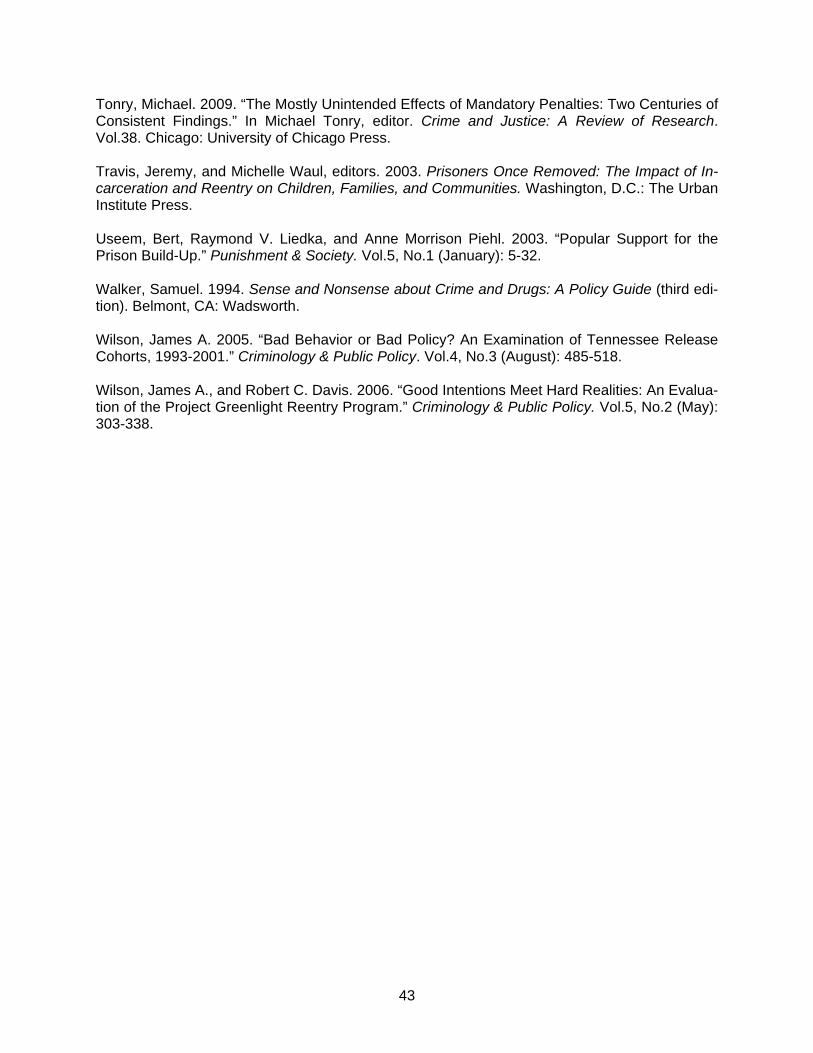
43
Tonry, Michael. 2009. “The Mostly Unintended Effects of Mandatory Penalties: Two Centuries of Consistent Findings.” In Michael Tonry, editor. Crime and Justice: A Review of Research. Vol.38. Chicago: University of Chicago Press. Travis, Jeremy, and Michelle Waul, editors. 2003. Prisoners Once Removed: The Impact of In-carceration and Reentry on Children, Families, and Communities. Washington, D.C.: The Urban Institute Press. Useem, Bert, Raymond V. Liedka, and Anne Morrison Piehl. 2003. “Popular Support for the Prison Build-Up.” Punishment & Society. Vol.5, No.1 (January): 5-32. Walker, Samuel. 1994. Sense and Nonsense about Crime and Drugs: A Policy Guide (third edi-tion). Belmont, CA: Wadsworth. Wilson, James A. 2005. “Bad Behavior or Bad Policy? An Examination of Tennessee Release Cohorts, 1993-2001.” Criminology & Public Policy. Vol.4, No.3 (August): 485-518. Wilson, James A., and Robert C. Davis. 2006. “Good Intentions Meet Hard Realities: An Evalua-tion of the Project Greenlight Reentry Program.” Criminology & Public Policy. Vol.5, No.2 (May): 303-338.

44

In accordance with the Americans with Disabilities Act, P.L. 101-336, this material is available in an altered format, upon request. If you require an altered format, please call the Department of the Attorney General, Crime Prevention and Justice Assistance Division, at (808) 586-1150.