Embed Size (px)
Citation preview
©2014 MFMER | slide-1 ©2014 MFMER | slide-1
Healthcare Reform and Hematology The Value of a Laboratory & Pathology Utilization
Program
Curtis A. Hanson, M.D.
©2014 MFMER | slide-2
DISCLOSURES:
Relevant Financial Relationship(s) None
Off Label Usage
None
©2014 MFMER | slide-3
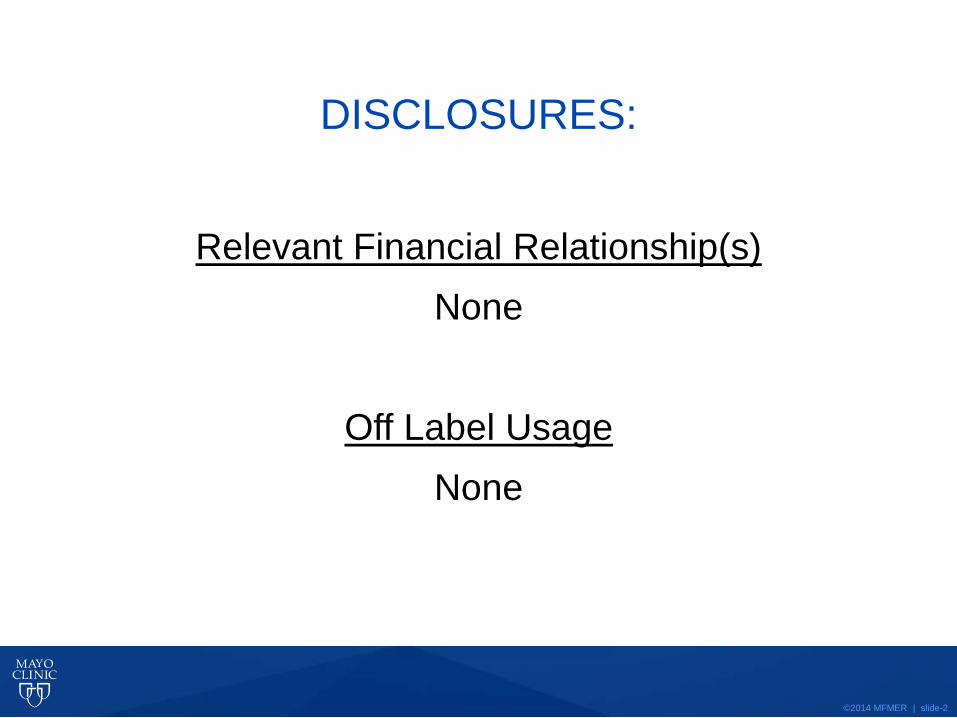
Laboratory Test Utilization Definition • A strategy for performing appropriate laboratory
and pathology testing with the goal of providing high-quality, cost-effective patient care
• Laboratory tests in the USA, including pathology: • $60 - $70 billion; ∼4% of healthcare costs • Conventional wisdom is that 20 to 40% of laboratory
testing is unnecessary • 20-25% increase annually in molecular/genetics • Molecular / Genetics is 15% of laboratory costs;
anticipated to reach 25% soon • Largest growth: proprietary tests, genetic tests, and
test bundling
©2014 MFMER | slide-4
“Medicine is a science of uncertainty and an art of probability.”
Dr. William Osler (1849 – 1919)
“Information is the resolution of uncertainty.”
Dr. Claude Shannon (1916 – 2001)
©2014 MFMER | slide-5
The Philosophical Challenge with Clinical Laboratory Utilization • How can we help our clinicians deal with the reality of
“uncertainty” with laboratory and pathology testing?
• Medicine is all about being comfortable with degrees of uncertainty
• You can never get to “zero” uncertainty
• There is always “one more test” you can do – “one more disease” to rule out
• We must use our clinical and laboratory knowledge to help lower the anxiety of uncertainty
• Remember: Data and information are our friends and evidence is our trump card
©2014 MFMER | slide-6
The Practical Challenge with Laboratory Utilization • It is critical for pathologists and laboratorians to understand
the clinical problem. Pathologists have to be clinicians!
• Deep knowledge of diseases and awareness of clinical issues in addition to analytical/laboratory management expertise is a “must have” in today’s laboratory world.
• We must change the question that comes from our clinicians:
• Do you do test XYZ? No!
• Can you help me solve this clinical problem? Yes!
©2014 MFMER | slide-7
How does utilization fit into our
current healthcare environment?
©2014 MFMER | slide-8
Healthcare Delivery is Changing • More and more primary care is being performed by non-
physicians in non-traditional settings – which can offer superior IT, access and location.
• Employer / Insurer Market Transformation – examples • High Deductible Plans paired w/ HSA • Public Exchanges • Direct Contracting between employers and providers • Private Exchanges
7,600+ locations 4,700+ locations 8,600+ locations
©2014 MFMER | slide-9
“UnitedHealth, doctors study way to lower cancer treatment costs”
• “In a study, per-patient lump payments to doctors and better monitoring led to a reduction in the price tag for treatments. The costs of cancer care fell 34 percent in a study in which UnitedHealth Group Inc. paid doctors a lump sum to treat each patient rather than for each drug or service the doctors provided.”
• 810 patients with breast, lung and colon cancer were treated. Drug markups were eliminated and replaced with flat, per-patient fees that varied for each type and stage of cancer.
• Five medical groups using the per-patient payments spent $64.8 million over the three-year study, compared with estimated costs of $98.1 million under the per-treatment payments – ~$40,000 per patient.
• Chemotherapy costs for patients increased during the study. Other costs, such as for hospitalization or therapeutic radiology, went down.
• UnitedHealth gave doctors information on their spending and the use of certain procedures, as well as how often patients were hospitalized.
• Star and Tribune (Minneapolis): July 14, 2014 • Journal of Oncology Practice: May 2014; 10(3): 187-189
©2014 MFMER | slide-10
Do we have utilization issues in
medicine – including hematology?
©2014 MFMER | slide-11
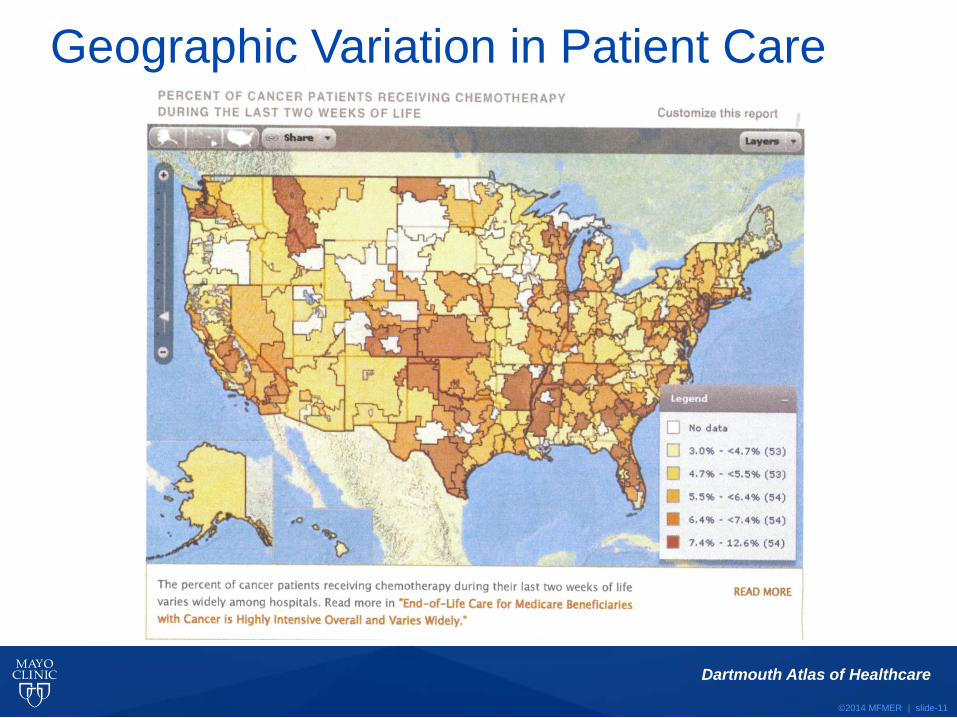
Dartmouth Atlas of Healthcare
Geographic Variation in Patient Care
©2014 MFMER | slide-12
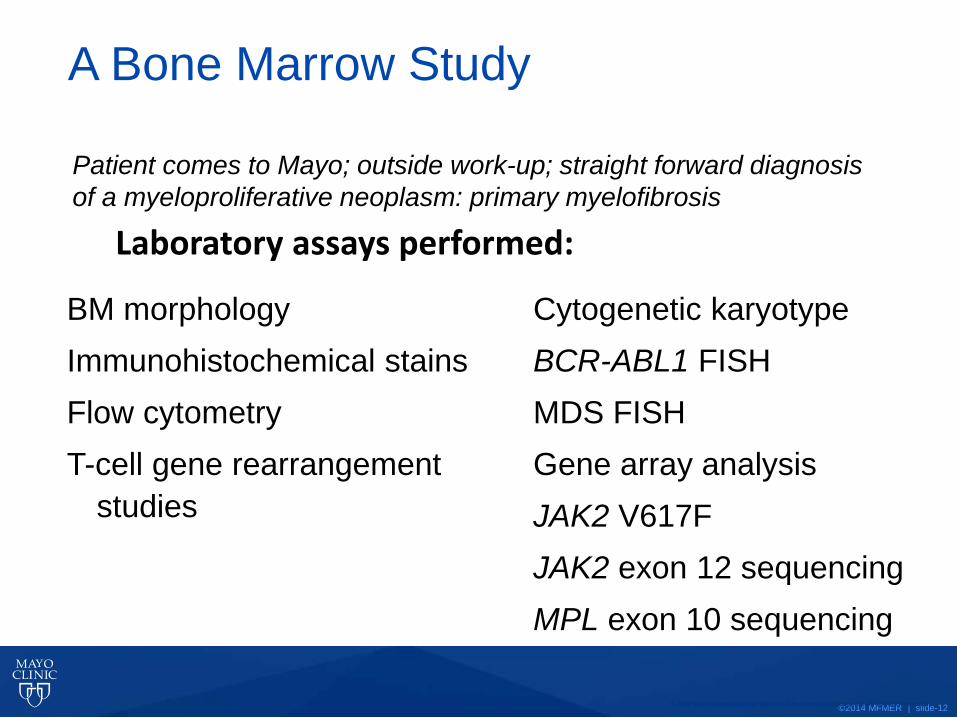
A Bone Marrow Study
BM morphology Immunohistochemical stains Flow cytometry T-cell gene rearrangement
studies
Cytogenetic karyotype BCR-ABL1 FISH MDS FISH Gene array analysis JAK2 V617F JAK2 exon 12 sequencing MPL exon 10 sequencing
Laboratory assays performed:
Patient comes to Mayo; outside work-up; straight forward diagnosis of a myeloproliferative neoplasm: primary myelofibrosis
© 2010 Mayo Foundation for Medical Education and Research. All Rights Reserved.
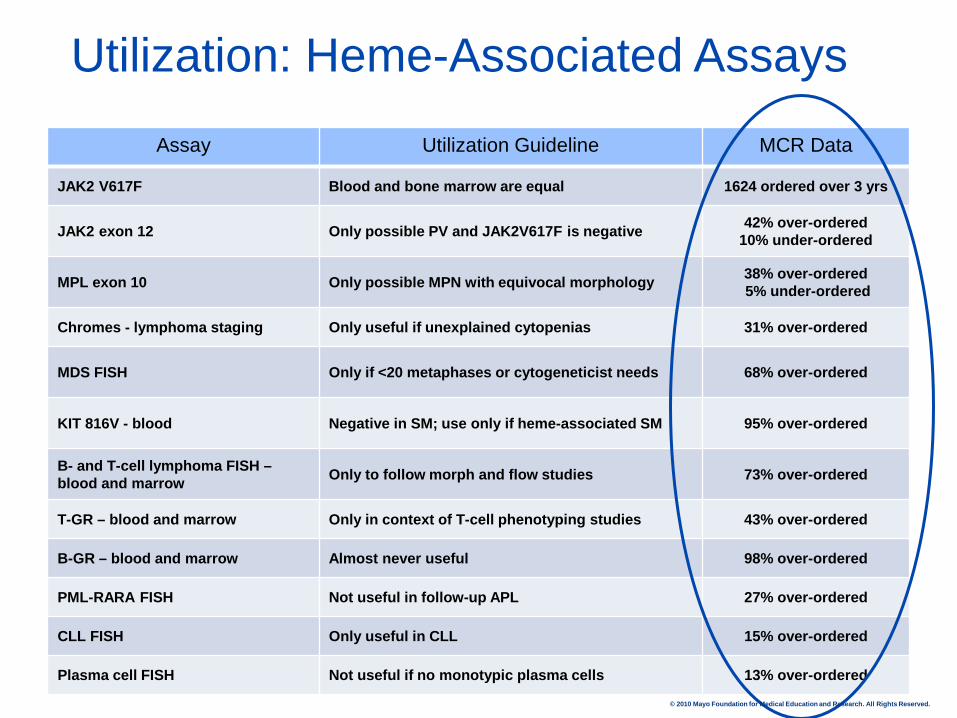
Utilization: Heme-Associated Assays
Assay Utilization Guideline MCR Data
JAK2 V617F Blood and bone marrow are equal 1624 ordered over 3 yrs
JAK2 exon 12 Only possible PV and JAK2V617F is negative 42% over-ordered 10% under-ordered
MPL exon 10 Only possible MPN with equivocal morphology 38% over-ordered 5% under-ordered
Chromes - lymphoma staging Only useful if unexplained cytopenias 31% over-ordered
MDS FISH Only if <20 metaphases or cytogeneticist needs 68% over-ordered
KIT 816V - blood Negative in SM; use only if heme-associated SM 95% over-ordered
B- and T-cell lymphoma FISH – blood and marrow Only to follow morph and flow studies 73% over-ordered
T-GR – blood and marrow Only in context of T-cell phenotyping studies 43% over-ordered
B-GR – blood and marrow Almost never useful 98% over-ordered
PML-RARA FISH Not useful in follow-up APL 27% over-ordered
CLL FISH Only useful in CLL 15% over-ordered
Plasma cell FISH Not useful if no monotypic plasma cells 13% over-ordered
© 2010 Mayo Foundation for Medical Education and Research. All Rights Reserved.
©2014 MFMER | slide-14
Why do we have laboratory
utilization issues?
©2014 MFMER | slide-15
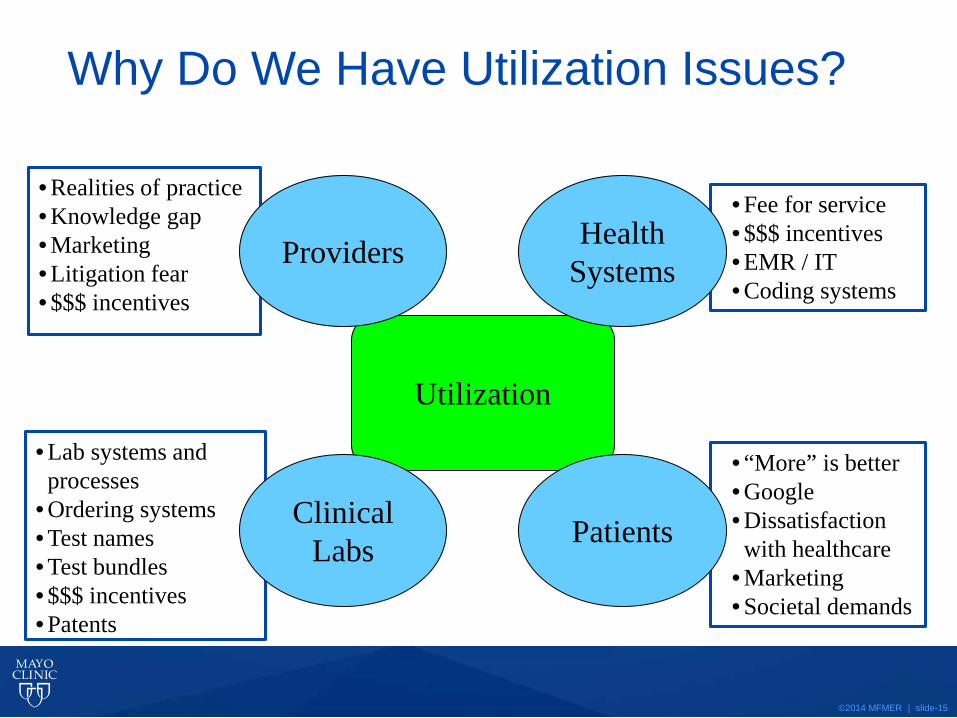
• Realities of practice • Knowledge gap • Marketing • Litigation fear • $$$ incentives
• Fee for service • $$$ incentives • EMR / IT • Coding systems
• Lab systems and processes
• Ordering systems • Test names • Test bundles • $$$ incentives • Patents
• “More” is better • Google • Dissatisfaction with healthcare
• Marketing • Societal demands
Utilization
Why Do We Have Utilization Issues?
Providers
Clinical Labs Patients
Health Systems
©2014 MFMER | slide-16
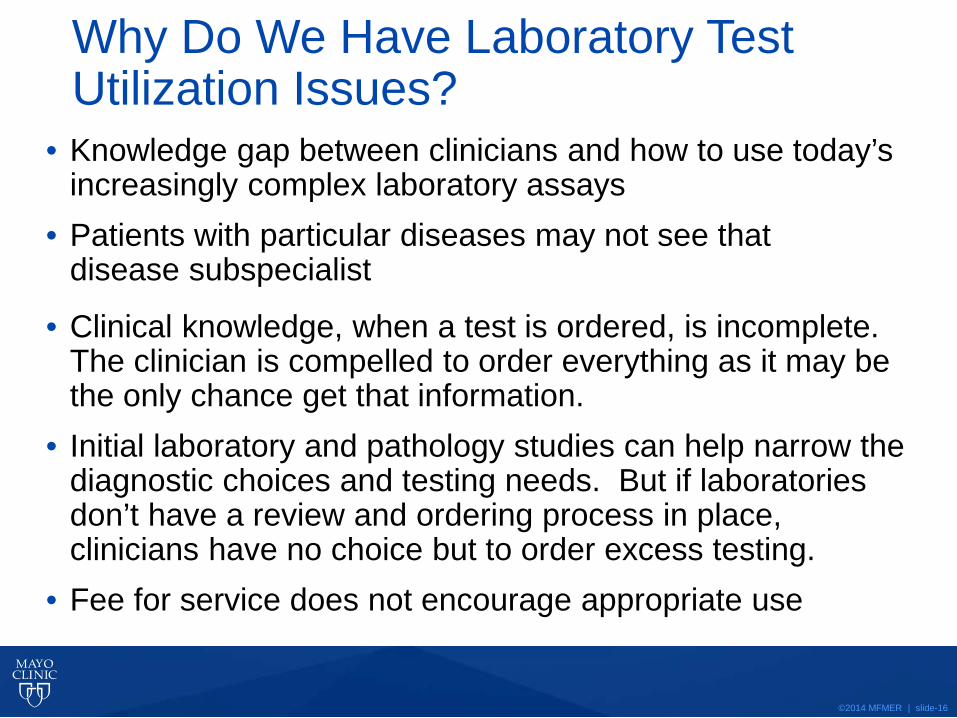
Why Do We Have Laboratory Test Utilization Issues?
• Knowledge gap between clinicians and how to use today’s increasingly complex laboratory assays
• Patients with particular diseases may not see that disease subspecialist
• Clinical knowledge, when a test is ordered, is incomplete. The clinician is compelled to order everything as it may be the only chance get that information.
• Initial laboratory and pathology studies can help narrow the diagnostic choices and testing needs. But if laboratories don’t have a review and ordering process in place, clinicians have no choice but to order excess testing.
• Fee for service does not encourage appropriate use
©2014 MFMER | slide-17
How do we address laboratory
utilization issues?
©2014 MFMER | slide-18
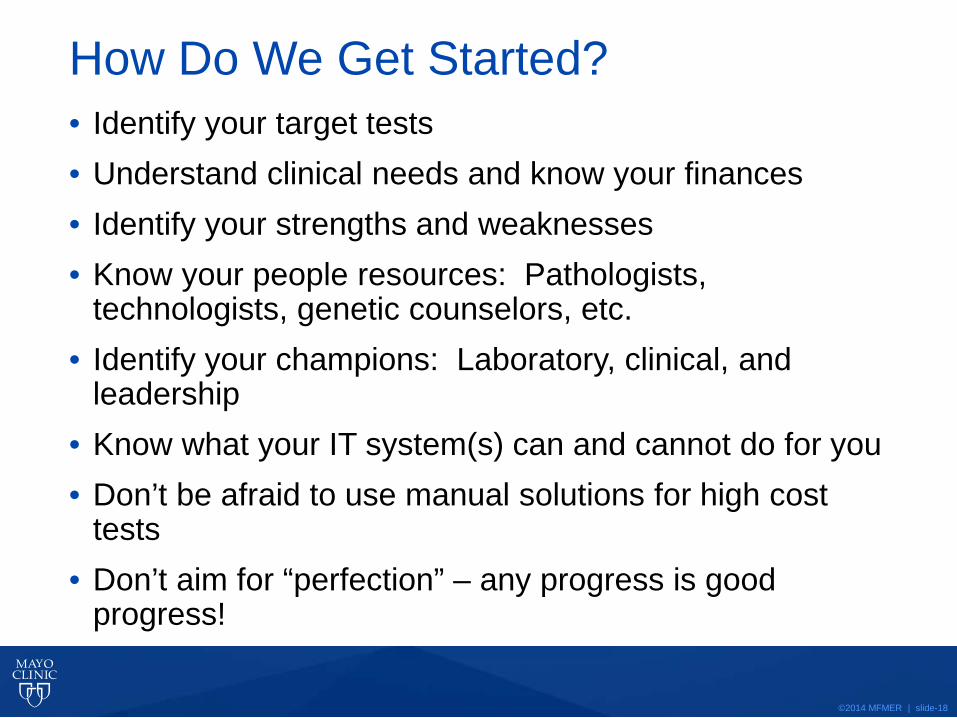
How Do We Get Started? • Identify your target tests • Understand clinical needs and know your finances • Identify your strengths and weaknesses • Know your people resources: Pathologists,
technologists, genetic counselors, etc. • Identify your champions: Laboratory, clinical, and
leadership • Know what your IT system(s) can and cannot do for you • Don’t be afraid to use manual solutions for high cost
tests • Don’t aim for “perfection” – any progress is good
progress!
©2014 MFMER | slide-19
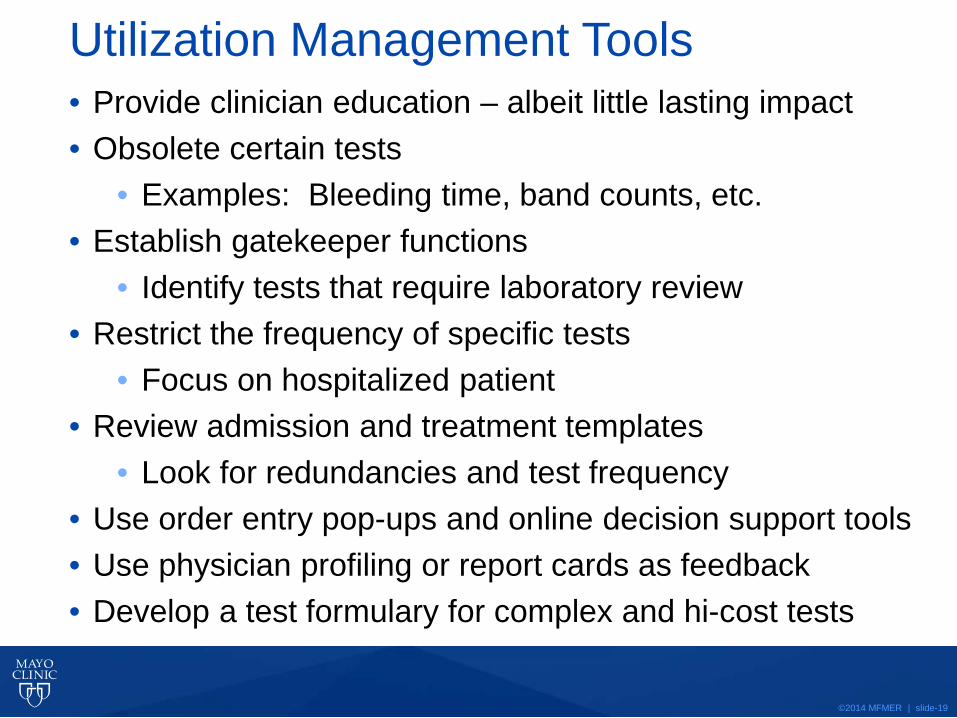
Utilization Management Tools • Provide clinician education – albeit little lasting impact • Obsolete certain tests
• Examples: Bleeding time, band counts, etc. • Establish gatekeeper functions
• Identify tests that require laboratory review • Restrict the frequency of specific tests
• Focus on hospitalized patient • Review admission and treatment templates
• Look for redundancies and test frequency • Use order entry pop-ups and online decision support tools • Use physician profiling or report cards as feedback • Develop a test formulary for complex and hi-cost tests
©2014 MFMER | slide-20
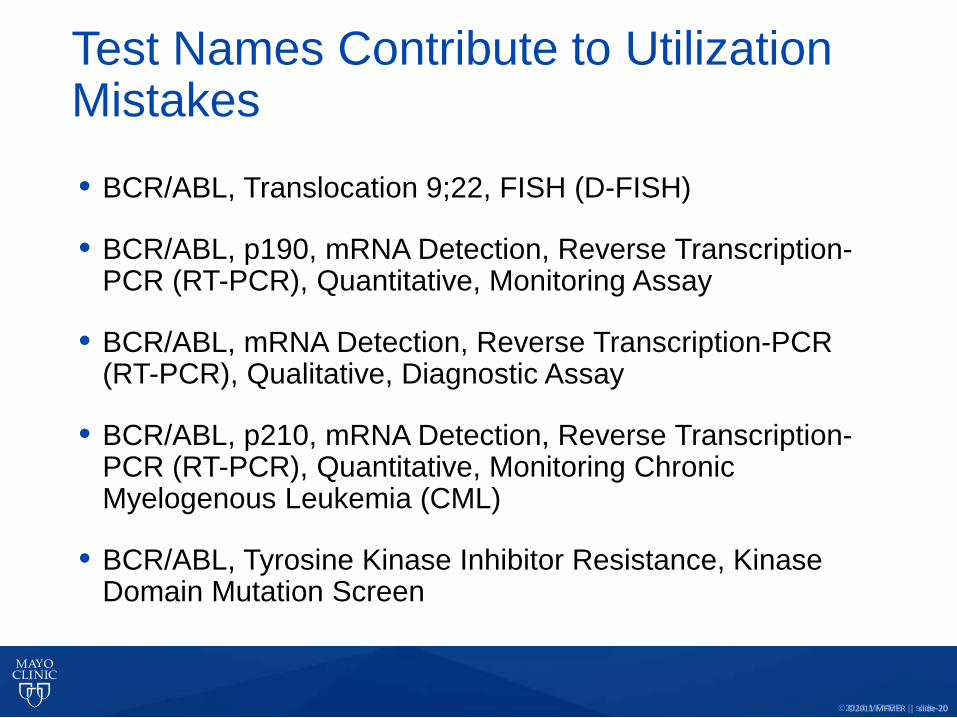
Test Names Contribute to Utilization Mistakes
• BCR/ABL, Translocation 9;22, FISH (D-FISH)
• BCR/ABL, p190, mRNA Detection, Reverse Transcription-PCR (RT-PCR), Quantitative, Monitoring Assay
• BCR/ABL, mRNA Detection, Reverse Transcription-PCR (RT-PCR), Qualitative, Diagnostic Assay
• BCR/ABL, p210, mRNA Detection, Reverse Transcription-PCR (RT-PCR), Quantitative, Monitoring Chronic Myelogenous Leukemia (CML)
• BCR/ABL, Tyrosine Kinase Inhibitor Resistance, Kinase Domain Mutation Screen
©2011 MFMER | slide-20
©2014 MFMER | slide-21
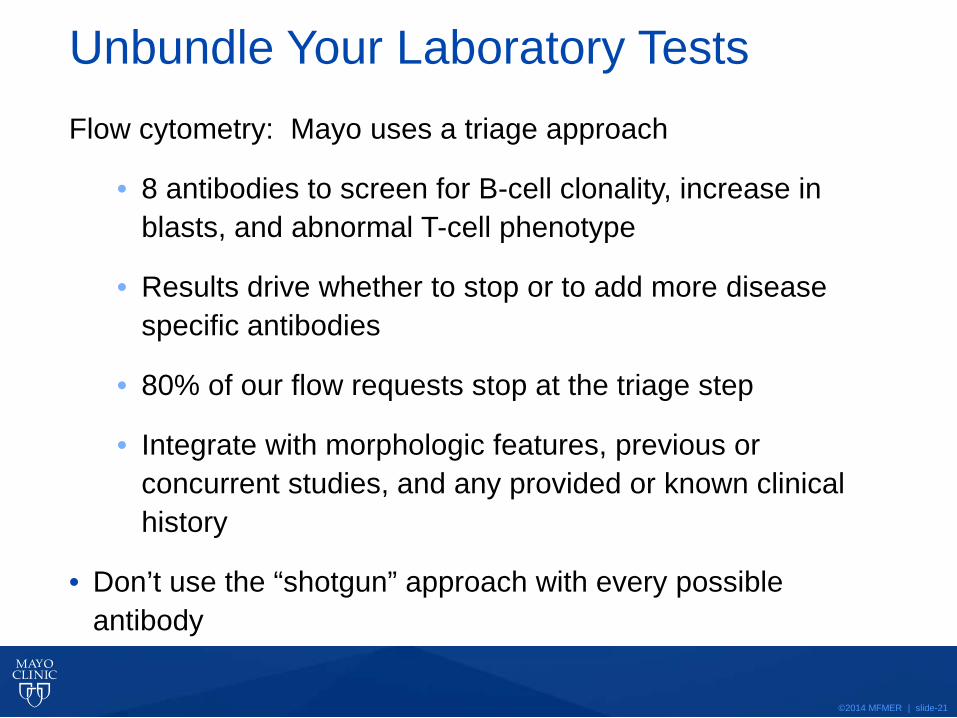
Unbundle Your Laboratory Tests Flow cytometry: Mayo uses a triage approach
• 8 antibodies to screen for B-cell clonality, increase in blasts, and abnormal T-cell phenotype
• Results drive whether to stop or to add more disease specific antibodies
• 80% of our flow requests stop at the triage step
• Integrate with morphologic features, previous or concurrent studies, and any provided or known clinical history
• Don’t use the “shotgun” approach with every possible antibody
©2014 MFMER | slide-22
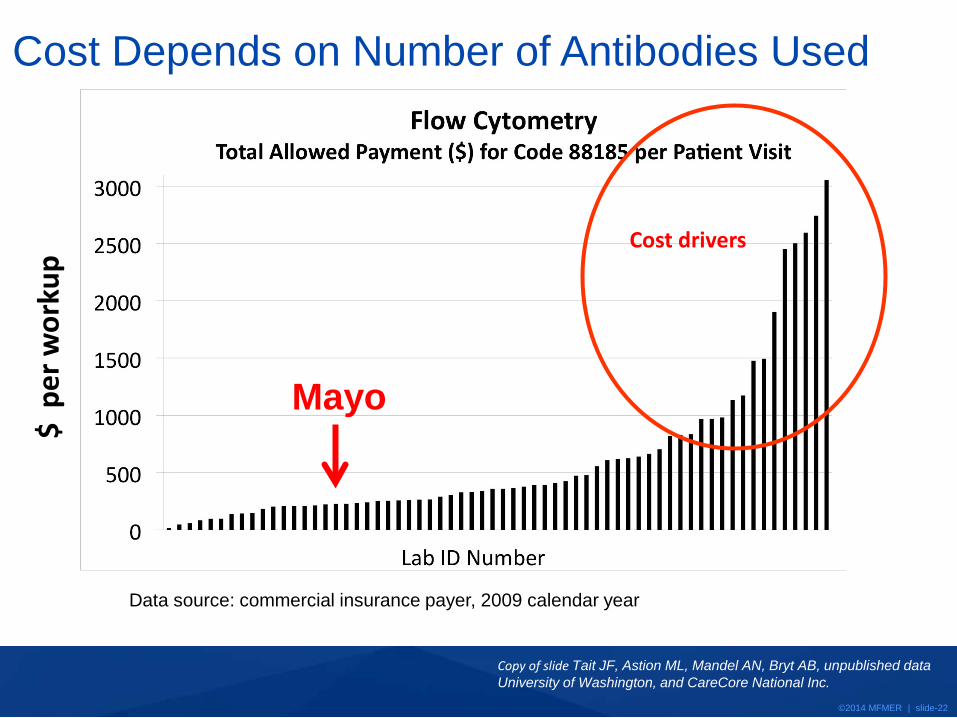
Data source: commercial insurance payer, 2009 calendar year
Cost Depends on Number of Antibodies Used
Cost drivers
$ p
er w
orku
p
Copy of slide Tait JF, Astion ML, Mandel AN, Bryt AB, unpublished data University of Washington, and CareCore National Inc.
Mayo
©2014 MFMER | slide-23
Send-and-Hold Process
• Offer “Send-and-Hold” tests to be sure that the right
specimens get drawn, but requests are then reviewed
in the lab or driven by initial test results
• Be clear that labs and clinicians know how long a
specimen will be held (i.e., validated) for those cases
in which an incorrect decision gets made
• Build systems that allow for sequential testing as part
of an algorithmic process

©2014 MFMER | slide-24
Send-and-Hold Examples • Flow cytometry in a lymphoma staging
• Wait for bone marrow morphology
• Cytogenetics in a lymphoma staging
• Wait for bone marrow morphology
• T-cell gene rearrangements for cytopenia
• Wait for flow cytometry results
• AML molecular prognostics (cytogenetic negative)
• Wait for cytogenetic results
• Plasma cell FISH in a MGUS evaluation
• Wait for flow cytometry results
©2014 MFMER | slide-25
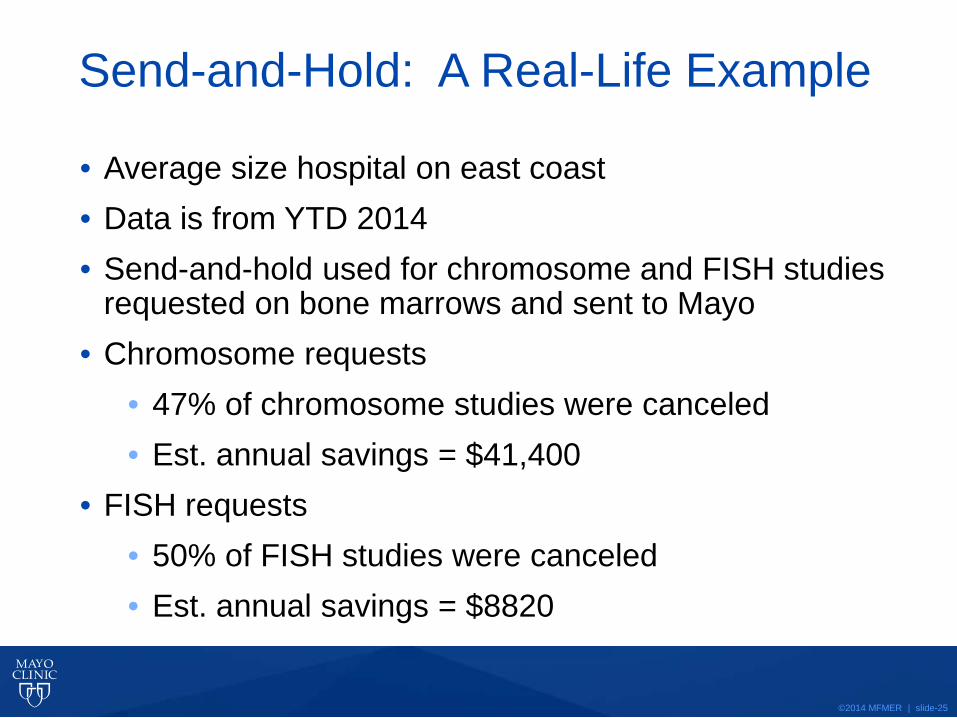
Send-and-Hold: A Real-Life Example
• Average size hospital on east coast • Data is from YTD 2014 • Send-and-hold used for chromosome and FISH studies
requested on bone marrows and sent to Mayo • Chromosome requests
• 47% of chromosome studies were canceled • Est. annual savings = $41,400
• FISH requests • 50% of FISH studies were canceled • Est. annual savings = $8820
©2014 MFMER | slide-26
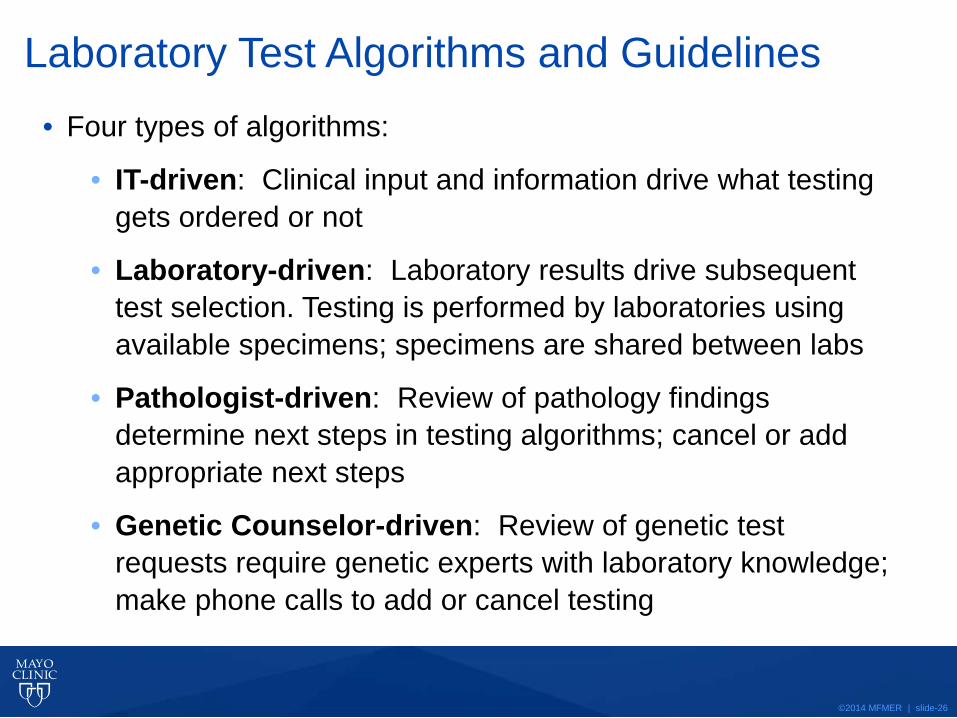
Laboratory Test Algorithms and Guidelines • Four types of algorithms:
• IT-driven: Clinical input and information drive what testing gets ordered or not
• Laboratory-driven: Laboratory results drive subsequent test selection. Testing is performed by laboratories using available specimens; specimens are shared between labs
• Pathologist-driven: Review of pathology findings determine next steps in testing algorithms; cancel or add appropriate next steps
• Genetic Counselor-driven: Review of genetic test requests require genetic experts with laboratory knowledge; make phone calls to add or cancel testing
©2014 MFMER | slide-27
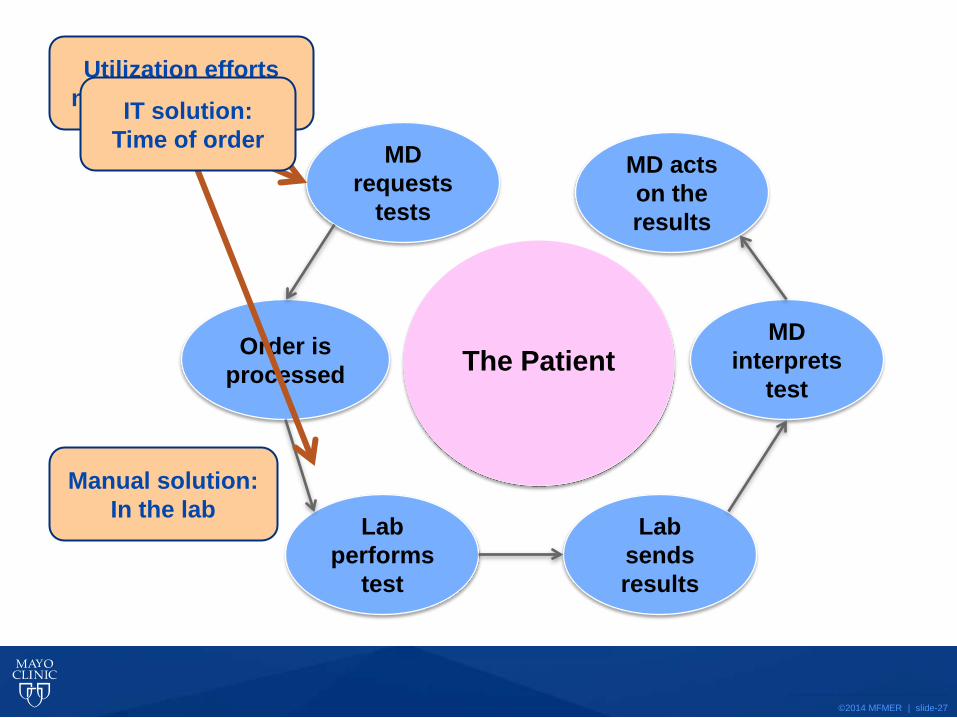
Order is processed
Lab performs
test
Lab sends results
MD interprets
test
MD acts on the results
MD requests
tests
The Patient
© 2010 Mayo Foundation for Medical Education and Research. All Rights Reserved.
Utilization efforts need to focus here! IT solution:
Time of order
Manual solution: In the lab
©2014 MFMER | slide-28
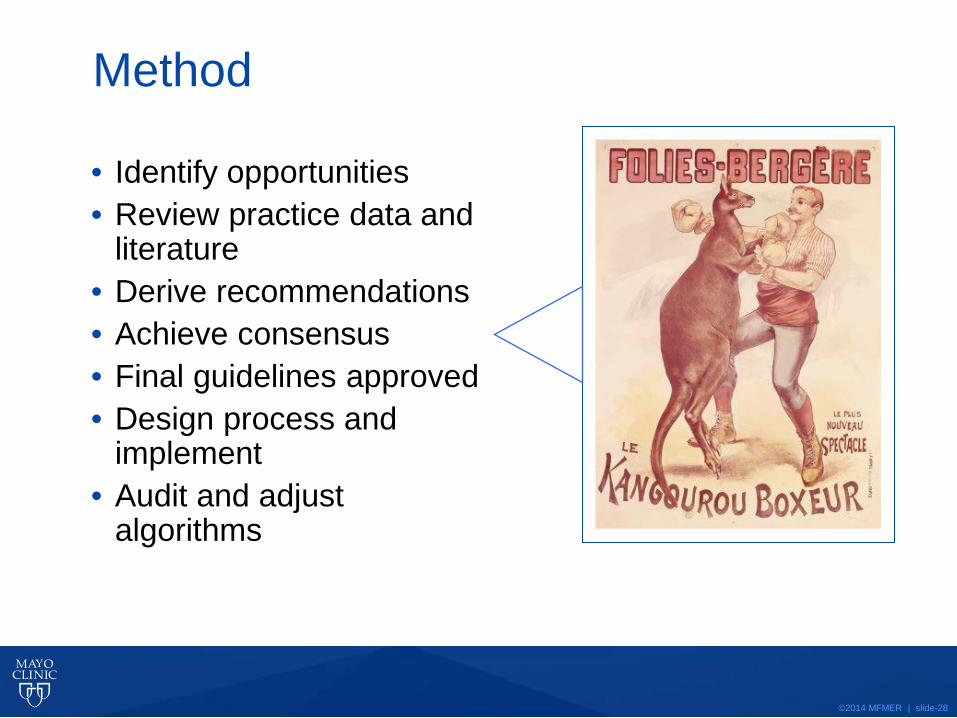
Method
• Identify opportunities • Review practice data and
literature • Derive recommendations • Achieve consensus • Final guidelines approved • Design process and
implement • Audit and adjust
algorithms
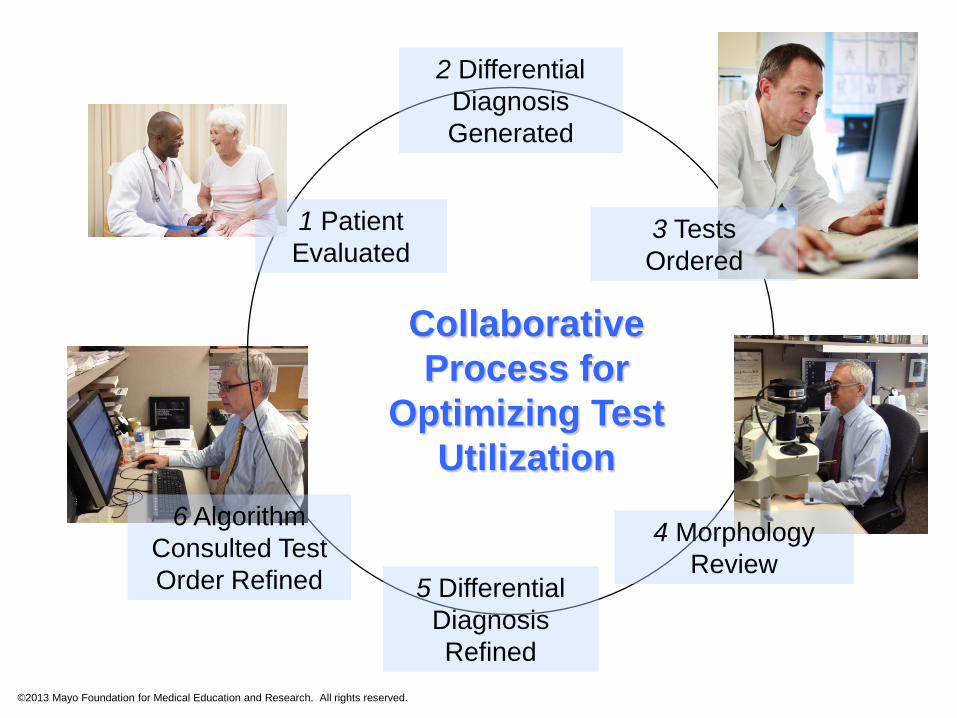
2 Differential Diagnosis Generated
3 Tests Ordered
4 Morphology Review
5 Differential Diagnosis Refined
6 Algorithm Consulted Test Order Refined
Collaborative Process for
Optimizing Test Utilization
1 Patient Evaluated
©2013 Mayo Foundation for Medical Education and Research. All rights reserved.
©2014 MFMER | slide-30
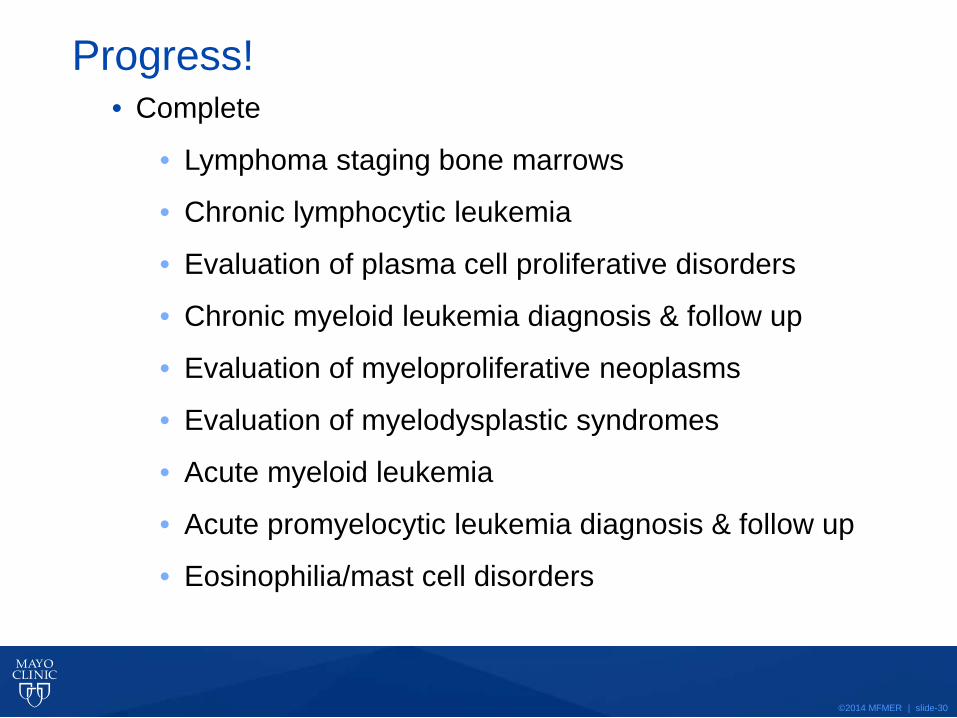
Progress! • Complete
• Lymphoma staging bone marrows
• Chronic lymphocytic leukemia
• Evaluation of plasma cell proliferative disorders
• Chronic myeloid leukemia diagnosis & follow up
• Evaluation of myeloproliferative neoplasms
• Evaluation of myelodysplastic syndromes
• Acute myeloid leukemia
• Acute promyelocytic leukemia diagnosis & follow up
• Eosinophilia/mast cell disorders
©2014 MFMER | slide-31
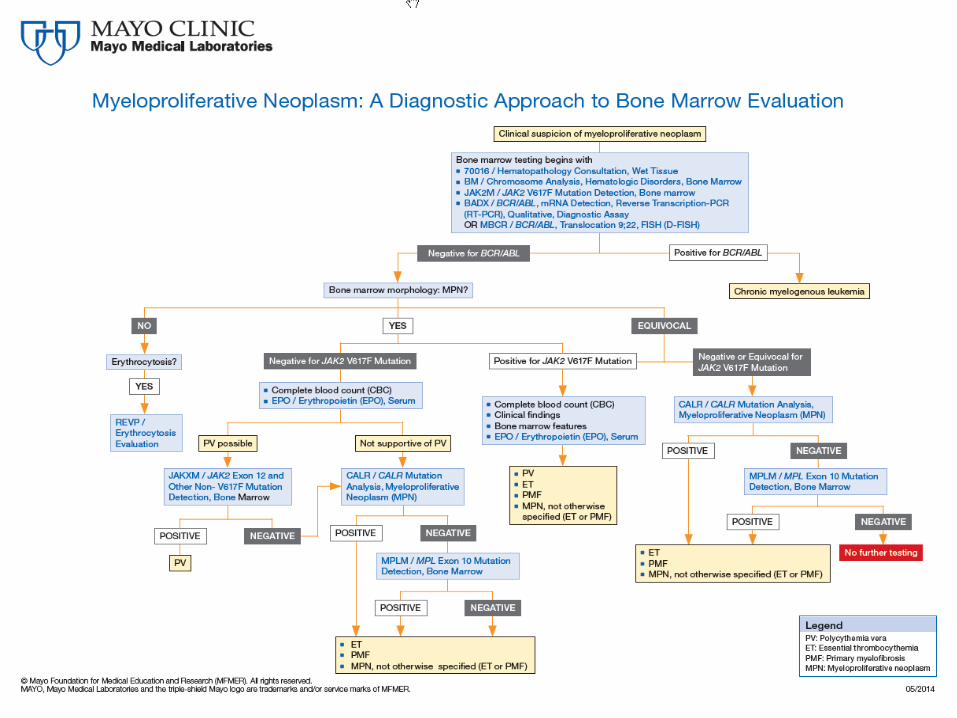
http://www.mayomedicallaboratories.com/media/articles/algorithms/mpn-bonemarrow.pdf
©2014 MFMER | slide-32
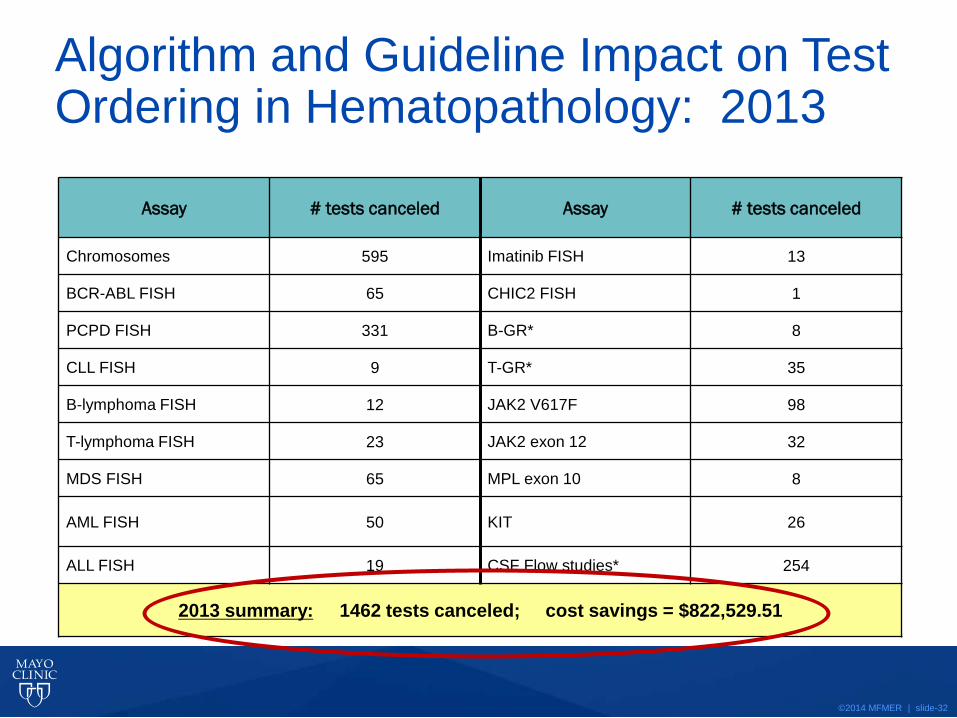
Assay # tests canceled Assay # tests canceled
Chromosomes 595 Imatinib FISH 13
BCR-ABL FISH 65 CHIC2 FISH 1
PCPD FISH 331 B-GR* 8
CLL FISH 9 T-GR* 35
B-lymphoma FISH 12 JAK2 V617F 98
T-lymphoma FISH 23 JAK2 exon 12 32
MDS FISH 65 MPL exon 10 8
AML FISH 50 KIT 26
ALL FISH 19 CSF Flow studies* 254
2013 summary: 1462 tests canceled; cost savings = $822,529.51
Algorithm and Guideline Impact on Test Ordering in Hematopathology: 2013
©2014 MFMER | slide-33
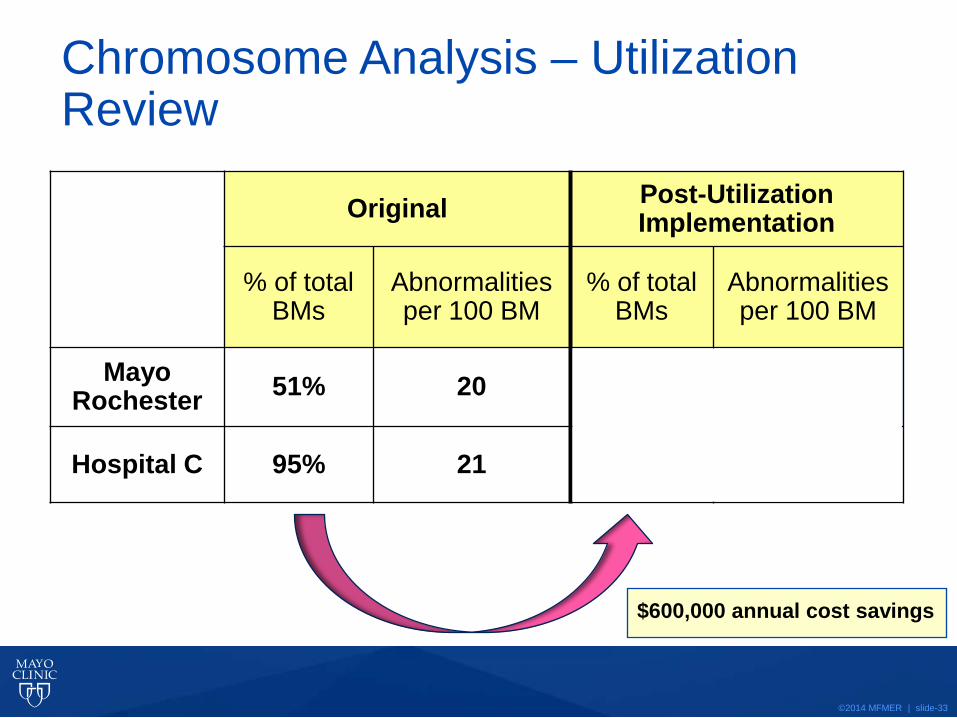
Chromosome Analysis – Utilization Review
Original Post-Utilization Implementation
% of total BMs
Abnormalities per 100 BM
% of total BMs
Abnormalities per 100 BM
Mayo Rochester 51% 20
Hospital C 95% 21 42% 21
$600,000 annual cost savings
©2014 MFMER | slide-34
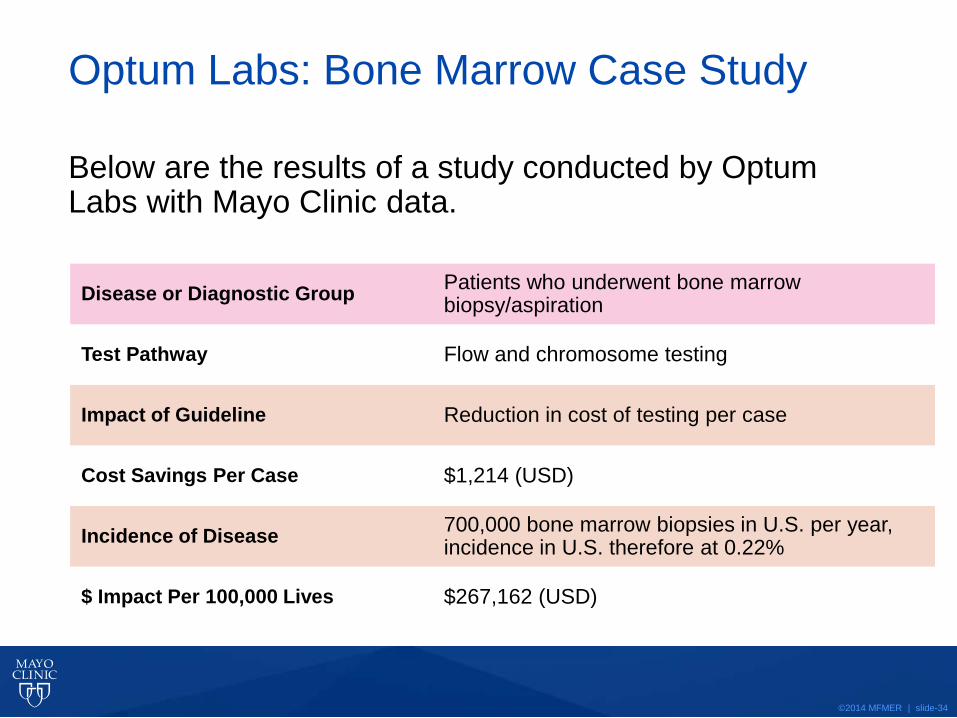
Optum Labs: Bone Marrow Case Study
Below are the results of a study conducted by Optum Labs with Mayo Clinic data.
Disease or Diagnostic Group Patients who underwent bone marrow biopsy/aspiration
Test Pathway Flow and chromosome testing
Impact of Guideline Reduction in cost of testing per case
Cost Savings Per Case $1,214 (USD)
Incidence of Disease 700,000 bone marrow biopsies in U.S. per year, incidence in U.S. therefore at 0.22%
$ Impact Per 100,000 Lives $267,162 (USD)
©2014 MFMER | slide-35
Questions & Discussion