Embed Size (px)
Citation preview

Healthcare
SP-35Michael Mahaney
Tianna Nguyen
Edward Poitras
Matthew Pry
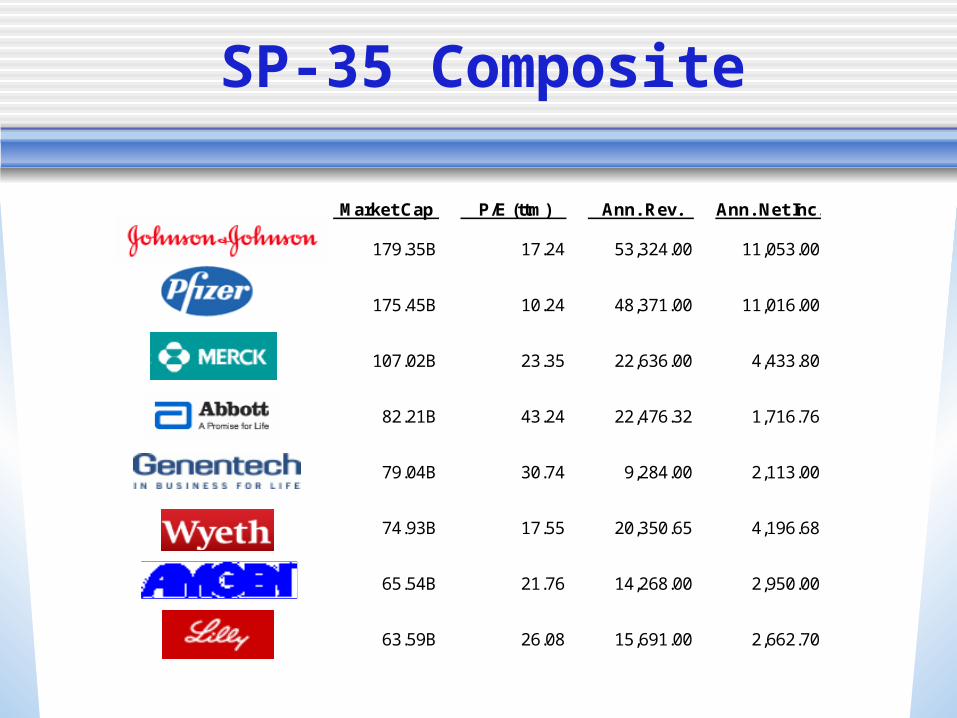
SP-35 Composite
0.0%
5.0%
10.0%
15.0%
20.0%
25.0%
0%
20%
40%
60%
80%
100%
Cu
mu
lati
ve %
Sector 20.3% 16.0% 11.5% 11.4% 11.3% 10.0% 9.1% 3.6% 3.6% 3.2%
Cumulative 20.3% 36.3% 47.8% 59.2% 70.5% 80.5% 89.6% 93.2% 96.8% 100.0%
FinancialsInformation Technology Health Care Industrials Energy
Consumer Discretionary
Consumer Staples
Telecommunications
ServicesUtilities Materials
• Health Care 3rd largest sector in S&P 500 Comprised of 53 companies
SP-35 Composite
Market Cap P/E (ttm) Ann. Rev. Ann. Net Inc.
179.35B 17.24 53,324.00 11,053.00
175.45B 10.24 48,371.00 11,016.00
107.02B 23.35 22,636.00 4,433.80
82.21B 43.24 22,476.32 1,716.76
79.04B 30.74 9,284.00 2,113.00
74.93B 17.55 20,350.65 4,196.68
65.54B 21.76 14,268.00 2,950.00
63.59B 26.08 15,691.00 2,662.70
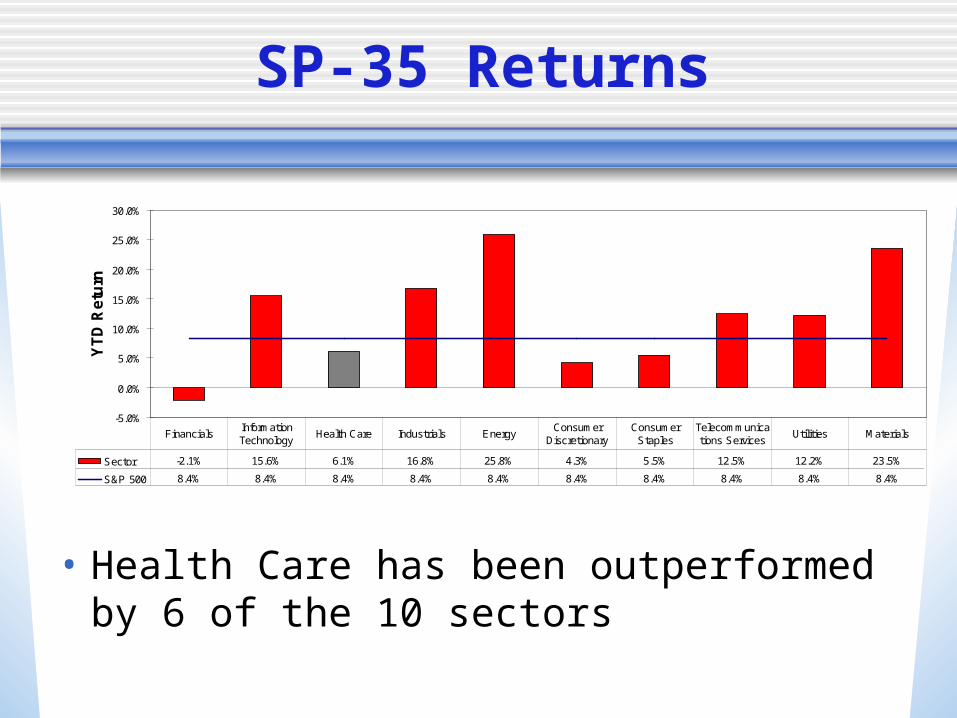
SP-35 Returns
-5.0%
0.0%
5.0%
10.0%
15.0%
20.0%
25.0%
30.0%
YT
D R
etu
rn
Sector -2.1% 15.6% 6.1% 16.8% 25.8% 4.3% 5.5% 12.5% 12.2% 23.5%
S&P 500 8.4% 8.4% 8.4% 8.4% 8.4% 8.4% 8.4% 8.4% 8.4% 8.4%
FinancialsInformation Technology
Health Care Industrials EnergyConsumer
DiscretionaryConsumer
StaplesTelecommunications Services
Utilities Materials
• Health Care has been outperformed by 6 of the 10 sectors
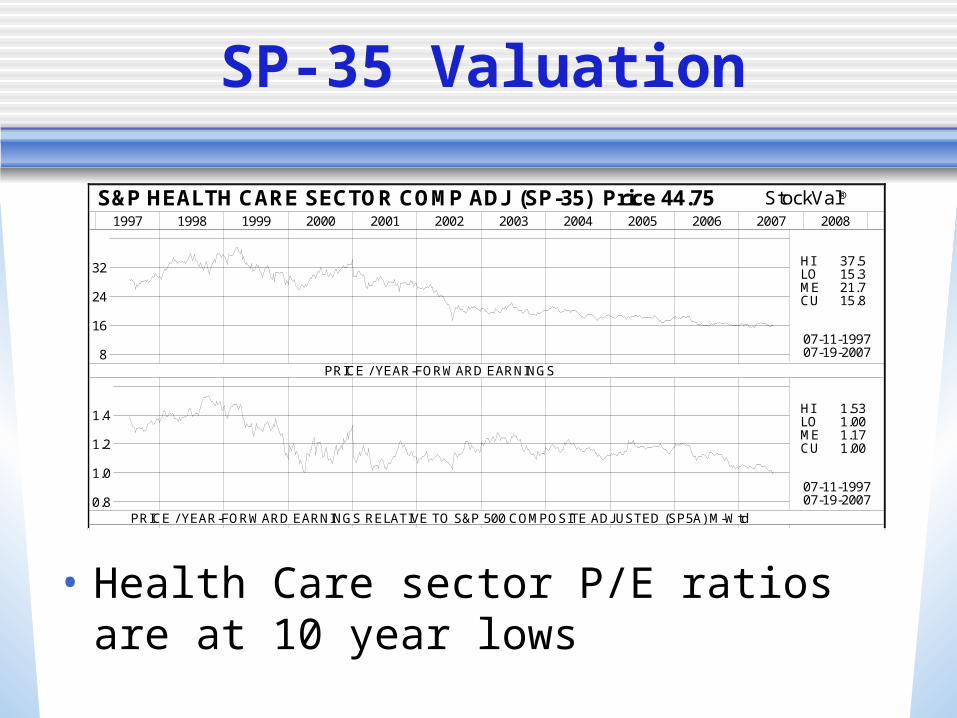
SP-35 Valuation
• Health Care sector P/E ratios are at 10 year lows
StockVal®S&P HEALTH CARE SECTOR COMP ADJ (SP-35) Price 44.751997 1998 1999 2000 2001 2002 2003 2004 2005 2006 2007 2008
PRICE / YEAR-FORWARD EARNINGS8
16
24
32 HI 37.5 LO 15.3 ME 21.7 CU 15.8
07-11-199707-19-2007
PRICE / YEAR-FORWARD EARNINGS RELATIVE TO S&P 500 COMPOSITE ADJUSTED (SP5A) M-Wtd0.8
1.0
1.2
1.4 HI 1.53 LO 1.00 ME 1.17 CU 1.00
07-11-199707-19-2007
GROWTH RATE ESTIMATE10
12
14
16 HI 17.98 LO 10.73 ME 15.47 CU 11.09
07-11-199707-19-2007
GROWTH RATE ESTIMATE RELATIVE TO S&P 500 COMPOSITE ADJUSTED (SP5A) M-Wtd0.8
1.0
1.2HI 1.23 LO 0.90 ME 1.02 CU 0.94
07-11-199707-19-2007
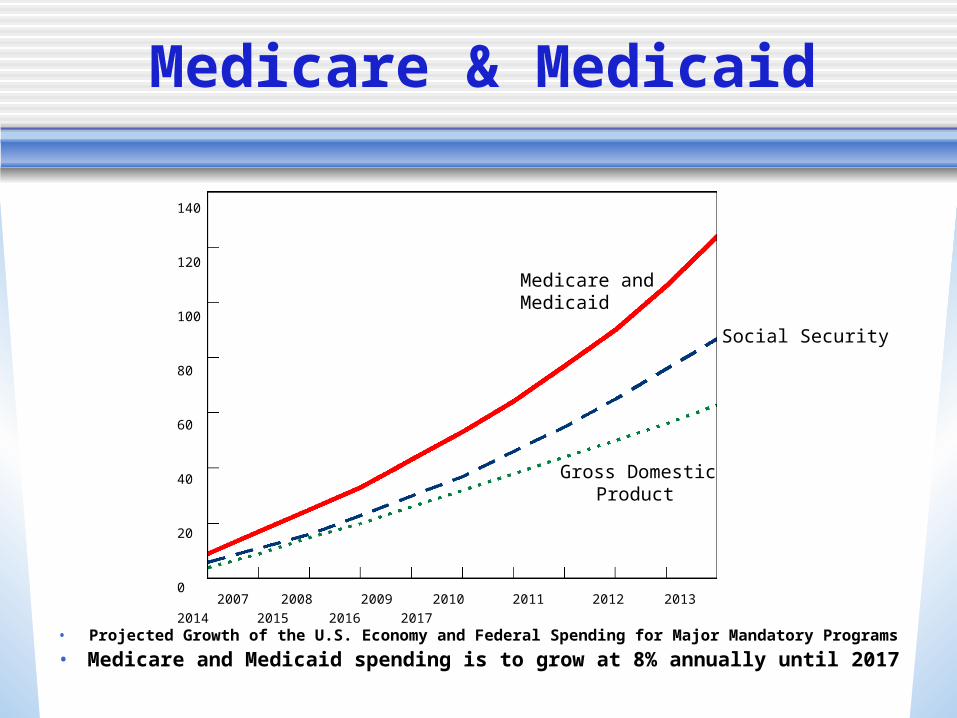
Medicare & Medicaid
• Projected Growth of the U.S. Economy and Federal Spending for Major Mandatory Programs
• Medicare and Medicaid spending is to grow at 8% annually until 2017
Gross Domestic Product
Medicare and Medicaid
Social Security
140
120
100
80
60
40
20
0 2007 2008 2009 2010 2011 2012 2013 2014 2015 2016 2017
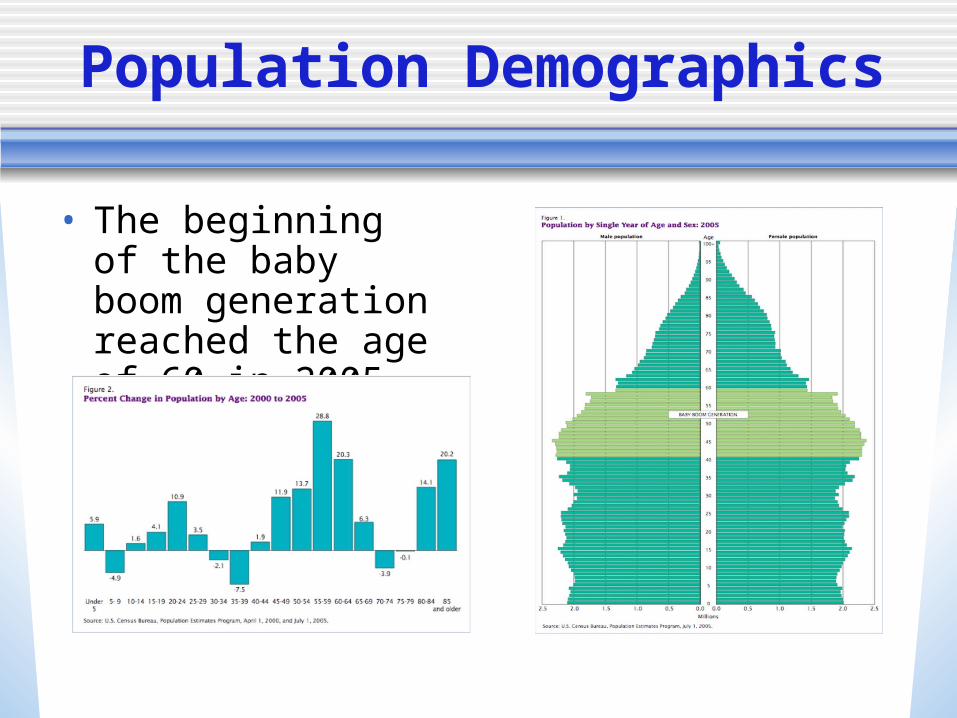
Population Demographics
• The beginning of the baby boom generation reached the age of 60 in 2005.
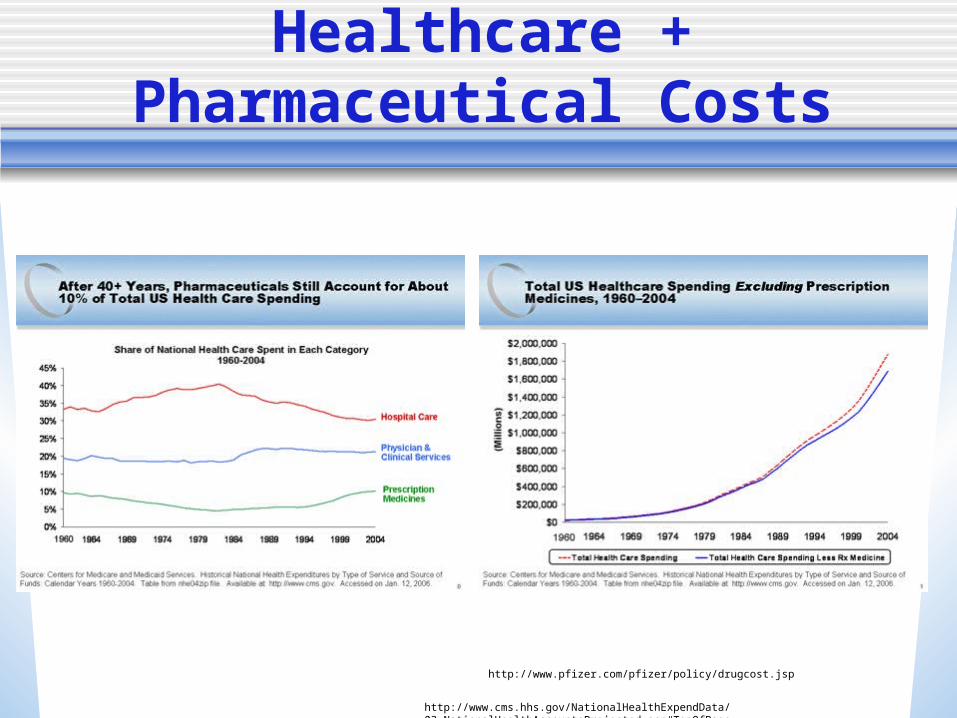
Healthcare + Pharmaceutical Costs
http://www.pfizer.com/pfizer/policy/drugcost.jsp
http://www.cms.hhs.gov/NationalHealthExpendData/03_NationalHealthAccountsProjected.asp#TopOfPage
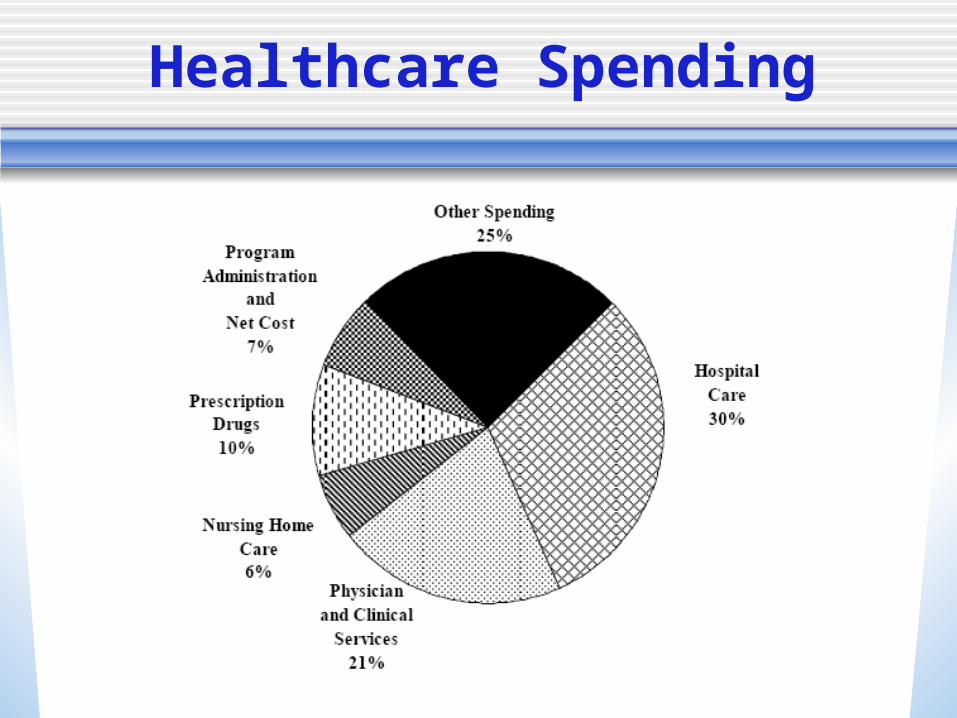
Healthcare Spending
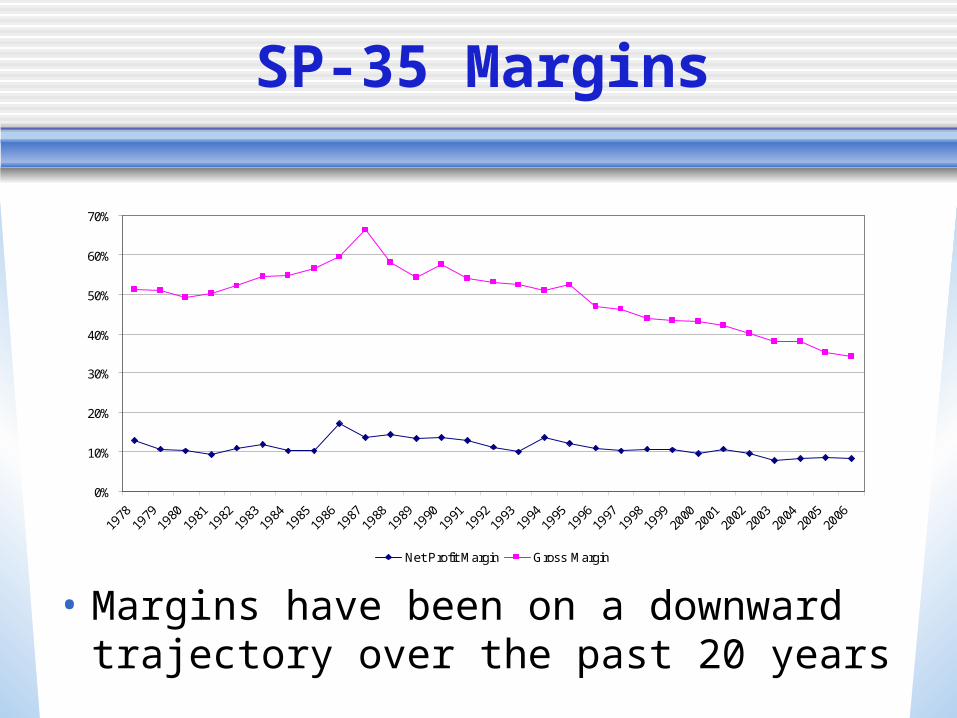
SP-35 Margins
0%
10%
20%
30%
40%
50%
60%
70%
Net Profit Margin Gross Margin
• Margins have been on a downward trajectory over the past 20 years
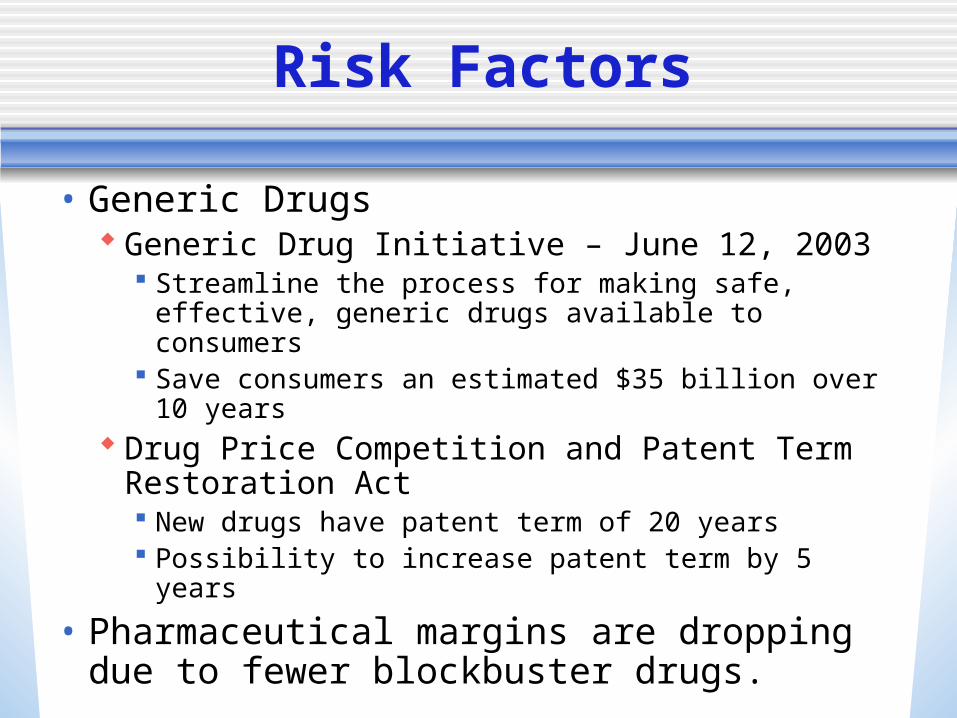
Risk Factors
• Generic Drugs Generic Drug Initiative – June 12, 2003
Streamline the process for making safe, effective, generic drugs available to consumers
Save consumers an estimated $35 billion over 10 years Drug Price Competition and Patent Term
Restoration Act New drugs have patent term of 20 years Possibility to increase patent term by 5 years
• Pharmaceutical margins are dropping due to fewer blockbuster drugs.
Risk Factors
• Nationalizing Healthcare Immense pressure from public Other nations have achieved success
• Government Regulations Price caps on drugs, medical equipment, supplies
• Lawsuits Possible lawsuits – Merck’s Vioxx fallout
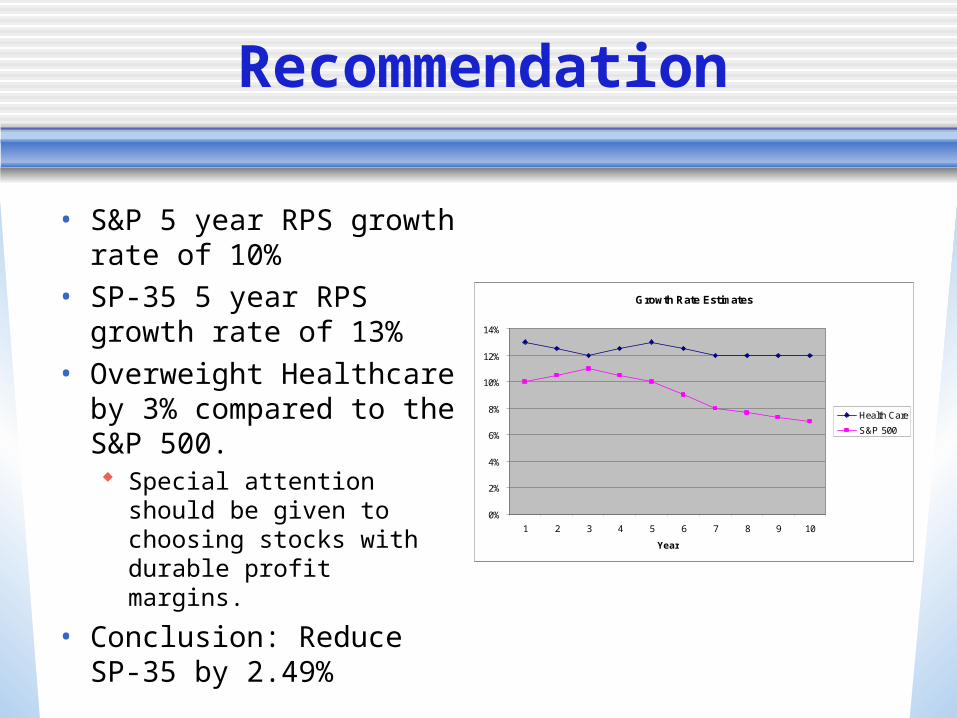
Recommendation
• S&P 5 year RPS growth rate of 10%
• SP-35 5 year RPS growth rate of 13%
• Overweight Healthcare by 3% compared to the S&P 500. Special attention should be
given to choosing stocks with durable profit margins.
• Conclusion: Reduce SP-35 by 2.49%
Growth Rate Estimates
0%
2%
4%
6%
8%
10%
12%
14%
1 2 3 4 5 6 7 8 9 10
Year
Health Care
S&P 500
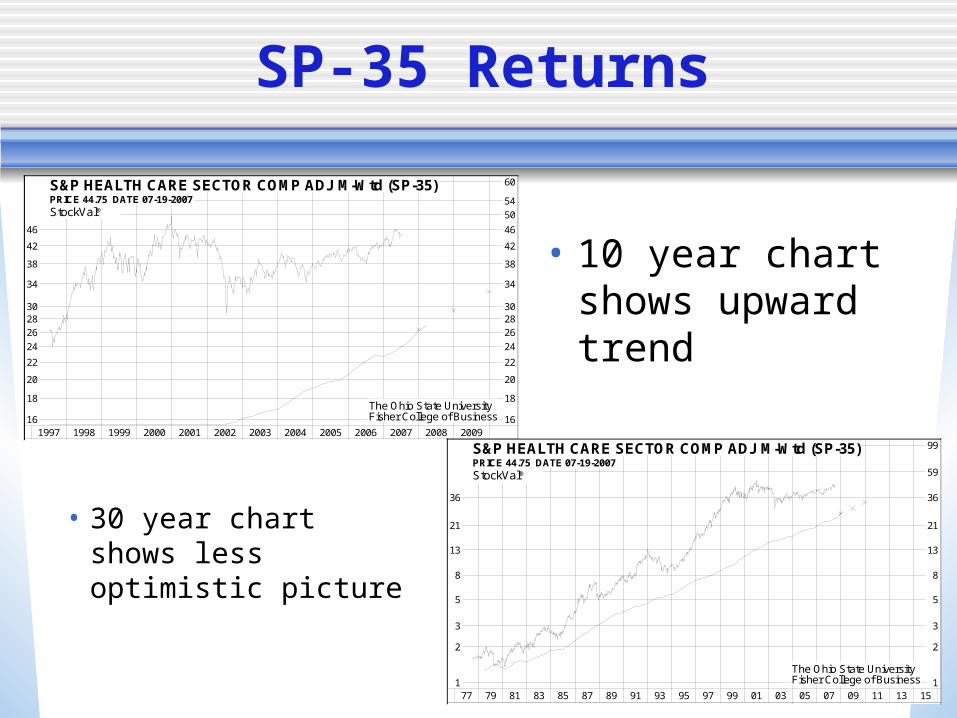
SP-35 Returns
• 30 year chart shows less optimistic picture
1997 1998 1999 2000 2001 2002 2003 2004 2005 2006 2007 2008 2009
S&P HEALTH CARE SECTOR COMP ADJ M-Wtd (SP-35)PRICE 44.75 DATE 07-19-2007PRICE 44.75 DATE 07-19-2007StockVal®
1616
1818
2020
2222
2424
262628283030
3434
3838
4242
4646
50
54
60
The Ohio State UniversityFisher College of Business
Price Change % Diff SP5
1-Day -0.43 -0.88
1-Week -1.60 -1.95
4-Weeks 0.48 -2.18
QTD 1.08 -2.23
YTD 5.68 -3.82
2006 4.70 -8.92
2005 6.08 3.07
2004 0.13 -8.87 FYE Dec 2006 EPS 2.27
First Call Data 2007 2008 2009
Mean Estimate 2.64 2.93 3.26Change +16% +11% +11%
High 2.72 3.15 3.60
Low 2.54 2.69 2.96
Total 20 19 12
# Up 5 4 3
# Down 2 3 2
House Estimate
PE Ratio 16.9 15.3 13.7
Revenues ($Mil) 58,756
Market Value ($Mil) 107,307
Shares Out (Mil) 2,397.7
Volume 60-Day Avg (Th) 13,877
Volume 60-Day Avg ($M) 621.1
Dividend Estimate 0.67
Payout Ratio 25%
Retention Rate 75%
Dividend Yield 1.50%
Data Page # 1
77 79 81 83 85 87 89 91 93 95 97 99 01 03 05 07 09 11 13 15
S&P HEALTH CARE SECTOR COMP ADJ M-Wtd (SP-35)PRICE 44.75 DATE 07-19-2007PRICE 44.75 DATE 07-19-2007StockVal®
11
22
33
55
88
1313
2121
3636
59
99
The Ohio State UniversityFisher College of Business
Price Change % Diff SP5
1-Day -0.43 -0.88
1-Week -1.60 -1.95
4-Weeks 0.48 -2.18
QTD 1.08 -2.23
YTD 5.68 -3.82
2006 4.70 -8.92
2005 6.08 3.07
2004 0.13 -8.87 FYE Dec 2006 EPS 2.27
First Call Data 2007 2008 2009
Mean Estimate 2.64 2.93 3.26Change +16% +11% +11%
High 2.72 3.15 3.60
Low 2.54 2.69 2.96
Total 20 19 12
# Up 5 4 3
# Down 2 3 2
House Estimate
PE Ratio 16.9 15.3 13.7
Revenues ($Mil) 58,756
Market Value ($Mil) 107,307
Shares Out (Mil) 2,397.7
Volume 60-Day Avg (Th) 13,877
Volume 60-Day Avg ($M) 621.1
Dividend Estimate 0.67
Payout Ratio 25%
Retention Rate 75%
Dividend Yield 1.50%
Data Page # 1
• 10 year chart shows upward trend
SP-35 Industries
• Pharmaceuticals
• Biotechnology
• Healthcare Facilities
• Medical Equipment
• Medical Supplies
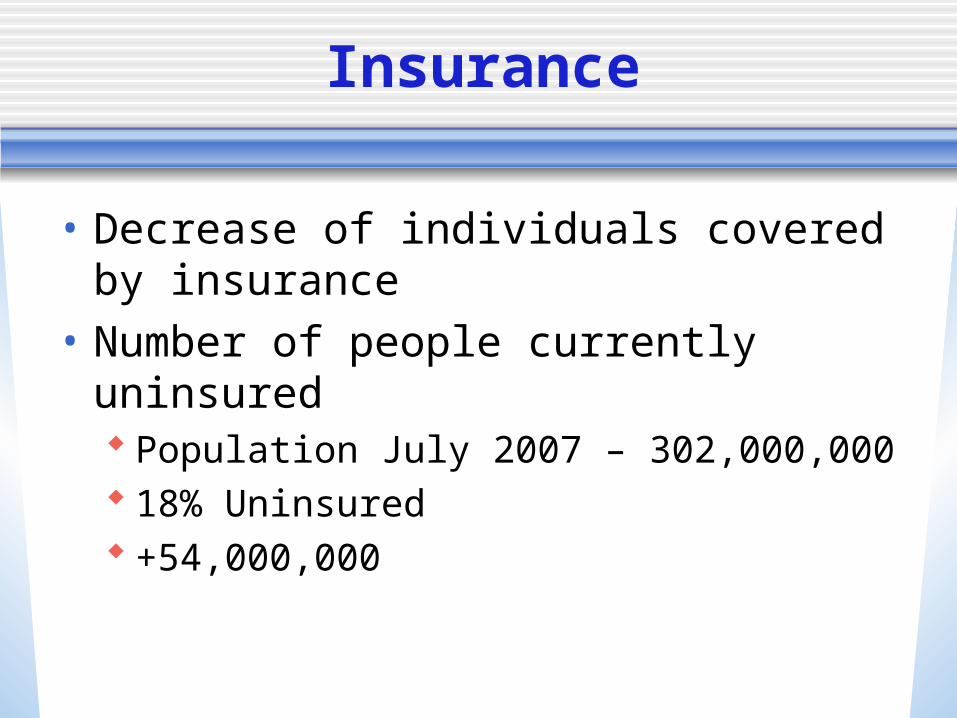
Insurance
• Decrease of individuals covered by insurance
• Number of people currently uninsured Population July 2007 – 302,000,000 18% Uninsured +54,000,000
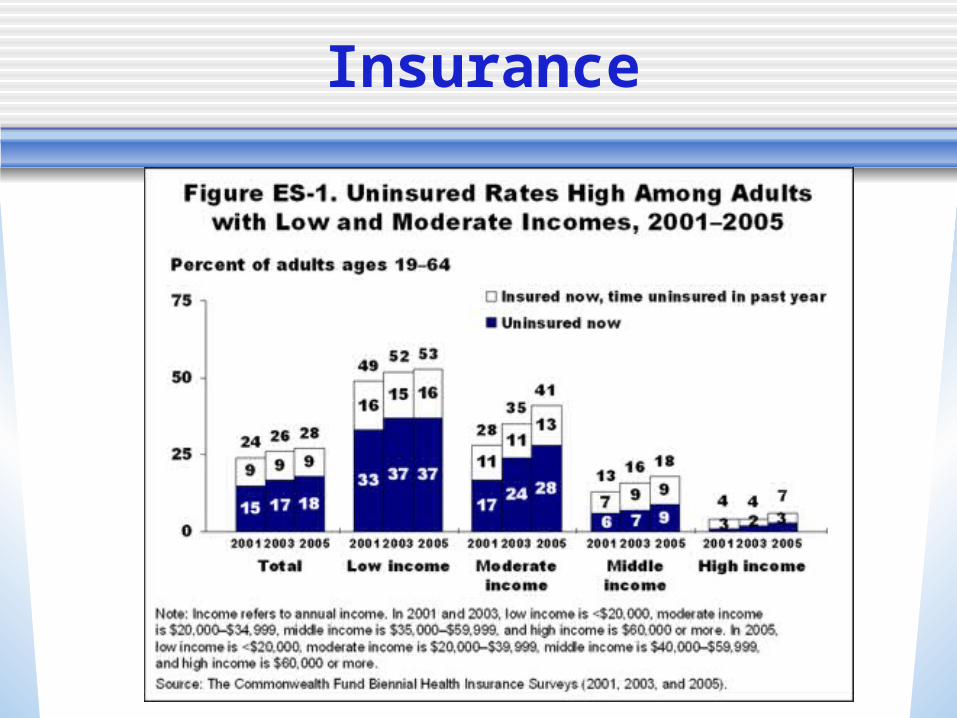
Insurance
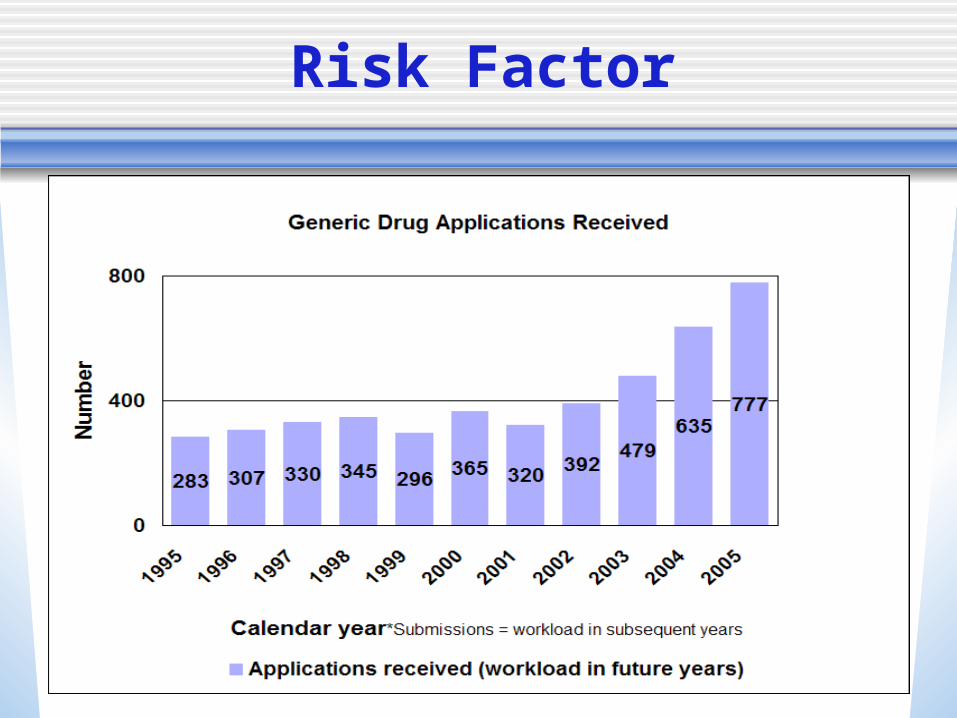
Risk Factor
Risk Factors
• Preventative Medicine More information available to general public Most effective way to treat high dollar diseases is
before they start or in early stages