Embed Size (px)
Citation preview
Healthy Eating and Active Living
Toolkit for Community Educators
Healthy E
ating and
Active Living
Toolkit for Com
munity E
ducators
MIXED-RACE COVER
I N T R O D U C T I O N
Welcome to the Healthy Eating and Active Living Toolkit for Community Educators! This online Healthy Eating and Active Living Toolkit for Community Educators was created by the Nutrition Education and Obesity Prevention Branch of the California Department of Public Health so you and other community educators can easily teach low-income adults about healthy eating, including eating the recommended amounts of fruits and vegetables and enjoying physical activity every day. This Toolkit, which is an adaptation of the Fruit, Vegetable and Physical Activity Toolbox for Community Educators, is available in English, Spanish, Chinese, Hmong, and Vietnamese.
THE EASY-TO-USE LESSON PLANS ARE DESIGNED TO:
• Increase awareness and knowledge of healthy eating and physical activity recommendations.
• Build self-confidence and skills so the recommendations are easier to follow.
• Strengthen social support for these behaviors from family, friends, and neighbors.
• Empower adults to advocate for changes that make healthy eating and physical activity opportunities more accessible in their community.
THE TOOLKIT TOPICS INCLUDE:
• MyPlate
• Fruits and Vegetables
• Salt and Sodium
• Sugar-Sweetened Beverages
• Physical Activity
• Advocating for Fruits, Vegetables and Physical Activity
EACH LESSON CONTAINS:
• Learning objectives
• A list of required and optional materials
• Step-by-step instructions
• Expansion ideas
#300443/Ver.09/15
LEARNING OBJECTIVES
By the end of the session, participants will be able to:
• Name three personal health benefits of eating healthy food.
• Identify the food groups to create a healthy plate.
• Assess current eating patterns and compare them to MyPlate recommendations.
• Plan a meal that meets MyPlate recommendations.
MATERIALS
• Sign-in sheet
• Name tags (optional)
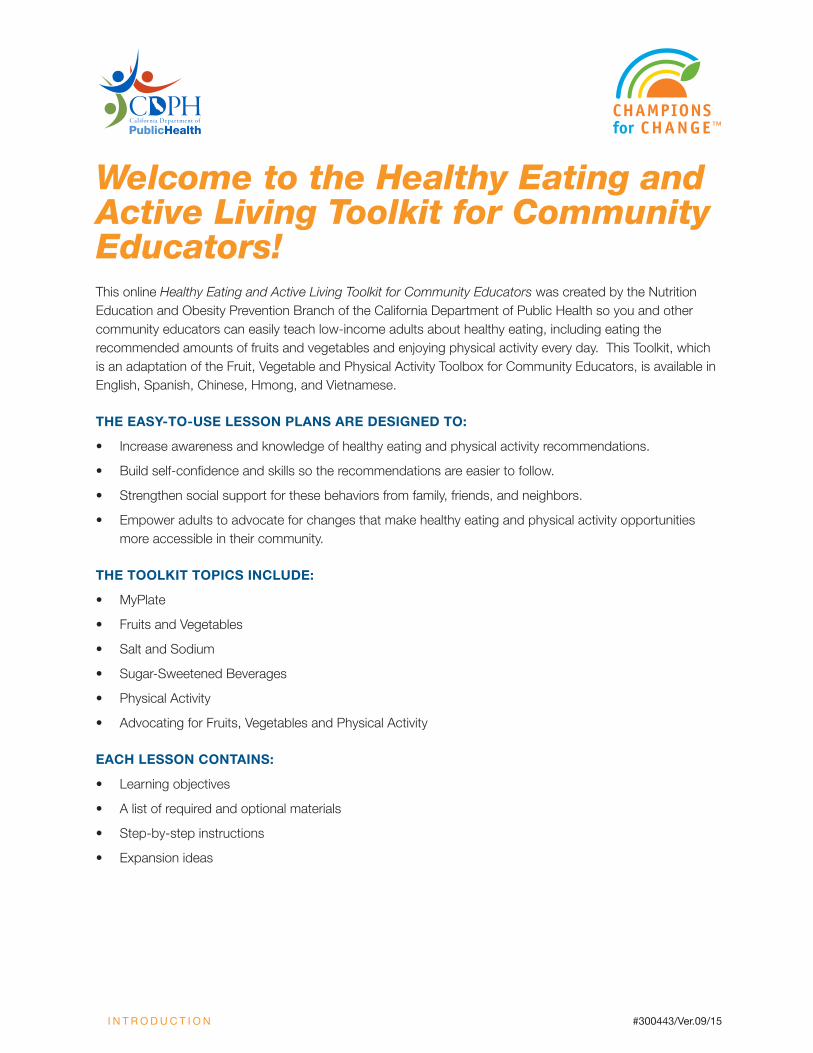
• MyPlate poster
Eat the MyPlate Way
E AT T H E M Y P L AT E W AY
• White board or flip chart
• Set of markers to record discussion questions
• Paper Plates in 12”, 9”, and 7” sizes
• Set of measuring cups to assist in menu planning
• Pencils or pens
• Handouts:
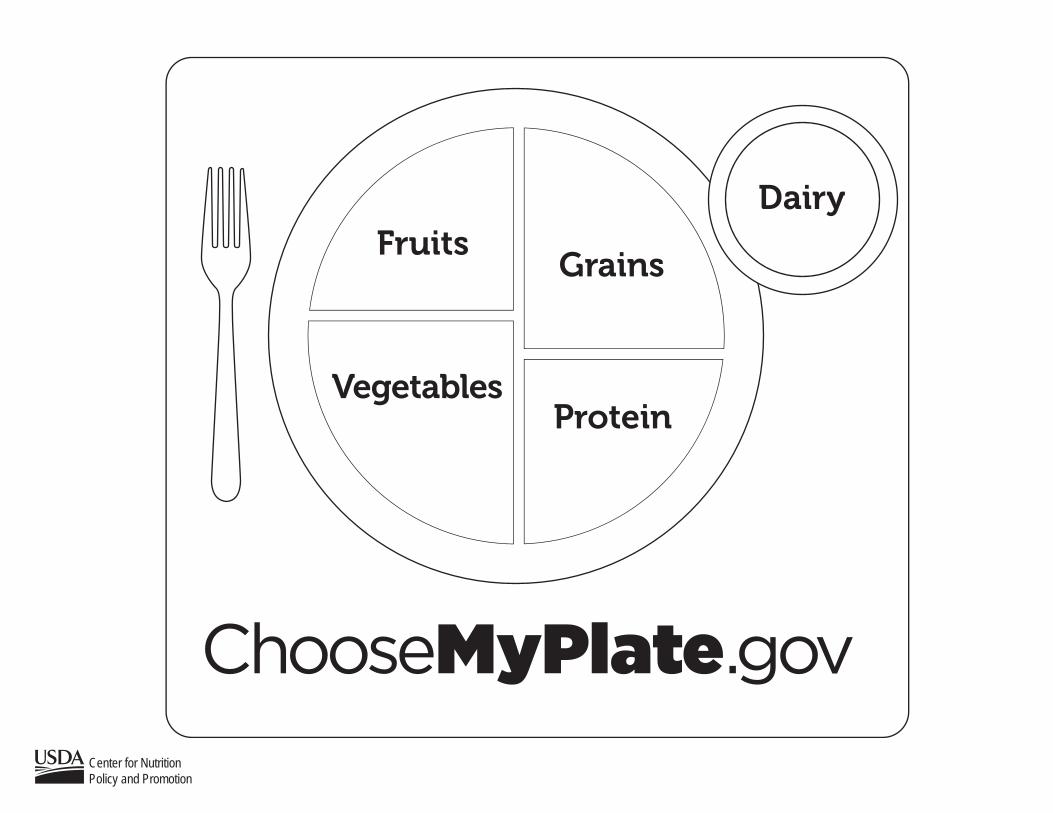
o MyPlate Coloring Sheets (2 copies, printed back to back)
o What’s On Your Plate? (mini poster)
o Build a Healthy Meal tip sheet
www.choosemyplate.gov/sites/default/files/audiences/ColoringSheet.pdf
www.choosemyplate.gov/sites/default/files/printablematerials/mini_poster.pdf
www.choosemyplate.gov/sites/default/files/tentips/DGTipsheet7BuildAHealthyMeal.pdf
PREPARATION
1. Review lesson plan and handouts.
2. Be prepared to explain and apply the information in the lesson.
3. Locate a room that will accommodate participants comfortably.
4. Prepare sign-in sheets and name tags (optional).
5. Make copies of participant handouts.
6. Display MyPlate poster.
7. Set up flip chart or white board to record discussion responses.
• • • • • • • • • • • • • • • • • • • • • • • • • • • • • • • • • • • • • • • • • • • • • • • • • • • • • • • • • • •
WARM-UP ACTIVITY: WHAT ARE THE BENEFITS OF HEALTHY EATING?
1. Introduce yourself and share with participants that you will be discussing the recommendations for healthy eating today using MyPlate as a guide.
2. Explain the objectives for the lesson.
3. Have participants pair up and discuss the benefits of healthy eating that they have heard about, or that they have experienced.
4. Ask participants to share their responses with the group. Wait for responses and write them on the flip chart or white board. If not mentioned, add that healthy eating contributes to:
• Better health
• Better dental health
• Reduced risk of heart disease, type 2 diabetes, and high blood pressure
E AT T H E M Y P L AT E W AY
• Healthier weight
• Improved mental health and mood
5. Next ask participants what they have heard about MyPlate and record their answers on the flip chart or white board.
Note for InstructorsHaving participants share the benefits of healthy eating helps you as the instructor understand what is important to them, and helps participants start to focus on the lesson topic.
ACTIVITY: FOOD GROUPS
1. Ask for three volunteers to each share the foods they ate for one meal – breakfast, lunch, or dinner. Write the foods on the flip chart or white board.
2. Using the MyPlate poster, review the sections of MyPlate, highlighting the foods included in each section, emphasizing that each food group makes an important contribution to overall health.
3. Using the MyPlate poster, point to one food group and ask the group to identify the foods from the volunteers’ meals that fit into that food group.
4. Repeat for each food group, correcting or clarifying the categorization as needed.
ACTIVITY: WHAT PLATE SIZE DO YOU USE?
1. Review the MyPlate recommendation to eat less overall, saying that one way to reach this recommendation is to reduce portions eaten.
2. Show participants the different plate sizes. Explain that adult plate sizes can be decreased from 12-inch to 9-inch, and that child plate sizes can be decreased from 9-inch to 7-inch. Display a variety of different types and sizes of plates and bowls on the tables.
3. Ask participants to describe the types and sizes of plates and bowls they typically use.
ACTIVITY: WHAT’S ON YOUR PLATE?
1. Distribute the MyPlate Coloring Sheets and ask participants to record (using words or drawings) their most recent meal on one side. Provide pens or pencils as needed.
2. Distribute the handout What’s on Your Plate? Review with participants, focusing on recommended daily amounts.
3. Ask participants to compare their meal to the MyPlate recommendations. Were food groups missing? How do their meals compare to the recommendations:
• Fill half your plate with fruits and vegetables.
• Fill one quarter of your plate with lean protein.
• Fill about one quarter of your plate with grains, and focus on whole grains.
• Choose lowfat or nonfat dairy products.
E AT T H E M Y P L AT E W AY
Note for instructorsAsking participants to describe their meals highlights cultural and familial differences and makes the lesson more relevant for everyone.
4. Ask for a few volunteers to share how their meal compared to the recommendations. What food groups were not included? Write responses on the flip chart or white board. Ask participants for suggestions for these gaps.
5. Ask participants to plan their next meal and write or draw the foods from each food group on the other side of the coloring sheet, focusing on the areas they were missing from the first meal. When done, ask participants to share with another person near them.
ACTIVITY: MIXED DISHES WITH MYPLATE RECOMMENDATIONS
1. Ask participants for examples of commonly eaten mixed dishes.
2. Review how to use MyPlate with mixed dishes such as soups, stews, stir-fries, casseroles, tacos, pizza, etc. Review some mixed dish meals mentioned by participants to ensure that participants understand how to apply MyPlate to a variety of meal types.
ACTIVITY: REVIEW, EVALUATION, PERSONAL NEXT STEPS
1. Ask participants to share how they could modify their current cooking patterns to follow MyPlate recommendations. Give a few examples if needed to start the discussion.
2. Ask what questions participants have about MyPlate and how it can help them plan healthier meals. Answer any questions. Refer participants to the ChooseMyPlate.gov website for more resources and tips. Offer the Build a Healthy Meal tip sheet for participants to take if they choose.
3. Do a class evaluation as a group, asking participants to respond to the following questions:
• What are the benefits of eating healthy foods for you personally?
• What are the food groups on MyPlate?
• What did you learn today that was new to you?
• What changes are you planning to make as a result of today’s class?
Thank participants for attending class today and learning more about using MyPlate to plan healthy meals for their families.
E AT T H E M Y P L AT E W AY#300444/Ver.09/15
Center for NutritionPolicy and Promotion
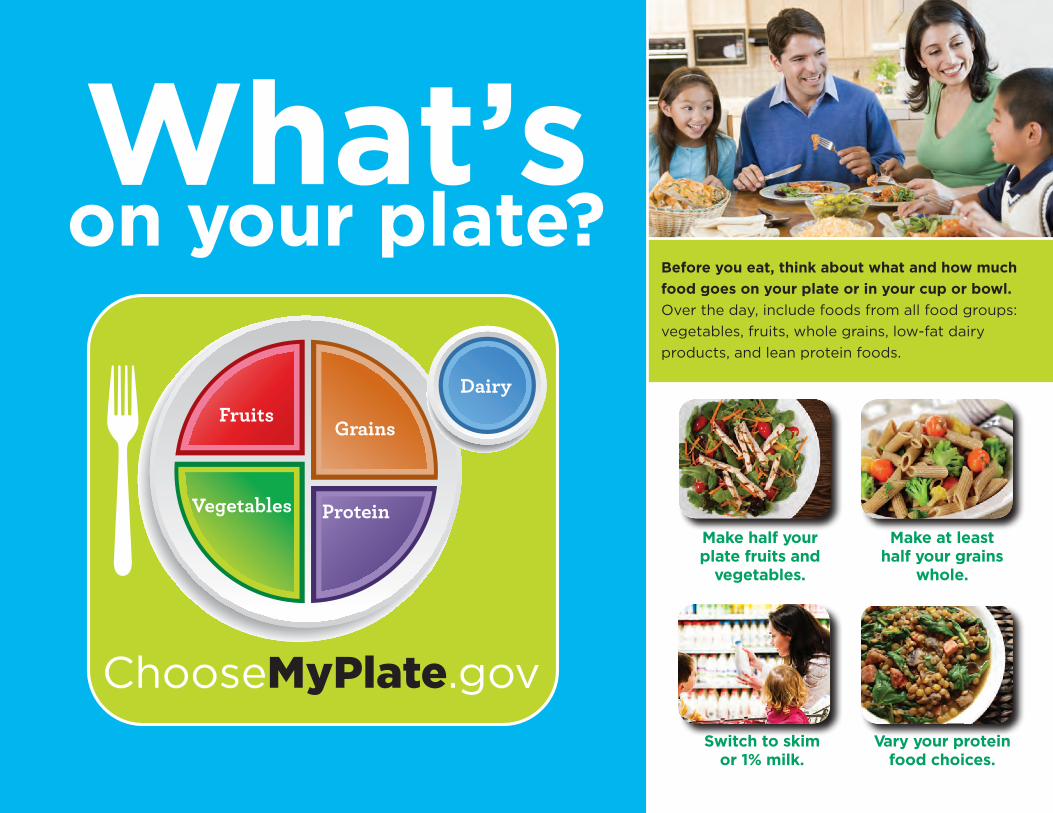
What’son your plate?
Make half your plate fruits and
vegetables.
Switch to skim or 1% milk.
Vary your protein food choices.
Make at least half your grains
whole.
Before you eat, think about what and how much food goes on your plate or in your cup or bowl. Over the day, include foods from all food groups: vegetables, fruits, whole grains, low-fat dairy products, and lean protein foods.
ChooseMyPlate.gov
Grains
DairyFruits
Vegetables Protein
U.S. Department of Agriculture • Center for Nutrition Policy and PromotionAugust 2011CNPP-25USDA is an equal opportunity provider and employer.
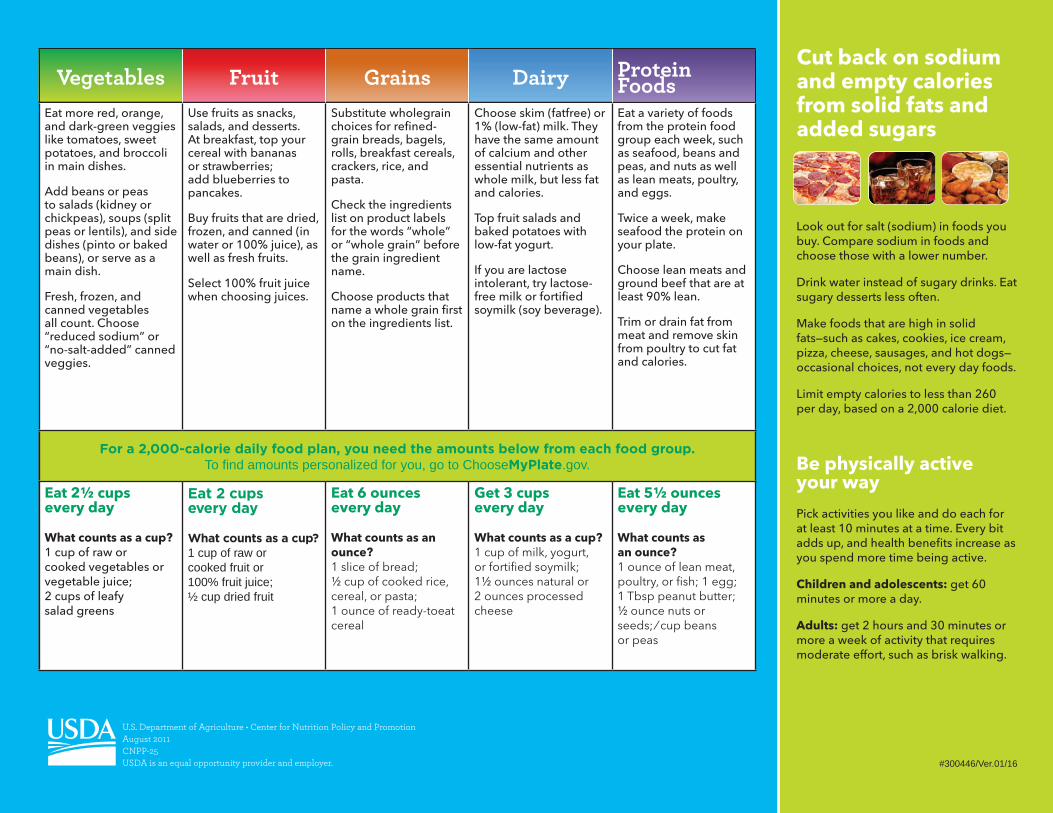
Cut back on sodium and empty calories from solid fats and added sugars
Vegetables Fruit Grains Dairy Protein Foods
Eat more red, orange, and dark-green veg gies like tomatoes, sweet potatoes, and broccoli in main dishes.
Add beans or peas to salads (kidney or chickpeas), soups (split peas or lentils), and side dishes (pinto or baked beans), or serve as a main dish.
Fresh, frozen, and canned vegetables all count. Choose “reduced sodium” or “no-salt-added” canned veggies.
Use fruits as snacks, salads, and desserts. At breakfast, top your cereal with bananas or strawberries; add blueberries to pancakes.
Buy fruits that are dried, frozen, and canned (in water or 100% juice), as well as fresh fruits.
Select 100% fruit juice when choosing juices.
Substitute whole grain choices for refined-grain breads, bagels, rolls, break fast cereals, crackers, rice, and pasta.
Check the ingredients list on product labels for the words “whole” or “whole grain” before the grain ingredient name.
Choose products that name a whole grain first on the ingredi ents list.
Choose skim (fat free) or 1% (low-fat) milk. They have the same amount of calcium and other essential nutrients as whole milk, but less fat and calories.
Top fruit salads and baked potatoes with low-fat yogurt.
If you are lactose intolerant, try lactose-free milk or fortified soymilk (soy beverage).
Eat a variety of foods from the protein food group each week, such as seafood, beans and peas, and nuts as well as lean meats, poultry, and eggs.
Twice a week, make seafood the protein on your plate.
Choose lean meats and ground beef that are at least 90% lean.
Trim or drain fat from meat and remove skin from poultry to cut fat and calories.
For a 2,000-calorie daily food plan, you need the amounts below from each food group.To find amounts personalized for you, go to ChooseMyPlate.gov.
Eat 2½ cups every day
What counts as a cup? 1 cup of raw or cooked vegetables or vegetable juice; 2 cups of leafy salad greens
Eat 2 cups every day
What counts as a cup? 1 cup of raw or cooked fruit or 100% fruit juice; ½ cup dried fruit
Eat 6 ounces every day
What counts as an ounce? 1 slice of bread; ½ cup of cooked rice, cereal, or pasta; 1 ounce of ready-to eat cereal
Get 3 cups every day
What counts as a cup? 1 cup of milk, yogurt, or fortified soymilk; 1½ ounces natural or 2 ounces processed cheese
Eat 5½ ounces every day
What counts as an ounce?1 ounce of lean meat, poultry, or fish; 1 egg; 1 Tbsp peanut butter; ½ ounce nuts or seeds; ⁄ cup beans or peas
Look out for salt (sodium) in foods you buy. Compare sodium in foods and choose those with a lower number.
Drink water instead of sugary drinks. Eat sugary desserts less often.
Make foods that are high in solid fats—such as cakes, cookies, ice cream, pizza, cheese, sausages, and hot dogs—occasional choices, not every day foods.
Limit empty calories to less than 260 per day, based on a 2,000 calorie diet.
Be physically active your way
Pick activities you like and do each for at least 10 minutes at a time. Every bit adds up, and health benefits increase as you spend more time being active.
Children and adolescents: get 60 minutes or more a day.
Adults: get 2 hours and 30 minutes or more a week of activity that requires moderate effort, such as brisk walking.
#300446/Ver.01/16
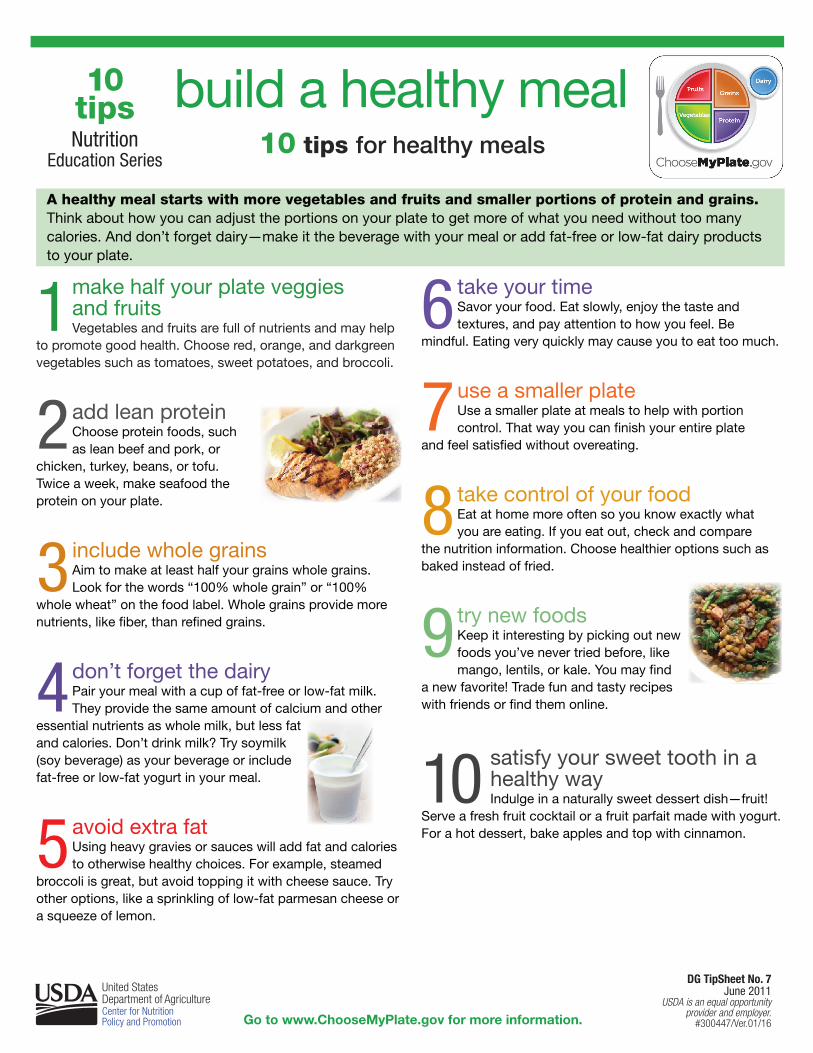
A healthy meal starts with more vegetables and fruits and smaller portions of protein and grains. Think about how you can adjust the portions on your plate to get more of what you need without too many calories. And don’t forget dairy—make it the beverage with your meal or add fat-free or low-fat dairy products to your plate.
build a healthy meal10 tips for healthy meals
10 tipsNutrition
Education Series
take your timeSavor your food. Eat slowly, enjoy the taste and textures, and pay attention to how you feel. Be
mindful. Eating very quickly may cause you to eat too much.
use a smaller plateUse a smaller plate at meals to help with portion control. That way you can finish your entire plate
and feel satisfied without overeating.
take control of your foodEat at home more often so you know exactly what you are eating. If you eat out, check and compare
the nutrition information. Choose healthier options such as baked instead of fried.
try new foodsKeep it interesting by picking out new foods you’ve never tried before, like mango, lentils, or kale. You may find
a new favorite! Trade fun and tasty recipes with friends or find them online.
satisfy your sweet tooth in a healthy wayIndulge in a naturally sweet dessert dish—fruit!
Serve a fresh fruit cocktail or a fruit parfait made with yogurt. For a hot dessert, bake apples and top with cinnamon.
make half your plate veggies and fruitsVegetables and fruits are full of nutrients and may help
to promote good health. Choose red, orange, and darkgreen vegetables such as tomatoes, sweet potatoes, and broccoli.
add lean proteinChoose protein foods, such as lean beef and pork, or
chicken, turkey, beans, or tofu. Twice a week, make seafood the protein on your plate.
include whole grainsAim to make at least half your grains whole grains. Look for the words “100% whole grain” or “100%
whole wheat” on the food label. Whole grains provide more nutrients, like fiber, than refined grains.
don’t forget the dairyPair your meal with a cup of fat-free or low-fat milk. They provide the same amount of calcium and other
essential nutrients as whole milk, but less fat and calories. Don’t drink milk? Try soymilk (soy beverage) as your beverage or include fat-free or low-fat yogurt in your meal.
avoid extra fatUsing heavy gravies or sauces will add fat and calories to otherwise healthy choices. For example, steamed
broccoli is great, but avoid topping it with cheese sauce. Try other options, like a sprinkling of low-fat parmesan cheese or a squeeze of lemon.
1 6
7
8
9
10
2
3
4
5
United States Department of Agriculture Center for Nutrition Policy and Promotion Go to www.ChooseMyPlate.gov for more information.
DG TipSheet No. 7June 2011
USDA is an equal opportunity provider and employer.
#300447/Ver.01/16
M A K E H A L F Y O U R P L AT E F R U I T S A N D V E G G I E S
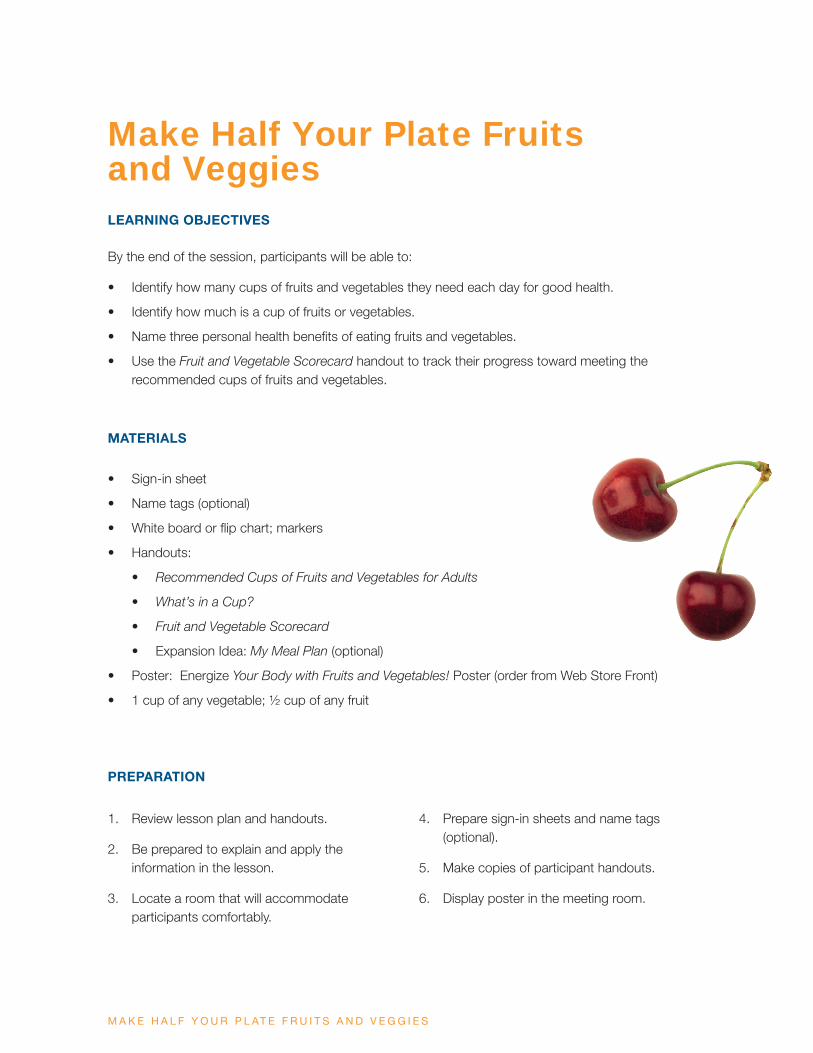
Make Half Your Plate Fruits and VeggiesLEARNING OBJECTIVES
By the end of the session, participants will be able to:
• Identify how many cups of fruits and vegetables they need each day for good health.
• Identify how much is a cup of fruits or vegetables.
• Name three personal health benefits of eating fruits and vegetables.
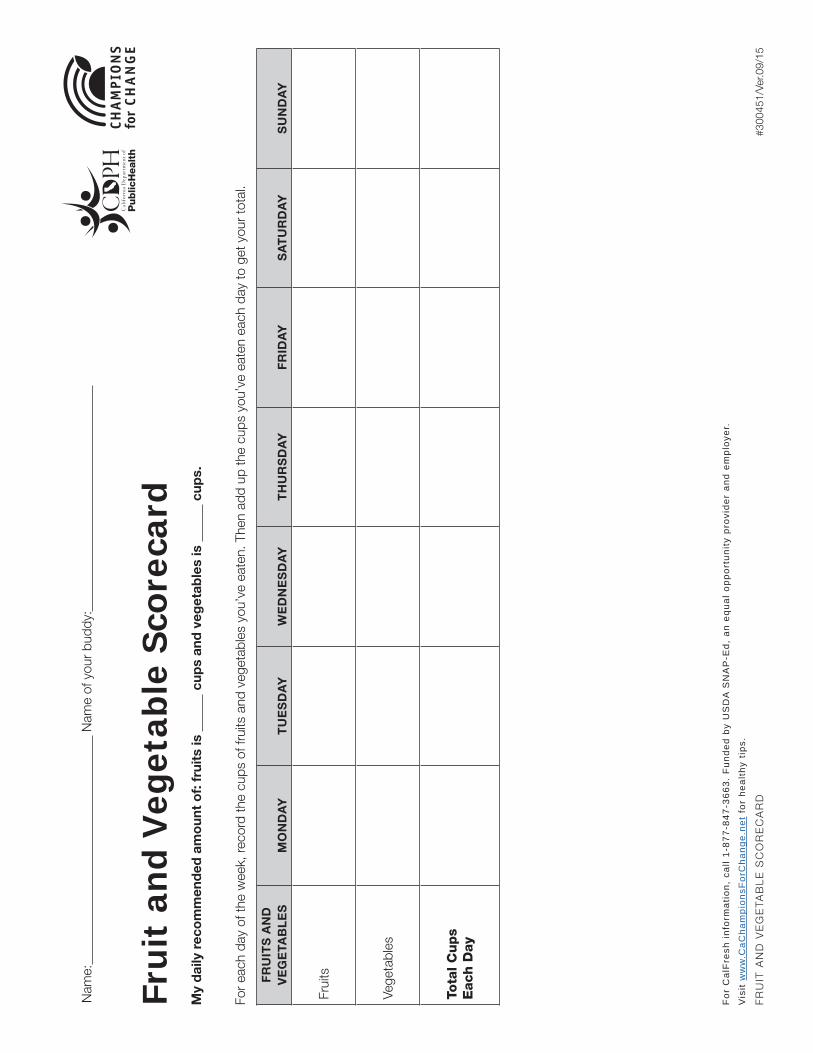
• Use the Fruit and Vegetable Scorecard handout to track their progress toward meeting the recommended cups of fruits and vegetables.
MATERIALS
• Sign-in sheet
• Name tags (optional)
• White board or flip chart; markers
• Handouts:
• Recommended Cups of Fruits and Vegetables for Adults
• What’s in a Cup?
• Fruit and Vegetable Scorecard
• Expansion Idea: My Meal Plan (optional)
• Poster: Energize Your Body with Fruits and Vegetables! Poster (order from Web Store Front)
• 1 cup of any vegetable; ½ cup of any fruit
PREPARATION
1. Review lesson plan and handouts.
2. Be prepared to explain and apply the information in the lesson.
3. Locate a room that will accommodate participants comfortably.
4. Prepare sign-in sheets and name tags (optional).
5. Make copies of participant handouts.
6. Display poster in the meeting room.
M A K E H A L F Y O U R P L AT E F R U I T S A N D V E G G I E S
• • • • • • • • • • • • • • • • • • • • • • • • • • • • • • • • • • • • • • • • • • • • • • • • • • • • • • • • • • • • • • • • • • • • • • • •
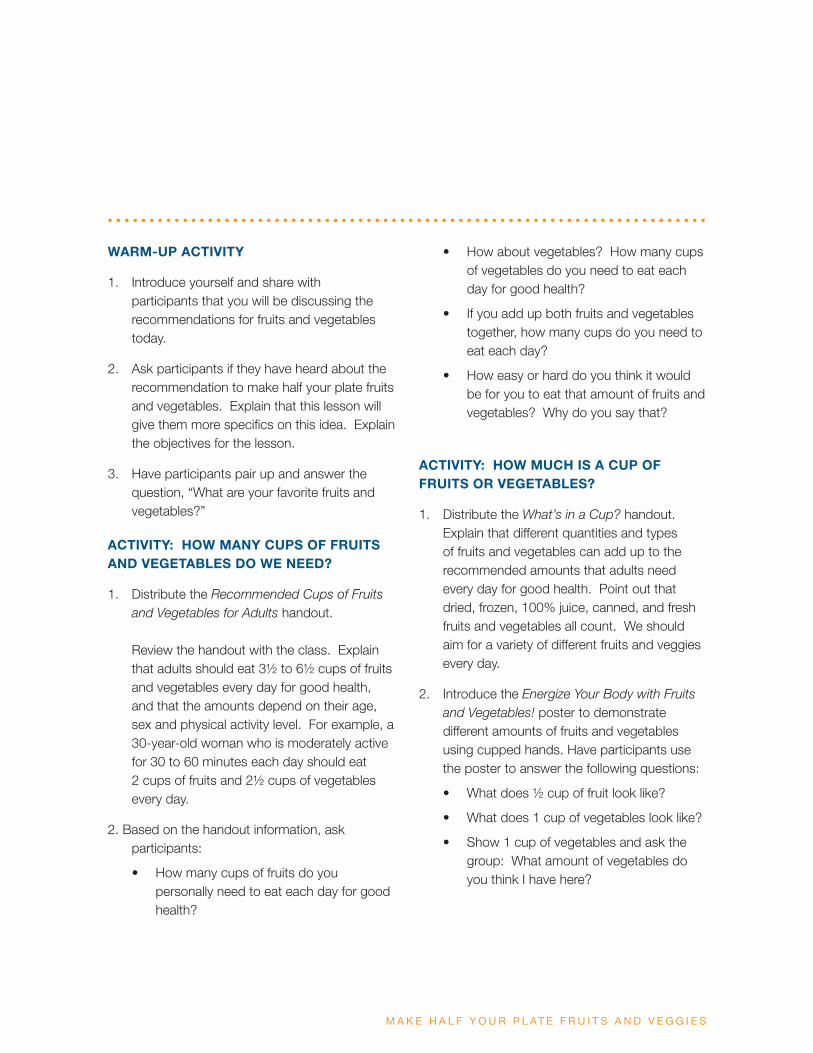
WARM-UP ACTIVITY
1. Introduce yourself and share with participants that you will be discussing the recommendations for fruits and vegetables today.
2. Ask participants if they have heard about the recommendation to make half your plate fruits and vegetables. Explain that this lesson will give them more specifics on this idea. Explain the objectives for the lesson.
3. Have participants pair up and answer the question, “What are your favorite fruits and vegetables?”
ACTIVITY: HOW MANY CUPS OF FRUITS AND VEGETABLES DO WE NEED?
1. Distribute the Recommended Cups of Fruits and Vegetables for Adults handout. Review the handout with the class. Explain that adults should eat 3½ to 6½ cups of fruits and vegetables every day for good health, and that the amounts depend on their age, sex and physical activity level. For example, a 30-year-old woman who is moderately active for 30 to 60 minutes each day should eat 2 cups of fruits and 2½ cups of vegetables every day.
2. Based on the handout information, ask participants:
• How many cups of fruits do you personally need to eat each day for good health?
• How about vegetables? How many cups of vegetables do you need to eat each day for good health?
• If you add up both fruits and vegetables together, how many cups do you need to eat each day?
• How easy or hard do you think it would be for you to eat that amount of fruits and vegetables? Why do you say that?
ACTIVITY: HOW MUCH IS A CUP OF FRUITS OR VEGETABLES?
1. Distribute the What’s in a Cup? handout. Explain that different quantities and types of fruits and vegetables can add up to the recommended amounts that adults need every day for good health. Point out that dried, frozen, 100% juice, canned, and fresh fruits and vegetables all count. We should aim for a variety of different fruits and veggies every day.
2. Introduce the Energize Your Body with Fruits and Vegetables! poster to demonstrate different amounts of fruits and vegetables using cupped hands. Have participants use the poster to answer the following questions:
• What does ½ cup of fruit look like?
• What does 1 cup of vegetables look like?
• Show 1 cup of vegetables and ask the group: What amount of vegetables do you think I have here?
M A K E H A L F Y O U R P L AT E F R U I T S A N D V E G G I E S
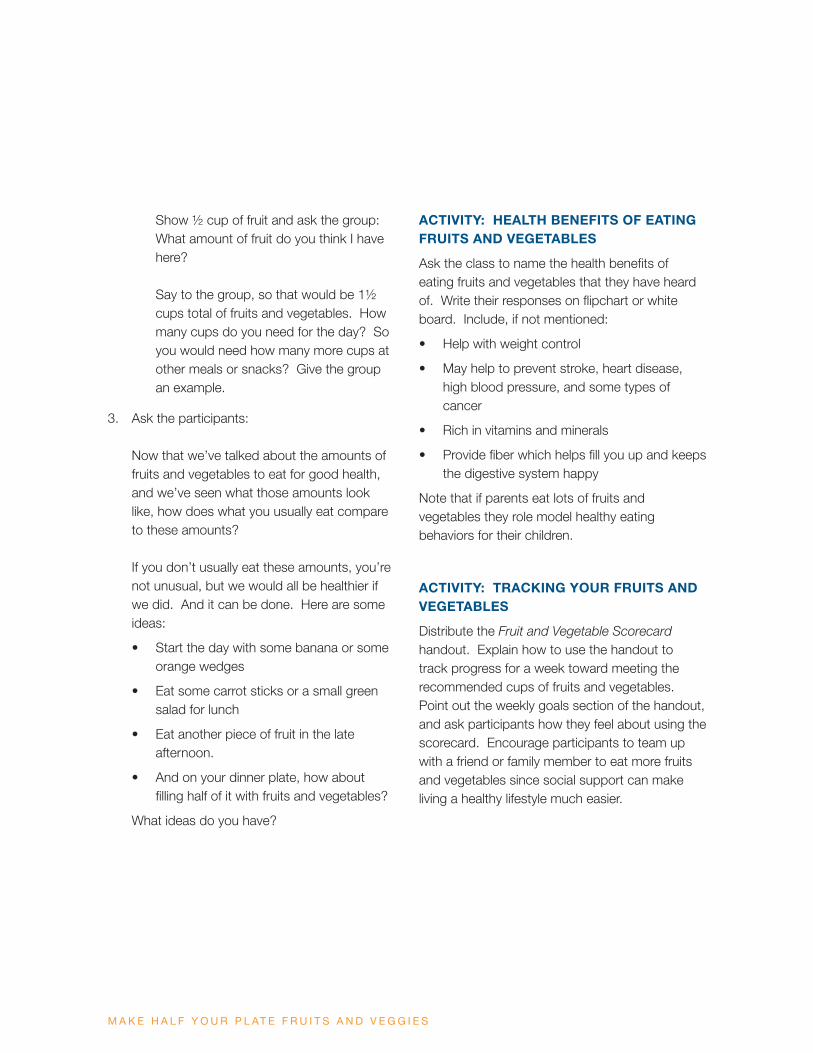
Show ½ cup of fruit and ask the group: What amount of fruit do you think I have here? Say to the group, so that would be 1½ cups total of fruits and vegetables. How many cups do you need for the day? So you would need how many more cups at other meals or snacks? Give the group an example.
3. Ask the participants: Now that we’ve talked about the amounts of fruits and vegetables to eat for good health, and we’ve seen what those amounts look like, how does what you usually eat compare to these amounts? If you don’t usually eat these amounts, you’re not unusual, but we would all be healthier if we did. And it can be done. Here are some ideas:
• Start the day with some banana or some orange wedges
• Eat some carrot sticks or a small green salad for lunch
• Eat another piece of fruit in the late afternoon.
• And on your dinner plate, how about filling half of it with fruits and vegetables?
What ideas do you have?
ACTIVITY: HEALTH BENEFITS OF EATING FRUITS AND VEGETABLES
Ask the class to name the health benefits of eating fruits and vegetables that they have heard of. Write their responses on flipchart or white board. Include, if not mentioned:
• Help with weight control
• May help to prevent stroke, heart disease, high blood pressure, and some types of cancer
• Rich in vitamins and minerals
• Provide fiber which helps fill you up and keeps the digestive system happy
Note that if parents eat lots of fruits and vegetables they role model healthy eating behaviors for their children.
ACTIVITY: TRACKING YOUR FRUITS AND VEGETABLES
Distribute the Fruit and Vegetable Scorecard handout. Explain how to use the handout to track progress for a week toward meeting the recommended cups of fruits and vegetables. Point out the weekly goals section of the handout, and ask participants how they feel about using the scorecard. Encourage participants to team up with a friend or family member to eat more fruits and vegetables since social support can make living a healthy lifestyle much easier.
M A K E H A L F Y O U R P L AT E F R U I T S A N D V E G G I E S
ACTIVITY: REVIEW, EVALUATION, PERSONAL NEXT STEPS
1. Ask participants what questions they have about fruits and vegetables and how to plan healthier meals with more fruits and vegetables. Answer any questions. Refer participants to the ChooseMyPlate.gov website for more resources and tips.
2. Do a class evaluation as a group, asking participants to respond to the following questions:
• What is a benefit of eating fruits and vegetables for you personally?
• What are some ways you could increase fruits and vegetables in meals and snacks?
• What did you learn today that was new to you?
• What changes are you planning to make as a result of today’s class?
Thank participants for attending class today and learning more about fruits and vegetables to help them plan healthy meals for their families.
Tips for instructors• Demonstrate how to measure a variety of fresh,
frozen, canned, or dried fruits and vegetables using measuring cups and cupped hands.
• Buy produce samples, or ask your local grocery store or farmers’ market to donate them.
• Remember to handle food safely. To learn more about food safety, visit www.foodsafety.gov.
• Use recipes and tips from various NEOPB cookbooks, as appropriate.
EXPANSION IDEA: PLANNING MEALS AND SNACKS WITH FRUITS AND VEGETABLES
Distribute the My Meal Plan handout. Have participants plan a day’s worth of meals, snacks, and desserts using their recommended amount of fruits and vegetables as a guide. Ask them to share their meal and snack ideas with the group. Refer participants to www.CAChampionsforChange.net for healthy recipes and lifestyle tips.
#300448/Ver.09/15
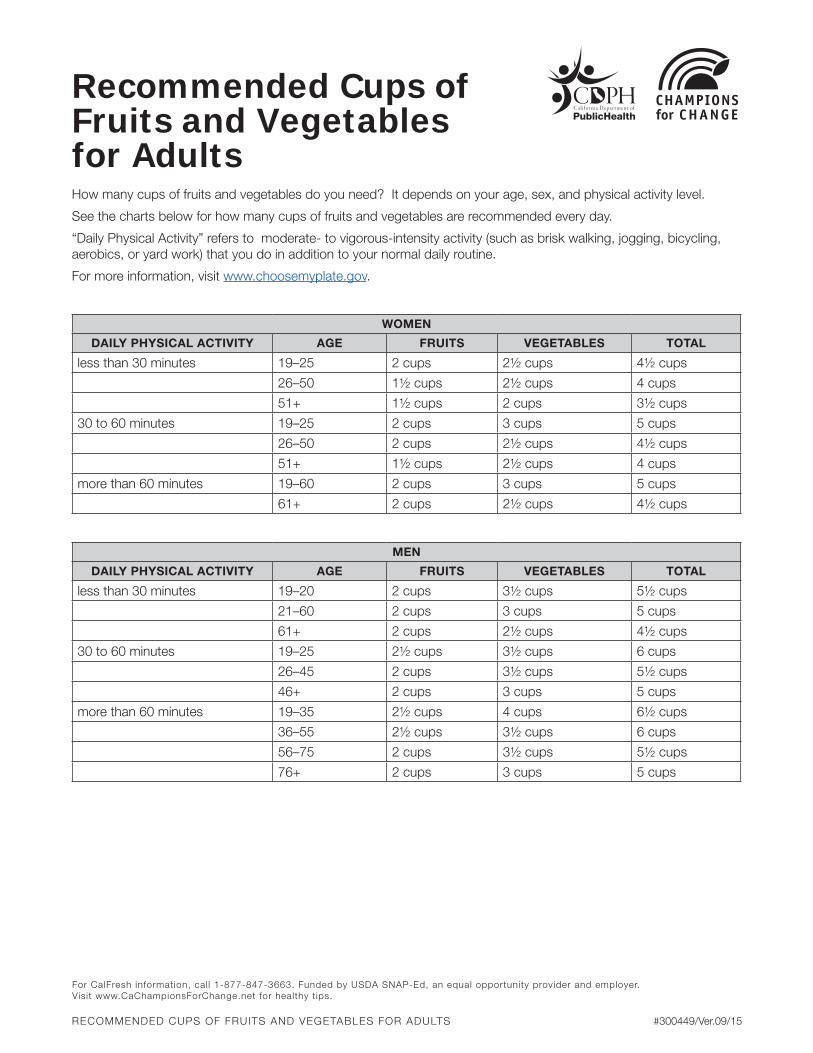
Recommended Cups of Fruits and Vegetables for AdultsHow many cups of fruits and vegetables do you need? It depends on your age, sex, and physical activity level.
See the charts below for how many cups of fruits and vegetables are recommended every day.
“Daily Physical Activity” refers to moderate- to vigorous-intensity activity (such as brisk walking, jogging, bicycling, aerobics, or yard work) that you do in addition to your normal daily routine.
For more information, visit www.choosemyplate.gov.
WOMEN
DAILY PHYSICAL ACTIVITY AGE FRUITS VEGETABLES TOTAL
less than 30 minutes 19–25 2 cups 2½ cups 4½ cups
26–50 1½ cups 2½ cups 4 cups
51+ 1½ cups 2 cups 3½ cups
30 to 60 minutes 19–25 2 cups 3 cups 5 cups
26–50 2 cups 2½ cups 4½ cups
51+ 1½ cups 2½ cups 4 cups
more than 60 minutes 19–60 2 cups 3 cups 5 cups
61+ 2 cups 2½ cups 4½ cups
MEN
DAILY PHYSICAL ACTIVITY AGE FRUITS VEGETABLES TOTAL
less than 30 minutes 19–20 2 cups 3½ cups 5½ cups
21–60 2 cups 3 cups 5 cups
61+ 2 cups 2½ cups 4½ cups
30 to 60 minutes 19–25 2½ cups 3½ cups 6 cups
26–45 2 cups 3½ cups 5½ cups
46+ 2 cups 3 cups 5 cups
more than 60 minutes 19–35 2½ cups 4 cups 6½ cups
36–55 2½ cups 3½ cups 6 cups
56–75 2 cups 3½ cups 5½ cups
76+ 2 cups 3 cups 5 cups
#300449/Ver.09/15
For CalFresh information, cal l 1-877-847-3663. Funded by USDA SNAP-Ed, an equal opportunity provider and employer. Visit www.CaChampionsForChange.net for healthy t ips.
RECOMMENDED CUPS OF FRUITS AND VEGETABLES FOR ADULTS
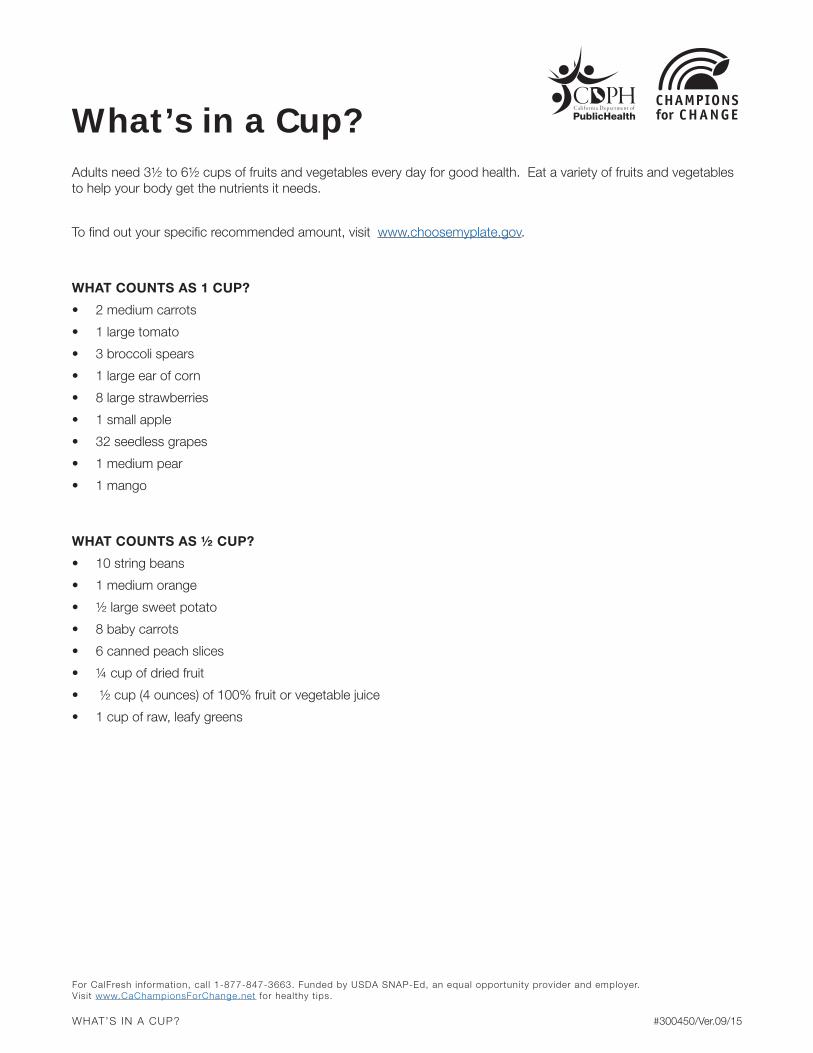
Adults need 3½ to 6½ cups of fruits and vegetables every day for good health. Eat a variety of fruits and vegetables to help your body get the nutrients it needs.
To find out your specific recommended amount, visit www.choosemyplate.gov.
WHAT COUNTS AS 1 CUP?
• 2 medium carrots
• 1 large tomato
• 3 broccoli spears
• 1 large ear of corn
• 8 large strawberries
• 1 small apple
• 32 seedless grapes
• 1 medium pear
• 1 mango
WHAT COUNTS AS ½ CUP?
• 10 string beans
• 1 medium orange
• ½ large sweet potato
• 8 baby carrots
• 6 canned peach slices
• ¼ cup of dried fruit
• ½ cup (4 ounces) of 100% fruit or vegetable juice
• 1 cup of raw, leafy greens
What’s in a Cup?
WHAT’S IN A CUP? #300450/Ver.09/15
For CalFresh information, cal l 1-877-847-3663. Funded by USDA SNAP-Ed, an equal opportunity provider and employer. Visit www.CaChampionsForChange.net for healthy t ips.
#300
451/
Ver.0
9/15
For
Cal
Fre
sh in
form
atio
n, c
all 1
-877
-847
-366
3. F
unde
d by
US
DA
SN
AP
-Ed,
an
equa
l opp
ortu
nity
pro
vide
r an
d em
ploy
er.
Vis
it w
ww
.CaC
ham
pion
sFor
Cha
nge.
net
for
heal
thy
tips.
FR
UIT
AN
D V
EG
ETA
BL
E S
CO
RE
CA
RD
Fru
it a
nd
Veg
etab
le S
core
card
Nam
e:
Nam
e of
you
r bu
ddy:
My
dai
ly r
eco
mm
end
ed a
mo
unt
of:
fru
its
is
cu
ps
and
veg
etab
les
is
cu
ps.
For
each
day
of t
he w
eek,
reco
rd th
e cu
ps o
f fru
its a
nd v
eget
able
s yo
u’ve
eat
en. T
hen
add
up th
e cu
ps y
ou’v
e ea
ten
each
day
to g
et y
our
tota
l.
FR
UIT
S A
ND
V
EG
ETA
BL
ES
MO
ND
AY
TU
ES
DA
YW
ED
NE
SD
AY
TH
UR
SD
AY
FR
IDA
YS
AT
UR
DA
YS
UN
DA
Y
Frui
ts
Vege
tabl
es
Tota
l C
up
s
Each
Day
#300
451/
Ver.0
9/15
For
Cal
Fre
sh in
form
atio
n, c
all 1
-877
-847
-366
3. F
unde
d by
US
DA
SN
AP
-Ed,
an
equa
l opp
ortu
nity
pro
vide
r an
d em
ploy
er.
Vis
it w
ww
.CaC
ham
pion
sFor
Cha
nge.
net
for
heal
thy
tips.
FR
UIT
AN
D V
EG
ETA
BL
E S
CO
RE
CA
RD
Step
s to
mee
t m
y fr
uit
an
d ve
geta
ble
goal
s
Nam
e:
Nam
e of
you
r bu
ddy:
3 S
TE
PS
I C
AN
TA
KE
TO
ME
ET
MY
GO
AL
SM
Y R
EW
AR
DS
(exa
mpl
es: p
ack
heal
thy
snac
ks; m
ake
a sh
oppi
ng li
st a
nd in
clud
e lo
ts o
f fru
its
and
vege
tabl
es; fi
nd a
bud
dy to
sup
port
my
effo
rts
to e
at h
ealth
ier)
1.
2.
3.
(exa
mpl
es: g
o da
ncin
g; p
lan
a fu
n ac
tivity
with
my
fam
ily;
spen
d a
day
with
my
best
frie
nd)
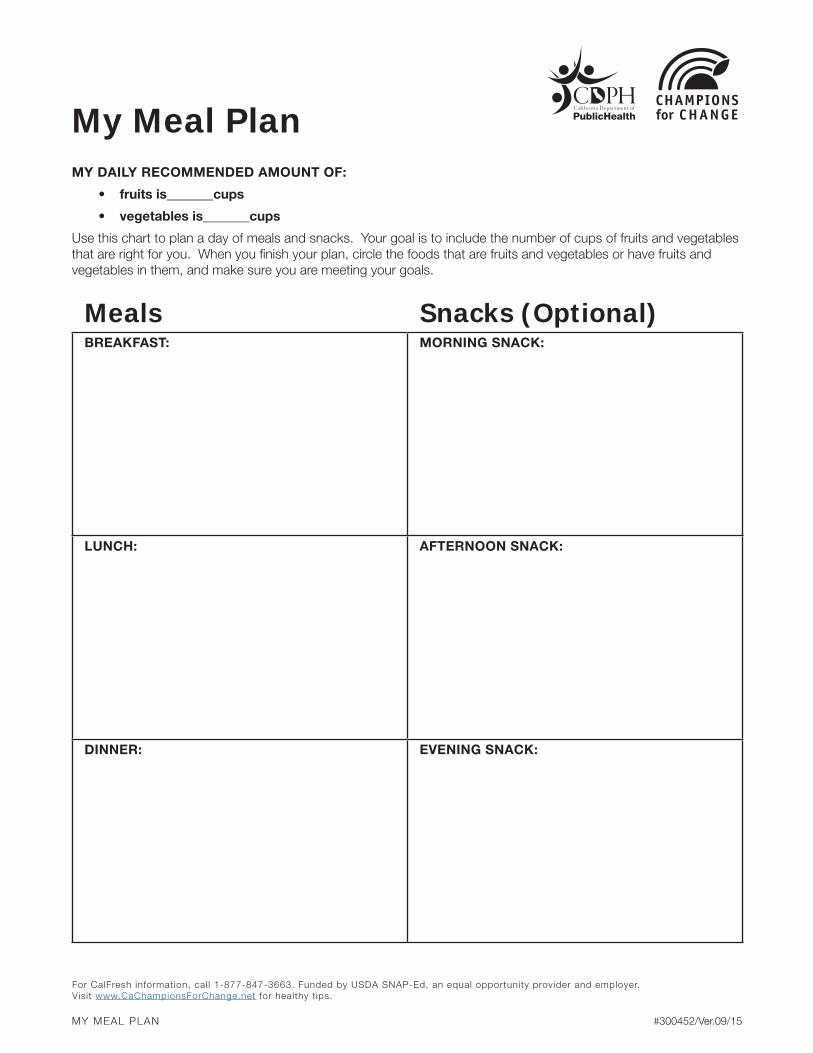
MY DAILY RECOMMENDED AMOUNT OF:
• fruits is_______cups
• vegetables is_______cups
Use this chart to plan a day of meals and snacks. Your goal is to include the number of cups of fruits and vegetables that are right for you. When you finish your plan, circle the foods that are fruits and vegetables or have fruits and vegetables in them, and make sure you are meeting your goals.
My Meal Plan
Meals Snacks (Optional)BREAKFAST: MORNING SNACK:
LUNCH: AFTERNOON SNACK:
DINNER: EVENING SNACK:
MY MEAL PLAN #300452/Ver.09/15
For CalFresh information, cal l 1-877-847-3663. Funded by USDA SNAP-Ed, an equal opportunity provider and employer. Visit www.CaChampionsForChange.net for healthy t ips.
?
Choosing Healthy Beverages
LEARNING OBJECTIVES
By the end of the lesson, participants will be able to:
• Describe how healthy beverages fit into the MyPlate dietary recommendations.
• Navigate a Nutrition Facts label to find the Ingredient List.
• Understand the link between sugary drinks, obesity, and type 2 diabetes.
• Name types of sugary drinks in their diets.
• Name drinks they and their family can consume instead of sugary drinks.
MATERIALS
• Sign-in sheet
• Name tags (optional)
• Self-stick flip chart paper
• Colored markers
• Nutrition Glossary www.cdph.ca.gov/programs/neopb/Documents/RYD-AR1-Glossary.pdf
• Drink Label Card Calculations Key www.cdph.ca.gov/programs/neopb/Documents/RYD-DrinkLabelCards_Final_Print_7_2013.pdf
• Granulated sugar or sugar cubes (approximately one pound)
• Re-sealable snack bags (6 ½” to 3 ¼”size)
• One 20 ounce soda bottle
• Set of Drink Label Cards www.cdph.ca.gov/programs/neopb/Documents/RYD-DrinkLabelCards_Final_Print_7_2013.pdf
• Cucumber Mint Breeze ingredients for water tasting:
o 1 cucumber, washed and sliced o 1 bunch mint, washedo Ice
o Watero Pitcher or dispensero Tasting Cups
• Show Me the Sugar! handout www.cdph.ca.gov/programs/neopb/Documents/ShowMetheSugar_EN.pdf
• Cucumber Mint Breeze recipe card www.cdph.ca.gov/programs/neopb/Documents/CucumberMintBreeze.pdf
• Choose MyPlate handout www.choosemyplate.gov/food-groups/downloads/TenTips/DGTipsheet1ChooseMyPlate.pdf
• Make Better Beverage Choices—10 Tips to Get Started handout www.choosemyplate.gov/food-groups/downloads/TenTips/DGTipsheet19MakeBetterBeverageChoices.pdf
?
WARM-UP ACTIVITY: WHAT ARE YOU DRINKING?
1. Introduce yourself and share a short professional background and your organization. Optional: Ask the participants to introduce themselves.
2. Explain that today’s topics include: 1) how healthy beverages fit into the MyPlate dietary recommendations; 2) the link between drinking sugary drinks, obesity, and type 2 diabetes; 3) the types of added sugar and sugary drinks that may be in their diets; and 4) healthy beverages they and their families can drink in place of sugar sweetened beverages.
• • • • • • • • • • • • • • • • • • • • • • • • • • • • • • • • • • • • • • • • • • • • • • • • • • • • • • • • • •
3. Ask participants to volunteer to share beverages they drank yesterday or within the past week. List and tally each type of drink named on the flip chart.
• Instructor Note: If a participant mentions a specific branded product, affirm their participation and name the sugary drink category to which that drink belongs.
• Discuss the different types of drinks in the participants’ diets (e.g., sports drinks, sodas, coffee drinks, etc.).
4. Review the list and thank participants for their willingness to share.
PREPARATION
1. Review lesson curriculum and trainer materials.
2. Make copies of participant handouts.
3. Prepare display bottle:
• Empty and wash 20 ounce soda bottle and cap. Allow to dry completely.
• Remove label from bottle and replace with Nutrition Facts label from Drink Label Cards for the 20 ounce soda.
• Fill bottle with 17 teaspoons of sugar or 17 sugar cubes and replace cap.
4. Using the "Drink Label Cards Calculations Key" for reference, select additional sugary drinks commonly consumed by participants. Label and fill each resealable snack bag with the appropriate amount of sugar cubes or teaspoons of sugar for each drink respectively.
• Prepare the "Cucumber Mint Breeze" recipe for water tasting, as directed in recipe card.
5. Prepare sign in sheets and name tags (optional).
?
DISCUSSION: IMPACT OF SUGARY DRINKS ON OUR HEALTH
1. Explain the link between sugary drinks, obesity, and type 2 diabetes.
• Extra calories from added sugar—like those in sugary drinks—contribute significantly to overweight and obesity. Sugary drinks are the largest source of added sugar in the American diet.1
• Sugary drinks contribute to increased risk for certain chronic diseases such as type 2 diabetes and heart disease.2,3
• Drinking sugary drinks nearly doubles the risk of dental cavities in children.4
• Strong evidence shows that children and adolescents who consume more sugary drinks have higher body weight compared to those who drink less.5
• And, adults who drink one or more sugary drinks a day are 27% more likely to be overweight than adults who do not drink sugary drinks.6
Ask the group: What do you think about this information? What does it mean to you?
2. The California Department of Public Health created the Rethink Your Drink Campaign.
The Campaign:
• Educates Californians about healthy drinks;
• Helps Californians recognize the amount of added sugar and calories in sugary drinks;
• Communicates the link to health risks.
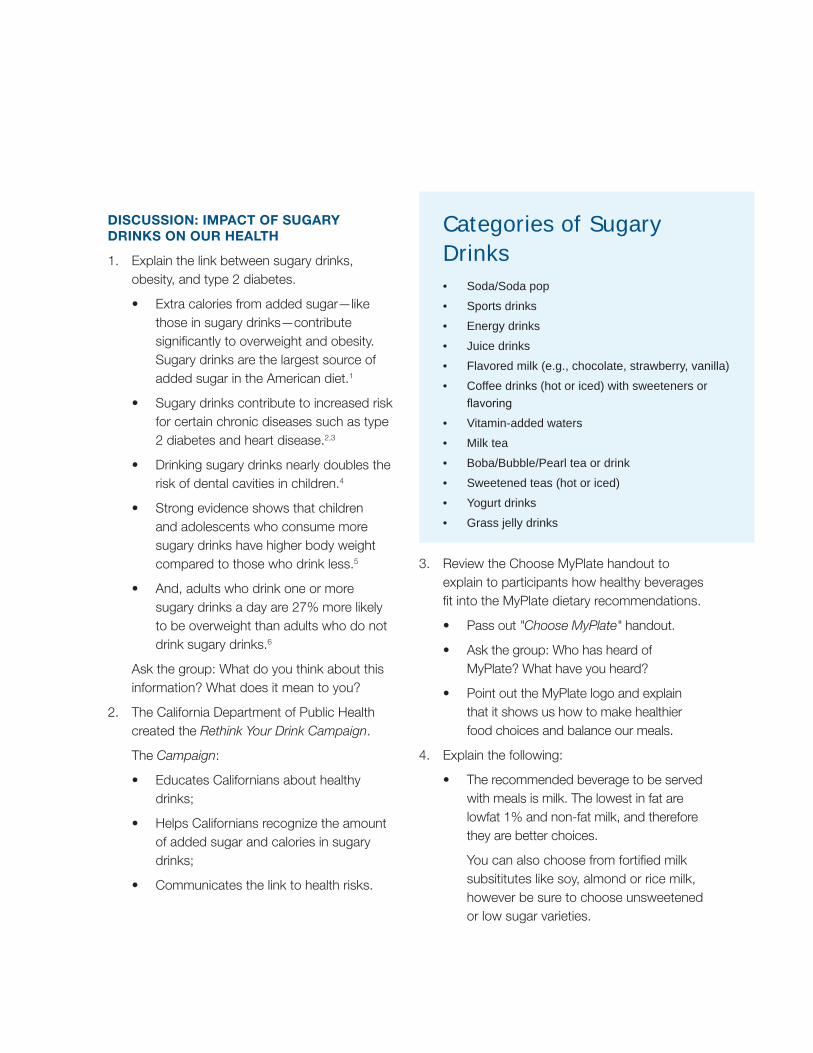
Categories of Sugary Drinks• Soda/Soda pop
• Sports drinks
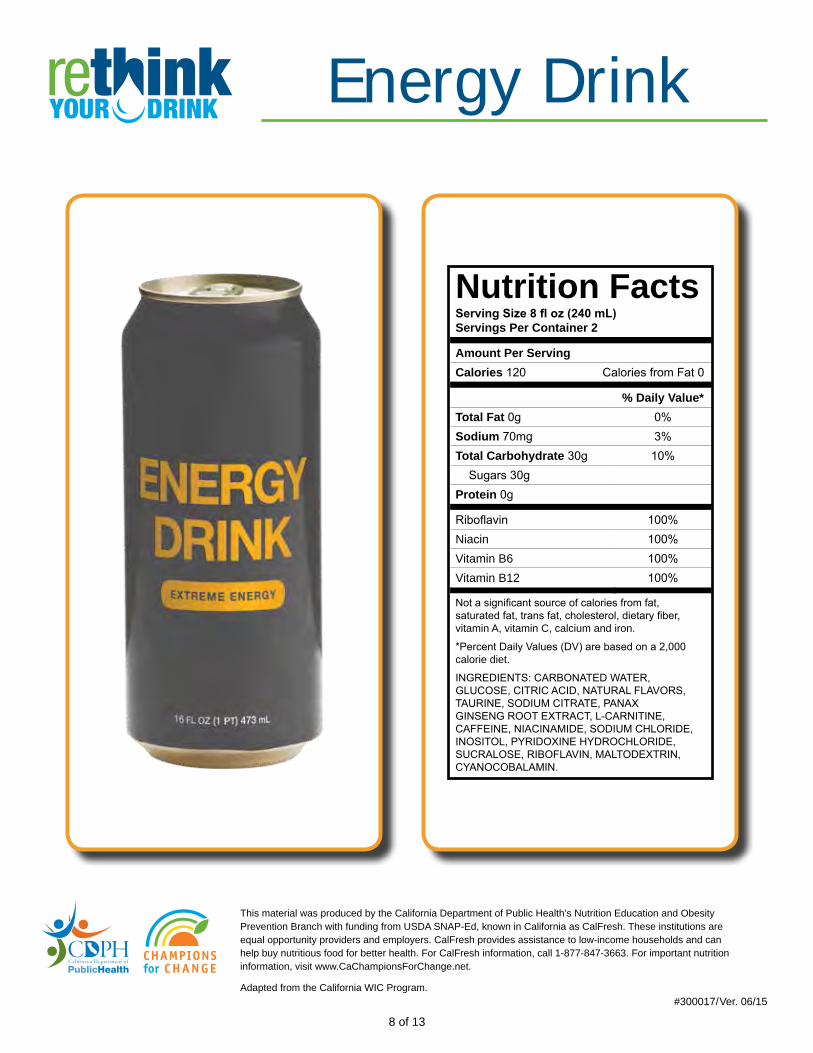
• Energy drinks
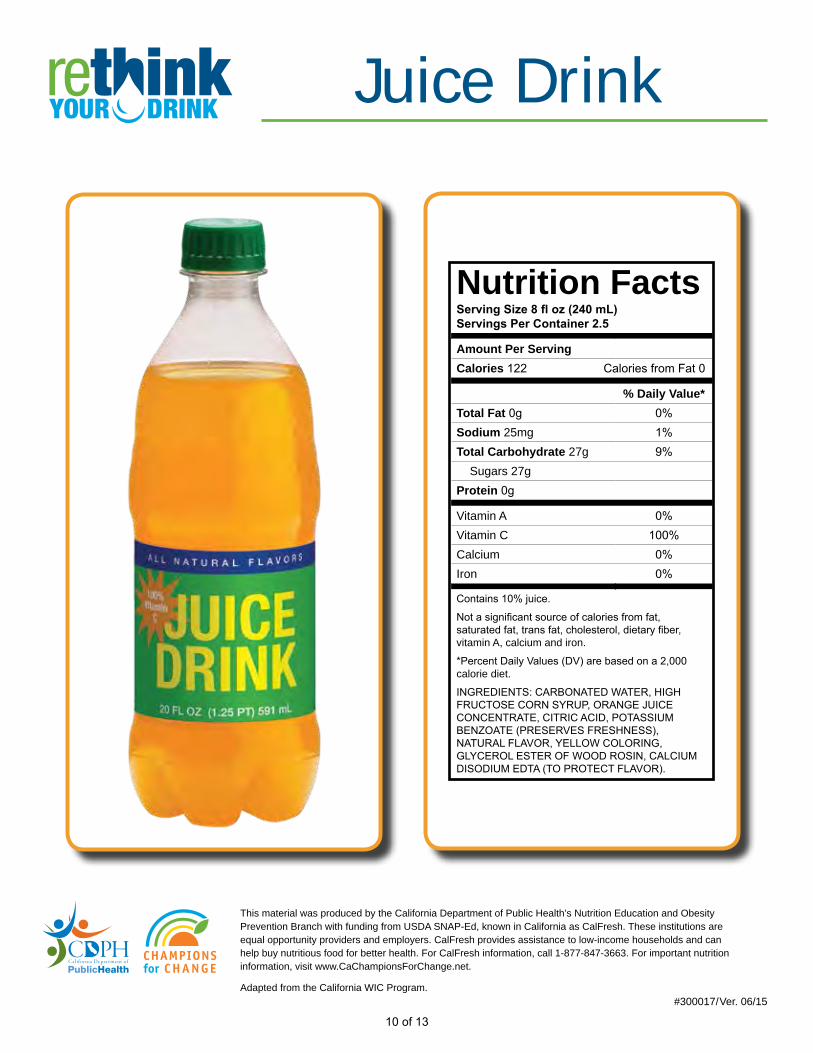
• Juice drinks
• Flavored milk (e.g., chocolate, strawberry, vanilla)
• Coffee drinks (hot or iced) with sweeteners or flavoring
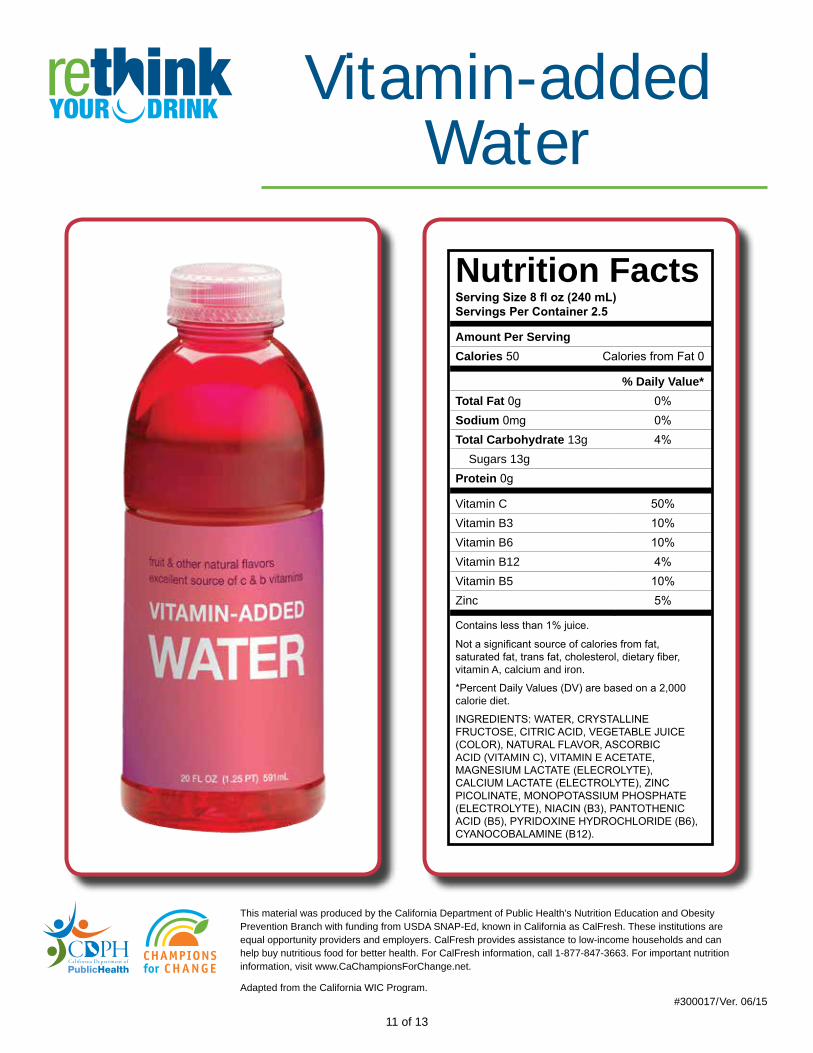
• Vitamin-added waters
• Milk tea
• Boba/Bubble/Pearl tea or drink
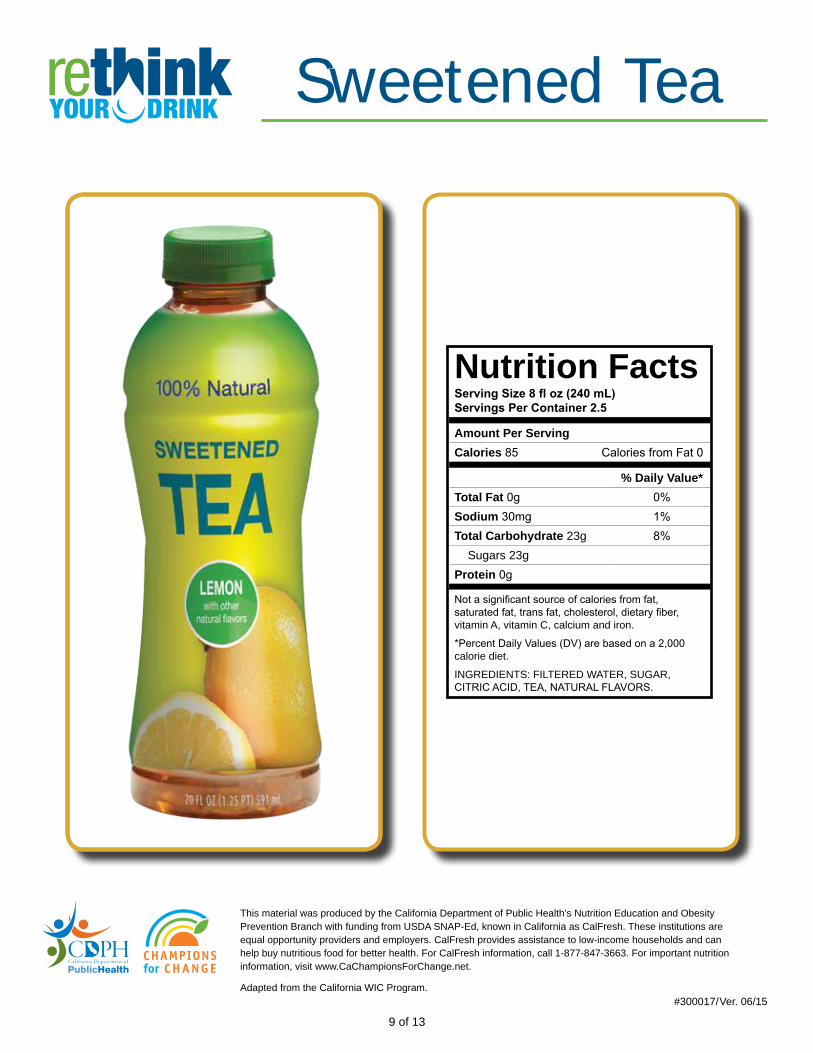
• Sweetened teas (hot or iced)
• Yogurt drinks
• Grass jelly drinks
3. Review the Choose MyPlate handout to explain to participants how healthy beverages fit into the MyPlate dietary recommendations.
• Pass out "Choose MyPlate" handout.
• Ask the group: Who has heard of MyPlate? What have you heard?
• Point out the MyPlate logo and explain that it shows us how to make healthier food choices and balance our meals.
4. Explain the following:
• The recommended beverage to be served with meals is milk. The lowest in fat are lowfat 1% and non-fat milk, and therefore they are better choices.
You can also choose from fortified milk subsititutes like soy, almond or rice milk, however be sure to choose unsweetened or low sugar varieties.
? S E C T I O N 2 • N U T R I T I O N L E S S O N S
o Instructor Note: If parents and caregivers are in the audience, remind them that children over age 2 can drink lowfat 1% and non-fat milk too!
• There are some foods and beverages made up almost entirely of added sugar. In fact, these foods and beverages do not contain enough of any nutrient to put them into any food group within MyPlate. Sugary drinks are one of these, and therefore do not belong to any food group.
5. Using the prepared and labeled soda container, showcase the amount of sugar in one 20 oz. soda.
• Ask the group: What do you think about this amount of sugar?
6. Use the prepared bags of sugar to show the amount of sugar in each sugary drink named.
• Ask the group: What surprises you about this information?
7. Use a green colored marker to circle the healthy drinks on the list developed during the warm up activity: water, seltzer water, non-fat and lowfat 1% milk and 100% juice.
8. Close this portion of the lesson by defining sugary drinks as drinks that often provide added calories and sugar, with few essential nutrients.
ACTIVITY: LABEL READING
1. Pass out the "Show Me the Sugar!" handout.
• Ask the group: Which of these names for sugar do you recognize? Which ones have you seen on food packages?
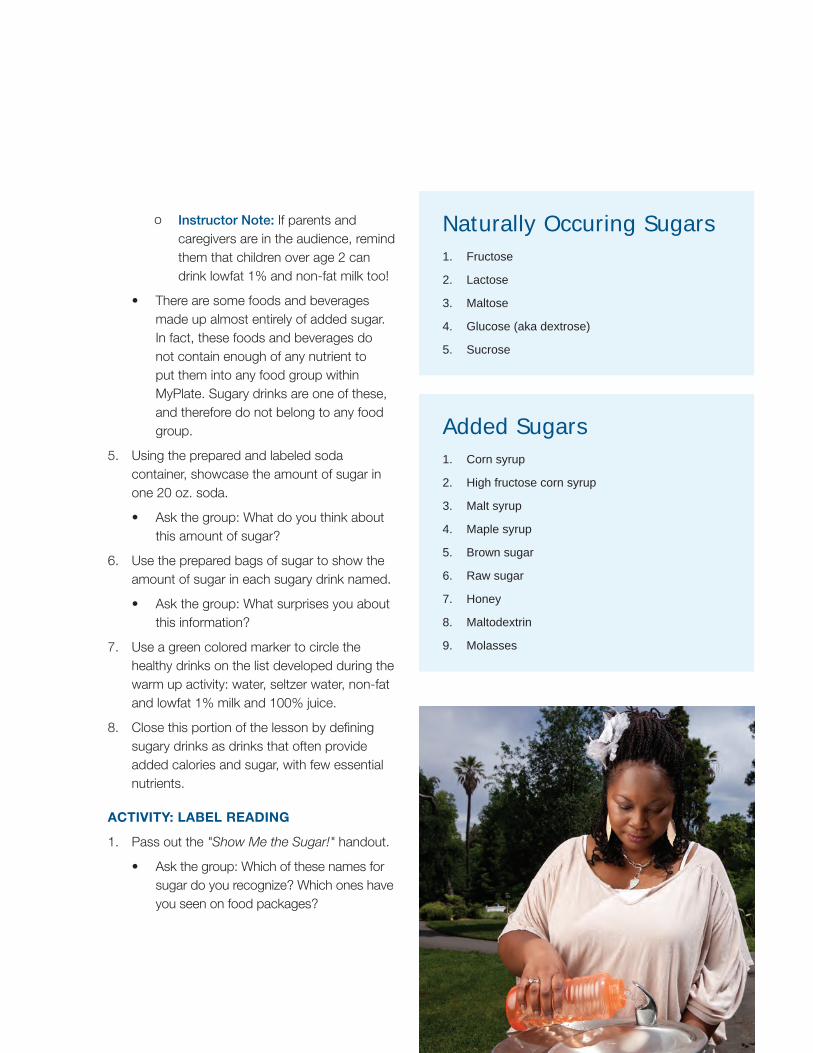
Naturally Occuring Sugars1. Fructose
2. Lactose
3. Maltose
4. Glucose (aka dextrose)
5. Sucrose
Added Sugars1. Corn syrup
2. High fructose corn syrup
3. Malt syrup
4. Maple syrup
5. Brown sugar
6. Raw sugar
7. Honey
8. Maltodextrin
9. Molasses
?S E C T I O N 2 • N U T R I T I O N L E S S O N S
ACTIVITY: MAKING BETTER BEVERAGE CHOICES
1. Pass out the "Make Better Beverage Choices" handout.
• Since participants should now be familiar with sugary drinks, sugary drinks' impact on health and that people consume too many sugary drinks, ask them what they think about changing their consumption patterns.
• Refer to the handout. Highlight to participants that tip #9 says, “Check the Facts: Use the Nutrition Facts label to choose beverages at the grocery store. The label contains information about total sugars, fats, and calories to help you make better choices.”
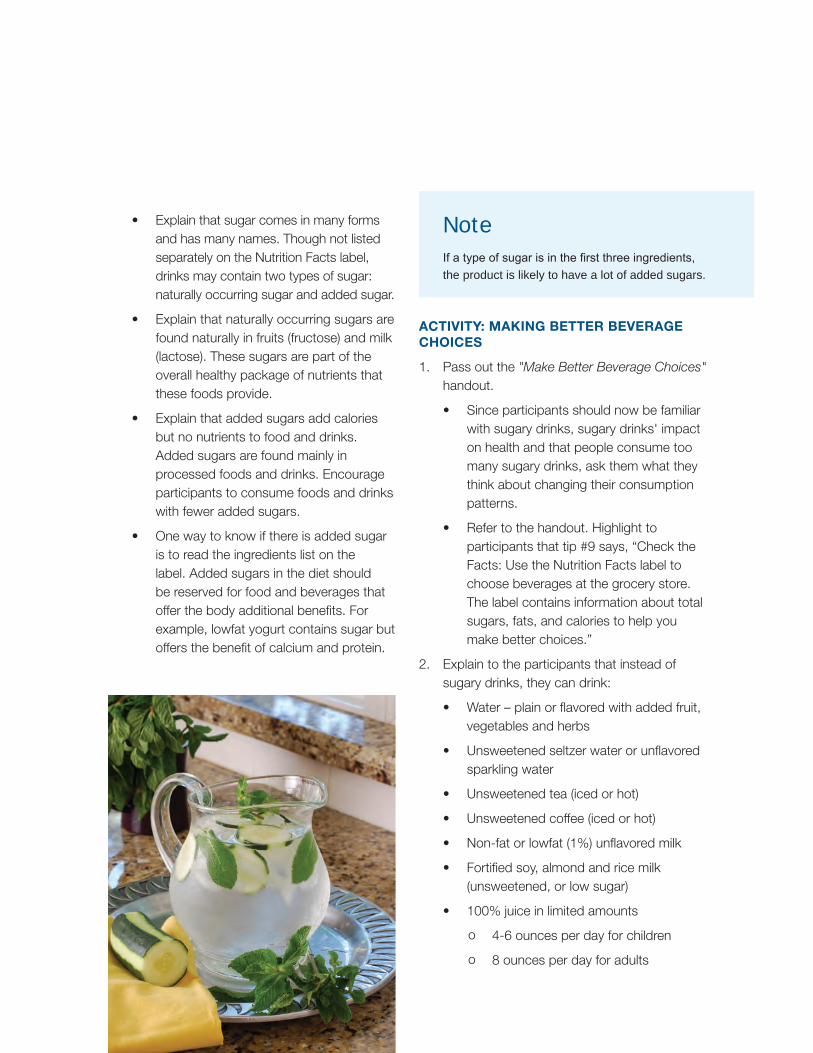
2. Explain to the participants that instead of sugary drinks, they can drink:
• Water – plain or flavored with added fruit, vegetables and herbs
• Unsweetened seltzer water or unflavored sparkling water
• Unsweetened tea (iced or hot)
• Unsweetened coffee (iced or hot)
• Non-fat or lowfat (1%) unflavored milk
• Fortified soy, almond and rice milk (unsweetened, or low sugar)
• 100% juice in limited amounts
o 4-6 ounces per day for children
o 8 ounces per day for adults
NoteIf a type of sugar is in the first three ingredients, the product is likely to have a lot of added sugars.
• Explain that sugar comes in many forms and has many names. Though not listed separately on the Nutrition Facts label, drinks may contain two types of sugar: naturally occurring sugar and added sugar.
• Explain that naturally occurring sugars are found naturally in fruits (fructose) and milk (lactose). These sugars are part of the overall healthy package of nutrients that these foods provide.
• Explain that added sugars add calories but no nutrients to food and drinks. Added sugars are found mainly in processed foods and drinks. Encourage participants to consume foods and drinks with fewer added sugars.
• One way to know if there is added sugar is to read the ingredients list on the label. Added sugars in the diet should be reserved for food and beverages that offer the body additional benefits. For example, lowfat yogurt contains sugar but offers the benefit of calcium and protein.
? S E C T I O N 2 • N U T R I T I O N L E S S O N S
ACTIVITY: FLAVORED WATER TASTING
1. Refer back to the list of drinks from the beginning of class. Encourage participants to make better beverage choices.
2. Explain to participants that there are simple and creative ways to make water tasty.
3. Distribute recipe cards and water samples. Have participants share their reactions and ideas for other flavored water combinations.
4. Thank the participants for coming and encourage them to drink water—instead of sugary beverages—for their health.
Expansion Idea
Advanced Label ReadingMATERIALS
• Calculating How Much Sugar is in a Container handout http://www.cdph.ca.gov/programs/neopb/Documents/CalculatingSugar-EN.pdf
• Drink Label Cards (one per pair)
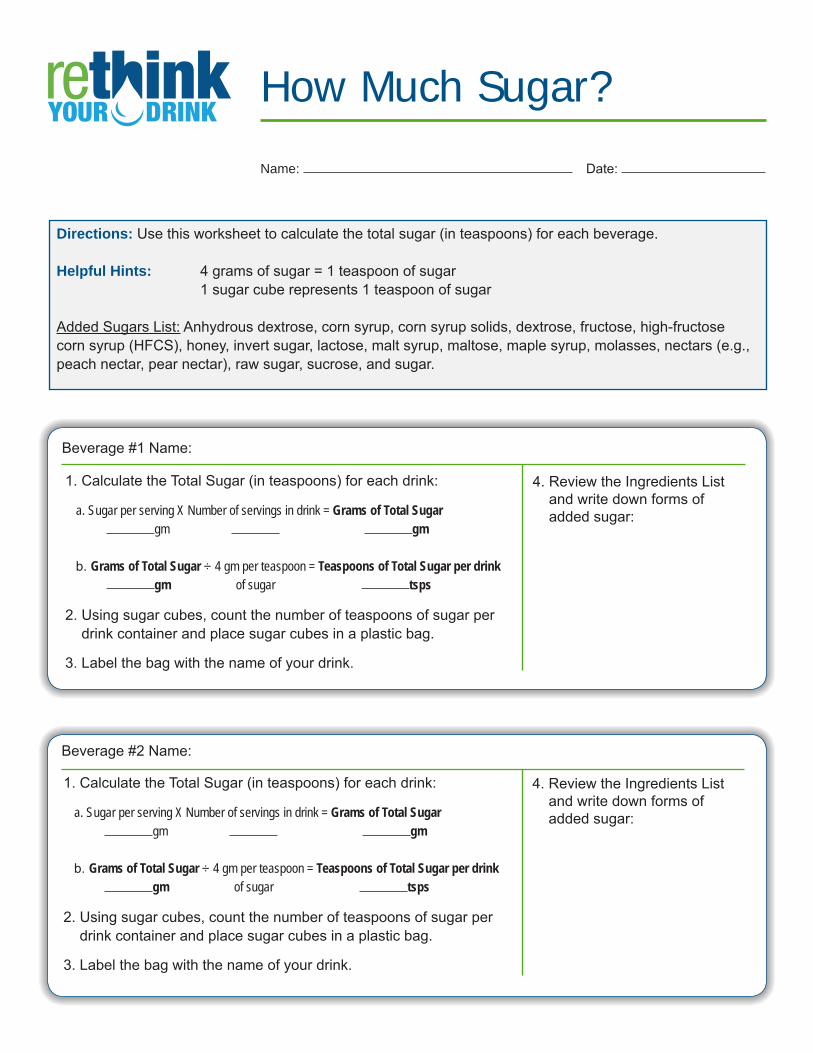
• How Much Sugar? worksheet http://www.cdph.ca.gov/programs/neopb/Documents/RYD-L1B1-HowMuchSugar.pdf
• Pencils
• Calculators (optional)
• Granulated sugar or sugar cubes
• Measuring teaspoons
• Clear eight- or nine-ounce cups
ACTIVITY
1. Have the participants get into pairs. Pass out the materials to each pair.
2. Discuss that the objective of this activity is to learn how much sugar is in some of the most common sugary drinks by using the Nutrition Facts label to calculate the amount of sugar they contain.
3. Explain to the participants that you will be teaching them how to calculate the amount of sugar in the beverages they commonly drink by reading a Nutrition Facts label.
?
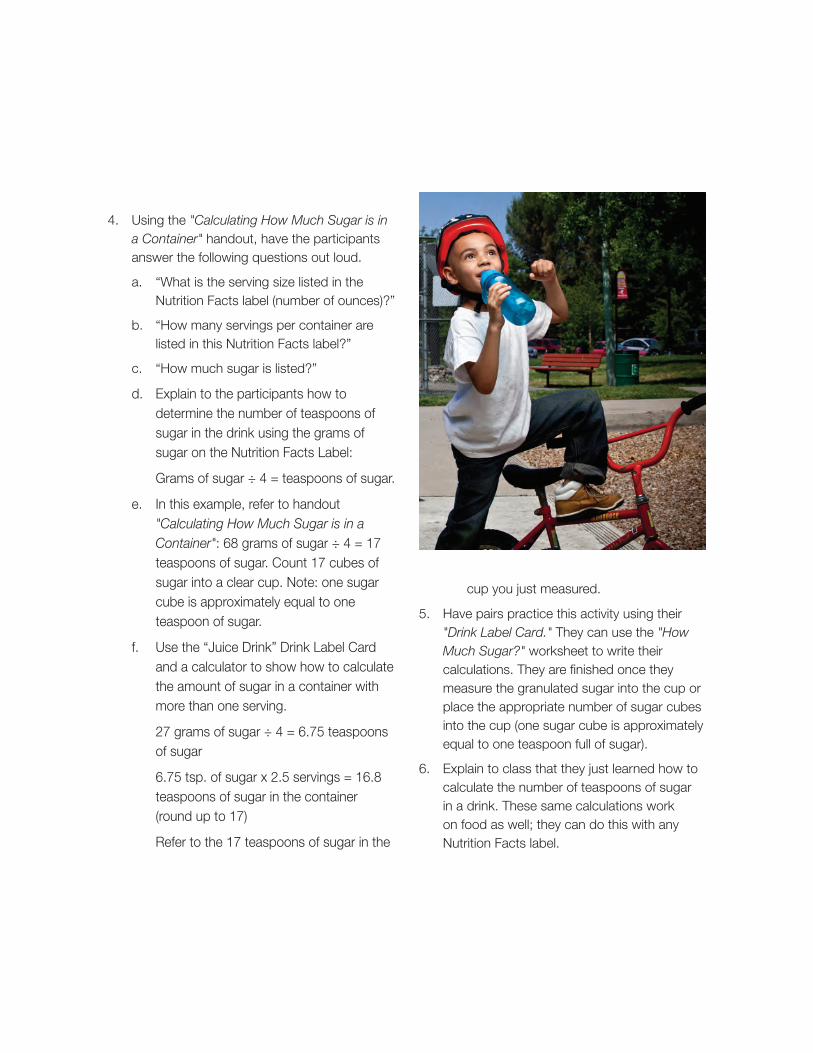
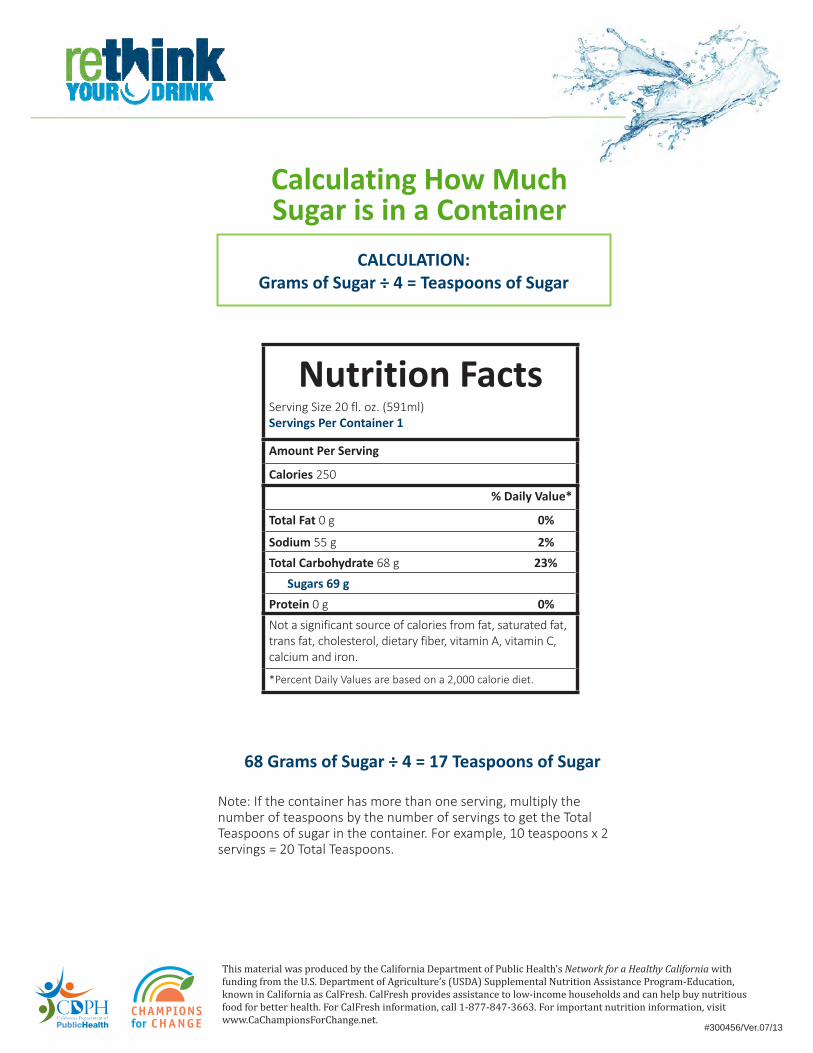
4. Using the "Calculating How Much Sugar is in a Container" handout, have the participants answer the following questions out loud.
a. “What is the serving size listed in the Nutrition Facts label (number of ounces)?”
b. “How many servings per container are listed in this Nutrition Facts label?”
c. “How much sugar is listed?”
d. Explain to the participants how to determine the number of teaspoons of sugar in the drink using the grams of sugar on the Nutrition Facts Label:
Grams of sugar ÷ 4 = teaspoons of sugar.
e. In this example, refer to handout "Calculating How Much Sugar is in a Container": 68 grams of sugar ÷ 4 = 17 teaspoons of sugar. Count 17 cubes of sugar into a clear cup. Note: one sugar cube is approximately equal to one teaspoon of sugar.
f. Use the “Juice Drink” Drink Label Card and a calculator to show how to calculate the amount of sugar in a container with more than one serving.
27 grams of sugar ÷ 4 = 6.75 teaspoons of sugar
6.75 tsp. of sugar x 2.5 servings = 16.8 teaspoons of sugar in the container (round up to 17)
Refer to the 17 teaspoons of sugar in the
cup you just measured.
5. Have pairs practice this activity using their "Drink Label Card." They can use the "How Much Sugar?" worksheet to write their calculations. They are finished once they measure the granulated sugar into the cup or place the appropriate number of sugar cubes into the cup (one sugar cube is approximately equal to one teaspoon full of sugar).
6. Explain to class that they just learned how to calculate the number of teaspoons of sugar in a drink. These same calculations work on food as well; they can do this with any Nutrition Facts label.
?
REFERENCES
1 Guthrie JF, Morton JF. Food sources of added sweeteners in the diets of Americans. J Am Diet Assoc. Jan 2000;100(1):43-51.
2 Malik VS, Popkin BM, Bray GA, Despres JP, Willett WC, Hu FB. Sugar-sweetened beverages and risk of metabolic syndrome and type 2 diabetes: a meta-analysis. Diabetes Care. Nov 2010; 33(11):2477-2483.
3 Fung TT, Malik V, Rexrode KM, Manson JE, Willett WC, Hu FB. Sweetened beverage consumption and risk of coronary heart disease in women. Am J Clin Nutr. Apr 2009;89(4):1037-1042.
4 Sohn W, Burt BA, Sowers MR. Carbonated soft drinks and dental caries in the primary dentition. J Dent Res. Mar 2006;85(3):262-266.
5 U.S. Department of Agriculture and U.S. Department of Health and Human Services. Dietary Guidelines for Americans, 2010. Washington, DC: U.S. Government Printing Office; December 2010.
6 Babey SH, Jones M, Yu H, Goldstein H. Bubbling over: Soda consumption and its link to obesity in California. Los Angeles, CA: UCLA Center for Public Health Advocacy; 2009.
#300390/Ver.09/15
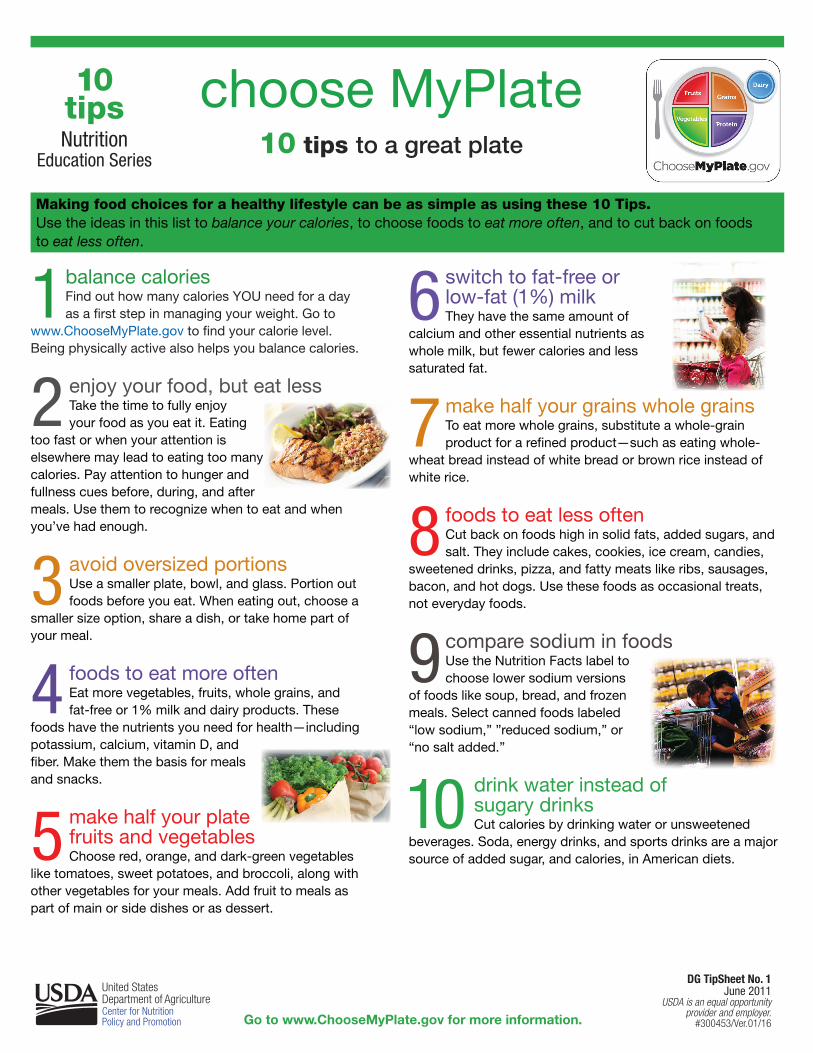
switch to fat-free or low-fat (1%) milk They have the same amount of
calcium and other essential nutrients as whole milk, but fewer calories and less saturated fat.
make half your grains whole grainsTo eat more whole grains, substitute a whole-grain product for a refined product—such as eating whole-
wheat bread instead of white bread or brown rice instead of white rice.
foods to eat less oftenCut back on foods high in solid fats, added sugars, and salt. They include cakes, cookies, ice cream, candies,
sweetened drinks, pizza, and fatty meats like ribs, sausages, bacon, and hot dogs. Use these foods as occasional treats, not everyday foods.
compare sodium in foodsUse the Nutrition Facts label to choose lower sodium versions
of foods like soup, bread, and frozen meals. Select canned foods labeled “low sodium,” ”reduced sodium,” or “no salt added.”
drink water instead of sugary drinksCut calories by drinking water or unsweetened
beverages. Soda, energy drinks, and sports drinks are a major source of added sugar, and calories, in American diets.
balance caloriesFind out how many calories YOU need for a day as a first step in managing your weight. Go to
www.ChooseMyPlate.gov to find your calorie level. Being physically active also helps you balance calories.
enjoy your food, but eat lessTake the time to fully enjoy your food as you eat it. Eating
too fast or when your attention is elsewhere may lead to eating too many calories. Pay attention to hunger and fullness cues before, during, and after meals. Use them to recognize when to eat and when you’ve had enough.
avoid oversized portionsUse a smaller plate, bowl, and glass. Portion out foods before you eat. When eating out, choose a
smaller size option, share a dish, or take home part of your meal.
foods to eat more oftenEat more vegetables, fruits, whole grains, and fat-free or 1% milk and dairy products. These
foods have the nutrients you need for health—including potassium, calcium, vitamin D, and fiber. Make them the basis for meals and snacks.
make half your plate fruits and vegetablesChoose red, orange, and dark-green vegetables
like tomatoes, sweet potatoes, and broccoli, along with other vegetables for your meals. Add fruit to meals as part of main or side dishes or as dessert.
Making food choices for a healthy lifestyle can be as simple as using these 10 Tips.Use the ideas in this list to balance your calories, to choose foods to eat more often, and to cut back on foods to eat less often.
choose MyPlate10 tips to a great plate
10 tipsNutrition
Education Series
1 6
7
8
9
10
2
3
4
5
United States Department of Agriculture Center for Nutrition Policy and Promotion Go to www.ChooseMyPlate.gov for more information.
DG TipSheet No. 1June 2011
USDA is an equal opportunity provider and employer.
#300453/Ver.01/16
#300454/Ver.07/13
Show Me the Sugar!
This material was produced by the California Department of Public Health’s Network for a Healthy California with funding from the U.S. Department of Agriculture’s (USDA) Supplemental Nutrition Assistance Program‐Education, known in California as CalFresh. CalFresh provides assistance to low‐income households and can help buy nutritious food for better health. For CalFresh information, call 1‐877‐847‐3663. For important nutrition information, visit www.CaChampionsForChange.net.
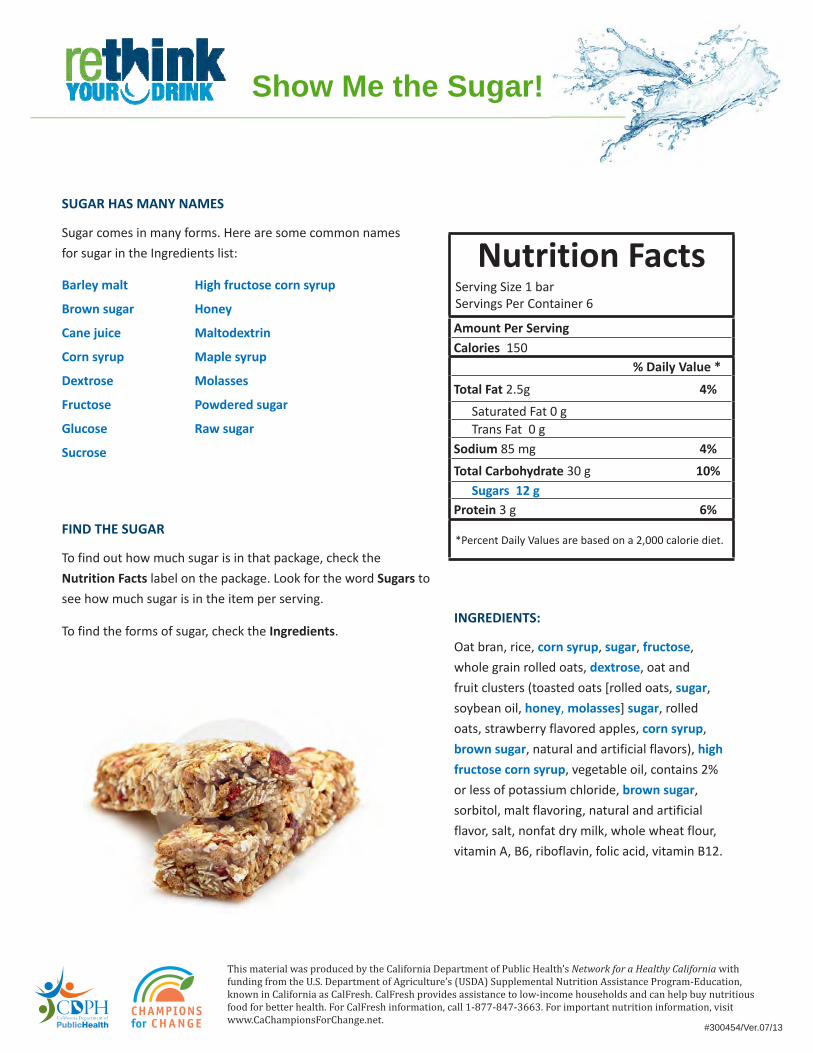
SUGAR HAS MANY NAMES
Sugar comes in many forms. Here are some common names for sugar in the Ingredients list:
Barley malt High fructose corn syrup
Brown sugar Honey
Cane juice Maltodextrin
Corn syrup Maple syrup
Dextrose Molasses
Fructose Powdered sugar
Glucose Raw sugar
Sucrose
INGREDIENTS:
Oat bran, rice, corn syrup, sugar, fructose, whole grain rolled oats, dextrose, oat and fruit clusters (toasted oats [rolled oats, sugar, soybean oil, honey, molasses] sugar, rolled oats, strawberry flavored apples, corn syrup, brown sugar, natural and artificial flavors), high fructose corn syrup, vegetable oil, contains 2% or less of potassium chloride, brown sugar, sorbitol, malt flavoring, natural and artificial flavor, salt, nonfat dry milk, whole wheat flour, vitamin A, B6, riboflavin, folic acid, vitamin B12.
FIND THE SUGAR
To find out how much sugar is in that package, check the Nutrition Facts label on the package. Look for the word Sugars to see how much sugar is in the item per serving.
To find the forms of sugar, check the Ingredients.
Nutrition FactsServing Size 1 barServings Per Container 6
Amount Per ServingCalories 150
% Daily Value *
Total Fat 2.5g 4% Saturated Fat 0 gTrans Fat 0 g
Sodium 85 mg 4% Total Carbohydrate 30 g 10%
Sugars 12 gProtein 3 g 6%
*Percent Daily Values are based on a 2,000 calorie diet.
United States Department of Agriculture Center for Nutrition Policy and Promotion
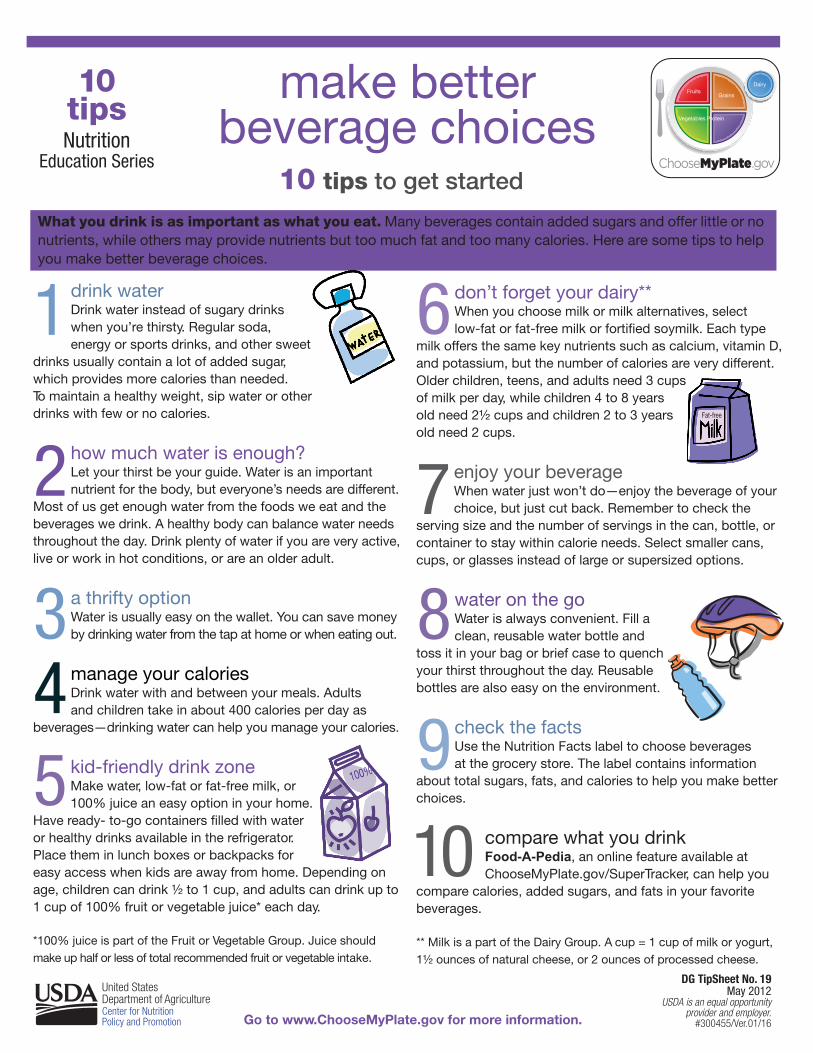
make better beverage choices
10 tips to get started What you drink is as important as what you eat. Many beverages contain added sugars and offer little or no nutrients, while others may provide nutrients but too much fat and too many calories. Here are some tips to help you make better beverage choices.
Go to www.ChooseMyPlate.gov for more information.
10 tipsNutrition
Education Series
DG TipSheet No. 19May 2012
USDA is an equal opportunity provider and employer.
#300455/Ver.01/16
FruitsGrains
Vegetables Protein
Dairy
drink waterDrink water instead of sugary drinks when you’re thirsty. Regular soda, energy or sports drinks, and other sweet
drinks usually contain a lot of added sugar, which provides more calories than needed.To maintain a healthy weight, sip water or other drinks with few or no calories.
how much water is enough?Let your thirst be your guide. Water is an important nutrient for the body, but everyone’s needs are different.
Most of us get enough water from the foods we eat and the beverages we drink. A healthy body can balance water needs throughout the day. Drink plenty of water if you are very active, live or work in hot conditions, or are an older adult.
a thrifty optionWater is usually easy on the wallet. You can save money by drinking water from the tap at home or when eating out.
manage your caloriesDrink water with and between your meals. Adults and children take in about 400 calories per day as
beverages—drinking water can help you manage your calories.
kid-friendly drink zoneMake water, low-fat or fat-free milk, or 100% juice an easy option in your home.
Have ready- to-go containers filled with water or healthy drinks available in the refrigerator. Place them in lunch boxes or backpacks for easy access when kids are away from home. Depending on age, children can drink ½ to 1 cup, and adults can drink up to 1 cup of 100% fruit or vegetable juice* each day.
*100% juice is part of the Fruit or Vegetable Group. Juice should make up half or less of total recommended fruit or vegetable intake.
don’t forget your dairy** When you choose milk or milk alternatives, select
low-fat or fat-free milk or fortified soymilk. Each type milk offers the same key nutrients such as calcium, vitamin D, and potassium, but the number of calories are very different. Older children, teens, and adults need 3 cups of milk per day, while children 4 to 8 years old need 2½ cups and children 2 to 3 years old need 2 cups.
enjoy your beverageWhen water just won’t do—enjoy the beverage of your choice, but just cut back. Remember to check the
serving size and the number of servings in the can, bottle, or container to stay within calorie needs. Select smaller cans, cups, or glasses instead of large or supersized options.
water on the goWater is always convenient. Fill a clean, reusable water bottle and
toss it in your bag or brief case to quench your thirst throughout the day. Reusable bottles are also easy on the environment.
check the factsUse the Nutrition Facts label to choose beverages at the grocery store. The label contains information
about total sugars, fats, and calories to help you make better choices.
compare what you drinkFood-A-Pedia, an online feature available at ChooseMyPlate.gov/SuperTracker, can help you
compare calories, added sugars, and fats in your favorite beverages.
** Milk is a part of the Dairy Group. A cup = 1 cup of milk or yogurt, 1½ ounces of natural cheese, or 2 ounces of processed cheese.
100%
Fat-free
2
1
345
6
7
8
9
10
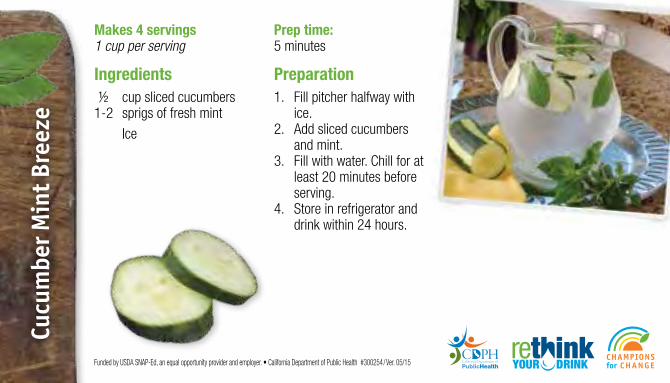
Ingredients ½ cup sliced cucumbers1-2 sprigs of fresh mint
Ice
Cucu
mbe
r Min
t Bre
eze
Preparation1. Fill pitcher halfway with
ice. 2. Add sliced cucumbers
and mint. 3. Fill with water. Chill for at
least 20 minutes before serving.
4. Store in refrigerator and drink within 24 hours.
Funded by USDA SNAP-Ed, an equal opportunity provider and employer. • California Department of Public Health #300254/Ver. 05/15
Makes 4 servings 1 cup per serving
Prep time: 5 minutes
This material was produced by the California Department of Public Health’s Network for a Healthy California with funding from the U.S. Department of Agriculture’s (USDA) Supplemental Nutrition Assistance Program‐Education, known in California as CalFresh. CalFresh provides assistance to low‐income households and can help buy nutritious food for better health. For CalFresh information, call 1‐877‐847‐3663. For important nutrition information, visit www.CaChampionsForChange.net.
Calculating How Much Sugar is in a Container
CALCULATION:Grams of Sugar ÷ 4 = Teaspoons of Sugar
68 Grams of Sugar ÷ 4 = 17 Teaspoons of Sugar
Note: If the container has more than one serving, multiply the number of teaspoons by the number of servings to get the Total Teaspoons of sugar in the container. For example, 10 teaspoons x 2 servings = 20 Total Teaspoons.
Nutrition FactsServing Size 20 fl. oz. (591ml)Servings Per Container 1
Amount Per Serving
Calories 250
% Daily Value*
Total Fat 0 g 0%
Sodium 55 g 2% Total Carbohydrate 68 g 23%
Sugars 69 gProtein 0 g 0% Not a significant source of calories from fat, saturated fat, trans fat, cholesterol, dietary fiber, vitamin A, vitamin C, calcium and iron.
*Percent Daily Values are based on a 2,000 calorie diet.
#300456/Ver.07/13
This material was produced by the California Department of Public Health’s Nutrition Education and Obesity Prevention Branch with funding from USDA SNAP-Ed, known in California as CalFresh. These institutions are equal opportunity providers and employers. CalFresh provides assistance to low-income households and can help buy nutritious food for better health. For CalFresh information, call 1-877-847-3663. For important nutrition information, visit www.CaChampionsForChange.net.
Adapted from the California WIC Program.#300017/Ver. 06/15
1 of 13
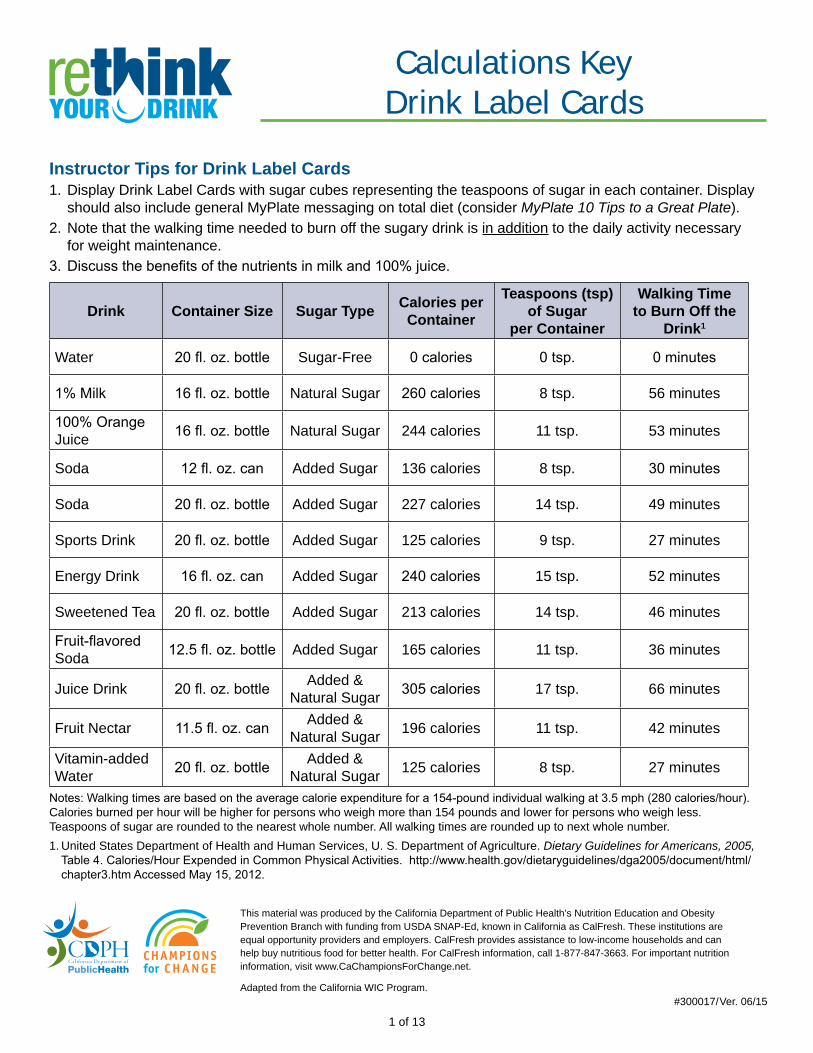
Instructor Tips for Drink Label Cards1. Display Drink Label Cards with sugar cubes representing the teaspoons of sugar in each container. Display
should also include general MyPlate messaging on total diet (consider MyPlate 10 Tips to a Great Plate). 2. Note that the walking time needed to burn off the sugary drink is in addition to the daily activity necessary
for weight maintenance.3.Discussthebenefitsofthenutrientsinmilkand100%juice.
Drink Container Size Sugar Type Calories per Container
Teaspoons (tsp)of Sugar
per Container
Walking Time to Burn Off the
Drink1
Water 20fl.oz.bottle Sugar-Free 0calories 0tsp. 0minutes
1%Milk 16fl.oz.bottle Natural Sugar 260calories 8 tsp. 56 minutes
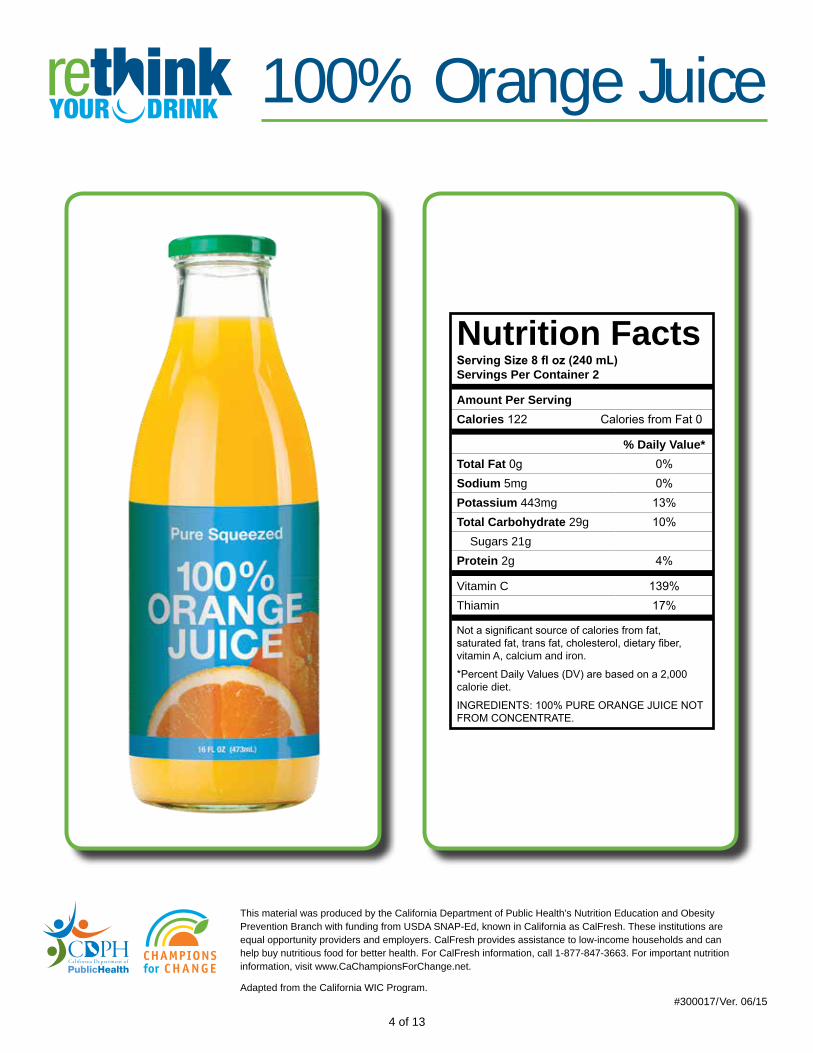
100%OrangeJuice 16fl.oz.bottle Natural Sugar 244 calories 11 tsp. 53 minutes
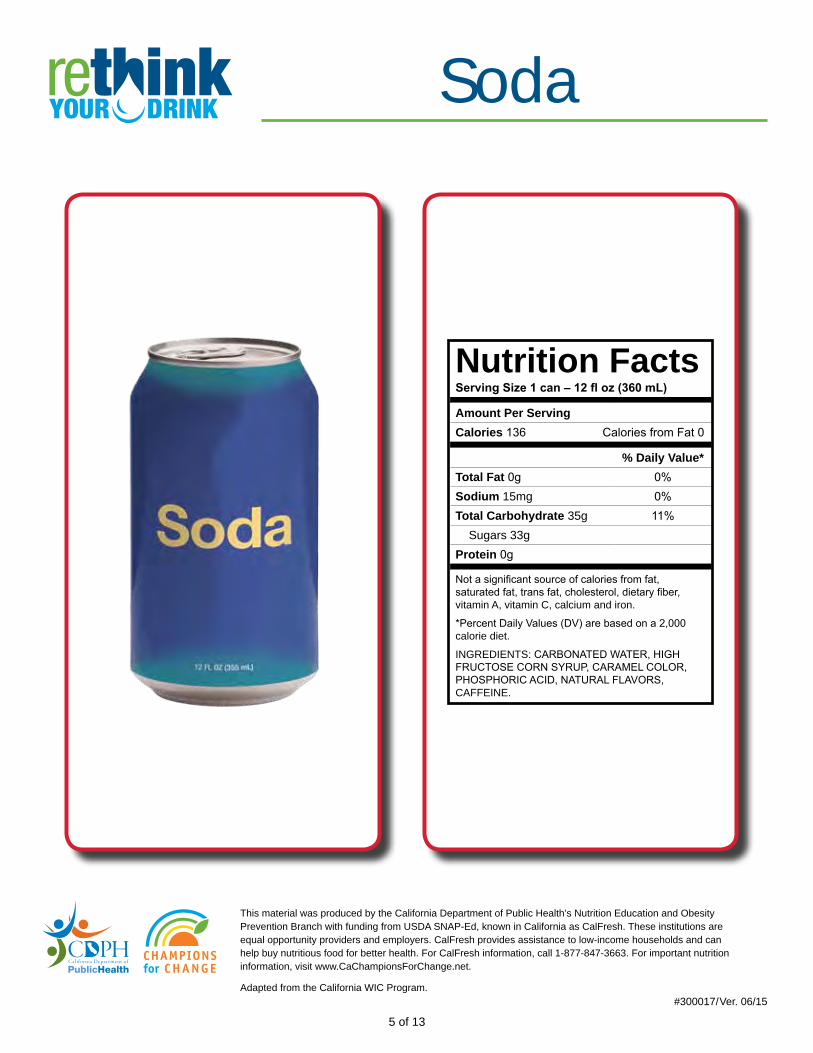
Soda 12fl.oz.can Added Sugar 136 calories 8 tsp. 30minutes
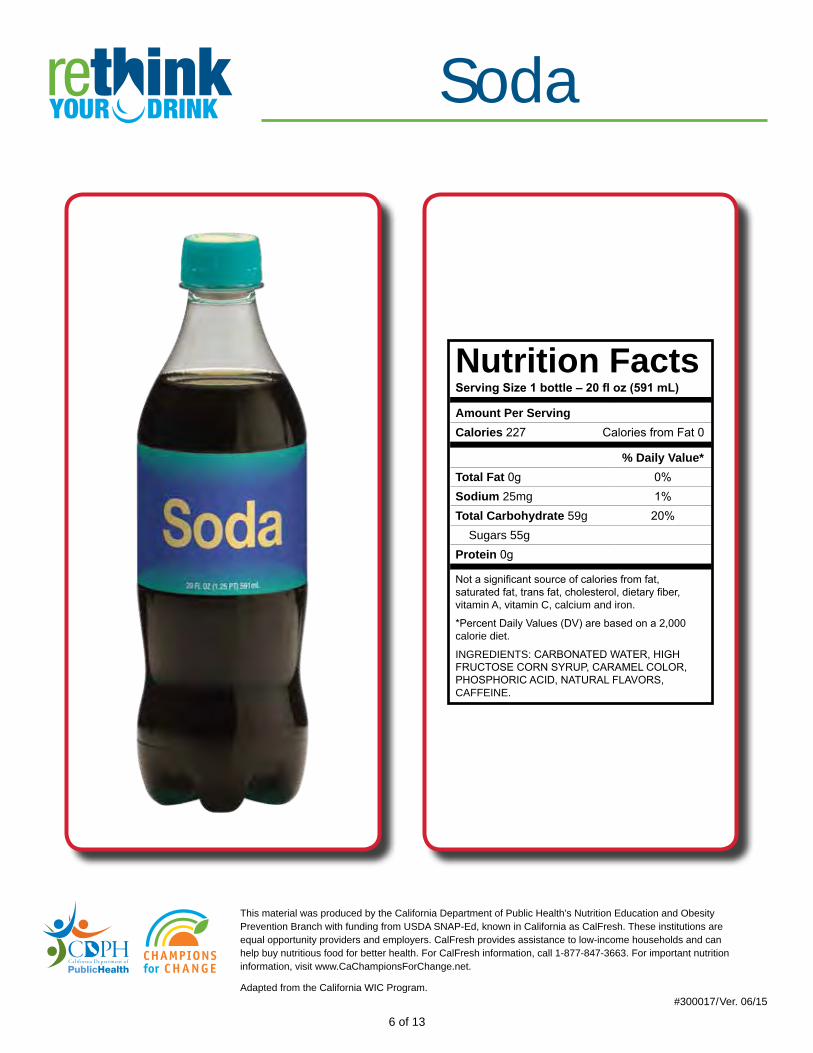
Soda 20fl.oz.bottle Added Sugar 227 calories 14 tsp. 49 minutes
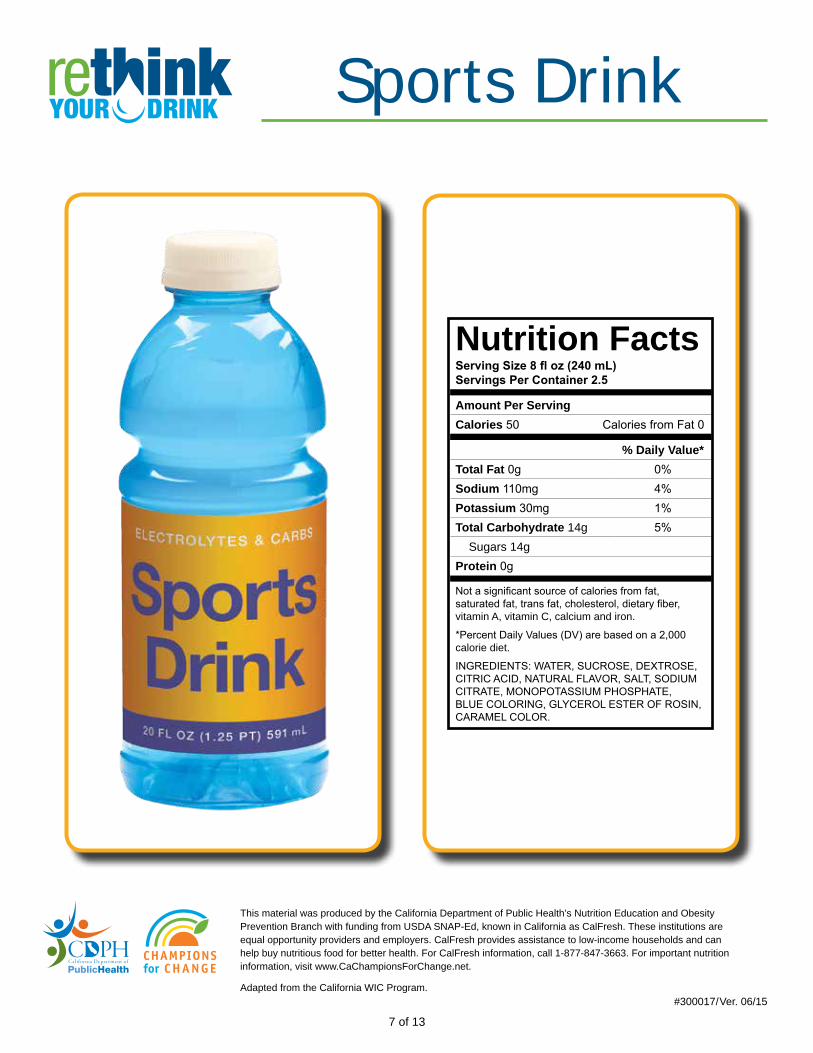
Sports Drink 20fl.oz.bottle Added Sugar 125 calories 9 tsp. 27 minutes
Energy Drink 16fl.oz.can Added Sugar 240calories 15 tsp. 52 minutes
Sweetened Tea 20fl.oz.bottle Added Sugar 213 calories 14 tsp. 46 minutes
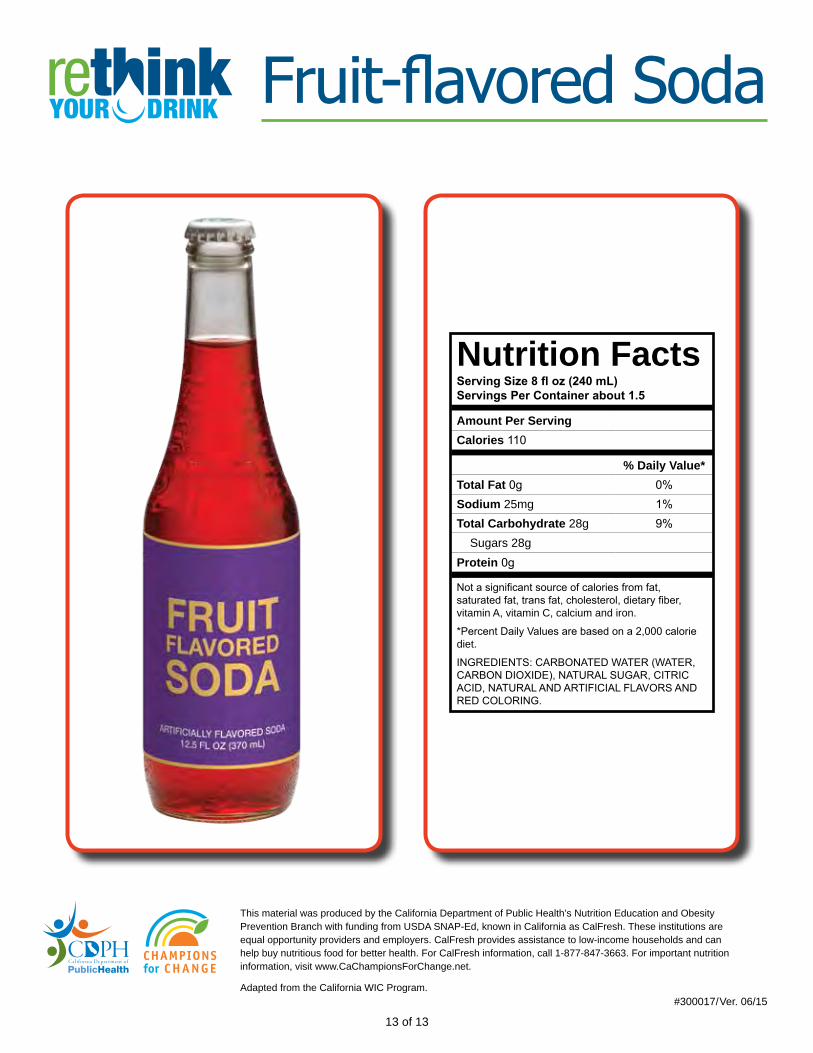
Fruit-flavoredSoda 12.5fl.oz.bottle Added Sugar 165 calories 11 tsp. 36 minutes
Juice Drink 20fl.oz.bottle Added & Natural Sugar 305calories 17 tsp. 66 minutes
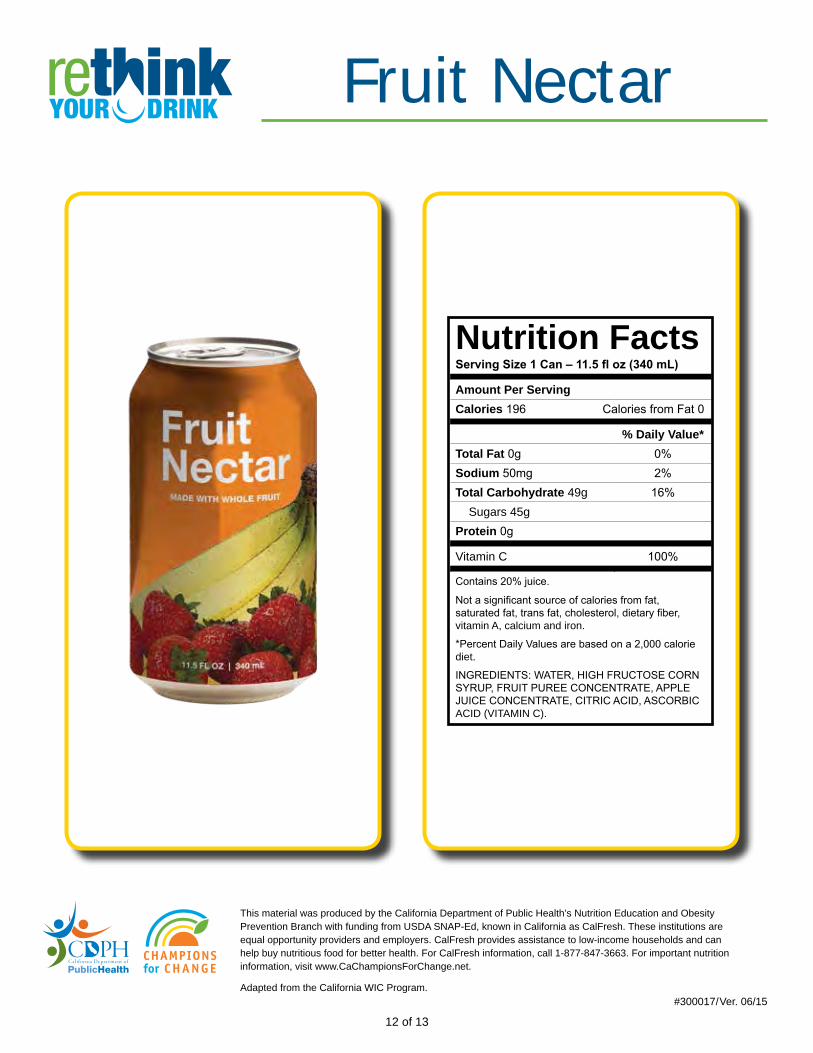
Fruit Nectar 11.5fl.oz.can Added & Natural Sugar 196 calories 11 tsp. 42 minutes
Vitamin-added Water 20fl.oz.bottle Added &
Natural Sugar 125 calories 8 tsp. 27 minutes
Notes:Walkingtimesarebasedontheaveragecalorieexpenditurefora154-poundindividualwalkingat3.5mph(280calories/hour).Calories burned per hour will be higher for persons who weigh more than 154 pounds and lower for persons who weigh less. Teaspoons of sugar are rounded to the nearest whole number. All walking times are rounded up to next whole number.1. United States Department of Health and Human Services, U. S. Department of Agriculture. Dietary Guidelines for Americans, 2005, Table4.Calories/HourExpendedinCommonPhysicalActivities.http://www.health.gov/dietaryguidelines/dga2005/document/html/chapter3.htmAccessedMay15,2012.
Calculations Key Drink Label Cards
This material was produced by the California Department of Public Health’s Nutrition Education and Obesity Prevention Branch with funding from USDA SNAP-Ed, known in California as CalFresh. These institutions are equal opportunity providers and employers. CalFresh provides assistance to low-income households and can help buy nutritious food for better health. For CalFresh information, call 1-877-847-3663. For important nutrition information, visit www.CaChampionsForChange.net.
Adapted from the California WIC Program.#300017/Ver. 06/15
2 of 13
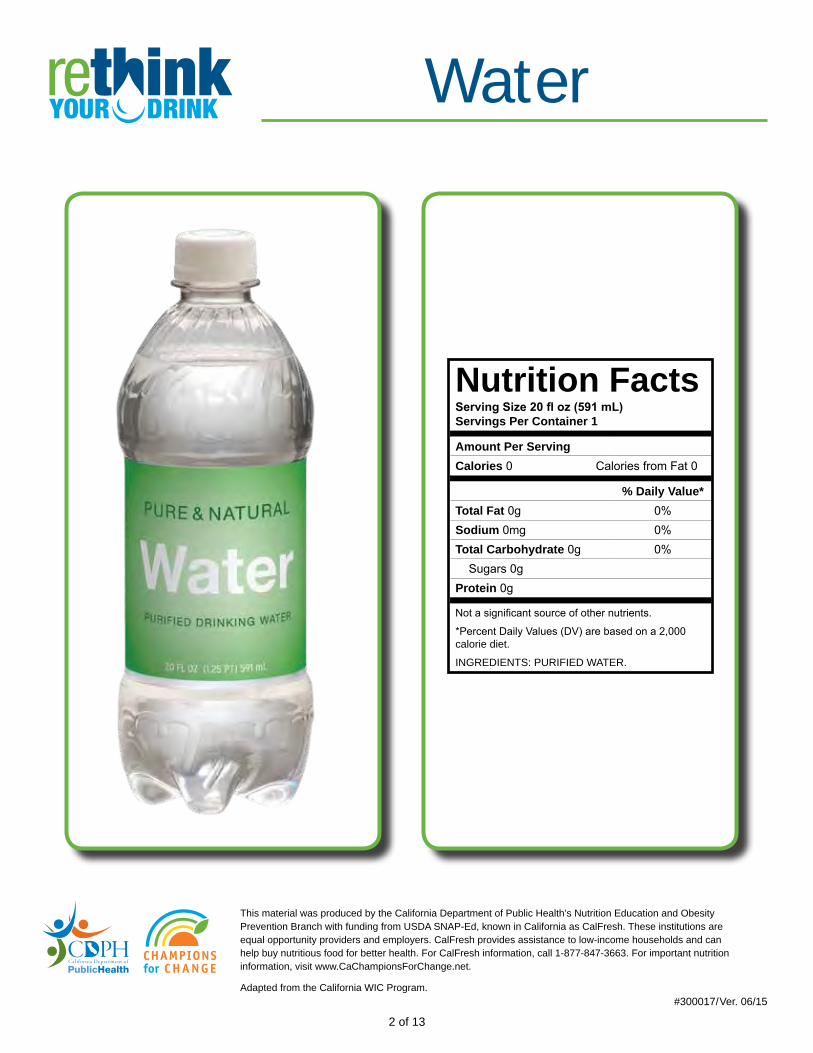
Nutrition FactsServing Size 20 fl oz (591 mL)Servings Per Container 1
Amount Per ServingCalories 0CaloriesfromFat0
% Daily Value*Total Fat0g 0%Sodium0mg 0%Total Carbohydrate0g 0%Sugars0gProtein0g
Notasignificantsourceofothernutrients.
*PercentDailyValues(DV)arebasedona2,000calorie diet.
INGREDIENTS: PURIFIED WATER.
Water
This material was produced by the California Department of Public Health’s Nutrition Education and Obesity Prevention Branch with funding from USDA SNAP-Ed, known in California as CalFresh. These institutions are equal opportunity providers and employers. CalFresh provides assistance to low-income households and can help buy nutritious food for better health. For CalFresh information, call 1-877-847-3663. For important nutrition information, visit www.CaChampionsForChange.net.
Adapted from the California WIC Program.#300017/Ver. 06/15
3 of 13
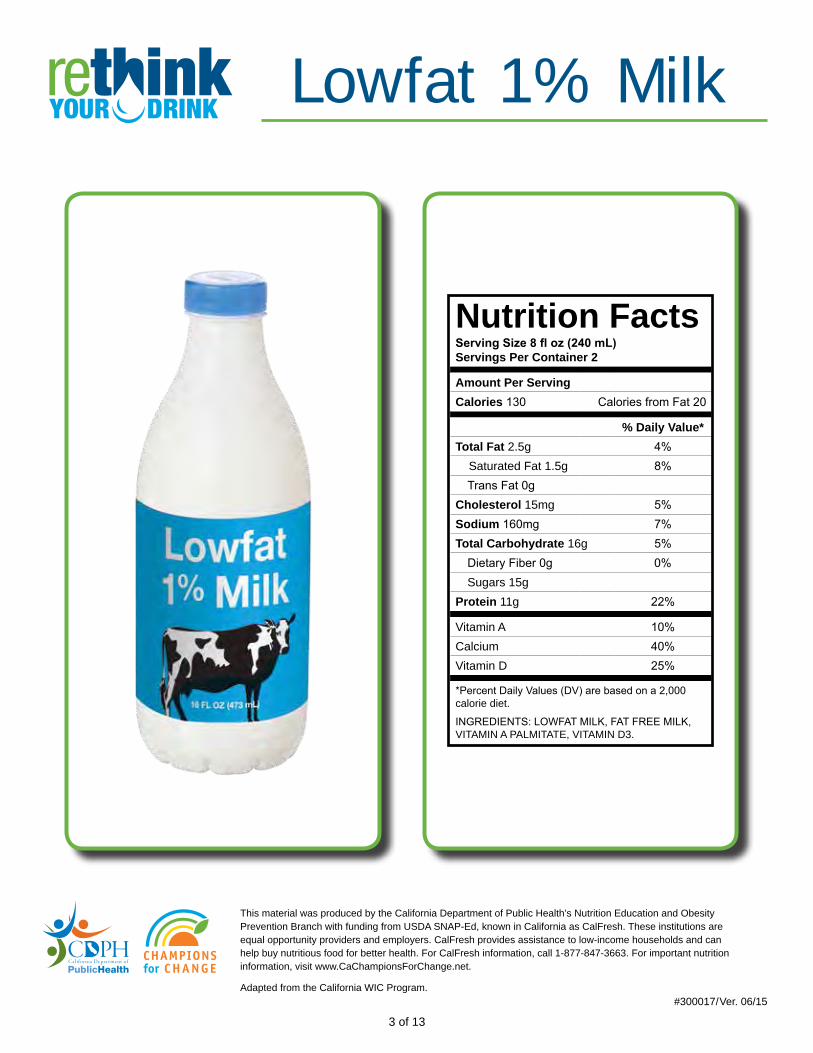
Nutrition FactsServing Size 8 fl oz (240 mL)Servings Per Container 2
Amount Per ServingCalories 130 CaloriesfromFat20
% Daily Value*Total Fat 2.5g 4% Saturated Fat 1.5g 8%TransFat0g
Cholesterol 15mg 5%Sodium160mg 7%Total Carbohydrate 16g 5%DietaryFiber0g 0%Sugars 15g
Protein 11g 22%
Vitamin A 10%Calcium 40%Vitamin D 25%
*PercentDailyValues(DV)arebasedona2,000calorie diet.
INGREDIENTS:LOWFATMILK,FATFREEMILK,VITAMIN A PALMITATE, VITAMIN D3.
Lowfat 1% Milk
This material was produced by the California Department of Public Health’s Nutrition Education and Obesity Prevention Branch with funding from USDA SNAP-Ed, known in California as CalFresh. These institutions are equal opportunity providers and employers. CalFresh provides assistance to low-income households and can help buy nutritious food for better health. For CalFresh information, call 1-877-847-3663. For important nutrition information, visit www.CaChampionsForChange.net.
Adapted from the California WIC Program.#300017/Ver. 06/15
4 of 13
Nutrition FactsServing Size 8 fl oz (240 mL)Servings Per Container 2
Amount Per ServingCalories 122CaloriesfromFat0
% Daily Value*Total Fat0g 0%Sodium 5mg 0%Potassium 443mg 13%Total Carbohydrate 29g 10% Sugars 21gProtein 2g 4%
Vitamin C 139%Thiamin 17%
Notasignificantsourceofcaloriesfromfat, saturatedfat,transfat,cholesterol,dietaryfiber,vitamin A, calcium and iron.
*PercentDailyValues(DV)arebasedona2,000calorie diet.
INGREDIENTS:100%PUREORANGEJUICENOTFROMCONCENTRATE.
100% Orange Juice
This material was produced by the California Department of Public Health’s Nutrition Education and Obesity Prevention Branch with funding from USDA SNAP-Ed, known in California as CalFresh. These institutions are equal opportunity providers and employers. CalFresh provides assistance to low-income households and can help buy nutritious food for better health. For CalFresh information, call 1-877-847-3663. For important nutrition information, visit www.CaChampionsForChange.net.
Adapted from the California WIC Program.#300017/Ver. 06/15
5 of 13
Nutrition FactsServing Size 1 can – 12 fl oz (360 mL)
Amount Per ServingCalories 136CaloriesfromFat0
% Daily Value*Total Fat0g 0%Sodium 15mg 0%Total Carbohydrate 35g 11% Sugars 33gProtein0g
Notasignificantsourceofcaloriesfromfat, saturatedfat,transfat,cholesterol,dietaryfiber,vitamin A, vitamin C, calcium and iron.
*PercentDailyValues(DV)arebasedona2,000calorie diet.
INGREDIENTS: CARBONATEDWATER,HIGHFRUCTOSECORNSYRUP,CARAMELCOLOR,PHOSPHORICACID,NATURALFLAVORS,CAFFEINE.
Soda
This material was produced by the California Department of Public Health’s Nutrition Education and Obesity Prevention Branch with funding from USDA SNAP-Ed, known in California as CalFresh. These institutions are equal opportunity providers and employers. CalFresh provides assistance to low-income households and can help buy nutritious food for better health. For CalFresh information, call 1-877-847-3663. For important nutrition information, visit www.CaChampionsForChange.net.
Adapted from the California WIC Program.#300017/Ver. 06/15
6 of 13
Nutrition FactsServing Size 1 bottle – 20 fl oz (591 mL)
Amount Per ServingCalories 227CaloriesfromFat0
% Daily Value*Total Fat0g 0%Sodium 25mg 1%Total Carbohydrate 59g 20% Sugars 55gProtein0g
Notasignificantsourceofcaloriesfromfat, saturatedfat,transfat,cholesterol,dietaryfiber,vitamin A, vitamin C, calcium and iron.
*PercentDailyValues(DV)arebasedona2,000calorie diet.
INGREDIENTS: CARBONATEDWATER,HIGHFRUCTOSECORNSYRUP,CARAMELCOLOR,PHOSPHORICACID,NATURALFLAVORS,CAFFEINE.
Soda
This material was produced by the California Department of Public Health’s Nutrition Education and Obesity Prevention Branch with funding from USDA SNAP-Ed, known in California as CalFresh. These institutions are equal opportunity providers and employers. CalFresh provides assistance to low-income households and can help buy nutritious food for better health. For CalFresh information, call 1-877-847-3663. For important nutrition information, visit www.CaChampionsForChange.net.
Adapted from the California WIC Program.#300017/Ver. 06/15
7 of 13
Nutrition FactsServing Size 8 fl oz (240 mL)Servings Per Container 2.5
Amount Per ServingCalories 50CaloriesfromFat0
% Daily Value*Total Fat0g 0%Sodium110mg 4%Potassium30mg 1%Total Carbohydrate 14g 5% Sugars 14gProtein0g
Notasignificantsourceofcaloriesfromfat, saturatedfat,transfat,cholesterol,dietaryfiber,vitamin A, vitamin C, calcium and iron.
*PercentDailyValues(DV)arebasedona2,000calorie diet.
INGREDIENTS:WATER,SUCROSE,DEXTROSE,CITRICACID,NATURALFLAVOR,SALT,SODIUMCITRATE,MONOPOTASSIUMPHOSPHATE,BLUECOLORING,GLYCEROLESTEROFROSIN,CARAMELCOLOR.
Sports Drink
This material was produced by the California Department of Public Health’s Nutrition Education and Obesity Prevention Branch with funding from USDA SNAP-Ed, known in California as CalFresh. These institutions are equal opportunity providers and employers. CalFresh provides assistance to low-income households and can help buy nutritious food for better health. For CalFresh information, call 1-877-847-3663. For important nutrition information, visit www.CaChampionsForChange.net.
Adapted from the California WIC Program.#300017/Ver. 06/15
8 of 13
Nutrition FactsServing Size 8 fl oz (240 mL)Servings Per Container 2
Amount Per ServingCalories 120CaloriesfromFat0
% Daily Value*Total Fat0g 0%Sodium70mg 3%Total Carbohydrate30g 10%Sugars30gProtein0g
Riboflavin 100%Niacin 100%Vitamin B6 100%Vitamin B12 100%
Notasignificantsourceofcaloriesfromfat, saturatedfat,transfat,cholesterol,dietaryfiber,vitamin A, vitamin C, calcium and iron.
*PercentDailyValues(DV)arebasedona2,000calorie diet.
INGREDIENTS:CARBONATEDWATER,GLUCOSE,CITRICACID,NATURALFLAVORS,TAURINE,SODIUMCITRATE,PANAXGINSENGROOTEXTRACT,L-CARNITINE,CAFFEINE,NIACINAMIDE,SODIUMCHLORIDE,INOSITOL,PYRIDOXINEHYDROCHLORIDE,SUCRALOSE,RIBOFLAVIN,MALTODEXTRIN,CYANOCOBALAMIN.
Energy Drink
This material was produced by the California Department of Public Health’s Nutrition Education and Obesity Prevention Branch with funding from USDA SNAP-Ed, known in California as CalFresh. These institutions are equal opportunity providers and employers. CalFresh provides assistance to low-income households and can help buy nutritious food for better health. For CalFresh information, call 1-877-847-3663. For important nutrition information, visit www.CaChampionsForChange.net.
Adapted from the California WIC Program.#300017/Ver. 06/15
9 of 13
Nutrition FactsServing Size 8 fl oz (240 mL)Servings Per Container 2.5
Amount Per ServingCalories 85CaloriesfromFat0
% Daily Value*Total Fat0g 0%Sodium30mg 1%Total Carbohydrate 23g 8% Sugars 23gProtein0g
Notasignificantsourceofcaloriesfromfat, saturatedfat,transfat,cholesterol,dietaryfiber,vitamin A, vitamin C, calcium and iron.
*PercentDailyValues(DV)arebasedona2,000calorie diet.
INGREDIENTS: FILTERED WATER, SUGAR, CITRICACID,TEA,NATURALFLAVORS.
Sweetened Tea
This material was produced by the California Department of Public Health’s Nutrition Education and Obesity Prevention Branch with funding from USDA SNAP-Ed, known in California as CalFresh. These institutions are equal opportunity providers and employers. CalFresh provides assistance to low-income households and can help buy nutritious food for better health. For CalFresh information, call 1-877-847-3663. For important nutrition information, visit www.CaChampionsForChange.net.
Adapted from the California WIC Program.#300017/Ver. 06/15
10of13
Nutrition FactsServing Size 8 fl oz (240 mL)Servings Per Container 2.5
Amount Per ServingCalories 122CaloriesfromFat0
% Daily Value*Total Fat0g 0%Sodium 25mg 1%Total Carbohydrate 27g 9% Sugars 27gProtein0g
Vitamin A 0%Vitamin C 100%Calcium 0%Iron 0%
Contains10%juice.
Notasignificantsourceofcaloriesfromfat, saturatedfat,transfat,cholesterol,dietaryfiber,vitamin A, calcium and iron.
*PercentDailyValues(DV)arebasedona2,000calorie diet.
INGREDIENTS:CARBONATEDWATER,HIGHFRUCTOSECORNSYRUP,ORANGEJUICECONCENTRATE,CITRICACID,POTASSIUMBENZOATE(PRESERVESFRESHNESS),NATURALFLAVOR,YELLOWCOLORING,GLYCEROLESTEROFWOODROSIN,CALCIUMDISODIUMEDTA(TOPROTECTFLAVOR).
Juice Drink
This material was produced by the California Department of Public Health’s Nutrition Education and Obesity Prevention Branch with funding from USDA SNAP-Ed, known in California as CalFresh. These institutions are equal opportunity providers and employers. CalFresh provides assistance to low-income households and can help buy nutritious food for better health. For CalFresh information, call 1-877-847-3663. For important nutrition information, visit www.CaChampionsForChange.net.
Adapted from the California WIC Program.#300017/Ver. 06/15
11 of 13
Nutrition FactsServing Size 8 fl oz (240 mL)Servings Per Container 2.5
Amount Per ServingCalories 50CaloriesfromFat0
% Daily Value*Total Fat0g 0%Sodium0mg 0%Total Carbohydrate 13g 4% Sugars 13gProtein0g
Vitamin C 50%Vitamin B3 10%Vitamin B6 10%Vitamin B12 4%Vitamin B5 10%Zinc 5%
Containslessthan1%juice.
Notasignificantsourceofcaloriesfromfat, saturatedfat,transfat,cholesterol,dietaryfiber,vitamin A, calcium and iron.
*PercentDailyValues(DV)arebasedona2,000calorie diet.
INGREDIENTS:WATER,CRYSTALLINEFRUCTOSE,CITRICACID,VEGETABLEJUICE(COLOR),NATURALFLAVOR,ASCORBICACID (VITAMIN C), VITAMIN E ACETATE, MAGNESIUMLACTATE(ELECROLYTE),CALCIUMLACTATE(ELECTROLYTE),ZINCPICOLINATE,MONOPOTASSIUMPHOSPHATE(ELECTROLYTE),NIACIN(B3),PANTOTHENICACID(B5),PYRIDOXINEHYDROCHLORIDE(B6),CYANOCOBALAMINE(B12).
Vitamin-added Water
This material was produced by the California Department of Public Health’s Nutrition Education and Obesity Prevention Branch with funding from USDA SNAP-Ed, known in California as CalFresh. These institutions are equal opportunity providers and employers. CalFresh provides assistance to low-income households and can help buy nutritious food for better health. For CalFresh information, call 1-877-847-3663. For important nutrition information, visit www.CaChampionsForChange.net.
Adapted from the California WIC Program.#300017/Ver. 06/15
12 of 13
Nutrition FactsServing Size 1 Can – 11.5 fl oz (340 mL)
Amount Per ServingCalories 196CaloriesfromFat0
% Daily Value*Total Fat0g 0%Sodium50mg 2%Total Carbohydrate 49g 16% Sugars 45gProtein0g
Vitamin C 100%
Contains20%juice.
Notasignificantsourceofcaloriesfromfat, saturatedfat,transfat,cholesterol,dietaryfiber,vitamin A, calcium and iron.
*PercentDailyValuesarebasedona2,000caloriediet.
INGREDIENTS:WATER,HIGHFRUCTOSECORNSYRUP,FRUITPUREECONCENTRATE,APPLEJUICECONCENTRATE,CITRICACID,ASCORBICACID (VITAMIN C).
Fruit Nectar
This material was produced by the California Department of Public Health’s Nutrition Education and Obesity Prevention Branch with funding from USDA SNAP-Ed, known in California as CalFresh. These institutions are equal opportunity providers and employers. CalFresh provides assistance to low-income households and can help buy nutritious food for better health. For CalFresh information, call 1-877-847-3663. For important nutrition information, visit www.CaChampionsForChange.net.
Adapted from the California WIC Program.#300017/Ver. 06/15
13 of 13
Nutrition FactsServing Size 8 fl oz (240 mL)Servings Per Container about 1.5
Amount Per ServingCalories 110
% Daily Value*Total Fat0g 0%Sodium 25mg 1%Total Carbohydrate 28g 9% Sugars 28gProtein0g
Notasignificantsourceofcaloriesfromfat, saturatedfat,transfat,cholesterol,dietaryfiber,vitamin A, vitamin C, calcium and iron.
*PercentDailyValuesarebasedona2,000caloriediet.
INGREDIENTS:CARBONATEDWATER(WATER,CARBONDIOXIDE),NATURALSUGAR,CITRICACID,NATURALANDARTIFICIALFLAVORSANDREDCOLORING.
Fruit-flavored Soda
Name: Date:
Directions: Use this worksheet to calculate the total sugar (in teaspoons) for each beverage.
Helpful Hints: 4 grams of sugar = 1 teaspoon of sugar 1 sugar cube represents 1 teaspoon of sugar
Added Sugars List: Anhydrous dextrose, corn syrup, corn syrup solids, dextrose, fructose, high-fructose corn syrup (HFCS), honey, invert sugar, lactose, malt syrup, maltose, maple syrup, molasses, nectars (e.g., peach nectar, pear nectar), raw sugar, sucrose, and sugar.
1. Calculate the Total Sugar (in teaspoons) for each drink:
a. Sugar per serving X Number of servings in drink = Grams of Total Sugar gm gm
b. Grams of Total Sugar ÷ 4 gm per teaspoon = Teaspoons of Total Sugar per drink gm of sugar tsps
2. Using sugar cubes, count the number of teaspoons of sugar per drink container and place sugar cubes in a plastic bag.
3. Label the bag with the name of your drink.
Beverage #1 Name:
4. Review the Ingredients List and write down forms of added sugar:
Beverage #2 Name:
4. Review the Ingredients List and write down forms of added sugar:
How Much Sugar?
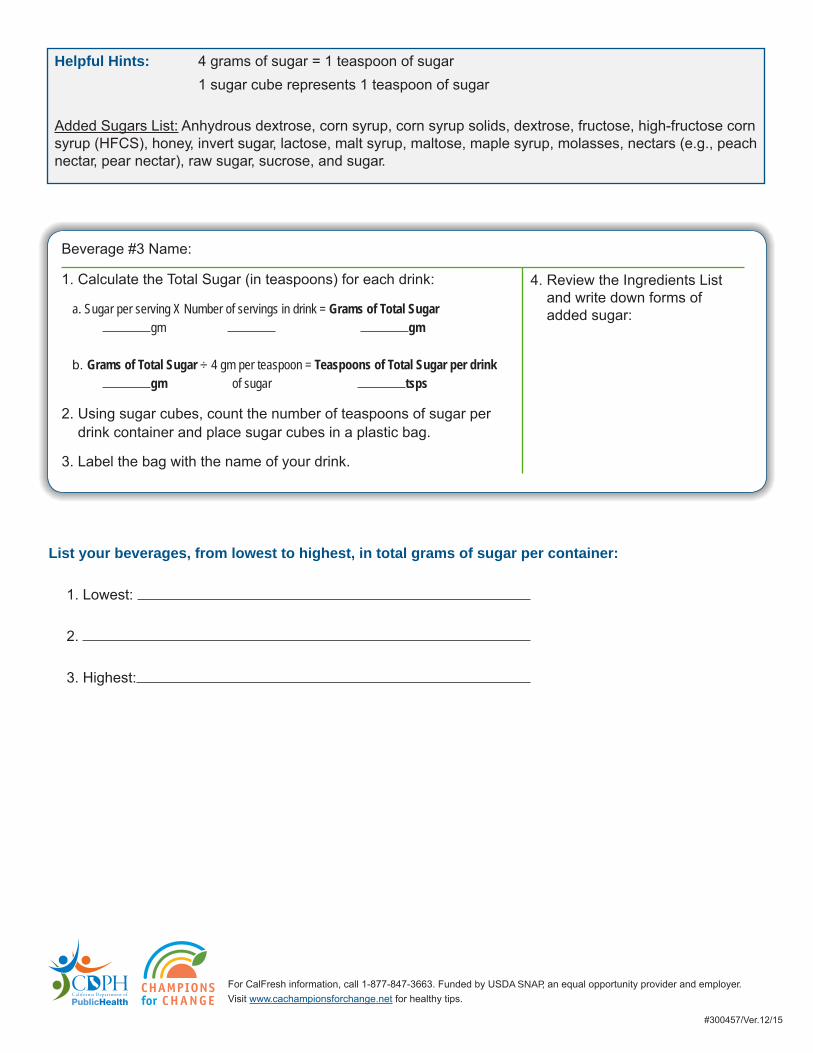
List your beverages, from lowest to highest, in total grams of sugar per container:
1. Lowest:
2.
3. Highest:
Beverage #3 Name:
Helpful Hints: 4 grams of sugar = 1 teaspoon of sugar 1 sugar cube represents 1 teaspoon of sugar
Added Sugars List: Anhydrous dextrose, corn syrup, corn syrup solids, dextrose, fructose, high-fructose corn syrup (HFCS), honey, invert sugar, lactose, malt syrup, maltose, maple syrup, molasses, nectars (e.g., peach nectar, pear nectar), raw sugar, sucrose, and sugar.
For CalFresh information, call 1-877-847-3663. Funded by USDA SNAP, an equal opportunity provider and employer. Visit www.cachampionsforchange.net for healthy tips.
1. Calculate the Total Sugar (in teaspoons) for each drink:
a. Sugar per serving X Number of servings in drink = Grams of Total Sugar gm gm
b. Grams of Total Sugar ÷ 4 gm per teaspoon = Teaspoons of Total Sugar per drink gm of sugar tsps
2. Using sugar cubes, count the number of teaspoons of sugar per drink container and place sugar cubes in a plastic bag.
3. Label the bag with the name of your drink.
4. Review the Ingredients List and write down forms of added sugar:
#300457/Ver.12/15
C U T B A C K O N S A LT A N D S O D I U M
LEARNING OBJECTIVES
By the end of the session, participants will be able to:
• Identify names and forms of salt.
• Identify amounts of sodium found in foods.
• Name three personal benefits of eating lower sodium meals.
• Plan a daily menu with reduced sodium.
MATERIALS
• Sign-in sheet
• Name tags (optional)
• White board or flip chart
• Pens or pencils
• 2 to 3 markers
• 6 to 8 food labels or clean empty packages of foods eaten by distinct cultural groups
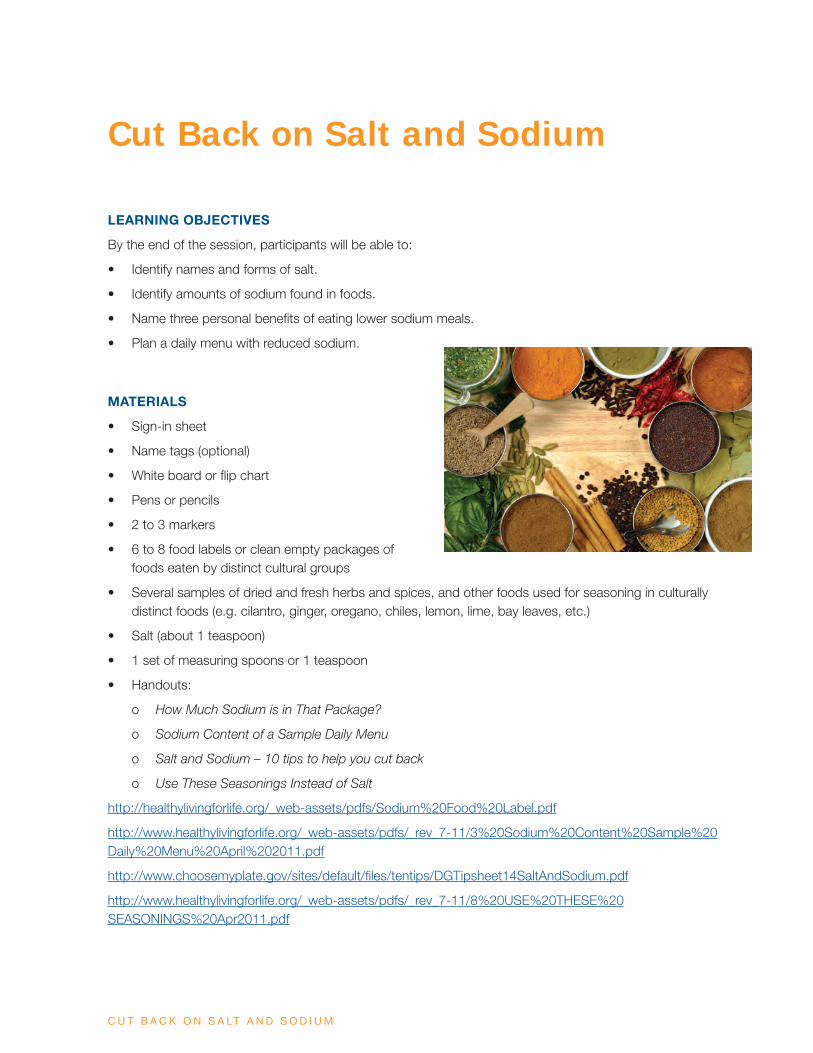
• Several samples of dried and fresh herbs and spices, and other foods used for seasoning in culturally distinct foods (e.g. cilantro, ginger, oregano, chiles, lemon, lime, bay leaves, etc.)
• Salt (about 1 teaspoon)
• 1 set of measuring spoons or 1 teaspoon
• Handouts:
o How Much Sodium is in That Package?
o Sodium Content of a Sample Daily Menu
o Salt and Sodium – 10 tips to help you cut back
o Use These Seasonings Instead of Salt
http://healthylivingforlife.org/_web-assets/pdfs/Sodium%20Food%20Label.pdf
http://www.healthylivingforlife.org/_web-assets/pdfs/_rev_7-11/3%20Sodium%20Content%20Sample%20Daily%20Menu%20April%202011.pdf
http://www.choosemyplate.gov/sites/default/files/tentips/DGTipsheet14SaltAndSodium.pdf
http://www.healthylivingforlife.org/_web-assets/pdfs/_rev_7-11/8%20USE%20THESE%20SEASONINGS%20Apr2011.pdf
Cut Back on Salt and Sodium
C U T B A C K O N S A LT A N D S O D I U M
PREPARATION
1. Review lesson plan and handouts.
2. Be prepared to explain and apply the information in the lesson.
3. Locate a room that will accommodate participants comfortably.
4. Prepare sign-in sheets and name tags (optional).
5. Make copies of participant handouts.
• • • • • • • • • • • • • • • • • • • • • • • • • • • • • • • • • • • • • • • • • • • • • • • • • • • • • • • • • • • • • • • • • • • • • • • • • • • • • • • • • • • • • • •
WARM-UP ACTIVITY: COMPARING SALT
1. Introduce yourself and share with participants that you will be discussing salt and sodium today.
2. Explain the objectives for the lesson.
3. Ask participants to guess which products in the display are highest and lowest in salt without reading the food labels. Give them a few minutes to respond. Organize the food packages and/or labels in the order given by participants, from high to low. Explain that you will talk more about this later.
4. Ask participants what comes to mind when they hear about eating food with less salt or sodium.
5. Show participants what a teaspoon of salt looks like. Ask them if they think they eat more or less than a teaspoon of salt in a day. Explain that salt contains sodium and that during the class today, sodium will be the word used to compare foods.
Tip for instructorsDisplay samples including fresh and processed foods. Include packages of high sodium items (500 mg or more per serving) that children might eat, like pre-packaged lunches.
6. Set up flip chart or white board to record discussion responses.
7. Display six to eight labels or packages for a sample of foods, including seasonings and canned and/or frozen foods that are typically eaten by participants.
C U T B A C K O N S A LT A N D S O D I U M
ACTIVITY: CHECK THE FOOD LABEL FOR SODIUM
1. Explain that a teaspoon of salt contains 2300 milligrams (mg) of sodium. Explain the amounts of salt recommended per day:
• The US Dietary Guidelines recommend that most Americans eat no more than 2300 mg of sodium, or a teaspoon of salt, per day. (Write on white board or flip chart: 2300 mg sodium = 1 teaspoon salt)
• For people with high blood pressure, heart disease, kidney disease, or diabetes, and for African Americans, the guidelines recommend no more than 1500 mg of sodium, or 2/3 of a teaspoon of salt, per day. (Write on white board or flip chart: 1500 mg sodium = 2/3 teaspoon salt)
2. Distribute the handout How Much Sodium is in That Package? Review the handout and how to read a Nutrition Facts label. Emphasize the serving size and the sodium content. Explain that sodium comes in many forms, such as monosodium glutamate (MSG), sodium nitrite, sodium bicarbonate (baking soda) and sodium chloride (table salt). These forms of sodium all add up. They can be found in processed, canned, frozen, packaged, and fast foods. Ask participants where they think most of the sodium comes from in the specific foods that they eat.
3. Ask for volunteers to come up and choose two of the labels or packages from the display.
• Ask them to find and state the sodium content per serving on the Nutrition Facts label.
• Have them compare the sodium content between the two packages (which food product has more sodium per serving).
• Ask the whole group how these amounts compare to the overall sodium recommendation of 2300 mg or 1500 mg per day.
4. Place the food items in the correct order from low to high sodium content per serving. Tell participants the amounts of sodium per serving in the foods with the highest and lowest sodium content. Ask participants what surprises them about this sodium information.
ACTIVITY: BENEFITS OF REDUCING SODIUM
1. Ask participants why they think it’s important to reduce their intake of sodium. Record their responses on the white board or flip chart. Then share with them what sodium does in the body:
• Sodium attracts water in the body.
o When we eat too much sodium, our bodies retain water, which can cause swelling and increase blood pressure.
o Our kidneys may need to work harder to get rid of this water, and high blood pressure can damage the kidneys.
C U T B A C K O N S A LT A N D S O D I U M
o Our hearts also work harder to circulate the extra fluid in the blood. This can make our hearts larger and weaker, causing chest pain, shortness of breath, and fatigue.
2. Ask participants to list some benefits of reducing sodium intake. Record their responses on the white board or paper. If not mentioned, add: less risk of high blood pressure, and healthier heart and kidneys.
ACTIVITY: WAYS TO REDUCE SODIUM INTAKE
1. Ask participants if they have tried using herbs and spices when they cook. Ask those who use herbs to share some examples of herbs they use or that could be used in cooking. Suggest that participants reduce sodium in cooking by using herbs, whether whole or chopped or powdered.
2. Give participants the opportunity to smell a variety of seasonings typically used in mainstream American or Latino or African American or Asian American cooking. Seasonings could include onion, garlic, cilantro, basil, parsley, rosemary, cumin, coriander, oregano, thyme, chiles, chili powder, ginger, lemon, lime.
3. Ask participants to share with the group their ideas for using the herbs and spices.
4. Tell participants that fresh foods tend to be the lowest in sodium. Frozen foods are the next best option. Sodium is often added to canned foods, so choose low-salt versions, and rinse canned foods before using whenever possible.
ACTIVITY: PLANNING MEALS THAT ARE LOWER IN SODIUM
1. Distribute the handout Sodium Content of a Sample Daily Menu. Ask participants to work with a partner to reduce the amount of sodium in the menu.
2. Invite pairs to share how they would adapt the menu to lower the amount of sodium. Wait for responses and then add anything not mentioned:
• Prepare dishes from scratch; limit use of packaged foods.
• Use less salt at the table; keep the salt shaker off the table.
• Cook with herbs and spices instead of salt.
• Eat out less often.
• When possible, use fresh or frozen vegetables; if using canned, rinse the food before preparing if possible.
ACTIVITY: REVIEW, EVALUATION, PERSONAL NEXT STEPS
1. Ask participants what questions they have about sodium and how to plan healthier meals with less sodium. Answer any questions. Refer participants to the ChooseMyPlate.gov website for more resources and tips. Offer the Salt and Sodium – 10 tips to help you cut back and Use These Seasonings Instead of Salt tip sheets for participants to take if they choose.
C U T B A C K O N S A LT A N D S O D I U M
2. Do a class evaluation as a group, asking participants to respond to the following questions:
• What are the benefits of eating lower sodium meals for you personally?
• What are three ways to reduce sodium in meals?
• What did you learn today that was new to you?
• What changes are you planning to make as a result of today’s class?
Thank participants for attending class today and learning more about reducing sodium to help them plan healthy meals for their families.
#300458/Ver.09/15
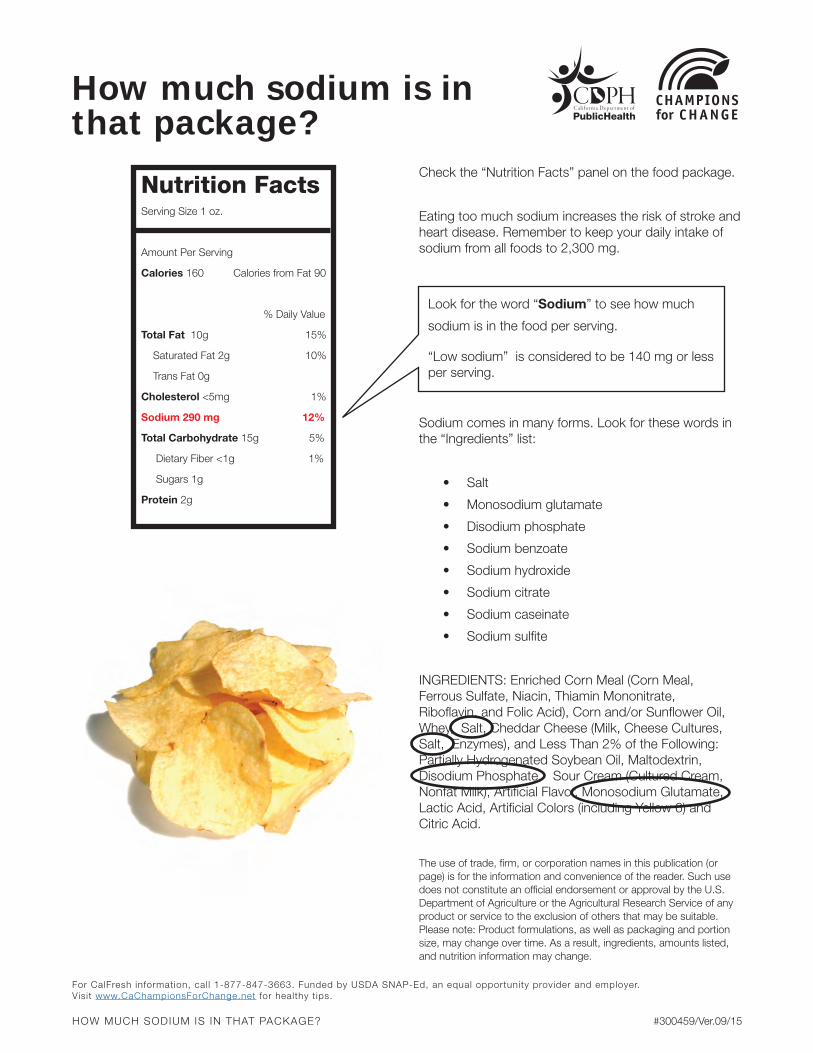
How much sodium is inthat package?
Nutrition FactsServing Size 1 oz.
Amount Per Serving
Calories 160 Calories from Fat 90
% Daily Value
Total Fat 10g 15%
Saturated Fat 2g 10%
Trans Fat 0g
Cholesterol <5mg 1%
Sodium 290 mg 12%
Total Carbohydrate 15g 5%
Dietary Fiber <1g 1%
Sugars 1g
Protein 2g
Check the “Nutrition Facts” panel on the food package.
Eating too much sodium increases the risk of stroke and heart disease. Remember to keep your daily intake of sodium from all foods to 2,300 mg.
Look for the word “Sodium” to see how much
sodium is in the food per serving.
“Low sodium” is considered to be 140 mg or less per serving.
Sodium comes in many forms. Look for these words in the “Ingredients” list:
• Salt
• Monosodium glutamate
• Disodium phosphate
• Sodium benzoate
• Sodium hydroxide
• Sodium citrate
• Sodium caseinate
• Sodium sulfite
INGREDIENTS: Enriched Corn Meal (Corn Meal, Ferrous Sulfate, Niacin, Thiamin Mononitrate, Riboflavin, and Folic Acid), Corn and/or Sunflower Oil, Whey, Salt, Cheddar Cheese (Milk, Cheese Cultures, Salt, Enzymes), and Less Than 2% of the Following: Partially Hydrogenated Soybean Oil, Maltodextrin, Disodium Phosphate, Sour Cream (Cultured Cream, Nonfat Milk), Artificial Flavor, Monosodium Glutamate, Lactic Acid, Artificial Colors (including Yellow 6) and Citric Acid.
The use of trade, firm, or corporation names in this publication (or page) is for the information and convenience of the reader. Such use does not constitute an official endorsement or approval by the U.S. Department of Agriculture or the Agricultural Research Service of any product or service to the exclusion of others that may be suitable. Please note: Product formulations, as well as packaging and portion size, may change over time. As a result, ingredients, amounts listed, and nutrition information may change.
#300459/Ver.09/15
For CalFresh information, cal l 1-877-847-3663. Funded by USDA SNAP-Ed, an equal opportunity provider and employer. Visit www.CaChampionsForChange.net for healthy t ips.
HOW MUCH SODIUM IS IN THAT PACKAGE?
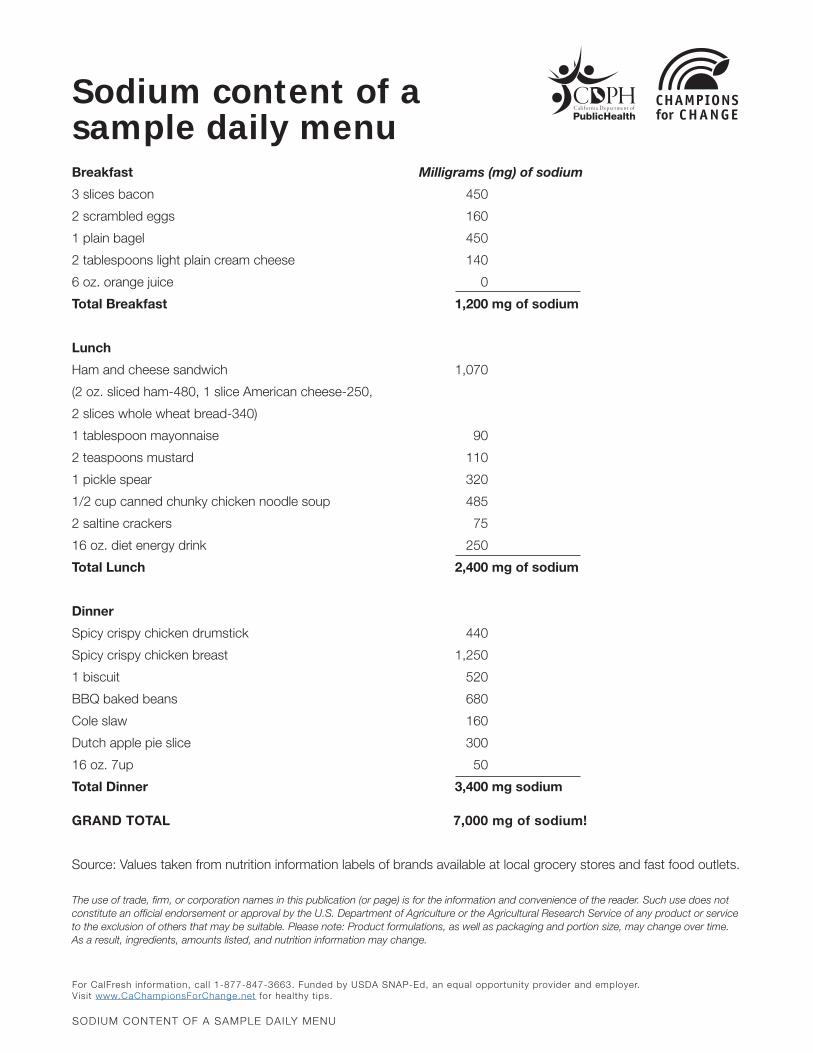
For CalFresh information, cal l 1-877-847-3663. Funded by USDA SNAP-Ed, an equal opportunity provider and employer. Visit www.CaChampionsForChange.net for healthy t ips.
SODIUM CONTENT OF A SAMPLE DAILY MENU
Breakfast Milligrams (mg) of sodium
3 slices bacon 450
2 scrambled eggs 160
1 plain bagel 450
2 tablespoons light plain cream cheese 140
6 oz. orange juice 0
Total Breakfast 1,200 mg of sodium
Lunch
Ham and cheese sandwich 1,070
(2 oz. sliced ham-480, 1 slice American cheese-250,
2 slices whole wheat bread-340)
1 tablespoon mayonnaise 90
2 teaspoons mustard 110
1 pickle spear 320
1/2 cup canned chunky chicken noodle soup 485
2 saltine crackers 75
16 oz. diet energy drink 250
Total Lunch 2,400 mg of sodium
Dinner
Spicy crispy chicken drumstick 440
Spicy crispy chicken breast 1,250
1 biscuit 520
BBQ baked beans 680
Cole slaw 160
Dutch apple pie slice 300
16 oz. 7up 50
Total Dinner 3,400 mg sodium
GRAND TOTAL 7,000 mg of sodium!
Source: Values taken from nutrition information labels of brands available at local grocery stores and fast food outlets. The use of trade, firm, or corporation names in this publication (or page) is for the information and convenience of the reader. Such use does not constitute an official endorsement or approval by the U.S. Department of Agriculture or the Agricultural Research Service of any product or service to the exclusion of others that may be suitable. Please note: Product formulations, as well as packaging and portion size, may change over time. As a result, ingredients, amounts listed, and nutrition information may change.
Sodium content of asample daily menu
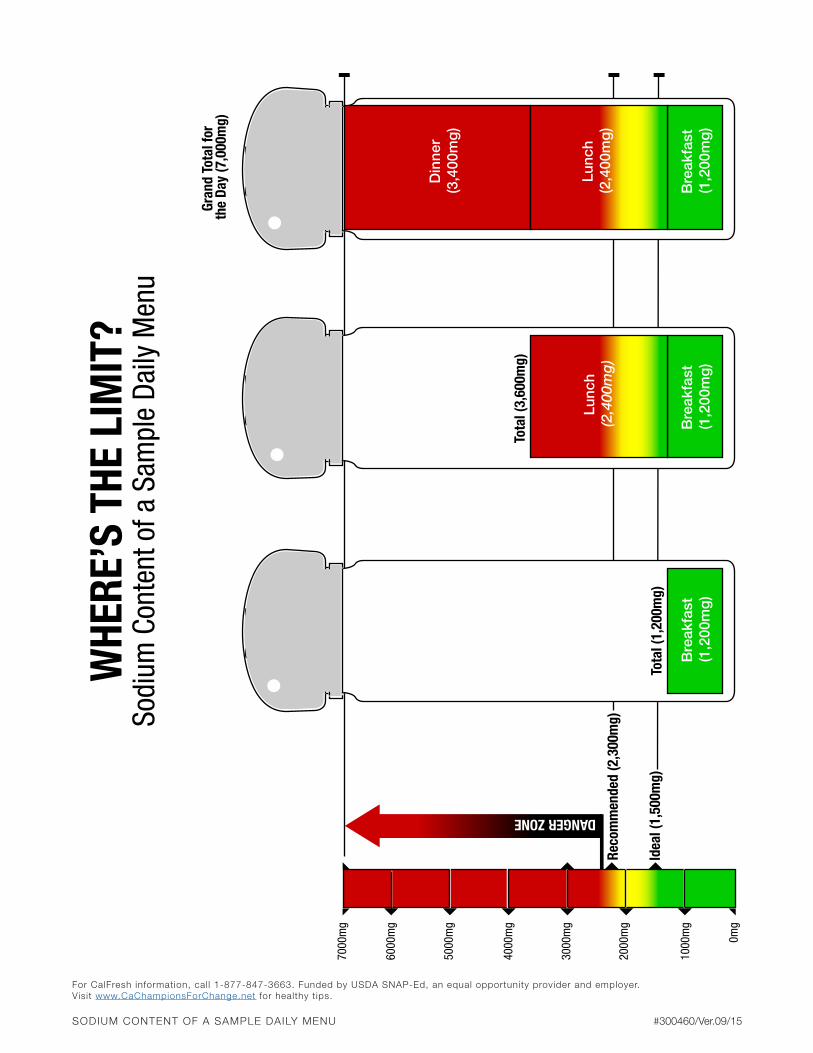
For CalFresh information, cal l 1-877-847-3663. Funded by USDA SNAP-Ed, an equal opportunity provider and employer. Visit www.CaChampionsForChange.net for healthy t ips.
SODIUM CONTENT OF A SAMPLE DAILY MENU
4000
mg
6000
mg
Idea
l (1,
500m
g)
Reco
mm
ende
d (2
,300
mg)
2000
mg
1000
mg
3000
mg
5000
mg
7000
mg
0mg
DANGER ZONE
Bre
akfa
st
(1,2
00m
g)
Bre
akfa
st
(1,2
00m
g)
Bre
akfa
st
(1,2
00m
g)
Lunc
h(2
,400
mg
)
Din
ner
(3,4
00m
g)
Lunc
h(2,400mg)
Tota
l (3,
600m
g)
Tota
l (1,
200m
g)
Gran
d To
tal f
or
the
Day
(7,0
00m
g)
WHE
RE’S
THE
LIM
IT?
Sodi
um C
onte
nt o
f a S
ampl
e Da
ily M
enu
#300460/Ver.09/15
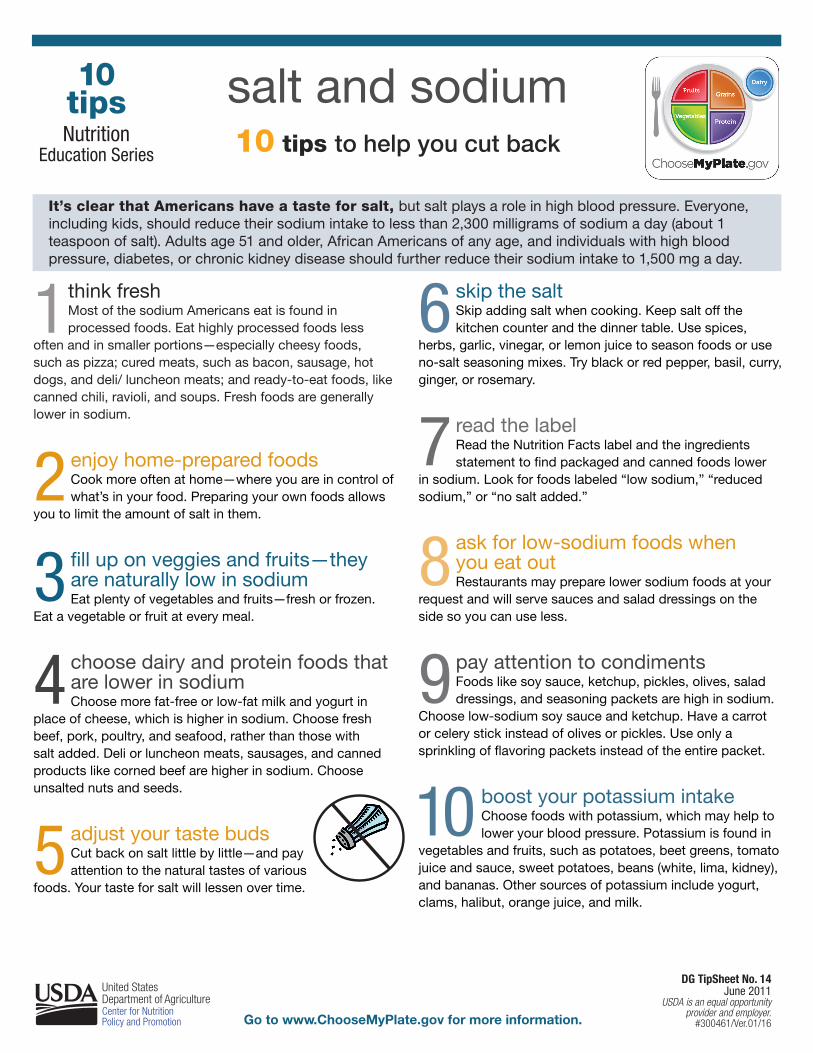
salt and sodium10 tips to help you cut back
10 tipsNutrition
Education Series
skip the saltSkip adding salt when cooking. Keep salt off the kitchen counter and the dinner table. Use spices,
herbs, garlic, vinegar, or lemon juice to season foods or use no-salt seasoning mixes. Try black or red pepper, basil, curry, ginger, or rosemary.
read the labelRead the Nutrition Facts label and the ingredients statement to find packaged and canned foods lower
in sodium. Look for foods labeled “low sodium,” “reduced sodium,” or “no salt added.”
ask for low-sodium foods when you eat outRestaurants may prepare lower sodium foods at your
request and will serve sauces and salad dressings on the side so you can use less.
pay attention to condimentsFoods like soy sauce, ketchup, pickles, olives, salad dressings, and seasoning packets are high in sodium.
Choose low-sodium soy sauce and ketchup. Have a carrot or celery stick instead of olives or pickles. Use only a sprinkling of flavoring packets instead of the entire packet.
boost your potassium intakeChoose foods with potassium, which may help to lower your blood pressure. Potassium is found in
vegetables and fruits, such as potatoes, beet greens, tomato juice and sauce, sweet potatoes, beans (white, lima, kidney), and bananas. Other sources of potassium include yogurt, clams, halibut, orange juice, and milk.
think freshMost of the sodium Americans eat is found in processed foods. Eat highly processed foods less
often and in smaller portions—especially cheesy foods, such as pizza; cured meats, such as bacon, sausage, hot dogs, and deli/ luncheon meats; and ready-to-eat foods, like canned chili, ravioli, and soups. Fresh foods are generally lower in sodium.
enjoy home-prepared foodsCook more often at home—where you are in control of what’s in your food. Preparing your own foods allows
you to limit the amount of salt in them.
fill up on veggies and fruits—they are naturally low in sodiumEat plenty of vegetables and fruits—fresh or frozen.
Eat a vegetable or fruit at every meal.
choose dairy and protein foods that are lower in sodiumChoose more fat-free or low-fat milk and yogurt in
place of cheese, which is higher in sodium. Choose fresh beef, pork, poultry, and seafood, rather than those with salt added. Deli or luncheon meats, sausages, and canned products like corned beef are higher in sodium. Choose unsalted nuts and seeds.
adjust your taste budsCut back on salt little by little—and pay attention to the natural tastes of various
foods. Your taste for salt will lessen over time.
1 6
7
8
9
10
2
3
4
5
United States Department of Agriculture Center for Nutrition Policy and Promotion Go to www.ChooseMyPlate.gov for more information.
DG TipSheet No. 14June 2011
USDA is an equal opportunity provider and employer.
#300461/Ver.01/16
It’s clear that Americans have a taste for salt, but salt plays a role in high blood pressure. Everyone, including kids, should reduce their sodium intake to less than 2,300 milligrams of sodium a day (about 1 teaspoon of salt). Adults age 51 and older, African Americans of any age, and individuals with high blood pressure, diabetes, or chronic kidney disease should further reduce their sodium intake to 1,500 mg a day.
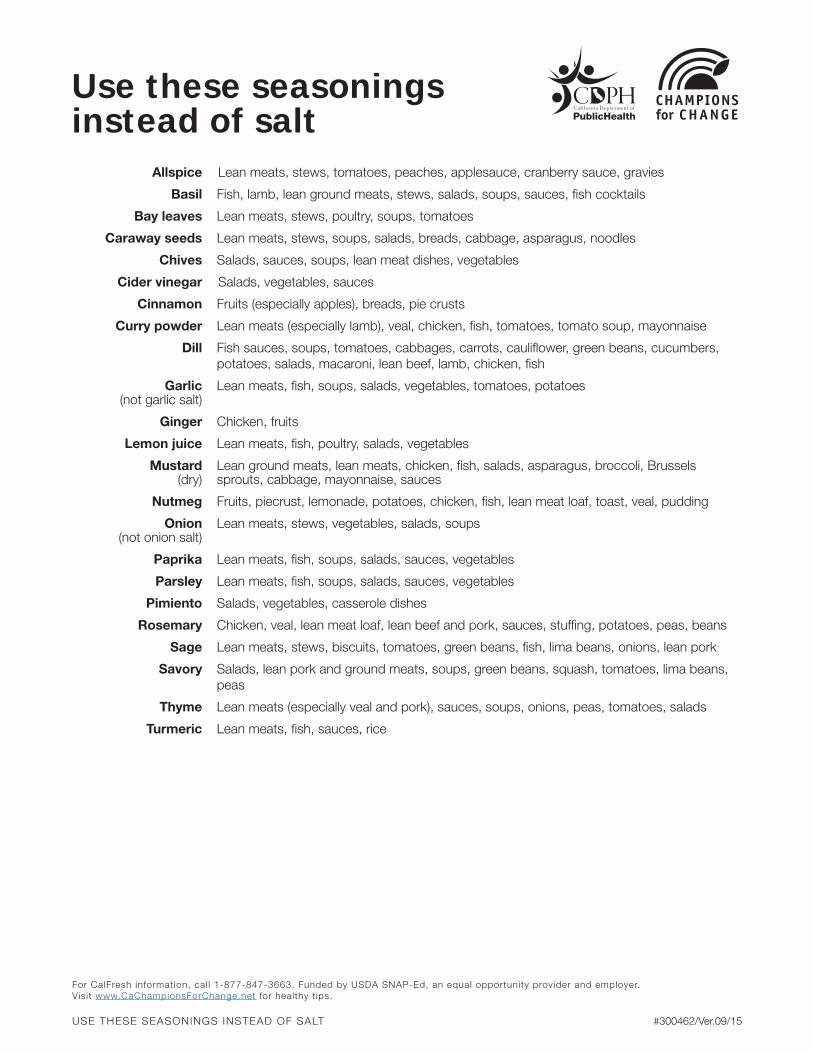
Allspice Lean meats, stews, tomatoes, peaches, applesauce, cranberry sauce, gravies
Basil Fish, lamb, lean ground meats, stews, salads, soups, sauces, fish cocktails
Bay leaves Lean meats, stews, poultry, soups, tomatoes
Caraway seeds Lean meats, stews, soups, salads, breads, cabbage, asparagus, noodles
Chives Salads, sauces, soups, lean meat dishes, vegetables
Cider vinegar Salads, vegetables, sauces
Cinnamon Fruits (especially apples), breads, pie crusts
Curry powder Lean meats (especially lamb), veal, chicken, fish, tomatoes, tomato soup, mayonnaise
Dill Fish sauces, soups, tomatoes, cabbages, carrots, cauliflower, green beans, cucumbers, potatoes, salads, macaroni, lean beef, lamb, chicken, fish
Garlic Lean meats, fish, soups, salads, vegetables, tomatoes, potatoes (not garlic salt)
Ginger Chicken, fruits
Lemon juice Lean meats, fish, poultry, salads, vegetables
Mustard Lean ground meats, lean meats, chicken, fish, salads, asparagus, broccoli, Brussels (dry) sprouts, cabbage, mayonnaise, sauces
Nutmeg Fruits, piecrust, lemonade, potatoes, chicken, fish, lean meat loaf, toast, veal, pudding
Onion Lean meats, stews, vegetables, salads, soups (not onion salt)
Paprika Lean meats, fish, soups, salads, sauces, vegetables
Parsley Lean meats, fish, soups, salads, sauces, vegetables
Pimiento Salads, vegetables, casserole dishes
Rosemary Chicken, veal, lean meat loaf, lean beef and pork, sauces, stuffing, potatoes, peas, beans
Sage Lean meats, stews, biscuits, tomatoes, green beans, fish, lima beans, onions, lean pork
Savory Salads, lean pork and ground meats, soups, green beans, squash, tomatoes, lima beans, peas
Thyme Lean meats (especially veal and pork), sauces, soups, onions, peas, tomatoes, salads
Turmeric Lean meats, fish, sauces, rice
Use these seasonings instead of salt
#300462/Ver.09/15
For CalFresh information, cal l 1-877-847-3663. Funded by USDA SNAP-Ed, an equal opportunity provider and employer. Visit www.CaChampionsForChange.net for healthy t ips.
USE THESE SEASONINGS INSTEAD OF SALT
G E T P H Y S I C A L
Get Physical
LEARNING OBJECTIVES
By the end of the lesson, participants will be able to:
• Measure their heart rate.
• Explain the differences between moderate and vigorous levels of physical activity.
• Identify the recommended frequency and duration of moderate or vigorous activity for children and adults per guidelines from the Centers for Disease Control and Prevention (CDC).
MATERIALS
• Sign-in sheet
• Name tags (optional)
• Pens or pencils
• Small pieces of paper
• White board or flip chart with markers
• Calculator
• Watch with second hand or stopwatch
• Handouts:
o Taking Your Pulse
o Recommended Minutes of Physical Activity for Adults and Youth
o Physical Activity Schedule
PREPARATION
• Review lesson plan and handouts.
• Be prepared to explain and apply the information in the lesson.
• Locate a room that will accommodate participants comfortably. If possible, pick a place with access to a walking path or other similar safe physical activity resource.
• Become familiar with the technique to locate an artery on the wrist and take a person’s pulse.
• Become familiar with the CDC recommended physical activity guidelines for adults and youth.
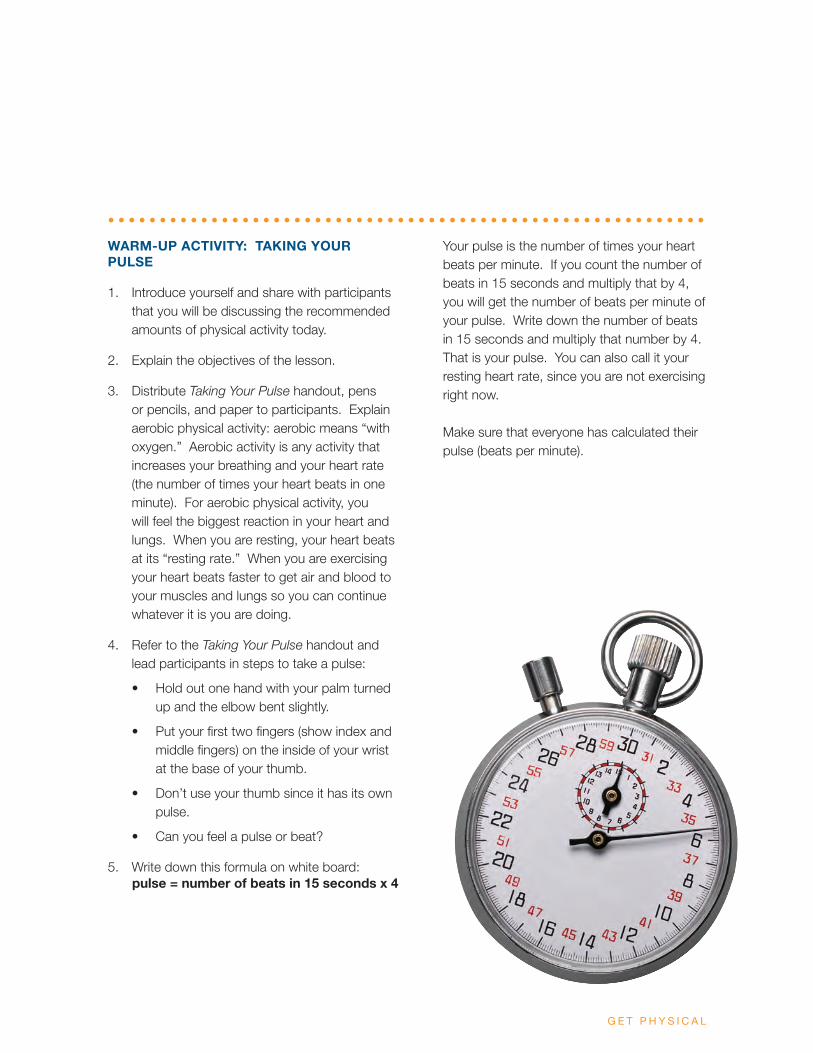
G E T P H Y S I C A L
WARM-UP ACTIVITY: TAKING YOUR PULSE
1. Introduce yourself and share with participants that you will be discussing the recommended amounts of physical activity today.
2. Explain the objectives of the lesson.
3. Distribute Taking Your Pulse handout, pens or pencils, and paper to participants. Explain aerobic physical activity: aerobic means “with oxygen.” Aerobic activity is any activity that increases your breathing and your heart rate (the number of times your heart beats in one minute). For aerobic physical activity, you will feel the biggest reaction in your heart and lungs. When you are resting, your heart beats at its “resting rate.” When you are exercising your heart beats faster to get air and blood to your muscles and lungs so you can continue whatever it is you are doing.
4. Refer to the Taking Your Pulse handout and lead participants in steps to take a pulse:
• Hold out one hand with your palm turned up and the elbow bent slightly.
• Put your first two fingers (show index and middle fingers) on the inside of your wrist at the base of your thumb.
• Don’t use your thumb since it has its own pulse.
• Can you feel a pulse or beat?
5. Write down this formula on white board: pulse = number of beats in 15 seconds x 4
• • • • • • • • • • • • • • • • • • • • • • • • • • • • • • • • • • • • • • • • • • • • • • • • • • • • • • • • • •
Your pulse is the number of times your heart beats per minute. If you count the number of beats in 15 seconds and multiply that by 4, you will get the number of beats per minute of your pulse. Write down the number of beats in 15 seconds and multiply that number by 4. That is your pulse. You can also call it your resting heart rate, since you are not exercising right now. Make sure that everyone has calculated their pulse (beats per minute).
G E T P H Y S I C A L
ACTIVITY: MODERATE AND VIGOROUS ACTIVITY
1. Explain the next activity, marching in place for 3 minutes. Ask participants to stand up and march in place for 3 minutes and do this activity with them. Then have the group slow down and stop. Ask participants to again take their pulse for 15 seconds, record the number, and multiply it by 4. Explain that they just completed a moderate level activity. Pulse and breathing have increased compared to the resting rates.
2. Explain that they will now walk quickly for 4 minutes (if brisk walking is not possible, substitute jumping jacks or other vigorous activity). Lead the group at a brisk pace for 4 minutes. Then have the group slow down and stop. Have them take their pulse for 15 seconds, record the number, and multiply it by 4. Explain that they just completed a vigorous level activity and their pulse should be higher and breathing should be deeper and faster than before. Participants could also be starting to sweat. Lead participants in walking at a slow pace for recovery and stopping for water if desired.
3. Ask, by show of hands, how many had their heart rate go up during the moderate activity as compared to the resting number. Explain that activities like light house work, light yard work, raking leaves, mowing with a power mower, washing the car, or riding a bike on level ground at a medium pace are considered moderate level activities.
4. Then ask participants, by show of hands, how many had their heart rate increase even more with the vigorous physical activity compared
to the moderate first walk. Ask how many had to breathe harder. How many started to sweat? Explain that activities like playing team sports, running, jogging, or swimming laps in a pool are examples of vigorous activities. The heart beats faster, breathing gets faster and deeper, and people may start to sweat.
ACTIVITY: PHYSICAL ACTIVITY RECOMMENDATIONS
1. Distribute the handout Recommended Minutes of Physical Activity for Adults and Youth. Review the guidelines, referring to the information in the handout. Adults: 30 minutes a day of moderate to vigorous activity, 5 or more days a week to:
• Maintain good health and weight, strengthen muscles and bones, and help prevent chronic disease
• Activity can be done in 10 minute periods of time 3 times throughout the day
Children and teens: 60 minutes of moderate to vigorous activity every day to:
• Maintain good health, create healthy activity habits, develop strong muscles and bones, help prevent obesity and related chronic diseases
2. Ask participants for their reactions to the recommendations. How do they think their current physical activity level compares to the guidelines? What about their children’s activity level?
G E T P H Y S I C A L
ACTIVITY: REVIEW, EVALUATION, PERSONAL NEXT STEPS
1. Ask participants to share how they could modify their (and their families’) current physical activity levels to follow the recommendations. Give a few examples if needed to start the discussion.
2. Ask what questions participants have about moderate and vigorous activity, or about the recommendations. Answer any questions. Offer the Physical Activity Schedule for participants to take if they choose.
3. Do a class evaluation as a group, asking participants to respond to the following questions:
• What are the benefits of being physically active for you personally?
• What did you learn today that was new to you?
• What changes are you planning to make as a result of today’s class?
Thank participants for attending class today and learning more about healthy amounts of physical activity for themselves and their families.
TIPS FOR INSTRUCTORS
• Have participants increase their physical activity intensity level, if desired, by pumping their arms while they walk.
• Remind participants to drink plenty of water before, during and after physical activity.
• Invite a representative from a local YMCA or YWCA, or local gym, to present the lesson with you.
• Recommend that participants visit their medical doctor before starting any physical activity program.
EXPANSION IDEA: PLANNING A WEEKLY PHYSICAL ACTIVITY SCHEDULE
Ask participants: How do we fit physical activity into our daily routines?
Ask participants what keeps them from meeting the physical activity guidelines. Write down responses.
Remind participants that the recommended minimum amount of physical activity per day is 30 minutes, and that this can be broken up into 10 minute periods of physical activity. Ask how participants feel about dedicating 10 minutes, 3 times a day for physical activity. Ask what types of moderate level physical activity they can do for 10 minutes at a time.
Distribute the Physical Activity Schedule handout and ask participants to fill it out.
Provide a few ideas to help participants fit physical activity into their regular routines:
• If you take your kids to soccer practice, can you walk in the park for 10 to 30 minutes while your kids practice?
• Would doing activities with a friend help you keep your schedule and offer encouragement?
• Can you take the family to the park for an hour on the weekend?
#300463/Ver.09/15
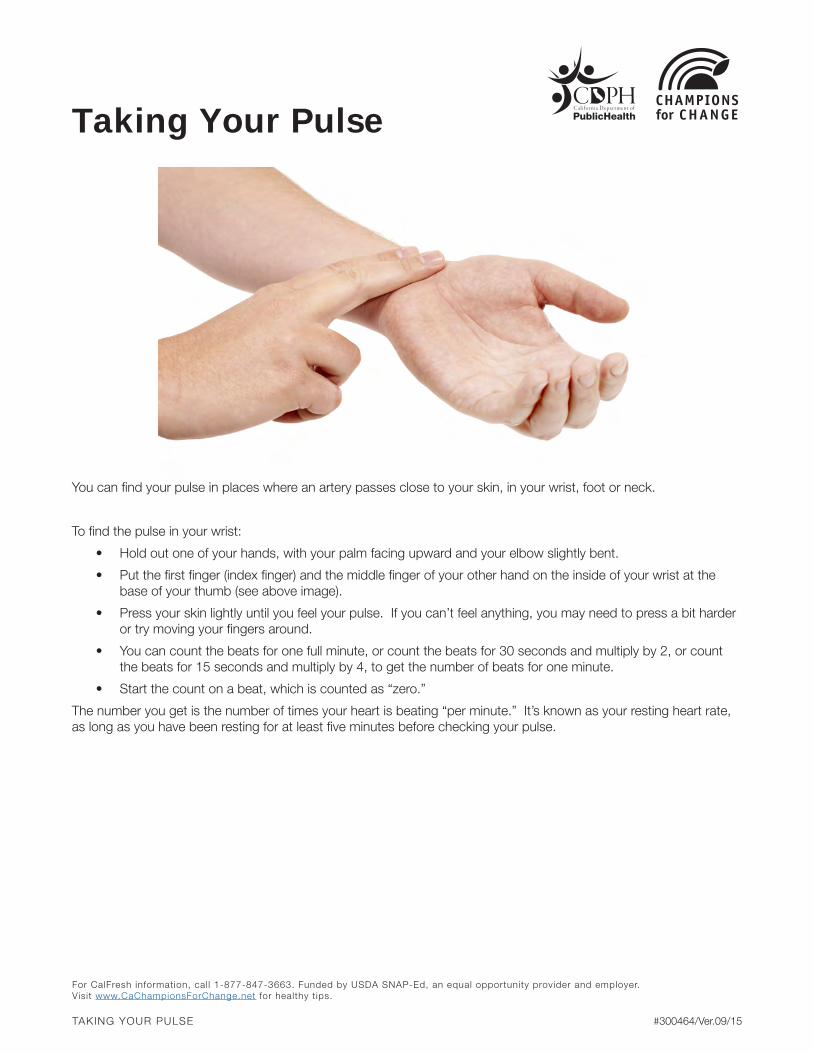
Taking Your Pulse
TAKING YOUR PULSE
You can find your pulse in places where an artery passes close to your skin, in your wrist, foot or neck.
To find the pulse in your wrist:
• Hold out one of your hands, with your palm facing upward and your elbow slightly bent.
• Put the first finger (index finger) and the middle finger of your other hand on the inside of your wrist at the base of your thumb (see above image).
• Press your skin lightly until you feel your pulse. If you can’t feel anything, you may need to press a bit harder or try moving your fingers around.
• You can count the beats for one full minute, or count the beats for 30 seconds and multiply by 2, or count the beats for 15 seconds and multiply by 4, to get the number of beats for one minute.
• Start the count on a beat, which is counted as “zero.”
The number you get is the number of times your heart is beating “per minute.” It’s known as your resting heart rate, as long as you have been resting for at least five minutes before checking your pulse.
#300464/Ver.09/15
For CalFresh information, cal l 1-877-847-3663. Funded by USDA SNAP-Ed, an equal opportunity provider and employer. Visit www.CaChampionsForChange.net for healthy t ips.
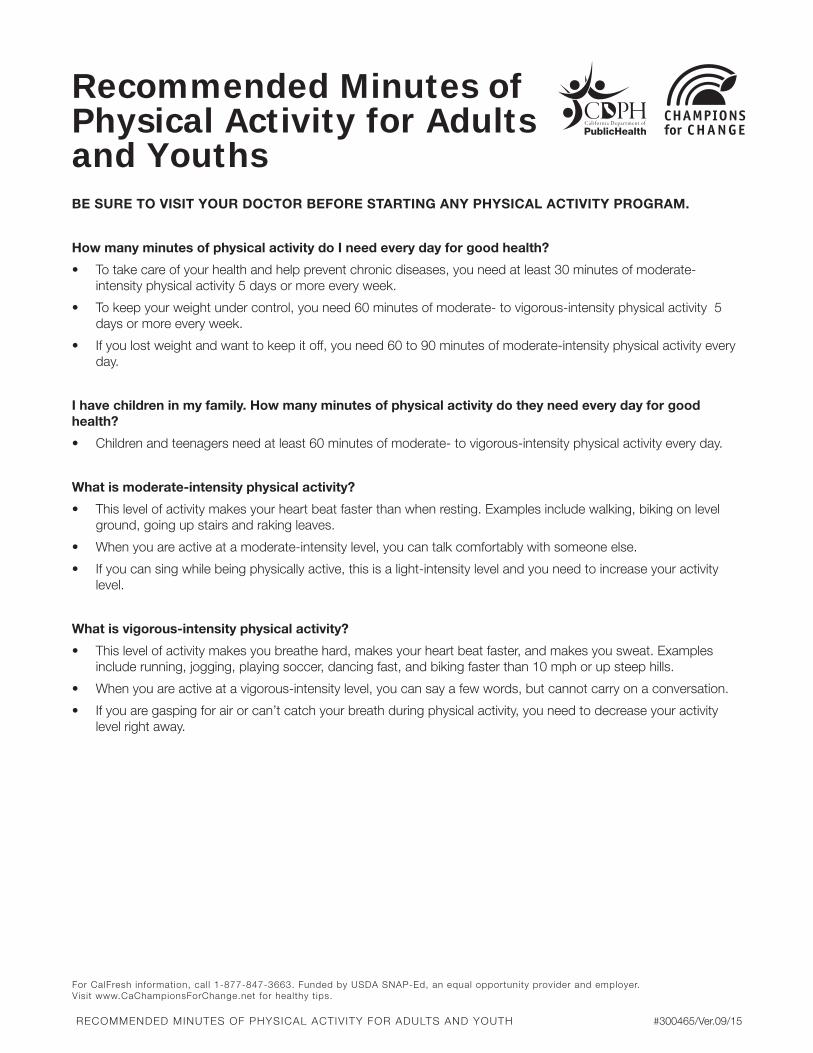
BE SURE TO VISIT YOUR DOCTOR BEFORE STARTING ANY PHYSICAL ACTIVITY PROGRAM.
How many minutes of physical activity do I need every day for good health?
• To take care of your health and help prevent chronic diseases, you need at least 30 minutes of moderate-intensity physical activity 5 days or more every week.
• To keep your weight under control, you need 60 minutes of moderate- to vigorous-intensity physical activity 5 days or more every week.
• If you lost weight and want to keep it off, you need 60 to 90 minutes of moderate-intensity physical activity every day.
I have children in my family. How many minutes of physical activity do they need every day for good health?
• Children and teenagers need at least 60 minutes of moderate- to vigorous-intensity physical activity every day.
What is moderate-intensity physical activity?
• This level of activity makes your heart beat faster than when resting. Examples include walking, biking on level ground, going up stairs and raking leaves.
• When you are active at a moderate-intensity level, you can talk comfortably with someone else.
• If you can sing while being physically active, this is a light-intensity level and you need to increase your activity level.
What is vigorous-intensity physical activity?
• This level of activity makes you breathe hard, makes your heart beat faster, and makes you sweat. Examples include running, jogging, playing soccer, dancing fast, and biking faster than 10 mph or up steep hills.
• When you are active at a vigorous-intensity level, you can say a few words, but cannot carry on a conversation.
• If you are gasping for air or can’t catch your breath during physical activity, you need to decrease your activity level right away.
Recommended Minutes of Physical Activity for Adults and Youths
#300465/Ver.09/15
For CalFresh information, cal l 1-877-847-3663. Funded by USDA SNAP-Ed, an equal opportunity provider and employer. Visit www.CaChampionsForChange.net for healthy t ips.
RECOMMENDED MINUTES OF PHYSICAL ACTIVITY FOR ADULTS AND YOUTH
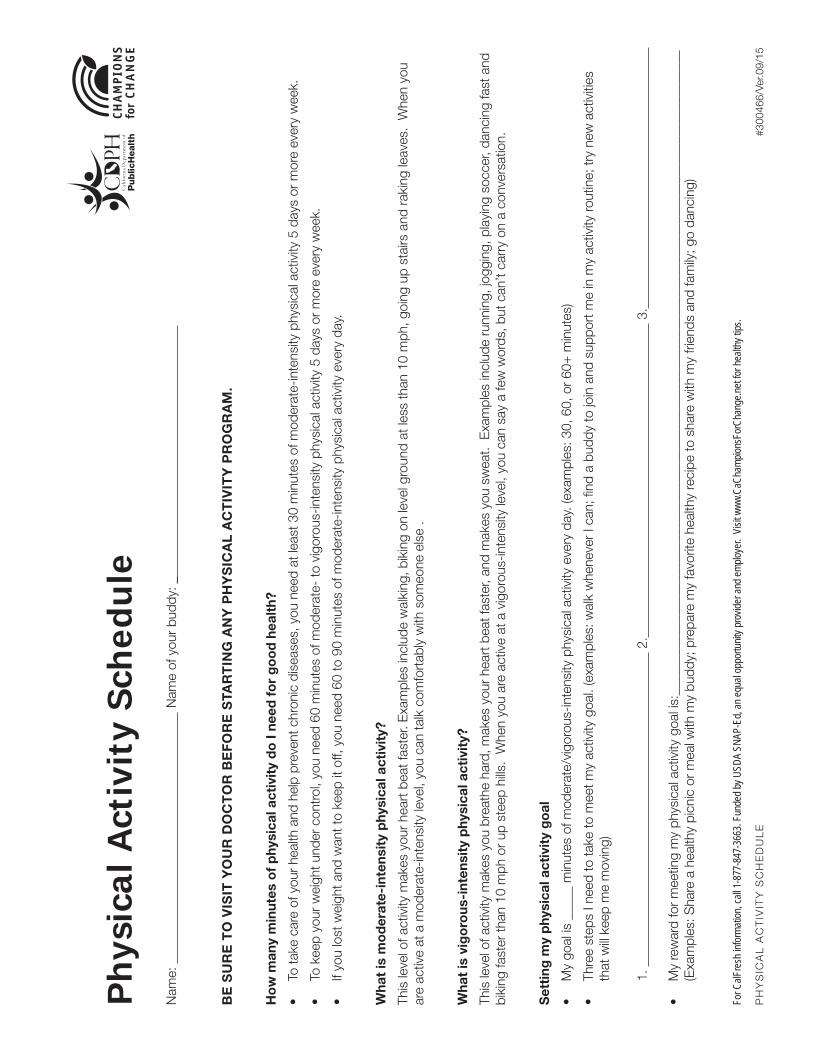
#300
466/
Ver.0
9/15
For C
alFre
sh in
forma
tion,
call 1
-877
-847
-366
3. Fu
nded
by U
SDA
SNAP
-Ed,
an eq
ual o
ppor
tunity
prov
ider a
nd em
ploye
r. Vi
sit w
ww.C
aCha
mpion
sFor
Chan
ge.ne
t for h
ealth
y tips
.
PH
YS
ICA
L A
CT
IVIT
Y S
CH
ED
UL
E
Nam
e:
Nam
e of
you
r bu
ddy:
_
BE
SU
RE
TO
VIS
IT Y
OU
R D
OC
TO
R B
EF
OR
E S
TAR
TIN
G A
NY
PH
YS
ICA
L A
CT
IVIT
Y P
RO
GR
AM
.
Ho
w m
any
min
utes
of
phy
sica
l act
ivit
y d
o I
need
fo
r g
oo
d h
ealt
h?
• To
take
car
e of
you
r he
alth
and
hel
p pr
even
t chr
onic
dis
ease
s, y
ou n
eed
at le
ast 3
0 m
inut
es o
f mod
erat
e-in
tens
ity p
hysi
cal a
ctiv
ity 5
day
s or
mor
e ev
ery
wee
k.
• To
kee
p yo
ur w
eigh
t und
er c
ontr
ol, y
ou n
eed
60 m
inut
es o
f mod
erat
e- to
vig
orou
s-in
tens
ity p
hysi
cal a
ctiv
ity 5
day
s or
mor
e ev
ery
wee
k.
• If
you
lost
wei
ght a
nd w
ant t
o ke
ep it
off,
you
nee
d 60
to 9
0 m
inut
es o
f mod
erat
e-in
tens
ity p
hysi
cal a
ctiv
ity e
very
day
.
Wha
t is
mo
der
ate-
inte
nsit
y p
hysi
cal a
ctiv
ity?
This
leve
l of a
ctiv
ity m
akes
you
r he
art b
eat f
aste
r. E
xam
ples
incl
ude
wal
king
, bik
ing
on le
vel g
roun
d at
less
than
10
mph
, goi
ng u
p st
airs
and
rak
ing
leav
es.
Whe
n yo
u ar
e ac
tive
at a
mod
erat
e-in
tens
ity le
vel,
you
can
talk
com
fort
ably
with
som
eone
els
e .
Wha
t is
vig
oro
us-i
nten
sity
phy
sica
l act
ivit
y?
This
leve
l of a
ctiv
ity m
akes
you
bre
athe
har
d, m
akes
you
r he
art b
eat f
aste
r, an
d m
akes
you
sw
eat.
Exa
mpl
es in
clud
e ru
nnin
g, jo
ggin
g, p
layi
ng s
occe
r, da
ncin
g fa
st a
nd
biki
ng fa
ster
than
10
mph
or
up s
teep
hills
. W
hen
you
are
activ
e at
a v
igor
ous-
inte
nsity
leve
l, yo
u ca
n sa
y a
few
wor
ds, b
ut c
an’t
carr
y on
a c
onve
rsat
ion.
Set
ting
my
phy
sica
l act
ivit
y g
oal
• M
y go
al is
___
__ m
inut
es o
f mod
erat
e/vi
goro
us-in
tens
ity p
hysi
cal a
ctiv
ity e
very
day
. (ex
ampl
es: 3
0, 6
0, o
r 60
+ m
inut
es)
• Th
ree
step
s I n
eed
to ta
ke to
mee
t my
activ
ity g
oal.
(exa
mpl
es: w
alk
whe
neve
r I c
an; fi
nd a
bud
dy to
join
and
sup
port
me
in m
y ac
tivity
rout
ine;
try
new
act
iviti
es
that
will
keep
me
mov
ing)
1.
2.
3
.
• M
y re
war
d fo
r m
eetin
g m
y ph
ysic
al a
ctiv
ity g
oal i
s:__
____
____
____
____
____
____
____
____
____
____
____
____
____
____
____
____
____
____
____
____
____
____
____
___
(Exa
mpl
es: S
hare
a h
ealth
y pi
cnic
or
mea
l with
my
budd
y; p
repa
re m
y fa
vorit
e he
alth
y re
cipe
to s
hare
with
my
frien
ds a
nd fa
mily
; go
danc
ing)
Ph
ysic
al A
ctiv
ity
Sch
edu
le
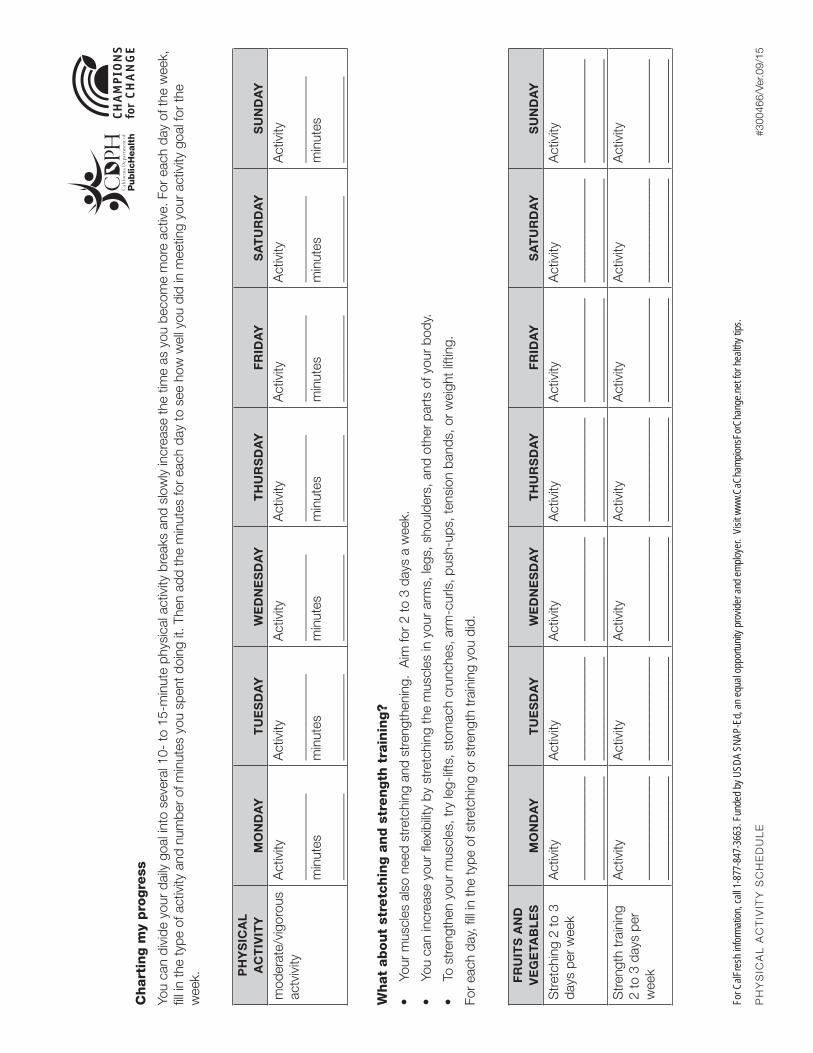
#300
466/
Ver.0
9/15
For C
alFre
sh in
forma
tion,
call 1
-877
-847
-366
3. Fu
nded
by U
SDA
SNAP
-Ed,
an eq
ual o
ppor
tunity
prov
ider a
nd em
ploye
r. Vi
sit w
ww.C
aCha
mpion
sFor
Chan
ge.ne
t for h
ealth
y tips
.
PH
YS
ICA
L A
CT
IVIT
Y S
CH
ED
UL
E
Chart
ing m
y p
rogre
ss
You
can
divi
de y
our
daily
goa
l int
o se
vera
l 10-
to 1
5-m
inut
e ph
ysic
al a
ctiv
ity b
reak
s an
d sl
owly
incr
ease
the
time
as y
ou b
ecom
e m
ore
activ
e. F
or e
ach
day
of th
e w
eek,
fil
l in
the
type
of a
ctiv
ity a
nd n
umbe
r of
min
utes
you
spe
nt d
oing
it. T
hen
add
the
min
utes
for
each
day
to s
ee h
ow w
ell y
ou d
id in
mee
ting
your
act
ivity
goa
l for
the
wee
k. PH
YS
ICA
L A
CT
IVIT
YM
ON
DA
YT
UE
SD
AY
WE
DN
ES
DA
YT
HU
RS
DA
YF
RID
AY
SA
TU
RD
AY
SU
ND
AY
mod
erat
e/vi
goro
us
actv
ivity
Act
ivity
____
____
____
_ m
inut
es
____
____
____
_
Act
ivity
____
____
____
_ m
inut
es
____
____
____
_
Act
ivity
____
____
____
_ m
inut
es
____
____
____
_
Act
ivity
____
____
____
_ m
inut
es
____
____
____
_
Act
ivity
____
____
____
_ m
inut
es
____
____
____
_
Act
ivity
____
____
____
_ m
inut
es
____
____
____
_
Act
ivity
____
____
____
_ m
inut
es
____
____
____
_
What
ab
ou
t st
retc
hin
g a
nd
str
en
gth
tra
inin
g?
• Yo
ur m
uscl
es a
lso
need
str
etch
ing
and
stre
ngth
enin
g. A
im fo
r 2
to 3
day
s a
wee
k.
• Yo
u ca
n in
crea
se y
our
flexi
bilit
y by
str
etch
ing
the
mus
cles
in y
our
arm
s, le
gs, s
houl
ders
, and
oth
er p
arts
of y
our
body
.
• To
str
engt
hen
your
mus
cles
, try
leg-
lifts
, sto
mac
h cr
unch
es, a
rm-c
urls
, pus
h-up
s, te
nsio
n ba
nds,
or
wei
ght l
iftin
g.
For
each
day
, fill
in th
e ty
pe o
f str
etch
ing
or s
tren
gth
trai
ning
you
did
.
FR
UIT
S A
ND
V
EG
ETA
BL
ES
MO
ND
AY
TU
ES
DA
YW
ED
NE
SD
AY
TH
UR
SD
AY
FR
IDA
YS
AT
UR
DA
YS
UN
DA
Y
Str
etch
ing
2 to
3
days
per
wee
k A
ctiv
ity
____
____
____
___
____
____
___
Act
ivity
____
____
____
___
____
____
___
Act
ivity
____
____
____
___
____
____
___
Act
ivity
____
____
____
___
____
____
___
Act
ivity
____
____
____
___
____
____
___
Act
ivity
____
____
____
___
____
____
___
Act
ivity
____
____
____
___
____
____
___
Str
engt
h tr
aini
ng
2 to
3 d
ays
per
wee
k
Act
ivity
____
____
____
___
____
____
___
Act
ivity
____
____
____
___
____
____
___
Act
ivity
____
____
____
___
____
____
___
Act
ivity
____
____
____
___
____
____
___
Act
ivity
____
____
____
___
____
____
___
Act
ivity
____
____
____
___
____
____
___
Act
ivity
____
____
____
___
____
____
___
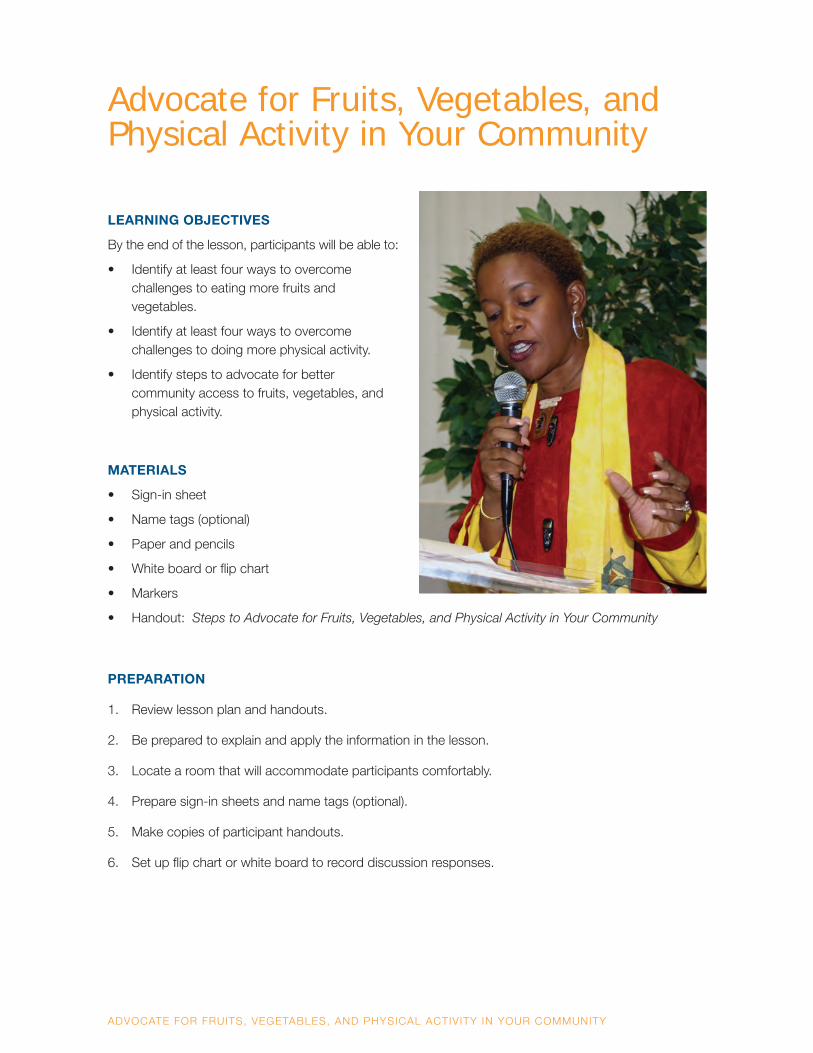
ADVOCATE FOR FRUITS, VEGETABLES, AND PHYSICAL ACTIVITY IN YOUR COMMUNITY
LEARNING OBJECTIVES
By the end of the lesson, participants will be able to:
• Identify at least four ways to overcome challenges to eating more fruits and vegetables.
• Identify at least four ways to overcome challenges to doing more physical activity.
• Identify steps to advocate for better community access to fruits, vegetables, and physical activity.
MATERIALS
• Sign-in sheet
• Name tags (optional)
• Paper and pencils
• White board or flip chart
• Markers
• Handout: Steps to Advocate for Fruits, Vegetables, and Physical Activity in Your Community
PREPARATION
1. Review lesson plan and handouts.
2. Be prepared to explain and apply the information in the lesson.
3. Locate a room that will accommodate participants comfortably.
4. Prepare sign-in sheets and name tags (optional).
5. Make copies of participant handouts.
6. Set up flip chart or white board to record discussion responses.
Advocate for Fruits, Vegetables, and Physical Activity in Your Community
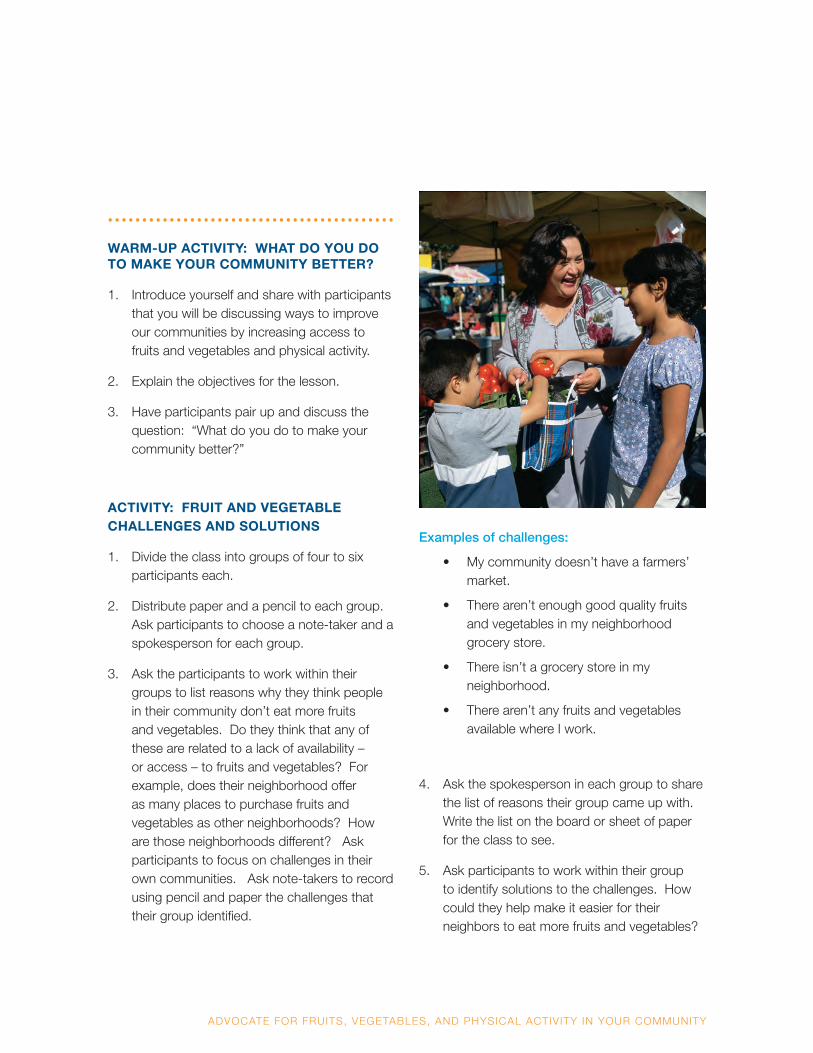
ADVOCATE FOR FRUITS, VEGETABLES, AND PHYSICAL ACTIVITY IN YOUR COMMUNITY
• • • • • • • • • • • • • • • • • • • • • • • • • • • • • • • • • • • • • • • • • •
WARM-UP ACTIVITY: WHAT DO YOU DO TO MAKE YOUR COMMUNITY BETTER?
1. Introduce yourself and share with participants that you will be discussing ways to improve our communities by increasing access to fruits and vegetables and physical activity.
2. Explain the objectives for the lesson.
3. Have participants pair up and discuss the question: “What do you do to make your community better?”
ACTIVITY: FRUIT AND VEGETABLE CHALLENGES AND SOLUTIONS
1. Divide the class into groups of four to six participants each.
2. Distribute paper and a pencil to each group. Ask participants to choose a note-taker and a spokesperson for each group.
3. Ask the participants to work within their groups to list reasons why they think people in their community don’t eat more fruits and vegetables. Do they think that any of these are related to a lack of availability – or access – to fruits and vegetables? For example, does their neighborhood offer as many places to purchase fruits and vegetables as other neighborhoods? How are those neighborhoods different? Ask participants to focus on challenges in their own communities. Ask note-takers to record using pencil and paper the challenges that their group identified.
Examples of challenges:
• My community doesn’t have a farmers’ market.
• There aren’t enough good quality fruits and vegetables in my neighborhood grocery store.
• There isn’t a grocery store in my neighborhood.
• There aren’t any fruits and vegetables available where I work.
4. Ask the spokesperson in each group to share the list of reasons their group came up with. Write the list on the board or sheet of paper for the class to see.
5. Ask participants to work within their group to identify solutions to the challenges. How could they help make it easier for their neighbors to eat more fruits and vegetables?
ADVOCATE FOR FRUITS, VEGETABLES, AND PHYSICAL ACTIVITY IN YOUR COMMUNITY
Examples of solutions:
• Work with other community members and leaders to get a farmers’ market started in the community.
• Ask my local grocery store to sell good quality fruits and vegetables.
• Ask employers to provide fruits and vegetables in the employee cafeterias.
• Work with other neighborhood residents and community leaders to get a grocery store in the neighborhood.
6. Ask the spokesperson in each group to share the list of solutions. Write the list on the white board or flip chart for the class to see.
ACTIVITY: PHYSICAL ACTIVITY CHALLENGES AND SOLUTIONS
1. Ask participants to work within their group to think about the reasons why people in their community are not more physically active. Does the community provide plenty of safe physical activity options for all neighborhoods? Ask note-takers to record using pencil and paper the challenges that their group identified.
Examples of challenges:
• My neighborhood is not safe for walking.
• My community does not have bicycle lanes.
• The walking paths in my community parks are poorly maintained.
2. Ask the spokesperson in each group to share the list of challenges. Write the list on the white board or flip chart for the class to see.
3. Ask participants to work within their groups to identify solutions to the challenges. What would it take to get the whole community more physically active? Walking, biking, playing… the moms, the dads, the kids, the old people?
Examples of solutions:
• Work with local law enforcement and other city officials to provide safe walking zones.
• Work with the Department of Transportation to construct bicycle lanes.
• Work with the Department of Parks and Recreation to restore walking paths.
4. Ask the spokesperson in each group to share the list of solutions. Write the list on the white board or flip chart for the class to see.
Tips for instructors• Invite a community development professional
to your class to discuss how your participants can make positive changes in their communities to increase access to fruits and vegetables and physical activity options.
• Use the expansion ideas to create a mini-course on community empowerment.
ADVOCATE FOR FRUITS, VEGETABLES, AND PHYSICAL ACTIVITY IN YOUR COMMUNITY
ACTIVITY: ADVOCATING FOR FRUITS, VEGETABLES, AND PHYSICAL ACTIVITY
1. Distribute the handout Steps to Advocate for Fruits, Vegetables, and Physical Activity in Your Community.
2. Describe each step to participants and allow them time to discuss with their group how they would apply the steps to one fruit and vegetable solution or one physical activity solution. Have the spokesperson in each group describe how his or her group applied the steps to the solutions.
3. Encourage participants to continue to work on their fruit and vegetable or physical activity solutions after class with their friends, family members, and neighbors.
Note: To achieve optimal results from this lesson, it is highly recommended that you conduct the expansion ideas with the participants during follow-up classes.
ACTIVITY: REVIEW, EVALUATION, PERSONAL NEXT STEPS
1. Ask what questions participants have about advocating for fruits and vegetables or physical activity. Answer any questions.
2. Do a class evaluation as a group, asking participants to respond to the following questions:
• For you personally, what are the benefits of having more fruits and vegetables and/or physical activity opportunities available to you in your community?
• What did you learn today that was new to you?
• What changes are you planning to make as a result of today’s class?
Thank participants for attending class today and learning more about advocating for increasing access to fruits, vegetables and physical activity in their communities.
ADVOCATE FOR FRUITS, VEGETABLES, AND PHYSICAL ACTIVITY IN YOUR COMMUNITY
Expansion IdeasFruit, Vegetable, and Physical Activity Community Assessments
Plan a follow-up class with the same group and work with participants to conduct a community assessment to determine what is available and what is lacking in terms of access to quality fruits and vegetables and physical activity opportunities. Photocopy the Fruit and Vegetable Community Assessment and Physical Activity Community Assessment handouts. Divide the class into two teams and ask one team to focus on access to quality fruits and vegetables and the other team to focus on opportunities for physical activity. Distribute the Fruit and Vegetable Community Assessment and Physical Activity Community Assessment handouts to the appropriate teams. Work with each team to complete the assessments.
After the assessments have been completed, schedule a follow-up class to discuss the results. Have participants use the Steps to Advocate for Fruits, Vegetables, and Physical Activity in Your Community handout to develop an action plan for improving access to fruits and vegetables and physical activity opportunities.
Community Walkability Checklist
Plan another class with the same group and conduct a walkability assessment of the participants’ community. You may want to have an additional instructor present to help manage the class and ensure safety. Photocopy the Walkability Checklist handout and distribute it to participants. After the assessments have been completed, schedule a follow-up class to discuss the results. Have participants use the Steps to Advocate for Fruits, Vegetables, and Physical Activity in Your Community handout to develop an action plan for improving walking conditions in their community.
#300467/Ver.09/15
STEPS TO ADVOCATE FOR FRUITS, VEGETABLES, AND PHYSICAL ACTIVITY IN YOUR COMMUNITY
For CalFresh information, cal l 1-877-847-3663. Funded by USDA SNAP-Ed, an equal opportunity provider and employer. Visit www.CaChampionsForChange.net for healthy t ips.
1. Bring together 5 to 10 people who would like to help people in your community eat more fruits and vegetables and be more active. It would be ideal if you could continue to work with the group from your class. If this is not possible, think about including other friends, family members, neighbors, or coworkers.
2. Decide what changes you want to see in your community. You might want to choose something that could help people eat more fruits and vegetables, and/or something that could get people more active.
Here are a few examples of changes you might want to see in your community to help people eat more fruits and vegetables:
• Request that fast food restaurants in your community serve more fruits and vegetables at reasonable prices.
• Ask your local grocery store to sell quality fruits and vegetables at affordable prices if they are not doing so already.
• Request that a farmers’ market be started in your community.
• Request that a community garden be located in your neighborhood so that you and your neighbors can grow your own fruits and vegetables.
Here are a few examples of changes you might want to see in your community to help people be more physically active:
• Workwithlocallawenforcementandcityofficialstohavea safe walking zone in your community.
• Ask that the Department of Transportation construct bicycle lanes in your community so that you and your neighbors can ride your bicycles safely. You might want to start with safe routes for kids to bike to school.
• Work with your local schools to provide after-hours and weekend access to recreation facilities, gyms, and/or soccerfields.
• Work with the Department of Parks and Recreation to improve walking paths in your community park.
3. Work with your group to create a clear and concise problem statement for your fruit, vegetable, and physical activity issues.
Here are examples of fruit and vegetable problem statements:
• The fast food restaurants in our neighborhood do not serve fruits and vegetables at reasonable prices.
• The grocery stores in our neighborhood do not sell good quality fruits and vegetables at affordable prices.
• There is not a farmers’ market in our neighborhood.• There is not a community garden in our neighborhood.
Here are examples of physical activity problem statements:
• Our neighborhood does not have safe areas where we can walk with our family and friends.
• Our neighborhood does not have bicycle lanes, which makes it unsafe for us to ride our bicycles.
• Our local schools do not provide after-hours and weekend access to recreation facilities, gyms, and/or soccerfields.
• The walking path in our neighborhood park is unsafe and difficulttowalkonbecauseitislitteredwithtrash.
Make sure to develop the problem statement with input from all group members.
4. Work with your group to list the steps that will be taken to solve the fruit, vegetable, and/or physical activity problems in your community. Once the group has listed the steps, make sure all group members agree with the solutions.
Steps to Advocate for Fruits, Vegetables, and Physical Activity in Your Community
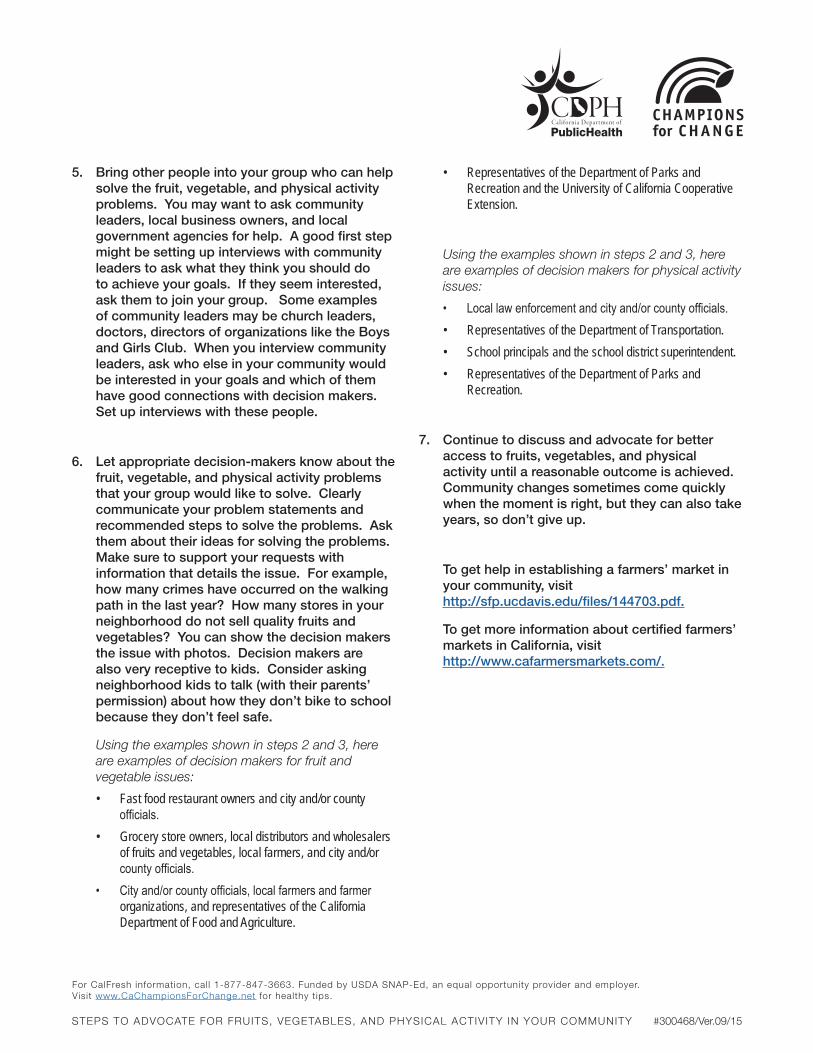
STEPS TO ADVOCATE FOR FRUITS, VEGETABLES, AND PHYSICAL ACTIVITY IN YOUR COMMUNITY
For CalFresh information, cal l 1-877-847-3663. Funded by USDA SNAP-Ed, an equal opportunity provider and employer. Visit www.CaChampionsForChange.net for healthy t ips.
5. Bring other people into your group who can help solve the fruit, vegetable, and physical activity problems. You may want to ask community leaders, local business owners, and local government agencies for help. A good first step might be setting up interviews with community leaders to ask what they think you should do to achieve your goals. If they seem interested, ask them to join your group. Some examples of community leaders may be church leaders, doctors, directors of organizations like the Boys and Girls Club. When you interview community leaders, ask who else in your community would be interested in your goals and which of them have good connections with decision makers. Set up interviews with these people.
6. Let appropriate decision-makers know about the fruit, vegetable, and physical activity problems that your group would like to solve. Clearly communicate your problem statements and recommended steps to solve the problems. Ask them about their ideas for solving the problems. Make sure to support your requests with information that details the issue. For example, how many crimes have occurred on the walking path in the last year? How many stores in your neighborhood do not sell quality fruits and vegetables? You can show the decision makers the issue with photos. Decision makers are also very receptive to kids. Consider asking neighborhood kids to talk (with their parents’ permission) about how they don’t bike to school because they don’t feel safe.
Using the examples shown in steps 2 and 3, here are examples of decision makers for fruit and vegetable issues:
• Fast food restaurant owners and city and/or county officials.
• Grocery store owners, local distributors and wholesalers of fruits and vegetables, local farmers, and city and/or countyofficials.
• Cityand/orcountyofficials,localfarmersandfarmerorganizations, and representatives of the California Department of Food and Agriculture.
• Representatives of the Department of Parks and Recreation and the University of California Cooperative Extension.
Using the examples shown in steps 2 and 3, here are examples of decision makers for physical activity issues:
• Locallawenforcementandcityand/orcountyofficials.• Representatives of the Department of Transportation.• School principals and the school district superintendent.• Representatives of the Department of Parks and
Recreation.
7. Continue to discuss and advocate for better access to fruits, vegetables, and physical activity until a reasonable outcome is achieved. Community changes sometimes come quickly when the moment is right, but they can also take years, so don’t give up.
To get help in establishing a farmers’ market in your community, visit http://sfp.ucdavis.edu/files/144703.pdf.
To get more information about certified farmers’ markets in California, visit http://www.cafarmersmarkets.com/.
#300468/Ver.09/15
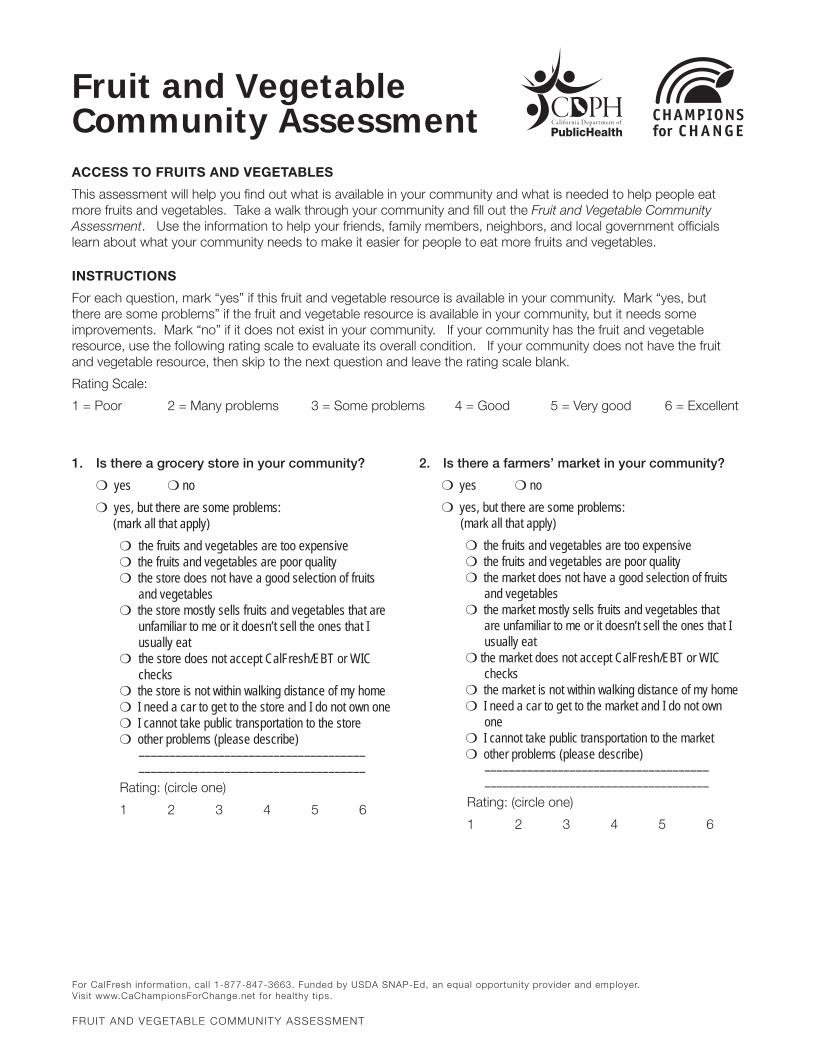
For CalFresh information, cal l 1-877-847-3663. Funded by USDA SNAP-Ed, an equal opportunity provider and employer. Visit www.CaChampionsForChange.net for healthy t ips.
ACCESS TO FRUITS AND VEGETABLES
This assessment will help you find out what is available in your community and what is needed to help people eat more fruits and vegetables. Take a walk through your community and fill out the Fruit and Vegetable Community Assessment. Use the information to help your friends, family members, neighbors, and local government officials learn about what your community needs to make it easier for people to eat more fruits and vegetables.
INSTRUCTIONS
For each question, mark “yes” if this fruit and vegetable resource is available in your community. Mark “yes, but there are some problems” if the fruit and vegetable resource is available in your community, but it needs some improvements. Mark “no” if it does not exist in your community. If your community has the fruit and vegetable resource, use the following rating scale to evaluate its overall condition. If your community does not have the fruit and vegetable resource, then skip to the next question and leave the rating scale blank.
Rating Scale:
1 = Poor 2 = Many problems 3 = Some problems 4 = Good 5 = Very good 6 = Excellent
Fruit and Vegetable Community Assessment
1. Is there a grocery store in your community?
m yes m no m yes, but there are some problems:
(mark all that apply)m the fruits and vegetables are too expensivem the fruits and vegetables are poor qualitym the store does not have a good selection of fruits
and vegetablesm the store mostly sells fruits and vegetables that are
unfamiliar to me or it doesn’t sell the ones that I usually eat
m the store does not accept CalFresh/EBT or WIC checks
m the store is not within walking distance of my homem I need a car to get to the store and I do not own onem I cannot take public transportation to the storem other problems (please describe)
––––––––––––––––––––––––––––––––––––– –––––––––––––––––––––––––––––––––––––
Rating: (circle one)
1 2 3 4 5 6
2. Is there a farmers’ market in your community?
m yes m nom yes, but there are some problems:
(mark all that apply)m the fruits and vegetables are too expensivem the fruits and vegetables are poor qualitym the market does not have a good selection of fruits
and vegetablesm the market mostly sells fruits and vegetables that
are unfamiliar to me or it doesn’t sell the ones that I usually eat
m the market does not accept CalFresh/EBT or WIC checks
m the market is not within walking distance of my homem I need a car to get to the market and I do not own
onem I cannot take public transportation to the marketm other problems (please describe) ––––––––––––––––––––––––––––––––––––– –––––––––––––––––––––––––––––––––––––
Rating: (circle one)
1 2 3 4 5 6
FRUIT AND VEGETABLE COMMUNITY ASSESSMENT
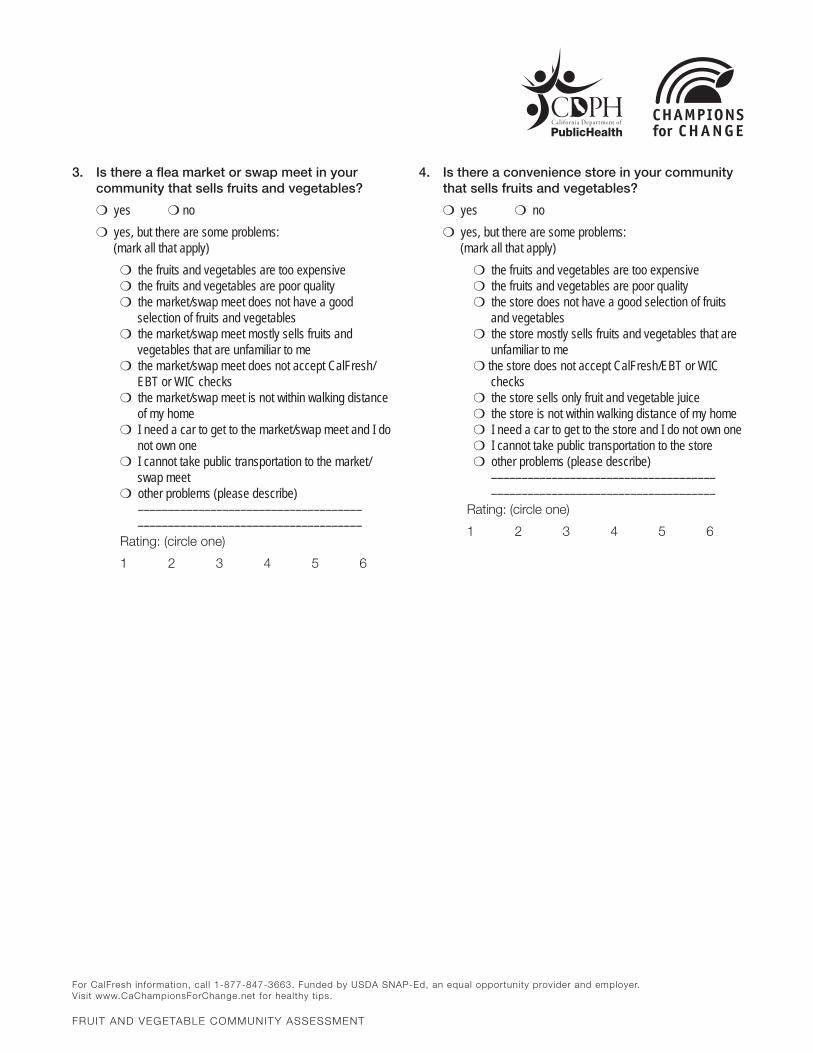
For CalFresh information, cal l 1-877-847-3663. Funded by USDA SNAP-Ed, an equal opportunity provider and employer. Visit www.CaChampionsForChange.net for healthy t ips.
FRUIT AND VEGETABLE COMMUNITY ASSESSMENT
3. Is there a flea market or swap meet in your community that sells fruits and vegetables?
m yes m nom yes, but there are some problems:
(mark all that apply)m the fruits and vegetables are too expensivem the fruits and vegetables are poor qualitym the market/swap meet does not have a good
selection of fruits and vegetablesm the market/swap meet mostly sells fruits and
vegetables that are unfamiliar to mem the market/swap meet does not accept CalFresh/
EBT or WIC checksm the market/swap meet is not within walking distance
of my homem I need a car to get to the market/swap meet and I do
not own onem I cannot take public transportation to the market/
swap meetm other problems (please describe)
––––––––––––––––––––––––––––––––––––– –––––––––––––––––––––––––––––––––––––
Rating: (circle one)
1 2 3 4 5 6
4. Is there a convenience store in your community that sells fruits and vegetables?
m yes m nom yes, but there are some problems:
(mark all that apply)m the fruits and vegetables are too expensivem the fruits and vegetables are poor qualitym the store does not have a good selection of fruits
and vegetablesm the store mostly sells fruits and vegetables that are
unfamiliar to mem the store does not accept CalFresh/EBT or WIC
checksm the store sells only fruit and vegetable juicem the store is not within walking distance of my homem I need a car to get to the store and I do not own onem I cannot take public transportation to the storem other problems (please describe) ––––––––––––––––––––––––––––––––––––– –––––––––––––––––––––––––––––––––––––
Rating: (circle one)
1 2 3 4 5 6
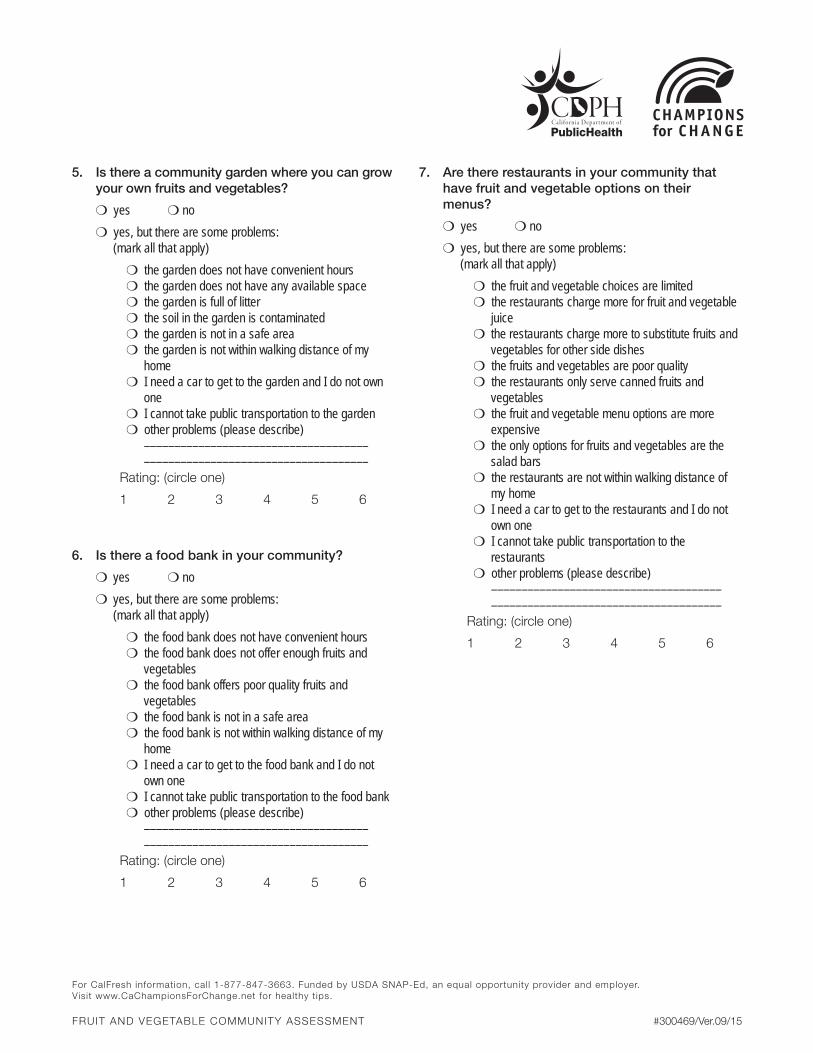
For CalFresh information, cal l 1-877-847-3663. Funded by USDA SNAP-Ed, an equal opportunity provider and employer. Visit www.CaChampionsForChange.net for healthy t ips.
5. Is there a community garden where you can grow your own fruits and vegetables?
m yes m nom yes, but there are some problems:
(mark all that apply)m the garden does not have convenient hoursm the garden does not have any available spacem the garden is full of litterm the soil in the garden is contaminatedm the garden is not in a safe aream the garden is not within walking distance of my
homem I need a car to get to the garden and I do not own
onem I cannot take public transportation to the gardenm other problems (please describe) ––––––––––––––––––––––––––––––––––––– –––––––––––––––––––––––––––––––––––––
Rating: (circle one)
1 2 3 4 5 6
6. Is there a food bank in your community?
m yes m nom yes, but there are some problems:
(mark all that apply)m the food bank does not have convenient hoursm the food bank does not offer enough fruits and
vegetablesm the food bank offers poor quality fruits and
vegetablesm the food bank is not in a safe aream the food bank is not within walking distance of my
homem I need a car to get to the food bank and I do not
own onem I cannot take public transportation to the food bankm other problems (please describe) ––––––––––––––––––––––––––––––––––––– –––––––––––––––––––––––––––––––––––––
Rating: (circle one)
1 2 3 4 5 6
7. Are there restaurants in your community that have fruit and vegetable options on their menus?
m yes m nom yes, but there are some problems:
(mark all that apply)m the fruit and vegetable choices are limitedm the restaurants charge more for fruit and vegetable
juicem the restaurants charge more to substitute fruits and
vegetables for other side dishesm the fruits and vegetables are poor qualitym the restaurants only serve canned fruits and
vegetablesm the fruit and vegetable menu options are more
expensivem the only options for fruits and vegetables are the
salad barsm the restaurants are not within walking distance of
my homem I need a car to get to the restaurants and I do not
own onem I cannot take public transportation to the
restaurantsm other problems (please describe) –––––––––––––––––––––––––––––––––––––– ––––––––––––––––––––––––––––––––––––––
Rating: (circle one)
1 2 3 4 5 6
FRUIT AND VEGETABLE COMMUNITY ASSESSMENT #300469/Ver.09/15
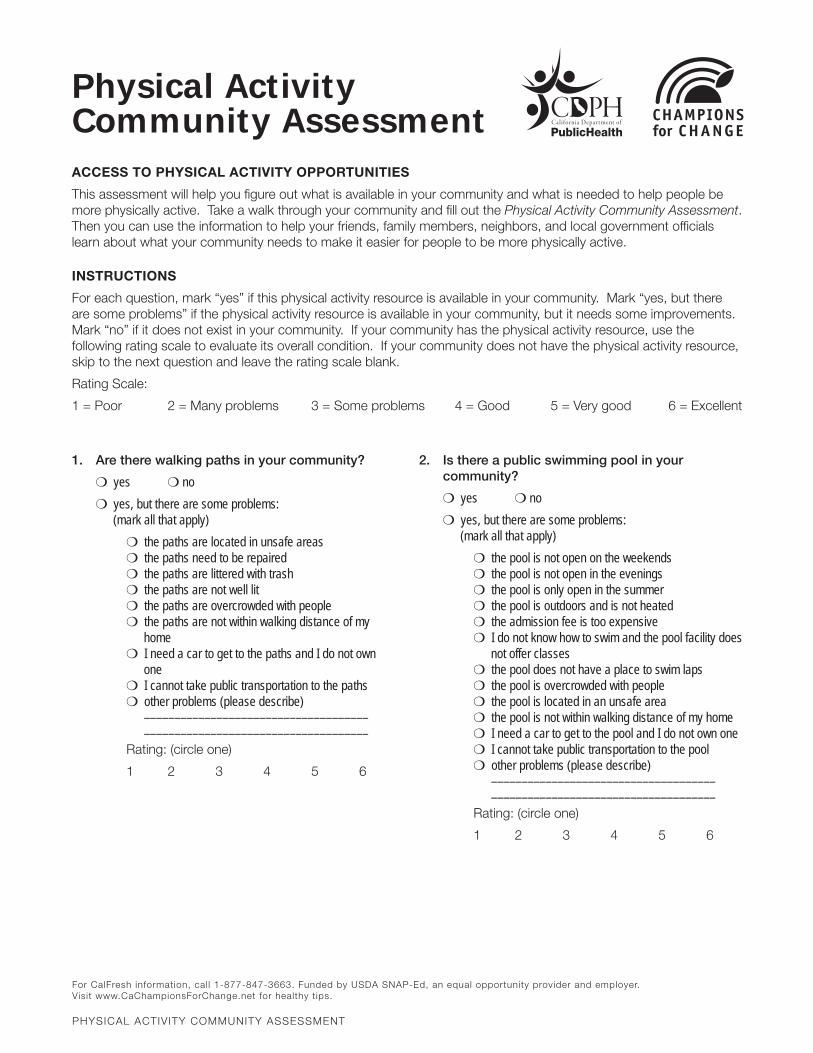
For CalFresh information, cal l 1-877-847-3663. Funded by USDA SNAP-Ed, an equal opportunity provider and employer. Visit www.CaChampionsForChange.net for healthy t ips.
PHYSICAL ACTIVITY COMMUNITY ASSESSMENT
ACCESS TO PHYSICAL ACTIVITY OPPORTUNITIES
This assessment will help you figure out what is available in your community and what is needed to help people be more physically active. Take a walk through your community and fill out the Physical Activity Community Assessment. Then you can use the information to help your friends, family members, neighbors, and local government officials learn about what your community needs to make it easier for people to be more physically active.
INSTRUCTIONS
For each question, mark “yes” if this physical activity resource is available in your community. Mark “yes, but there are some problems” if the physical activity resource is available in your community, but it needs some improvements. Mark “no” if it does not exist in your community. If your community has the physical activity resource, use the following rating scale to evaluate its overall condition. If your community does not have the physical activity resource, skip to the next question and leave the rating scale blank.
Rating Scale:
1 = Poor 2 = Many problems 3 = Some problems 4 = Good 5 = Very good 6 = Excellent
Physical Activity Community Assessment
1. Are there walking paths in your community?
m yes m no m yes, but there are some problems:
(mark all that apply)m the paths are located in unsafe areasm the paths need to be repaired m the paths are littered with trash m the paths are not well litm the paths are overcrowded with peoplem the paths are not within walking distance of my
homem I need a car to get to the paths and I do not own
onem I cannot take public transportation to the pathsm other problems (please describe) ––––––––––––––––––––––––––––––––––––– –––––––––––––––––––––––––––––––––––––
Rating: (circle one)
1 2 3 4 5 6
2. Is there a public swimming pool in your community?
m yes m nom yes, but there are some problems:
(mark all that apply)m the pool is not open on the weekends m the pool is not open in the evenings m the pool is only open in the summer m the pool is outdoors and is not heated m the admission fee is too expensivem I do not know how to swim and the pool facility does
not offer classesm the pool does not have a place to swim lapsm the pool is overcrowded with people m the pool is located in an unsafe area m the pool is not within walking distance of my homem I need a car to get to the pool and I do not own onem I cannot take public transportation to the poolm other problems (please describe) ––––––––––––––––––––––––––––––––––––– –––––––––––––––––––––––––––––––––––––
Rating: (circle one)
1 2 3 4 5 6
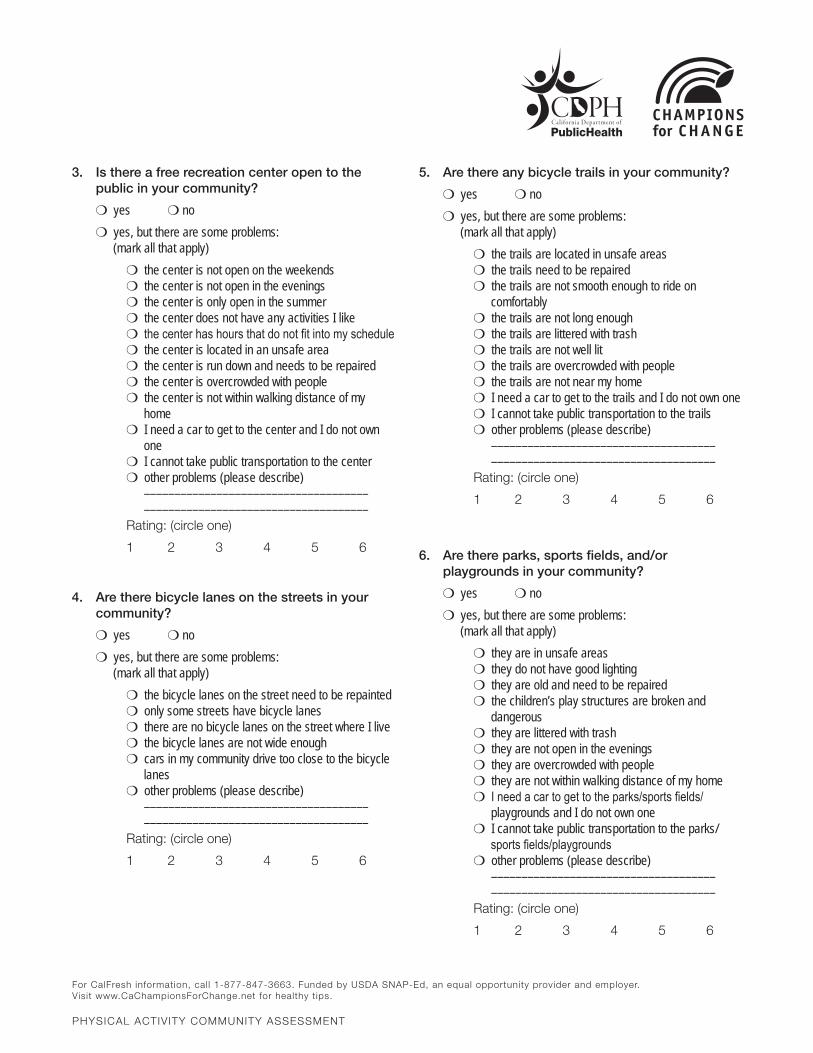
For CalFresh information, cal l 1-877-847-3663. Funded by USDA SNAP-Ed, an equal opportunity provider and employer. Visit www.CaChampionsForChange.net for healthy t ips.
PHYSICAL ACTIVITY COMMUNITY ASSESSMENT
3. Is there a free recreation center open to the public in your community?
m yes m nom yes, but there are some problems:
(mark all that apply)m the center is not open on the weekends m the center is not open in the evenings m the center is only open in the summer m the center does not have any activities I likem the center has hours that do not fit into my schedulem the center is located in an unsafe aream the center is run down and needs to be repairedm the center is overcrowded with peoplem the center is not within walking distance of my
homem I need a car to get to the center and I do not own
onem I cannot take public transportation to the centerm other problems (please describe) ––––––––––––––––––––––––––––––––––––– –––––––––––––––––––––––––––––––––––––
Rating: (circle one)
1 2 3 4 5 6
4. Are there bicycle lanes on the streets in your community?
m yes m nom yes, but there are some problems:
(mark all that apply)m the bicycle lanes on the street need to be repaintedm only some streets have bicycle lanesm there are no bicycle lanes on the street where I livem the bicycle lanes are not wide enoughm cars in my community drive too close to the bicycle
lanesm other problems (please describe) ––––––––––––––––––––––––––––––––––––– –––––––––––––––––––––––––––––––––––––
Rating: (circle one)
1 2 3 4 5 6
5. Are there any bicycle trails in your community?
m yes m nom yes, but there are some problems:
(mark all that apply)m the trails are located in unsafe areasm the trails need to be repairedm the trails are not smooth enough to ride on
comfortablym the trails are not long enoughm the trails are littered with trashm the trails are not well litm the trails are overcrowded with peoplem the trails are not near my homem I need a car to get to the trails and I do not own onem I cannot take public transportation to the trailsm other problems (please describe) ––––––––––––––––––––––––––––––––––––– –––––––––––––––––––––––––––––––––––––
Rating: (circle one)
1 2 3 4 5 6
6. Are there parks, sports fields, and/or playgrounds in your community?
m yes m nom yes, but there are some problems:
(mark all that apply)m they are in unsafe areasm they do not have good lightingm they are old and need to be repairedm the children’s play structures are broken and
dangerousm they are littered with trashm they are not open in the evenings m they are overcrowded with people m they are not within walking distance of my homem I need a car to get to the parks/sports fields/
playgrounds and I do not own onem I cannot take public transportation to the parks/
sports fields/playgroundsm other problems (please describe) ––––––––––––––––––––––––––––––––––––– –––––––––––––––––––––––––––––––––––––
Rating: (circle one)
1 2 3 4 5 6
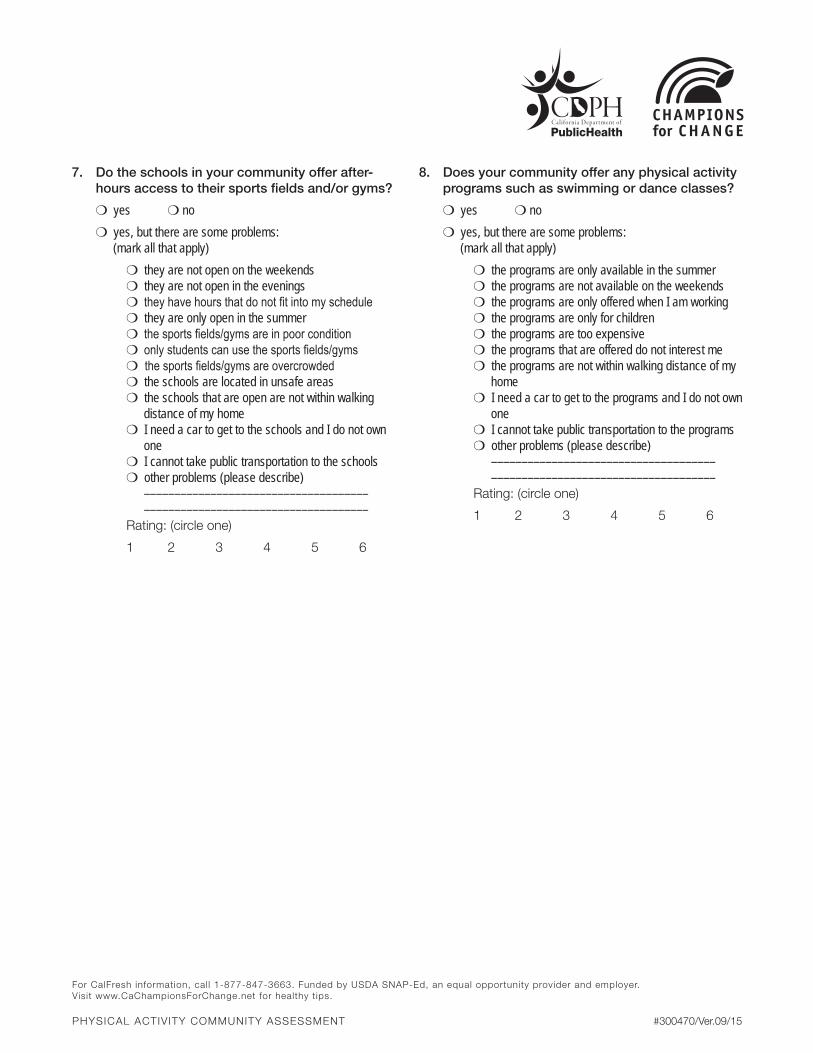
For CalFresh information, cal l 1-877-847-3663. Funded by USDA SNAP-Ed, an equal opportunity provider and employer. Visit www.CaChampionsForChange.net for healthy t ips.
PHYSICAL ACTIVITY COMMUNITY ASSESSMENT
7. Do the schools in your community offer after-hours access to their sports fields and/or gyms?
m yes m nom yes, but there are some problems:
(mark all that apply)m they are not open on the weekends m they are not open in the eveningsm they have hours that do not fit into my schedulem they are only open in the summerm the sports fields/gyms are in poor conditionm only students can use the sports fields/gymsm the sports fields/gyms are overcrowded m the schools are located in unsafe areas m the schools that are open are not within walking
distance of my homem I need a car to get to the schools and I do not own
onem I cannot take public transportation to the schoolsm other problems (please describe) ––––––––––––––––––––––––––––––––––––– –––––––––––––––––––––––––––––––––––––
Rating: (circle one)
1 2 3 4 5 6
8. Does your community offer any physical activity programs such as swimming or dance classes?
m yes m nom yes, but there are some problems:
(mark all that apply)m the programs are only available in the summerm the programs are not available on the weekendsm the programs are only offered when I am workingm the programs are only for childrenm the programs are too expensivem the programs that are offered do not interest mem the programs are not within walking distance of my
homem I need a car to get to the programs and I do not own
onem I cannot take public transportation to the programsm other problems (please describe) ––––––––––––––––––––––––––––––––––––– –––––––––––––––––––––––––––––––––––––
Rating: (circle one)
1 2 3 4 5 6
#300470/Ver.09/15
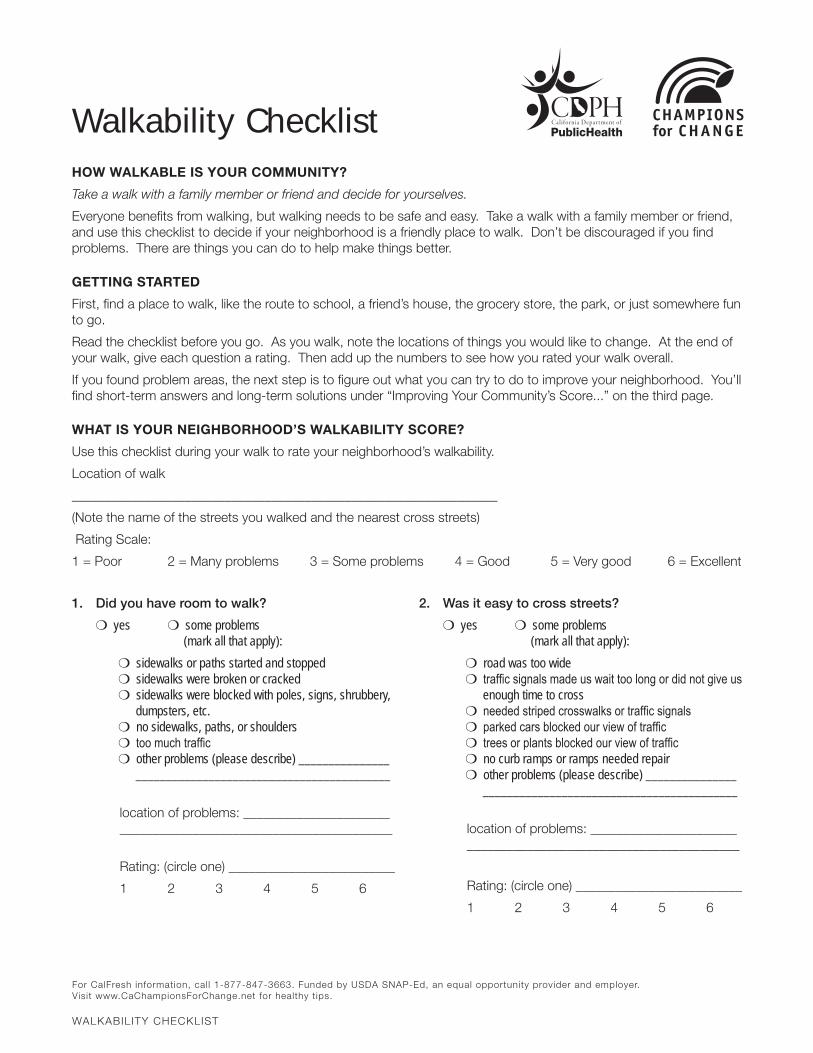
For CalFresh information, cal l 1-877-847-3663. Funded by USDA SNAP-Ed, an equal opportunity provider and employer. Visit www.CaChampionsForChange.net for healthy t ips.
WALKABILITY CHECKLIST
HOW WALKABLE IS YOUR COMMUNITY?
Take a walk with a family member or friend and decide for yourselves.
Everyone benefits from walking, but walking needs to be safe and easy. Take a walk with a family member or friend, and use this checklist to decide if your neighborhood is a friendly place to walk. Don’t be discouraged if you find problems. There are things you can do to help make things better.
GETTING STARTED
First, find a place to walk, like the route to school, a friend’s house, the grocery store, the park, or just somewhere fun to go.
Read the checklist before you go. As you walk, note the locations of things you would like to change. At the end of your walk, give each question a rating. Then add up the numbers to see how you rated your walk overall.
If you found problem areas, the next step is to figure out what you can try to do to improve your neighborhood. You’ll find short-term answers and long-term solutions under “Improving Your Community’s Score...” on the third page.
WHAT IS YOUR NEIGHBORHOOD’S WALKABILITY SCORE?
Use this checklist during your walk to rate your neighborhood’s walkability.
Location of walk
________________________________________________________________
(Note the name of the streets you walked and the nearest cross streets)
Rating Scale:
1 = Poor 2 = Many problems 3 = Some problems 4 = Good 5 = Very good 6 = Excellent
Walkability Checklist
1. Did you have room to walk?
m yes m some problems (mark all that apply):m sidewalks or paths started and stoppedm sidewalks were broken or crackedm sidewalks were blocked with poles, signs, shrubbery,
dumpsters, etc.m no sidewalks, paths, or shouldersm too much trafficm other problems (please describe) _______________
__________________________________________
location of problems: ______________________ _________________________________________
Rating: (circle one) _________________________
1 2 3 4 5 6
2. Was it easy to cross streets?
m yes m some problems (mark all that apply):m road was too widem traffic signals made us wait too long or did not give us
enough time to crossm needed striped crosswalks or traffic signalsm parked cars blocked our view of traffic m trees or plants blocked our view of trafficm no curb ramps or ramps needed repairm other problems (please describe) _______________
__________________________________________
location of problems: ______________________ _________________________________________
Rating: (circle one) _________________________
1 2 3 4 5 6
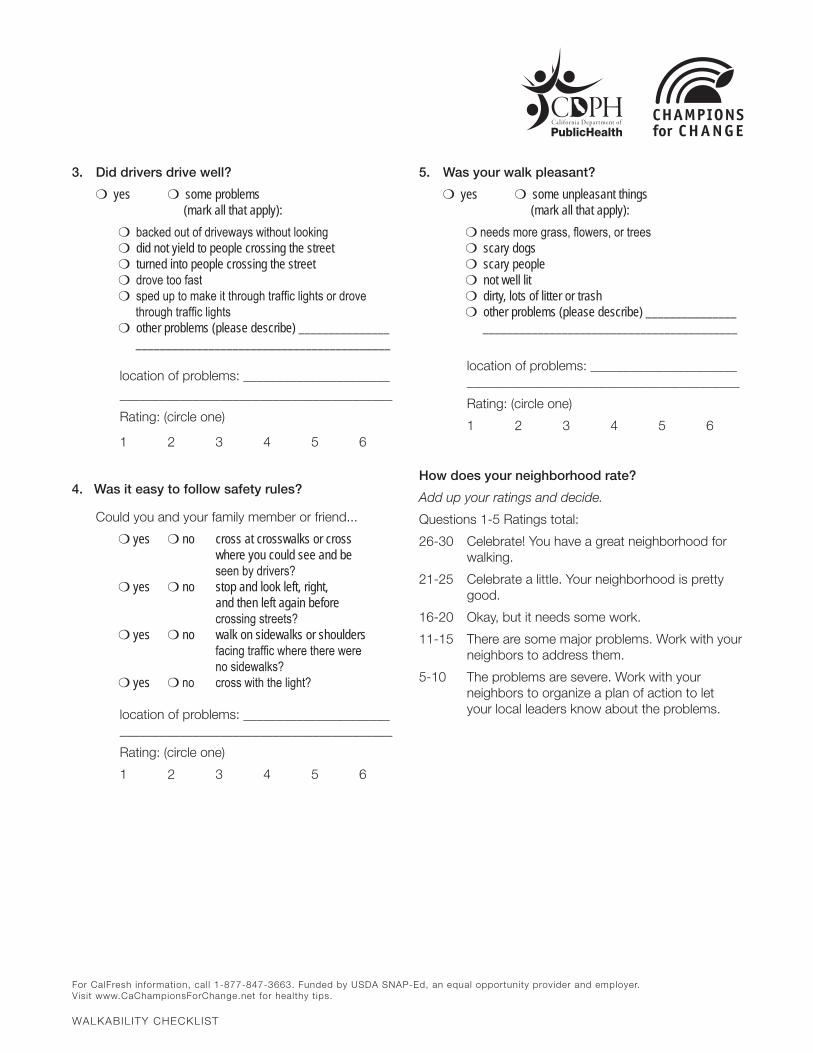
For CalFresh information, cal l 1-877-847-3663. Funded by USDA SNAP-Ed, an equal opportunity provider and employer. Visit www.CaChampionsForChange.net for healthy t ips.
WALKABILITY CHECKLIST
3. Did drivers drive well?
m yes m some problems (mark all that apply):m backed out of driveways without lookingm did not yield to people crossing the streetm turned into people crossing the streetm drove too fastm sped up to make it through traffic lights or drove
through traffic lightsm other problems (please describe) _______________
__________________________________________
location of problems: ______________________ _________________________________________
Rating: (circle one)
1 2 3 4 5 6
4. Was it easy to follow safety rules?
Could you and your family member or friend...
m yes m no cross at crosswalks or cross where you could see and be seen by drivers?m yes m no stop and look left, right, and then left again before crossing streets?m yes m no walk on sidewalks or shoulders facing traffic where there were no sidewalks?m yes m no cross with the light?
location of problems: ______________________ _________________________________________
Rating: (circle one)
1 2 3 4 5 6
5. Was your walk pleasant?
m yes m some unpleasant things (mark all that apply):m needs more grass, flowers, or treesm scary dogsm scary peoplem not well litm dirty, lots of litter or trashm other problems (please describe) _______________
__________________________________________
location of problems: ______________________ _________________________________________
Rating: (circle one)
1 2 3 4 5 6
How does your neighborhood rate?
Add up your ratings and decide.
Questions 1-5 Ratings total:
26-30 Celebrate! You have a great neighborhood for walking.
21-25 Celebrate a little. Your neighborhood is pretty good.
16-20 Okay, but it needs some work.
11-15 There are some major problems. Work with your neighbors to address them.
5-10 The problems are severe. Work with your neighbors to organize a plan of action to let your local leaders know about the problems.
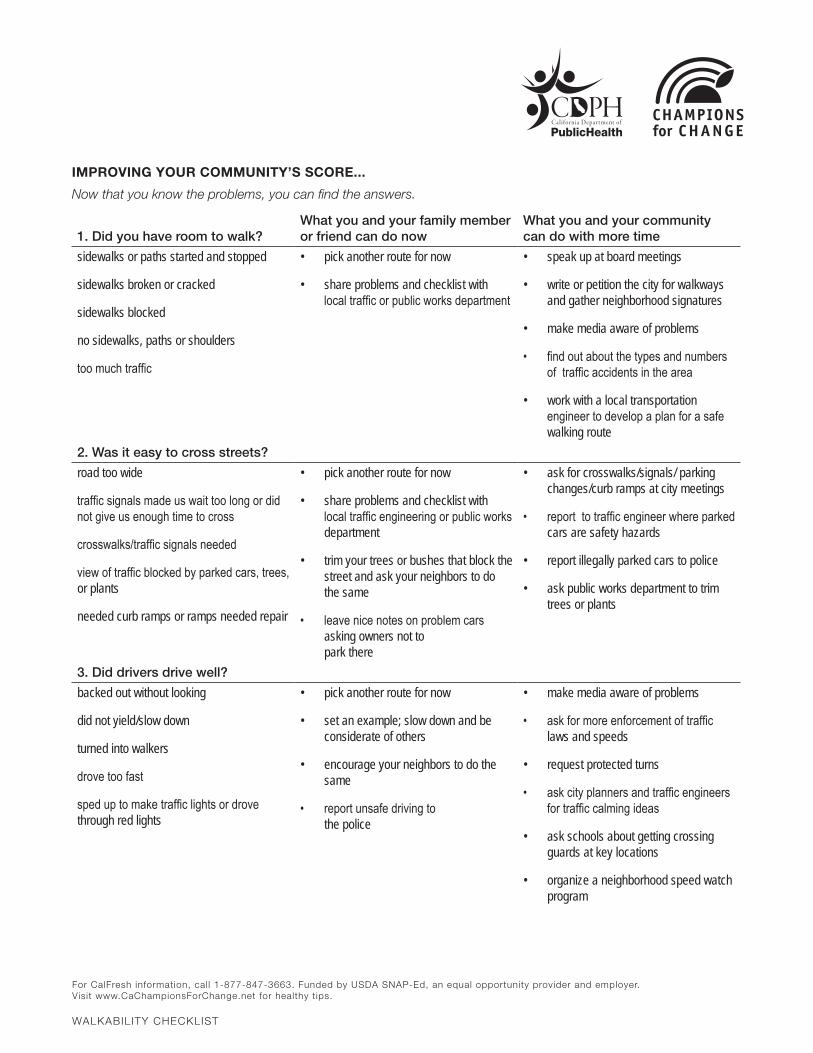
For CalFresh information, cal l 1-877-847-3663. Funded by USDA SNAP-Ed, an equal opportunity provider and employer. Visit www.CaChampionsForChange.net for healthy t ips.
WALKABILITY CHECKLIST
IMPROVING YOUR COMMUNITY’S SCORE...
Now that you know the problems, you can find the answers.
1. Did you have room to walk?What you and your family member or friend can do now
What you and your community can do with more time
sidewalks or paths started and stopped
sidewalks broken or cracked
sidewalks blocked
no sidewalks, paths or shoulders
too much traffic
• pick another route for now
• share problems and checklist with local traffic or public works department
• speak up at board meetings
• write or petition the city for walkways and gather neighborhood signatures
• make media aware of problems
• find out about the types and numbers of traffic accidents in the area
• work with a local transportation engineer to develop a plan for a safe walking route
2. Was it easy to cross streets?
road too wide
traffic signals made us wait too long or did not give us enough time to cross
crosswalks/traffic signals needed
view of traffic blocked by parked cars, trees, or plants
needed curb ramps or ramps needed repair
• pick another route for now
• share problems and checklist with local traffic engineering or public works department
• trim your trees or bushes that block the street and ask your neighbors to do the same
• leave nice notes on problem cars asking owners not to park there
• ask for crosswalks/signals/ parking changes/curb ramps at city meetings
• report to traffic engineer where parked cars are safety hazards
• report illegally parked cars to police
• ask public works department to trim trees or plants
3. Did drivers drive well?
backed out without looking
did not yield/slow down
turned into walkers
drove too fast
sped up to make traffic lights or drove through red lights
• pick another route for now
• set an example; slow down and be considerate of others
• encourage your neighbors to do the same
• report unsafe driving to the police
• make media aware of problems
• ask for more enforcement of traffic laws and speeds
• request protected turns
• ask city planners and traffic engineers for traffic calming ideas
• ask schools about getting crossing guards at key locations
• organize a neighborhood speed watch program
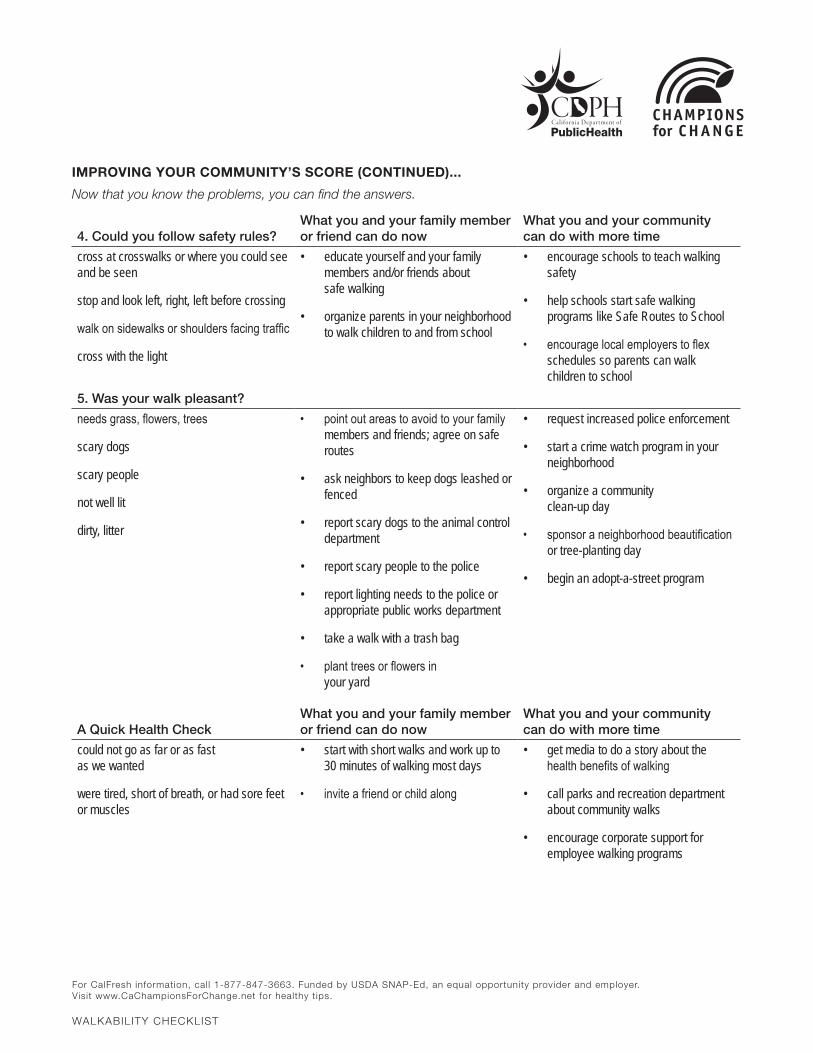
For CalFresh information, cal l 1-877-847-3663. Funded by USDA SNAP-Ed, an equal opportunity provider and employer. Visit www.CaChampionsForChange.net for healthy t ips.
WALKABILITY CHECKLIST
IMPROVING YOUR COMMUNITY’S SCORE (CONTINUED)...
Now that you know the problems, you can find the answers.
4. Could you follow safety rules?What you and your family member or friend can do now
What you and your community can do with more time
cross at crosswalks or where you could see and be seen
stop and look left, right, left before crossing
walk on sidewalks or shoulders facing traffic
cross with the light
• educate yourself and your family members and/or friends about safe walking
• organize parents in your neighborhood to walk children to and from school
• encourage schools to teach walking safety
• help schools start safe walking programs like Safe Routes to School
• encourage local employers to flex schedules so parents can walk children to school
5. Was your walk pleasant?
needs grass, flowers, trees
scary dogs
scary people
not well lit
dirty, litter
• point out areas to avoid to your family members and friends; agree on safe routes
• ask neighbors to keep dogs leashed or fenced
• report scary dogs to the animal control department
• report scary people to the police
• report lighting needs to the police or appropriate public works department
• take a walk with a trash bag
• plant trees or flowers in your yard
• request increased police enforcement
• start a crime watch program in your neighborhood
• organize a community clean-up day
• sponsor a neighborhood beautification or tree-planting day
• begin an adopt-a-street program
A Quick Health Check
What you and your family member or friend can do now
What you and your community can do with more time
could not go as far or as fast as we wanted
were tired, short of breath, or had sore feet or muscles
• start with short walks and work up to 30 minutes of walking most days
• invite a friend or child along
• get media to do a story about the health benefits of walking
• call parks and recreation department about community walks
• encourage corporate support for employee walking programs
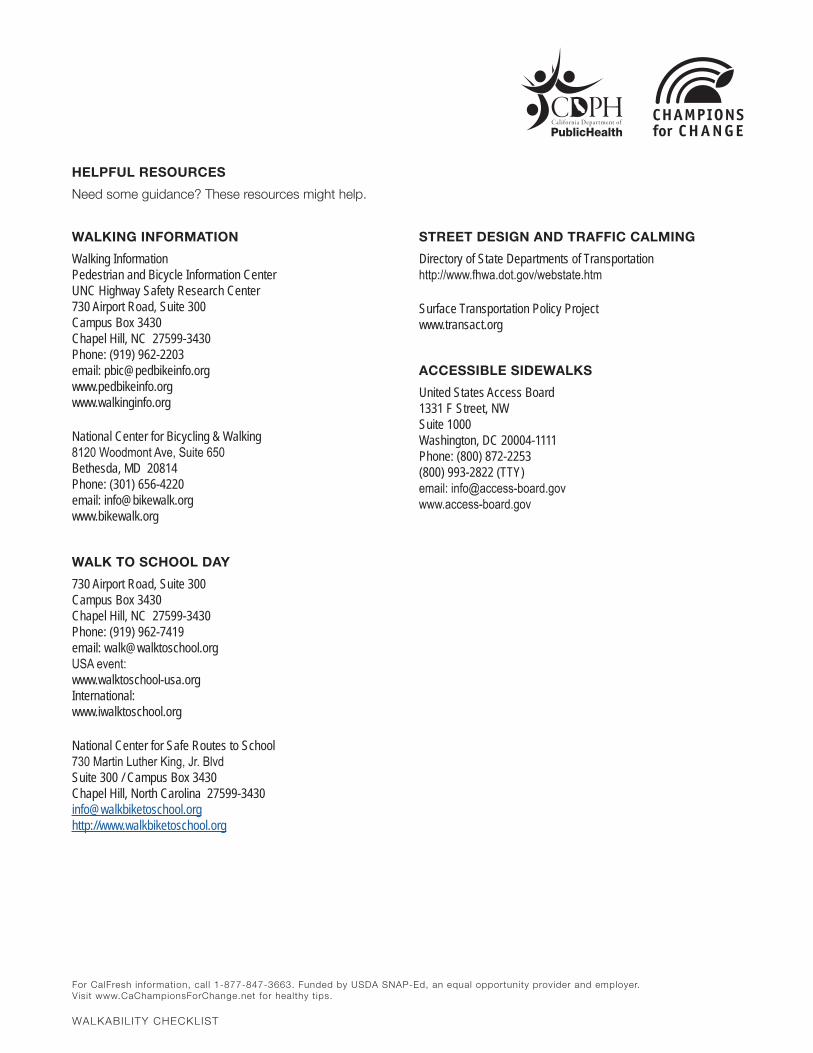
For CalFresh information, cal l 1-877-847-3663. Funded by USDA SNAP-Ed, an equal opportunity provider and employer. Visit www.CaChampionsForChange.net for healthy t ips.
WALKABILITY CHECKLIST
HELPFUL RESOURCES
Need some guidance? These resources might help.
WALKING INFORMATION
Walking Information Pedestrian and Bicycle Information Center UNC Highway Safety Research Center 730 Airport Road, Suite 300 Campus Box 3430 Chapel Hill, NC 27599-3430 Phone: (919) 962-2203 email: [email protected] www.pedbikeinfo.org www.walkinginfo.org
National Center for Bicycling & Walking 8120 Woodmont Ave, Suite 650 Bethesda, MD 20814 Phone: (301) 656-4220 email: [email protected] www.bikewalk.org
WALK TO SCHOOL DAY
730 Airport Road, Suite 300 Campus Box 3430 Chapel Hill, NC 27599-3430 Phone: (919) 962-7419 email: [email protected] USA event: www.walktoschool-usa.org International: www.iwalktoschool.org
National Center for Safe Routes to School 730 Martin Luther King, Jr. Blvd Suite 300 / Campus Box 3430 Chapel Hill, North Carolina 27599-3430 [email protected] http://www.walkbiketoschool.org
STREET DESIGN AND TRAFFIC CALMING
Directory of State Departments of Transportation http://www.fhwa.dot.gov/webstate.htm
Surface Transportation Policy Project www.transact.org
ACCESSIBLE SIDEWALKS
United States Access Board 1331 F Street, NW Suite 1000 Washington, DC 20004-1111 Phone: (800) 872-2253 (800) 993-2822 (TTY) email: [email protected] www.access-board.gov
For CalFresh information, cal l 1-877-847-3663. Funded by USDA SNAP-Ed, an equal opportunity provider and employer. Visit www.CaChampionsForChange.net for healthy t ips.
WALKABILITY CHECKLIST
PEDESTRIAN SAFETY
National Highway Traffic Safety Administration Traffic Safety Programs 400 Seventh Street, SW Washington, DC 20590 Phone: 1-888-327-9153 TTY: 1-800-424-9153 www.nhtsa.dot.gov
Pedestrian Safety www.nhtsa.dot.gov/people/injury/pedbimot/ped
Safe Kids Worldwide 1301 Pennsylvania Ave. NW Suite 1000 Washington, DC 20004-1707 Phone: (202) 662-0600 Fax: (202) 393-2072 www.safekids.org
WALKING AND HEALTH
Division of Nutrition and Physical Activity, National Center for Chronic Disease Prevention and Health Promotion, Centers for Disease Control and Prevention 4770 Buford Highway, NE, MS/K-24 Atlanta, GA 30341-3717 Phone: 1-800-232-4636 (800-CDC-INFO) email: [email protected] www.cdc.gov/nccdphp/dnpa/index.htm En español: 1-888-246-2857 www.cdc.gov/spanish/
Ready, Set, It’s Everywhere You Go! www.cdc.gov/communication/campaigns/ready.htm
California Department of Public Health Safe and Active Communities (SAC) Branch PO Box 997377, MS 7214 Sacramento, CA 95899-7377 (916) 552-9800 www.cdph.ca.gov/programs/sacb/Pages/default.aspx
WALKING COALITIONS
America Walks Old City Hall 45 School Street, 2nd Floor Boston, MA 02108 Phone: 617-367-1170 email: [email protected] www.americawalks.org
Partnership for a Walkable America National Safety Council 1121 Spring Lake Drive Itasca, IL 60143-3201 Phone: (603) 285-1121 www.walkableamerica.org
Source: Adapted from the Pedestrian and Bicycle Information Center, Walkability Checklist. Available at: www.pedbikeinfo.org/community/walkability.cfm Accessed September 23, 2015.
HELPFUL RESOURCES (CONTINUED)
Need some guidance? These resources might help.
#300471/Ver.09/15
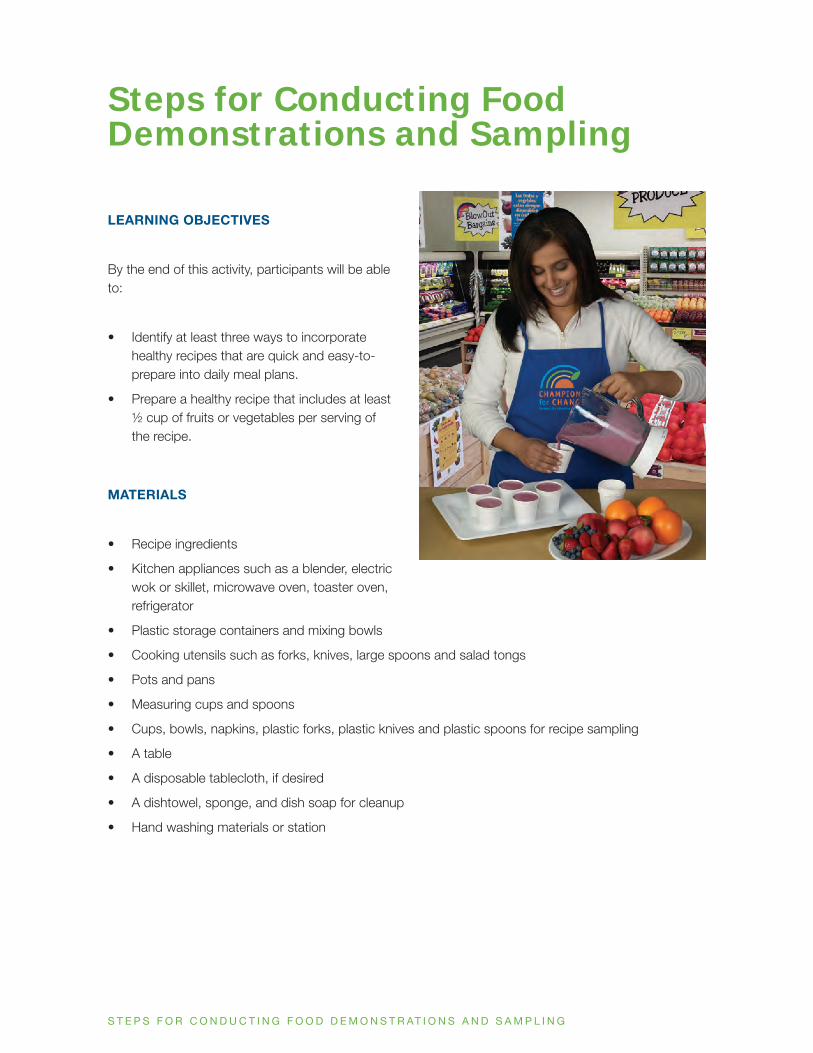
S T E P S F O R C O N D U C T I N G F O O D D E M O N S T R AT I O N S A N D S A M P L I N G
Steps for Conducting Food Demonstrations and Sampling
LEARNING OBJECTIVES
By the end of this activity, participants will be able to:
• Identify at least three ways to incorporate healthy recipes that are quick and easy-to-prepare into daily meal plans.
• Prepare a healthy recipe that includes at least ½ cup of fruits or vegetables per serving of the recipe.
MATERIALS
• Recipe ingredients
• Kitchen appliances such as a blender, electric wok or skillet, microwave oven, toaster oven, refrigerator
• Plastic storage containers and mixing bowls
• Cooking utensils such as forks, knives, large spoons and salad tongs
• Pots and pans
• Measuring cups and spoons
• Cups, bowls, napkins, plastic forks, plastic knives and plastic spoons for recipe sampling
• A table
• A disposable tablecloth, if desired
• A dishtowel, sponge, and dish soap for cleanup
• Hand washing materials or station
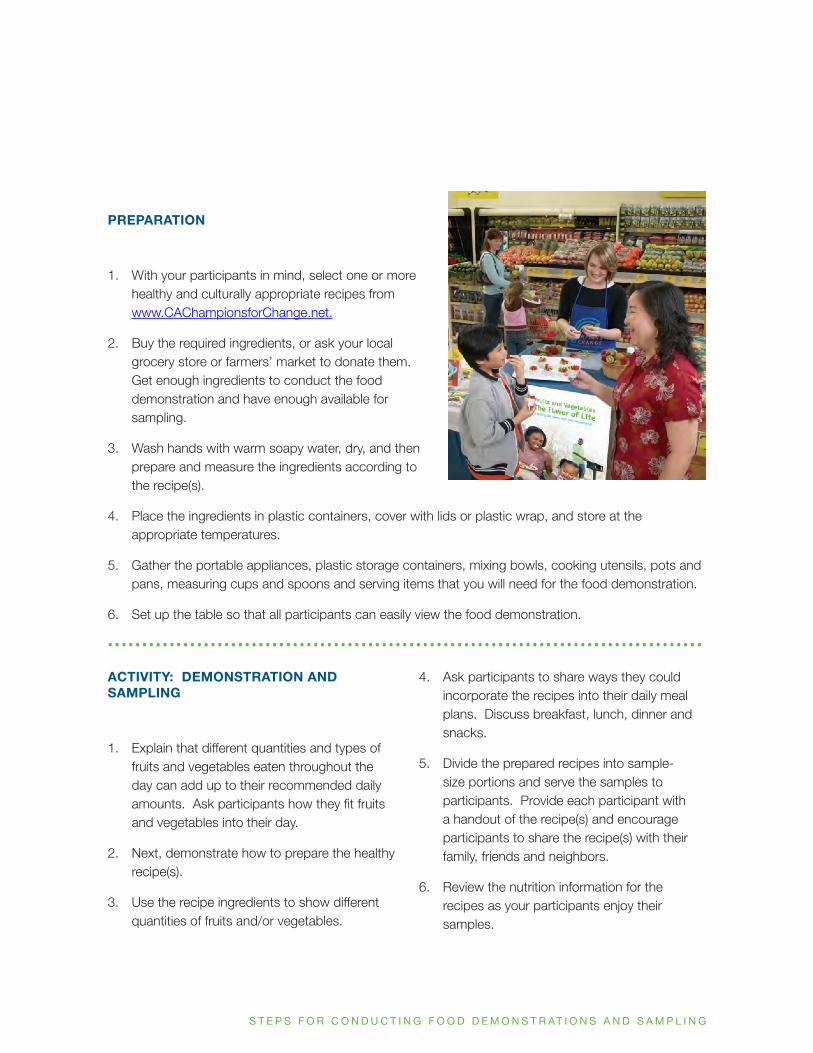
S T E P S F O R C O N D U C T I N G F O O D D E M O N S T R AT I O N S A N D S A M P L I N G
PREPARATION
1. With your participants in mind, select one or more healthy and culturally appropriate recipes from www.CAChampionsforChange.net.
2. Buy the required ingredients, or ask your local grocery store or farmers’ market to donate them. Get enough ingredients to conduct the food demonstration and have enough available for sampling.
3. Wash hands with warm soapy water, dry, and then prepare and measure the ingredients according to the recipe(s).
4. Place the ingredients in plastic containers, cover with lids or plastic wrap, and store at the appropriate temperatures.
5. Gather the portable appliances, plastic storage containers, mixing bowls, cooking utensils, pots and pans, measuring cups and spoons and serving items that you will need for the food demonstration.
6. Set up the table so that all participants can easily view the food demonstration.
• • • • • • • • • • • • • • • • • • • • • • • • • • • • • • • • • • • • • • • • • • • • • • • • • • • • • • • • • • • • • • • • • • • • • • • • • • • • • • • • • • • • • • •
ACTIVITY: DEMONSTRATION AND SAMPLING
1. Explain that different quantities and types of fruits and vegetables eaten throughout the day can add up to their recommended daily amounts. Ask participants how they fit fruits and vegetables into their day.
2. Next, demonstrate how to prepare the healthy recipe(s).
3. Use the recipe ingredients to show different quantities of fruits and/or vegetables.
4. Ask participants to share ways they could incorporate the recipes into their daily meal plans. Discuss breakfast, lunch, dinner and snacks.
5. Divide the prepared recipes into sample-size portions and serve the samples to participants. Provide each participant with a handout of the recipe(s) and encourage participants to share the recipe(s) with their family, friends and neighbors.
6. Review the nutrition information for the recipes as your participants enjoy their samples.
S T E P S F O R C O N D U C T I N G F O O D D E M O N S T R AT I O N S A N D S A M P L I N G
7. Ask participants to share what they enjoyed about the recipe(s).
8. Conclude the lesson by reinforcing the benefits of eating fruits and vegetables and the recommendation to fill half of our plate with fruits and vegetables.
Tips for instructors• Laminate the recipes to make them water resistant.
• Let a participant help you demonstrate a recipe. (Remember hand washing!)
• Remember to handle food safely when conducting food demonstrations. Emphasize proper hand washing. To learn more about food safety, visit www.foodsafety.gov.
• Organize a nutritious and delicious potluck or picnic by asking each participant to prepare a healthy recipe for everyone to share. Ask participants to bring a favorite family recipe, and show them how to include at least ½ cup of fruits and/or vegetables in each serving of the recipe.
#300472/Ver.09/15