Embed Size (px)
Citation preview
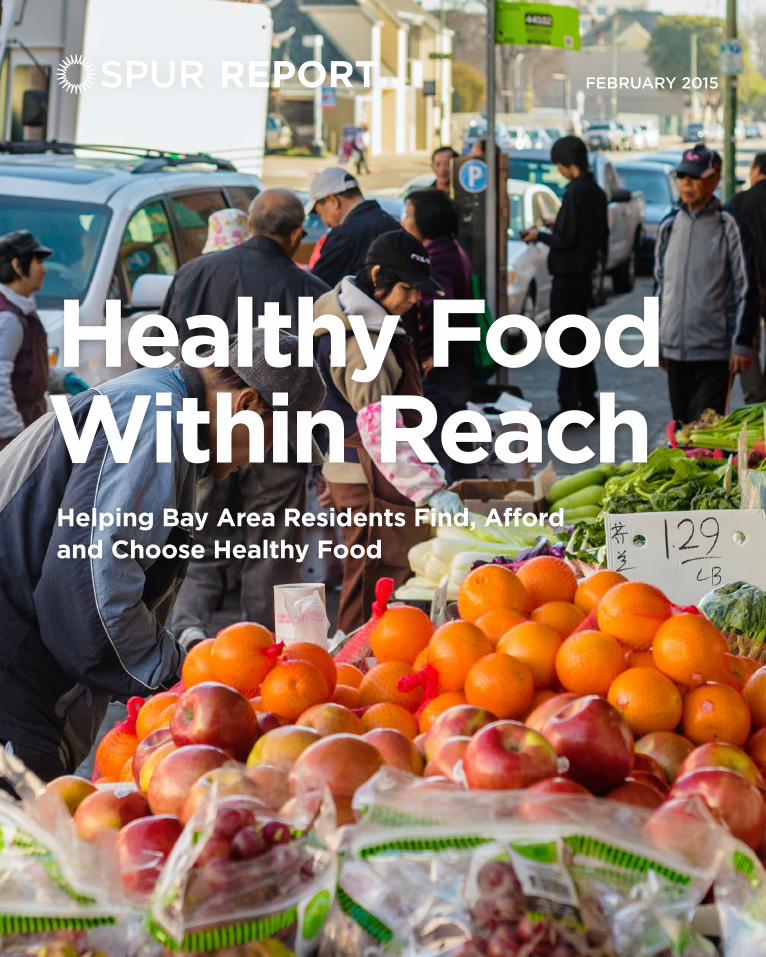
REPORT FEBRUARY 2015
Healthy Food Within ReachHelping Bay Area Residents Find, Afford and Choose Healthy Food
Contents
4 Executive Summary
6 How Can Bay Area Cities Best Support Access to Healthy Food?
8 Why Food Access Matters
18 Recommendations
34 Plan of Action for Local Governments
36 APPENDIX 1 Self-Sufficiency Standard and Poverty Measures and Levels
37 APPENDIX 2 Minimum Wage Earnings Compared to California Poverty
Measure Thresholds
38 APPENDIX 3 Methodology for Food Retail Environment Maps
SPUR Lead Staff and Task Force Co-ChairEli Zigas
Research AssistantSean Becker
SPUR Food Access Task ForceHeather Wooten (Co-Chair), ChangeLab Solutions
Lisa Craypo, Ad Lucem ConsultingLisa Feldstein, UC BerkeleyJennifer Gross, formerly with the San Mateo County Health Department
Erin Healy, The Health TrustTeri Olle, SF-Marin Food BankRachel Poplack, The Health TrustShakirah Simley, Bi-Rite Family of BusinessesDeborah Quick, Morgan, Lewis & Bockius
Mapping and GIS AnalysisLauren Heumann, Darshini Shah
Resources and reviewersSusana Algert, Carle Brinkman, Bonnie Broderick, Arden Bucklin-Sporer, Carlo Carino, Nicole Coxe, Brian Darrow, Jaime Flores, Becky Gershon, Allison Hagey, Stefan Harvey, Susana Hennessey-Lavery, Andy Hull, Doug Johnson, Paula Jones, Sarah Nelson, Shu Wen Ng, Leo O’Farrell, Bogdan Rau, Zetta Reicker, Dottie Rosenbaum, Bhavdeep Sachdev, Hilary Seligman, Darshini Shah, Diana Sokolove, Laura Tam, Egon Terplan, Iris Tiong, Kris Vantornhout, Tony Vi, Chris Wimer, Diane Woloshin, Sabrina Wu
SPUR’s Food Systems and Urban Agriculture Program is generously supported by the Columbia Foundation, Clarence E. Heller Charitable Foundation, TomKat Charitable Trust, 11th Hour Project, New Belgium Family Foundation, Seed Fund, John and Marcia Goldman Foundation, Clif Bar Family Foundation and Veritable Vegetable.
Edited by: Karen Steen
Cover photo of E&F Market, Oakland, by Sergio Ruiz
SPUR
654 Mission StreetSan Francisco, CA 94105tel. [email protected]
76 South First StreetSan Jose, CA 95113tel. [email protected]
c/o Impact Hub Oakland2323 BroadwayOakland CA, 94612tel. [email protected]
Healthy Food Within ReachHelping Bay Area Residents Find, Afford and Choose Healthy Food
The SPUR Board of Directors reviewed, debated and adopted this report as official policy on September 17, 2014.
Executive Summary
One in 10 adults in the Bay Area struggle to consistently find three meals a day. More than half of all adults are overweight or obese. And residents in many of the region’s communities live in neighborhoods where fast food restaurants and convenience stores abound, while grocery stores are scarce or don’t exist at all. To meet our basic needs, improve public health and enhance our quality of life, Bay Area residents must have access to healthy food.
There are four main barriers to food access that prevent someone from having a healthy diet:
• Physical access: Can you find healthy food?
• Economic access: Can you afford healthy food?
• Educational access: Do you know how to make healthy choices and how to cook?
• Cultural access: Do you want the healthy food that is available and affordable?
City and county agencies have a variety of tools they can use to address these barriers. SPUR’s Food Access Task Force analyzed different policy tools as they have been used both inside and outside the Bay Area to help evaluate the effectiveness of various strategies. We found that a one-size-fits-all approach rarely works. A retail strategy for a dense urban neighborhood is unlikely to work as well in a suburban neighborhood. A social service outreach program based on one language or culture may not translate well to a different community. To make progress on food access, policymakers must examine the barriers at a neighborhood scale. We also found that some strategies should be evaluated in more detail to determine their cost-effectiveness and their long-term impacts on public health. This kind of research would be especially helpful for evaluating food retail initiatives and would provide policymakers with critical information for how to focus their efforts.
City and county agencies should not try to address food access by themselves, nor do they necessarily need to lead all the initiatives described in this report. While we have targeted our recommendations to city and county governments, all of our recommended actions should involve other community stakeholders. Local merchant associations, food banks, nonprofit educators, food policy councils and other similar groups are important partners — and in some cases may be in the best position to lead an effort in partnership with local government agencies. SPUR recommends 12 actions that local governments can take to identify and address these issues in Bay Area communities.
STRATEGY 1: Understand the local context when developing food access strategies
Recommendation 1: Conduct an assessment or use existing data to develop a targeted set of food access programs and initiatives.
STRATEGY 2: Increase the purchasing power of low-income residents to improve their economic access to healthy food
Recommendation 2: Maximize enrollment in federally funded food assistance programs.
Recommendation 3: Support long-term funding for healthy food incentive programs.
4 SPUR REPORT FEBRUARY 2015 HEALTHY FOOD WITHIN REACH
STRATEGY 3: Make healthy food available in all neighborhoods
Recommendation 4: Tailor grocery store attraction and corner-store conversion initiatives at the neighborhood level.
Recommendation 5: Use zoning thoughtfully to shape food retail options.
Recommendation 6: Link public financial assistance for food retailers with requirements that they offer healthy options.
Recommendation 7: Support food pantries and emergency food assistance for those who cannot afford, or are not able, to shop at food retailers.
STRATEGY 4: Ensure that people know how to cook and make healthy food choices
Recommendation 8: Support educational initiatives promoting food literacy and encourage their integration into existing food access programs.
STRATEGY 5: Reduce demand for unhealthy food while increasing demand for healthier options
Recommendation 9: Limit or prohibit the sale and marketing of unhealthy food in environments frequented by children, especially at facilities that receive government funding.
Recommendation 10: Engage selectively in publicly funded marketing campaigns.
Recommendation 11: Tax sugar-sweetened beverages to decrease consumption and generate revenue for initiatives addressing diet-related disease and food access.
STRATEGY 6: Support research that evaluates and improves food access initiatives
Recommendation 12: Partner with local academic institutions to evaluate food access programs, and give preference to projects that include robust evaluation.
See pages 34-35 for a plan of action identifying the parties responsible for implementing these recommendations.
Sergio Ruiz
EXECUTIVE SUMMARY 5SPUR REPORT FEBRUARY 2015
The Bay Area is a global culinary capital known for offering delicious food from around the region and around the world. Our restaurants, grocery stores and farms helped pioneer the celebration of fresh, local and organic food — as well as the business models that make this thriving food culture possible. Yet many Bay Area residents, like many Americans nationwide, face a reality far removed from this celebration of cuisine. In communities throughout the region, families have trouble affording three meals a day, grapple with the effects of diet-related diseases such as obesity and diabetes, and have to travel far to find quality grocery stores that offer fresh, healthy food. In the past decade, these problems have intensified, and local governments have begun responding with a variety of initiatives. City and county agencies have worked to attract supermarkets to neighborhoods that haven’t had a full-service grocer in years. They’ve partnered with corner stores to stock healthier options. They’ve increased enrollment in food assistance programs, promoted urban agriculture and more. Each of these programs attempts to improve access to healthy food by approaching the problem from a different angle. Some have been more successful than others. Despite these efforts, there is more work to be done to solve the problems of food insecurity, diet-related disease and unhealthy food retail environments. This report analyzes these various initiatives and provides policymakers with a recommended plan of action. SPUR’s Food Access Task Force reviewed existing programs in the Bay Area as well as in other parts of the country. Many of the programs we studied involve commercial food retailers such as grocery and corner stores, but we also analyzed important noncommercial food providers such as food pantries, home-delivered meals and free dining rooms. Based on our research
and findings, we offer policymakers a framework for improving food access and recommendations for how to prioritize their efforts going forward. Our research scope covers the geography where SPUR focuses its work: the nine-county Bay Area, with a specific interest in San Francisco, San Jose and Oakland, the region’s three central cities.1 Many of the issues that exacerbate obstacles to accessing healthy food — poverty, for example — require strong state or federal policy responses. Throughout this report, we highlight the issues where that is the case. At the same time, city and county governments have a variety of policy tools they can use to improve food access. Those tools are the focus of this report.
Defining Food Access: Four Barriers to Healthy Food Consumption
We define food access as an individual or family’s ability to obtain “sufficient, safe and nutritious food to meet their dietary needs and food preferences for an active and healthy life.”2 There are four main barriers to food access; see Figure 1. We need to
How Can Bay Area Cities Best Support Access to Healthy Food?
1 The nine counties are Alameda, Contra Costa, Marin, Napa, San Francisco, San Mateo, Santa Clara, Solano and Sonoma.2 This definition is based on the United Nations’ Food and Agriculture Organization’s definition of “food insecurity,” a term that is in many ways similar to “food access.” In this report we use the framework and terminology of “food access” to describe all the barriers that people face in meeting their food needs. We use the phrases “food security” and “food insecurity” in the context of the economic barriers to obtaining food. See: Food and Agriculture Organization, “Declaration of the World Summit on Food Security” (November 2009).
6 SPUR REPORT FEBRUARY 2015 HEALTHY FOOD WITHIN REACH

Defining Healthy and Unhealthy Food
Throughout this report, we emphasize the importance of increasing access to “healthy food” and reducing consumption of “unhealthy food.” All calories are not created equal. Our diet is closely tied to our health, and improving food access should improve not just the quantity of food in someone’s diet but the quality. Providing highly processed food with little nutritional value may address hunger, but it could also contribute to obesity and other diet-related health problems. Successful efforts to improve food access should reduce hunger and promote a healthy diet at the same time. In this report, “healthy food” refers to food items that support the federal government’s Dietary Guidelines for Americans, which state that “a healthy eating pattern limits intake of sodium, solid fats, added sugars, and refined grains and emphasizes nutrient-dense foods and beverages — vegetables, fruits, whole grains, fat-free or low-fat milk and milk products, seafood, lean meats and poultry, eggs, beans and peas, and nuts and seeds.”4
“Unhealthy food” refers to food that the Institute of Medicine’s Committee on Accelerating Progress in Obesity Prevention describes as “calorie-dense and low in naturally occurring nutrients. Such foods and beverages contribute little fiber and few essential nutrients and phytochemicals but contain added fats, sweeteners, sodium, and other ingredients.”5
While many nutrition professionals are working to devise a system to identify and label healthy and unhealthy foods, currently there is no widely accepted standard in place to categorize individual food items as healthy or unhealthy.6 Instead, the definitions above provide categories of food that generally support or detract from a person’s health when consumed frequently.
address all four of these barriers to promote a more wholesome diet for individuals and a self-sustaining healthy food economy for communities.3 In the past decade, local government agencies and many nonprofit organizations have focused heavily on addressing physical access through initiatives such as attracting grocery stores, improving corner store offerings, expanding food pantries and encouraging the start of new farmers’ markets. These initiatives can significantly improve the lives of residents, but by their nature they are focused only on the supply side of a healthy food economy. For most initiatives to be economically self-sustaining, the other barriers outlined above — which underlie demand for healthy food — must also be addressed. A new grocery store will fail without enough customers, corner stores will stop stocking healthy items that have anemic sales, and farmers’ markets can’t succeed without shoppers who have the time, knowledge and desire to cook what’s on offer. Policymakers interested in addressing food access must work to understand which barriers are present in their communities and to address these obstacles simultaneously.
4 U.S. Department of Agriculture and U.S. Department of Health and Human Services, Dietary Guidelines for Americans, 2010 (Washington, DC: U.S. Government Printing Office, December 2010), ix.5 Institute of Medicine, Committee on Accelerating Progress in Obesity Prevention Food and Nutrition Board, Accelerating the Progress in Obesity Prevention: Solving the Weight of the Nation (Washington, DC: The National Academies Press, 2012), 153.6 For a review of various nutrient profile standards under development, see: Shirley Gerroir, “Nutrient Profiling Systems: Are Science and the Consumer Connected?” American Journal of Clinical Nutrition, vol. 91 (2010): 1116S-1117S. For a summary of issues regarding labeling specific foods as healthy or unhealthy in the context of the federal program, see: U.S. Department of Agriculture Food and Nutrition Service, Implications of Restricting the Use of Food Stamp Benefits — Summary (March 1, 2007), http://www.fns.usda.gov/sites/default/files/arra/FSPFoodRestrictions.pdf
3 This framework is an adaptation of the work of Heather Wooten of ChangeLab Solutions.
FIGURE 1
The Four Barriers to Food AccessThe barrier of physical access corresponds with the supply or availability of healthy food. The barriers of economic, educational and cultural access correspond with the demand for healthy food. Food access efforts need to address all four.
PHYSICAL
Can you find healthy food?SUPPLY
ECONOMIC
Can you afford healthy food?
DEMAND
EDUCATIONAL
Do you know how to make healthy choices and how to cook?
CULTURAL
Do you want the healthy food that is available and affordable?
HOW CAN BAY AREA CITIES BEST SUPPORT ACCESS TO HEALTHY FOOD? 7SPUR REPORT FEBRUARY 2015
Access to healthy food in the Bay Area is intimately tied to three major problems facing the region:
1. Hunger and food insecurity: Meeting basic dietary needs to lead an active life
2. Public health: Improving diet to reduce the historically high levels of obesity and diabetes
3. Quality of life: Improving neighborhood food retail options
Below we present a series of baseline measurements that illustrate each of these problems and can be used to evaluate future progress in addressing them.
What Success Looks Like
What tangible metrics can we use to measure increased food access? In the long term, we would feel confident that access to healthy food had improved if the following changes occurred to a significant degree throughout the Bay Area and across income levels:
• A decrease in self-reported food insecurity
• A decline in both obesity and diabetes rates
• An increase in fruit and vegetable consumption rates
• An increase in the number of people reporting access to fresh fruits and vegetables that they can afford
• A decrease in the proportion of residents living in poverty, according to the California Poverty Measure thresholds
• A decrease in the proportion of households living below the Self-Sufficiency Standard for California counties
While it is beyond the scope of this report to address the root causes of poverty, income levels are important proxies for food security, and sustainable, long-term success will mean increasing the number of people who can meet their dietary needs without public or private assistance.
Addressing Hunger and Food Insecurity Through Food Access
Even in a relatively wealthy region like the Bay Area, many people experience food insecurity, a category that includes both those who are chronically hungry and those who are uncertain, from one week to the next, if they’ll be able to obtain enough food for an active and healthy life. Ten percent of all adults in the Bay Area reported being food insecure in 2011–2012. While the region’s rate is lower than the statewide average of 14 percent, food insecurity varies significantly by county. In some places, such as Alameda and Contra Costa counties, the rate approaches the statewide average, while Solano County’s rate of food insecurity exceeds it (see Figure 2).7 Between 2001 and 2012, the share of adults in the Bay Area who said they had trouble affording sufficient food increased by 72 percent, with the most dramatic jump occurring at the start of the Great Recession. As of 2012, nearly one out of 10 adults in the Bay Area — 572,000 total — reported being food insecure (see Figure 3). Looking at the Bay Area within a national context, our region’s trend closely parallels that of the rest of the country. When based on a cost-of-living analysis rather than a survey, the Bay Area’s rate of food insecurity
Why Food Access Matters
7 The California Health Interview Survey, the largest state health survey in the nation, provides the most direct measurement of food insecurity. It asks five questions related to skipping meals, reducing meal size, eating less than one wants to or eating unbalanced meals because of money. The survey likely provides a conservative estimate of food insecurity because interviewers ask these questions only of respondents who report making less than 200 percent of the Federal Poverty Level. See: UCLA Center for Health Policy Research, California Health Interview Survey, 2011–2012, “Health Profiles: Greater Bay Area Counties,” March 2014, http://healthpolicy.ucla.edu/newsroom/press-releases/pages/details.aspx?NewsID=174; California Health Interview Survey, 2011–12, “Adult Questionnaire,” 156–157, http://healthpolicy.ucla.edu/chis/design/Documents/CHIS2011adultquestionnaire.pdf
8 SPUR REPORT FEBRUARY 2015 HEALTHY FOOD WITHIN REACH
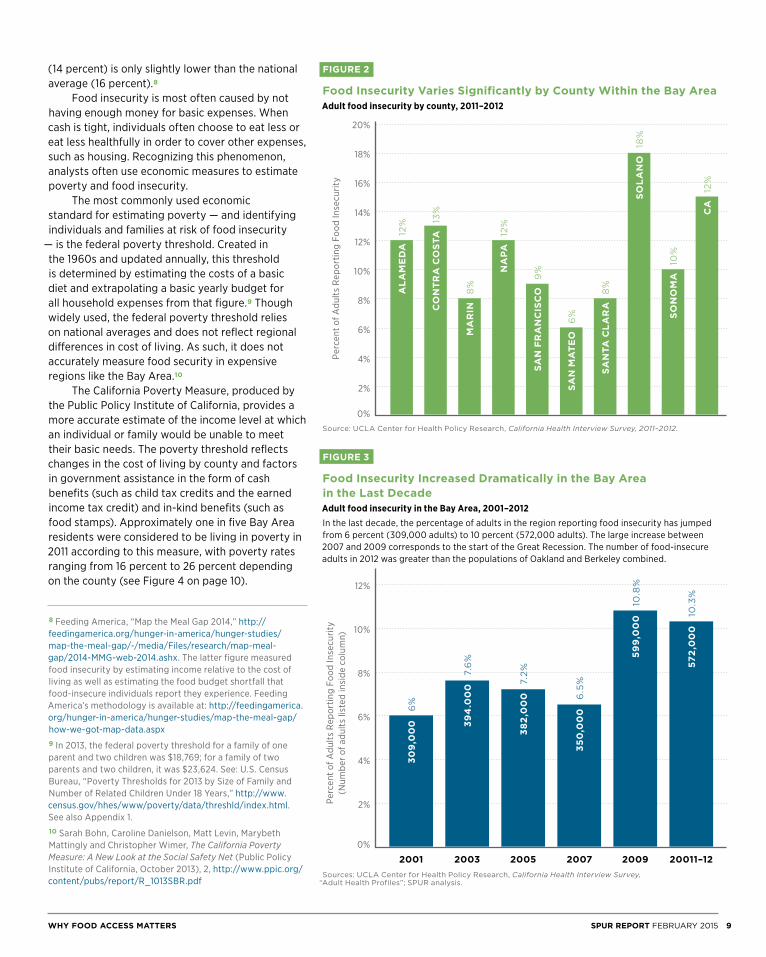
(14 percent) is only slightly lower than the national average (16 percent).8 Food insecurity is most often caused by not having enough money for basic expenses. When cash is tight, individuals often choose to eat less or eat less healthfully in order to cover other expenses, such as housing. Recognizing this phenomenon, analysts often use economic measures to estimate poverty and food insecurity. The most commonly used economic standard for estimating poverty — and identifying individuals and families at risk of food insecurity
— is the federal poverty threshold. Created in the 1960s and updated annually, this threshold is determined by estimating the costs of a basic diet and extrapolating a basic yearly budget for all household expenses from that figure.9 Though widely used, the federal poverty threshold relies on national averages and does not reflect regional differences in cost of living. As such, it does not accurately measure food security in expensive regions like the Bay Area.10
The California Poverty Measure, produced by the Public Policy Institute of California, provides a more accurate estimate of the income level at which an individual or family would be unable to meet their basic needs. The poverty threshold reflects changes in the cost of living by county and factors in government assistance in the form of cash benefits (such as child tax credits and the earned income tax credit) and in-kind benefits (such as food stamps). Approximately one in five Bay Area residents were considered to be living in poverty in 2011 according to this measure, with poverty rates ranging from 16 percent to 26 percent depending on the county (see Figure 4 on page 10).
FIGURE 2
Food Insecurity Varies Significantly by County Within the Bay AreaAdult food insecurity by county, 2011–2012
Source: UCLA Center for Health Policy Research, California Health Interview Survey, 2011–2012.
FIGURE 3
Food Insecurity Increased Dramatically in the Bay Area in the Last DecadeAdult food insecurity in the Bay Area, 2001–2012In the last decade, the percentage of adults in the region reporting food insecurity has jumped from 6 percent (309,000 adults) to 10 percent (572,000 adults). The large increase between 2007 and 2009 corresponds to the start of the Great Recession. The number of food-insecure adults in 2012 was greater than the populations of Oakland and Berkeley combined.
Sources: UCLA Center for Health Policy Research, California Health Interview Survey, “Adult Health Profiles”; SPUR analysis.
8 Feeding America, “Map the Meal Gap 2014,” http://feedingamerica.org/hunger-in-america/hunger-studies/map-the-meal-gap/~/media/Files/research/map-meal-gap/2014-MMG-web-2014.ashx. The latter figure measured food insecurity by estimating income relative to the cost of living as well as estimating the food budget shortfall that food-insecure individuals report they experience. Feeding America’s methodology is available at: http://feedingamerica.org/hunger-in-america/hunger-studies/map-the-meal-gap/how-we-got-map-data.aspx9 In 2013, the federal poverty threshold for a family of one parent and two children was $18,769; for a family of two parents and two children, it was $23,624. See: U.S. Census Bureau, “Poverty Thresholds for 2013 by Size of Family and Number of Related Children Under 18 Years,” http://www.census.gov/hhes/www/poverty/data/threshld/index.html. See also Appendix 1.10 Sarah Bohn, Caroline Danielson, Matt Levin, Marybeth Mattingly and Christopher Wimer, The California Poverty Measure: A New Look at the Social Safety Net (Public Policy Institute of California, October 2013), 2, http://www.ppic.org/content/pubs/report/R_1013SBR.pdf
Perc
ent o
f Adu
lts R
epor
ting
Food
Inse
curit
y(N
umbe
r of a
dults
list
ed in
side
col
umn)
2%
0%
4%
6%
8%
10%
12%
2001 2003 2005 2007 2009 20011–12
30
9,0
00 3
94
.00
0
38
2,0
00
35
0,0
00
59
9,0
00
572
,00
0
6%
7.6%
7.2%
6.5%
10.8%
10.3%
2%
0%
4%
6%
8%
10%
12%
14%
16%
18%
20%
AL
AM
ED
A
CO
NT
RA
CO
STA
MA
RIN
NA
PA
SA
N F
RA
NC
ISC
O
SA
N M
AT
EO
SA
NTA
CL
AR
A
SO
LA
NO
SO
NO
MA
CA
12% 13
%
8%
12%
9%
6%
8%
18%
10%
12%
Perc
ent o
f Adu
lts R
epor
ting
Food
Inse
curit
y
WHY FOOD ACCESS MATTERS 9SPUR REPORT FEBRUARY 2015

Over the long term, it’s important to track not only whether more people have become food secure but whether greater numbers of people have the income they need to be food secure independent of government or private assistance. The California Self-Sufficiency Standard measures the income necessary for a family to meet its basic needs without assistance.11 According to the index, a family of four (including a preschool child and a school-age child) in San Francisco required an income of $79,092 in 2014 to be self-sufficient, while a family of three (one preschool child) required $68,670. In 2014 in most Bay Area counties, to meet the dietary goals of the basic food plan laid out by the U.S. Department of Agriculture (USDA), a family of three would need to spend approximately $680 per month on food while a family of four would need to spend approximately
$930 per month. The thresholds for families of four for all nine Bay Area counties are shown in Figure 4, and data for a family of three is available in Appendix 1. In the Bay Area in 2012, between one-third and one-fourth of all households lived below the self-sufficiency thresholds, depending on the county. Both the California Poverty Measure and Self-Sufficiency Standard, while not direct measurements of food insecurity, provide useful economic benchmarks for tracking progress in addressing poverty, the underlying cause of food insecurity.
County
California Poverty Measure,
Family of Four 201112
Percent of All Residents Living Below California Poverty
Measure Thresholds 201113
Self-Sufficiency Standard,
Family of Four 201414
Percent of All Households Living Below
Self-Sufficiency Standard 201215
Alameda $31,701 18% $72,830 29%
Contra Costa $31,743 19% $71,711 26%
Marin $35,785 19% $87,263 30%
Napa $31,335 26% $74,110 27%
San Francisco $36,349 23% $79,092 26%
San Mateo $36,504 18% $85,090 29%
Santa Clara $34,377 19% $81,774 30%
Solano $30,166 16% $66,580 35%
Sonoma $30,898 17% $70,434 34%
11 Insight Center for Economic Development, The Self-Sufficiency Standard for California 2014, http://www.insightcced.org/communities/besa/besa-ca/ca-sss.html. For the full methodology, see: Diana Pearce, Methodology Appendix: The Self-Sufficiency Standard for California 2014 (January 2014), http://www.insightcced.org/uploads/cfes/2014/MethodologyAppendix-2014.pdf12 A family of four is defined as two adults and two children. See: “Data Set: California Poverty by County” (Public Policy Institute of California, 2013), http://www.ppic.org/main/dataset.asp?p=1399. For thresholds for a family of three, see Appendix 1.
13 Ibid.14 A family of four is defined as two adults, one preschooler and one school-age child. See: Insight Center for Community Economic Development, “2014 Self-Sufficiency Standard for California,” http://www.insightcced.org/uploads/cfes/2014/CA2014-All-Families.xlsx. For thresholds for a family of three, see Appendix 1.15 Insight Center for Community Economic Development, “The Self-Sufficiency Standard by Select Household Characteristics: California 2012,” http://www.insightcced.org/uploads/cfes/2014/CA2012ACS-County-Tables.xls
FIGURE 4
Self-Sufficiency and Poverty Thresholds by County The California Poverty Measure estimates the income level below which an individual or a family would be unable to meet their basic needs. It is adjusted for changes in the cost of living by county and factors in government assistance. The California Self-Sufficiency Standard, meanwhile, measures what income an individual or family would need to meet their basic needs without assistance.
10 SPUR REPORT FEBRUARY 2015 HEALTHY FOOD WITHIN REACH
Improving Public Health Through Food Access
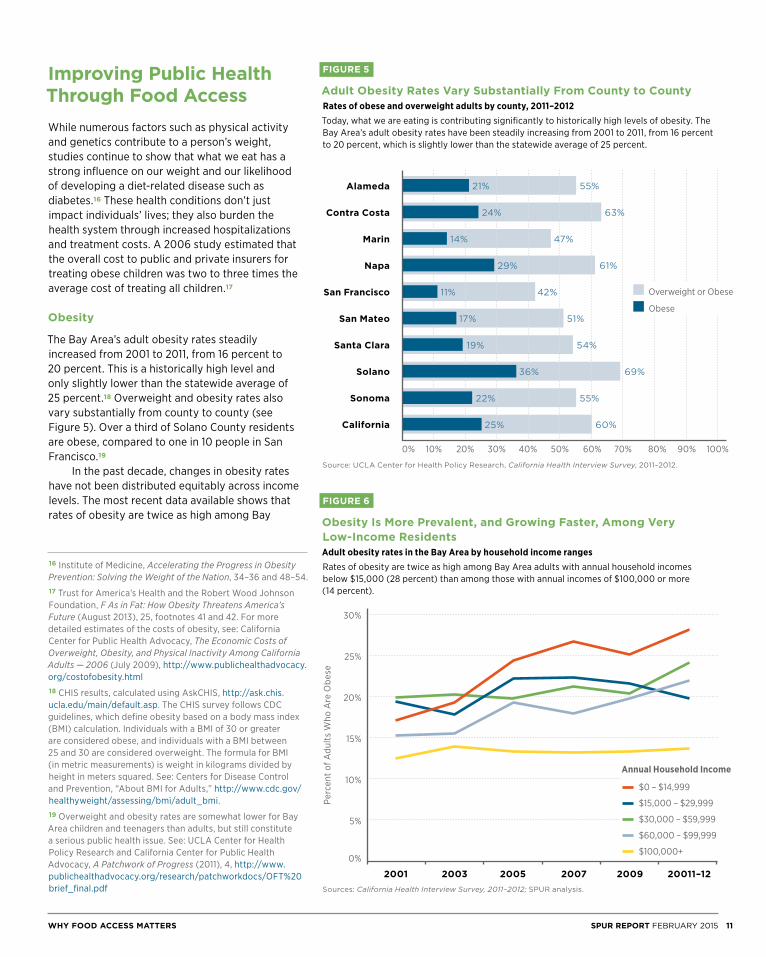
While numerous factors such as physical activity and genetics contribute to a person’s weight, studies continue to show that what we eat has a strong influence on our weight and our likelihood of developing a diet-related disease such as diabetes.16 These health conditions don’t just impact individuals’ lives; they also burden the health system through increased hospitalizations and treatment costs. A 2006 study estimated that the overall cost to public and private insurers for treating obese children was two to three times the average cost of treating all children.17
Obesity
The Bay Area’s adult obesity rates steadily increased from 2001 to 2011, from 16 percent to 20 percent. This is a historically high level and only slightly lower than the statewide average of 25 percent.18 Overweight and obesity rates also vary substantially from county to county (see Figure 5). Over a third of Solano County residents are obese, compared to one in 10 people in San Francisco.19
In the past decade, changes in obesity rates have not been distributed equitably across income levels. The most recent data available shows that rates of obesity are twice as high among Bay
FIGURE 5
Adult Obesity Rates Vary Substantially From County to CountyRates of obese and overweight adults by county, 2011–2012Today, what we are eating is contributing significantly to historically high levels of obesity. The Bay Area’s adult obesity rates have been steadily increasing from 2001 to 2011, from 16 percent to 20 percent, which is slightly lower than the statewide average of 25 percent.
Source: UCLA Center for Health Policy Research, California Health Interview Survey, 2011–2012.
FIGURE 6
Obesity Is More Prevalent, and Growing Faster, Among Very Low-Income ResidentsAdult obesity rates in the Bay Area by household income rangesRates of obesity are twice as high among Bay Area adults with annual household incomes below $15,000 (28 percent) than among those with annual incomes of $100,000 or more (14 percent).
Sources: California Health Interview Survey, 2011–2012; SPUR analysis.
16 Institute of Medicine, Accelerating the Progress in Obesity Prevention: Solving the Weight of the Nation, 34–36 and 48–54.17 Trust for America’s Health and the Robert Wood Johnson Foundation, F As in Fat: How Obesity Threatens America’s Future (August 2013), 25, footnotes 41 and 42. For more detailed estimates of the costs of obesity, see: California Center for Public Health Advocacy, The Economic Costs of Overweight, Obesity, and Physical Inactivity Among California Adults — 2006 (July 2009), http://www.publichealthadvocacy.org/costofobesity.html18 CHIS results, calculated using AskCHIS, http://ask.chis.ucla.edu/main/default.asp. The CHIS survey follows CDC guidelines, which define obesity based on a body mass index (BMI) calculation. Individuals with a BMI of 30 or greater are considered obese, and individuals with a BMI between 25 and 30 are considered overweight. The formula for BMI (in metric measurements) is weight in kilograms divided by height in meters squared. See: Centers for Disease Control and Prevention, “About BMI for Adults,” http://www.cdc.gov/healthyweight/assessing/bmi/adult_bmi. 19 Overweight and obesity rates are somewhat lower for Bay Area children and teenagers than adults, but still constitute a serious public health issue. See: UCLA Center for Health Policy Research and California Center for Public Health Advocacy, A Patchwork of Progress (2011), 4, http://www.publichealthadvocacy.org/research/patchworkdocs/OFT%20brief_final.pdf
Alameda
Contra Costa
Marin
Napa
San Francisco
San Mateo
Santa Clara
Solano
Sonoma
California
10%0% 20% 30% 40% 50% 60% 70% 80% 90% 100%
21%
24%
14%
29%
11%
17%
19%
36%
22%
25%
55%
63%
47%
61%
42%
51%
54%
69%
55%
60%
Overweight or Obese
Obese
Perc
ent o
f Adu
lts W
ho A
re O
bese
2001 2003 2005 2007 2009 20011–12
5%
0%
10%
15%
20%
25%
30%
$0 – $14,999
$15,000 – $29,999
$30,000 – $59,999
$60,000 – $99,999
$100,000+
Annual Household Income
WHY FOOD ACCESS MATTERS 11SPUR REPORT FEBRUARY 2015

Area adults with annual household incomes below $15,000 (28 percent) than among those with annual incomes of $100,000 or more (14 percent).20 As illustrated in Figure 6, the trends of adult obesity rates in the past decade differ among income brackets. However, despite the important differences, all income groups in the Bay Area have seen their rates of obesity increase or, at best, stay steadily high in the past decade.
Diabetes
Another public health issue strongly related to diet is Type II diabetes. Though many factors contribute to the onset of diabetes, our task force concluded that, because diet is a primary factor, it is important to measure progress on addressing food access by tracking the incidence of Type II diabetes.21 Currently, 6 percent of Bay Area residents report having been diagnosed with Type II diabetes.22
Dietary Behavior
Tracking obesity and diabetes — primary public health concerns — is important in evaluating the outcome of food access efforts. Tracking dietary choices — a measurement of individual behavior — is another way to evaluate the impact of efforts to improve access to healthy foods. Public health officials commonly use fruit and vegetable consumption as a proxy measurement for healthy eating because those products are an integral component of a healthy diet.23 Currently, between 60 and 75 percent of Bay Area adults report consuming less than three fruits and vegetables a day, depending on the county.24 This means that the vast majority of adults are not meeting the USDA and Centers for Disease Control and Prevention’s recommendation that most people eat at least four to five total servings of fruits and vegetables each day.25
Improving Quality of Life Through Food Access
Improving food access also improves quality of life by increasing the convenience and availability of affordable, healthy and desirable food. Residents in some neighborhoods of the Bay Area — especially low-income and rural ones — have to travel significantly farther than their counterparts in other neighborhoods just to find a grocery store or market that offers fresh fruit, vegetables and other healthy items. A longer trip is not just an inconvenience and frustration for many residents, it’s also an equity issue because the transportation costs (in both money and time) to get basic groceries pose a greater burden for lower-income residents.26
One out of every 10 Bay Area adults report that they can find fresh fruit and vegetables in their neighborhood only sometimes or never. Of those who can access fresh produce in their neighborhood, one out of every six adults report that they only sometimes find it affordable, and 1 percent report that they never find it affordable.27
Among lower-income residents, the barriers to food access are even more stark. Fifteen percent of households with an annual income less than $20,000 report that they can only sometimes, or never, find fresh produce in their neighborhood, while nearly 30 percent report that they can only sometimes, or never, access affordable produce in their neighborhood (see Figure 7). Though not everyone shops for food within their own neighborhood, many people do — and more might if they could find affordable options that matched their tastes.28 Increasing the availability of produce, dairy, meat, whole grains and other basic ingredients in a neighborhood where those options are currently lacking can help improve the quality of life for the area’s residents. While the availability and affordability of healthy retail options in a neighborhood has an impact on residents’ quality of life, research indicates that when it comes to public health, people’s food choices are influenced more by the mix of food options around them — including convenience stores and fast food restaurants — than they are by healthy options alone.29
20 SPUR analysis of CHIS data, http://ask.chis.ucla.edu/main/default.asp21 National Institute of Diabetes and Digestive and Kidney Diseases, “Causes of Diabetes,” diabetes.niddk.nih.gov/dm/pubs/causes22 California Health Interview Survey, 2011–2012.23 Antonio Agudo, Measuring Intake of Fruit and Vegetables (World Health Organization, 2004), http://www.who.int/dietphysicalactivity/publications/f&v_intake_measurement.pdf 24 California Health Interview Survey, 2011–2012.25 U.S. Department of Agriculture and U.S. Department of Health and Human Services,. Dietary Guidelines for Americans, 2010. See also: Centers for Disease Control and Prevention, “Nutrition for Everyone: How Many Fruits and Vegetables Do You Need?” accessed August 2014, http://www.cdc.gov/nutrition/everyone/fruitsvegetables/howmany.html26 For a general analysis of transportation costs as a share of income in the Bay Area, see: Metropolitan Transportation Commission, Transportation 2035 Plan for the Bay Area: Equity Analysis Report (February 2009), 24–25. Additionally, survey data shows that 25 percent of the Bay Area’s low-income residents
commute by transit, walking or biking compared to 13 percent of residents with higher incomes. Assuming that the numbers are similar for nonwork travel, the time cost — and likely monetary cost as well — for lower-income residents to run basic errands when a grocery store is far from home is greater than it is for higher-income residents, who are more likely to use a car. See: Metropolitan Transportation Commission and Association of Bay Area Governments, Plan Bay Area Equity Analysis Report (July 2013), 3–8, figs. 3–4.27 California Health Interview Survey, 2011–2012.28 A University of Washington study published in 2014 found that, especially among residents with access to a car, two-thirds of people in their sample — regardless of income — did not shop at the grocery store closest to their home or to their workplace. Instead, factors such as price and store quality had a greater influence on where people shopped. See: Anju Aggarwal et al., “Access to Supermarkets and Fruit and Vegetable Consumption,” American Journal of Public Health, vol. 104, no. 5 (May 2014), 917–923.29 Judith Bell et al., Access to Healthy Food and Why it Matters: A Review of the Research (PolicyLink, 2013), 12–15.
12 SPUR REPORT FEBRUARY 2015 HEALTHY FOOD WITHIN REACH
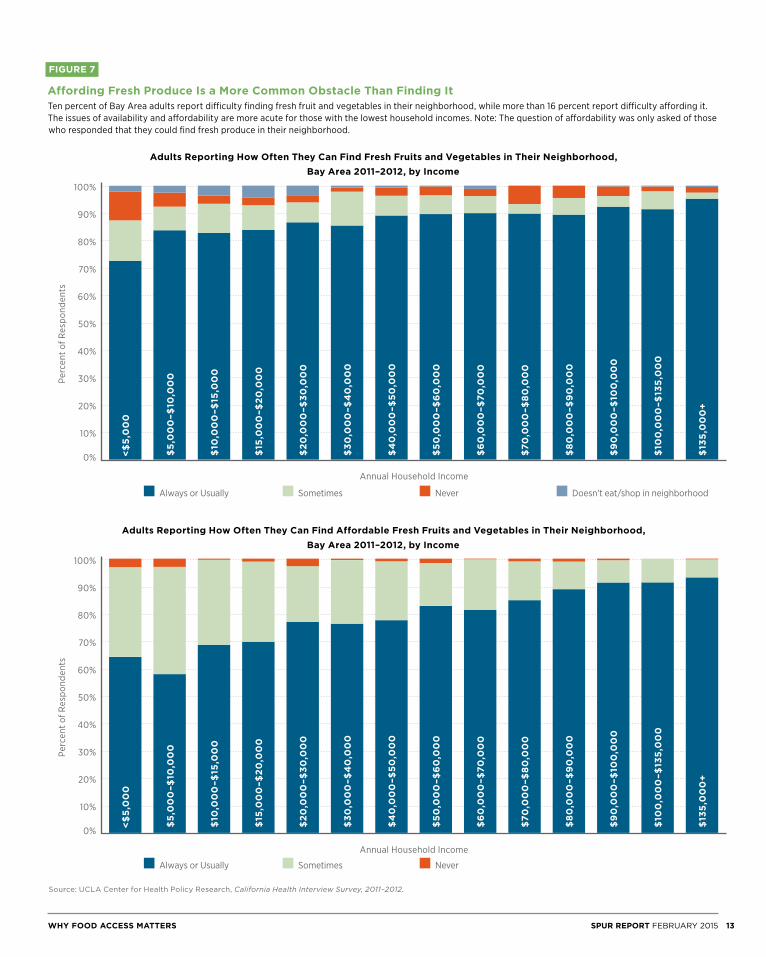
FIGURE 7
Affording Fresh Produce Is a More Common Obstacle Than Finding ItTen percent of Bay Area adults report difficulty finding fresh fruit and vegetables in their neighborhood, while more than 16 percent report difficulty affording it. The issues of availability and affordability are more acute for those with the lowest household incomes. Note: The question of affordability was only asked of those who responded that they could find fresh produce in their neighborhood.
Source: UCLA Center for Health Policy Research, California Health Interview Survey, 2011–2012.
Adults Reporting How Often They Can Find Affordable Fresh Fruits and Vegetables in Their Neighborhood, Bay Area 2011–2012, by Income
Perc
ent o
f Res
pond
ents
10%
20%
0%
30%
40%
50%
60%
70%
80%
90%
100%
Always or Usually Sometimes Never
Adults Reporting How Often They Can Find Fresh Fruits and Vegetables in Their Neighborhood, Bay Area 2011–2012, by Income
Perc
ent o
f Res
pond
ents
10%
20%
0%
30%
40%
50%
60%
70%
80%
90%
100%
Always or Usually Sometimes Never Doesn’t eat/shop in neighborhood
<$
5,0
00
<$
5,0
00
$5
,00
0–$
10,0
00
$5
,00
0–$
10,0
00
$10
,00
0–$
15,0
00
$10
,00
0–$
15,0
00
$15
,00
0–$
20
,00
0$
15,0
00
–$2
0,0
00
$2
0,0
00
–$3
0,0
00
$2
0,0
00
–$3
0,0
00
$3
0,0
00
–$4
0,0
00
$3
0,0
00
–$4
0,0
00
$4
0,0
00
–$5
0,0
00
$4
0,0
00
–$5
0,0
00
$5
0,0
00
–$6
0,0
00
$5
0,0
00
–$6
0,0
00
$6
0,0
00
–$70
,00
0$
60
,00
0–$
70,0
00
$70
,00
0–$
80
,00
0$
70,0
00
–$8
0,0
00
$8
0,0
00
–$9
0,0
00
$8
0,0
00
–$9
0,0
00
$9
0,0
00
–$10
0,0
00
$9
0,0
00
–$10
0,0
00
$10
0,0
00
–$13
5,0
00
$10
0,0
00
–$13
5,0
00
$13
5,0
00
+$
135
,00
0+
Annual Household Income
Annual Household Income
WHY FOOD ACCESS MATTERS 13SPUR REPORT FEBRUARY 2015
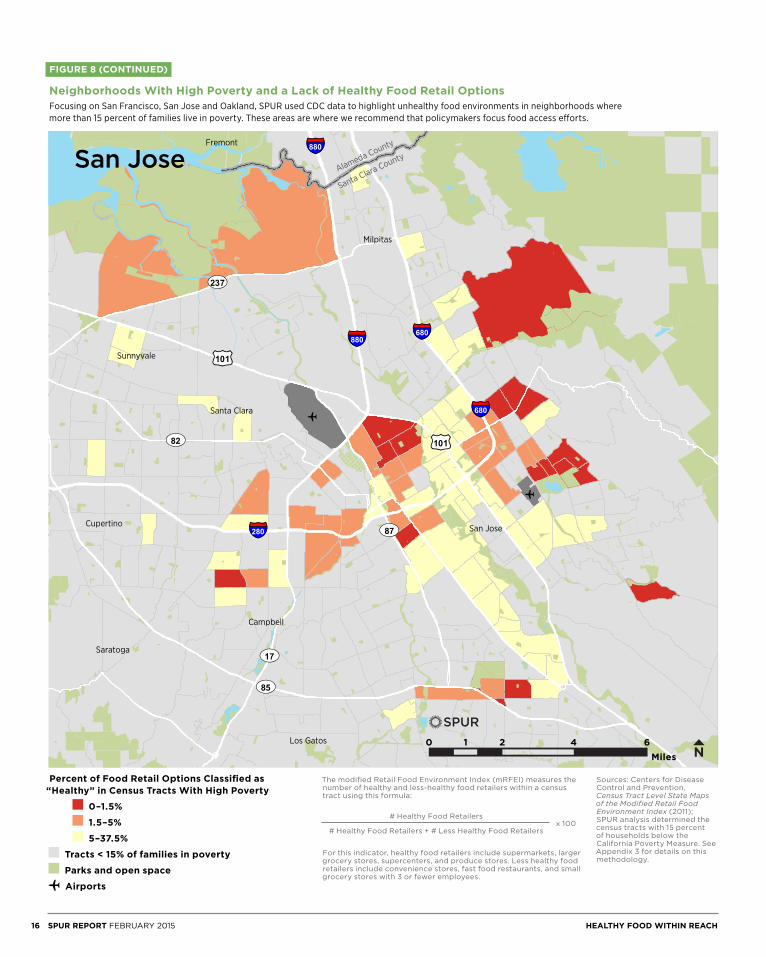
Starting at the turn of this century, many advocates framed food access as an issue of bringing healthy food retail into places that had none — often called “food deserts.” Few places, however, are completely lacking in food options. Rather, in many neighborhoods, there’s plenty of food being sold — it’s just mostly unhealthy. Recognizing this distinction, advocates have begun labeling these areas “food swamps” to draw attention to the need to change the relative prevalence of healthy and unhealthy options. The Centers for Disease Control and Prevention, responding to this more nuanced analysis of the physical food environment, created the Modified Retail Food Environment Index, which calculates the ratio of healthy food retailers to total food retailers. It attempts to show “food swamps” on a map. Even with this level of analysis, the Modified Retail Food Environment Index can only paint a partial picture. Measuring the quality of a neighborhood’s food retail options is difficult because the data on retail outlets is imprecise. The index doesn’t include farmers’ markets, nor does it reveal the mix of products available in
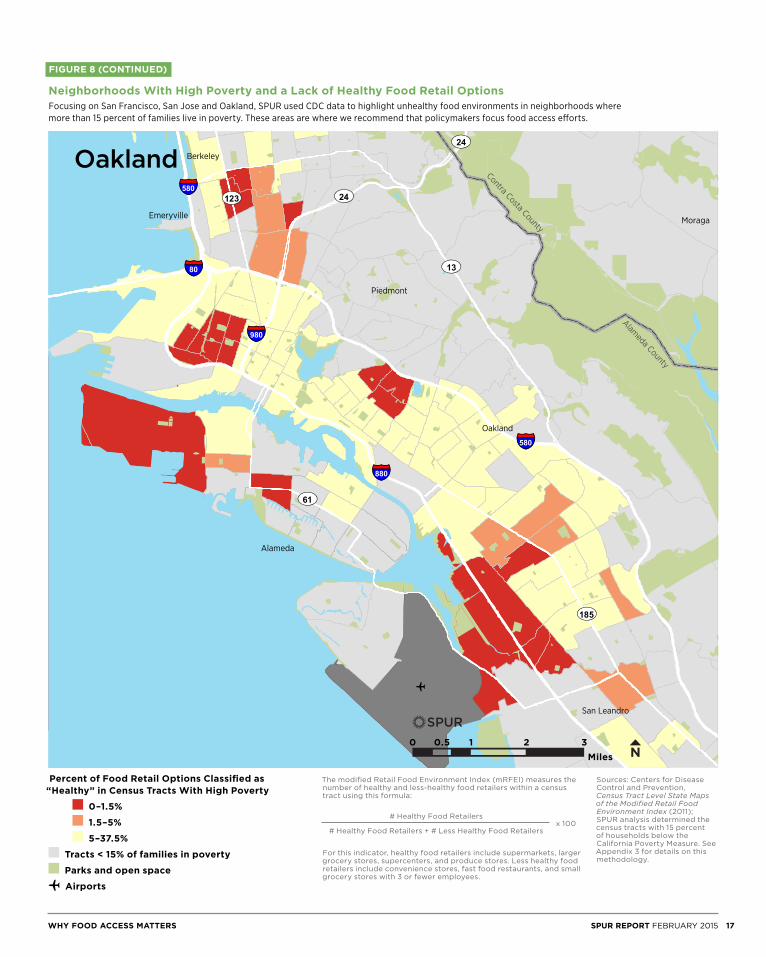
outlets classified as grocery stores or fast food retailers.30 But, even with these limitations, our task force concluded that the Modified Retail Food Environment Index data could help policymakers identify areas of their cities and counties with unhealthy retail food environments. We looked at the data for the three central cities of the Bay Area: San Francisco, San Jose and Oakland. (See Figure 8, pages 15-17.) To further refine the maps, SPUR highlighted unhealthy food retail environments in census tracts where 15 percent or more of the households fall below the county-specific California Poverty Measure threshold. (For a more detailed explanation of the methodology that generated these maps, see Appendix 3.) These are the neighborhoods and areas where we believe policymakers should focus their attention and engage local residents, community institutions and retailers.
30 For the full description of the Centers for Disease Control and Prevention’s methodology in creating the Modified Food Retail Environment Index, see: Centers for Disease Control and Prevention, Census Tract Level State Maps of the Modified Retail Food Environment Index (2011), 1–2, ftp://ftp.cdc.gov/pub/Publications/dnpao/census-tract-level-state-maps-mrfei_TAG508.pdf
14 SPUR REPORT FEBRUARY 2015 HEALTHY FOOD WITHIN REACH
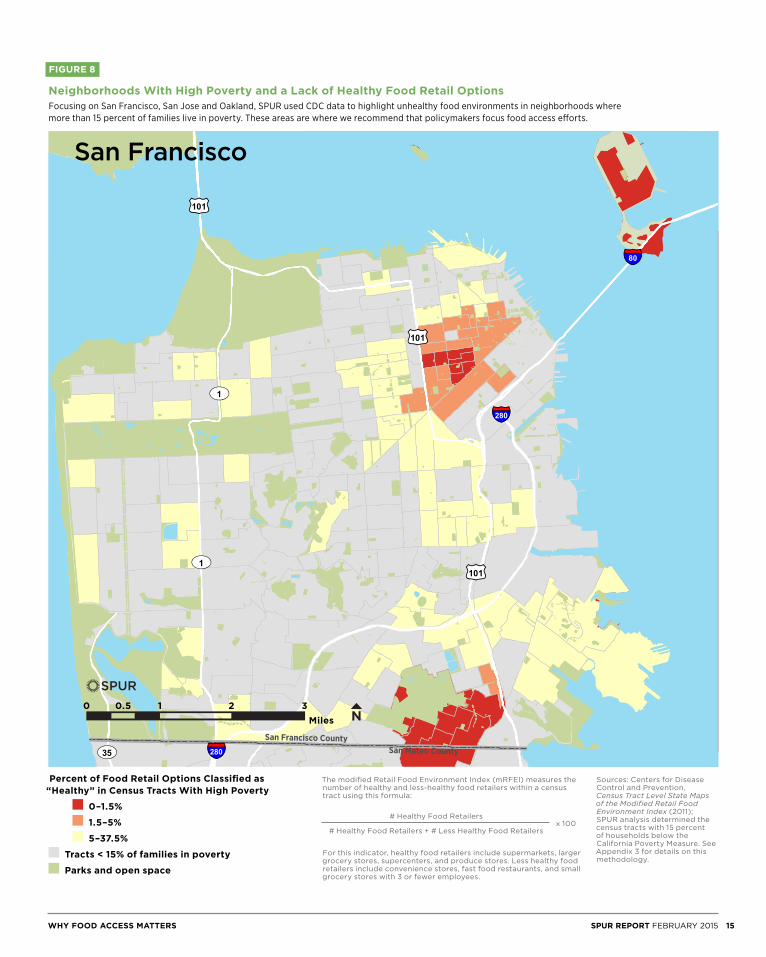
FIGURE 8
Neighborhoods With High Poverty and a Lack of Healthy Food Retail Options Focusing on San Francisco, San Jose and Oakland, SPUR used CDC data to highlight unhealthy food environments in neighborhoods where more than 15 percent of families live in poverty. These areas are where we recommend that policymakers focus food access efforts.
San Mateo CountySan Francisco County
£¤101
£¤101
£¤101
UV35
UV1
UV1
§̈¦280
§̈¦80
§̈¦280
0 - 1 .5
1 .5 - 5
5 - 1 0
1 0 - 37.5
0 1 2 30.5Miles ±
Tracts < 1 5% of families in poverty
Parks and Openspace
o Airports
LegendmRFEI Index(tracts > 15% poverty)
Sources: Centers for Disease Control and Prevention, Census Tract Level State Maps of the Modified Retail Food Environment Index (2011); SPUR analysis determined the census tracts with 15 percent of households below the California Poverty Measure. See Appendix 3 for details on this methodology.
The modified Retail Food Environment Index (mRFEI) measures the number of healthy and less-healthy food retailers within a census tract using this formula:
For this indicator, healthy food retailers include supermarkets, larger grocery stores, supercenters, and produce stores. Less healthy food retailers include convenience stores, fast food restaurants, and small grocery stores with 3 or fewer employees.
# Healthy Food Retailers
# Healthy Food Retailers + # Less Healthy Food Retailersx 100
Percent of Food Retail Options Classified as “Healthy” in Census Tracts With High Poverty
0–1.5%
1.5–5%
5–37.5%
Tracts < 15% of families in poverty
Parks and open space
Miles0 0.5 1 2 3
San Francisco
WHY FOOD ACCESS MATTERS 15SPUR REPORT FEBRUARY 2015
o
o
San Jose
Sunnyvale
Milpitas
Santa Clara
Fremont
Saratoga
Cupertino
Los Gatos
Campbell
Santa Clara CountyAlameda County
£¤101
£¤101
UV85
UV237
UV87
UV82
UV17
§̈¦280
§̈¦680§̈¦880
§̈¦680
§̈¦880
0 - 1 .5
1 .5 - 5
5 - 1 0
1 0 - 37.5
0 2 4 61Miles ±
Tracts < 1 5% of families in poverty
Parks and Openspace
o Airports
LegendmRFEI Index(tracts > 15% poverty)
Miles0 1 2 4 6
San Jose
Sources: Centers for Disease Control and Prevention, Census Tract Level State Maps of the Modified Retail Food Environment Index (2011); SPUR analysis determined the census tracts with 15 percent of households below the California Poverty Measure. See Appendix 3 for details on this methodology.
The modified Retail Food Environment Index (mRFEI) measures the number of healthy and less-healthy food retailers within a census tract using this formula:
For this indicator, healthy food retailers include supermarkets, larger grocery stores, supercenters, and produce stores. Less healthy food retailers include convenience stores, fast food restaurants, and small grocery stores with 3 or fewer employees.
# Healthy Food Retailers
# Healthy Food Retailers + # Less Healthy Food Retailersx 100
Percent of Food Retail Options Classified as “Healthy” in Census Tracts With High Poverty
0–1.5%
1.5–5%
5–37.5%
Tracts < 15% of families in poverty
Parks and open space
o Airports
FIGURE 8 (CONTINUED)
Neighborhoods With High Poverty and a Lack of Healthy Food Retail Options Focusing on San Francisco, San Jose and Oakland, SPUR used CDC data to highlight unhealthy food environments in neighborhoods where more than 15 percent of families live in poverty. These areas are where we recommend that policymakers focus food access efforts.
16 SPUR REPORT FEBRUARY 2015 HEALTHY FOOD WITHIN REACH
o
Oakland
Alameda
Berkeley
San Leandro
MoragaEmeryville
Piedmont
Alameda County
Contra Costa County
UV13
UV185
UV123
UV61
UV24
UV24
§̈¦880
§̈¦580
§̈¦80
§̈¦980
§̈¦580
0 - 1 .5
1 .5 - 5
5 - 1 0
1 0 - 37.5
0 1 2 30.5Miles ±Tracts < 1 5% of families in poverty
Parks and Openspace
o Airports
LegendmRFEI Index(tracts > 15% poverty)
Oakland
Miles0 1 20.5 3
Sources: Centers for Disease Control and Prevention, Census Tract Level State Maps of the Modified Retail Food Environment Index (2011); SPUR analysis determined the census tracts with 15 percent of households below the California Poverty Measure. See Appendix 3 for details on this methodology.
The modified Retail Food Environment Index (mRFEI) measures the number of healthy and less-healthy food retailers within a census tract using this formula:
For this indicator, healthy food retailers include supermarkets, larger grocery stores, supercenters, and produce stores. Less healthy food retailers include convenience stores, fast food restaurants, and small grocery stores with 3 or fewer employees.
# Healthy Food Retailers
# Healthy Food Retailers + # Less Healthy Food Retailersx 100
Percent of Food Retail Options Classified as “Healthy” in Census Tracts With High Poverty
0–1.5%
1.5–5%
5–37.5%
Tracts < 15% of families in poverty
Parks and open space
o Airports
FIGURE 8 (CONTINUED)
Neighborhoods With High Poverty and a Lack of Healthy Food Retail Options Focusing on San Francisco, San Jose and Oakland, SPUR used CDC data to highlight unhealthy food environments in neighborhoods where more than 15 percent of families live in poverty. These areas are where we recommend that policymakers focus food access efforts.
WHY FOOD ACCESS MATTERS 17SPUR REPORT FEBRUARY 2015
Recommendations
City and county agencies can use a variety of strategies to address the four barriers to healthy food access. To evaluate the effectiveness of different strategies, SPUR’s Food Access Task Force analyzed policy tools that have been used both inside and outside the Bay Area. One overarching theme of our analysis is that a one-size-fits-all approach rarely works. A retail strategy for a dense urban neighborhood is unlikely to work as well in a suburban neighborhood. A social service outreach program based on one language or culture may not translate well to a different community. To make progress on food access, policymakers must examine the barriers at a neighborhood scale. We have developed six broad strategies, listed below. Within each strategy, we provide specific recommendations, along with an analysis of various policy tools used to address food access. City and county agencies should not try to address food access by themselves, nor do they necessarily need to lead all the initiatives described here. While we have targeted our recommendations to city and county governments, all of the actions we propose should involve other community stakeholders. Local merchant associations, food banks, nonprofit educators, food policy councils and similar groups are important partners. The government may be the best leader in some cases, but in others nongovernmental groups may be in the best position to spearhead an effort in partnership with local government agencies. Many of the strategies we studied are relatively new; therefore, metrics on their effectiveness, especially in regard to their public health impacts, are not yet available. This created a challenge in drafting detailed recommendations for some strategies, and it is why we include Recommendation 12, which encourages government agencies to partner with academics to rigorously evaluate food access programs. We expect that future policy work, both by SPUR and other organizations, will provide more specific recommendations based on these evaluations.
STRATEGY 1
Understand the local context when developing food access strategies
Recommendation 1: Conduct an assessment or use existing data to develop a targeted set of food access programs and initiatives.
Who: Public health departments
Statistics in the earlier section of this report clearly show that food access varies dramatically within each city and county by income and by geography. Some neighborhoods and some communities are struggling with high levels of diet-related disease, food insecurity or poor retail food environments. Others are not. And even among places that face challenges when it comes to food access, such as West Oakland and San Francisco’s Tenderloin neighborhood, important differences in each place require city agencies to consider neighborhood-level variables when developing their initiatives and programs. County public health departments are often in the best position to lead overall food access strategy. These departments have access to pre-existing data on neighborhood income and health. And they can work with local planning departments, economic development agencies and community groups to combine that information with local data on the food retail environment. When collecting information to develop a food access strategy, it is important that agency staff review all barriers to food access, not just the physical ones. The California Department of Public Health has created a helpful model framework called the Communities of Excellence in Nutrition, Physical Activity and Obesity Prevention, which has been used by numerous counties.31 The San Francisco
31 California Department of Public Health, “Communities of Excellence in Nutrition, Physical Activity and Obesity Prevention,” http://www.cdph.ca.gov/programs/cpns/Pages/CX3_Main_Navgation.aspx
18 SPUR REPORT FEBRUARY 2015 HEALTHY FOOD WITHIN REACH

Food Security Task Force’s Assessment of Food Security in San Francisco is an excellent example of the way a city agency can compile existing data into a strategy to address food security for the city’s most vulnerable residents.32 Another local model that uses data to target future initiatives is the 2007 Neighborhood Food Preference Survey, conducted by San Francisco’s Southeast Food Access Working Group, in partnership with the local health department.33 This survey, which included questions about shopping habits, cultural preferences and dietary behavior, helped guide the group’s work on food retail for numerous years and helped ensure that the programs it supported were tailored to the neighborhood’s specific challenges. Categories of data that can be especially helpful in developing a food access initiative at the neighborhood level include:
• Existing food retailers and the types and quality of food available in those stores
• Income data (including the percentage of residents participating in food assistance programs)
• Food shopping behavior: Where do residents currently shop for food and groceries?
• Residents’ perspective on food access barriers: Why do residents say they don’t purchase or consume healthier food?
STRATEGY 2
Increase the purchasing power of low-income residents to improve their economic access to healthy food
While all four barriers to food access pose obstacles to healthier eating, one of the biggest issues is economic access. In many cities, food access efforts have focused on food retail and increasing the availability of healthy options. But without consumer demand, healthy food retail isn’t economically viable and retailers are less likely to move into new neighborhoods or change their product mix. Increasing residents’ purchasing power makes healthy food relatively more affordable and can increase demand for those products, which helps businesses see value in stocking a greater supply of healthier options.
Recommendation 2: Maximize enrollment in federally funded food assistance programs.
Who: Boards of supervisors, city councils, county social service agencies, school districts, public health departments
Local governments have a few tools at their disposal to help low-income residents obtain more money for food. From a local budget perspective, the most cost-effective are those that are funded primarily by the federal government. County social service agencies, school districts and public health departments, along with nonprofit social service organizations, should work to enroll the thousands of families who are eligible but not participating in the food stamp program and should strive to increase student enrollment in free and reduced-cost school meals programs.
CalFreshThe largest of the federal food assistance programs is the Supplemental Nutrition Assistance Program, known as CalFresh in California and formerly known as the Food Stamp Program. CalFresh provides
32 San Francisco Food Security Task Force, Assessment of Food Security in San Francisco (2013), https://www.sfdph.org/dph/files/mtgsGrps/FoodSecTaskFrc/docs/FSTF-AssessmentOfFoodSecurityInSF-2013.pdf33 Southeast Food Access Working Group, Food Preferences in San Francisco’s Southeast Sector (2007), http://southeastfoodaccess.org/wp-content/uploads/2011/11/SEFA_Survey_Report_FINAL.pdf
At the Heart of the City Farmers’ Market in San Francisco, customers can buy produce with their CalFresh benefits via an electronic benefits transfer (EBT) card.
Eli Zigas
RECOMMENDATIONS 19SPUR REPORT FEBRUARY 2015
eligible individuals and households with money to buy food via an electronic benefit transfer card that functions like a debit card. To qualify for CalFresh, residents must have a net income no higher than 100 percent of the federal poverty level, which amounts to $973 per month for an individual and $1,650 per month for a family of three in 2014–15.34 Undocumented residents and those receiving Supplemental Security Income are not eligible. The average CalFresh benefit per person in California in 2013 was $151.44 per month, or roughly $5 per day.35
In the nine-county Bay Area, nearly 441,000 people, or 6 percent of all residents, received CalFresh benefits in 2013.36 Strikingly, only 56 percent of those who are estimated to be eligible for the program are enrolled, which means that an additional 350,000 Bay Area residents could be receiving assistance through the program.37 If county social service agencies were able to enroll all those nonparticipants and they received average levels of benefits, the federal government would provide low-income residents in the Bay Area with an additional $53 million per month to spend at local food retailers. The CalFresh program is very cost-effective for local governments. The federal government provides 100 percent of the benefits and, along with support from the state government, covers 85 percent of a county’s administrative costs.38 In San Francisco, for example, this means that the city’s General Fund only pays for $3.6 million of the city’s $121 million CalFresh budget
— nearly $100 million of which is used by residents to purchase food.39 Additionally, the USDA has estimated that as much as $9 of economic activity is directly and indirectly generated from every $5 of CalFresh benefit spent, which means that CalFresh also suports economic development.40
Local social service agencies are improving CalFresh enrollment levels by linking other social safety net programs with CalFresh and by using technology to make it easier for residents to enroll and stay enrolled. Both are administrative changes that increase efficiency for the agencies and the applicants. For example, the Alameda County Nutrition Action Partners — a partnership that includes the Alameda County Social Services
Agency, Alameda County Public Health Department, Alameda County Community Food Bank and the Oakland Unified School District — is developing a single application that individuals and families can use to apply for CalFresh, free or reduced school meals, emergency food assistance and the Special Supplemental Nutrition Program for Women, Infants and Children. The information is shared among the relevant agencies, with the aim of reducing the number of office visits residents must make to obtain food assistance. Similarly, San Francisco’s Human Services Agency has recently piloted a text-messaging reminder service, called Promptly, to reduce the turnover of CalFresh applicants. CalFresh participants receive a message on their phone reminding them to submit certain re-enrollment paperwork before they lose their benefits. This low-cost method of outreach has increased the response rates for these types of notifications and reduced the number of people who lose their benefits and then have to re-enroll.41 Both the single application and the text-messaging service are examples of how local agencies can reduce their overhead costs while also increasing the number of eligible residents consistently receiving food assistance benefits.
School MealsSchool meals allow local school districts to provide nutritious food to students at low or no cost to them and their families. While school lunch is the largest component, a school’s meals program can also include breakfast, snack and supper during the school year, as well as lunch during the summer. Most school districts in the Bay Area charge less than $3 for a lunch. Even so, the vast majority of students eating school meals have family incomes below 185 percent of the federal poverty line, which qualifies them for free or reduced price lunches. For these students, a school meal provides critical food security and allows their families to stretch their food budgets further. In the nine Bay Area counties, an average of 42 percent of students (375,000 total) receive lunch through their schools each day, with three out of four of those students receiving the meal for free or at a reduced price.42
34 Starting in late 2014, CalFresh applicants with a gross income of 200 percent of the federal poverty level can receive benefits as long as their net income — which is calculated by subtracting a variety of deductions and certain expenses, such as child care and utilities from earnings — is below 100 percent of the federal poverty level. See: California Department of Social Services, “Eligibility and Insurance Requirements,” accessed October 13, 2014, http://www.calfresh.ca.gov/PG841.htm. For net income thresholds, see: U.S. Department of Agriculture, Food and Nutrition Service, “Supplemental Nutrition Assistance Program (SNAP),” accessed on October 13, 2014, http://www.fns.usda.gov/snap/eligibility 35 U.S. Department of Agriculture, Food and Nutrition Service,
“Supplemental Nutrition Assistance Program: Average Monthly Benefit Per Person” (July 11, 2014), http://www.fns.usda.gov/pd/supplemental-nutrition-assistance-program-snap36 California Department of Social Services, “CalFresh County Data Dashboard, FFY 2014, Oct–Dec 2013,” http://www.cdss.ca.gov/research/PG3575.htm37 Background, recommendations, and the estimate of eligible individuals not participating in CalFresh by county is calculated by California Food Policy Advocates. See: Tia Shimada, Lost Dollars, Empty Plates: The Impact of CalFresh Participation on State and Local Economies (California Food Policy
Advocates, February 2013). See also county-by-county data at http://cfpa.net/county-profiles (accessed June 30, 2014).38 California Department of Social Services, “Program Overview,” Local Assistance 2013 November Estimate, http://www.cdss.ca.gov/cdssweb/entres/localassistanceest/jan14/Overviews.pdf39 San Francisco Food Security Task Force and Tenderloin Hunger Task Force, Food Security in San Francisco — The Opportunity, presentation to the Board of Supervisors (April 10, 2014), slide 11, http://www.sfdph.org/dph/files/mtgsGrps/FoodSecTaskFrc/docs/FSTF-Hearing04102014.pdf 40 USDA Economic Research Service, The Food Assistance National Input-Output Multiplier (FANIOM) Model and Stimulus Effects of SNAP (2010), http://www.ers.usda.gov/publications/err-economic-research-report/err103.aspx#.U3hPqlhdVrY 41 The San Francisco CalFresh Office developed Promptly in conjunction with Code for America (http://codeforamerica.org/apps/promptly). Anecdotal evidence of the program’s impact is from correspondence with Leo O’Farrell, San Francisco CalFresh Program Director and Andy Hull, Postcode, August 2014. 42 California Department of Education, “2012–2013 School Nutrition Program County Profile Report,” http://www.cde.ca.gov/ds/sh/sn
20 SPUR REPORT FEBRUARY 2015 HEALTHY FOOD WITHIN REACH
The federal government, and to a smaller degree the state government, reimburses school districts a set amount of money for each free and reduced meal they serve. The cost to local school districts to operate the school meals program varies by district. Generally, because of the federal and state reimbursements, the per-meal cost to local districts is very low. Recently, the USDA updated its nutritional guidelines for reimbursable meals in an attempt to better align the nutritional content of school meals with the agency’s general dietary guidelines. School meals give communities an opportunity to provide a nutritious meal at low or no cost to the student and relatively low cost to the school district’s general fund. However, unlike with CalFresh, students have limited choices when it comes to the food that is available, which makes enticing students to eat the meals a key factor in how well these programs address food access and how economically viable they are for the school district. School districts throughout the Bay Area have reformed, and should continue to reform, their school meal programs to improve the quality of the food while increasing the number of students who choose to eat what is offered. As many school nutrition directors will attest, that is easier said than done. Even so, there are promising models in the Bay Area. Oakland Unified School District is using voter-approved bond funding to build a new central kitchen that will allow it to incorporate fresher ingredients into its meals and lower overhead costs.43 In January 2012, San Francisco Unified School District changed its school meals contract, shifting away from frozen meals to fresher meals with higher-quality food produced by Revolution Foods.44 Meal participation rates in the district increased modestly after the change, though costs did as well.45
Special Supplemental Nutrition Program for Women, Infants and Children The Special Supplemental Nutrition Program for Women, Infants and Children (commonly known by its acronym, WIC) provides money for food to pregnant women, new mothers, infants and children under five in households with incomes at or below 185 percent of the federal poverty level. Participants can only use the money, distributed in the form of checks, for specific types of products, such as grains, bread, milk and produce that meet certain nutritional guidelines. The average value of the food checks that the 1.4 million program participants receive in California is $60 per month per participant.46 Unlike CalFresh and school meals, WIC is not an entitlement program but is instead funded by federal block grants distributed to the states. By providing money to low-income
Improving Food Assistance for the Elderly, Blind and Disabled
California is the only state in the country that excludes Supplemental Security Income (SSI) recipients from the CalFresh program. In California, around 1.3 million low-income people receive SSI either because they are over 65 or because they are blind or disabled.47 When the SSI program was established in 1974, states were given the option to “cash out” the food stamp benefits to SSI recipients; under this option, states could give SSI recipients an additional cash allowance for food in lieu of food stamps. The cash-out was set at $10 per month, and in effect it meant that $10 was added to an individual’s SSI income so that he or she wouldn’t have to apply for CalFresh. As the program has evolved, the cash-out benefit has not increased along with the changes in costs of living.48
In the 1970s, California had generous welfare programs in place, and it seemed that the cash-out option would give recipients more money than they’d receive if they applied for CalFresh. State leaders and advocates also thought that the cash-out would be more cost-effective to administrate, because people on SSI wouldn’t have to apply for two separate programs. Today, however, the minimum CalFresh benefit is $15 per month, which is 50 percent greater than the food benefit in the SSI program. Preventing SSI recipients from participating in CalFresh is now limiting the amount of dollars SSI recipients can receive to supplement their food budget. Currently, analysts and advocates are evaluating two possible options for addressing this issue. One is to eliminate the cash-out option and allow SSI recipients to enroll in CalFresh. Another option is to keep the cash-out benefit that SSI recipients receive, increase it to match or exceed the minimum CalFresh benefits and adjust its value based on inflation going forward. Regardless of the specific mechanism, the state legislature should change state regulations to ensure that low-income and disabled Californians can receive a level of food assistance benefits that reflects the increased costs of food in the past four decades and future price increases as well.
43 Luke Tsai, “Measure J and the Future of OUSD’s School Lunch Program,” East Bay Express, October 31, 2012. 44 Mike Billings, “San Francisco Schools’ New Food Provider Off to Healthy Start,” San Francisco Examiner, January 9, 2013.45 SFUSD’s meal participation rate increased 5 percent for lunch and 10 percent for breakfast between the 2011-12 and 2013-14 school years. Correspondence with Zetta Reicker, Director of Student Nutrition Services, San Francisco Unified School District, December 2014.46 California Department of Public Health, Special Supplemental Nutrition Program for Women, Infants and Children: May 2014 Estimate, 6 and 11.
47 California Department of Social Services, “Program Overview,” Local Assistance 2013 November Estimate, 27–28.48 For background on the interaction between CalFresh and the state’s SSI program, see: Kerry Birnbach, “California’s Cashout Policy” (California Food Policy Advocates, March 5, 2013), http://cfpa.net/calfresh/calfresh-cashout-101
RECOMMENDATIONS 21SPUR REPORT FEBRUARY 2015
families to purchase healthy food, the WIC program helps address the economic barrier of food access.
Child and Adult Care Food Programs The Child and Adult Care Food Programs provide federal reimbursement for affordable, nutritious food, as well as administrative costs, to child-care facilities and adult day care homes. Children and seniors in households with income at or below 130 percent of the federal poverty level receive free meals, while those below 185 percent of the federal poverty level receive reduced-price meals.53 In the nine-county Bay Area in 2013, an estimated 78,000 children and 1,800 seniors received meals from care centers participating in the program, supported by federal meal reimbursements totaling $49 million.54
Recommendation 3: Support long-term funding for healthy food incentive programs.
Who: Boards of supervisors, city councils, social service agencies
In the past few years, nonprofit organizations, government agencies and farmers’ markets have collaborated to create another model to increase low-income residents’ economic access to healthy food. Known by a variety of names across the country, such as Market Match and Double Up Bucks, these programs provide a subsidy, in the form of coupons or matching dollars, to low-income customers who shop at farmers’ markets. For example, at some participating farmers’ markets in the Bay Area, the Market Match program, coordinated by the Ecology Center, provides customers with an extra $5 if they spend $10 of their CalFresh benefits on fresh produce at the market.55
These programs have been shown to boost low-income customers’ purchase of fresh, healthy food while also increasing revenue for local farmers.56 For example, a two-year analysis of four different programs nationwide, including California’s Market Match program — which operated at more than 150 markets in 2014 — found that more than 75 percent of customers who used food stamps at farmers’ markets reported increasing their produce purchases because of the incentive program.57
The biggest obstacle to the expansion of these programs is a steady stream of funding. Currently, nearly all of the programs are funded by public or private grants. The federal farm bill
Increasing Income to Increase Purchasing Power
Food subsidy programs are incredibly important in addressing food insecurity, but they do not impact the largest underlying cause of a family’s inability to afford food: income. A family’s income can be increased through a variety of policy tools. As SPUR and other authors outlined in the 2014 Economic Prosperity Strategy, workforce training and increased education can help workers move from low-wage jobs to middle-wage jobs.49 The Economic Prosperity Strategy’s recommendations include numerous ways that cities and counties can help Bay Area residents increase their incomes. However, as the study also showed, the Bay Area is not projected to generate enough middle-wage jobs to allow all working families the opportunity to earn an income that covers their basic needs. And today there is already a gap between a basic cost of living and what a full-time job at minimum wage provides. In 2014, the minimum wage was $10.74 per hour in San Francisco, $10.15 in San Jose and $9.00 in the rest of California. A single parent with two children who works a full-time job at minimum wage would still be in poverty in every part of the Bay Area according to the California Poverty Measure.50 The situation improves with two parents who have full-time minimum-wage jobs. But the minimum wage would have to be much higher for families to meet their basic needs without public or private assistance. In a household with two working adults and two children, both adults would have to work full-time jobs earning $17 to $21 per hour in 2014 to meet the Self-Sufficiency Standard.51 In short, our minimum wages are inadequate. The state and federal governments are often in the best position to establish minimum wages. But when those minimums do not reflect the higher cost of living in the Bay Area relative to much of California, local governments should consider raising city or county minimum wages. These higher wage floors, especially if they are indexed to inflation and established in coordination with surrounding jurisdictions, can greatly increase the economic security of low- and moderate-wage workers.52
Investing in education, providing worker training and increasing the state and local minimum wage would all help low-income families increase their purchasing power for healthy food.
49 SPUR and partner organizations. Economic Prosperity Strategy: Improving Economic Opportunity for the Bay Area’s Low- and Moderate-Wage Workers (October 2014), www.spur.org/economicprosperity50 SPUR analysis; see Appendix 2.51 Insight Center for Community Economic Development, “2014 Self-Sufficiency Standard for California.” 52 SPUR and partner organizations. Economic Prosperity Strategy: Improving Economic Opportunity for the Bay Area’s Low- and Moderate-Wage Workers, 83–89.
53 U.S. Department of Agriculture, Food and Nutrition Service, “Child and Adult Care Food Program,” accessed on July 23, 2014, http://www.fns.usda.gov/cacfp/why-cacfp-important54 California Department of Education, Nutrition Services Division, “Child and Adult Care Food Program: Child Care and Adult Care Components, Facts And Figures by County, Federal Fiscal Year 2012–13” (March 2014), accessed July 2014, http://www.cde.ca.gov/ds/sh/sn55 Market Match Program. http://marketmatch.org56 For a comprehensive literature review, see: Lindsay Cattell, Nicole Danna, Marina Fisher and Terra Rose, San Francisco Healthy Food Supplement Program: A Report for the San Francisco Food Security Task Force (May 2014), 11–14, www.sfdph.org/foodsecurity. See also: SPUR, Locally Nourished (May 2013), 27.57 Community Science, SNAP Healthy Food Incentives Cluster Evaluation: 2013 Final Report (October 4, 2013), 22.
22 SPUR REPORT FEBRUARY 2015 HEALTHY FOOD WITHIN REACH
passed in 2014 included a Food Insecurity Nutrition Incentive Grant Program that will provide a total of $100 million in matching grants for these types of programs between 2014 and 2018.58 Even with this support, however, the programs lack long-term sustainability because of unsteady funding. Local elected officials should augment existing funds and secure a permanent source of funding for these programs either at the local or state level. These incentive programs hold the greatest potential if they can be expanded beyond farmers’ markets to grocery stores — where most people do most of their food shopping. The Fair Food Network piloted an incentive program with three independent grocery stores in Detroit in 2013 and expanded it to include larger grocery chains in 2014. The results have shown promise but also indicate that implementing this incentive in grocery stores can be more complicated than at farmers’ markets for at least three reasons: the difficulty of identifying local produce, complex cash register technology and the greater number of staff involved at grocery stores.59
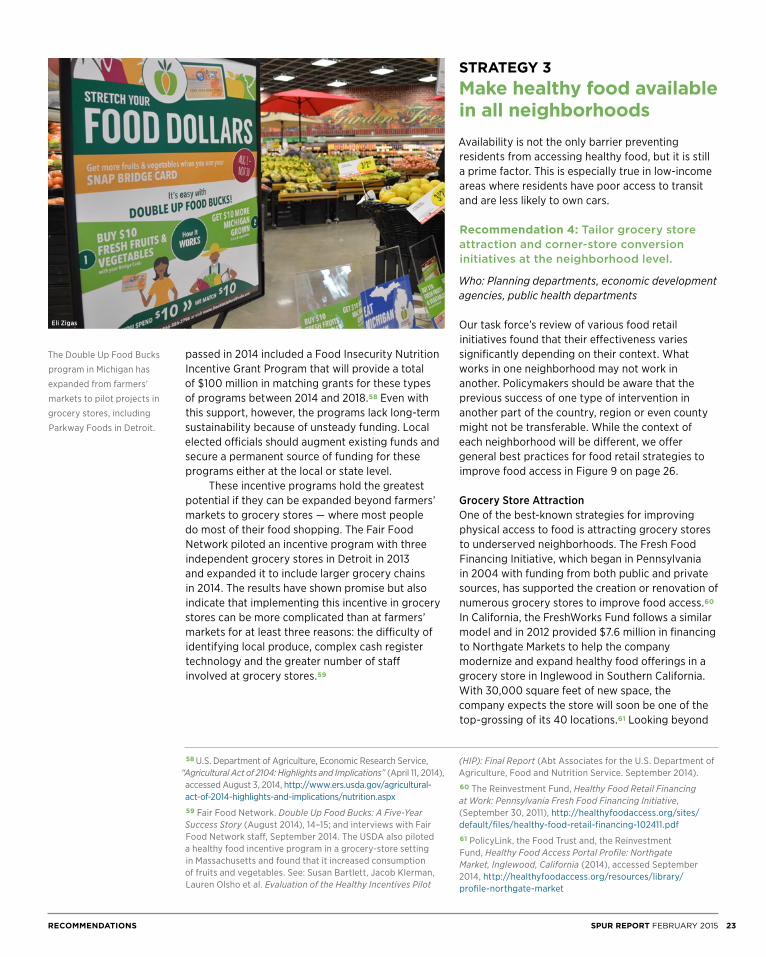
STRATEGY 3
Make healthy food available in all neighborhoods
Availability is not the only barrier preventing residents from accessing healthy food, but it is still a prime factor. This is especially true in low-income areas where residents have poor access to transit and are less likely to own cars.
Recommendation 4: Tailor grocery store attraction and corner-store conversion initiatives at the neighborhood level.
Who: Planning departments, economic development agencies, public health departments
Our task force’s review of various food retail initiatives found that their effectiveness varies significantly depending on their context. What works in one neighborhood may not work in another. Policymakers should be aware that the previous success of one type of intervention in another part of the country, region or even county might not be transferable. While the context of each neighborhood will be different, we offer general best practices for food retail strategies to improve food access in Figure 9 on page 26.
Grocery Store Attraction One of the best-known strategies for improving physical access to food is attracting grocery stores to underserved neighborhoods. The Fresh Food Financing Initiative, which began in Pennsylvania in 2004 with funding from both public and private sources, has supported the creation or renovation of numerous grocery stores to improve food access.60 In California, the FreshWorks Fund follows a similar model and in 2012 provided $7.6 million in financing to Northgate Markets to help the company modernize and expand healthy food offerings in a grocery store in Inglewood in Southern California. With 30,000 square feet of new space, the company expects the store will soon be one of the top-grossing of its 40 locations.61 Looking beyond
58 U.S. Department of Agriculture, Economic Research Service, “Agricultural Act of 2104: Highlights and Implications” (April 11, 2014), accessed August 3, 2014, http://www.ers.usda.gov/agricultural-act-of-2014-highlights-and-implications/nutrition.aspx59 Fair Food Network. Double Up Food Bucks: A Five-Year Success Story (August 2014), 14–15; and interviews with Fair Food Network staff, September 2014. The USDA also piloted a healthy food incentive program in a grocery-store setting in Massachusetts and found that it increased consumption of fruits and vegetables. See: Susan Bartlett, Jacob Klerman, Lauren Olsho et al. Evaluation of the Healthy Incentives Pilot
(HIP): Final Report (Abt Associates for the U.S. Department of Agriculture, Food and Nutrition Service. September 2014).60 The Reinvestment Fund, Healthy Food Retail Financing at Work: Pennsylvania Fresh Food Financing Initiative, (September 30, 2011), http://healthyfoodaccess.org/sites/default/files/healthy-food-retail-financing-102411.pdf61 PolicyLink, the Food Trust and, the Reinvestment Fund, Healthy Food Access Portal Profile: Northgate Market, Inglewood, California (2014), accessed September 2014, http://healthyfoodaccess.org/resources/library/profile-northgate-market
The Double Up Food Bucks program in Michigan has expanded from farmers’ markets to pilot projects in grocery stores, including Parkway Foods in Detroit.
Eli Zigas
RECOMMENDATIONS 23SPUR REPORT FEBRUARY 2015
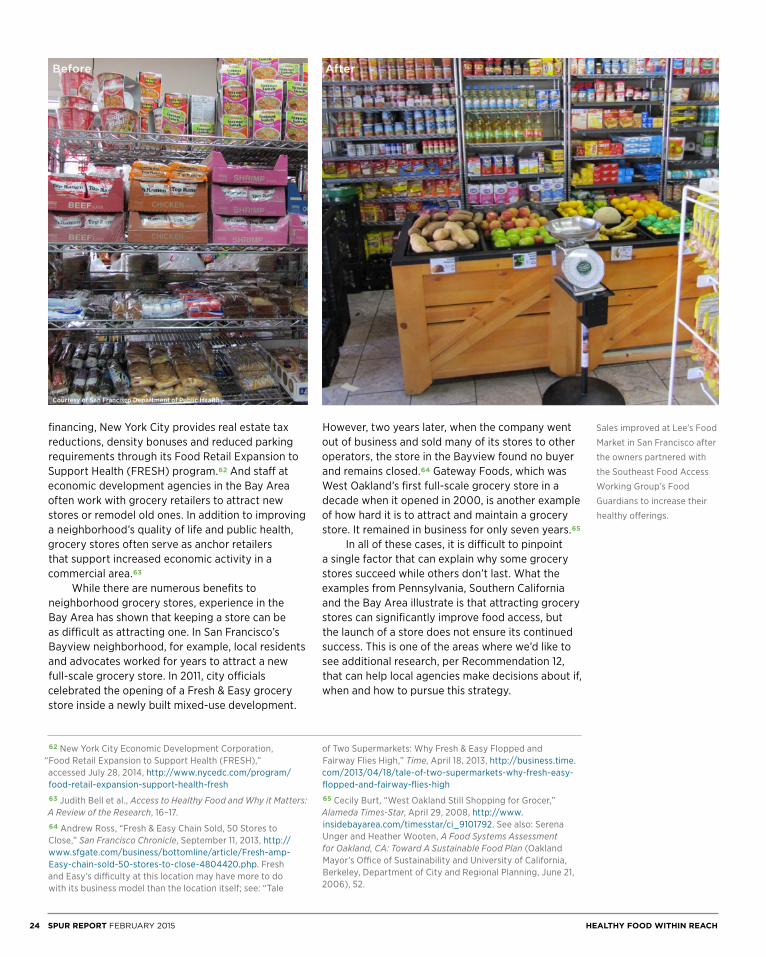
financing, New York City provides real estate tax reductions, density bonuses and reduced parking requirements through its Food Retail Expansion to Support Health (FRESH) program.62 And staff at economic development agencies in the Bay Area often work with grocery retailers to attract new stores or remodel old ones. In addition to improving a neighborhood’s quality of life and public health, grocery stores often serve as anchor retailers that support increased economic activity in a commercial area.63
While there are numerous benefits to neighborhood grocery stores, experience in the Bay Area has shown that keeping a store can be as difficult as attracting one. In San Francisco’s Bayview neighborhood, for example, local residents and advocates worked for years to attract a new full-scale grocery store. In 2011, city officials celebrated the opening of a Fresh & Easy grocery store inside a newly built mixed-use development.
However, two years later, when the company went out of business and sold many of its stores to other operators, the store in the Bayview found no buyer and remains closed.64 Gateway Foods, which was West Oakland’s first full-scale grocery store in a decade when it opened in 2000, is another example of how hard it is to attract and maintain a grocery store. It remained in business for only seven years.65
In all of these cases, it is difficult to pinpoint a single factor that can explain why some grocery stores succeed while others don’t last. What the examples from Pennsylvania, Southern California and the Bay Area illustrate is that attracting grocery stores can significantly improve food access, but the launch of a store does not ensure its continued success. This is one of the areas where we’d like to see additional research, per Recommendation 12, that can help local agencies make decisions about if, when and how to pursue this strategy.
Sales improved at Lee’s Food Market in San Francisco after the owners partnered with the Southeast Food Access Working Group’s Food Guardians to increase their healthy offerings.
62 New York City Economic Development Corporation, “Food Retail Expansion to Support Health (FRESH),” accessed July 28, 2014, http://www.nycedc.com/program/food-retail-expansion-support-health-fresh63 Judith Bell et al., Access to Healthy Food and Why it Matters: A Review of the Research, 16–17. 64 Andrew Ross, “Fresh & Easy Chain Sold, 50 Stores to Close,” San Francisco Chronicle, September 11, 2013, http://www.sfgate.com/business/bottomline/article/Fresh-amp-Easy-chain-sold-50-stores-to-close-4804420.php. Fresh and Easy’s difficulty at this location may have more to do with its business model than the location itself; see: “Tale
of Two Supermarkets: Why Fresh & Easy Flopped and Fairway Flies High,” Time, April 18, 2013, http://business.time.com/2013/04/18/tale-of-two-supermarkets-why-fresh-easy-flopped-and-fairway-flies-high65 Cecily Burt, “West Oakland Still Shopping for Grocer,” Alameda Times-Star, April 29, 2008, http://www.insidebayarea.com/timesstar/ci_9101792. See also: Serena Unger and Heather Wooten, A Food Systems Assessment for Oakland, CA: Toward A Sustainable Food Plan (Oakland Mayor’s Office of Sustainability and University of California, Berkeley, Department of City and Regional Planning, June 21, 2006), 52.
Courtesy of San Francisco Department of Public Health
Before After
24 SPUR REPORT FEBRUARY 2015 HEALTHY FOOD WITHIN REACH
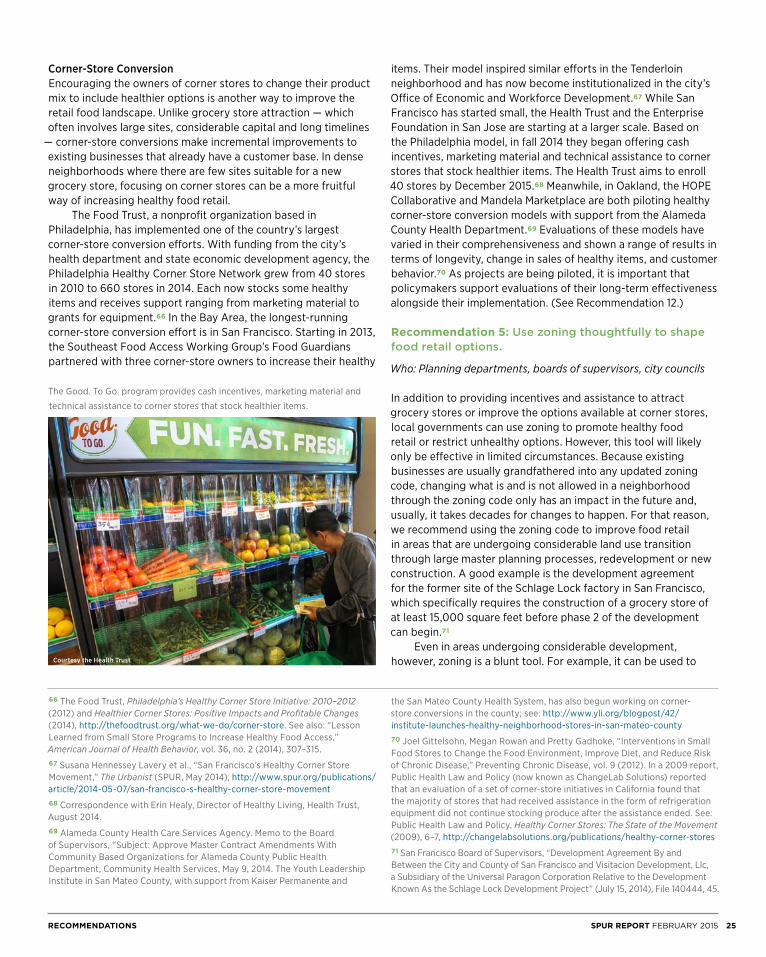
Corner-Store Conversion Encouraging the owners of corner stores to change their product mix to include healthier options is another way to improve the retail food landscape. Unlike grocery store attraction — which often involves large sites, considerable capital and long timelines
— corner-store conversions make incremental improvements to existing businesses that already have a customer base. In dense neighborhoods where there are few sites suitable for a new grocery store, focusing on corner stores can be a more fruitful way of increasing healthy food retail. The Food Trust, a nonprofit organization based in Philadelphia, has implemented one of the country’s largest corner-store conversion efforts. With funding from the city’s health department and state economic development agency, the Philadelphia Healthy Corner Store Network grew from 40 stores in 2010 to 660 stores in 2014. Each now stocks some healthy items and receives support ranging from marketing material to grants for equipment.66 In the Bay Area, the longest-running corner-store conversion effort is in San Francisco. Starting in 2013, the Southeast Food Access Working Group’s Food Guardians partnered with three corner-store owners to increase their healthy
items. Their model inspired similar efforts in the Tenderloin neighborhood and has now become institutionalized in the city’s Office of Economic and Workforce Development.67 While San Francisco has started small, the Health Trust and the Enterprise Foundation in San Jose are starting at a larger scale. Based on the Philadelphia model, in fall 2014 they began offering cash incentives, marketing material and technical assistance to corner stores that stock healthier items. The Health Trust aims to enroll 40 stores by December 2015.68 Meanwhile, in Oakland, the HOPE Collaborative and Mandela Marketplace are both piloting healthy corner-store conversion models with support from the Alameda County Health Department.69 Evaluations of these models have varied in their comprehensiveness and shown a range of results in terms of longevity, change in sales of healthy items, and customer behavior.70 As projects are being piloted, it is important that policymakers support evaluations of their long-term effectiveness alongside their implementation. (See Recommendation 12.)
Recommendation 5: Use zoning thoughtfully to shape food retail options.
Who: Planning departments, boards of supervisors, city councils
In addition to providing incentives and assistance to attract grocery stores or improve the options available at corner stores, local governments can use zoning to promote healthy food retail or restrict unhealthy options. However, this tool will likely only be effective in limited circumstances. Because existing businesses are usually grandfathered into any updated zoning code, changing what is and is not allowed in a neighborhood through the zoning code only has an impact in the future and, usually, it takes decades for changes to happen. For that reason, we recommend using the zoning code to improve food retail in areas that are undergoing considerable land use transition through large master planning processes, redevelopment or new construction. A good example is the development agreement for the former site of the Schlage Lock factory in San Francisco, which specifically requires the construction of a grocery store of at least 15,000 square feet before phase 2 of the development can begin.71
Even in areas undergoing considerable development, however, zoning is a blunt tool. For example, it can be used to
The Good. To Go. program provides cash incentives, marketing material and technical assistance to corner stores that stock healthier items.
66 The Food Trust, Philadelphia’s Healthy Corner Store Initiative: 2010–2012 (2012) and Healthier Corner Stores: Positive Impacts and Profitable Changes (2014), http://thefoodtrust.org/what-we-do/corner-store. See also: “Lesson Learned from Small Store Programs to Increase Healthy Food Access,” American Journal of Health Behavior, vol. 36, no. 2 (2014), 307–315.67 Susana Hennessey Lavery et al., “San Francisco’s Healthy Corner Store Movement,” The Urbanist (SPUR, May 2014), http://www.spur.org/publications/article/2014-05-07/san-francisco-s-healthy-corner-store-movement68 Correspondence with Erin Healy, Director of Healthy Living, Health Trust, August 2014.69 Alameda County Health Care Services Agency. Memo to the Board of Supervisors, “Subject: Approve Master Contract Amendments With Community Based Organizations for Alameda County Public Health Department, Community Health Services, May 9, 2014. The Youth Leadership Institute in San Mateo County, with support from Kaiser Permanente and
the San Mateo County Health System, has also begun working on corner-store conversions in the county; see: http://www.yli.org/blogpost/42/institute-launches-healthy-neighborhood-stores-in-san-mateo-county 70 Joel Gittelsohn, Megan Rowan and Pretty Gadhoke, “Interventions in Small Food Stores to Change the Food Environment, Improve Diet, and Reduce Risk of Chronic Disease,” Preventing Chronic Disease, vol. 9 (2012). In a 2009 report, Public Health Law and Policy (now known as ChangeLab Solutions) reported that an evaluation of a set of corner-store initiatives in California found that the majority of stores that had received assistance in the form of refrigeration equipment did not continue stocking produce after the assistance ended. See: Public Health Law and Policy, Healthy Corner Stores: The State of the Movement (2009), 6–7, http://changelabsolutions.org/publications/healthy-corner-stores71 San Francisco Board of Supervisors, “Development Agreement By and Between the City and County of San Francisco and Visitacion Development, Llc, a Subsidiary of the Universal Paragon Corporation Relative to the Development Known As the Schlage Lock Development Project” (July 15, 2014), File 140444, 45.
Courtesy the Health Trust
RECOMMENDATIONS 25SPUR REPORT FEBRUARY 2015
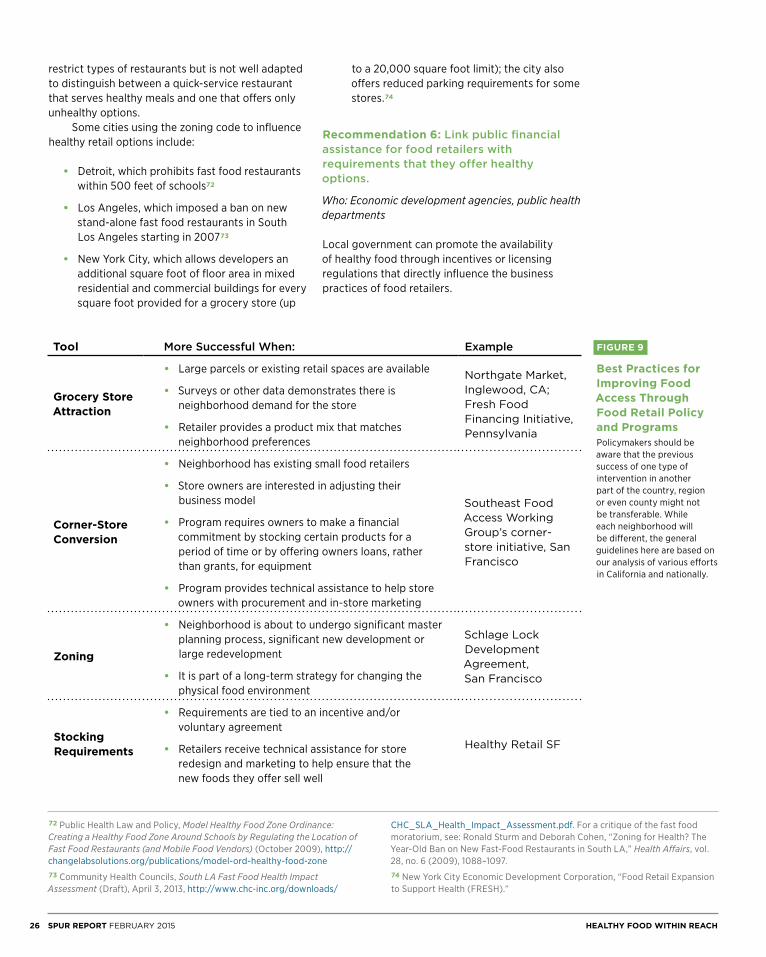
restrict types of restaurants but is not well adapted to distinguish between a quick-service restaurant that serves healthy meals and one that offers only unhealthy options. Some cities using the zoning code to influence healthy retail options include:
• Detroit, which prohibits fast food restaurants within 500 feet of schools72
• Los Angeles, which imposed a ban on new stand-alone fast food restaurants in South Los Angeles starting in 200773
• New York City, which allows developers an additional square foot of floor area in mixed residential and commercial buildings for every square foot provided for a grocery store (up
to a 20,000 square foot limit); the city also offers reduced parking requirements for some stores.74
Recommendation 6: Link public financial assistance for food retailers with requirements that they offer healthy options.
Who: Economic development agencies, public health departments
Local government can promote the availability of healthy food through incentives or licensing regulations that directly influence the business practices of food retailers.
Tool More Successful When: Example
Grocery Store Attraction
• Large parcels or existing retail spaces are available
• Surveys or other data demonstrates there is neighborhood demand for the store
• Retailer provides a product mix that matches neighborhood preferences
Northgate Market, Inglewood, CA; Fresh Food Financing Initiative, Pennsylvania
Corner-Store Conversion
• Neighborhood has existing small food retailers
• Store owners are interested in adjusting their business model
• Program requires owners to make a financial commitment by stocking certain products for a period of time or by offering owners loans, rather than grants, for equipment
• Program provides technical assistance to help store owners with procurement and in-store marketing
Southeast Food Access Working Group’s corner-store initiative, San Francisco
Zoning
• Neighborhood is about to undergo significant master planning process, significant new development or large redevelopment
• It is part of a long-term strategy for changing the physical food environment
Schlage Lock Development Agreement, San Francisco
Stocking Requirements
• Requirements are tied to an incentive and/or voluntary agreement
• Retailers receive technical assistance for store redesign and marketing to help ensure that the new foods they offer sell well
Healthy Retail SF
FIGURE 9
Best Practices for Improving Food Access Through Food Retail Policy and ProgramsPolicymakers should be aware that the previous success of one type of intervention in another part of the country, region or even county might not be transferable. While each neighborhood will be different, the general guidelines here are based on our analysis of various efforts in California and nationally.
72 Public Health Law and Policy, Model Healthy Food Zone Ordinance: Creating a Healthy Food Zone Around Schools by Regulating the Location of Fast Food Restaurants (and Mobile Food Vendors) (October 2009), http://changelabsolutions.org/publications/model-ord-healthy-food-zone73 Community Health Councils, South LA Fast Food Health Impact Assessment (Draft), April 3, 2013, http://www.chc-inc.org/downloads/
CHC_SLA_Health_Impact_Assessment.pdf. For a critique of the fast food moratorium, see: Ronald Sturm and Deborah Cohen, “Zoning for Health? The Year-Old Ban on New Fast-Food Restaurants in South LA,” Health Affairs, vol. 28, no. 6 (2009), 1088–1097. 74 New York City Economic Development Corporation, “Food Retail Expansion to Support Health (FRESH).”
26 SPUR REPORT FEBRUARY 2015 HEALTHY FOOD WITHIN REACH
In the context of incentives, economic development agencies, health departments and any other agency that provides assistance to a grocery store or corner store can condition that assistance on certain requirements. For example, a grant program can mandate that recipients apply for authorization to accept CalFresh and/or WIC. As part of the San Francisco Healthy Food Retailer Incentives Program, retailers who receive loans and technical assistance must agree to dedicate at least 35 percent of their shelf space to “fresh produce, whole grains, lean proteins and low-fat dairy products.”75 These types of incentive-based commitments are a straightforward way for local governments to promote healthy food access through voluntary agreements. Through their ability to license businesses, local governments have the power to require certain business practices, and this can extend to regulating a minimum set of foods that retailers must offer. For example, in 2008 Minneapolis passed the Staple Food Ordinance, which required any retailers classified as grocery stores (including many corner stores) to sell a minimum amount of produce, meat, poultry, fish or vegetable protein; bread or cereal; and dairy products. Despite the requirement, a year later the local health department found that 75 percent of corner stores were not carrying the produce required by law.76 The department subsequently increased its outreach and engagement with storeowners and saw increases in produce sales, though those sales still often constituted less than 1 percent of overall store sales.77 The experience in Minneapolis illustrates that regulations requiring retailers to carry healthy food items are unlikely to succeed without increased demand and significant government support for training, marketing and equipment. Licensing or other retailer mandates to stock certain items are newer food policy tools, and any future pilots should be evaluated closely to determine whether they have a positive impact. In the meantime, we recommend that local jurisdictions only consider pursuing this type of strategy when it is combined with a comprehensive business assistance program and with initiatives that support increased consumer demand, like those recommended in Strategies 2 and 4.
Recommendation 7: Support food pantries and emergency food assistance for those who cannot afford, or are not able, to shop at food retailers.
Who: Social service agencies, public health departments, nonprofit organizations
The previous three recommendations all aim to improve physical access to healthy food through food retailers. Some residents, however, do not have enough money to obtain all their food from a retailer, are physically homebound or are homeless. For those residents, physical access to food is best provided through the safety-net programs of food pantries, home-delivered meals and groceries, and meals served at institutions and soup kitchens. In San Francisco, nearly 100,000 people are served every week by more than 200 food pantries that are either operated or supported by the SF-Marin Food Bank. This means that 12 percent of the city’s population accesses food through this noncommercial distribution channel, which is largely funded by private philanthropy. In addition to the pantries, local nonprofits such as St. Anthony’s and Glide operate 13 free dining rooms that serve an average of 6,000 meals per day.78 Services like Meals on Wheels, which are partially funded by the city’s Department of Aging and Adult Services, deliver an additional 4,500 meals daily to seniors and adults with disabilities.79 In Santa Clara County and San Mateo counties, the Second Harvest Food Bank supports 740 food pantries and also operates a Produce Mobile Program, which uses refrigerated trucks to distribute fresh produce to nearly 11,000 low-income households.80 The Alameda County Food Bank directly or indirectly provides food to 311,000 individuals annually, serving one out of every five residents in the county at some point of the year.81
Because these safety-net programs provide critical nutrition to those most in need, local governments should consider expanding their financial support for these programs. San Francisco, for example, recently committed an additional $2.5 million to expand its support of programs for home-delivered meals and groceries as well as free dining rooms.82 In addition to
75 Healthy Food Retailer Ordinance, San Francisco Administrative Code, Chapter 59 (Ordinance 193-13). For other examples in other cities see: ChangeLab Solutions, Health on the Shelf: A Guide to Healthy Small Food Retailer Certification Programs (2013), 61–67, http://changelabsolutions.org/publications/health-on-the-shelf 76 Minneapolis, Minnesota, Code of Ordinances, Title 10, Food Code, Chapter 203 as cited in: Minneapolis Health Department, The Minneapolis Healthy Corner Store Program Summary Report (November 2013), http://www.minneapolismn.gov/health/living/new%20cornerstores77 Minneapolis Health Department, Testing an Evaluation Model for Assessing the Efficacy of the Minneapolis Healthy Corner Store Program (September 201378 The San Francisco Food Security Task Force’s 2013 report provides an in-depth examination of the barriers to food access facing the city’s most vulnerable residents. See footnote 32.79 San Francisco Food Security Task Force and Tenderloin Hunger Task Force,
“Food Security in San Francisco — The Opportunity,” slide 24. See footnote 39.80 Santa Clara County Food System Alliance, Santa Clara County Food System Assessment (November 2013), p. 85, http://aginnovations.org/images/
uploads/Final_VersionASSESS_010814_sm.pdf; Second Harvest Food Bank of Santa Clara and San Mateo Counties, “Produce Mobile Program,” accessed November 6, 2014, http://www.shfb.org/producemobile81 Gregory Mills et al., Hunger in America 2014: Report for Alameda County Food Bank (Feeding America: August 2014), 2; Alameda County Community Food Bank, “Hunger and Health: A Joint Diagnosis,” Community Harvest: Food Bank News (Fall 2014), 1.82 In the FY 2014–15 budget process, the mayor’s budget included an infusion of $750,000 to enhance the Department of Aging and Adult Services’ home-delivered meal and grocery services. See: Mayor’s Office of Public Policy and Finance, Mayor’s 2014–2015 and 2015–2016 Proposed Budget, 283, http://www.sfmayor.org/index.aspx?page=981. In addition, the Board of Supervisors, through the “add back” budget process, provided an additional $1.7 million for congregate and home-delivered meals and home-delivered groceries. See: San Francisco Board of Supervisors, “Addback by Dept” in the “Annual Budget and Appropriation Ordinance for Selected Departments — FYs 2014–2015 and 2015–2016,” File 140619 (June 2014); Correspondence with Teri Olle, SF-Marin Food Bank, October 2014.
RECOMMENDATIONS 27SPUR REPORT FEBRUARY 2015
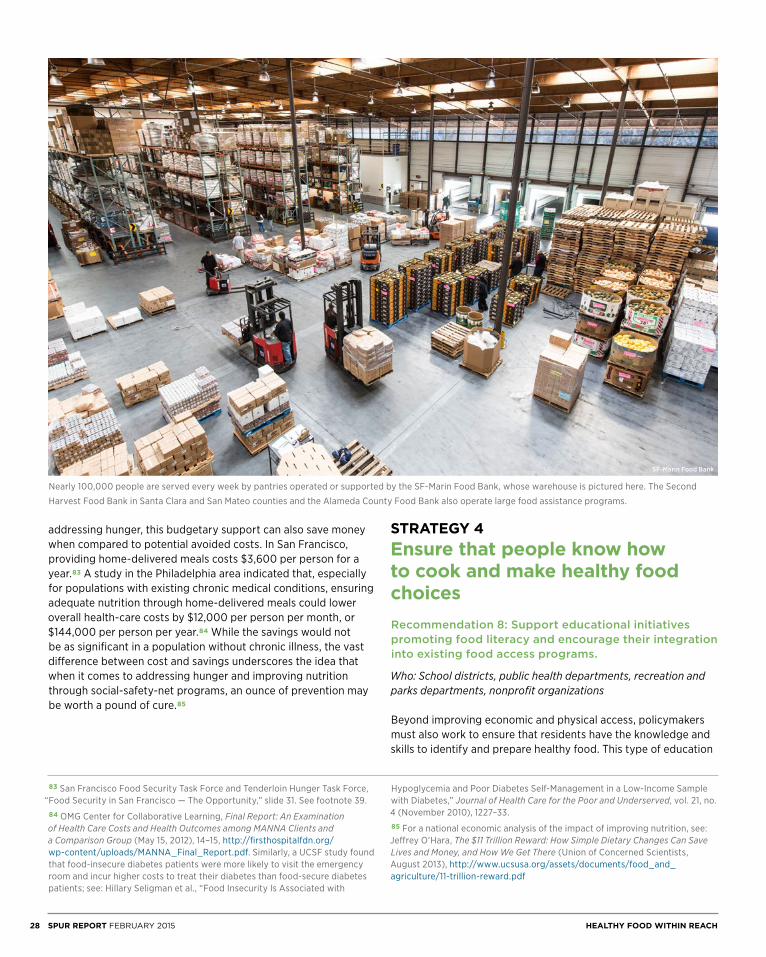
addressing hunger, this budgetary support can also save money when compared to potential avoided costs. In San Francisco, providing home-delivered meals costs $3,600 per person for a year.83 A study in the Philadelphia area indicated that, especially for populations with existing chronic medical conditions, ensuring adequate nutrition through home-delivered meals could lower overall health-care costs by $12,000 per person per month, or $144,000 per person per year.84 While the savings would not be as significant in a population without chronic illness, the vast difference between cost and savings underscores the idea that when it comes to addressing hunger and improving nutrition through social-safety-net programs, an ounce of prevention may be worth a pound of cure.85
STRATEGY 4
Ensure that people know how to cook and make healthy food choices
Recommendation 8: Support educational initiatives promoting food literacy and encourage their integration into existing food access programs.
Who: School districts, public health departments, recreation and parks departments, nonprofit organizations
Beyond improving economic and physical access, policymakers must also work to ensure that residents have the knowledge and skills to identify and prepare healthy food. This type of education
Nearly 100,000 people are served every week by pantries operated or supported by the SF-Marin Food Bank, whose warehouse is pictured here. The Second Harvest Food Bank in Santa Clara and San Mateo counties and the Alameda County Food Bank also operate large food assistance programs.
83 San Francisco Food Security Task Force and Tenderloin Hunger Task Force, “Food Security in San Francisco — The Opportunity,” slide 31. See footnote 39.
84 OMG Center for Collaborative Learning, Final Report: An Examination of Health Care Costs and Health Outcomes among MANNA Clients and a Comparison Group (May 15, 2012), 14–15, http://firsthospitalfdn.org/wp-content/uploads/MANNA_Final_Report.pdf. Similarly, a UCSF study found that food-insecure diabetes patients were more likely to visit the emergency room and incur higher costs to treat their diabetes than food-secure diabetes patients; see: Hillary Seligman et al., “Food Insecurity Is Associated with
Hypoglycemia and Poor Diabetes Self-Management in a Low-Income Sample with Diabetes,” Journal of Health Care for the Poor and Underserved, vol. 21, no. 4 (November 2010), 1227–33.85 For a national economic analysis of the impact of improving nutrition, see: Jeffrey O’Hara, The $11 Trillion Reward: How Simple Dietary Changes Can Save Lives and Money, and How We Get There (Union of Concerned Scientists, August 2013), http://www.ucsusa.org/assets/documents/food_and_agriculture/11-trillion-reward.pdf
SF-Marin Food Bank
28 SPUR REPORT FEBRUARY 2015 HEALTHY FOOD WITHIN REACH
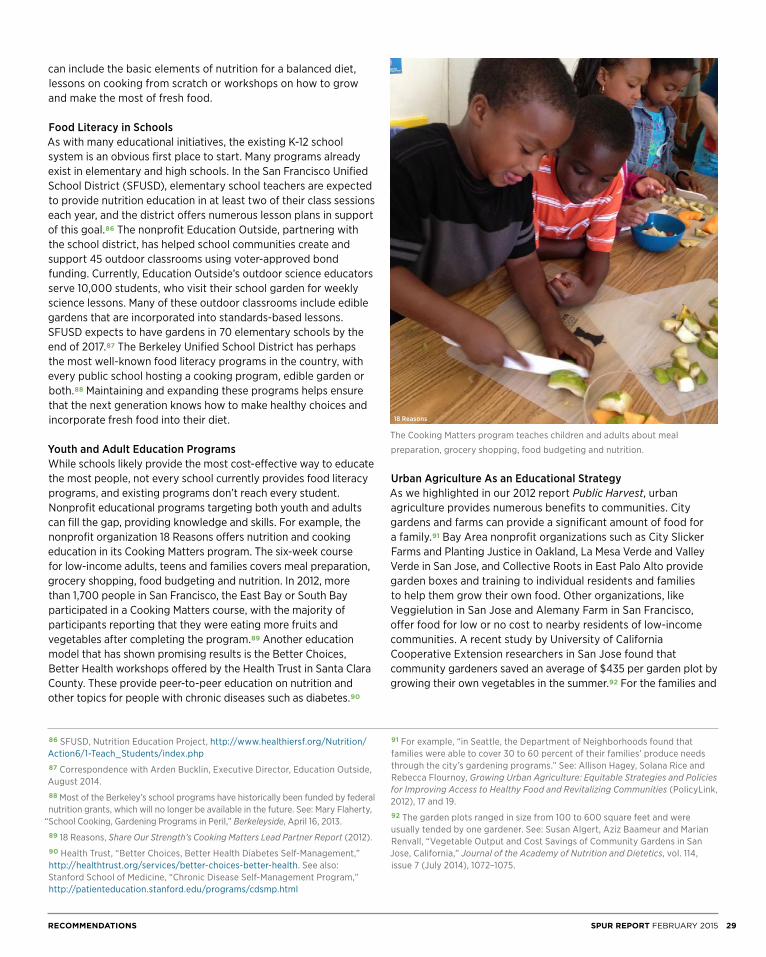
can include the basic elements of nutrition for a balanced diet, lessons on cooking from scratch or workshops on how to grow and make the most of fresh food.
Food Literacy in Schools As with many educational initiatives, the existing K-12 school system is an obvious first place to start. Many programs already exist in elementary and high schools. In the San Francisco Unified School District (SFUSD), elementary school teachers are expected to provide nutrition education in at least two of their class sessions each year, and the district offers numerous lesson plans in support of this goal.86 The nonprofit Education Outside, partnering with the school district, has helped school communities create and support 45 outdoor classrooms using voter-approved bond funding. Currently, Education Outside’s outdoor science educators serve 10,000 students, who visit their school garden for weekly science lessons. Many of these outdoor classrooms include edible gardens that are incorporated into standards-based lessons. SFUSD expects to have gardens in 70 elementary schools by the end of 2017.87 The Berkeley Unified School District has perhaps the most well-known food literacy programs in the country, with every public school hosting a cooking program, edible garden or both.88 Maintaining and expanding these programs helps ensure that the next generation knows how to make healthy choices and incorporate fresh food into their diet.
Youth and Adult Education ProgramsWhile schools likely provide the most cost-effective way to educate the most people, not every school currently provides food literacy programs, and existing programs don’t reach every student. Nonprofit educational programs targeting both youth and adults can fill the gap, providing knowledge and skills. For example, the nonprofit organization 18 Reasons offers nutrition and cooking education in its Cooking Matters program. The six-week course for low-income adults, teens and families covers meal preparation, grocery shopping, food budgeting and nutrition. In 2012, more than 1,700 people in San Francisco, the East Bay or South Bay participated in a Cooking Matters course, with the majority of participants reporting that they were eating more fruits and vegetables after completing the program.89 Another education model that has shown promising results is the Better Choices, Better Health workshops offered by the Health Trust in Santa Clara County. These provide peer-to-peer education on nutrition and other topics for people with chronic diseases such as diabetes.90
Urban Agriculture As an Educational Strategy As we highlighted in our 2012 report Public Harvest, urban agriculture provides numerous benefits to communities. City gardens and farms can provide a significant amount of food for a family.91 Bay Area nonprofit organizations such as City Slicker Farms and Planting Justice in Oakland, La Mesa Verde and Valley Verde in San Jose, and Collective Roots in East Palo Alto provide garden boxes and training to individual residents and families to help them grow their own food. Other organizations, like Veggielution in San Jose and Alemany Farm in San Francisco, offer food for low or no cost to nearby residents of low-income communities. A recent study by University of California Cooperative Extension researchers in San Jose found that community gardeners saved an average of $435 per garden plot by growing their own vegetables in the summer.92 For the families and
86 SFUSD, Nutrition Education Project, http://www.healthiersf.org/Nutrition/Action6/1-Teach_Students/index.php87 Correspondence with Arden Bucklin, Executive Director, Education Outside, August 2014.88 Most of the Berkeley’s school programs have historically been funded by federal nutrition grants, which will no longer be available in the future. See: Mary Flaherty,
“School Cooking, Gardening Programs in Peril,” Berkeleyside, April 16, 2013.89 18 Reasons, Share Our Strength’s Cooking Matters Lead Partner Report (2012). 90 Health Trust, “Better Choices, Better Health Diabetes Self-Management,” http://healthtrust.org/services/better-choices-better-health. See also: Stanford School of Medicine, “Chronic Disease Self-Management Program,” http://patienteducation.stanford.edu/programs/cdsmp.html
91 For example, “in Seattle, the Department of Neighborhoods found that families were able to cover 30 to 60 percent of their families’ produce needs through the city’s gardening programs.” See: Allison Hagey, Solana Rice and Rebecca Flournoy, Growing Urban Agriculture: Equitable Strategies and Policies for Improving Access to Healthy Food and Revitalizing Communities (PolicyLink, 2012), 17 and 19.92 The garden plots ranged in size from 100 to 600 square feet and were usually tended by one gardener. See: Susan Algert, Aziz Baameur and Marian Renvall, “Vegetable Output and Cost Savings of Community Gardens in San Jose, California,” Journal of the Academy of Nutrition and Dietetics, vol. 114, issue 7 (July 2014), 1072–1075.
The Cooking Matters program teaches children and adults about meal preparation, grocery shopping, food budgeting and nutrition.
18 Reasons
RECOMMENDATIONS 29SPUR REPORT FEBRUARY 2015

individuals connected with these programs, urban agriculture can improve both their physical and economic access to healthy food. However, at a neighborhood scale, urban agriculture — especially in dense areas like the Bay Area’s central cities — is not able to meet the nutritional needs of thousands of people in a cost-effective way relative to a grocery store. Instead, urban agriculture’s value in regard to food access at this scale is its ability to increase knowledge of what healthy food is — by offering residents the opportunity to cultivate it, understand seasonality, and sample new tastes and ingredients. To assist residents who want to grow food for themselves, cities and counties can offer public land directly or support nonprofit organizations that promote backyard growing. And, when evaluating other types of urban agriculture programs for their food access benefits, policymakers should focus on how well the program increases knowledge of healthy eating, as well as other community benefits, rather than on the number of people it will feed.
Fruit and Vegetable Prescription Programs In recent years, a number of health-care providers have partnered with food access advocates on a strategy to encourage fruit and vegetable consumption by issuing prescriptions for healthier eating along with vouchers to help purchase fresh produce. These programs address both educational and economic access simultaneously. In multiple cities in the Bay Area, the organization Fresh Approach, which is affiliated with the Pacific Coast Farmers’ Market Association, offers workshops on nutrition, cooking and active living for adults and youth with weight-related diagnoses, who are referred to the program by local health-care clinics.
Alongside the educational workshops, the program provides each participant with vouchers for $7 per person in their household per week, which are redeemable at farmers’ markets. In 2013, Fresh Approach found modest reductions in weight among its 100 adult participants but no similar reduction among the 74 youth participants.93 Nationally, Wholesome Wave, a nonprofit organization, has sponsored a prescription program in multiple cities with a similar program design and voucher amount. An evaluation of their program from 2011 to 2013 found that over half of the participants reported increasing their consumption of fruits and vegetables and that approximately 40 percent reduced their body mass index (a measure of body fat based on height and weight) during the program. Further study is needed to know if these positive impacts continue after the program.94
93 Wendy Constantine et al., Fresh Approach’s VeggieRx Program 2013 Program Year Report: A Formative Evaluation (Research and Evaluation Systems, May 1, 2014), http://freshapproach.org/wp-content/uploads/2014/05/VeggieRx-Report-2013.pdf. The report also highlighted that 50 people who were given a prescription to participate in VeggieRx in the same time period — or slightly more than 20 percent of all prescription recipients — never attended a workshop or received vouchers. 94 Wholesome Wave, Wholesome Wave’s Fruit and Vegetable Prescription Program: 2013 Report (October 2014), 14, http://www.wholesomewave.org/our-initiatives/fruit-and-vegetable-prescription-program/fvrx-data-and-publications. A 2005 meta-study indicated that programs directly promoting fruit and vegetable consumption through education are most effective when targeted to populations already at risk of disease. See: Joceline Pomerleau et al., “Interventions Designed to Increase Adult Fruit and Vegetable Intake Can Be Effective: A Systematic Review of the Literature,” Journal of Nutrition, vol. 135, no. 10 (October 2005).
Valley Verde, based in San Jose, provides garden boxes and training to individuals and families to help them grow their own food.
Valley Verde
30 SPUR REPORT FEBRUARY 2015 HEALTHY FOOD WITHIN REACH
STRATEGY 5
Reduce demand for unhealthy food while increasing demand for healthier options
Improving food access requires overcoming the four barriers of physical, economic, educational and cultural access. The overarching goals of improving public health and a community’s food environment, however, are heavily influenced not only by the absolute demand for healthier food but also by how strong that demand is relative to that for unhealthy food.95 Improving residents’ access to an apple is important, but we must also think about that apple in the context of a sea of potato chips, candy, soda and other junk food. There is only so much food a person will purchase and consume, and what they choose has an impact on their health and on what is offered in their community — especially when healthy food displaces unhealthy food in their diet. In addition to supporting the strategies outlined above to help residents find, afford and choose nutritious food, policymakers should complement these efforts with policies that reduce demand for unhealthy options.96
Recommendation 9: Limit or prohibit the sales and marketing of unhealthy food in environments frequented by children, especially at facilities that receive government funding.
Who: Boards of supervisors, school districts, planning departments, recreation and parks departments
“Marketing works.” Those opening words of the Institute of Medicine’s report Food Marketing to Children and Youth capture a fact that is both commonly understood and supported by research.97 And marketing unhealthy food to youth is not only effective — it is pervasive. An article in the 2009 Annual Review of
Incorporating Cultural Food Preferences Into All Food Access Strategies
Even if someone can find, afford and make a healthy diet choice, it’s no guarantee that they will. Sometimes this is because of a cultural barrier: The healthy and available option is unfamiliar or unappetizing. As policymakers develop programs to improve healthy food access, they should keep in mind that food choices are driven by taste, not just cost and availability. For example, the SF-Marin Food Bank traditionally distributed cranberry sauce to its clients before Thanksgiving. But they found that many of their clients from Asian immigrant families were not choosing to bring the sauce home. After soliciting feedback from their clients, the Food Bank began offering other options such as fermented black bean sauce or soy sauce as a Thanksgiving option, which are more popular condiments for many of these clients.98 While this is a small example, it illustrates how tailoring programs to match the cultural preferences of clients has allowed the Food Bank to serve more people and have a greater impact on reducing hunger and food insecurity. Similarly, a Santa Clara County Public Health Department survey in fall 2013 found that a number of elementary and middle school students reported that their favorite part of their school’s salad bar was being able to make fruit with chili powder and jicama with lemon juice. They were creatively adapting a traditional salad bar to better meet their food preferences, which also increased their interest in eating the fruits and vegetables offered at school.99
The federal school meals program could better serve its students if it were more flexible in its offerings. Specifically, USDA guidelines mandate that schools participating in the federal school meals program must offer milk as an option and that each meal must meet certain nutritional requirements. As a result, in many districts, milk is the only beverage offered alongside the meal, and students are often encouraged to take it. Students who are lactose-intolerant or who come from families where milk is not a common beverage often discard the milk. While school districts are allowed to offer nondairy alternatives generally
— and are required to do so when students have submitted a doctor’s note explaining their special dietary needs — it is often more expensive for the district to provide these options, and therefore they’re not commonly offered.100 By discounting the fact that not all students want to drink milk, the USDA guidelines lead to wasted milk (and money), and as a result, some students eat a less nutritious meal. In short, one menu does not fit all. What works for one group of clients or customers may not work in another location or program. Food access programs that recognize the importance of cultural preference in determining food choice are the most likely to succeed.
95 As the Institute of Medicine notes, “Unhealthy foods and beverages displace the consumption of foods recommended in the Dietary Guidelines for Americans and may lead to the development of obesity” and other diet-related disease, especially when consumed in large amounts. See: Institute of Medicine, Accelerating the Progress in Obesity Prevention: Solving the Weight of the Nation, 11. 96 For a good overview of the importance of focusing on the demand for healthy and unhealthy food, see: Michele Ver Ploeg, “Food Environment, Food Store Access, Consumer Behavior and Diet,” CHOICES: The Magazine of Food, Farm, and Resource Issues, vol. 25, no. 3 (2010). 97 Institute of Medicine, Food Marketing to Children and Youth: Threat or Opportunity? (Washington, DC: The National Academies Press, 2006), xiii.98 Correspondence with Teri Olle, Associate Director of Policy and Advocacy, SF-Marin Food Bank, August 2014.99 Santa Clara County Public Health Department, “Santa Clara County Salad Bar Initiative Evaluation” (April 2014) and correspondence with Jaime Flores, Santa Clara County Public Health Department, October 2014.100 Monica Eng, “Lactose Intolerance: When Drinking School Milk Makes Students Feel Sick,” Chicago Tribune, November 26, 2012, http://articles.chicagotribune.com/2012-11-26/health/ct-met-school-milk-lactose-intolerance-20121126_1_lactose-intolerance-soy-milk-school-milk
RECOMMENDATIONS 31SPUR REPORT FEBRUARY 2015
Public Health noted, “In the United States, more than 98 percent of the television food ads seen by children and 89 percent of those seen by adolescents are for products high in fat, sugar and/or sodium” and “other studies show high levels of calorie-dense, low-nutrient foods promoted to children in other types of marketing, including marketing in schools, on children’s Web sites and in magazines.”101 The federal government is best positioned to regulate food marketing to children through mass media, but local governments can also take steps. The most straightforward policy tool for local governments is to prohibit or limit what is sold and marketed on public property or in places that receive government funding, such as schools, parks, museums and zoos. The San Francisco Unified School District, for example, has prohibited the use of commercially branded instructional material in classrooms and also banned the sale of soda and unhealthy items on school property.102 Cities throughout California have crafted nutritional guidelines for what is sold in vending machines on their property, with varying degrees of stringency.103 Through contracts with concessionaires and their own operations, local agencies can also support healthier eating by limiting sales of unhealthy food. A lighter-touch option is to make healthy choices more convenient than unhealthy choices. Recent studies by behavioral economists, in an initiative called Smarter Lunchrooms, indicate that small changes such as offering at least one lunch line with only healthier items or improving the marketing of healthy items can improve students’ food choices. 104
Recommendation 10: Engage selectively in publicly funded marketing campaigns.
Who: Public health departments
It’s tempting to counteract industry marketing of unhealthy food by fighting fire with fire and using marketing to promote healthy eating. Local public health departments, however, should be careful in putting resources toward marketing campaigns, because their marketing efforts can be drowned out by the food
industry’s advertising. Emphasizing this David-versus-Goliath dynamic, the Institute of Medicine notes that “in 2005 children aged 8–12 saw an average of 158 public service announcements on fitness or nutrition in that one year compared with 7,609 ads for foods and beverages, or about 1 hour and 15 minutes of messages about fitness or nutrition compared with more than 50 hours of messages promoting food and beverage consumption.”105
Despite the imbalance of marketing budgets, research indicates that some marketing campaigns to improve nutrition have been effective, especially when coupled with other efforts to increase food access or when targeted at people with health issues.106 In an evaluation of the Bay Area’s multi-county “Soda Free Summer” campaign in 2008, for example, 44 percent of survey respondents reported reducing their soda consumption following the start of the campaign.107 However, marketing campaigns are often less successful in creating long-lasting changes in behavior after they end.108
Recommendation 11: Tax sugar-sweetened beverages to decrease consumption and generate revenue for initiatives addressing diet-related disease and food access.
Who: Boards of supervisors, city councils
Sugar-sweetened beverages are the single largest source of sugar for American adults and children, and their consumption is associated with diet-related disease.109 As noted earlier, these diseases not only harm individuals but also burden the public health system with increased hospitalizations and treatment costs. The San Francisco Budget and Legislative Analyst estimates that San Franciscans pay $41 million to $61 million annually through public and private health-care costs for obesity and diabetes treatment that is attributable to sugar-sweetened beverages. The analyst further estimated that city agencies spend $6 million to $28 million annually for health-care costs attributable to sugary drinks.110
101 Jennifer L. Harris et al., “A Crisis in the Marketplace: How Food Marketing Contributes to Childhood Obesity and What Can Be Done,” Annual Review of Public Health, vol. 30 (2009), 213.102 SFUSD, Commercial Free Schools Act, Resolution 95-25A6, June 22, 1999, http://peachsf.org/wp-content/uploads/2011/02/ResolutionNo95-25A6.pdf; and SFUSD Wellness Policy as updated in June 2007, accessed August 2014, http://www.sfusd.edu/en/assets/sfusd-staff/nutrition-and-meals/files/SFUSDWellness.pdf. As cited in: Marlene B. Schwartz and Amy Ustjanauskas,
“Food Marketing to Youth: Current Threats and Opportunities,” Childhood Obesity, vol. 8, no. 2 (April 2012).103 For example, Santa Clara County has clear nutritional guidelines for what can be served in the county’s meetings, vending machines, cafeterias and institutions; see: http://www.sccgov.org/sites/sccphd/en-us/Newsandevents/Pages/County-Improves-Nutrition-Standards.aspx. See also: California Center for Public Health Advocacy, Local Beverage Policies Adopted by California Cities and Counties (July 6, 2013).104 Andrew Hanks, David Just and Brian Wansink, “Smarter Lunchrooms Can Address New School Lunchroom Guidelines and Childhood Obesity,” Journal of Pediatrics, vol. 162, no. 4 (2013), 867–869; Andrew Hanks, David Just, Laura
Smith and Brian Wansink, “Healthy Convenience: Nudging Students Toward Healthier Choices in the Lunchroom,” Journal of Public Health (January 2012), 1–7.105 Institute of Medicine, Accelerating the Progress in Obesity Prevention: Solving the Weight of the Nation, 244. 106 Melanie Wakefield, Barbara Loken and Robert Hornik, “Use of Mass Media Campaigns to Change Health Behavior,” Lancet, vol. 376 (October 9, 2010), 1265.107 Lisa Craypo and Mariah Lafleur, Getting the Soda Free Message (Samuels & Associates for the Bay Area Nutrition and Physical Activity Collaborative, April 2009), http://www.banpac.org/sugar_savvy_curr/banpac_soda_free_report_12_10_09.pdf108 Institute of Medicine, Accelerating the Progress in Obesity Prevention: Solving the Weight of the Nation, 244. 109 Susan H. Babey et al., Still Bubbling Over: California Adolescents Drinking More Soda and Other Sugar-Sweetened Beverages (UCLA Center for Health Policy Research, October 2013).110 Budget and Legislative Analyst, City and County of San Francisco, Updated Study of the Health and Financial Impacts Caused by High Consumption of Sugar-Sweetened Beverages (December 12, 2013), http://www.sfbos.org/Modules/ShowDocument.aspx?documentid=47337
32 SPUR REPORT FEBRUARY 2015 HEALTHY FOOD WITHIN REACH
The aim of taxing sugar-sweetened beverages is to increase their price and, by extension, reduce overall consumption of those beverages. A report by University of California, San Francisco researchers estimated that a one-cent-per-ounce tax on sugar-sweetened beverages would result in a 15 percent decrease in consumption by adults and that higher taxes would result in greater decreases.111 An analysis by the San Francisco Controller’s Office estimated that a two-cents-per-ounce tax in San Francisco could result in a decrease in consumption of up to 31 percent.112 Preliminary data from Mexico, which instituted a sugar-sweetened beverage tax in January 2014, indicates a 10 percent reduction in purchases of sugary drinks.113 While many other factors (such as overall diet, physical activity and exercise) influence diet-related public health, there is convincing evidence that liquid sugar is especially pernicious and merits a specific policy intervention. Though sugar-sweetened beverage taxes are regressive (because they place a greater cost burden on lower-income individuals than on those with higher-incomes), the revenue generated by the tax should be targeted to serve communities that are disproportionately affected by diet-related disease. Sugar-sweetened beverage taxes would be better implemented at the state or federal level, but after a decade of failed attempts to pass such legislation in Sacramento, it is reasonable for local governments to propose taxes to discourage unhealthy beverage consumption while also raising revenue to support the food access initiatives recommended in this report. Getting voters to tax themselves is not easy. Dozens of soda-tax proposals in American states and cities in the past decade have failed to pass. However, in November 2014, Berkeley voters overwhelmingly approved a one-cent-per-ounce tax on sugar-sweetened beverages, with 76 percent of the vote. During that same election, a two-cents-per-ounce tax proposal in San Francisco also gained 56 percent of the vote, though it did not pass because it required a two-thirds majority.114 Advocates of the taxes see this majority support in two cities as a sign that these taxes are gaining public approval and could pass in other cities or states in the near future.115
STRATEGY 6
Support research that evaluates and improves food access initiatives
Recommendation 12: Partner with local academic institutions to evaluate food access programs, and give preference to projects that include robust evaluation.
Who: Public health departments, social service agencies, planning departments, economic development agencies, school districts
During our review of policy tools that address food access, the task force found it difficult to evaluate the efficacy of a number of these initiatives — especially when it came to long-term public health impacts and cost-effectiveness. Other researchers have noted how hard it is to find evaluations that include control groups and follow-up studies to assess more than just the program’s immediate impact on participants.116 This type of rigorous evaluation is difficult for most local government agencies and nonprofits to conduct and usually requires an academic partner, long time frame and significant budget. Where possible, agencies should encourage partnerships that result in rigorous program evaluation so that they can prioritize new funding for the most cost-effective programs and improve existing programs. In the Bay Area, a number of academic institutions already have mechanisms to establish partnerships with local governments and community groups to evaluate food-related issues, including:
• Office of University Community Partnerships, University of California, San Francisco
• Office of Community Health, Stanford School of Medicine
• Center for Family and Community Health, University of California, Berkeley
• Center for Weight and Health, University of California, Berkeley
While this list is by no means comprehensive, it illustrates that there are existing resources among world-class institutions that could — and should — be used to further refine city and county efforts to address food access.
111 Y. Claire Wang et al., “A Penny-Per-Ounce Tax on Sugar-Sweetened Beverages Would Cut Health and Cost Burdens of Diabetes,” Health Affairs, vol. 31, no. 1 (January 2012), http://www.scribd.com/doc/179457124/A-Penny-Per-Ounce-Tax-On-Sugar-Sweetened-Beverages112 Office of the Controller, Office of Economic Analysis, City and County of San Francisco, “Tax on Sugar-Sweetened Beverages to Fund Food and Health Programs” (July 14, 2014), 21, http://openbook.sfgov.org/webreports/details3.aspx?id=1770113 Instituto Nacional De Salud Pública de México, “Resultados Preliminares Sobre los Efectos del Impuesto de un Peso a Bebidas Azucaradas en México,” accessed November 6, 2014, http://www.insp.mx/epppo/blog/preliminares-bebidas-azucaradas.html114 Alameda County Registrar of Voters, “Unofficial Election Results for Measure D – City of Berkeley,” accessed November 17, 2014, http://www.acgov.
org/rov/current_election/226/index.htm; and San Francisco Department of Elections, “November 4, 2014 Unofficial Election Results (Local Measure E),” accessed November 17, 2014, http://www.sfelections.org/results/20141104115 Helena Bottemiller Evich, “Berkeley Breaks Through on Soda Tax,” Politico, November 5, 2014 (updated November 9, 2014), http://www.politico.com/story/2014/11/berkeley-breaks-through-on-soda-tax-112570.html. For an example of model legislation, see: ChangeLab Solutions, “Model Sugar-Sweetened Beverage Tax Legislation,” http://changelabsolutions.org/publications/ssb-model-tax-legislation116 Linda Cobiac, Theo Vos and Lennert Veerman, “Cost-Effectiveness of Interventions to Promote Fruit and Vegetable Consumption,” PLOS ONE, vol. 5, no. 11 (2010): e14148; and Joel Gittelsohn, Megan Rowan and Pretty Gadhoke,
“Interventions in Small Food Stores to Change the Food Environment, Improve Diet, and Reduce Risk of Chronic Disease,” Preventing Chronic Disease, vol. 9 (2012).
RECOMMENDATIONS 33SPUR REPORT FEBRUARY 2015

Plan of Action for Local Governments
City and county agencies should not try to address food access by themselves, nor do they necessarily need to lead all the initiatives described below. While we have targeted our recommendations to city and county governments, all of the actions we propose should involve other community stakeholders. Local merchant associations, food banks, nonprofit educators, food policy councils and similar groups are important partners. The government may be the best leader in some cases, but in others, including those related to emergency food assistance programs and education, the nongovernmental groups may be in the best position to spearhead an effort in partnership with local government agencies.
Recommendations Organized by Implementing Agency
Implementing Agency
Recommendation Rec. #
Boards of supervisors and city councils
Maximize enrollment in federally funded food assistance programs.
2
Support long-term funding for healthy food incentive programs. 3
Use zoning thoughtfully to shape food retail options. 5
Limit or prohibit the sales and marketing of unhealthy food in environments frequented by children, especially at facilities that receive government funding.
9
Tax sugar-sweetened beverages to decrease consumption and generate revenue for initiatives addressing diet-related disease and food access.
11
Public health departments
Conduct an assessment or use existing data to develop a targeted set of food access programs and initiatives.
1
Maximize enrollment in federally funded food assistance programs.
2
Tailor grocery store attraction and corner-store conversion initiatives at the neighborhood level.
4
Link public financial assistance for food retailers with requirements that they offer healthy options.
6
Support food pantries and emergency food assistance for those who cannot afford, or are not able, to shop at food retailers.
7
Support educational initiatives promoting food literacy and encourage their integration into existing food access programs.
8
Engage selectively in publicly funded marketing campaigns. 10
Partner with local academic institutions to evaluate food access programs, and give preference to projects that include robust evaluation.
12
34 SPUR REPORT FEBRUARY 2015 HEALTHY FOOD WITHIN REACH

Implementing Agency
Recommendation Rec. #
Social service agencies
Maximize enrollment in federally funded food assistance programs.
2
Support long-term funding for healthy food incentive programs. 3
Support food pantries and emergency food assistance for those who cannot afford, or are not able, to shop at food retailers.
7
Partner with local academic institutions to evaluate food access programs, and give preference to projects that include robust evaluation.
12
Planning departments
Tailor grocery store attraction and corner-store conversion initiatives at the neighborhood level.
4
Use zoning thoughtfully to shape food retail options. 5
Limit or prohibit the sales and marketing of unhealthy food in environments frequented by children, especially at facilities that receive government funding.
9
Partner with local academic institutions to evaluate food access programs, and give preference to projects that include robust evaluation.
12
School districts
Maximize enrollment in federally funded food assistance programs.
2
Support educational initiatives promoting food literacy and encourage their integration into existing food access programs.
8
Limit or prohibit the sales and marketing of unhealthy food in environments frequented by children, especially at facilities that receive government funding.
9
Partner with local academic institutions to evaluate food access programs, and give preference to projects that include robust evaluation.
12
Economic development agencies
Tailor grocery store attraction and corner-store conversion initiatives at the neighborhood level.
4
Link public financial assistance for food retailers with requirements that they offer healthy options.
6
Partner with local academic institutions to evaluate food access programs, and give preference to projects that include robust evaluation.
12
Recreation and parks departments
Support educational initiatives promoting food literacy and encourage their integration into existing food access programs.
8
Limit or prohibit the sales and marketing of unhealthy food in environments frequented by children, especially at facilities that receive government funding.
9
PLAN OF ACTION FOR LOCAL GOVERNMENTS 35SPUR REPORT FEBRUARY 2015
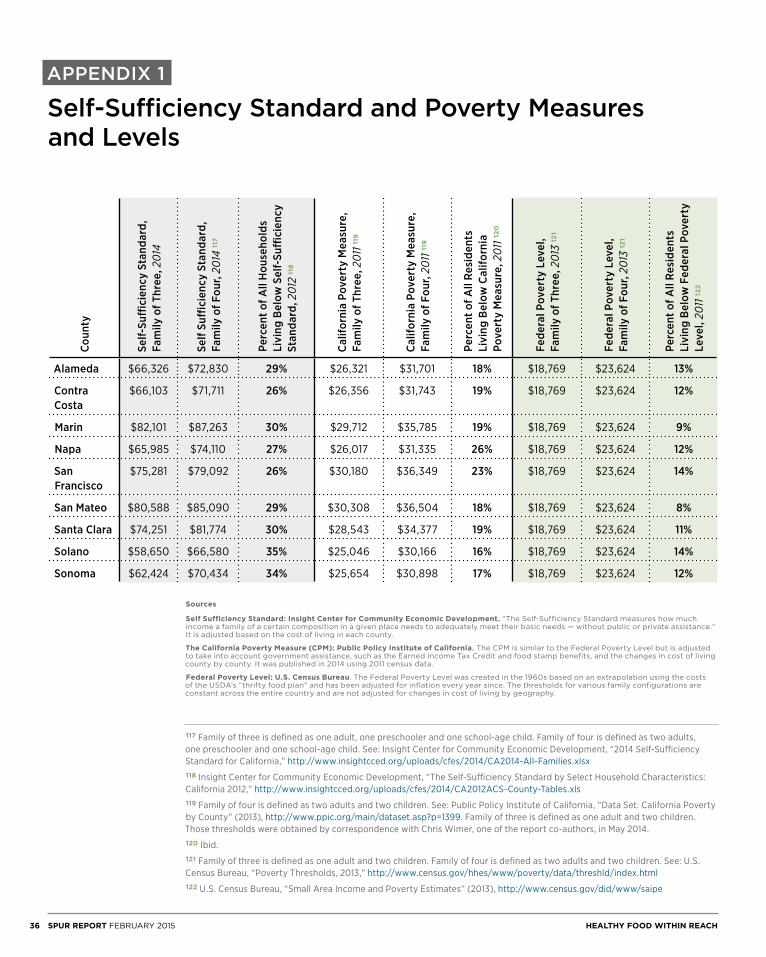
APPENDIX 1
Self-Sufficiency Standard and Poverty Measures and Levels
Sources
Self Sufficiency Standard: Insight Center for Community Economic Development. “The Self-Sufficiency Standard measures how much income a family of a certain composition in a given place needs to adequately meet their basic needs — without public or private assistance.” It is adjusted based on the cost of living in each county.
The California Poverty Measure (CPM): Public Policy Institute of California. The CPM is similar to the Federal Poverty Level but is adjusted to take into account government assistance, such as the Earned Income Tax Credit and food stamp benefits, and the changes in cost of living county by county. It was published in 2014 using 2011 census data.
Federal Poverty Level: U.S. Census Bureau. The Federal Poverty Level was created in the 1960s based on an extrapolation using the costs of the USDA’s “thrifty food plan” and has been adjusted for inflation every year since. The thresholds for various family configurations are constant across the entire country and are not adjusted for changes in cost of living by geography.
117 Family of three is defined as one adult, one preschooler and one school-age child. Family of four is defined as two adults, one preschooler and one school-age child. See: Insight Center for Community Economic Development, “2014 Self-Sufficiency Standard for California,” http://www.insightcced.org/uploads/cfes/2014/CA2014-All-Families.xlsx118 Insight Center for Community Economic Development, “The Self-Sufficiency Standard by Select Household Characteristics: California 2012,” http://www.insightcced.org/uploads/cfes/2014/CA2012ACS-County-Tables.xls119 Family of four is defined as two adults and two children. See: Public Policy Institute of California, “Data Set: California Poverty by County” (2013), http://www.ppic.org/main/dataset.asp?p=1399. Family of three is defined as one adult and two children. Those thresholds were obtained by correspondence with Chris Wimer, one of the report co-authors, in May 2014.120 Ibid. 121 Family of three is defined as one adult and two children. Family of four is defined as two adults and two children. See: U.S. Census Bureau, “Poverty Thresholds, 2013,” http://www.census.gov/hhes/www/poverty/data/threshld/index.html122 U.S. Census Bureau, “Small Area Income and Poverty Estimates” (2013), http://www.census.gov/did/www/saipe
Coun
ty
Self-
Suffi
cien
cy S
tand
ard,
Fa
mily
of T
hree
, 201
4
Self
Suffi
cien
cy S
tand
ard,
Fa
mily
of F
our,
2014
117
Perc
ent o
f All
Hou
seho
lds
Livi
ng B
elow
Sel
f-Su
ffici
ency
St
anda
rd, 2
012
118
Calif
orni
a Po
vert
y M
easu
re,
Fam
ily o
f Thr
ee, 2
011 1
19
Calif
orni
a Po
vert
y M
easu
re,
Fam
ily o
f Fou
r, 20
11 11
9
Perc
ent o
f All
Resi
dent
s Li
ving
Bel
ow C
alifo
rnia
Po
vert
y M
easu
re, 2
011 1
20
Fede
ral P
over
ty L
evel
, Fa
mily
of T
hree
, 201
3 12
1
Fede
ral P
over
ty L
evel
, Fa
mily
of F
our,
2013
121
Perc
ent o
f All
Resi
dent
s Li
ving
Bel
ow F
eder
al P
over
ty
Leve
l, 20
11 12
2
Alameda $66,326 $72,830 29% $26,321 $31,701 18% $18,769 $23,624 13%
Contra Costa
$66,103 $71,711 26% $26,356 $31,743 19% $18,769 $23,624 12%
Marin $82,101 $87,263 30% $29,712 $35,785 19% $18,769 $23,624 9%
Napa $65,985 $74,110 27% $26,017 $31,335 26% $18,769 $23,624 12%
San Francisco
$75,281 $79,092 26% $30,180 $36,349 23% $18,769 $23,624 14%
San Mateo $80,588 $85,090 29% $30,308 $36,504 18% $18,769 $23,624 8%
Santa Clara $74,251 $81,774 30% $28,543 $34,377 19% $18,769 $23,624 11%
Solano $58,650 $66,580 35% $25,046 $30,166 16% $18,769 $23,624 14%
Sonoma $62,424 $70,434 34% $25,654 $30,898 17% $18,769 $23,624 12%
36 SPUR REPORT FEBRUARY 2015 HEALTHY FOOD WITHIN REACH
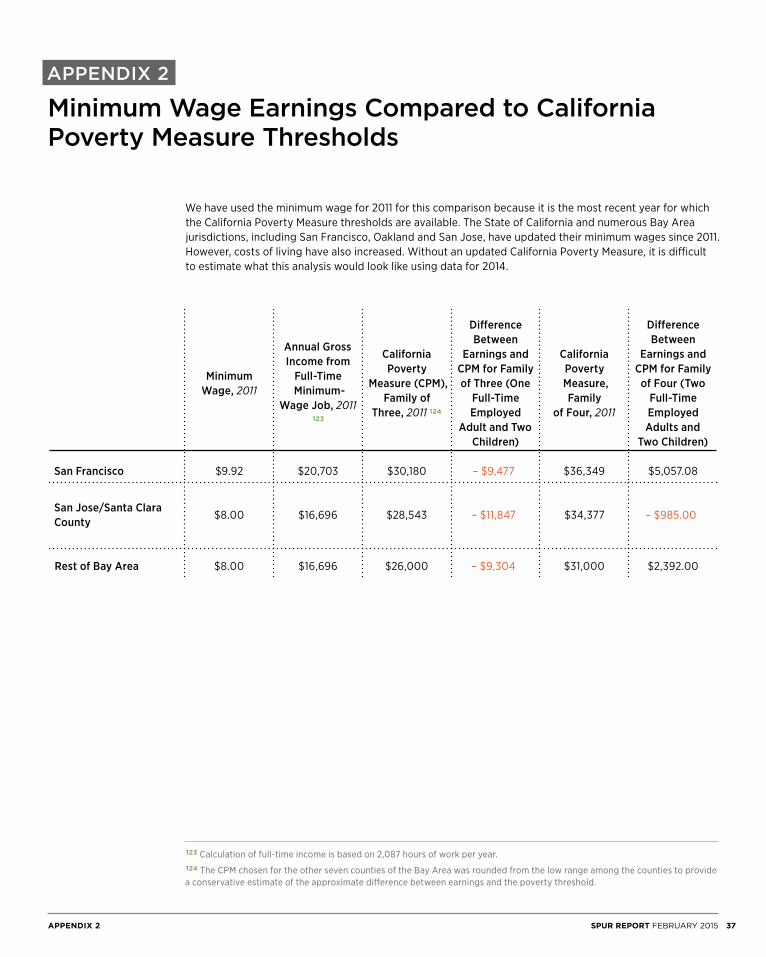
APPENDIX 2
Minimum Wage Earnings Compared to California Poverty Measure Thresholds
We have used the minimum wage for 2011 for this comparison because it is the most recent year for which the California Poverty Measure thresholds are available. The State of California and numerous Bay Area jurisdictions, including San Francisco, Oakland and San Jose, have updated their minimum wages since 2011. However, costs of living have also increased. Without an updated California Poverty Measure, it is difficult to estimate what this analysis would look like using data for 2014.
123 Calculation of full-time income is based on 2,087 hours of work per year.124 The CPM chosen for the other seven counties of the Bay Area was rounded from the low range among the counties to provide a conservative estimate of the approximate difference between earnings and the poverty threshold.
Minimum Wage, 2011
Annual Gross Income from
Full-Time Minimum-
Wage Job, 2011 123
California Poverty
Measure (CPM), Family of
Three, 2011 124
Difference Between
Earnings and CPM for Family of Three (One
Full-Time Employed
Adult and Two Children)
California Poverty Measure, Family
of Four, 2011
Difference Between
Earnings and CPM for Family of Four (Two
Full-Time Employed Adults and
Two Children)
San Francisco $9.92 $20,703 $30,180 – $9,477 $36,349 $5,057.08
San Jose/Santa Clara County $8.00 $16,696 $28,543 – $11,847 $34,377 – $985.00
Rest of Bay Area $8.00 $16,696 $26,000 – $9,304 $31,000 $2,392.00
37SPUR REPORT FEBRUARY 2015APPENDIX 2
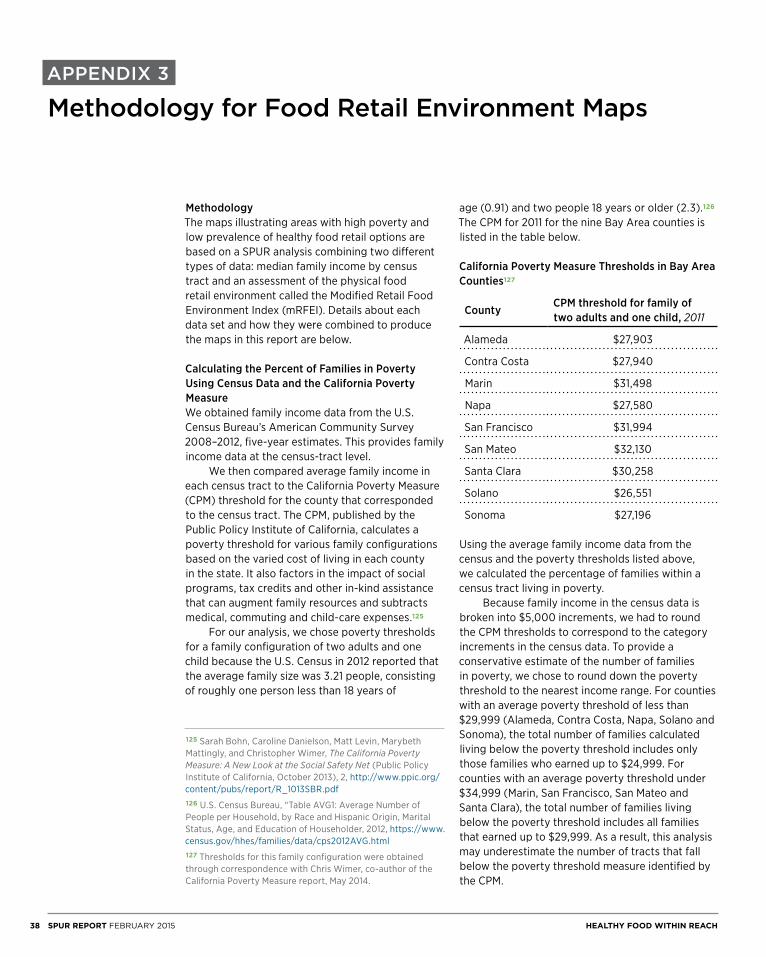
APPENDIX 3
Methodology for Food Retail Environment Maps
MethodologyThe maps illustrating areas with high poverty and low prevalence of healthy food retail options are based on a SPUR analysis combining two different types of data: median family income by census tract and an assessment of the physical food retail environment called the Modified Retail Food Environment Index (mRFEI). Details about each data set and how they were combined to produce the maps in this report are below.
Calculating the Percent of Families in Poverty Using Census Data and the California Poverty Measure We obtained family income data from the U.S. Census Bureau’s American Community Survey 2008–2012, five-year estimates. This provides family income data at the census-tract level. We then compared average family income in each census tract to the California Poverty Measure (CPM) threshold for the county that corresponded to the census tract. The CPM, published by the Public Policy Institute of California, calculates a poverty threshold for various family configurations based on the varied cost of living in each county in the state. It also factors in the impact of social programs, tax credits and other in-kind assistance that can augment family resources and subtracts medical, commuting and child-care expenses.125
For our analysis, we chose poverty thresholds for a family configuration of two adults and one child because the U.S. Census in 2012 reported that the average family size was 3.21 people, consisting of roughly one person less than 18 years of
age (0.91) and two people 18 years or older (2.3).126 The CPM for 2011 for the nine Bay Area counties is listed in the table below.
California Poverty Measure Thresholds in Bay Area Counties127
Using the average family income data from the census and the poverty thresholds listed above, we calculated the percentage of families within a census tract living in poverty. Because family income in the census data is broken into $5,000 increments, we had to round the CPM thresholds to correspond to the category increments in the census data. To provide a conservative estimate of the number of families in poverty, we chose to round down the poverty threshold to the nearest income range. For counties with an average poverty threshold of less than $29,999 (Alameda, Contra Costa, Napa, Solano and Sonoma), the total number of families calculated living below the poverty threshold includes only those families who earned up to $24,999. For counties with an average poverty threshold under $34,999 (Marin, San Francisco, San Mateo and Santa Clara), the total number of families living below the poverty threshold includes all families that earned up to $29,999. As a result, this analysis may underestimate the number of tracts that fall below the poverty threshold measure identified by the CPM.
County CPM threshold for family of two adults and one child, 2011
Alameda $27,903
Contra Costa $27,940
Marin $31,498
Napa $27,580
San Francisco $31,994
San Mateo $32,130
Santa Clara $30,258
Solano $26,551
Sonoma $27,196
125 Sarah Bohn, Caroline Danielson, Matt Levin, Marybeth Mattingly, and Christopher Wimer, The California Poverty Measure: A New Look at the Social Safety Net (Public Policy Institute of California, October 2013), 2, http://www.ppic.org/content/pubs/report/R_1013SBR.pdf126 U.S. Census Bureau, “Table AVG1: Average Number of People per Household, by Race and Hispanic Origin, Marital Status, Age, and Education of Householder, 2012, https://www.census.gov/hhes/families/data/cps2012AVG.html127 Thresholds for this family configuration were obtained through correspondence with Chris Wimer, co-author of the California Poverty Measure report, May 2014.
38 SPUR REPORT FEBRUARY 2015 HEALTHY FOOD WITHIN REACH
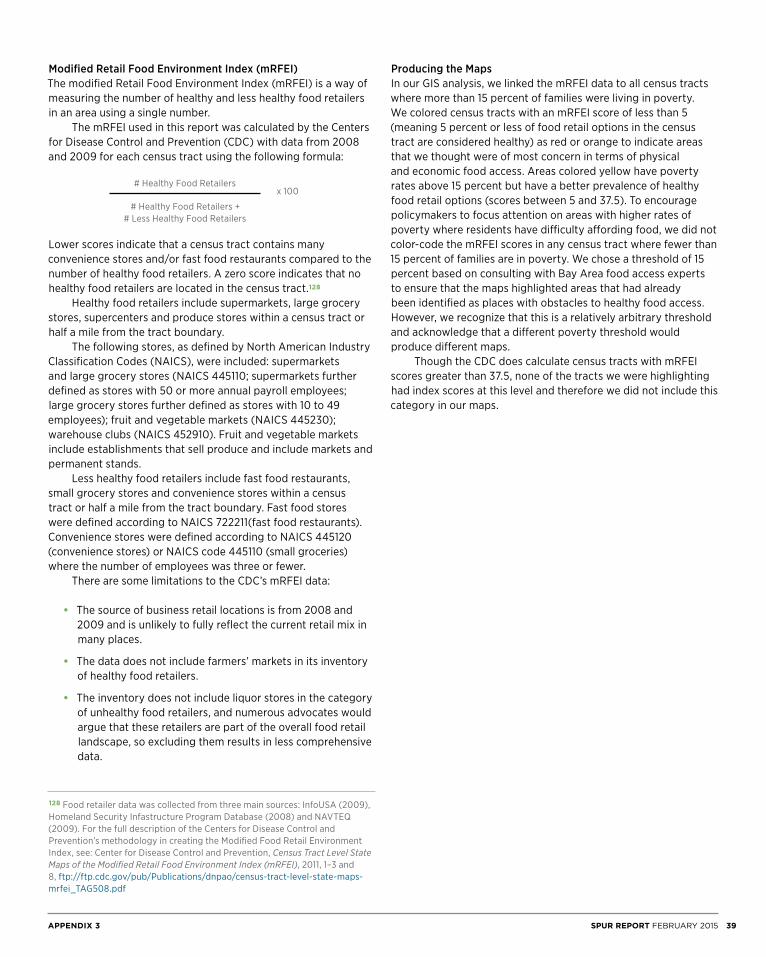
Modified Retail Food Environment Index (mRFEI)The modified Retail Food Environment Index (mRFEI) is a way of measuring the number of healthy and less healthy food retailers in an area using a single number. The mRFEI used in this report was calculated by the Centers for Disease Control and Prevention (CDC) with data from 2008 and 2009 for each census tract using the following formula:
Lower scores indicate that a census tract contains many convenience stores and/or fast food restaurants compared to the number of healthy food retailers. A zero score indicates that no healthy food retailers are located in the census tract.128
Healthy food retailers include supermarkets, large grocery stores, supercenters and produce stores within a census tract or half a mile from the tract boundary. The following stores, as defined by North American Industry Classification Codes (NAICS), were included: supermarkets and large grocery stores (NAICS 445110; supermarkets further defined as stores with 50 or more annual payroll employees; large grocery stores further defined as stores with 10 to 49 employees); fruit and vegetable markets (NAICS 445230); warehouse clubs (NAICS 452910). Fruit and vegetable markets include establishments that sell produce and include markets and permanent stands. Less healthy food retailers include fast food restaurants, small grocery stores and convenience stores within a census tract or half a mile from the tract boundary. Fast food stores were defined according to NAICS 722211(fast food restaurants). Convenience stores were defined according to NAICS 445120 (convenience stores) or NAICS code 445110 (small groceries) where the number of employees was three or fewer. There are some limitations to the CDC’s mRFEI data:
• The source of business retail locations is from 2008 and 2009 and is unlikely to fully reflect the current retail mix in many places.
• The data does not include farmers’ markets in its inventory of healthy food retailers.
• The inventory does not include liquor stores in the category of unhealthy food retailers, and numerous advocates would argue that these retailers are part of the overall food retail landscape, so excluding them results in less comprehensive data.
Producing the MapsIn our GIS analysis, we linked the mRFEI data to all census tracts where more than 15 percent of families were living in poverty. We colored census tracts with an mRFEI score of less than 5 (meaning 5 percent or less of food retail options in the census tract are considered healthy) as red or orange to indicate areas that we thought were of most concern in terms of physical and economic food access. Areas colored yellow have poverty rates above 15 percent but have a better prevalence of healthy food retail options (scores between 5 and 37.5). To encourage policymakers to focus attention on areas with higher rates of poverty where residents have difficulty affording food, we did not color-code the mRFEI scores in any census tract where fewer than 15 percent of families are in poverty. We chose a threshold of 15 percent based on consulting with Bay Area food access experts to ensure that the maps highlighted areas that had already been identified as places with obstacles to healthy food access. However, we recognize that this is a relatively arbitrary threshold and acknowledge that a different poverty threshold would produce different maps. Though the CDC does calculate census tracts with mRFEI scores greater than 37.5, none of the tracts we were highlighting had index scores at this level and therefore we did not include this category in our maps.
128 Food retailer data was collected from three main sources: InfoUSA (2009), Homeland Security Infastructure Program Database (2008) and NAVTEQ (2009). For the full description of the Centers for Disease Control and Prevention’s methodology in creating the Modified Food Retail Environment Index, see: Center for Disease Control and Prevention, Census Tract Level State Maps of the Modified Retail Food Environment Index (mRFEI), 2011, 1–3 and 8, ftp://ftp.cdc.gov/pub/Publications/dnpao/census-tract-level-state-maps-mrfei_TAG508.pdf
# Healthy Food Retailersx 100
# Healthy Food Retailers + # Less Healthy Food Retailers
39SPUR REPORT FEBRUARY 2015APPENDIX 3
SPUR
654 Mission StreetSan Francisco, CA 94105tel. [email protected]
76 South First StreetSan Jose, CA 95113tel. [email protected]
c/o Impact Hub Oakland2323 BroadwayOakland CA, 94612tel. [email protected]
SPUR promotes good planning and good government through research, education and advocacy.
We are a member-supported nonprofit organization. Join us.
www.spur.org
Ideas + action for a better city