Embed Size (px)
Citation preview
Healthy Ohio Community Profiles
Fairfield County 2008
The Ohio Department of Health
2 Healthy Ohio Community Profile: Fairfield County
Acknowledgements
Suggested Citation
Ohio Department of Health. Healthy Ohio Community Profiles. Office of Healthy Ohio, Columbus, Ohio. December, 2008
For comments and information requests:
Office of Healthy Ohio Ohio Department of Health
246 North High Street Columbus, OH 43215
Phone: (614) 466-1663 Fax: (614) 644-0085
E-mail: [email protected] Website: http://www.HealthyOhioProgram.org
These profiles could not have been completed without the support, analytical and reviewing skills of many persons and programs throughout the Ohio Department of Health. Many thanks are due to the Office of Healthy Ohio for the leadership, vision, and funding for these profiles. The following pro-grams contributed data analyses, talking points, and thoughtful review: Office of Healthy Ohio, Office of Vital Statistics, Chronic Disease and Behavioral Epidemiology, Ohio Cancer Incidence and Surveil-lance System, School and Adolescent Health Program, Comprehensive Cancer Program, Primary Care Program, Office of Public Affairs, Injury Prevention Program, Heart Disease and Stroke Preven-tion Program, Tobacco Use Prevention and Cessation Program, Diabetes Prevention and Control Program, Division of Family and Community Health Services, and the Center for Health Promotion.
The Ohio Department of Health 3
Introduction
Fairfield County: At a Glance
Community health profiles can be important tools, useful in improving the health of a community through the information they provide to practitioners, public health officials and community members regarding specific information about their community. These profiles can be used to foster partnerships between physicians and community members, support program development and to improve the overall health of the community. Ohio is made up of 88 counties, each of which share similarities but also have unique characteristics that set them, and the communities within them, apart from each another. In Ohio, the burden of dis-ease and injury is not equally distributed across communities. Factors impacting a community’s disease and injury burden include socioeconomic status, access to health care, age distribution, and lifestyle behaviors. The purpose of this Healthy Ohio Community Profile is to assess the critical health issues among Fair-field County residents and compare them to the health issues facing Ohio’s total population. A special focus is placed on the leading causes of death and illness. Information is presented on death rates; prevalence of chronic disease risk factors; prevalence of heart disease, stroke, heart disease and stroke symptom awareness and response; pre-diabetes, diabetes and arthritis; and the incidence and mortality of cancer. Information is also presented on unintentional and intentional injury; the prevalence of cancer screening practices and diabetes care; the prevalence of maternal smoking, overweight children, low birth weight and infant and childhood deaths. Together, these indices can be used as a resource to set priorities, develop prevention and screening programs, reduce health disparities and improve the health of all Fairfield County residents. The Healthy Ohio Community Profiles for Ohio and each of the 88 counties are funded by the Office of Healthy Ohio, Ohio Department of Health.
• Fairfield County was home to 123,453 residents in 2000, with 4.8 percent of the residents being black, other or Hispanic/Latino.
• In 2000, 4.5 percent of Fairfield County residents had incomes below the poverty level and 12.4
percent of the residents over the age of 25 did not graduate from high school or obtain a GED. • Of the residents living in Fairfield County in 2004, 10.1 percent of adults 18 years and older and
7.3 percent of children 17 years and younger did not have health insurance. • Diseases of the heart, cancer, stroke, lower respiratory disease, diabetes mellitus, and uninten-
tional injuries accounted for 66.3 percent of the resident deaths during 2004-2006. • In Fairfield County, 23.2 percent of adult residents currently smoke cigarettes, 36.8 percent are
overweight and 28.2 percent are obese. Each of these behaviors increase the risk of developing a chronic disease.
• 38.5 percent of Fairfield County adult residents had been told by their doctors that their cholesterol
was high during 2004, 2006 and 2007. • Heart disease was the leading cause of death for Fairfield County residents in 2004-2006. 3.4
percent of residents reported they previously suffered a heart attack, while 3.6 percent had angina or coronary heart disease during 2004, 2006 and 2007.
• In Fairfield County, an average of 65 residents died from a stroke each year during 2004-2006.
26.1 percent of the adult residents reported having high blood pressure and 2.2 percent had previ-ously had a stroke during 2004, 2006 and 2007.
4 Healthy Ohio Community Profile: Fairfield County
Demographics
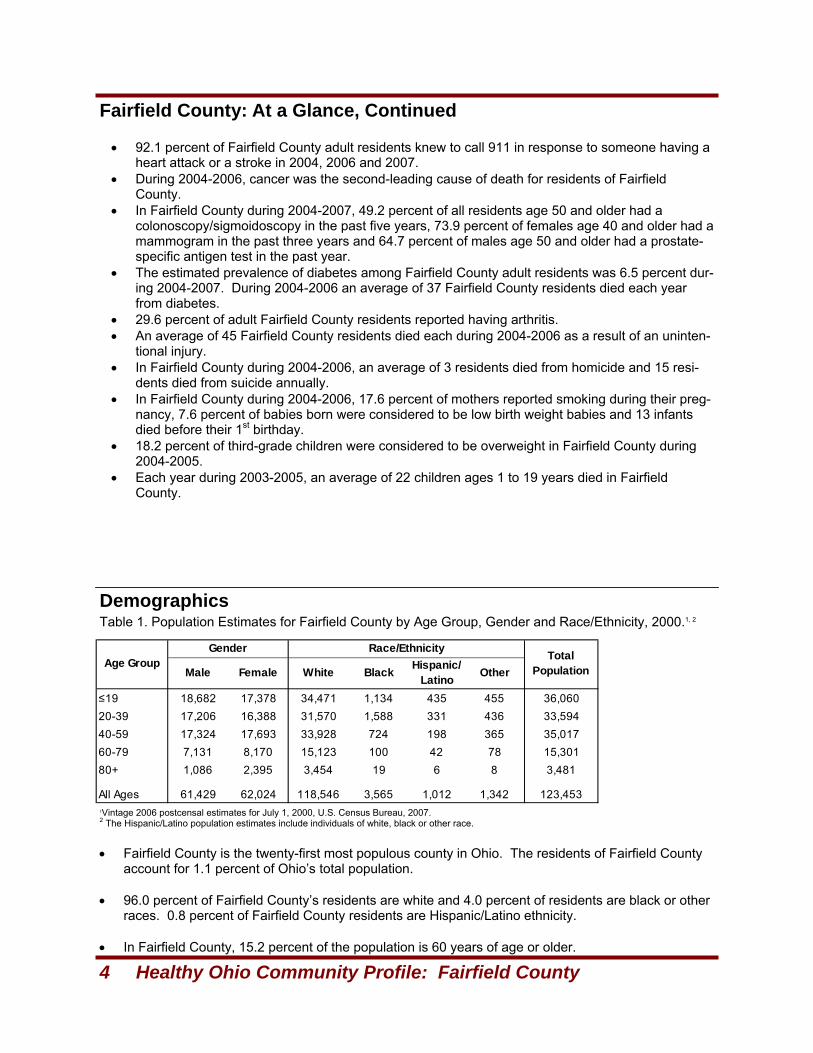
1Vintage 2006 postcensal estimates for July 1, 2000, U.S. Census Bureau, 2007. 2 The Hispanic/Latino population estimates include individuals of white, black or other race.
≤19 18,682 17,378 34,471 1,134 435 455 36,06020-39 17,206 16,388 31,570 1,588 331 436 33,59440-59 17,324 17,693 33,928 724 198 365 35,01760-79 7,131 8,170 15,123 100 42 78 15,30180+ 1,086 2,395 3,454 19 6 8 3,481
All Ages 61,429 62,024 118,546 3,565 1,012 1,342 123,453
Age GroupGender Race/Ethnicity Total
PopulationMale Female White Black Hispanic/Latino Other
Fairfield County: At a Glance, Continued
• Fairfield County is the twenty-first most populous county in Ohio. The residents of Fairfield County account for 1.1 percent of Ohio’s total population.
• 96.0 percent of Fairfield County’s residents are white and 4.0 percent of residents are black or other races. 0.8 percent of Fairfield County residents are Hispanic/Latino ethnicity.
• In Fairfield County, 15.2 percent of the population is 60 years of age or older.
Table 1. Population Estimates for Fairfield County by Age Group, Gender and Race/Ethnicity, 2000.1, 2
• 92.1 percent of Fairfield County adult residents knew to call 911 in response to someone having a
heart attack or a stroke in 2004, 2006 and 2007. • During 2004-2006, cancer was the second-leading cause of death for residents of Fairfield
County. • In Fairfield County during 2004-2007, 49.2 percent of all residents age 50 and older had a
colonoscopy/sigmoidoscopy in the past five years, 73.9 percent of females age 40 and older had a mammogram in the past three years and 64.7 percent of males age 50 and older had a prostate-specific antigen test in the past year.
• The estimated prevalence of diabetes among Fairfield County adult residents was 6.5 percent dur-ing 2004-2007. During 2004-2006 an average of 37 Fairfield County residents died each year from diabetes.
• 29.6 percent of adult Fairfield County residents reported having arthritis. • An average of 45 Fairfield County residents died each during 2004-2006 as a result of an uninten-
tional injury. • In Fairfield County during 2004-2006, an average of 3 residents died from homicide and 15 resi-
dents died from suicide annually. • In Fairfield County during 2004-2006, 17.6 percent of mothers reported smoking during their preg-
nancy, 7.6 percent of babies born were considered to be low birth weight babies and 13 infants died before their 1st birthday.
• 18.2 percent of third-grade children were considered to be overweight in Fairfield County during 2004-2005.
• Each year during 2003-2005, an average of 22 children ages 1 to 19 years died in Fairfield County.
The Ohio Department of Health 5
Socioeconomic Status
Access to Health Care
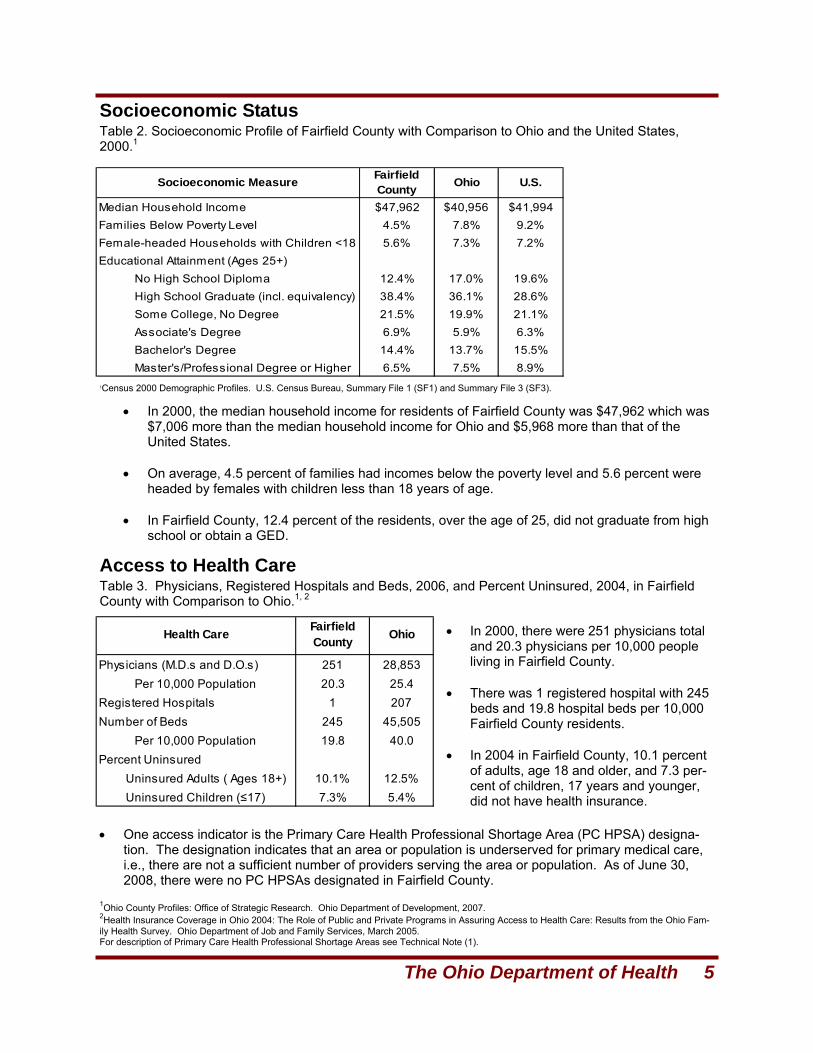
1Census 2000 Demographic Profiles. U.S. Census Bureau, Summary File 1 (SF1) and Summary File 3 (SF3).
Physicians (M.D.s and D.O.s) 251 28,853Per 10,000 Population 20.3 25.4
Registered Hospitals 1 207Number of Beds 245 45,505
Per 10,000 Population 19.8 40.0Percent Uninsured
Uninsured Adults ( Ages 18+) 10.1% 12.5%Uninsured Children (≤17) 7.3% 5.4%
Health Care Fairfield County Ohio
Table 2. Socioeconomic Profile of Fairfield County with Comparison to Ohio and the United States, 2000.1
• In 2000, the median household income for residents of Fairfield County was $47,962 which was $7,006 more than the median household income for Ohio and $5,968 more than that of the United States.
• On average, 4.5 percent of families had incomes below the poverty level and 5.6 percent were
headed by females with children less than 18 years of age. • In Fairfield County, 12.4 percent of the residents, over the age of 25, did not graduate from high
school or obtain a GED.
Table 3. Physicians, Registered Hospitals and Beds, 2006, and Percent Uninsured, 2004, in Fairfield County with Comparison to Ohio.1, 2
• In 2000, there were 251 physicians total and 20.3 physicians per 10,000 people living in Fairfield County.
• There was 1 registered hospital with 245
beds and 19.8 hospital beds per 10,000 Fairfield County residents.
• In 2004 in Fairfield County, 10.1 percent
of adults, age 18 and older, and 7.3 per-cent of children, 17 years and younger, did not have health insurance.
1Ohio County Profiles: Office of Strategic Research. Ohio Department of Development, 2007. 2Health Insurance Coverage in Ohio 2004: The Role of Public and Private Programs in Assuring Access to Health Care: Results from the Ohio Fam-ily Health Survey. Ohio Department of Job and Family Services, March 2005. For description of Primary Care Health Professional Shortage Areas see Technical Note (1).
• One access indicator is the Primary Care Health Professional Shortage Area (PC HPSA) designa-tion. The designation indicates that an area or population is underserved for primary medical care, i.e., there are not a sufficient number of providers serving the area or population. As of June 30, 2008, there were no PC HPSAs designated in Fairfield County.
Socioeconomic Measure Fairfield County Ohio U.S.
Median Household Income $47,962 $40,956 $41,994Families Below Poverty Level 4.5% 7.8% 9.2%Female-headed Households with Children <18 5.6% 7.3% 7.2%Educational Attainment (Ages 25+)
No High School Diploma 12.4% 17.0% 19.6%High School Graduate (incl. equivalency) 38.4% 36.1% 28.6%Some College, No Degree 21.5% 19.9% 21.1%Associate's Degree 6.9% 5.9% 6.3%Bachelor's Degree 14.4% 13.7% 15.5%Master's/Professional Degree or Higher 6.5% 7.5% 8.9%
6 Healthy Ohio Community Profile: Fairfield County
Leading Causes of Death
1Deaths and rates from Statistical Analyses Unit, Office of Vital Statistics, Ohio Department of Health, 2008. 2U.S. Data from National Vital Statistics Reports 2005. CDC, 2008. 3Rank based on number of deaths. For age-adjustment and causes of death definitions, see Technical Note (2).
Individuals who have high blood pressure, high cholesterol, low fruit and vegetable intake, low levels of physical activity, use tobacco products or drink heavily are at a higher risk of developing at least one of the leading causes of death diseases including diseases of the heart, cancer, stroke and diabetes. There is evidence that people can reduce their risk of developing these diseases by increasing their fruit and vegetable consumption, eliminating the use of tobacco products and heavy drinking and increasing their amount of physical activity. Regular doctor visits and screening procedures can also increase a person’s chance of survival by aiding in proper chronic disease management. Together, prevention and early detection may reduce the overall incidence and mortality of certain causes of death by increasing the prevalence of symptom awareness and screening procedures and reducing risk factor behaviors within a population.
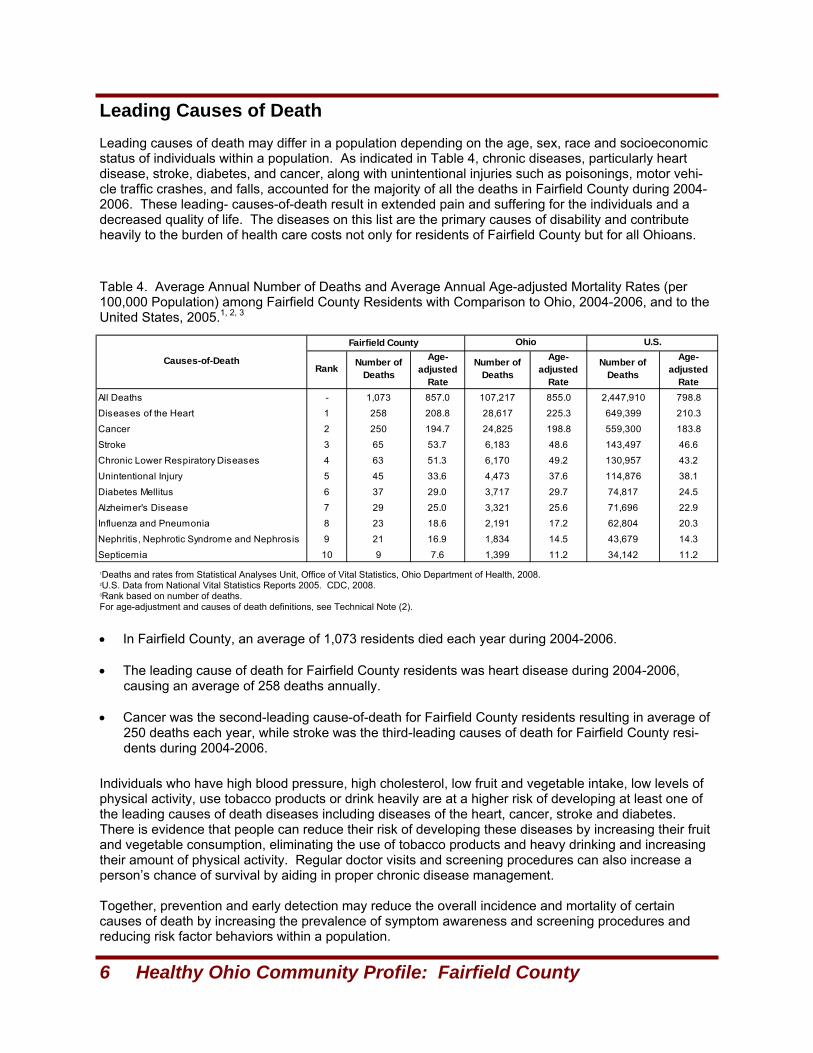
Leading causes of death may differ in a population depending on the age, sex, race and socioeconomic status of individuals within a population. As indicated in Table 4, chronic diseases, particularly heart disease, stroke, diabetes, and cancer, along with unintentional injuries such as poisonings, motor vehi-cle traffic crashes, and falls, accounted for the majority of all the deaths in Fairfield County during 2004-2006. These leading- causes-of-death result in extended pain and suffering for the individuals and a decreased quality of life. The diseases on this list are the primary causes of disability and contribute heavily to the burden of health care costs not only for residents of Fairfield County but for all Ohioans.
Table 4. Average Annual Number of Deaths and Average Annual Age-adjusted Mortality Rates (per 100,000 Population) among Fairfield County Residents with Comparison to Ohio, 2004-2006, and to the United States, 2005.1, 2, 3
• In Fairfield County, an average of 1,073 residents died each year during 2004-2006. • The leading cause of death for Fairfield County residents was heart disease during 2004-2006,
causing an average of 258 deaths annually. • Cancer was the second-leading cause-of-death for Fairfield County residents resulting in average of
250 deaths each year, while stroke was the third-leading causes of death for Fairfield County resi-dents during 2004-2006.
Fairfield County
All Deaths - 1,073 857.0 107,217 855.0 2,447,910 798.8
Diseases of the Heart 1 258 208.8 28,617 225.3 649,399 210.3
Cancer 2 250 194.7 24,825 198.8 559,300 183.8
Stroke 3 65 53.7 6,183 48.6 143,497 46.6
Chronic Lower Respiratory Diseases 4 63 51.3 6,170 49.2 130,957 43.2
Unintentional Injury 5 45 33.6 4,473 37.6 114,876 38.1
Diabetes Mellitus 6 37 29.0 3,717 29.7 74,817 24.5
Alzheimer's Disease 7 29 25.0 3,321 25.6 71,696 22.9
Influenza and Pneumonia 8 23 18.6 2,191 17.2 62,804 20.3
Nephritis, Nephrotic Syndrome and Nephrosis 9 21 16.9 1,834 14.5 43,679 14.3
Septicemia 10 9 7.6 1,399 11.2 34,142 11.2
Age-adjusted
Rate
Number of Deaths
Age-adjusted
Rate
Causes-of-Death
Ohio U.S.
Rank Number of Deaths
Age-adjusted
Rate
Number of Deaths
The Ohio Department of Health 7
Risk Factor Behaviors
12004-2007 Ohio Behavioral Risk Factor Surveillance System; Chronic Disease and Behavioral Epidemiology, Bureau of Health Surveillance – Pre-vention, Ohio Department of Health, April 2008. 2Heavy Drinking = Men having more than 2 drinks/day, women having more than 1 drink/day. 3Current Cigarette Smoking = Persons who reported smoking at least 100 cigarettes in their lifetime and currently smoke every day or some days. 4Current Use of Smokeless Tobacco = Persons who reported using smokeless tobacco at least 100 times in their lifetime and currently use smoke-less tobacco every day or some days. 5Lack of Physical Activity = Persons who failed to participate in moderate physical activity for 30 or more minutes per day on five or more days per week; or vigorous physical activity for 20 or more minutes per day on three or more days per week. 6Overweight = Body Mass Index (BMI) of 25-29.9. 7Obese = BMI of 30.0 or greater. For description of Ohio Behavioral Risk Factor Surveillance System data and analyses, see Technical Note (3).
Male Female All Residents Male Female All
ResidentsHeavy Drinking 6.6% 5.3% 5.9% 4.0% 6.1% 5.4%Current Cigarette Smoking 24.6% 22.0% 23.2% 22.6% 21.3% 23.6%Current Use of Smokeless Tobacco 5.5% 0.2% 2.8% 0.2% 2.6% 2.7%Consuming <5 Fruits/Vegetables Per Day 81.6% 74.7% 78.0% 73.9% 80.2% 78.4%Lack of Physical Activity 19.0% 25.7% 22.4% 26.8% 24.7% 24.2%Overweight 42.9% 30.9% 36.8% 29.4% 36.8% 35.9%Obese 31.3% 25.3% 28.2% 25.6% 28.0% 26.3%
Chronic Disease Risk FactorsFairfield County Ohio
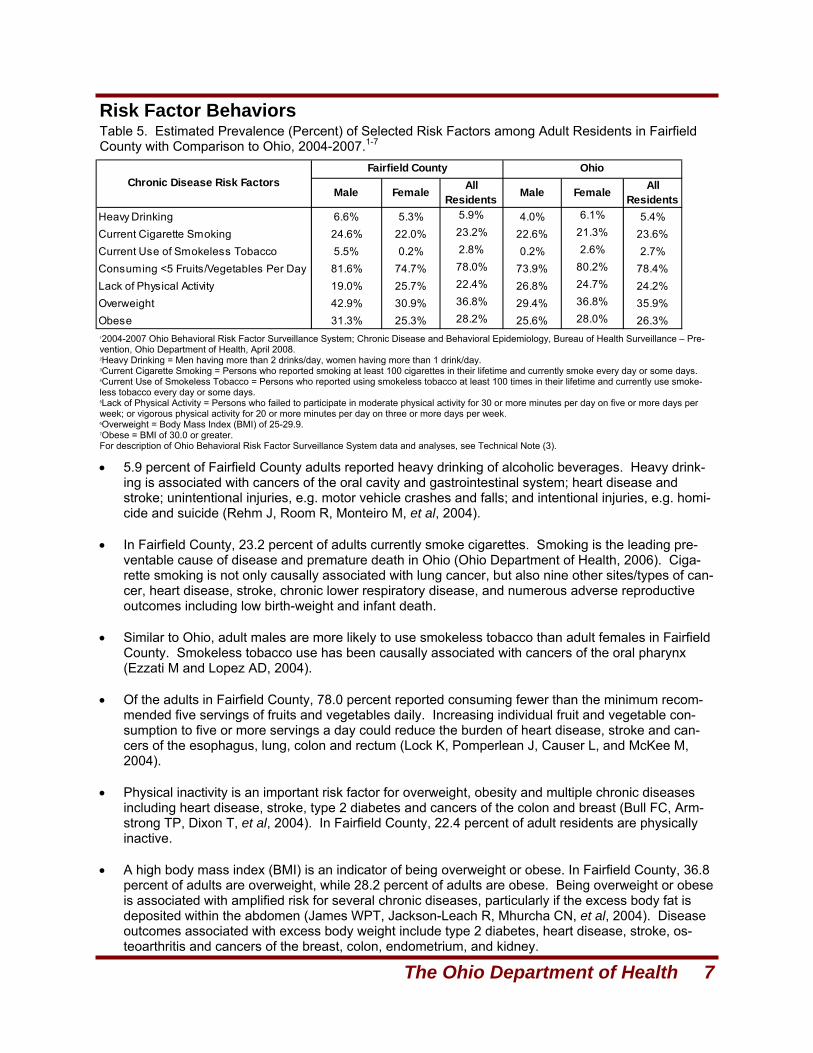
Table 5. Estimated Prevalence (Percent) of Selected Risk Factors among Adult Residents in Fairfield County with Comparison to Ohio, 2004-2007.1-7
• 5.9 percent of Fairfield County adults reported heavy drinking of alcoholic beverages. Heavy drink-ing is associated with cancers of the oral cavity and gastrointestinal system; heart disease and stroke; unintentional injuries, e.g. motor vehicle crashes and falls; and intentional injuries, e.g. homi-cide and suicide (Rehm J, Room R, Monteiro M, et al, 2004).
• In Fairfield County, 23.2 percent of adults currently smoke cigarettes. Smoking is the leading pre-
ventable cause of disease and premature death in Ohio (Ohio Department of Health, 2006). Ciga-rette smoking is not only causally associated with lung cancer, but also nine other sites/types of can-cer, heart disease, stroke, chronic lower respiratory disease, and numerous adverse reproductive outcomes including low birth-weight and infant death.
• Similar to Ohio, adult males are more likely to use smokeless tobacco than adult females in Fairfield
County. Smokeless tobacco use has been causally associated with cancers of the oral pharynx (Ezzati M and Lopez AD, 2004).
• Of the adults in Fairfield County, 78.0 percent reported consuming fewer than the minimum recom-
mended five servings of fruits and vegetables daily. Increasing individual fruit and vegetable con-sumption to five or more servings a day could reduce the burden of heart disease, stroke and can-cers of the esophagus, lung, colon and rectum (Lock K, Pomperlean J, Causer L, and McKee M, 2004).
• Physical inactivity is an important risk factor for overweight, obesity and multiple chronic diseases
including heart disease, stroke, type 2 diabetes and cancers of the colon and breast (Bull FC, Arm-strong TP, Dixon T, et al, 2004). In Fairfield County, 22.4 percent of adult residents are physically inactive.
• A high body mass index (BMI) is an indicator of being overweight or obese. In Fairfield County, 36.8
percent of adults are overweight, while 28.2 percent of adults are obese. Being overweight or obese is associated with amplified risk for several chronic diseases, particularly if the excess body fat is deposited within the abdomen (James WPT, Jackson-Leach R, Mhurcha CN, et al, 2004). Disease outcomes associated with excess body weight include type 2 diabetes, heart disease, stroke, os-teoarthritis and cancers of the breast, colon, endometrium, and kidney.
8 Healthy Ohio Community Profile: Fairfield County
Heart Disease and Stroke
Cholesterol and Blood Pressure Awareness
12004, 2006, 2007 Ohio Behavioral Risk Factor Surveillance System; Chronic Disease and Behavioral Epidemiology, Bureau of Health Surveillance – Prevention, Ohio Department of Health, April, 2008. 2Respondents who reported having been told by a health care professional that their cholesterol level was high. 3Respondents who reported having been told by a health care professional that their blood pressure was high. For description of Ohio Behavioral Risk Factor Surveillance System data and analyses, see Technical Note (3).
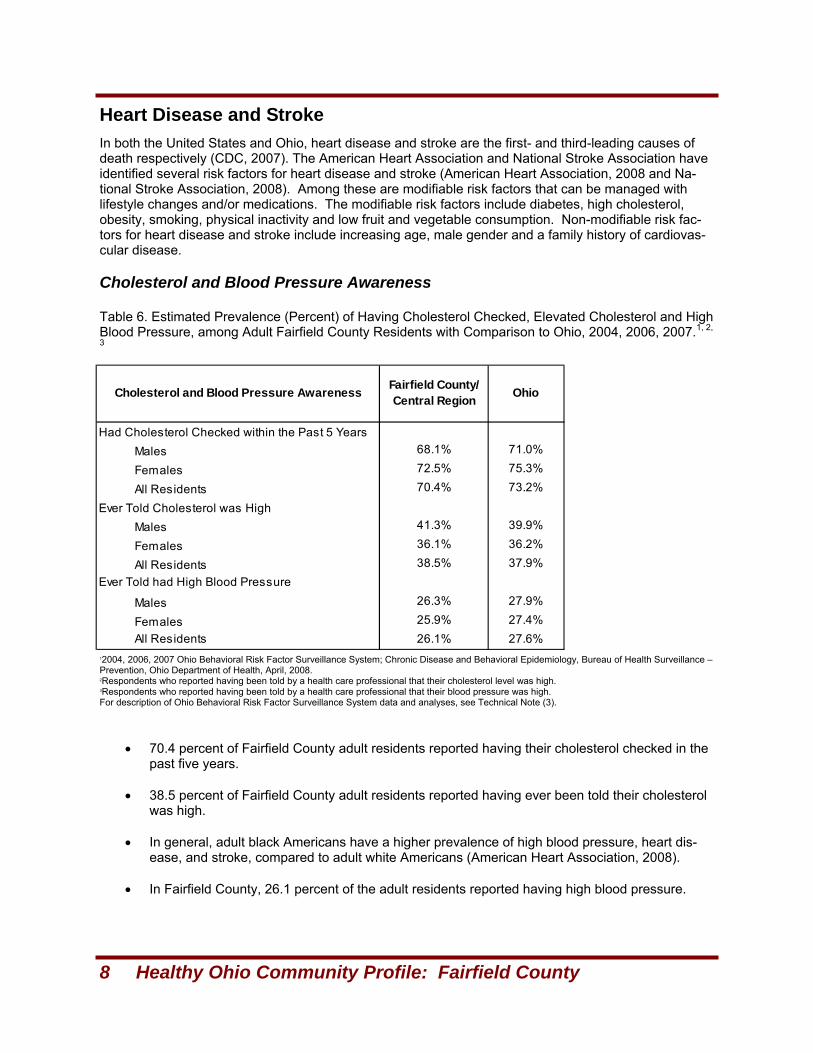
In both the United States and Ohio, heart disease and stroke are the first- and third-leading causes of death respectively (CDC, 2007). The American Heart Association and National Stroke Association have identified several risk factors for heart disease and stroke (American Heart Association, 2008 and Na-tional Stroke Association, 2008). Among these are modifiable risk factors that can be managed with lifestyle changes and/or medications. The modifiable risk factors include diabetes, high cholesterol, obesity, smoking, physical inactivity and low fruit and vegetable consumption. Non-modifiable risk fac-tors for heart disease and stroke include increasing age, male gender and a family history of cardiovas-cular disease.
Table 6. Estimated Prevalence (Percent) of Having Cholesterol Checked, Elevated Cholesterol and High Blood Pressure, among Adult Fairfield County Residents with Comparison to Ohio, 2004, 2006, 2007.1, 2,
3
• 70.4 percent of Fairfield County adult residents reported having their cholesterol checked in the past five years.
• 38.5 percent of Fairfield County adult residents reported having ever been told their cholesterol
was high. • In general, adult black Americans have a higher prevalence of high blood pressure, heart dis-
ease, and stroke, compared to adult white Americans (American Heart Association, 2008). • In Fairfield County, 26.1 percent of the adult residents reported having high blood pressure.
Had Cholesterol Checked within the Past 5 YearsMales 68.1% 71.0%
Females 72.5% 75.3%
All Residents 70.4% 73.2%
Ever Told Cholesterol was HighMales 41.3% 39.9%
Females 36.1% 36.2%
All Residents 38.5% 37.9%Ever Told had High Blood Pressure
Males 26.3% 27.9%
Females 25.9% 27.4%All Residents 26.1% 27.6%
Cholesterol and Blood Pressure Awareness Fairfield County/ Central Region Ohio
The Ohio Department of Health 9
Heart Disease and Stroke, Continued
Prevalence of Heart Disease and Stroke
12004, 2006, 2007 Ohio Behavioral Risk Factor Surveillance System; Chronic Disease and Behavioral Epidemiology, Bureau of Health Surveillance – Prevention, Ohio Department of Health, April 2008. 2Respondents who reported being told by a health care professional they have had a heart attack. 3Respondents who reported being told by a health care professional they have angina or coronary heart disease. 4Respondents who reported being told by a health care professional they have had a stroke. For description of Ohio Behavioral Risk Factor Surveillance System data and analyses, see Technical Note (3).
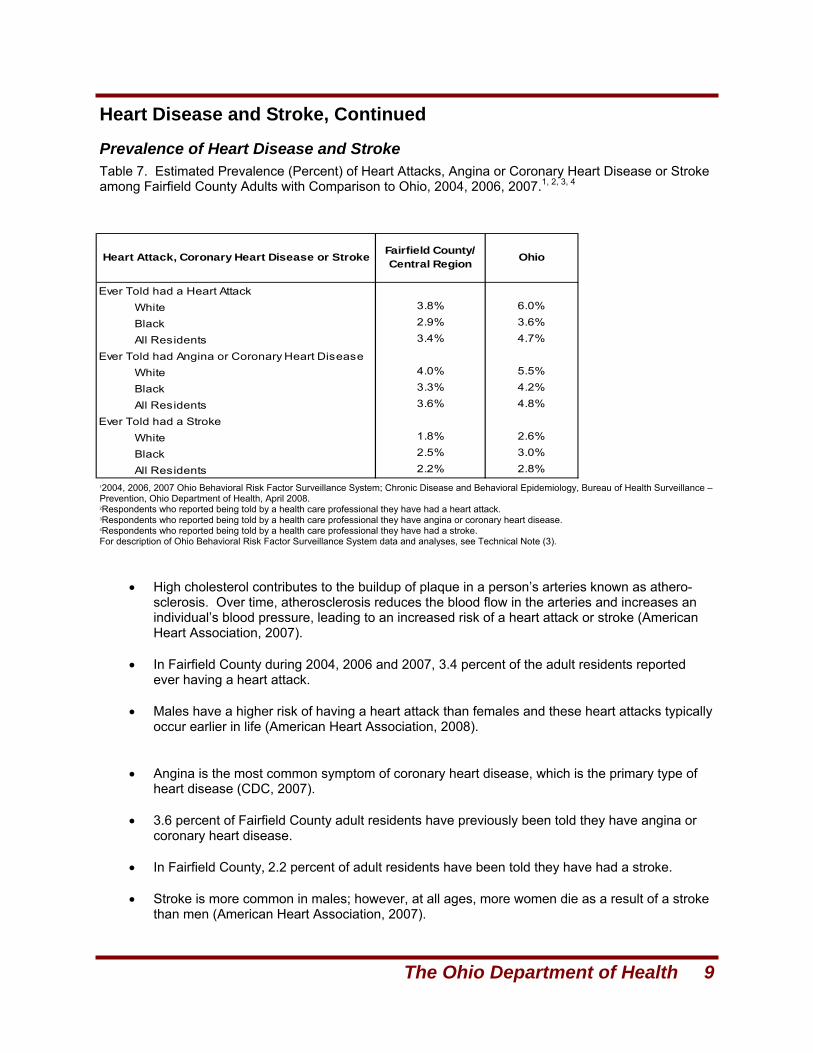
Table 7. Estimated Prevalence (Percent) of Heart Attacks, Angina or Coronary Heart Disease or Stroke among Fairfield County Adults with Comparison to Ohio, 2004, 2006, 2007.1, 2, 3, 4
• High cholesterol contributes to the buildup of plaque in a person’s arteries known as athero-sclerosis. Over time, atherosclerosis reduces the blood flow in the arteries and increases an individual’s blood pressure, leading to an increased risk of a heart attack or stroke (American Heart Association, 2007).
• In Fairfield County during 2004, 2006 and 2007, 3.4 percent of the adult residents reported
ever having a heart attack. • Males have a higher risk of having a heart attack than females and these heart attacks typically
occur earlier in life (American Heart Association, 2008). • Angina is the most common symptom of coronary heart disease, which is the primary type of
heart disease (CDC, 2007). • 3.6 percent of Fairfield County adult residents have previously been told they have angina or
coronary heart disease. • In Fairfield County, 2.2 percent of adult residents have been told they have had a stroke. • Stroke is more common in males; however, at all ages, more women die as a result of a stroke
than men (American Heart Association, 2007).
Ever Told had a Heart AttackWhite 3.8% 6.0%
Black 2.9% 3.6%
All Residents 3.4% 4.7%
Ever Told had Angina or Coronary Heart DiseaseWhite 4.0% 5.5%
Black 3.3% 4.2%
All Residents 3.6% 4.8%
Ever Told had a StrokeWhite 1.8% 2.6%
Black 2.5% 3.0%
All Residents 2.2% 2.8%
Heart Attack, Coronary Heart Disease or Stroke Fairfield County/ Central Region Ohio
10 Healthy Ohio Community Profile: Fairfield County
Heart Disease and Stroke, Continued Heart Attack and Stroke Symptom Awareness and Response
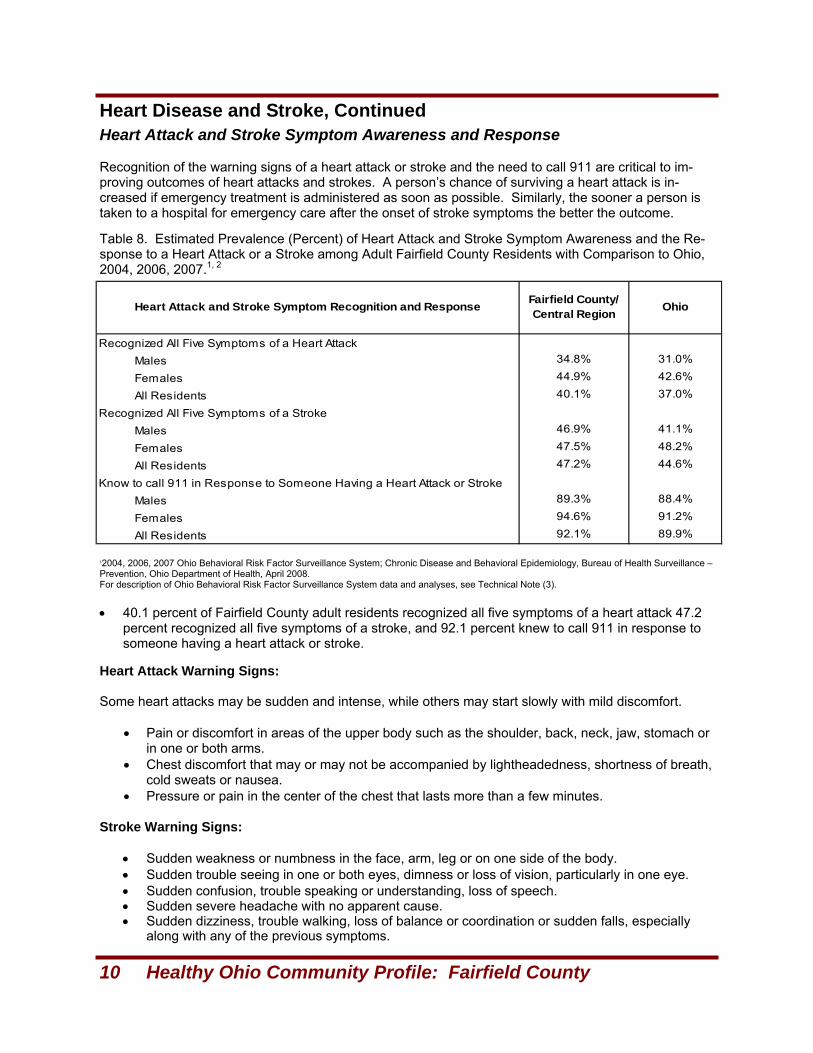
Recognition of the warning signs of a heart attack or stroke and the need to call 911 are critical to im-proving outcomes of heart attacks and strokes. A person’s chance of surviving a heart attack is in-creased if emergency treatment is administered as soon as possible. Similarly, the sooner a person is taken to a hospital for emergency care after the onset of stroke symptoms the better the outcome.
12004, 2006, 2007 Ohio Behavioral Risk Factor Surveillance System; Chronic Disease and Behavioral Epidemiology, Bureau of Health Surveillance – Prevention, Ohio Department of Health, April 2008. For description of Ohio Behavioral Risk Factor Surveillance System data and analyses, see Technical Note (3).
Table 8. Estimated Prevalence (Percent) of Heart Attack and Stroke Symptom Awareness and the Re-sponse to a Heart Attack or a Stroke among Adult Fairfield County Residents with Comparison to Ohio, 2004, 2006, 2007.1, 2
• 40.1 percent of Fairfield County adult residents recognized all five symptoms of a heart attack 47.2 percent recognized all five symptoms of a stroke, and 92.1 percent knew to call 911 in response to someone having a heart attack or stroke.
Heart Attack Warning Signs: Some heart attacks may be sudden and intense, while others may start slowly with mild discomfort.
• Pain or discomfort in areas of the upper body such as the shoulder, back, neck, jaw, stomach or in one or both arms.
• Chest discomfort that may or may not be accompanied by lightheadedness, shortness of breath, cold sweats or nausea.
• Pressure or pain in the center of the chest that lasts more than a few minutes. Stroke Warning Signs:
• Sudden weakness or numbness in the face, arm, leg or on one side of the body. • Sudden trouble seeing in one or both eyes, dimness or loss of vision, particularly in one eye. • Sudden confusion, trouble speaking or understanding, loss of speech. • Sudden severe headache with no apparent cause. • Sudden dizziness, trouble walking, loss of balance or coordination or sudden falls, especially
along with any of the previous symptoms.
Recognized All Five Symptoms of a Heart AttackMales 34.8% 31.0%
Females 44.9% 42.6%
All Residents 40.1% 37.0%
Recognized All Five Symptoms of a StrokeMales 46.9% 41.1%
Females 47.5% 48.2%
All Residents 47.2% 44.6%
Know to call 911 in Response to Someone Having a Heart Attack or StrokeMales 89.3% 88.4%
Females 94.6% 91.2%
All Residents 92.1% 89.9%
Heart Attack and Stroke Symptom Recognition and Response Fairfield County/ Central Region Ohio
The Ohio Department of Health 11
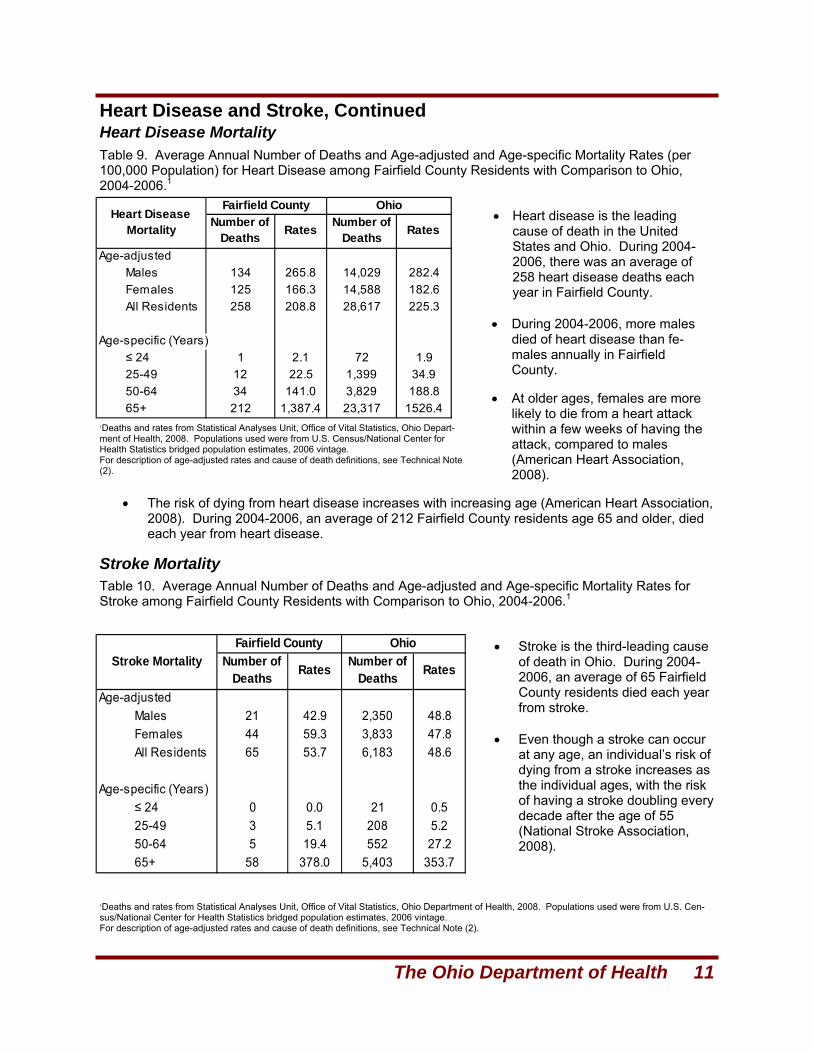
Heart Disease and Stroke, Continued Heart Disease Mortality
Stroke Mortality
1Deaths and rates from Statistical Analyses Unit, Office of Vital Statistics, Ohio Depart-ment of Health, 2008. Populations used were from U.S. Census/National Center for Health Statistics bridged population estimates, 2006 vintage. For description of age-adjusted rates and cause of death definitions, see Technical Note (2).
1Deaths and rates from Statistical Analyses Unit, Office of Vital Statistics, Ohio Department of Health, 2008. Populations used were from U.S. Cen-sus/National Center for Health Statistics bridged population estimates, 2006 vintage. For description of age-adjusted rates and cause of death definitions, see Technical Note (2).
Age-adjustedMales 134 265.8 14,029 282.4Females 125 166.3 14,588 182.6All Residents 258 208.8 28,617 225.3
Age-specific (Years)≤ 24 1 2.1 72 1.925-49 12 22.5 1,399 34.950-64 34 141.0 3,829 188.865+ 212 1,387.4 23,317 1526.4
Heart Disease Mortality
Fairfield County OhioNumber of
Deaths Rates Number of Deaths Rates
Table 9. Average Annual Number of Deaths and Age-adjusted and Age-specific Mortality Rates (per 100,000 Population) for Heart Disease among Fairfield County Residents with Comparison to Ohio, 2004-2006.1
• Heart disease is the leading cause of death in the United States and Ohio. During 2004-2006, there was an average of 258 heart disease deaths each year in Fairfield County.
• During 2004-2006, more males
died of heart disease than fe-males annually in Fairfield County.
• At older ages, females are more
likely to die from a heart attack within a few weeks of having the attack, compared to males (American Heart Association, 2008).
• The risk of dying from heart disease increases with increasing age (American Heart Association, 2008). During 2004-2006, an average of 212 Fairfield County residents age 65 and older, died each year from heart disease.
Table 10. Average Annual Number of Deaths and Age-adjusted and Age-specific Mortality Rates for Stroke among Fairfield County Residents with Comparison to Ohio, 2004-2006.1
• Stroke is the third-leading cause of death in Ohio. During 2004-2006, an average of 65 Fairfield County residents died each year from stroke.
• Even though a stroke can occur
at any age, an individual’s risk of dying from a stroke increases as the individual ages, with the risk of having a stroke doubling every decade after the age of 55 (National Stroke Association, 2008).
Age-adjustedMales 21 42.9 2,350 48.8Females 44 59.3 3,833 47.8All Residents 65 53.7 6,183 48.6
Age-specific (Years)≤ 24 0 0.0 21 0.525-49 3 5.1 208 5.250-64 5 19.4 552 27.265+ 58 378.0 5,403 353.7
Stroke MortalityFairfield County Ohio
Number of Deaths Rates Number of
Deaths Rates
12 Healthy Ohio Community Profile: Fairfield County
Cancer
Screening Behaviors
Incidence and Mortality
Cancer is a group of diseases characterized by uncontrolled growth and spread of abnormal cells. Can-cer can spread throughout various parts of the body and result in death if not controlled. The use of to-bacco products, physical inactivity, obesity, poor nutrition and heavy drinking of alcohol are a few behav-iors that increase an individual’s risk for developing cancer and are lifestyle factors that can be pre-vented (American Cancer Society, 2008).
During 2001-2005, cancer was a major cause of illness and death in Ohio and all of the 88 counties. There was an average of 598 new invasive cancers and 240 cancer deaths per year among Fairfield County residents during 2001-2005.
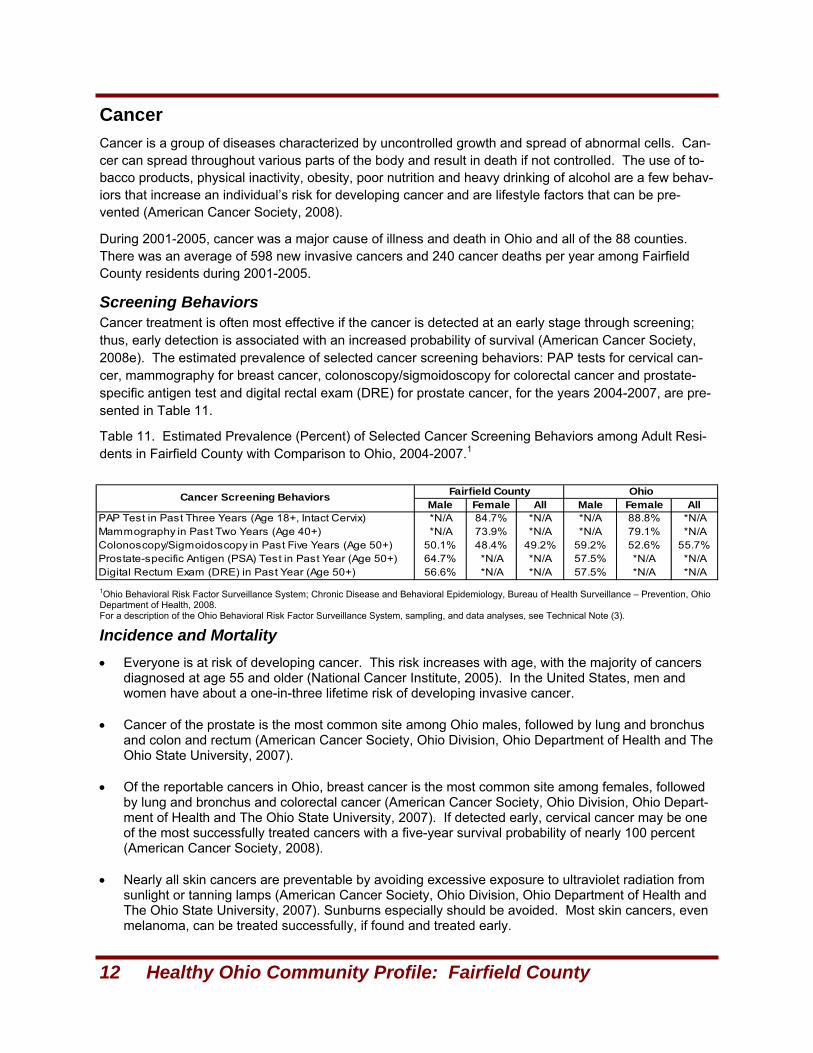
Cancer treatment is often most effective if the cancer is detected at an early stage through screening; thus, early detection is associated with an increased probability of survival (American Cancer Society, 2008e). The estimated prevalence of selected cancer screening behaviors: PAP tests for cervical can-cer, mammography for breast cancer, colonoscopy/sigmoidoscopy for colorectal cancer and prostate-specific antigen test and digital rectal exam (DRE) for prostate cancer, for the years 2004-2007, are pre-sented in Table 11.
Table 11. Estimated Prevalence (Percent) of Selected Cancer Screening Behaviors among Adult Resi-dents in Fairfield County with Comparison to Ohio, 2004-2007.1
• Everyone is at risk of developing cancer. This risk increases with age, with the majority of cancers diagnosed at age 55 and older (National Cancer Institute, 2005). In the United States, men and women have about a one-in-three lifetime risk of developing invasive cancer.
• Cancer of the prostate is the most common site among Ohio males, followed by lung and bronchus
and colon and rectum (American Cancer Society, Ohio Division, Ohio Department of Health and The Ohio State University, 2007).
• Of the reportable cancers in Ohio, breast cancer is the most common site among females, followed by lung and bronchus and colorectal cancer (American Cancer Society, Ohio Division, Ohio Depart-ment of Health and The Ohio State University, 2007). If detected early, cervical cancer may be one of the most successfully treated cancers with a five-year survival probability of nearly 100 percent (American Cancer Society, 2008).
• Nearly all skin cancers are preventable by avoiding excessive exposure to ultraviolet radiation from sunlight or tanning lamps (American Cancer Society, Ohio Division, Ohio Department of Health and The Ohio State University, 2007). Sunburns especially should be avoided. Most skin cancers, even melanoma, can be treated successfully, if found and treated early.
1Ohio Behavioral Risk Factor Surveillance System; Chronic Disease and Behavioral Epidemiology, Bureau of Health Surveillance – Prevention, Ohio Department of Health, 2008. For a description of the Ohio Behavioral Risk Factor Surveillance System, sampling, and data analyses, see Technical Note (3).
Male Female All Male Female AllPAP Test in Past Three Years (Age 18+, Intact Cervix) *N/A 84.7% *N/A *N/A 88.8% *N/AMammography in Past Two Years (Age 40+) *N/A 73.9% *N/A *N/A 79.1% *N/AColonoscopy/Sigmoidoscopy in Past Five Years (Age 50+) 50.1% 48.4% 49.2% 59.2% 52.6% 55.7%Prostate-specific Antigen (PSA) Test in Past Year (Age 50+) 64.7% *N/A *N/A 57.5% *N/A *N/ADigital Rectum Exam (DRE) in Past Year (Age 50+) 56.6% *N/A *N/A 57.5% *N/A *N/A
Cancer Screening Behaviors Fairfield County Ohio
The Ohio Department of Health 13
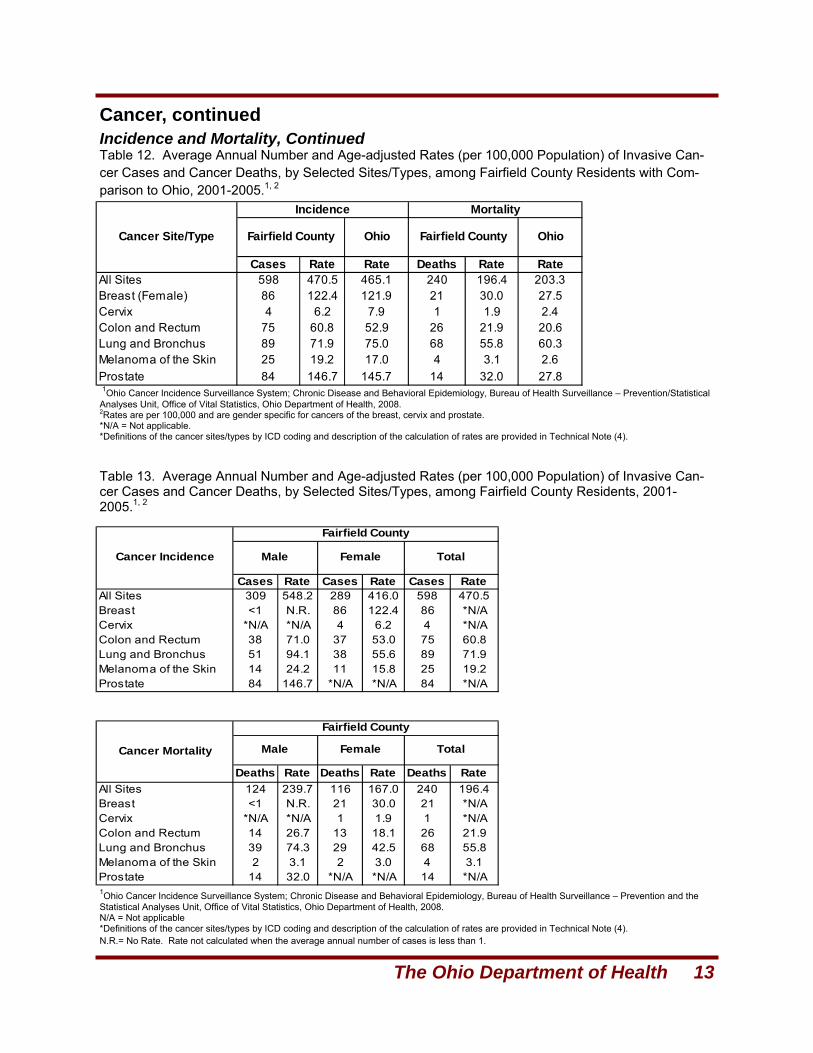
Cancer, continued Incidence and Mortality, Continued
Cases Rate Rate Deaths Rate RateAll Sites 598 470.5 465.1 240 196.4 203.3Breast (Female) 86 122.4 121.9 21 30.0 27.5Cervix 4 6.2 7.9 1 1.9 2.4Colon and Rectum 75 60.8 52.9 26 21.9 20.6Lung and Bronchus 89 71.9 75.0 68 55.8 60.3Melanoma of the Skin 25 19.2 17.0 4 3.1 2.6Prostate 84 146.7 145.7 14 32.0 27.8
Cancer Site/Type
Incidence Mortality
Fairfield County Ohio Fairfield County Ohio
Table 13. Average Annual Number and Age-adjusted Rates (per 100,000 Population) of Invasive Can-cer Cases and Cancer Deaths, by Selected Sites/Types, among Fairfield County Residents, 2001-2005.1, 2
Table 12. Average Annual Number and Age-adjusted Rates (per 100,000 Population) of Invasive Can-cer Cases and Cancer Deaths, by Selected Sites/Types, among Fairfield County Residents with Com-parison to Ohio, 2001-2005.1, 2
1Ohio Cancer Incidence Surveillance System; Chronic Disease and Behavioral Epidemiology, Bureau of Health Surveillance – Prevention/Statistical Analyses Unit, Office of Vital Statistics, Ohio Department of Health, 2008. 2Rates are per 100,000 and are gender specific for cancers of the breast, cervix and prostate. *N/A = Not applicable. *Definitions of the cancer sites/types by ICD coding and description of the calculation of rates are provided in Technical Note (4).
1Ohio Cancer Incidence Surveillance System; Chronic Disease and Behavioral Epidemiology, Bureau of Health Surveillance – Prevention and the Statistical Analyses Unit, Office of Vital Statistics, Ohio Department of Health, 2008. N/A = Not applicable *Definitions of the cancer sites/types by ICD coding and description of the calculation of rates are provided in Technical Note (4). N.R.= No Rate. Rate not calculated when the average annual number of cases is less than 1.
Cases Rate Cases Rate Cases RateAll Sites 309 548.2 289 416.0 598 470.5Breast <1 N.R. 86 122.4 86 *N/ACervix *N/A *N/A 4 6.2 4 *N/AColon and Rectum 38 71.0 37 53.0 75 60.8Lung and Bronchus 51 94.1 38 55.6 89 71.9Melanoma of the Skin 14 24.2 11 15.8 25 19.2Prostate 84 146.7 *N/A *N/A 84 *N/A
Deaths Rate Deaths Rate Deaths RateAll Sites 124 239.7 116 167.0 240 196.4Breast <1 N.R. 21 30.0 21 *N/ACervix *N/A *N/A 1 1.9 1 *N/AColon and Rectum 14 26.7 13 18.1 26 21.9Lung and Bronchus 39 74.3 29 42.5 68 55.8Melanoma of the Skin 2 3.1 2 3.0 4 3.1Prostate 14 32.0 *N/A *N/A 14 *N/A
Cancer Incidence Male Female Total
Fairfield County
Cancer Mortality Male Female Total
Fairfield County
14 Healthy Ohio Community Profile: Fairfield County
Diabetes
Diabetes Prevalence
Pre-diabetes Prevalence
1Ohio Behavioral Risk Factor Surveillance System; Chronic Disease and Behavioral Epidemiology, Bureau of Health Surveillance – Prevention, Ohio Department of Health, 2008. 2Respondents who were told by a health care professional they have diabetes. For a description of the Ohio Behavioral Risk Factor Surveillance System, sampling, and data and analyses, see Technical Note (3).
Diabetes is a group of diseases in which blood glucose levels are high as a result of defects in insulin production, insulin inaction or both (Centers for Disease Control and Prevention, 2005). In 2004-2006, diabetes was the sixth-leading cause of death in Ohio and in the United States. Diabetes can cause a number of serious health issues including blindness, kidney failure and heart disease. There are different types of diabetes with different risk factors for the disease (Centers for Disease Con-trol and Prevention, 2005). Type 1 diabetes typically strikes children and young adults. Type 1 diabetes accounts for 5 percent to 10 percent of all diagnosed cases of diabetes. Risk factors for type 1 diabetes include autoimmune, environmental and genetic factors. Type 2 diabetes usually strikes adults and ac-counts for 90 percent to 95 percent of all diagnosed diabetes cases. Risk factors for type 2 diabetes include older age, obesity, family history of diabetes, impaired glucose metabolism or pre-diabetes, his-tory of gestational diabetes and physical inactivity. Gestational diabetes is a form of glucose intolerance diagnosed during pregnancy in some women. Other types of diabetes account for 1 percent to 5 per-cent of all diagnosed cases. Risk factors for these other types include infections and other illnesses, malnutrition, specific genetic diseases (such as maturity-onset diabetes of youth), drugs and surgery.
Pre-diabetes is a condition in which blood glucose levels are higher than normal but not high enough to be classified as diabetes (Centers for Disease Control and Prevention, 2005). People with pre-diabetes have increased risk of developing type 2 diabetes, heart disease and stroke. There have been no population-based studies of the prevalence of pre-diabetes in Ohio. However, data from the National Health and Nutrition Examination Surveys for 1999-2000 indicate a pre-diabetes prevalence of 6.2 percent for persons aged 20 years and older (Cowie CC, Rust KF, Byrd-Holf D, et al, 2003). Among overweight adults age 45-74 years, the prevalence of pre-diabetes increased from 6.2 percent to 22.6 percent (Benjamin SM, Valdez R, Geiss LS, et al, 2003).
6.9%6.2%
6.5%
8.3% 7.6% 7.9%
0.0%
1.0%
2.0%
3.0%
4.0%
5.0%
6.0%
7.0%
8.0%
9.0%
Male Female All Residents
Fairfield County/ Central Region Ohio
0.6%
4.2%
8.3%
12.2%
17.2%
1.4%
4.7%
7.3%
15.1%
17.4%
0.0%
2.0%
4.0%
6.0%
8.0%
10.0%
12.0%
14.0%
16.0%
18.0%
20.0%
18 ‐ 34 35 ‐ 44 45 ‐ 54 55 ‐ 64 65+
Fairfield County/ Central Region Ohio
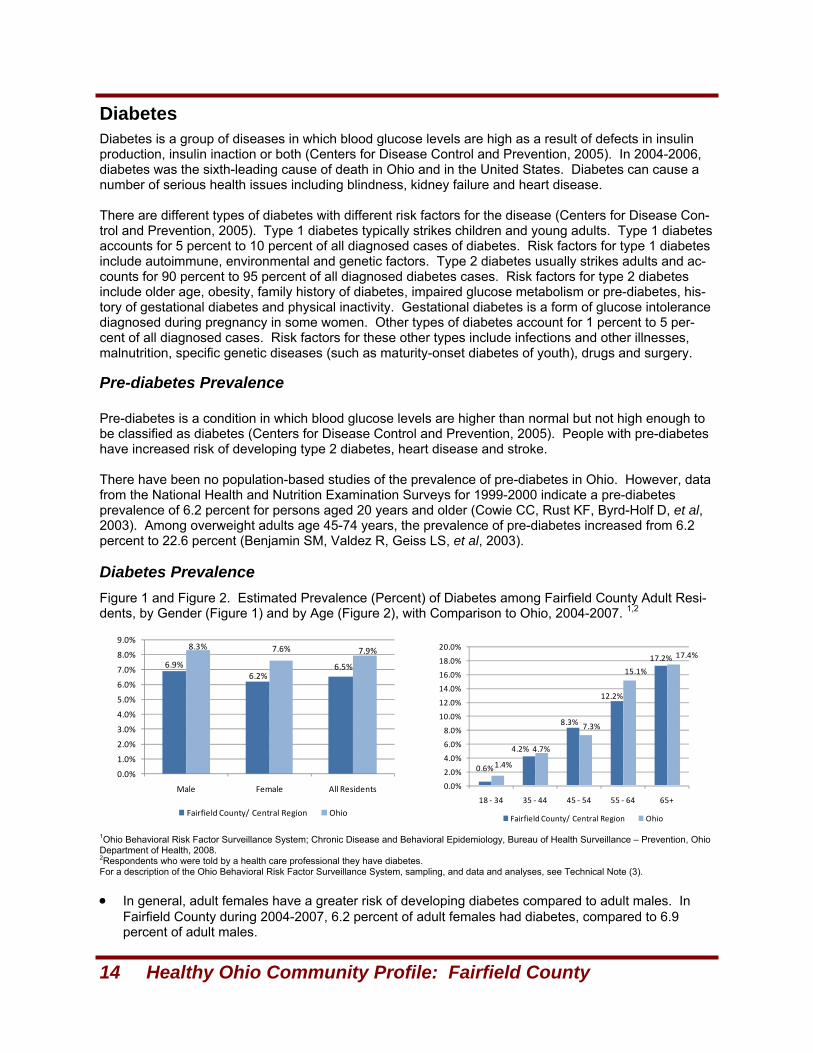
Figure 1 and Figure 2. Estimated Prevalence (Percent) of Diabetes among Fairfield County Adult Resi-dents, by Gender (Figure 1) and by Age (Figure 2), with Comparison to Ohio, 2004-2007. 1,2
• In general, adult females have a greater risk of developing diabetes compared to adult males. In Fairfield County during 2004-2007, 6.2 percent of adult females had diabetes, compared to 6.9 percent of adult males.
The Ohio Department of Health 15
Diabetes, Continued
Diabetes Management Practices
Diabetes Mortality
1Ohio Behavioral Risk Factor Surveillance System; Chronic Disease and Behavioral Epidemiology, Bureau of Health Surveillance – Prevention, Ohio Department of Health, 2008. For a description of the Ohio Behavioral Risk Factor Surveillance System, sampling and data and analyses, see Technical Note (3).
1Deaths and rates from Statistical Analyses Unit, Office of Vital Statistics, Ohio Department of Health, 2008. For definitions of cause of death by ICD Codes and description of calculation of rates, see Technical Note (2).
Age-adjustedMales 22 39.2 1,812 35.3Females 15 20.9 1,905 25.6All Residents 37 29.0 3,717 29.7
Age-specific (Years)≤ 24 <1 0.7 9 0.225-49 2 3.9 222 5.550-64 7 30.4 687 33.965+ 27 179.2 2,799 183.2
Diabetes MortalityFairfield County Ohio
Number of Deaths Rates Number of
Deaths Rates
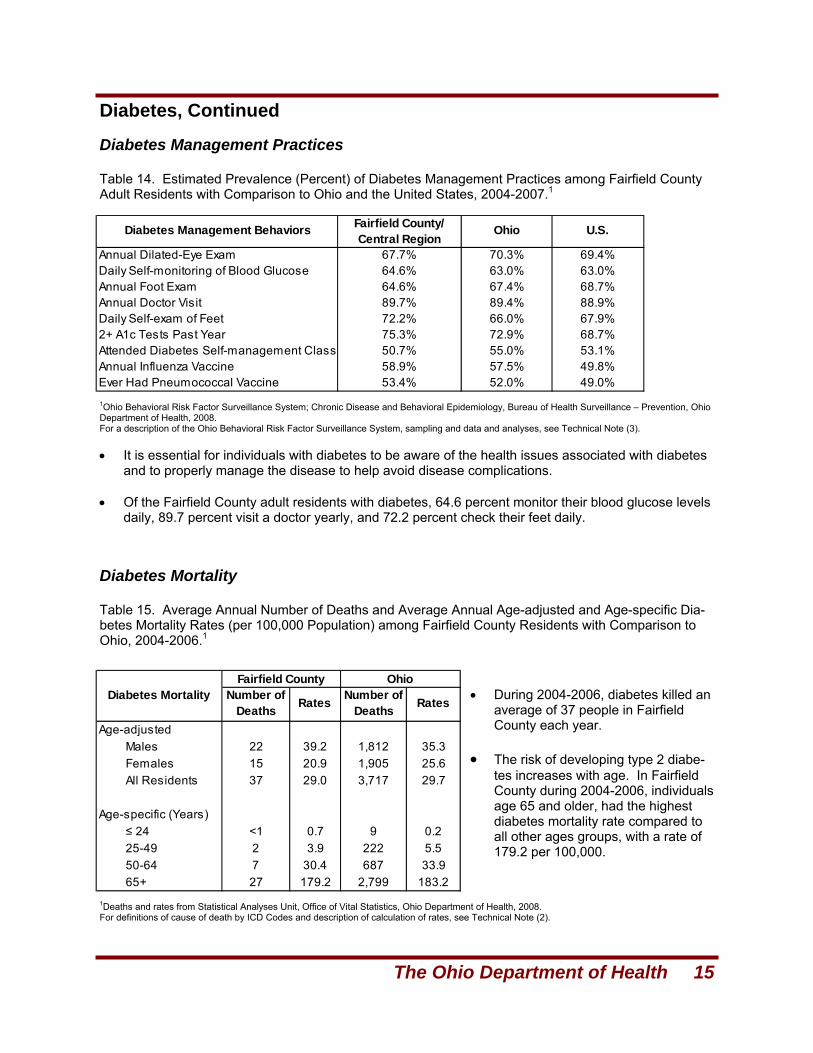
Table 14. Estimated Prevalence (Percent) of Diabetes Management Practices among Fairfield County Adult Residents with Comparison to Ohio and the United States, 2004-2007.1
• It is essential for individuals with diabetes to be aware of the health issues associated with diabetes and to properly manage the disease to help avoid disease complications.
• Of the Fairfield County adult residents with diabetes, 64.6 percent monitor their blood glucose levels
daily, 89.7 percent visit a doctor yearly, and 72.2 percent check their feet daily.
Table 15. Average Annual Number of Deaths and Average Annual Age-adjusted and Age-specific Dia-betes Mortality Rates (per 100,000 Population) among Fairfield County Residents with Comparison to Ohio, 2004-2006.1
• During 2004-2006, diabetes killed an average of 37 people in Fairfield County each year.
• The risk of developing type 2 diabe-
tes increases with age. In Fairfield County during 2004-2006, individuals age 65 and older, had the highest diabetes mortality rate compared to all other ages groups, with a rate of 179.2 per 100,000.
Annual Dilated-Eye Exam 67.7% 70.3% 69.4%Daily Self-monitoring of Blood Glucose 64.6% 63.0% 63.0%Annual Foot Exam 64.6% 67.4% 68.7%Annual Doctor Visit 89.7% 89.4% 88.9%Daily Self-exam of Feet 72.2% 66.0% 67.9%2+ A1c Tests Past Year 75.3% 72.9% 68.7%Attended Diabetes Self-management Class 50.7% 55.0% 53.1%Annual Influenza Vaccine 58.9% 57.5% 49.8%Ever Had Pneumococcal Vaccine 53.4% 52.0% 49.0%
Diabetes Management Behaviors Fairfield County/ Central Region
Ohio U.S.
16 Healthy Ohio Community Profile: Fairfield County
Arthritis
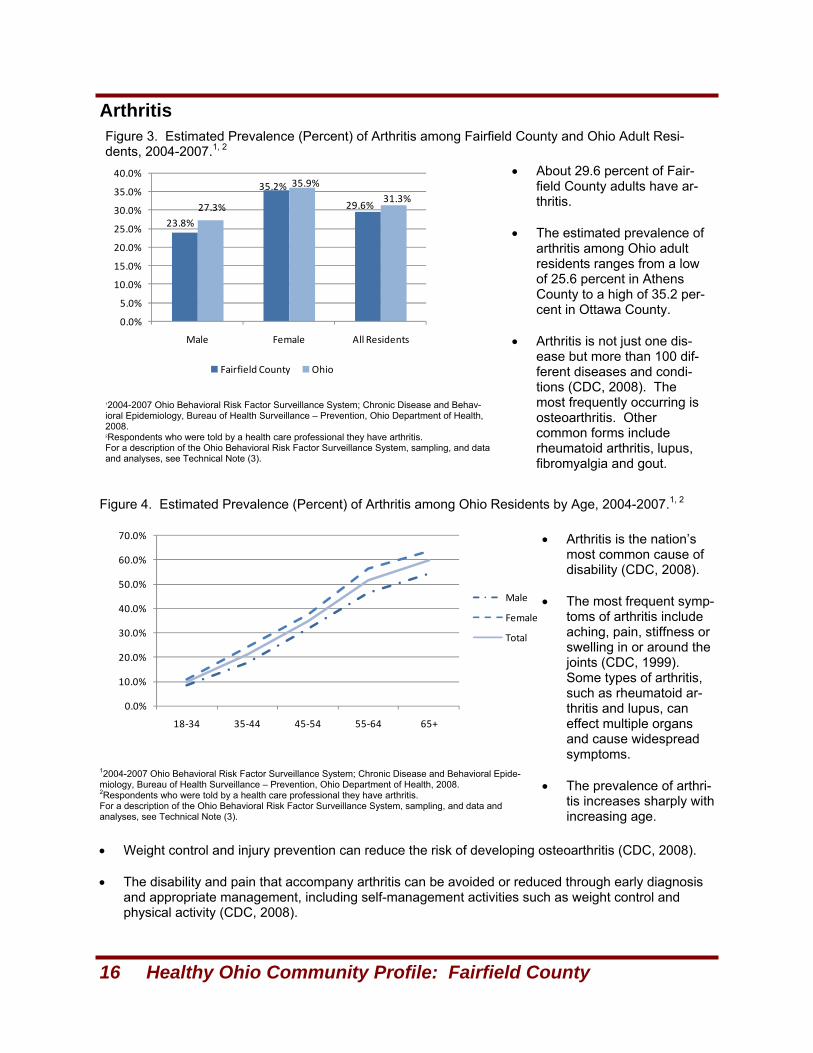
Figure 4. Estimated Prevalence (Percent) of Arthritis among Ohio Residents by Age, 2004-2007.1, 2
12004-2007 Ohio Behavioral Risk Factor Surveillance System; Chronic Disease and Behavioral Epide-miology, Bureau of Health Surveillance – Prevention, Ohio Department of Health, 2008. 2Respondents who were told by a health care professional they have arthritis. For a description of the Ohio Behavioral Risk Factor Surveillance System, sampling, and data and analyses, see Technical Note (3).
0.0%
10.0%
20.0%
30.0%
40.0%
50.0%
60.0%
70.0%
18‐34 35‐44 45‐54 55‐64 65+
Male
Female
Total
• Arthritis is the nation’s most common cause of disability (CDC, 2008).
• The most frequent symp-
toms of arthritis include aching, pain, stiffness or swelling in or around the joints (CDC, 1999). Some types of arthritis, such as rheumatoid ar-thritis and lupus, can effect multiple organs and cause widespread symptoms.
• The prevalence of arthri-
tis increases sharply with increasing age.
• Weight control and injury prevention can reduce the risk of developing osteoarthritis (CDC, 2008). • The disability and pain that accompany arthritis can be avoided or reduced through early diagnosis
and appropriate management, including self-management activities such as weight control and physical activity (CDC, 2008).
12004-2007 Ohio Behavioral Risk Factor Surveillance System; Chronic Disease and Behav-ioral Epidemiology, Bureau of Health Surveillance – Prevention, Ohio Department of Health, 2008. 2Respondents who were told by a health care professional they have arthritis. For a description of the Ohio Behavioral Risk Factor Surveillance System, sampling, and data and analyses, see Technical Note (3).
23.8%
35.2%
29.6%27.3%
35.9%31.3%
0.0%
5.0%
10.0%
15.0%
20.0%
25.0%
30.0%
35.0%
40.0%
Male Female All Residents
Fairfield County Ohio
Figure 3. Estimated Prevalence (Percent) of Arthritis among Fairfield County and Ohio Adult Resi-dents, 2004-2007.1, 2
• About 29.6 percent of Fair-field County adults have ar-thritis.
• The estimated prevalence of
arthritis among Ohio adult residents ranges from a low of 25.6 percent in Athens County to a high of 35.2 per-cent in Ottawa County.
• Arthritis is not just one dis-
ease but more than 100 dif-ferent diseases and condi-tions (CDC, 2008). The most frequently occurring is osteoarthritis. Other common forms include rheumatoid arthritis, lupus, fibromyalgia and gout.
The Ohio Department of Health 17
Unintentional and Intentional Injuries
Unintentional Fatal Falls
All Fatal Unintentional Injuries
On average, 18 Ohioans lose their lives each day as a result of an unintentional or intentional in-jury. Males are at greater risk than females for intentional and unintentional injury-related death at nearly all ages. For Ohioans of all ages, the leading causes of injury-related death include uninten-tional motor vehicle traffic crashes, suicide, unintentional poisonings, unintentional falls and homicides.
1Deaths and rates from Injury Prevention Program/Statistical Analyses Unit, Office of Vital Statistics, Ohio Department of Health, 2008. Populations used were from U.S. Census/National Center for Health Statistics bridged population estimates, 2006 vintage. For description of age-adjusted rates and causes of death injury definitions, see Technical Note (5).
1Deaths and rates from Statistical Analyses Unit, Office of Vital Statistics/Injury Prevention Program, Bureau of Health Promotion and Risk Reduction, Office of Healthy Ohio, Ohio Department of Health, May, 2008. For description of calculation of rates and causes of injury death definitions, see Technical Note (5).
Age-adjustedMales 28 43.8 2,775 51.3Females 17 23.8 1,698 25.2All Residents 45 33.6 4,473 37.6
Age-specific (Years)≤ 24 8 17.7 714 18.325-49 16 30.2 1,524 38.050-64 7 29.0 711 35.065+ 14 93.9 1,524 99.8
Unintentionial Fatal Injury: All
Fairfield County OhioNumber of
Deaths Rates Number of Deaths Rates
Age-adjustedMales 3 6.0 421 8.6Females 3 3.9 400 5.0All Residents 5 4.5 821 6.5
Age-specific (Years)≤ 24 0 0.0 11 0.325-49 <1 0.6 51 1.350-64 <1 1.4 99 4.965+ 5 30.6 661 43.3
Unintentional Injury Mortality: Falls
Fairfield County OhioNumber of
Deaths Rates Number of Deaths Rates
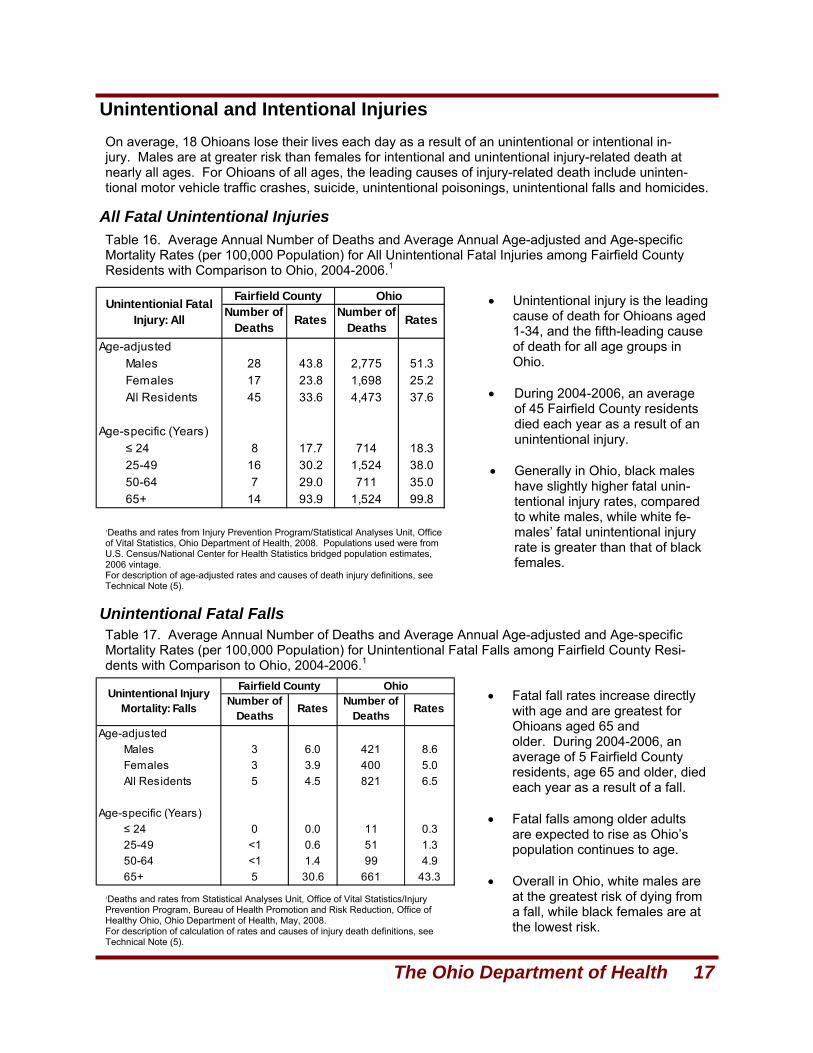
Table 16. Average Annual Number of Deaths and Average Annual Age-adjusted and Age-specific Mortality Rates (per 100,000 Population) for All Unintentional Fatal Injuries among Fairfield County Residents with Comparison to Ohio, 2004-2006.1
• Unintentional injury is the leading cause of death for Ohioans aged 1-34, and the fifth-leading cause of death for all age groups in Ohio.
• During 2004-2006, an average
of 45 Fairfield County residents died each year as a result of an unintentional injury.
• Generally in Ohio, black males
have slightly higher fatal unin-tentional injury rates, compared to white males, while white fe-males’ fatal unintentional injury rate is greater than that of black females.
Table 17. Average Annual Number of Deaths and Average Annual Age-adjusted and Age-specific Mortality Rates (per 100,000 Population) for Unintentional Fatal Falls among Fairfield County Resi-dents with Comparison to Ohio, 2004-2006.1
• Fatal fall rates increase directly with age and are greatest for Ohioans aged 65 and older. During 2004-2006, an average of 5 Fairfield County residents, age 65 and older, died each year as a result of a fall.
• Fatal falls among older adults are expected to rise as Ohio’s population continues to age.
• Overall in Ohio, white males are at the greatest risk of dying from a fall, while black females are at the lowest risk.
18 Healthy Ohio Community Profile: Fairfield County
Unintentional and Intentional Injuries, Continued
Unintentional Motor Vehicle Traffic Crashes
Unintentional Fatal Poisonings
1Deaths and rates from Statistical Analyses Unit, Office of Vital Statistics/Injury Pre-vention Program, Bureau of Health Promotion and Risk Reduction, Office of Healthy Ohio, Ohio Department of Health, May 2008. For description of calculation of rates and causes of injury death definition see Tech-nical Note (5).
1Deaths and rates from Statistical Analyses Unit, Office of Vital Statistics/Injury Preven-tion Program, Bureau of Health Promotion and Risk Reduction, Office of Healthy Ohio, Ohio Department of Health, May 2008. For description of calculation of rates and causes of injury death definitions, see Techni-cal Note (5).
Age-adjustedMales 7 10.2 733 13.0Females 3 4.2 379 6.5All Residents 10 7.3 1,112 9.7
Age-specific (Years)≤ 24 2 4.3 115 3.025-49 7 13.5 735 18.350-64 1 4.1 221 10.965+ <1 2.2 41 2.7
Unintentional Injury Mortality: Poisonings
Fairfield County OhioNumber of
Deaths Rates Number of Deaths Rates
Age-adjustedMales 11 16.1 904 16.2Females 5 7.1 416 6.8All Residents 16 11.5 1,321 11.4
Age-specific (Years)≤ 24 4 9.2 370 9.525-49 6 10.9 506 12.650-64 4 16.6 217 10.765+ 2 15.3 228 14.9
Unintentional Injury Mortality: Motor Vehicle
Traffic Crashes
Fairfield County OhioNumber of
Deaths Rates Number of Deaths Rates
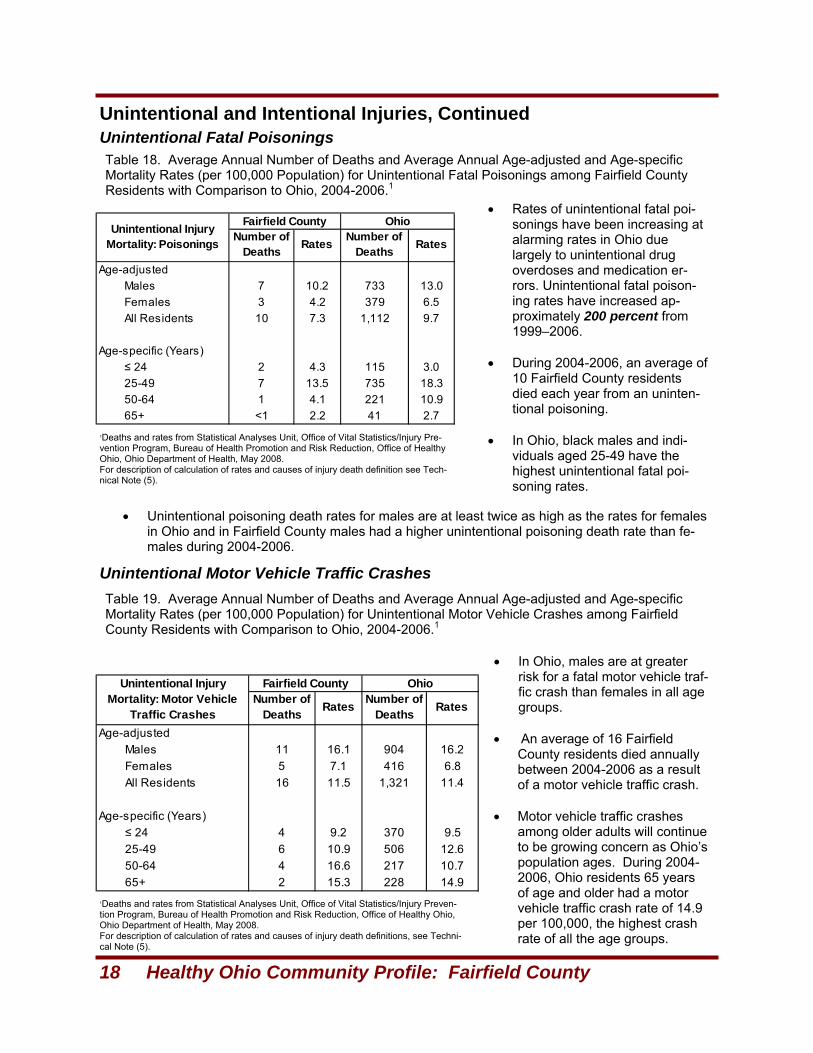
Table 18. Average Annual Number of Deaths and Average Annual Age-adjusted and Age-specific Mortality Rates (per 100,000 Population) for Unintentional Fatal Poisonings among Fairfield County Residents with Comparison to Ohio, 2004-2006.1
• Rates of unintentional fatal poi-sonings have been increasing at alarming rates in Ohio due largely to unintentional drug overdoses and medication er-rors. Unintentional fatal poison-ing rates have increased ap-proximately 200 percent from 1999–2006.
• During 2004-2006, an average of
10 Fairfield County residents died each year from an uninten-tional poisoning.
• In Ohio, black males and indi-
viduals aged 25-49 have the highest unintentional fatal poi-soning rates.
• Unintentional poisoning death rates for males are at least twice as high as the rates for females in Ohio and in Fairfield County males had a higher unintentional poisoning death rate than fe-males during 2004-2006.
Table 19. Average Annual Number of Deaths and Average Annual Age-adjusted and Age-specific Mortality Rates (per 100,000 Population) for Unintentional Motor Vehicle Crashes among Fairfield County Residents with Comparison to Ohio, 2004-2006.1
• In Ohio, males are at greater risk for a fatal motor vehicle traf-fic crash than females in all age groups.
• An average of 16 Fairfield
County residents died annually between 2004-2006 as a result of a motor vehicle traffic crash.
• Motor vehicle traffic crashes
among older adults will continue to be growing concern as Ohio’s population ages. During 2004-2006, Ohio residents 65 years of age and older had a motor vehicle traffic crash rate of 14.9 per 100,000, the highest crash rate of all the age groups.
The Ohio Department of Health 19
Homicide
Suicide
Unintentional and Intentional Injuries, Continued
1Deaths and rates from Statistical Analyses Unit, Office of Vital Statistics/Injury Prevention Program, Bureau of Health Promotion and Risk Reduction, Office of Healthy Ohio, Ohio Department of Health, May 2008. For description of calculation of rates and causes of injury death definitions, see Technical Note (5).
1 Deaths and rates from Statistical Analyses Unit, Office of Vital Statistics/Injury Prevention Program, Bureau of Health Promotion and Risk Reduction, Office of Healthy Ohio, Ohio Department of Health, May 2008. For description of calculation of rates and causes of injury death definitions, see Technical Note (5).
• Firearm-related violence plays a large role in homicides in Ohio. Nearly eight out 10 homi-cides among black males in Ohio involve firearms.
Age-adjustedMales 2 3.0 1 5.5Females 1 0.9 1 8.4All Residents 3 1.9 150 2.6
Age-specific (Years)≤ 24 1 1.4 211 5.425-49 1 2.6 315 7.850-64 <1 1.4 63 3.165+ <1 2.2 31 2.0
Intentional Fatal Injury: Homicide
Fairfield County OhioNumber of
Deaths Rates Number of Deaths Rates
Age-adjustedMales 14 22.6 1,053 18.8Females 1 1 266 4.4All Residents 15 10.9 1,319 11.3
Age-specific (Years)≤ 24 2 4.3 192 4.925-49 6 11.6 616 15.350-64 4 15.2 312 15.465+ 3 21.8 200 13.1
Intentional Fatal Injury: Suicide
Fairfield County OhioNumber of
Deaths Rates Number of Deaths Rates
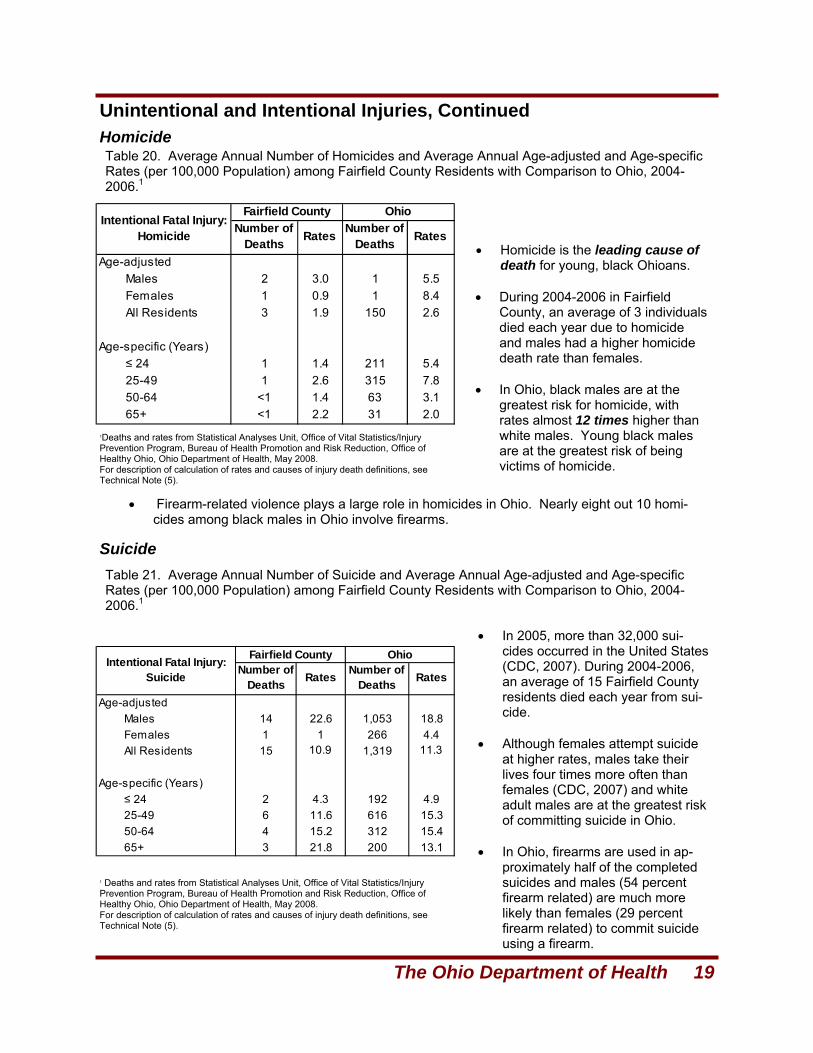
Table 20. Average Annual Number of Homicides and Average Annual Age-adjusted and Age-specific Rates (per 100,000 Population) among Fairfield County Residents with Comparison to Ohio, 2004-2006.1
• Homicide is the leading cause of death for young, black Ohioans.
• During 2004-2006 in Fairfield
County, an average of 3 individuals died each year due to homicide and males had a higher homicide death rate than females.
• In Ohio, black males are at the
greatest risk for homicide, with rates almost 12 times higher than white males. Young black males are at the greatest risk of being victims of homicide.
Table 21. Average Annual Number of Suicide and Average Annual Age-adjusted and Age-specific Rates (per 100,000 Population) among Fairfield County Residents with Comparison to Ohio, 2004-2006.1
• In 2005, more than 32,000 sui-cides occurred in the United States (CDC, 2007). During 2004-2006, an average of 15 Fairfield County residents died each year from sui-cide.
• Although females attempt suicide
at higher rates, males take their lives four times more often than females (CDC, 2007) and white adult males are at the greatest risk of committing suicide in Ohio.
• In Ohio, firearms are used in ap-
proximately half of the completed suicides and males (54 percent firearm related) are much more likely than females (29 percent firearm related) to commit suicide using a firearm.
20 Healthy Ohio Community Profile: Fairfield County
Child Health Maternal Smoking
Low Birth Weight
Infant Deaths
Childhood Overweight
• During 2004-2006, 40 Fairfield County infants died before their 1st birthday for an annual average of 13 deaths. The Fairfield County average annual infant death rate for 2004-2006 was 7.6 per 1,000 live births. The infant death rate for the 88 counties ranged from a low of 1.3 per 1,000 live births in Paulding County to a high of 12.6 per 1,000 live births in Gallia County.
• The leading causes of infant death include birth defects, disorders relating to preterm birth and low birth-weight, SIDS and respiratory distress syndrome (March of Dimes, 2007).
• A random sample of Ohio public school’s third-grade children during the 2004-2005 school year indi-cated 18.2 percent of Fairfield County third-graders were overweight (Ohio Department of Health, 2007; see Technical Note 5). The statewide assessment during the 2004-2005 school year found 18.9 percent of Ohio’s public school third-grade students were overweight. Percentage of students who were overweight ranged from 9.5 percent in Butler County to 32.5 percent in Highland County.
• Overweight children are at higher risk of a number of physical and psychological health conse-quences when compared to children who are not overweight (Ohio Department of Health, 2007): (a) asthma; (b) damage to bones and joints from carrying extra weight on developing skeletons; (c) sleep apnea; (d) high blood pressure that can damage the heart, kidneys and blood vessels, and can lead to heart disease and stroke; (e) type 2 diabetes; (f) high cholesterol levels that can in-crease risk of heart attacks or strokes; (g) premature onset of puberty; (h) stigmatization and bully-ing by peers; and (i) becoming an obese adult. *For description of the Ohio Department of Health’s Body Mass Index assessment of Ohio’s Third Grade Students, see Technical Note (6).
• An analysis of Ohio birth certificates for the years 2004-2006, indicated 17.6 percent of mothers liv-ing in Fairfield County smoked cigarettes during their pregnancy. Throughout Ohio during 2004-2006 18.1 percent of mothers reported smoking cigarettes during their pregnancy. Maternal smok-ing in the individual counties during 2004-2006, ranged from a low of 6.9 percent in Delaware County to a high of 35.9 percent in Paulding County.
• Ohio birth data for the years 1999-2001 indicated 73.0 percent of deaths from sudden infant death syndrome (SIDS) and 55.4 percent of infants who were small for their gestational age were attribut-able to maternal smoking during pregnancy (Ohio Department of Health, 2006). Maternal smoking was also a risk factor for 38.8 percent of low birth-weight babies (babies weighing less than 2,500 grams), 25.4 percent of preterm low birth-weight babies and 22.4 percent of very low birth-weight (babies weighing less than 1,500 grams) babies.
• A recent study suggested mothers who smoked any time during the month before pregnancy to the end of the first trimester were more likely to have a baby with a birth defect, particularly congenital heart defects, than mothers who did not smoke during this time frame (March of Dimes, 2008).
• Babies born weighing less than 2,500 grams (5 pounds, 8 ounces) are considered low birth-weight (March of Dimes, 2008). Low birth-weight babies are at increased risk of serious health problems including chronic disabilities and even death.
• An analysis of Ohio birth certificates for the years 2004-2006 indicated 7.6 percent of babies born in Fairfield County were considered low birth weight babies. The statewide Ohio percentage for low birth-weight was 8.6 percent and the average annual percents for the counties in Ohio ranged from a low of 4.9 percent in Mercer County to a high of 11.9 percent in Lawrence County.
• Factors that increase the risk for low birth weight babies include: fetal birth defects, maternal chronic health problems, maternal diabetes, maternal cigarette smoking, maternal infections, fetal infections, maternal use of alcohol and illicit drugs, placental problems, and inadequate weight gain (March of Dimes, 2005).
The Ohio Department of Health 21
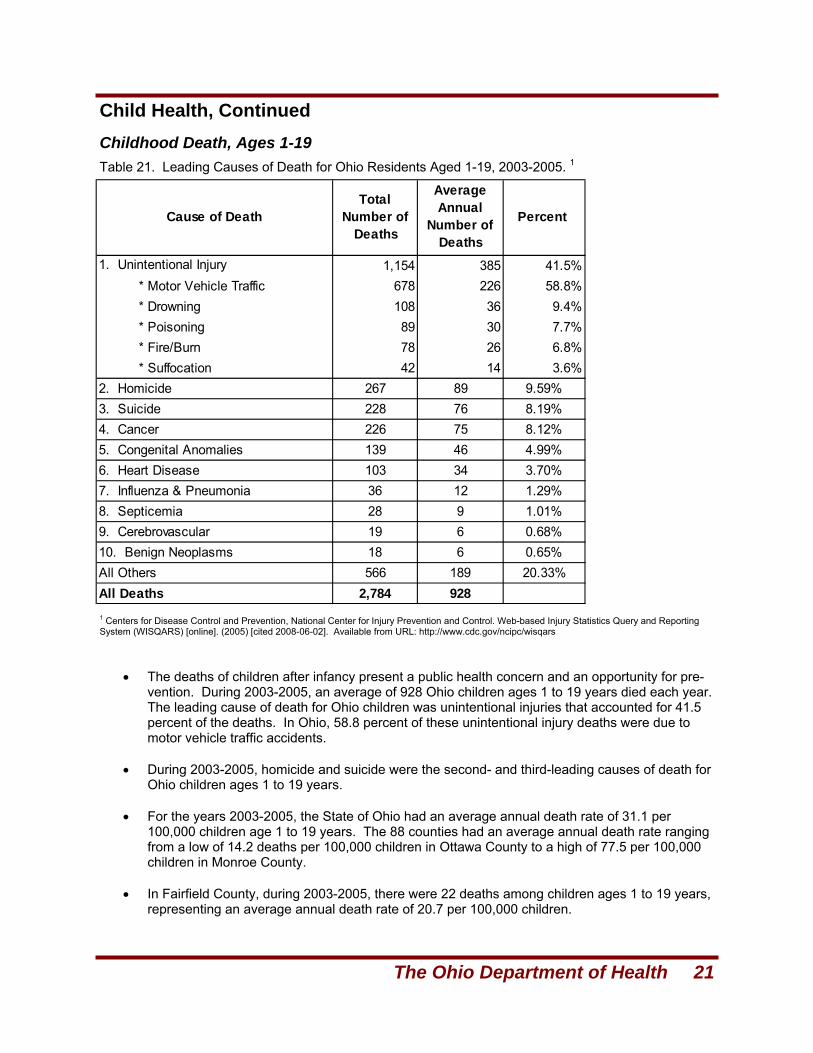
Child Health, Continued Childhood Death, Ages 1-19 Table 21. Leading Causes of Death for Ohio Residents Aged 1-19, 2003-2005. 1
1 Centers for Disease Control and Prevention, National Center for Injury Prevention and Control. Web-based Injury Statistics Query and Reporting System (WISQARS) [online]. (2005) [cited 2008-06-02]. Available from URL: http://www.cdc.gov/ncipc/wisqars
• The deaths of children after infancy present a public health concern and an opportunity for pre-vention. During 2003-2005, an average of 928 Ohio children ages 1 to 19 years died each year. The leading cause of death for Ohio children was unintentional injuries that accounted for 41.5 percent of the deaths. In Ohio, 58.8 percent of these unintentional injury deaths were due to motor vehicle traffic accidents.
• During 2003-2005, homicide and suicide were the second- and third-leading causes of death for
Ohio children ages 1 to 19 years. • For the years 2003-2005, the State of Ohio had an average annual death rate of 31.1 per
100,000 children age 1 to 19 years. The 88 counties had an average annual death rate ranging from a low of 14.2 deaths per 100,000 children in Ottawa County to a high of 77.5 per 100,000 children in Monroe County.
• In Fairfield County, during 2003-2005, there were 22 deaths among children ages 1 to 19 years,
representing an average annual death rate of 20.7 per 100,000 children.
1. Unintentional Injury 1,154 385 41.5% * Motor Vehicle Traffic 678 226 58.8% * Drowning 108 36 9.4% * Poisoning 89 30 7.7% * Fire/Burn 78 26 6.8% * Suffocation 42 14 3.6%
2. Homicide 267 89 9.59%3. Suicide 228 76 8.19%4. Cancer 226 75 8.12%5. Congenital Anomalies 139 46 4.99%6. Heart Disease 103 34 3.70%7. Influenza & Pneumonia 36 12 1.29%8. Septicemia 28 9 1.01%9. Cerebrovascular 19 6 0.68%10. Benign Neoplasms 18 6 0.65%All Others 566 189 20.33%All Deaths 2,784 928
Cause of DeathTotal
Number of Deaths
Average Annual
Number of Deaths
Percent
22 Healthy Ohio Community Profile: Fairfield County
Technical Notes (1) A Primary Care Health Professional Shortage Area (PC HPSA) is a defined service area or popula-tion that demonstrates a shortage of primary care physicians (i.e., family practitioners, general practitio-ners, general internists, obstetrician/gynecologists, and pediatricians). Service areas with a population to physician ratio of 3,500:1 or greater are considered to be PC HPSAs. The PC HPSA is a federal des-ignation which enables certain practice sites and health professionals to apply for recruitment and reten-tion assistance from state and federal programs. In Ohio, the Primary Care and Rural Health Section in the Bureau of Community Health Services and Systems Development (Division of Family and Commu-nity Health Services) provides technical assistance to communities in the HPSA process, and develops and submits HPSA applications to the federal Health Resources and Services Administration (HRSA). Authorization and detailed information regarding designation criteria may be found in 42 Code of Federal Regulations (CFR), Chapter 1; Part 5 (October 1, 1993, pp. 34-48) entitled Designation of Health Profes-sional(s) Shortage Areas. For further information regarding PC HPSAs, please contact the Bureau of Community Health Services and Systems Development (BCHSSD) at [email protected]. (2) The 10 leading underlying causes of resident deaths, based on the average annual number of deaths for Ohio and the 88 counties, were obtained from the Statistical Analysis Unit, Office of Vital Sta-tistics, Ohio Department of Health, for the years 2004-2006. The 10 leading causes with the relevant International Classification of Disease (ICD) codes are: Diseases of the Heart (I00-I09), Cancer (C00-C97), Stroke (I60-I69), Chronic Lower Respiratory Disease (J40-J47), Diabetes Mellitus (E10-E14), Un-intentional Injuries (V01-V59, Y85-Y86), Influenza and Pneumonia (J10-J18), Alzheimer’s Disease (G30), Nephritis, Nephrotic Syndrome and Nephrosis (N00-N07, N17-N19, N25-N27), and Septicemia (A40-A41). The rates are age adjusted using 11 age groups: <1, 1-4, 5-14, 15-24, 25-34, 35-44, 45-54, 55-64, 65-74, 75-84, 85+, and are age-adjusted to the U.S. 2000 standard population. (3) The Ohio Behavioral Risk Factor Surveillance System self-reported data are collected from tele-phone surveys of randomly selected, non-institutional residents age 18 years and older. Direct preva-lence estimates were made for Ohio and for the eight counties where a sample of 400 or more residents was available: Cuyahoga, Franklin, Hamilton, Lucas, Mahoning, Montgomery, Stark and Summit. For Ohio and these eight counties the weighted percentages were adjusted to: 1) probability of selection, i.e. number of phone numbers per household, adults per household and completed interviews; and 2) demographic distribution, i.e. age and gender. “Don’t know” and “Refused” responses were excluded from the analyses. The prevalence estimates for overweight and obesity were made using the self-reported height and weight to calculate a Body Mass Index (BMI) for each respondent using the formula: BMI = weight (pounds) divided by height2 (inches) x 703, Overweight = BMI of 25.0 to 29.9; Obese = BMI of 30.0 or greater. Synthetic estimates were made for the 88 counties using age- and gender spe-cific estimates for five regions, i.e. Central (Delaware, Fairfield, Franklin, Knox, Licking, Madison, Marion, Morrow, Pickaway and Union counties); Northeast (Ashland, Ashtabula, Columbiana, Cuya-hoga, Geauga, Holmes, Lake, Lorain, Mahoning, Medina, Portage, Stark, Summit and Trumbull coun-ties); Southeast (Athens, Belmont, Carroll, Coshocton, Gallia, Guernsey, Harrison, Hocking, Jackson, Jefferson, Lawrence, Meigs, Monroe, Morgan, Muskingum, Noble, Perry, Tuscarawas, Vinton and Washington counties); Southwest (Adams, Brown, Butler, Champaign, Clark, Clermont, Clinton, Darke, Fayette, Greene, Hamilton, Highland, Logan, Miami, Montgomery, Pike, Preble, Ross, Scioto, Shelby and Warren counties) and Northwest (Allen, Auglaize, Crawford, Defiance, Erie, Fulton, Hancock, Har-din, Henry, Huron, Lucas, Mercer, Ottawa, Paulding, Putnam, Richland, Sandusky, Seneca, Van Wert, Williams, Wood and Wyandot counties). Because the sample has been drawn from the non-institutionalized population and includes only those persons well enough to engage in a telephone con-versation, the prevalence of diabetes, history of high blood pressure, elevated cholesterol, heart attack and coronary heart disease are most likely underestimated. (4) Cancer Incidence = newly diagnosed cases of invasive cancer among Ohio and county residents for diagnosis years 2001-2005 for all cancer sites and types combined, breast, cervix, colon and rectum, lung and bronchus, melanoma of the skin and prostate. Cases identified through the Ohio
The Ohio Department of Health 23
References
Technical Notes, Continued Cancer Incidence Surveillance System were classified using the following International Classification of Diseases for Oncology, Third Edition (World Health Organization, Geneva, Switzerland, 2000) codes: all cancer sites and types (C000-C809), breast (C500-C509), cervix (C530-C539), colon and rectum (C180-189; C199; C209; C260), lung and bronchus (C340-C349), melanoma of the skin (C440-C449, histology types 8720-8790), and prostate (C619), excluding histology types 9590-9989 for breast, cervix, colon and rectum, lung and bronchus, melanoma of the skin, and prostate. *Cancer Mortality = Ohio and county resident deaths for the years 2001-2005 when the underlying cause of death was determined to be cancer. Cancer deaths were categorized using the following Inter-national Classification of Diseases, Tenth Edition (ICD-10) codes: all cancer sites and types (ICD C000-C979), breast (C500-C509), cervix (C530-C539), colon and rectum (C180-C209;C260), lung and bron-chus (C340-C349), melanoma of the skin (C430-C439), and prostate (C610-C619). Deaths were identi-fied through the Office of Vital Statistics, Ohio Department of Health, 2008. *The 2001-2005 rates per 100,000 were calculated using vintage 2006 postcensal estimates for July 1, 2001-2005, (U.S. Census Bureau, 2007). Rates are direct age adjusted to the U.S. 2000 standard population. (5) Injury deaths were identified from Ohio certificates of death collected by the Statistical Analysis Unit, Office of Vital Statistics at the Ohio Department of Health when the underlying-cause-of-death was any unintentional injury, International Classification of Disease Codes (ICD), [10th Revision, World Health Organization, 2000] Vol. – Y59, Y85-Y86; unintentional falls, ICD W00-W19; unintentional poisonings, ICD X40-X49; unintentional motor vehicle crashes, V02-V04 (.9, .9), V09.2, V12-V14 (.3-.9), (V19 (.4-.6), V20-V28 (.3-.9), V29 (.4-.9), V30-V39, (.4-.9), V40-V49 (.4-.9), V50-V59 (.4-.9), V60-V69 (.4-.9), V70-V79 (.4-.9), V80 (.3-.5), V81.1, V82.1, V83-V86 (.0-.3), V87 (.0-.8), V89.2; suicide X60-X84, Y87.0, U03; and homicide, X85-Y09, Y87.1, U01, U02 with death occurring in the years 2004-2006. The age ad-justed rates used 18 age groups: <5, 5-9, 10-14, 15-19, 20-24, 25-29, 30-34, 35-39, 40-44, 45-49, 50-54, 55-59, 60-64, 65-69, 70-74, 75-79, 80-84 and 85+. Rates are age adjusted to the U.S. 2000 stan-dard population. The 2004-2006 rates used the population from the U.S. Census/National Center for Health Statistics bridged population estimates, 2006 vintage. Rate calculations from Injury Prevention Program, Bureau of Health Promotion and Risk Reduction, Office of Healthy Ohio, Ohio Department of Health, May 2008. (6) The Ohio Department of Health invited a random sample of public elementary schools, within each Ohio county (Union County choose not to participate), to participate in a BMI and oral health assess-ment in the 2004-2005 school year. From 387 participating schools, 14,543 children, whose parents provided written permission, were weighed and measured by volunteer trained local health profession-als, resulting in valid BMI estimates for 14,451 students. BMI is a measure that compares weight to height and is interpreted differently for children than adults. For children, BMI is compared to other children of the same age and sex to give a “BMI-for-age” percentile. In this assessment, the third-grade children were classified as overweight that had a BMI-for-age > 95th percentile.
American Cancer Society. All about Cervical Cancer. Retrieved: May 7, 2008. http://www.cancer.org/docroot/CRI/CRI_2x.asp?sitearea=&dt=8. 2008.
American Cancer Society. What is Cancer? Retrieved: May 7, 2008. http://www.cancer.org. 2008. American Cancer Society, Ohio Division, Ohio Department of Health, The Ohio State University. Ohio Cancer Facts & Figures. 2007. American Diabetes Association. Diabetes Complications and Related Concerns. Retrieved: May 6, 2008. http://www.diabetes.org/for-parents-and-kids/what-is-diabetes/complications.jsp. 2008. American Heart Association. Atherosclerosis. Retrieved: June 17, 2008. http://www.americanheart.org/
presenter.jhtml?identifier=4440. 2007. American Heart Association. Heart Attack, Stroke and Cardiac Arrest Warning Signs. Retrieved: May 21, 2008.
http://www.americanheart.org/presenter.jhtml?identifier=3053. 2008. American Heart Association. Risk Factors and Coronary Heart Disease. Retrieved: April 30, 2008.
http://www.americanheart.org/presenter.jhtml?identifier=4726. 2008.
24 Healthy Ohio Community Profile: Fairfield County
References, Continued American Heart Association. Stroke Risk Factors. Retrieved: June 17, 2008. http://www.americanheart.org/
presenter.jhtml?identifier=4716. 2007. Benjamin SM, Valdez R, Geiss LS, et al. Estimated Number of Adults With Pre-diabetes in the U.S. in 2000,
Diabetes Care 2003; 26 (3): 645-649. Bull FC, Armstrong TP, Dixon T, Han S, Weiman A, Pratt M. Physical Inactivity, pp. 729-881. IN: Ezzati M, Lopez
AD, Rodgers A, and Murray CJL (Editors). Comparative Quantifications of Health Risks, World Health Organiza-tion, 2004.
Centers for Disease Control and Prevention (CDC). About Heart Disease. Retrieved: April 30, 2008. http://www.cdc.gov/heartdisease/about.htm. Nov. 15, 2007.
Centers for Disease Control and Prevention (CDC). Arthritis Foundation. Association of State and Territorial Health Officials. National Arthritis Action Plan: A Public Health Strategy. 1999.
Centers for Disease Control and Prevention (CDC). Heart Disease Facts and Statistics. Retrieved: April 30, 2008. http://www.cdc.gov/heartdisease/facts.htm. Nov. 15, 2007.
Centers for Disease Control and Prevention. (CDC) National diabetes fact sheet: general information and national estimates on diabetes in the United States, 2005. Atlanta, GA: U.S. Department of Health and Human Services, Centers for Disease Control and Prevention, 2005. Internet: http://www.cdc.gov/diabetes
Centers for Disease Control and Prevention (CDC). Suicide: Facts at a Glance. Retrieved: April 30, 2008. http://www.cdc.gov/ncipc/dvp/Suicide/SuicideDataSheet.pdf. Summer 2007.
Centers for Disease and Prevention (CDC). Targeting Arthritis: Improving Quality of Life for More than 46 Million Americans. National Center for Chronic Disease Prevention and Health Promotion. Atlanta, GA. 2008. http://www.cdc.gov/arthritis. 2008.
Cowie CC, Rust KF, Byrd-Holt D, et al. Prevalence of Diabetes and Impaired Fasting Glucose in Adults – United States, 1999-2000. Morbidity and Mortality Weekly Report, 2003; 52 (35): 833-837.
Ezzati M, Lopez AD. Smoking and Oral Tobacco Use, pp. 883-957. IN: Ezzati M, Lopez AD, Rodgers A, and Murray CJL (Editors). Comparative Quantifications of Health Risks, World Health Organization, 2004.
James WPT, Jackson-Leach R, Mhurchu CN, Kalamara E, Shayeshi M, Rigby NJ, Nishida C, and Rodgers A. Overweight and Obesity (High Body Mass Index). IN: Ezzati M, Lopez AD, Rodgers A, and Murray CJL (Editors). Comparative Quantifications of Health Risks, World Health Organization, 2004.
Lock K, Pomerleau J, Causer L, and McKee M. Low Fruit and Vegetable Consumption, pp. 597-728. IN: Ezzati M, Lopez AD, Rodgers A, and Murray CJL (Editors). Comparative Quantifications of Health Risks, World Health Organization, 2004.
March of Dimes: About Us. Nearly 28,000 U.S. Infants Died in 2004-Preterm Birth Contributes More than One-Third of Infant Deaths. Retrieved May 29, 2008. http://search.marchofdimes.com/cgi-bin/MsmGo.exe?grab_id=4&page_id=8325120&query=infant+deaths&hiword=DEATH+INFANCY+INFANTS+deaths+infant. May 2, 2007.
March of Dimes: Professional and Researchers. Low Birth weight. Retrieved: May 29, 2008. http://search.marchofdimes.com/cgi-bin/MsmGo.exe?grab_id=4&page_id=10093056&query=low+birhtweight&hiword=low. November 2005.
March of Dimes: Professionals and Researchers. Smoking During Pregnancy. Retrieved: May 29, 2008. http://search.marchofdimes.com/cgi-bin/MsmGo.exe?grab_id=4&page_id=5248512&query=smoking+during+pregnancy&hiword=PREGNANCIES+PREGNANT+during+pregnancy+smoking. April 2008.
National Cancer Institute. DevCan: Probability of Developing or Dying of Cancer Software. Version 6.2.; Statistical Research and Applications Branch. Retrieved: June 3, 2008. http://srab.cancer.gov/devcan. 2005.
National Stroke Association. Stroke Risk Reduction: Uncontrollable Risk Factors. Retrieved: April 29, 2008. http://www.stroke.org/site/PageServer?pagename=UNCONT. 2008.
Ohio Department of Health. The Health Consequences of Cigarette Smoking among Ohioans. Bureau of Health Promotion and Risk Reduction/Bureau of Health Surveillance; Division of Prevention, February, 2006.
Ohio Department of Health. Ohio Residual Deaths Data, 2004-2004. Statistical Analysis Unit, Office of Vital Statis-tics, 2008.
Ohio Department of Health. A Report on Body Mass Index of Ohio’s Third Grade Students, 2004-2005. School and Adolescent Health Section. Division of Family and Community Health Services, 2007.
Rehm J, Room R, Monteiro M, Gmel G, Grahan K, Rehn N, Sempos CT, Frick U, and Jernigan D. Alcohol Use, pp. 960-1108. IN: Ezzati M, Lopez AD, Rodgers A, and Murray CJL (Editors). Comparative Quantifications of Health Risks, World Health Organization, 2004.