Embed Size (px)
Citation preview
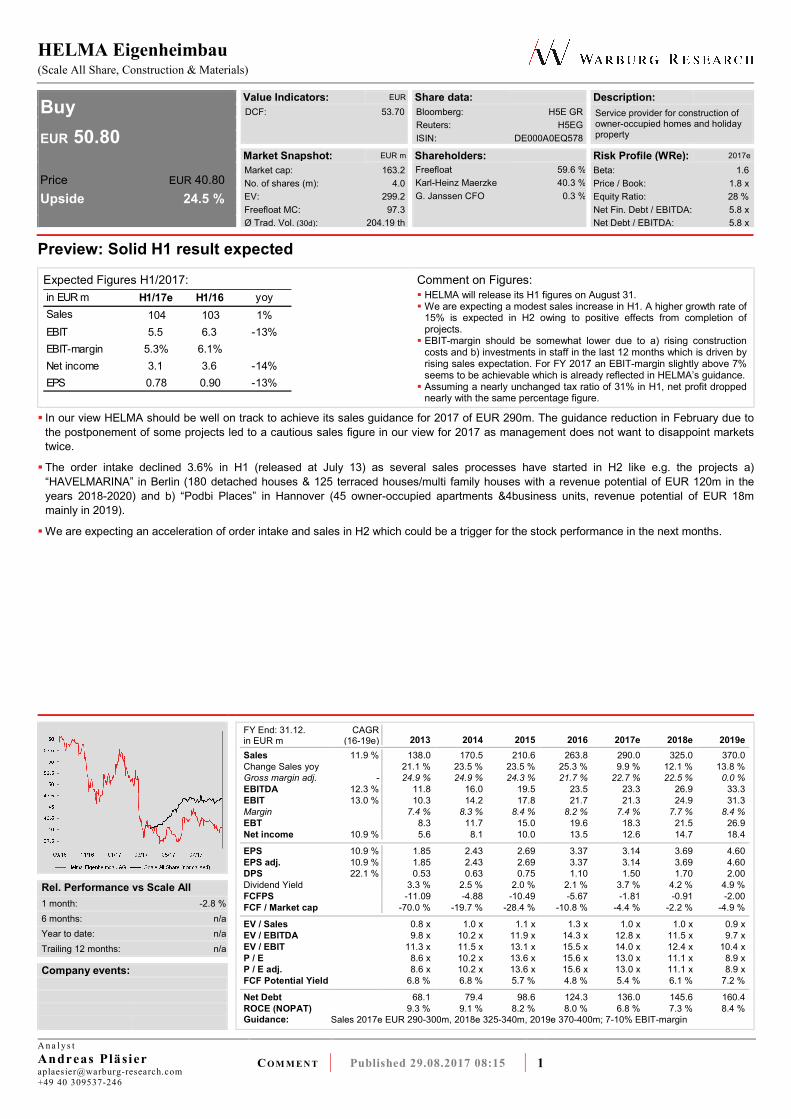
HELMA Eigenheimbau (Scale All Share, Construction & Materials)
A n a l y s t
Andreas Pläsier [email protected]
+49 40 309537-246
CO M M E N T Published 29.08.2017 08:15 1
Buy
EUR 50.80
Price EUR 40.80
Upside 24.5 %
Value Indicators: EUR Share data: Description:
DCF: 53.70
Bloomberg: H5E GR
Reuters: H5EG
ISIN: DE000A0EQ578
Service provider for construction of owner-occupied homes and holiday property
Market Snapshot: EUR m Shareholders: Risk Profile (WRe): 2017e
Market cap: 163.2
No. of shares (m): 4.0
EV: 299.2
Freefloat MC: 97.3
Ø Trad. Vol. (30d): 204.19 th
Freefloat 59.6 %
Karl-Heinz Maerzke 40.3 %
G. Janssen CFO 0.3 %
Beta: 1.6
Price / Book: 1.8 x
Equity Ratio: 28 %
Net Fin. Debt / EBITDA: 5.8 x
Net Debt / EBITDA: 5.8 x
Preview: Solid H1 result expected
Expected Figures H1/2017: Comment on Figures: in EUR m H1/17e H1/16 yoy
Sales 104 103 1%
EBIT 5.5 6.3 -13%
EBIT-margin 5.3% 6.1%
Net income 3.1 3.6 -14%
EPS 0.78 0.90 -13%
� HELMA will release its H1 figures on August 31. � We are expecting a modest sales increase in H1. A higher growth rate of
15% is expected in H2 owing to positive effects from completion of projects.
� EBIT-margin should be somewhat lower due to a) rising construction costs and b) investments in staff in the last 12 months which is driven by rising sales expectation. For FY 2017 an EBIT-margin slightly above 7% seems to be achievable which is already reflected in HELMA’s guidance.
� Assuming a nearly unchanged tax ratio of 31% in H1, net profit dropped nearly with the same percentage figure.
� In our view HELMA should be well on track to achieve its sales guidance for 2017 of EUR 290m. The guidance reduction in February due to
the postponement of some projects led to a cautious sales figure in our view for 2017 as management does not want to disappoint markets
twice.
� The order intake declined 3.6% in H1 (released at July 13) as several sales processes have started in H2 like e.g. the projects a)
“HAVELMARINA” in Berlin (180 detached houses & 125 terraced houses/multi family houses with a revenue potential of EUR 120m in the
years 2018-2020) and b) “Podbi Places” in Hannover (45 owner-occupied apartments &4business units, revenue potential of EUR 18m
mainly in 2019).
� We are expecting an acceleration of order intake and sales in H2 which could be a trigger for the stock performance in the next months.
FY End: 31.12. in EUR m
CAGR (16-19e) 2013 2014 2015 2016 2017e 2018e 2019e
Sales 11.9 % 138.0 170.5 210.6 263.8 290.0 325.0 370.0
Change Sales yoy 21.1 % 23.5 % 23.5 % 25.3 % 9.9 % 12.1 % 13.8 %
Gross margin adj. - 24.9 % 24.9 % 24.3 % 21.7 % 22.7 % 22.5 % 0.0 %
EBITDA 12.3 % 11.8 16.0 19.5 23.5 23.3 26.9 33.3
EBIT 13.0 % 10.3 14.2 17.8 21.7 21.3 24.9 31.3
Margin 7.4 % 8.3 % 8.4 % 8.2 % 7.4 % 7.7 % 8.4 %
EBT 8.3 11.7 15.0 19.6 18.3 21.5 26.9
Net income 10.9 % 5.6 8.1 10.0 13.5 12.6 14.7 18.4
EPS 10.9 % 1.85 2.43 2.69 3.37 3.14 3.69 4.60
EPS adj. 10.9 % 1.85 2.43 2.69 3.37 3.14 3.69 4.60
DPS 22.1 % 0.53 0.63 0.75 1.10 1.50 1.70 2.00
Dividend Yield 3.3 % 2.5 % 2.0 % 2.1 % 3.7 % 4.2 % 4.9 %
FCFPS -11.09 -4.88 -10.49 -5.67 -1.81 -0.91 -2.00
FCF / Market cap -70.0 % -19.7 % -28.4 % -10.8 % -4.4 % -2.2 % -4.9 %
EV / Sales 0.8 x 1.0 x 1.1 x 1.3 x 1.0 x 1.0 x 0.9 x
EV / EBITDA 9.8 x 10.2 x 11.9 x 14.3 x 12.8 x 11.5 x 9.7 x
EV / EBIT 11.3 x 11.5 x 13.1 x 15.5 x 14.0 x 12.4 x 10.4 x
P / E 8.6 x 10.2 x 13.6 x 15.6 x 13.0 x 11.1 x 8.9 x
P / E adj. 8.6 x 10.2 x 13.6 x 15.6 x 13.0 x 11.1 x 8.9 x
FCF Potential Yield 6.8 % 6.8 % 5.7 % 4.8 % 5.4 % 6.1 % 7.2 %
Net Debt 68.1 79.4 98.6 124.3 136.0 145.6 160.4
ROCE (NOPAT) 9.3 % 9.1 % 8.2 % 8.0 % 6.8 % 7.3 % 8.4 % Guidance: Sales 2017e EUR 290-300m, 2018e 325-340m, 2019e 370-400m; 7-10% EBIT-margin
Rel. Performance vs Scale All
1 month: -2.8 %
6 months: n/a
Year to date: n/a
Trailing 12 months: n/a
Company events:
HELMA Eigenheimbau
CO M M E N T Publ ished 29 .08 .2017 2
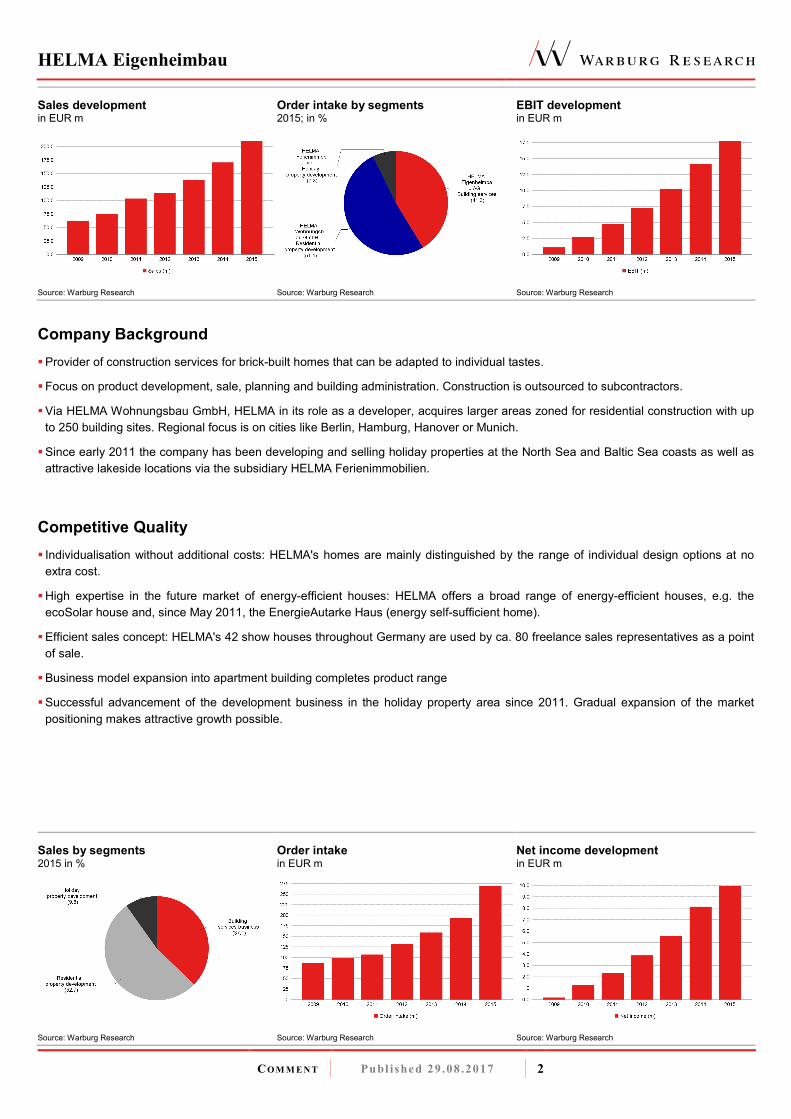
Sales development in EUR m
Source: Warburg Research
Order intake by segments 2015; in %
Source: Warburg Research
EBIT development in EUR m
Source: Warburg Research
Company Background
� Provider of construction services for brick-built homes that can be adapted to individual tastes.
� Focus on product development, sale, planning and building administration. Construction is outsourced to subcontractors.
� Via HELMA Wohnungsbau GmbH, HELMA in its role as a developer, acquires larger areas zoned for residential construction with up
to 250 building sites. Regional focus is on cities like Berlin, Hamburg, Hanover or Munich.
� Since early 2011 the company has been developing and selling holiday properties at the North Sea and Baltic Sea coasts as well as
attractive lakeside locations via the subsidiary HELMA Ferienimmobilien.
Competitive Quality
� Individualisation without additional costs: HELMA's homes are mainly distinguished by the range of individual design options at no
extra cost.
� High expertise in the future market of energy-efficient houses: HELMA offers a broad range of energy-efficient houses, e.g. the
ecoSolar house and, since May 2011, the EnergieAutarke Haus (energy self-sufficient home).
� Efficient sales concept: HELMA's 42 show houses throughout Germany are used by ca. 80 freelance sales representatives as a point
of sale.
� Business model expansion into apartment building completes product range
� Successful advancement of the development business in the holiday property area since 2011. Gradual expansion of the market
positioning makes attractive growth possible.
Sales by segments 2015 in %
Source: Warburg Research
Order intake in EUR m
Source: Warburg Research
Net income development in EUR m
Source: Warburg Research
HELMA Eigenheimbau
CO M M E N T Publ ished 29 .08 .2017 3
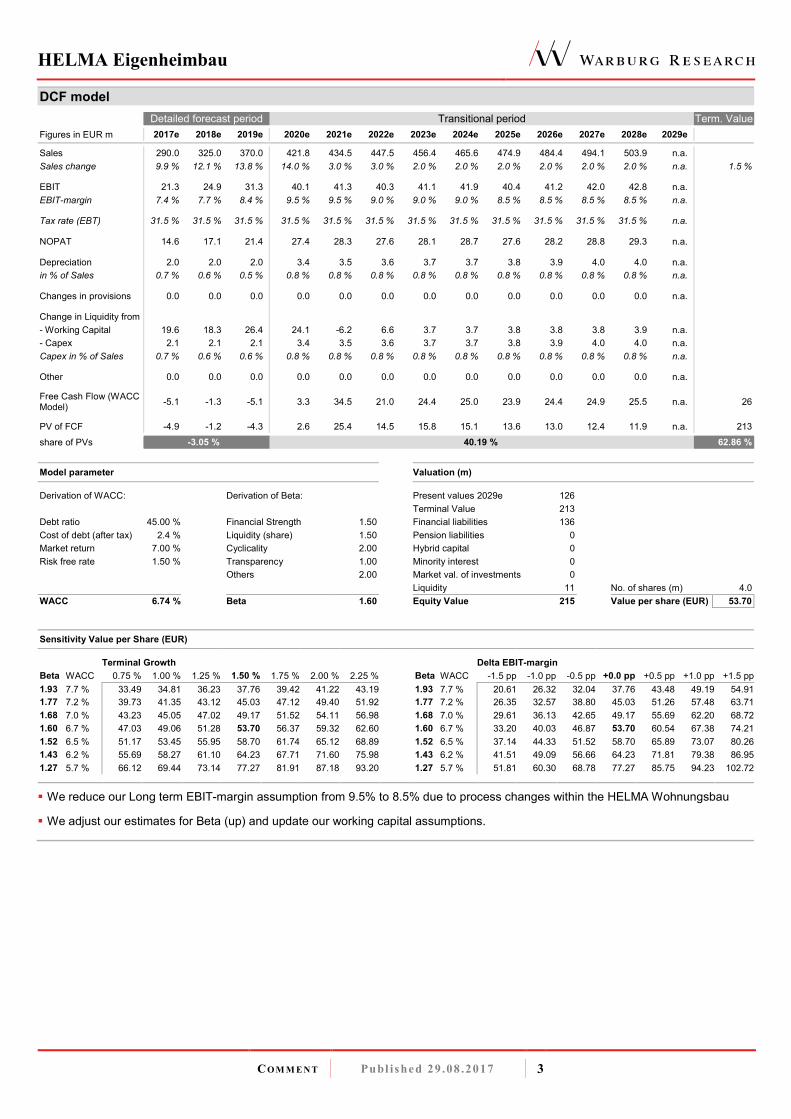
DCF model
Detailed forecast period Transitional period Term. Value
Figures in EUR m 2017e 2018e 2019e 2020e 2021e 2022e 2023e 2024e 2025e 2026e 2027e 2028e 2029e
Sales 290.0 325.0 370.0 421.8 434.5 447.5 456.4 465.6 474.9 484.4 494.1 503.9 n.a.
Sales change 9.9 % 12.1 % 13.8 % 14.0 % 3.0 % 3.0 % 2.0 % 2.0 % 2.0 % 2.0 % 2.0 % 2.0 % n.a. 1.5 %
EBIT 21.3 24.9 31.3 40.1 41.3 40.3 41.1 41.9 40.4 41.2 42.0 42.8 n.a.
EBIT-margin 7.4 % 7.7 % 8.4 % 9.5 % 9.5 % 9.0 % 9.0 % 9.0 % 8.5 % 8.5 % 8.5 % 8.5 % n.a.
Tax rate (EBT) 31.5 % 31.5 % 31.5 % 31.5 % 31.5 % 31.5 % 31.5 % 31.5 % 31.5 % 31.5 % 31.5 % 31.5 % n.a.
NOPAT 14.6 17.1 21.4 27.4 28.3 27.6 28.1 28.7 27.6 28.2 28.8 29.3 n.a.
Depreciation 2.0 2.0 2.0 3.4 3.5 3.6 3.7 3.7 3.8 3.9 4.0 4.0 n.a.
in % of Sales 0.7 % 0.6 % 0.5 % 0.8 % 0.8 % 0.8 % 0.8 % 0.8 % 0.8 % 0.8 % 0.8 % 0.8 % n.a.
Changes in provisions 0.0 0.0 0.0 0.0 0.0 0.0 0.0 0.0 0.0 0.0 0.0 0.0 n.a.
Change in Liquidity from
- Working Capital 19.6 18.3 26.4 24.1 -6.2 6.6 3.7 3.7 3.8 3.8 3.8 3.9 n.a.
- Capex 2.1 2.1 2.1 3.4 3.5 3.6 3.7 3.7 3.8 3.9 4.0 4.0 n.a.
Capex in % of Sales 0.7 % 0.6 % 0.6 % 0.8 % 0.8 % 0.8 % 0.8 % 0.8 % 0.8 % 0.8 % 0.8 % 0.8 % n.a.
Other 0.0 0.0 0.0 0.0 0.0 0.0 0.0 0.0 0.0 0.0 0.0 0.0 n.a.
Free Cash Flow (WACC Model)
-5.1 -1.3 -5.1 3.3 34.5 21.0 24.4 25.0 23.9 24.4 24.9 25.5 n.a. 26
PV of FCF -4.9 -1.2 -4.3 2.6 25.4 14.5 15.8 15.1 13.6 13.0 12.4 11.9 n.a. 213 share of PVs -3.05 % 40.19 % 62.86 %
Model parameter Valuation (m)
Derivation of WACC: Derivation of Beta: Present values 2029e 126
Terminal Value 213
Debt ratio 45.00 % Financial Strength 1.50 Financial liabilities 136
Cost of debt (after tax) 2.4 % Liquidity (share) 1.50 Pension liabilities 0
Market return 7.00 % Cyclicality 2.00 Hybrid capital 0
Risk free rate 1.50 % Transparency 1.00 Minority interest 0
Others 2.00 Market val. of investments 0
Liquidity 11 No. of shares (m) 4.0
WACC 6.74 % Beta 1.60 Equity Value 215 Value per share (EUR) 53.70
Sensitivity Value per Share (EUR)
Terminal Growth Delta EBIT-margin
Beta WACC 0.75 % 1.00 % 1.25 % 1.50 % 1.75 % 2.00 % 2.25 % Beta WACC -1.5 pp -1.0 pp -0.5 pp +0.0 pp +0.5 pp +1.0 pp +1.5 pp
1.93 7.7 % 33.49 34.81 36.23 37.76 39.42 41.22 43.19 1.93 7.7 % 20.61 26.32 32.04 37.76 43.48 49.19 54.91
1.77 7.2 % 39.73 41.35 43.12 45.03 47.12 49.40 51.92 1.77 7.2 % 26.35 32.57 38.80 45.03 51.26 57.48 63.71
1.68 7.0 % 43.23 45.05 47.02 49.17 51.52 54.11 56.98 1.68 7.0 % 29.61 36.13 42.65 49.17 55.69 62.20 68.72
1.60 6.7 % 47.03 49.06 51.28 53.70 56.37 59.32 62.60 1.60 6.7 % 33.20 40.03 46.87 53.70 60.54 67.38 74.21
1.52 6.5 % 51.17 53.45 55.95 58.70 61.74 65.12 68.89 1.52 6.5 % 37.14 44.33 51.52 58.70 65.89 73.07 80.26
1.43 6.2 % 55.69 58.27 61.10 64.23 67.71 71.60 75.98 1.43 6.2 % 41.51 49.09 56.66 64.23 71.81 79.38 86.95
1.27 5.7 % 66.12 69.44 73.14 77.27 81.91 87.18 93.20 1.27 5.7 % 51.81 60.30 68.78 77.27 85.75 94.23 102.72
� We reduce our Long term EBIT-margin assumption from 9.5% to 8.5% due to process changes within the HELMA Wohnungsbau
� We adjust our estimates for Beta (up) and update our working capital assumptions.
HELMA Eigenheimbau
CO M M E N T Publ ished 29 .08 .2017 4
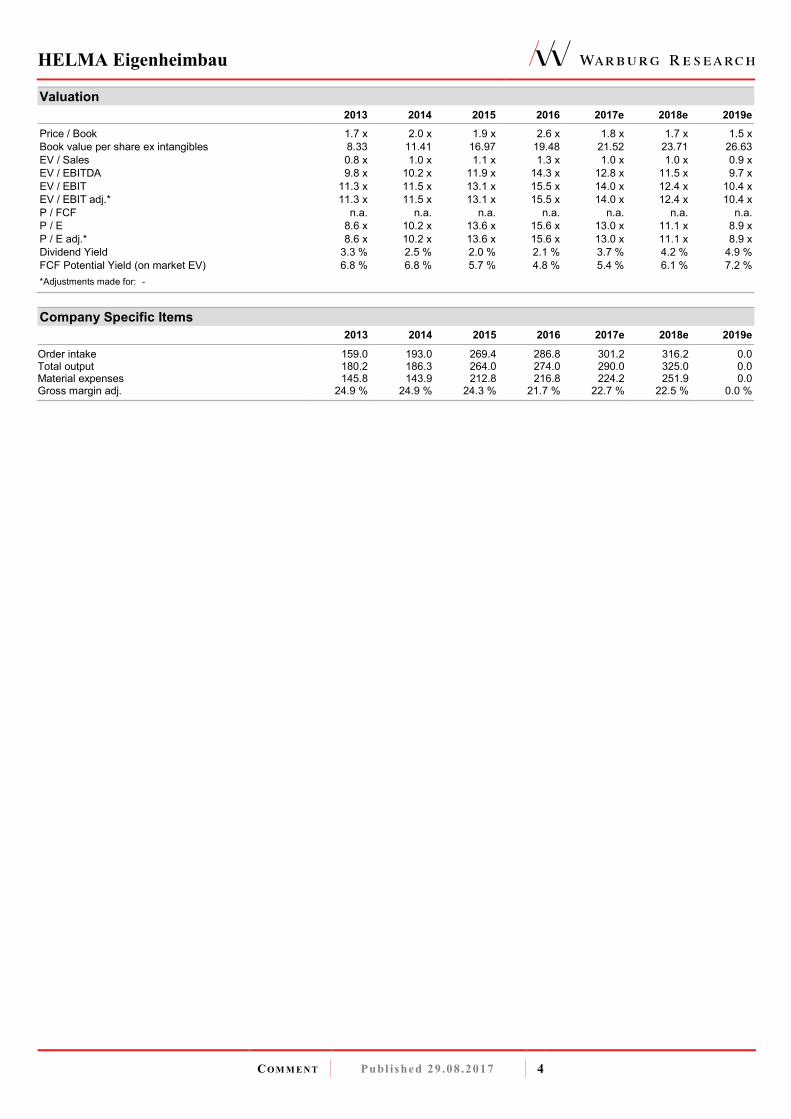
Valuation
2013 2014 2015 2016 2017e 2018e 2019e
Price / Book 1.7 x 2.0 x 1.9 x 2.6 x 1.8 x 1.7 x 1.5 x
Book value per share ex intangibles 8.33 11.41 16.97 19.48 21.52 23.71 26.63
EV / Sales 0.8 x 1.0 x 1.1 x 1.3 x 1.0 x 1.0 x 0.9 x
EV / EBITDA 9.8 x 10.2 x 11.9 x 14.3 x 12.8 x 11.5 x 9.7 x
EV / EBIT 11.3 x 11.5 x 13.1 x 15.5 x 14.0 x 12.4 x 10.4 x
EV / EBIT adj.* 11.3 x 11.5 x 13.1 x 15.5 x 14.0 x 12.4 x 10.4 x
P / FCF n.a. n.a. n.a. n.a. n.a. n.a. n.a.
P / E 8.6 x 10.2 x 13.6 x 15.6 x 13.0 x 11.1 x 8.9 x
P / E adj.* 8.6 x 10.2 x 13.6 x 15.6 x 13.0 x 11.1 x 8.9 x
Dividend Yield 3.3 % 2.5 % 2.0 % 2.1 % 3.7 % 4.2 % 4.9 %
FCF Potential Yield (on market EV) 6.8 % 6.8 % 5.7 % 4.8 % 5.4 % 6.1 % 7.2 %
*Adjustments made for: -
Company Specific Items
2013 2014 2015 2016 2017e 2018e 2019e
Order intake 159.0 193.0 269.4 286.8 301.2 316.2 0.0 Total output 180.2 186.3 264.0 274.0 290.0 325.0 0.0 Material expenses 145.8 143.9 212.8 216.8 224.2 251.9 0.0 Gross margin adj. 24.9 % 24.9 % 24.3 % 21.7 % 22.7 % 22.5 % 0.0 %
HELMA Eigenheimbau
CO M M E N T Publ ished 29 .08 .2017 5
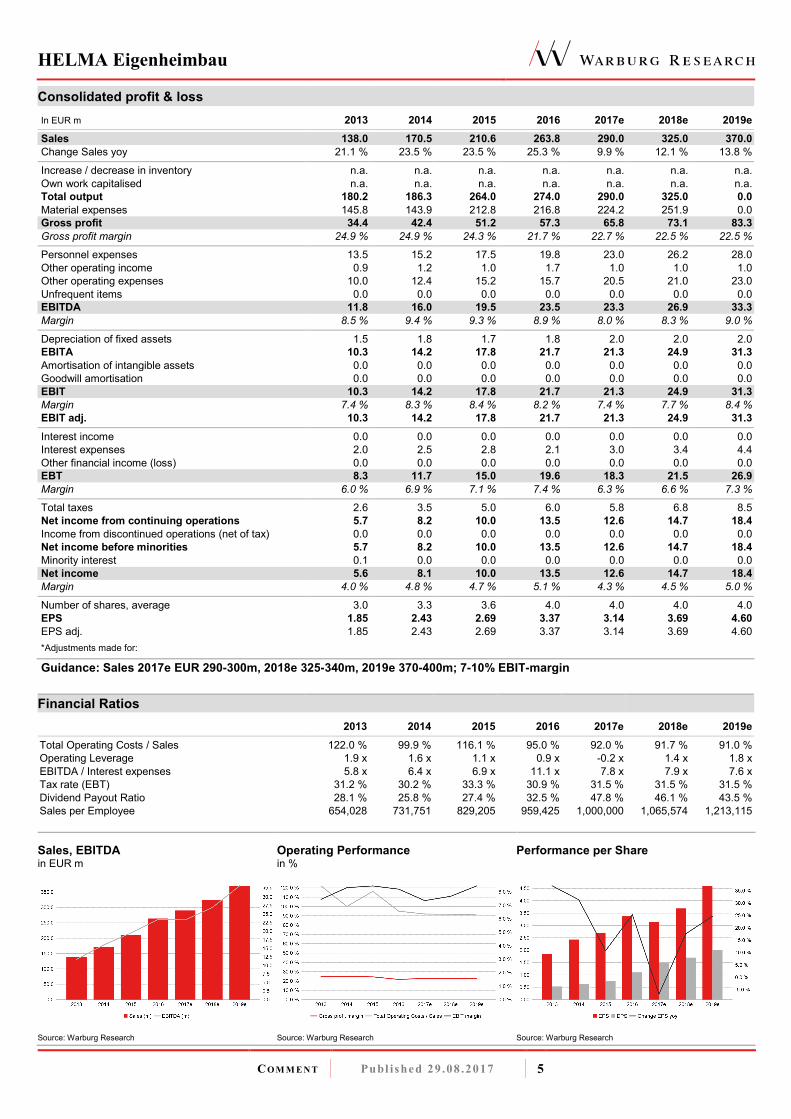
Consolidated profit & loss In EUR m 2013 2014 2015 2016 2017e 2018e 2019e
Sales 138.0 170.5 210.6 263.8 290.0 325.0 370.0
Change Sales yoy 21.1 % 23.5 % 23.5 % 25.3 % 9.9 % 12.1 % 13.8 % Increase / decrease in inventory n.a. n.a. n.a. n.a. n.a. n.a. n.a.
Own work capitalised n.a. n.a. n.a. n.a. n.a. n.a. n.a.
Total output 180.2 186.3 264.0 274.0 290.0 325.0 0.0
Material expenses 145.8 143.9 212.8 216.8 224.2 251.9 0.0
Gross profit 34.4 42.4 51.2 57.3 65.8 73.1 83.3
Gross profit margin 24.9 % 24.9 % 24.3 % 21.7 % 22.7 % 22.5 % 22.5 % Personnel expenses 13.5 15.2 17.5 19.8 23.0 26.2 28.0
Other operating income 0.9 1.2 1.0 1.7 1.0 1.0 1.0
Other operating expenses 10.0 12.4 15.2 15.7 20.5 21.0 23.0
Unfrequent items 0.0 0.0 0.0 0.0 0.0 0.0 0.0
EBITDA 11.8 16.0 19.5 23.5 23.3 26.9 33.3
Margin 8.5 % 9.4 % 9.3 % 8.9 % 8.0 % 8.3 % 9.0 %
Depreciation of fixed assets 1.5 1.8 1.7 1.8 2.0 2.0 2.0
EBITA 10.3 14.2 17.8 21.7 21.3 24.9 31.3
Amortisation of intangible assets 0.0 0.0 0.0 0.0 0.0 0.0 0.0
Goodwill amortisation 0.0 0.0 0.0 0.0 0.0 0.0 0.0
EBIT 10.3 14.2 17.8 21.7 21.3 24.9 31.3
Margin 7.4 % 8.3 % 8.4 % 8.2 % 7.4 % 7.7 % 8.4 %
EBIT adj. 10.3 14.2 17.8 21.7 21.3 24.9 31.3
Interest income 0.0 0.0 0.0 0.0 0.0 0.0 0.0
Interest expenses 2.0 2.5 2.8 2.1 3.0 3.4 4.4
Other financial income (loss) 0.0 0.0 0.0 0.0 0.0 0.0 0.0
EBT 8.3 11.7 15.0 19.6 18.3 21.5 26.9
Margin 6.0 % 6.9 % 7.1 % 7.4 % 6.3 % 6.6 % 7.3 % Total taxes 2.6 3.5 5.0 6.0 5.8 6.8 8.5
Net income from continuing operations 5.7 8.2 10.0 13.5 12.6 14.7 18.4
Income from discontinued operations (net of tax) 0.0 0.0 0.0 0.0 0.0 0.0 0.0
Net income before minorities 5.7 8.2 10.0 13.5 12.6 14.7 18.4
Minority interest 0.1 0.0 0.0 0.0 0.0 0.0 0.0
Net income 5.6 8.1 10.0 13.5 12.6 14.7 18.4
Margin 4.0 % 4.8 % 4.7 % 5.1 % 4.3 % 4.5 % 5.0 %
Number of shares, average 3.0 3.3 3.6 4.0 4.0 4.0 4.0
EPS 1.85 2.43 2.69 3.37 3.14 3.69 4.60
EPS adj. 1.85 2.43 2.69 3.37 3.14 3.69 4.60
*Adjustments made for:
Guidance: Sales 2017e EUR 290-300m, 2018e 325-340m, 2019e 370-400m; 7-10% EBIT-margin
Financial Ratios 2013 2014 2015 2016 2017e 2018e 2019e
Total Operating Costs / Sales 122.0 % 99.9 % 116.1 % 95.0 % 92.0 % 91.7 % 91.0 %
Operating Leverage 1.9 x 1.6 x 1.1 x 0.9 x -0.2 x 1.4 x 1.8 x
EBITDA / Interest expenses 5.8 x 6.4 x 6.9 x 11.1 x 7.8 x 7.9 x 7.6 x
Tax rate (EBT) 31.2 % 30.2 % 33.3 % 30.9 % 31.5 % 31.5 % 31.5 %
Dividend Payout Ratio 28.1 % 25.8 % 27.4 % 32.5 % 47.8 % 46.1 % 43.5 %
Sales per Employee 654,028 731,751 829,205 959,425 1,000,000 1,065,574 1,213,115
Sales, EBITDA in EUR m
Source: Warburg Research
Operating Performance in %
Source: Warburg Research
Performance per Share
Source: Warburg Research
HELMA Eigenheimbau
CO M M E N T Publ ished 29 .08 .2017 6
Consolidated balance sheet In EUR m 2013 2014 2015 2016 2017e 2018e 2019e
Assets
Goodwill and other intangible assets 2.1 1.9 1.9 2.2 2.2 2.2 2.2
thereof other intangible assets 0.7 0.5 0.5 0.8 0.8 0.8 0.8
thereof Goodwill 1.4 1.4 1.4 1.4 1.4 1.4 1.4
Property, plant and equipment 15.8 16.1 16.3 16.4 16.5 16.6 16.7
Financial assets 0.0 0.0 0.0 0.0 0.0 0.0 0.0
Other long-term assets 0.0 0.0 0.0 0.0 0.0 0.0 0.0
Fixed assets 18.2 18.3 18.5 18.6 18.7 18.8 18.9
Inventories 78.4 96.1 154.4 173.8 192.0 212.0 240.0
Accounts receivable 29.0 35.2 56.6 71.8 83.4 93.5 106.4
Liquid assets 6.8 6.9 12.5 11.3 14.8 14.7 12.2
Other short-term assets 4.3 3.4 3.0 2.7 2.7 2.7 2.7
Current assets 118.5 141.6 226.5 259.7 292.9 322.9 361.3
Total Assets 136.6 159.9 245.0 278.2 311.6 341.7 380.2
Liabilities and shareholders' equity
Subscribed capital 3.1 3.4 4.0 4.0 4.0 4.0 4.0
Capital reserve 14.5 20.8 41.5 41.5 41.5 41.5 41.5
Retained earnings 0.2 7.1 11.5 14.7 22.8 31.6 43.2
Other equity components 10.1 9.5 12.8 19.9 19.9 19.9 20.0
Shareholders' equity 27.9 40.8 69.8 80.1 88.3 97.0 108.7
Minority interest 0.2 0.1 0.1 0.1 0.1 0.1 0.1
Total equity 28.1 41.0 69.9 80.2 88.4 97.1 108.8
Provisions 7.9 8.7 32.3 24.9 32.0 41.4 53.8
thereof provisions for pensions and similar obligations 0.0 0.0 0.0 0.0 0.0 0.0 0.0
Financial liabilities (total) 74.9 86.3 111.1 135.7 150.7 160.3 172.6
thereof short-term financial liabilities 21.6 14.5 50.7 32.4 25.7 20.7 22.8
Accounts payable 7.3 6.7 8.1 9.7 12.7 15.1 17.2
Other liabilities 18.4 17.2 23.7 27.8 27.8 27.8 27.8
Liabilities 108.5 119.0 175.1 198.0 223.2 244.6 271.4
Total liabilities and shareholders' equity 136.6 159.9 245.0 278.2 311.6 341.7 380.2
Financial Ratios 2013 2014 2015 2016 2017e 2018e 2019e
Efficiency of Capital Employment
Operating Assets Turnover 1.2 x 1.2 x 1.0 x 1.0 x 1.0 x 1.1 x 1.1 x
Capital Employed Turnover 1.4 x 1.4 x 1.3 x 1.3 x 1.3 x 1.3 x 1.4 x
ROA 30.8 % 44.4 % 53.7 % 72.7 % 67.2 % 78.5 % 97.4 %
Return on Capital
ROCE (NOPAT) 9.3 % 9.1 % 8.2 % 8.0 % 6.8 % 7.3 % 8.4 %
ROE 23.2 % 23.7 % 18.0 % 18.0 % 14.9 % 15.9 % 17.9 %
Adj. ROE 23.2 % 23.7 % 18.0 % 18.0 % 14.9 % 15.9 % 17.9 %
Balance sheet quality
Net Debt 68.1 79.4 98.6 124.3 136.0 145.6 160.4
Net Financial Debt 68.1 79.4 98.6 124.3 135.9 145.6 160.4
Net Gearing 242.5 % 193.9 % 141.1 % 155.0 % 153.8 % 149.9 % 147.4 %
Net Fin. Debt / EBITDA 578.0 % 497.1 % 505.7 % 530.0 % 582.7 % 540.7 % 482.4 %
Book Value / Share 9.0 12.0 17.4 20.0 22.1 24.3 27.2
Book value per share ex intangibles 8.3 11.4 17.0 19.5 21.5 23.7 26.6
ROCE Development
Source: Warburg Research
Net debt in EUR m
Source: Warburg Research
Book Value per Share in EUR
Source: Warburg Research
HELMA Eigenheimbau
CO M M E N T Publ ished 29 .08 .2017 7
Consolidated cash flow statement In EUR m 2013 2014 2015 2016 2017e 2018e 2019e
Net income 5.7 8.2 10.0 13.5 12.6 14.7 18.4
Depreciation of fixed assets 1.5 1.8 1.7 1.8 2.0 2.0 2.0
Amortisation of goodwill 0.0 0.0 0.0 0.0 0.0 0.0 0.0
Amortisation of intangible assets 0.0 0.0 0.0 0.0 0.0 0.0 0.0
Increase/decrease in long-term provisions 0.0 0.5 -0.5 0.0 0.0 0.0 0.0
Other non-cash income and expenses 3.3 0.3 1.1 0.0 1.0 1.0 1.0
Cash Flow before NWC change 10.5 10.8 12.3 15.3 15.6 17.7 21.4
Increase / decrease in inventory -42.6 -17.6 -58.3 -19.4 -18.2 -20.0 -28.0
Increase / decrease in accounts receivable -1.2 -6.2 -21.4 -15.2 -11.6 -10.1 -12.9
Increase / decrease in accounts payable 2.0 -0.6 1.3 1.6 3.0 2.4 2.1
Increase / decrease in other working capital positions 0.0 -1.1 28.5 -3.1 6.1 8.4 11.5
Increase / decrease in working capital (total) -41.8 -25.5 -49.9 -36.1 -20.7 -19.3 -27.3
Net cash provided by operating activities [1] -31.3 -14.3 -36.2 -20.8 -5.1 -1.6 -5.9
Investments in intangible assets -0.2 -0.2 0.0 0.0 0.0 0.0 0.0
Investments in property, plant and equipment -2.0 -1.9 -1.7 -1.9 -2.1 -2.1 -2.1
Payments for acquisitions 0.0 0.0 0.0 0.0 0.0 0.0 0.0
Financial investments 0.0 0.0 0.0 0.0 0.0 0.0 0.0
Income from asset disposals 0.0 0.0 0.1 0.0 0.0 0.0 0.0
Net cash provided by investing activities [2] -2.2 -2.1 -1.9 -1.9 -2.1 -2.1 -2.1
Change in financial liabilities 37.0 11.7 24.8 24.6 15.1 9.6 12.3
Dividends paid -1.1 -1.9 -2.5 -3.0 -4.4 -6.0 -6.8
Purchase of own shares 0.0 0.0 0.0 0.0 0.0 0.0 0.0
Capital measures 3.2 6.7 21.2 0.0 0.0 0.0 0.0
Other -0.6 0.0 0.3 -0.1 0.0 0.0 0.0
Net cash provided by financing activities [3] 38.6 16.4 43.7 21.5 10.7 3.6 5.5
Change in liquid funds [1]+[2]+[3] 5.1 0.1 5.6 -1.2 3.4 -0.1 -2.5
Effects of exchange-rate changes on cash 0.0 0.0 0.0 0.0 0.0 0.0 0.0
Cash and cash equivalent at end of period 6.6 6.9 12.5 11.3 14.8 14.7 12.2
Financial Ratios 2013 2014 2015 2016 2017e 2018e 2019e
Cash Flow
FCF -33.5 -16.3 -38.2 -22.7 -7.2 -3.7 -8.0
Free Cash Flow / Sales -24.2 % -9.6 % -18.0 % -8.6 % -2.5 % -1.1 % -2.2 %
Free Cash Flow Potential 7.9 11.0 13.1 16.0 16.2 18.7 23.4
Free Cash Flow / Net Profit -598.7 % -201.0 % -381.1 % -168.0 % -57.5 % -24.8 % -43.5 %
Interest Received / Avg. Cash 0.0 % 0.0 % 0.0 % 0.0 % 0.0 % 0.0 % 0.0 %
Interest Paid / Avg. Debt 3.6 % 3.1 % 2.9 % 1.7 % 2.1 % 2.2 % 2.6 %
Management of Funds
Investment ratio 1.6 % 1.2 % 0.8 % 0.7 % 0.7 % 0.6 % 0.6 %
Maint. Capex / Sales 0.9 % 0.8 % 0.7 % 0.5 % 0.5 % 0.4 % 0.4 %
Capex / Dep 142.9 % 115.5 % 98.7 % 106.0 % 105.0 % 105.0 % 105.0 %
Avg. Working Capital / Sales 57.4 % 65.9 % 77.7 % 83.2 % 86.0 % 85.1 % 83.7 %
Trade Debtors / Trade Creditors 396.2 % 522.4 % 701.7 % 740.2 % 656.7 % 619.2 % 618.6 %
Inventory Turnover n.a. n.a. n.a. n.a. n.a. n.a. n.a.
Receivables collection period (days) 77 75 98 99 105 105 105
Payables payment period (days) n.a. n.a. n.a. n.a. n.a. n.a. n.a.
Cash conversion cycle (Days) n.a. n.a. n.a. n.a. n.a. n.a. n.a.
CAPEX and Cash Flow in EUR m
Source: Warburg Research
Free Cash Flow Generation
Source: Warburg Research
Working Capital
Source: Warburg Research
HELMA Eigenheimbau
CO M M E N T Publ ished 29 .08 .2017 8
LEGAL DISCLAIMER
This research report (“investment recommendation” or “recommendation”) was prepared by the Warburg Research GmbH, a fully owned subsidiary of
the M.M.Warburg & CO (AG & Co.) KGaA and is passed on by the M.M.Warburg & CO (AG & Co.) KGaA. It contains selected information and does not
purport to be complete. The report is based on publicly available information and data ("the information") believed to be accurate and complete.
Warburg Research GmbH neither examines the information for accuracy and completeness, nor guarantees its accuracy and completeness. Possible
errors or incompleteness of the information do not constitute grounds for liability of M.M.Warburg & CO (AG & Co.) KGaA or Warburg Research GmbH
for damages of any kind whatsoever, and M.M.Warburg & CO (AG & Co.) KGaA and Warburg Research GmbH are not liable for indirect and/or direct
and/or consequential damages. In particular, neither M.M.Warburg & CO (AG & Co.) KGaA nor Warburg Research GmbH are liable for the statements,
plans or other details contained in these analyses concerning the examined companies, their affiliated companies, strategies, economic situations,
market and competitive situations, regulatory environment, etc. Although due care has been taken in compiling this research report, it cannot be
excluded that it is incomplete or contains errors. M.M.Warburg & CO (AG & Co.) KGaA and Warburg Research GmbH, their shareholders and
employees are not liable for the accuracy and completeness of the statements, estimations and the conclusions derived from the information contained
in this document. Provided a research report is being transmitted in connection with an existing contractual relationship, i.e. financial advisory or similar
services, the liability of M.M.Warburg & CO (AG & Co.) KGaA and Warburg Research GmbH shall be restricted to gross negligence and wilful
misconduct. In case of failure in essential tasks, M.M.Warburg & CO (AG & Co.) KGaA and Warburg Research GmbH are liable for normal negligence.
In any case, the liability of M.M.Warburg & CO (AG & Co.) KGaA and Warburg Research GmbH is limited to typical, expectable damages. This
research report does not constitute an offer or a solicitation of an offer for the purchase or sale of any security. Partners, directors or employees of
M.M.Warburg & CO (AG & Co.) KGaA, Warburg Research GmbH or affiliated companies may serve in a position of responsibility, i.e. on the board of
directors of companies mentioned in the report. Opinions expressed in this report are subject to change without notice. All rights reserved.
COPYRIGHT NOTICE
This work including all its parts is protected by copyright. Any use beyond the limits provided by copyright law without permission is prohibited and
punishable. This applies, in particular, to reproductions, translations, microfilming, and storage and processing on electronic media of the entire content
or parts thereof.
DISCLOSURE ACCORDING TO §34B OF THE GERMAN SECURITIES TRADING ACT (WHPG), THE ORDINANCE ON THE ANALYSIS OF FINANCIAL INSTRUMENTS (FINANV) AND MAR INCL. COMMISSION DELEGATED REGULATION (EU) 2016/958
The valuation underlying the investment recommendation for the company analysed here is based on generally accepted and widely used methods of
fundamental analysis, such as e.g. DCF Model, Free Cash Flow Potential, Peer Group Comparison or Sum of the Parts Model (see also
http://www.mmwarburg.de/disclaimer/disclaimer.htm#Valuation). The result of this fundamental valuation is modified to take into consideration the
analyst’s assessment as regards the expected development of investor sentiment and its impact on the share price.
Independent of the applied valuation methods, there is the risk that the price target will not be met, for instance because of unforeseen changes in
demand for the company’s products, changes in management, technology, economic development, interest rate development, operating and/or
material costs, competitive pressure, supervisory law, exchange rate, tax rate etc. For investments in foreign markets and instruments there are further
risks, generally based on exchange rate changes or changes in political and social conditions.
This commentary reflects the opinion of the relevant author at the point in time of its compilation. A change in the fundamental factors underlying the
valuation can mean that the valuation is subsequently no longer accurate. Whether, or in what time frame, an update of this commentary follows is not
determined in advance.
Additional internal and organisational arrangements to prevent or to deal with conflicts of interest have been implemented. Among these are the spatial
separation of Warburg Research GmbH from M.M.Warburg & CO (AG & Co.) KGaA and the creation of areas of confidentiality. This prevents the
exchange of information, which could form the basis of conflicts of interest for Warburg Research in terms of the analysed issuers or their financial
instruments.
The analysts of Warburg Research GmbH do not receive a gratuity – directly or indirectly – from the investment banking activities of M.M.Warburg &
CO (AG & Co.) KGaA or of any company within the Warburg Group.
All prices of financial instruments given in this investment recommendation are the closing prices on the last stock-market trading day before the
publication date stated, unless another point in time is explicitly stated.
M.M.Warburg & CO (AG & Co.) KGaA and Warburg Research GmbH are subject to the supervision of the Federal Financial Supervisory Authority,
BaFin. M.M.Warburg & CO (AG & Co.) KGaA is additionally subject to the supervision of the European Central Bank (ECB).
SOURCES
All data and consensus estimates have been obtained from FactSet except where stated otherwise.
HELMA Eigenheimbau
CO M M E N T Publ ished 29 .08 .2017 9
Additional information for clients in the United States
1. This research report (the “Report”) is a product of Warburg Research GmbH, Germany, a fully owned subsidiary of M.M.Warburg & CO (AG & Co.)
KGaA, Germany (in the following collectively “Warburg”). Warburg is the employer of the research analyst(s), who have prepared the Report. The
research analyst(s) reside outside the United States and are not associated persons of any U.S. regulated broker-dealer and therefore are not subject
to the supervision of any U.S. regulated broker-dealer.
2. The Report is provided in the United States for distribution solely to "major U.S. institutional investors" under Rule 15a-6 of the U.S. Securities
Exchange Act of 1934.
3. Any recipient of the Report should effect transactions in the securities discussed in the Report only through J.P.P. Euro-Securities, Inc., Delaware.
4. J.P.P. Euro-Securities, Inc. does not accept or receive any compensation of any kind for the dissemination of the research reports from Warburg.
Reference in accordance with section 34b of the German Securities Trading Act (WpHG), the Ordinance on the Analysis of Financial Instruments (FinAnV), MAR and Commission Delegated Regulation (EU) regarding possible conflicts of interest with companies analysed:
-1- Warburg Research, or an affiliated company, or an employee of one of these companies responsible for the compilation of the research, hold
a share of more than 5% of the equity capital of the analysed company.
-2-
Warburg Research, or an affiliated company, within the last twelve months participated in the management of a consortium for an issue in
the course of a public offering of such financial instruments, which are, or the issuer of which is, the subject of the investment
recommendation.
-3- Companies affiliated with Warburg Research manage financial instruments, which are, or the issuers of which are, subject of the
investment recommendation, in a market based on the provision of buy or sell contracts.
-4-
MMWB, Warburg Research, or an affiliated company, reached an agreement with the issuer to provide investment banking and/or
investment services and the relevant agreement was in force in the last 12 months or there arose for this period, based on the relevant
agreement, the obligation to provide or to receive a service or compensation - provided that this disclosure does not result in the disclosure of
confidential business information.
-5- The company compiling the analysis or an affiliated company had reached an agreement on the compilation of the investment
recommendation with the analysed company.
-6- Companies affiliated with Warburg Research regularly trade financial instruments of the analysed company or derivatives of these.
-6a- Warburg Research, or an affiliated company, holds a net long position of more than 0.5% of the total issued share capital of the analysed
company.
-6b- Warburg Research, or an affiliated company, holds a net short position of more than 0.5% of the total issued share capital of the analysed
company.
-6c- The issuer holds shares of more than 5% of the total issued capital of Warburg Research or an affiliated company.
-7- The company preparing the analysis as well as its affiliated companies and employees have other important interests in relation to the
analysed company, such as, for example, the exercising of mandates at analysed companies.
Company Disclosure Link to the historical price targets and rating changes (last 12 months)
HELMA Eigenheimbau 3, 5, 6 http://www.mmwarburg.com/disclaimer/disclaimer_en/DE000A0EQ578.htm
HELMA Eigenheimbau
CO M M E N T Publ ished 29 .08 .2017 10
INVESTMENT RECOMMENDATION
Investment recommendation: expected direction of the share price development of the financial instrument up to the given price target in the opinion of
the analyst who covers this financial instrument.
-B- Buy: The price of the analysed financial instrument is expected to rise over the next 12 months.
-H- Hold: The price of the analysed financial instrument is expected to remain mostly flat over the next 12
months.
-S- Sell: The price of the analysed financial instrument is expected to fall over the next 12 months.
“-“ Rating suspended: The available information currently does not permit an evaluation of the company.
WARBURG RESEARCH GMBH – ANALYSED RESEARCH UNIVERSE BY RATING
Rating Number of stocks % of Universe
Buy 107 52
Hold 89 44
Sell 7 3
Rating suspended 1 0
Total 204 100
WARBURG RESEARCH GMBH – ANALYSED RESEARCH UNIVERSE BY RATING L
L taking into account only those companies which were provided with major investment services in the last twelve months.
Rating Number of stocks % of Universe
Buy 28 68
Hold 11 27
Sell 1 2
Rating suspended 1 2
Total 41 100
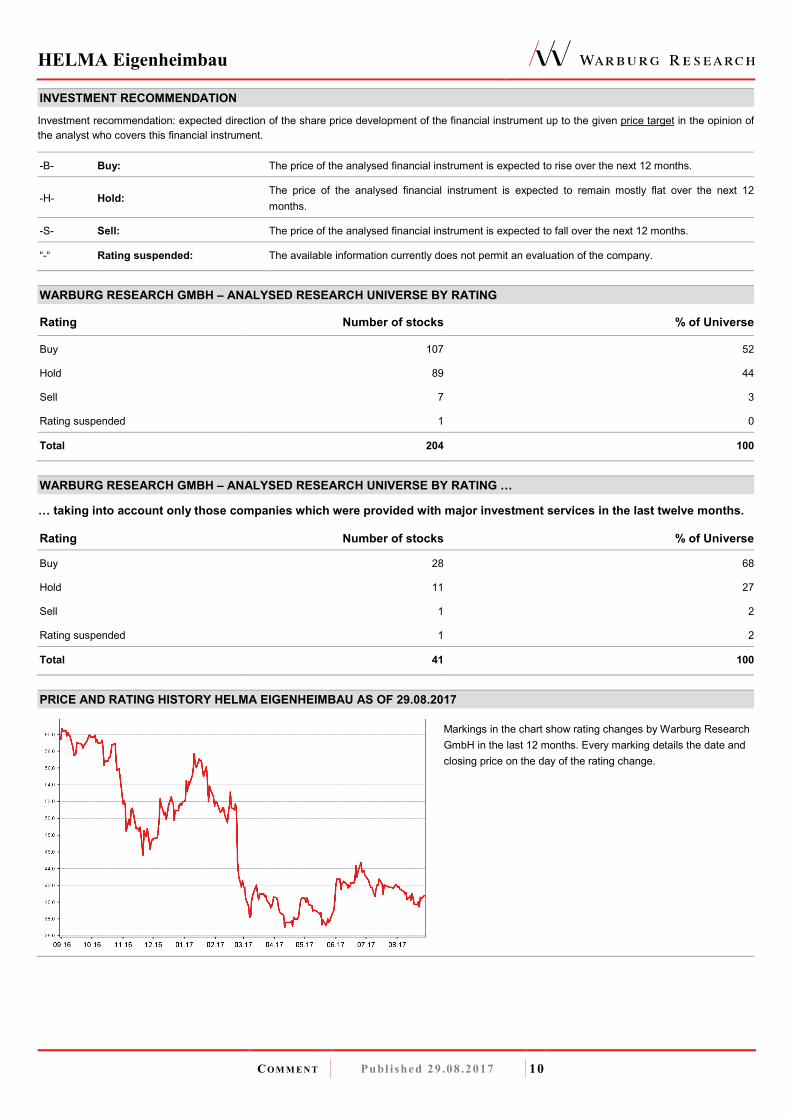
PRICE AND RATING HISTORY HELMA EIGENHEIMBAU AS OF 29.08.2017
Markings in the chart show rating changes by Warburg Research
GmbH in the last 12 months. Every marking details the date and
closing price on the day of the rating change.
HELMA Eigenheimbau
CO M M E N T Publ ished 29 .08 .2017 11
EQUITIES Roland Rapelius +49 40 3282-2673 Head of Equities [email protected] RESEARCH Michael Heider +49 40 309537-280 Jochen Reichert +49 40 309537-130 Head of Research [email protected] Telco, Internet, Media [email protected]
Henner Rüschmeier +49 40 309537-270 J. Moritz Rieser +49 40 309537-260 Head of Research [email protected] Real Estate [email protected]
Lucas Boventer +49 40 309537-290 Arash Roshan Zamir +49 40 309537-155 Renewables, Internet, Media [email protected] Cap. Goods, Renewables [email protected]
Christian Cohrs +49 40 309537-175 Malte Schaumann +49 40 309537-170 Engineering, Logistics [email protected] Technology [email protected]
Felix Ellmann +49 40 309537-120 Patrick Schmidt +49 40 309537-125 Software, IT [email protected] Small Cap Research [email protected]
Jörg Philipp Frey +49 40 309537-258 Oliver Schwarz +49 40 309537-250 Retail, Consumer Goods [email protected] Chemicals, Agriculture [email protected]
Marie-Thérèse Grübner +49 40 309537-240 Marc-René Tonn +49 40 309537-259 Small Cap Research [email protected] Automobiles, Car Suppliers [email protected]
Ulrich Huwald +49 40 309537-255 Björn Voss +49 40 309537-254 Health Care, Pharma [email protected] Steel, Car Suppliers [email protected]
Thilo Kleibauer +49 40 309537-257 Alexander Wahl +49 40 309537-230 Retail, Consumer Goods [email protected] Car Suppliers, Construction [email protected]
Eggert Kuls +49 40 309537-256 Andreas Wolf +49 40 309537-140 Engineering [email protected] Software, IT [email protected]
Andreas Pläsier +49 40 309537-246 Banks, Financial Services [email protected] INSTITUTIONAL EQUITY SALES Holger Nass +49 40 3282-2669 Michael Kriszun +49 40 3282-2695 Head of Equity Sales, USA [email protected] United Kingdom [email protected]
Klaus Schilling +49 40 3282-2664 Marc Niemann +49 40 3282-2660 Dep. Head of Equity Sales, GER [email protected] Germany [email protected]
Tim Beckmann +49 40 3282-2665 Sanjay Oberoi +49 69 5050-7410 United Kingdom [email protected] United Kingdom [email protected]
Lyubka Bogdanova +49 69 5050-7411 Simon Pallhuber +49 69 5050-7414 United Kingdom, Australia [email protected] Switzerland, France [email protected]
Jens Buchmüller +49 69 5050-7415 Scandinavia, Austria [email protected]
Paul Dontenwill +49 40 3282-2666 Angelika Flegler +49 69 5050-7417 USA, Poland, The Netherlands [email protected] Roadshow/Marketing [email protected]
Matthias Fritsch +49 40 3282-2696 Juliane Willenbruch +49 40 3282-2694 United Kingdom [email protected] Roadshow/Marketing [email protected]
SALES TRADING Oliver Merckel +49 40 3282-2634 Bastian Quast +49 40 3282-2701 Head of Sales Trading [email protected] Sales Trading [email protected] Elyaz Dust +49 40 3282-2702 Jörg Treptow +49 40 3282-2658 Sales Trading [email protected] Sales Trading [email protected] Michael Ilgenstein +49 40 3282-2700 Jan Walter +49 40 3282-2662 Sales Trading [email protected] Sales Trading [email protected] MACRO RESEARCH Carsten Klude +49 40 3282-2572 Dr. Christian Jasperneite +49 40 3282-2439 Macro Research [email protected] Investment Strategy [email protected] Our research can be found under: Warburg Research http://research.mmwarburg.com/en/index.html Thomson Reuters www.thomsonreuters.com Bloomberg MMWA GO Capital IQ www.capitaliq.com FactSet www.factset.com For access please contact:
Andrea Schaper +49 40 3282-2632 Kerstin Muthig +49 40 3282-2703 Sales Assistance [email protected] Sales Assistance [email protected]