Embed Size (px)
Citation preview
Herbivores Enforce SharpBoundaries Between Terrestrial and
Aquatic Ecosystems
Judith M. Sarneel,1,2* N. Huig,1 G. F. Veen,1,3 W. Rip,4 and E. S. Bakker1
1Department of Aquatic Ecology, Netherlands Institute of Ecology (NIOO-KNAW), Droevendaalsesteeg 10, 6708 PB, Wageningen,
The Netherlands; 2Landscape Ecology Group, Department of Ecology and Environmental Sciences, Umea University, 901 87 Umea,
Sweden; 3Department of Forest Ecology and Management, Swedish University of Agricultural Sciences, 901 83 Umea, Sweden;4Waternet (Water board Amstel Gooi en Vecht), P.O. Box 94370, 1090 GJ Amsterdam, The Netherlands
ABSTRACT
The transitions between ecosystems (ecotones) are
often biodiversity hotspots, but we know little
about the forces that shape them. Today, often
sharp boundaries with low diversity are found be-
tween terrestrial and aquatic ecosystems. This has
been attributed to environmental factors that
hamper succession. However, ecosystem properties
are often controlled by both bottom-up and top-
down forces, but their relative importance in
shaping riparian boundaries is not known. We
hypothesize that (1) herbivores may enforce sharp
transitions between terrestrial and aquatic ecosys-
tems by inhibiting emergent vegetation expansion
and reducing the width of the transition zone and
(2) the vegetation expansion, diversity, and species
turnover are related to abiotic factors in the ab-
sence of herbivores, but not in their presence. We
tested these hypotheses in 50 paired grazed and
ungrazed plots spread over ten wetlands, during
two years. Excluding grazers increased vegetation
expansion, cover, biomass, and species richness. In
ungrazed plots, vegetation cover was negatively
related to water depth, whereas plant species
richness was negatively related to the vegetation
N:P ratio. The presence of (mainly aquatic) herbi-
vores overruled the effect of water depth on vege-
tation cover increase but did not interact with
vegetation N:P ratio. Increased local extinction in
the presence of herbivores explained the negative
effect of herbivores on species richness, as local
colonization rates were unaffected by grazing. We
conclude that (aquatic) herbivores can strongly
inhibit expansion of the riparian vegetation and
reduce vegetation diversity over a range of envi-
ronmental conditions. Consequently, herbivores
enforce sharp boundaries between terrestrial and
aquatic ecosystems.
Key words: Biodiversity; ecotone; herbivory;
nutrient availability; riparian vegetation; species
turnover; succession; spatial patterns; transition
zones; vegetation N:P ratio; water depth.
INTRODUCTION
It is increasingly recognized that ecological transi-
tion zones or ecotones between habitat patches or
ecosystems should be regarded as separate entities
as they can play a critical role in controlling or
modifying flows of organisms and material be-
tween bordering ecosystems (Cadenasso and Pick-
ett 2000; Yarrow and Marin 2007). Although a lot
Received 15 May 2014; accepted 26 July 2014
Electronic supplementary material: The online version of this article
(doi:10.1007/s10021-014-9805-1) contains supplementary material,
which is available to authorized users.
Author contribution ESB, JMS, and WR conceived the study, ESB,
GFV, JMS, and NH performed the research, GFV and JMS analyzed data,
ESB and JMS wrote the paper.
*Corresponding author; e-mail: [email protected]
EcosystemsDOI: 10.1007/s10021-014-9805-1
� 2014 Springer Science+Business Media New York
of progress has been made in conceptualizing key
concepts and terminology, less is known about the
ecological processes that shape ecotones and their,
often high, biodiversity (Yarrow and Marin 2007).
The transition between freshwater and terrestrial
systems (the riparian zone) is characterized by a
relatively high floral and faunal species richness
and is, therefore, considered a diversity hotspot in
the landscape (Nilsson and Svedmark 2002). De-
spite their relatively small size, riparian zones have
disproportionately important functions for larger
scale processes of both biodiversity and biogeo-
chemistry of the two bordering systems (Naiman
and Decamps 1997; Nilsson and Svedmark 2002).
For instance, as they modulate the flux of partic-
ulate organic matter into the aquatic system, their
width influences the resilience of the bordering
aquatic system to regime shifts between alternative
clear and turbid states (Sollie and others 2008).The
species richness of riparian zones is positively re-
lated to the width of the transition zone, as well as
its structural diversity of the vegetation (Sarneel
and others 2011). Today, often sharp boundaries
with low diversity are found between terrestrial
and aquatic ecosystems. This has been attributed to
a range of environmental and anthropogenic fac-
tors including eutrophication, accumulation of
toxic compounds, and wave action (Lamers and
others 2002), which inhibit wetland plant growth.
In the bordering aquatic and terrestrial systems, it
has been recognized that both bottom-up (abiotic
conditions) and top-down forces (consumer-prey
relations) can strongly influence plant growth,
species turnover, and succession (Olff and Ritchie
1998; Wassen and others 2005; Bakker and others
2006). A recent meta-analyses showed that in ter-
restrial ecosystems species richness generally in-
creases with grazing and decreases with fertilization
level, whereas in freshwater systems most often
opposite relations are found with both grazing and
nutrient availability (Hillebrand and others 2007).
Because of these contrasting effects in the border-
ing systems, it is not immediately clear how, or
whether, herbivores determine plant diversity
along a gradient from water to land and how, or
whether, herbivores can shape the riparian zone by
modulating bottom-up control of the riparian
vegetation.
In ponds, the riparian ecosystem is shaped by
succession that, in the absence of disturbances or
management, causes open water to gradually fill
with organic material after successive colonization
by submerged aquatic plants, emergent riparian
vegetation, wetland plants, and trees (Liira and
others 2010; Lamers and others 2002). This suc-
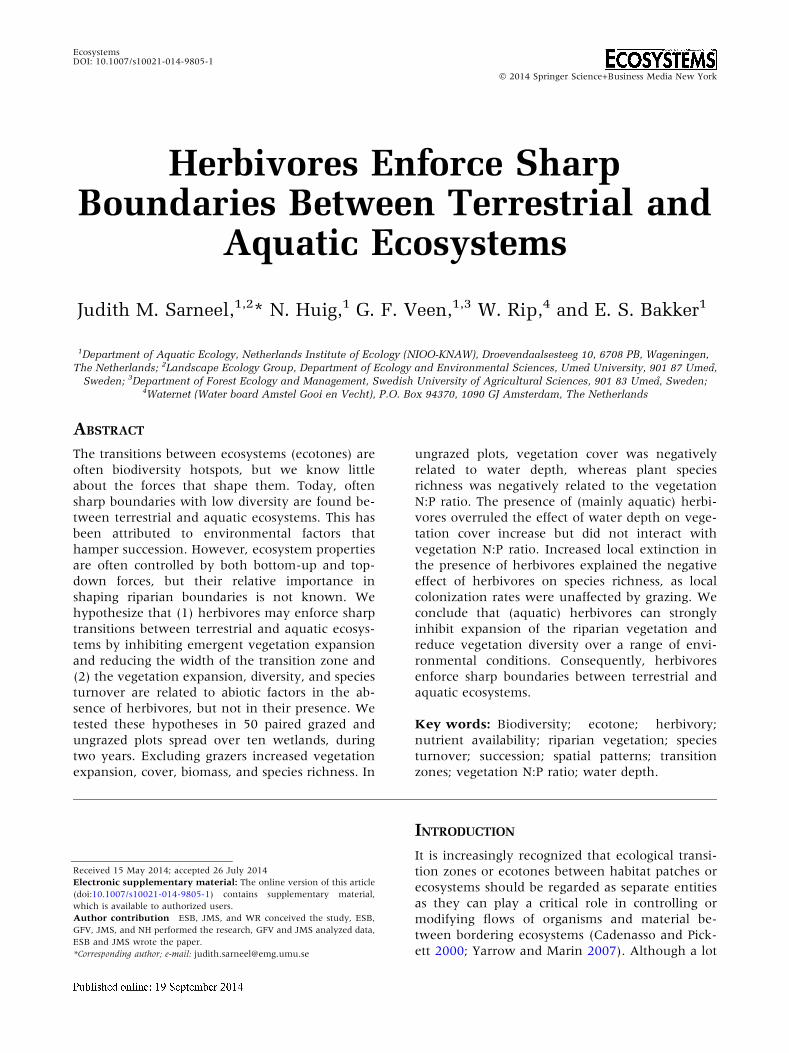
cession causes a very species-rich spatial vegetation
zonation (Figure 1A). The phase with emergent
vegetation plays a crucial role for succession as it
contains many ecosystem engineers that turn water
Figure 1. A Schematic cross section of the riparian zone
with different vegetation types. B Schematic top view of
an exclosure and control plot in the riparian zone. The
dash-lined square indicates the location of the vegetation
transect. Circles indicate the location of the biomass
samples taken (black taken in 2011 and white in 2012).
Arrow A indicates distance of the emergent stem furthest
from the bank ward plot end (indicated with black ovals),
and arrow B indicates the ten emergent stems that were
selected to determine the percentage of stems grazed.
J. M. Sarneel and others
into land (Sarneel and others 2010; Hidding and
others 2014). The emergent vegetation expansion
rate has been shown to increase with increasing
nutrient availability and decrease with water
depth, whereas vegetation diversity generally de-
creases with both increasing nutrient availability
and water depth (Wassen and others 2005; Sarneel
and others 2010; Bornette and Puijalon 2011).
However, it has recently been shown that next to
abiotic drivers, herbivores can have strong negative
effects on the establishment of riparian plant spe-
cies (Veen and others 2013) and influence com-
munity composition (Chaichana and others 2011).
For early successional and aquatic plant commu-
nities highly variable grazing effects have been
found (Marklund and others 2002; Bakker and
others 2013). Yet, possible interactions between
top-down and bottom-up effects as determinants
for emergent vegetation expansion and community
assembly in the different zones of the riparian
transition have not been addressed. In this study,
we tested the effect of herbivory on emergent
vegetation expansion and riparian plant diversity
and its relative importance in relation to abiotic
conditions (nutrient availability and water depth).
Whereas the impact of herbivory on emergent
vegetation expansion may be direct because they
prefer and graze away the young expanding shoots
and rhizomes (van den Wyngaert and others 2003),
the impact of herbivores on riparian plant species
richness depends on their effect on the balance
between local colonization and extinction rates
(Olff and Ritchie 1998; Bakker and others 2006).
Herbivores can increase species richness when they
enhance colonization rates by transferring seeds
between habitats (Figureuerola and Green 2002) or
by creating bare soil for seedling establishment
(Bakker and Olff 2003). Herbivores can also in-
crease species richness when they reduce local
extinction by releasing plants from competition by
reducing the biomass of dominant species (Olff and
Ritchie 1998). Conversely, they can decrease spe-
cies richness when they increase local extinction
through selective feeding on subordinate species
(Gibson and Brown 1991). By affecting vegetation
expansion, establishment success and species
dominance, both land-bound and aquatic herbi-
vores have shown to be able to accelerate, retard
and deflect succession in different ecosystems such
as arctic and temperate salt marshes (Kuijper and
Bakker 2005), boreal and temperate grasslands
(Weltzin and others 1997; Speed and others 2013),
and tundra’s (Eskelinen and others 2012), but
interactions between grazing and abiotic factors as
shaping forces of (riparian) transition zones remain
largely unknown (Speed and others 2013).
We tested the effect of herbivores on emergent
vegetation expansion, riparian plant diversity, and
species turnover in riparian ecosystems and addressed
the potential interaction with the two most important
drivers of emergent vegetation expansion and ripar-
ian community assembly (nutrient availability and
water depth) in a field exclosure experiment in ten
wetlands. We hypothesize that (1) herbivores may
enforce sharp transitions between terrestrial and
aquatic ecosystems by inhibitingemergent vegetation
expansion and reducing the width of the riparian
transition zone and (2) the emergent vegetation
expansion, diversity, and species turnover of the
riparian ecotone are related to abiotic factors in the
absence of herbivores, but not in their presence, and
that herbivores thus can overrule abiotic drivers of
vegetation assembly and succession.
METHODS
Experimental Design
We built exclosures in ten Dutch wetlands, thereby
covering a wide range of environmental conditions
(Table 1). We used the paired plot design fre-
quently used in exclosure studies (Bakker and
others 2006; Gayet and others 2011; Eskelinen and
others 2012; Veen and others 2013). In each wet-
land we selected five banks representative of the
area. The plots differed in aspect and direction to
the main wind direction and were mainly domi-
nated by Phragmites australis, Glyceria maxima, and
Typha species. We installed a paired exclosure and
an open control plot accessible for grazers on each
of the 50 banks in March 2011 before the growing
season started.
Each plot (3 m wide and 6 m long; See Fig-
ure 1B) was placed at the edge of the marginal
wetland zone (Figure 1A), perpendicular to the
bank. The plots thus captured the whole transition
from water to land and included on average
79% ± 1.4 SE (n = 100) open water to allow space
for expansion of emergent vegetation fringe.
Exclosures were made by building a fence of
chicken wire (mesh size 2.5 cm) supported by 6
poles. The fence protruded on average 1 m above
the water and was firmly pushed into the sediment,
using pegs when necessary. On top we put thick
orange wire in a cross pattern and zigzag pattern to
prevent grazing birds from entering from above.
The accessible control plot was marked with poles
on the four corners. The paired exclosure and
Grazing and Environment Shape Sharp Ecotones
control plots had similar water depth (Generalized
Linear Mixed Model (GLMM); treatment effect:
v2 = 0.001, P = 0.976 see ‘Data analyses’) and ini-
tial vegetation cover (GLMM; treatment effect;
emergent vegetation cover: v2 = 0.39, P = 0.531;
and floating and submerged vegetation cover:
v2 = 0.77, P = 0.380).
Vegetation Sampling
In 2011, we sampled our control plots and exclo-
sures regularly from April until August 2011 (0, 4,
8, 14, and 20 weeks respectively after establishing
the plots). This revealed that peak standing crop
was reached in July (Appendix 1 in Electronic
Supplementary Material). In 2012, vegetation
cover was, therefore, recorded before the growing
season started in March and at peak standing crop
in July.
With each visit the total cover of emergent plants
was estimated using cover classes that increased
with 10% and 3 extra classes for covers less than
10% (Following Braun Blanquet; Barkman and
others 1964). In July 2011 and 2012, we made
detailed vegetation releves of a transect which ran
through the middle of each plot (2 9 50 = 100
releves; being 0.75 cm wide and 6 m long: see
Figure 1B). As a measure of emergent vegetation
expansion, we measured the distance (m) between
the bank ward plot end and the most distant
emergent shoot in the water for each plot. We also
calculated the emergent cover increase between
July 2011 and 2012 per plot. In July 2011 and
2012, we determined the percentage of stems that
were damaged (with ripped off leaves and broken
stems, signs of grazing) from the ten stems of
Phragmites and Typha that were most distant from
the bank (Figure 1B).
In August 2011, we harvested aboveground
biomass (a circular 0.2 m2 area) from three loca-
tions next to each riparian transect. One sample
was taken within the marginal wetland zone, an-
other one on the edge of the emergent vegetation
fringe and the last one in the open water (respec-
tively, ± 1, 3 and 5 m from the bank ward plot
end, see Figure 1B). The biomass samples were
taken to the lab, rinsed to remove mud and algae,
sorted to species, dried (48 hours at 60�C), and
weighed. In July 2012, we collected a sample of
0.2 m2 of the marginal wetland zone inside the
exclosures and weighed the total biomass after
drying (48 h at 60�C).
Habitat Characteristics
We determined the most important habitat char-
acteristics that determine the growth and diversity
of freshwater plant communities (reviewed by
Bornette and Puijalon 2011), standing biomass
(described before), and herbivore densities.
Nutrients
The ratio between nitrogen (N) and phosphorus (P)
concentrations in the aboveground plant biomass
has been shown to be an important predictor of
wetland plant diversity (Koerselman and Meul-
eman 1996; Gusewell and others 2003; Fujita and
others 2014), even though the underlying mecha-
nisms remain to be resolved (for discussion on the
interpretation of N:P ratios see Fujita and others
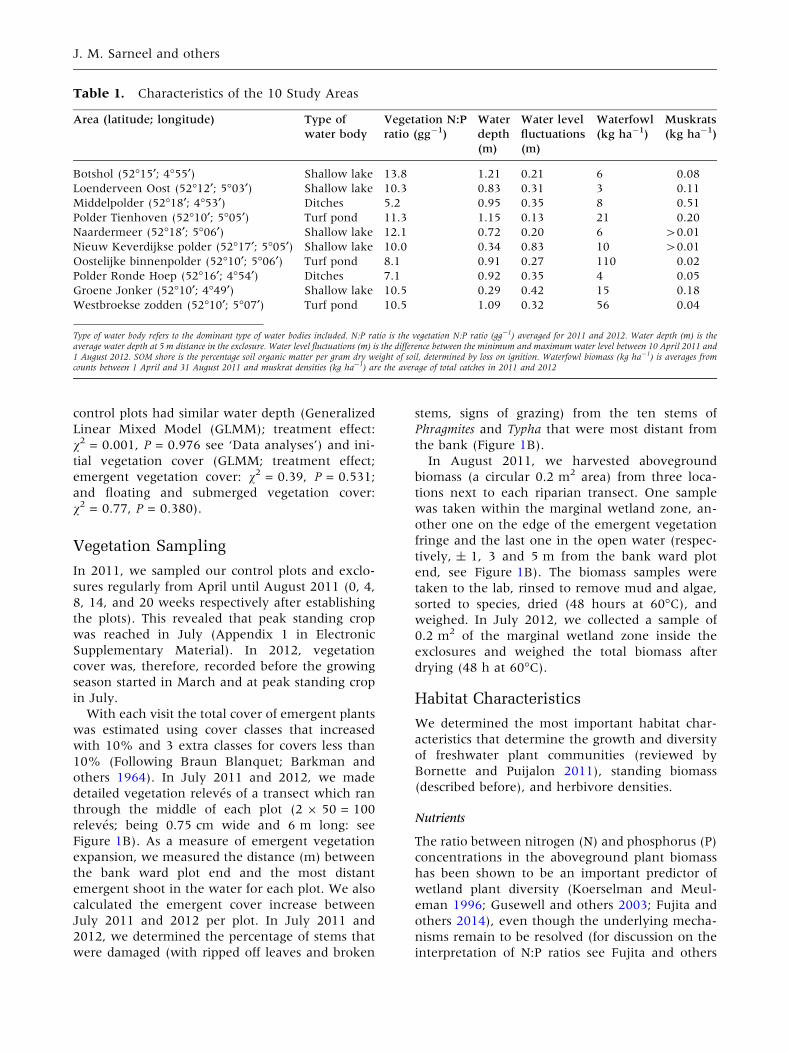
Table 1. Characteristics of the 10 Study Areas
Area (latitude; longitude) Type of
water body
Vegetation N:P
ratio (gg-1)
Water
depth
(m)
Water level
fluctuations
(m)
Waterfowl
(kg ha-1)
Muskrats
(kg ha-1)
Botshol (52�15¢; 4�55¢) Shallow lake 13.8 1.21 0.21 6 0.08
Loenderveen Oost (52�12¢; 5�03¢) Shallow lake 10.3 0.83 0.31 3 0.11
Middelpolder (52�18¢; 4�53¢) Ditches 5.2 0.95 0.35 8 0.51
Polder Tienhoven (52�10¢; 5�05¢) Turf pond 11.3 1.15 0.13 21 0.20
Naardermeer (52�18¢; 5�06¢) Shallow lake 12.1 0.72 0.20 6 >0.01
Nieuw Keverdijkse polder (52�17¢; 5�05¢) Shallow lake 10.0 0.34 0.83 10 >0.01
Oostelijke binnenpolder (52�10¢; 5�06¢) Turf pond 8.1 0.91 0.27 110 0.02
Polder Ronde Hoep (52�16¢; 4�54¢) Ditches 7.1 0.92 0.35 4 0.05
Groene Jonker (52�10¢; 4�49¢) Shallow lake 10.5 0.29 0.42 15 0.18
Westbroekse zodden (52�10¢; 5�07¢) Turf pond 10.5 1.09 0.32 56 0.04
Type of water body refers to the dominant type of water bodies included. N:P ratio is the vegetation N:P ratio (gg-1) averaged for 2011 and 2012. Water depth (m) is theaverage water depth at 5 m distance in the exclosure. Water level fluctuations (m) is the difference between the minimum and maximum water level between 10 April 2011 and1 August 2012. SOM shore is the percentage soil organic matter per gram dry weight of soil, determined by loss on ignition. Waterfowl biomass (kg ha-1) is averages fromcounts between 1 April and 31 August 2011 and muskrat densities (kg ha-1) are the average of total catches in 2011 and 2012
J. M. Sarneel and others
2014). We analyzed N and P-content of the biomass
samples taken from the marginal wetland zone of
the exclosures in 2011 and 2012 (see ‘‘Vegetation
Sampling’’ section). After grinding the samples, N
concentration (% of dry weight) was determined
by combustion, using a FLASH 2000 Organic Ele-
mental Analyzer (Interscience, Breda, the Nether-
lands). P-content (% of dry weight) was
determined through acid digestion (with 2% per-
sulphate; 30 min at 121�C) after incinerating the
samples for 30 min at 500�C. The digested samples
were analyzed using a QuAAtro segmented flow
analyzer (Seal analytical Inc., Beun de Ronde,
Abcoude).
Water
Water depth (m) was measured in the plots at ev-
ery meter along a 6 m long transect in April 2011.
Depths were averaged to obtain the initial water
depth per plot. With use of daily water level fluc-
tuations measurements (measured with pressure
data loggers; van Essen instruments, Delft, the
Netherlands), we calculated the average water
depth during our study period in each exclosure
and control plot. From the water level data, we also
calculated the range of water level fluctuations (the
5–95% range; in m). As a measure of wave expo-
sure of the plots, we determined wind fetch by
calculating the weighted mean of the distances of
open water (m) in front of the sample point in a
range of -42� to +42� (in 6� increments) from the
prevailing wind direction (obtained from the Royal
Netherlands Meteorological Institute; KNMI).
We collected 100 ml water samples in each
control plot in June 2011. We fixed 5 ml with
glutaraldehyde within 12 h (final concentration
0.025% by mass) and measured algae concentra-
tions (l gl-1) using a Phyto-PAM (Heinz Walz
GmbH, Effeltrich, Germany). We determined
transparency of the surface water of the control
plots with a Secchi disk (m) in July 2011.
Herbivores
We measured the density of potential herbivores in
each study area by counting the herbivorous
waterfowl that we encountered (which were mal-
lards, Greylag geese, mute swans, and coots) upon
each field visit in 2011 (5 visits).
Four of the ten wetland areas were grazed by
livestock (cows and sheep) during a part of the
growing season. However, livestock were discarded
from the analyses as almost all exclosures were
placed at locations where livestock could not reach
the expanding vegetation fringe (Appendix 2 in
Electronic Supplementary Material). In two cases
where they could, they destroyed the exclosures;
these plots were excluded from the analyses
(Appendix 2 in Electronic Supplementary Mate-
rial).
Muskrat densities were calculated as number of
muskrats caught per year by muskrat catchers in
2011 and 2012 (data obtained from Hoogheemra-
adschap De Stichtse Rijnlanden). Waterfowl and
muskrats densities were expressed for each species
in kg body mass ha-1 (Proulx 1997; Wood and
others 2012) and summed to obtain a measure of
aquatic herbivore density.
Data Analyses
We analyzed vegetation cover, species richness and
vegetation diversity in control plots and exclosures
for all species and separately for emergent and
floating and submerged species at peak standing
crop in July 2011 and 2012. Shannon species
diversity indexes were calculated with R 2.15.2 (R
Core Team 2013) using the package Vegan. As a
measure of vegetation expansion and grazing im-
pact, we further analyzed the distance of the fur-
thest stem in July 2012, emergent cover increase
between July 2011 and 2012 and the percentage of
damaged stems in July 2012. Two measures of
species turnover were calculated: the proportion of
species in the transect that went locally extinct
(i.e., were found in 2011 but not in 2012) and that
colonized the transect (i.e., were found in 2012 but
not in 2011), both as percentage of the total species
richness found for each transect in July 2011 (fol-
lowing Merritt and others 2010). Homogeneity of
variance was tested with a Levene’s test, and nor-
mal distribution of the residuals was tested with a
Shaphiro wilk’s test in R 2.15.2. Arcsine and Ln+1
transformations were applied to improve homoge-
neity and normality (indicated in Table 2).
The overall effect of exclosure treatment on the
vegetation parameters, expansion, and species
turnover was analyzed with generalized linear
mixed models (GLMM) in the package lme4 in R
2.15.2, using maximum likelihood estimation
(analysis 1, A1). To correct for the block structure
of our experimental setup, we added a random
factor that nested paired plots within area (see also
Veen and others 2013). To determine effects of our
fixed factor (exclosure treatment), we used a like-
lihood ratio test to compare models with and
without the variable of interest (Crawley 2007).
Furthermore, to test the effect of exclosure treat-
ment on biomass in the different parts of the
riparian transect, we used GLMM including the
Grazing and Environment Shape Sharp Ecotones
fixed factors (exclosure treatment and location
along the transect) and a random factor accounting
for the nested structure of the samples in the
transect (A2). We used likelihood ratio test to
compare models with and without the fixed factors
and their interaction.
We performed multiple stepwise regressions (in
SPSS 19.0; IBM Corporation, Armonk, New York)
to select which of the environmental variables
determined increase of emergent cover and species
turnover (A3). Based on this analysis, we selected
water depth and vegetation N:P ratio (Appendix 3
in Electronic Supplementary Material) to further
analyze the hypothesized interactive effects of
these environmental conditions and grazing on
emergent cover and riparian species richness. We
performed an ANCOVA analysis in R (A4), using
GLMM models with a random effect for the block
structure of our set up (as in A1) and subsequent
maximum likelihood estimation tests to compare
models (as in A1).
RESULTS
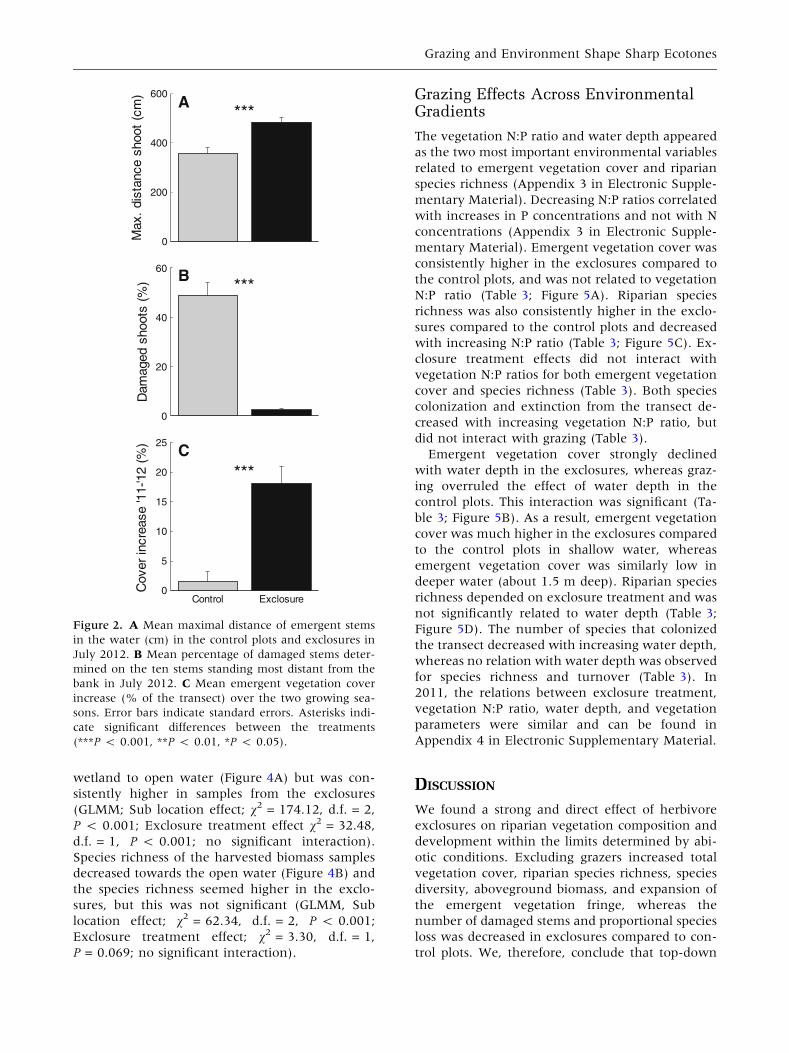
Grazing Effects on Vegetation Dynamics
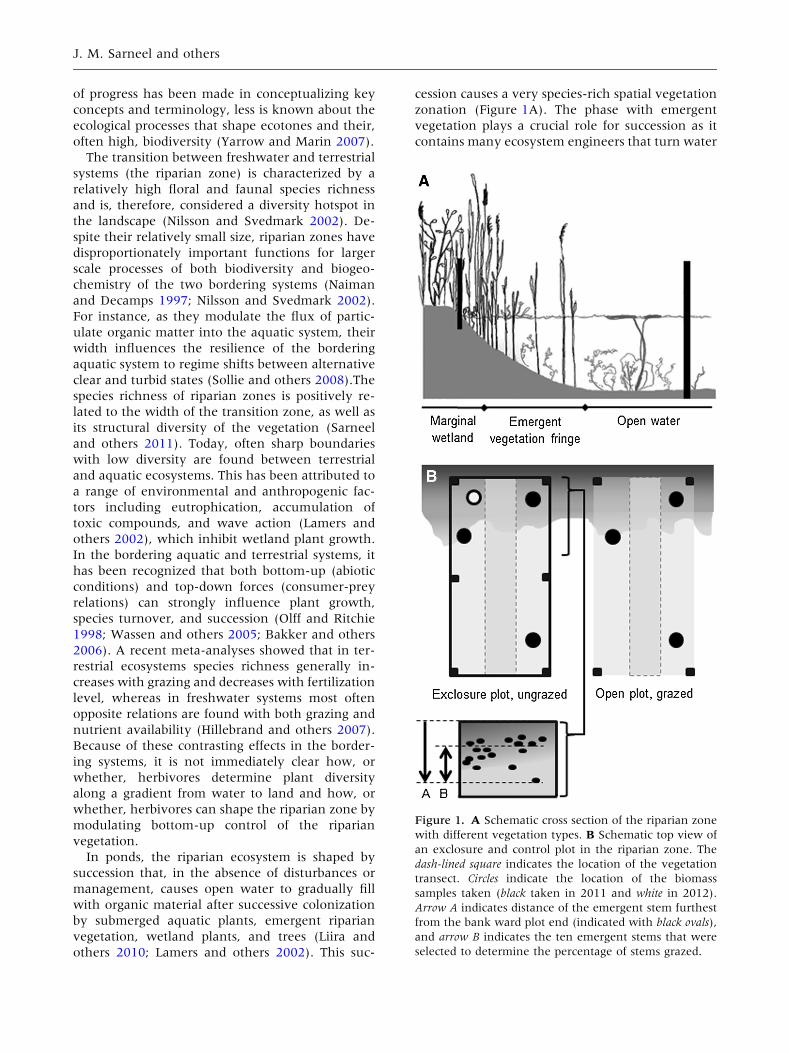
Vegetation expansion (distance of the furthest
stem) was higher inside the exclosure after two
years (Ln+1 transformed, GLMM, v2 = 25.72,
P < 0.001, Figure 2A), whereas the number of
damaged stems was lower there (Ln+1 trans-
formed, GLMM, v2 = 80.20, P < 0.001, Figure 2B).
Over the two years, the emergent vegetation cover
increased more in the exclosures than in the con-
trol plots (Ln+1 transformed, GLMM, v2 = 22.55,
P < 0.001, Figure 2C). More specifically, the
emergent cover in the control plots did not change
over the years (One-sample t test on cover change
in control plots, P = 0.41), whereas the increase
was significantly higher than 0 in the exclosures
(One-sample t test, P < 0.001).
Grazing Effects on Vegetation Abundanceand Diversity
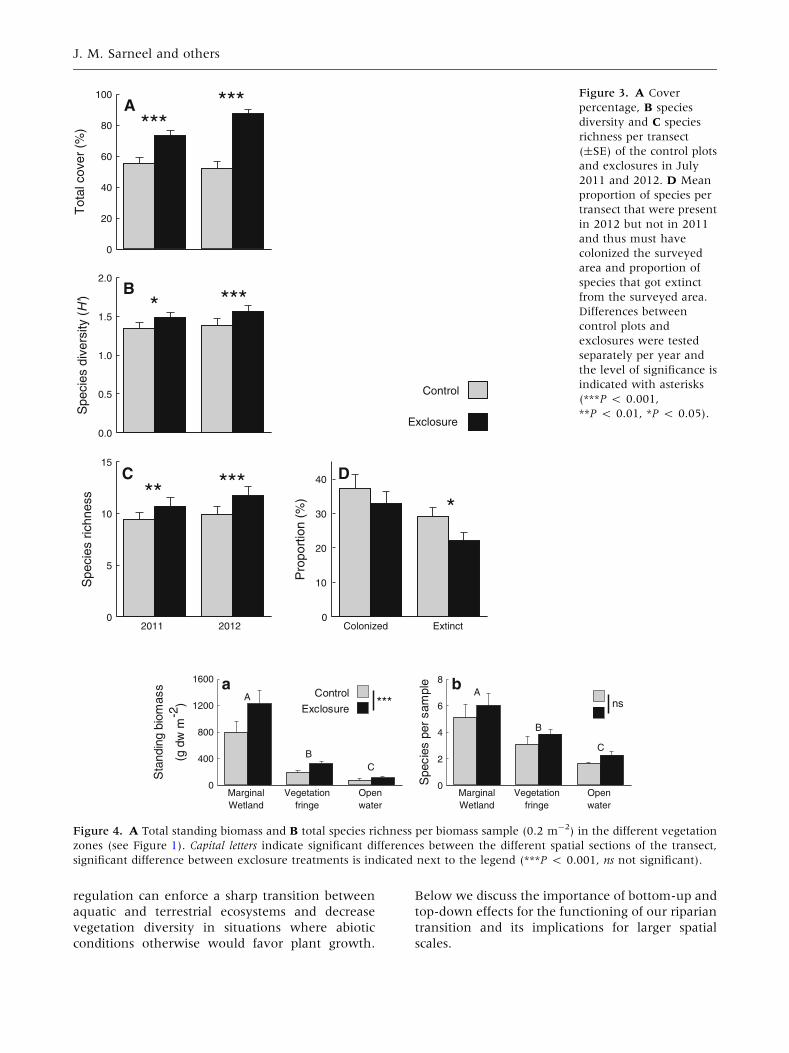
Total cover, total species richness and species diver-
sity of the vegetation transects were significantly
higher in exclosures than in control plots for both
2011 and 2012 (Figure 3; Table 2). This pattern was
consistent (and significant for cover and species
richness) within both the emergent and floating and
submerged species (Table 2). Species composition
changed over the years and on average 30% of the
species observed in 2011 were replaced by other
species in 2012. The proportion of species that was
found in 2012 but not in 2011, and thus must have
colonized the surveyed transect, did not differ be-
tween exclosure treatments, but the proportion of
species that disappeared from the surveyed transect
between 2011 and 2012 was significantly higher in
the control plots (GLMM, v2 = 5.50, P = 0.019,
Figure 3D) compared to the exclosures.
Grazing Effects Across the SuccessionalGradient
Exclosure effects were consistent in the biomass
samples of all three spatial sub locations of the
surveyed transect (Figure 4). Plant standing crop
decreased over the gradient from the marginal
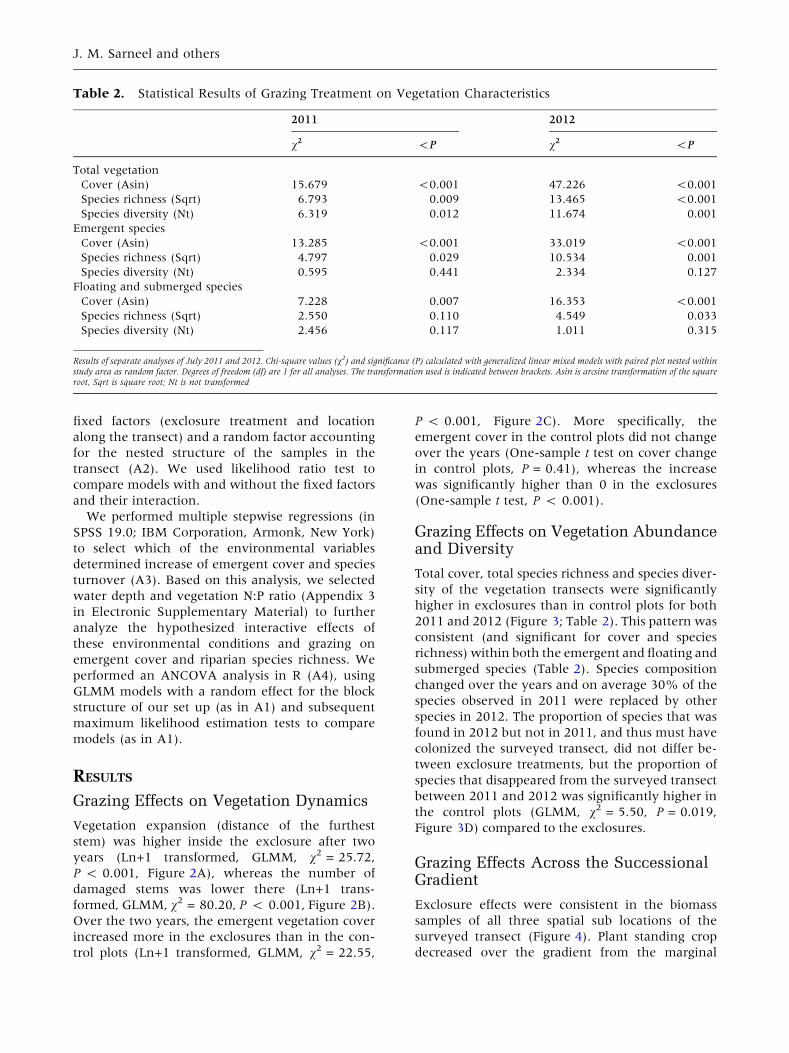
Table 2. Statistical Results of Grazing Treatment on Vegetation Characteristics
2011 2012
v2 <P v2 <P
Total vegetation
Cover (Asin) 15.679 <0.001 47.226 <0.001
Species richness (Sqrt) 6.793 0.009 13.465 <0.001
Species diversity (Nt) 6.319 0.012 11.674 0.001
Emergent species
Cover (Asin) 13.285 <0.001 33.019 <0.001
Species richness (Sqrt) 4.797 0.029 10.534 0.001
Species diversity (Nt) 0.595 0.441 2.334 0.127
Floating and submerged species
Cover (Asin) 7.228 0.007 16.353 <0.001
Species richness (Sqrt) 2.550 0.110 4.549 0.033
Species diversity (Nt) 2.456 0.117 1.011 0.315
Results of separate analyses of July 2011 and 2012. Chi-square values (v2) and significance (P) calculated with generalized linear mixed models with paired plot nested withinstudy area as random factor. Degrees of freedom (df) are 1 for all analyses. The transformation used is indicated between brackets. Asin is arcsine transformation of the squareroot, Sqrt is square root; Nt is not transformed
J. M. Sarneel and others
wetland to open water (Figure 4A) but was con-
sistently higher in samples from the exclosures
(GLMM; Sub location effect; v2 = 174.12, d.f. = 2,
P < 0.001; Exclosure treatment effect v2 = 32.48,
d.f. = 1, P < 0.001; no significant interaction).
Species richness of the harvested biomass samples
decreased towards the open water (Figure 4B) and
the species richness seemed higher in the exclo-
sures, but this was not significant (GLMM, Sub
location effect; v2 = 62.34, d.f. = 2, P < 0.001;
Exclosure treatment effect; v2 = 3.30, d.f. = 1,
P = 0.069; no significant interaction).
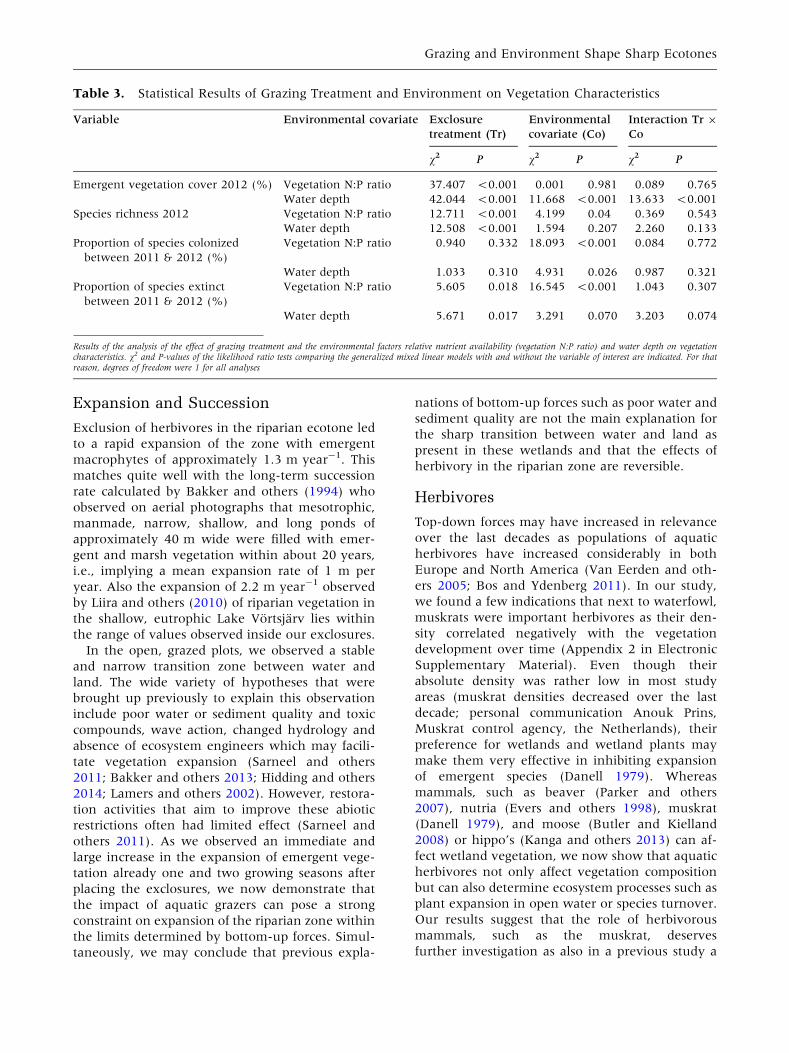
Grazing Effects Across EnvironmentalGradients
The vegetation N:P ratio and water depth appeared
as the two most important environmental variables
related to emergent vegetation cover and riparian
species richness (Appendix 3 in Electronic Supple-
mentary Material). Decreasing N:P ratios correlated
with increases in P concentrations and not with N
concentrations (Appendix 3 in Electronic Supple-
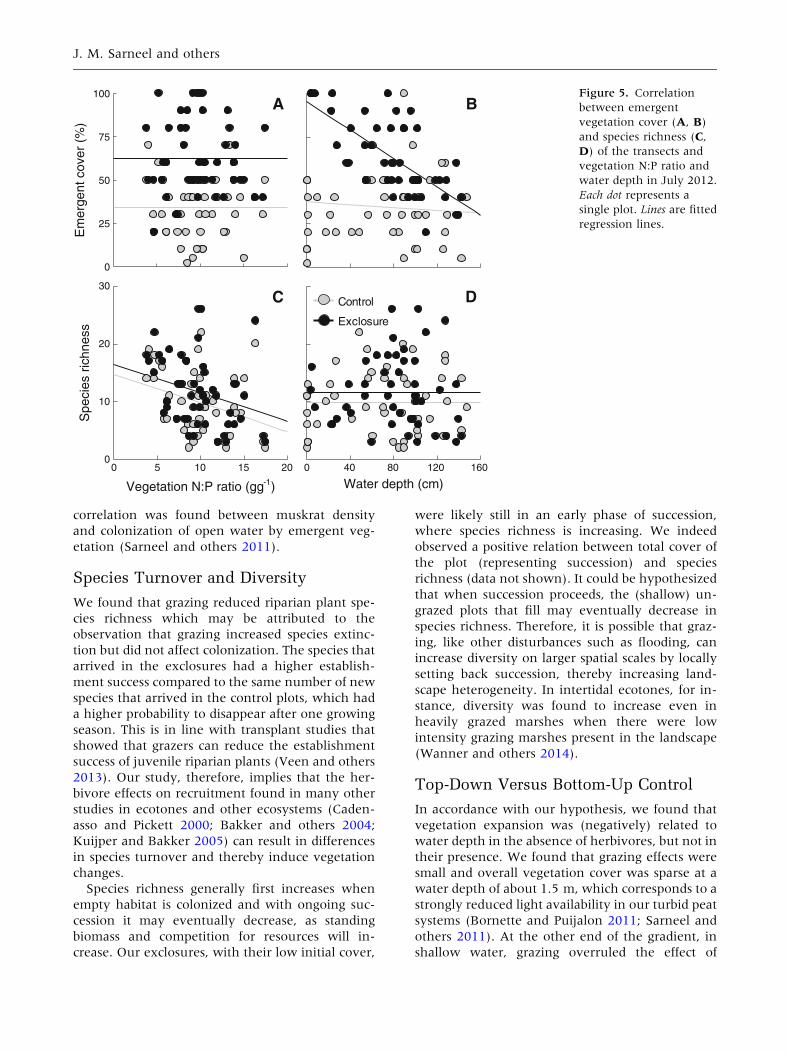
mentary Material). Emergent vegetation cover was
consistently higher in the exclosures compared to
the control plots, and was not related to vegetation
N:P ratio (Table 3; Figure 5A). Riparian species
richness was also consistently higher in the exclo-
sures compared to the control plots and decreased
with increasing N:P ratio (Table 3; Figure 5C). Ex-
closure treatment effects did not interact with
vegetation N:P ratios for both emergent vegetation
cover and species richness (Table 3). Both species
colonization and extinction from the transect de-
creased with increasing vegetation N:P ratio, but
did not interact with grazing (Table 3).
Emergent vegetation cover strongly declined
with water depth in the exclosures, whereas graz-
ing overruled the effect of water depth in the
control plots. This interaction was significant (Ta-
ble 3; Figure 5B). As a result, emergent vegetation
cover was much higher in the exclosures compared
to the control plots in shallow water, whereas
emergent vegetation cover was similarly low in
deeper water (about 1.5 m deep). Riparian species
richness depended on exclosure treatment and was
not significantly related to water depth (Table 3;
Figure 5D). The number of species that colonized
the transect decreased with increasing water depth,
whereas no relation with water depth was observed
for species richness and turnover (Table 3). In
2011, the relations between exclosure treatment,
vegetation N:P ratio, water depth, and vegetation
parameters were similar and can be found in
Appendix 4 in Electronic Supplementary Material.
DISCUSSION
We found a strong and direct effect of herbivore
exclosures on riparian vegetation composition and
development within the limits determined by abi-
otic conditions. Excluding grazers increased total
vegetation cover, riparian species richness, species
diversity, aboveground biomass, and expansion of
the emergent vegetation fringe, whereas the
number of damaged stems and proportional species
loss was decreased in exclosures compared to con-
trol plots. We, therefore, conclude that top-down
)mc(
toohsecnatsid
.xaM 0
200
400
600
***A
)% (
sto oh sd ega
maD
0
20
40
60
***B
Control Exclosure
)%(
21'-11'esae rcni
re voC 0
5
10
15
20
25
***C
Figure 2. A Mean maximal distance of emergent stems
in the water (cm) in the control plots and exclosures in
July 2012. B Mean percentage of damaged stems deter-
mined on the ten stems standing most distant from the
bank in July 2012. C Mean emergent vegetation cover
increase (% of the transect) over the two growing sea-
sons. Error bars indicate standard errors. Asterisks indi-
cate significant differences between the treatments
(***P < 0.001, **P < 0.01, *P < 0.05).
Grazing and Environment Shape Sharp Ecotones
regulation can enforce a sharp transition between
aquatic and terrestrial ecosystems and decrease
vegetation diversity in situations where abiotic
conditions otherwise would favor plant growth.
Below we discuss the importance of bottom-up and
top-down effects for the functioning of our riparian
transition and its implications for larger spatial
scales.
Tot
al c
over
(%
)
0
20
40
60
80
100
2011 2012
Spe
cies
ric
hnes
s
0
5
10
15
Spe
cies
div
ersi
ty (
H')
0.0
0.5
1.0
1.5
2.0B
A***
C
***
** ***
****
Colonized Extinct
Pro
port
ion
(%)
0
10
20
30
40
*
D
Control
Exclosure
Figure 3. A Cover
percentage, B species
diversity and C species
richness per transect
(±SE) of the control plots
and exclosures in July
2011 and 2012. D Mean
proportion of species per
transect that were present
in 2012 but not in 2011
and thus must have
colonized the surveyed
area and proportion of
species that got extinct
from the surveyed area.
Differences between
control plots and
exclosures were tested
separately per year and
the level of significance is
indicated with asterisks
(***P < 0.001,
**P < 0.01, *P < 0.05).S
peci
es p
er s
ampl
e
0
2
4
6
8
ssamoib
gnidnatS
mwd
g(-2
)
0
400
800
1200
1600 a bA
B
C
*** nsControl
Exclosure
MarginalWetland
Vegetationfringe
Openwater
A
BC
MarginalWetland
Vegetationfringe
Openwater
Figure 4. A Total standing biomass and B total species richness per biomass sample (0.2 m-2) in the different vegetation
zones (see Figure 1). Capital letters indicate significant differences between the different spatial sections of the transect,
significant difference between exclosure treatments is indicated next to the legend (***P < 0.001, ns not significant).
J. M. Sarneel and others
Expansion and Succession
Exclusion of herbivores in the riparian ecotone led
to a rapid expansion of the zone with emergent
macrophytes of approximately 1.3 m year-1. This
matches quite well with the long-term succession
rate calculated by Bakker and others (1994) who
observed on aerial photographs that mesotrophic,
manmade, narrow, shallow, and long ponds of
approximately 40 m wide were filled with emer-
gent and marsh vegetation within about 20 years,
i.e., implying a mean expansion rate of 1 m per
year. Also the expansion of 2.2 m year-1 observed
by Liira and others (2010) of riparian vegetation in
the shallow, eutrophic Lake Vortsjarv lies within
the range of values observed inside our exclosures.
In the open, grazed plots, we observed a stable
and narrow transition zone between water and
land. The wide variety of hypotheses that were
brought up previously to explain this observation
include poor water or sediment quality and toxic
compounds, wave action, changed hydrology and
absence of ecosystem engineers which may facili-
tate vegetation expansion (Sarneel and others
2011; Bakker and others 2013; Hidding and others
2014; Lamers and others 2002). However, restora-
tion activities that aim to improve these abiotic
restrictions often had limited effect (Sarneel and
others 2011). As we observed an immediate and
large increase in the expansion of emergent vege-
tation already one and two growing seasons after
placing the exclosures, we now demonstrate that
the impact of aquatic grazers can pose a strong
constraint on expansion of the riparian zone within
the limits determined by bottom-up forces. Simul-
taneously, we may conclude that previous expla-
nations of bottom-up forces such as poor water and
sediment quality are not the main explanation for
the sharp transition between water and land as
present in these wetlands and that the effects of
herbivory in the riparian zone are reversible.
Herbivores
Top-down forces may have increased in relevance
over the last decades as populations of aquatic
herbivores have increased considerably in both
Europe and North America (Van Eerden and oth-
ers 2005; Bos and Ydenberg 2011). In our study,
we found a few indications that next to waterfowl,
muskrats were important herbivores as their den-
sity correlated negatively with the vegetation
development over time (Appendix 2 in Electronic
Supplementary Material). Even though their
absolute density was rather low in most study
areas (muskrat densities decreased over the last
decade; personal communication Anouk Prins,
Muskrat control agency, the Netherlands), their
preference for wetlands and wetland plants may
make them very effective in inhibiting expansion
of emergent species (Danell 1979). Whereas
mammals, such as beaver (Parker and others
2007), nutria (Evers and others 1998), muskrat
(Danell 1979), and moose (Butler and Kielland
2008) or hippo’s (Kanga and others 2013) can af-
fect wetland vegetation, we now show that aquatic
herbivores not only affect vegetation composition
but can also determine ecosystem processes such as
plant expansion in open water or species turnover.
Our results suggest that the role of herbivorous
mammals, such as the muskrat, deserves
further investigation as also in a previous study a
Table 3. Statistical Results of Grazing Treatment and Environment on Vegetation Characteristics
Variable Environmental covariate Exclosure
treatment (Tr)
Environmental
covariate (Co)
Interaction Tr 9
Co
v2 P v2 P v2 P
Emergent vegetation cover 2012 (%) Vegetation N:P ratio 37.407 <0.001 0.001 0.981 0.089 0.765
Water depth 42.044 <0.001 11.668 <0.001 13.633 <0.001
Species richness 2012 Vegetation N:P ratio 12.711 <0.001 4.199 0.04 0.369 0.543
Water depth 12.508 <0.001 1.594 0.207 2.260 0.133
Proportion of species colonized
between 2011 & 2012 (%)
Vegetation N:P ratio 0.940 0.332 18.093 <0.001 0.084 0.772
Water depth 1.033 0.310 4.931 0.026 0.987 0.321
Proportion of species extinct
between 2011 & 2012 (%)
Vegetation N:P ratio 5.605 0.018 16.545 <0.001 1.043 0.307
Water depth 5.671 0.017 3.291 0.070 3.203 0.074
Results of the analysis of the effect of grazing treatment and the environmental factors relative nutrient availability (vegetation N:P ratio) and water depth on vegetationcharacteristics. v2 and P-values of the likelihood ratio tests comparing the generalized mixed linear models with and without the variable of interest are indicated. For thatreason, degrees of freedom were 1 for all analyses
Grazing and Environment Shape Sharp Ecotones
correlation was found between muskrat density
and colonization of open water by emergent veg-
etation (Sarneel and others 2011).
Species Turnover and Diversity
We found that grazing reduced riparian plant spe-
cies richness which may be attributed to the
observation that grazing increased species extinc-
tion but did not affect colonization. The species that
arrived in the exclosures had a higher establish-
ment success compared to the same number of new
species that arrived in the control plots, which had
a higher probability to disappear after one growing
season. This is in line with transplant studies that
showed that grazers can reduce the establishment
success of juvenile riparian plants (Veen and others
2013). Our study, therefore, implies that the her-
bivore effects on recruitment found in many other
studies in ecotones and other ecosystems (Caden-
asso and Pickett 2000; Bakker and others 2004;
Kuijper and Bakker 2005) can result in differences
in species turnover and thereby induce vegetation
changes.
Species richness generally first increases when
empty habitat is colonized and with ongoing suc-
cession it may eventually decrease, as standing
biomass and competition for resources will in-
crease. Our exclosures, with their low initial cover,
were likely still in an early phase of succession,
where species richness is increasing. We indeed
observed a positive relation between total cover of
the plot (representing succession) and species
richness (data not shown). It could be hypothesized
that when succession proceeds, the (shallow) un-
grazed plots that fill may eventually decrease in
species richness. Therefore, it is possible that graz-
ing, like other disturbances such as flooding, can
increase diversity on larger spatial scales by locally
setting back succession, thereby increasing land-
scape heterogeneity. In intertidal ecotones, for in-
stance, diversity was found to increase even in
heavily grazed marshes when there were low
intensity grazing marshes present in the landscape
(Wanner and others 2014).
Top-Down Versus Bottom-Up Control
In accordance with our hypothesis, we found that
vegetation expansion was (negatively) related to
water depth in the absence of herbivores, but not in
their presence. We found that grazing effects were
small and overall vegetation cover was sparse at a
water depth of about 1.5 m, which corresponds to a
strongly reduced light availability in our turbid peat
systems (Bornette and Puijalon 2011; Sarneel and
others 2011). At the other end of the gradient, in
shallow water, grazing overruled the effect of
Water depth (cm)0 40 80 120 160
Em
erge
nt c
over
(%
)
0
25
50
75
100A B
C DControl
Exclosure
Vegetation N:P ratio (gg-1)
0 5 10 15 20
Spe
cies
ric
hnes
s
0
10
20
30
Figure 5. Correlation
between emergent
vegetation cover (A, B)
and species richness (C,
D) of the transects and
vegetation N:P ratio and
water depth in July 2012.
Each dot represents a
single plot. Lines are fitted
regression lines.
J. M. Sarneel and others
improved growing conditions. Herbivores may,
therefore, enforce a narrow riparian zone in shal-
low water bodies due to a high accessibility of stems
and rhizomes, and to high herbivore density as
water birds may prefer shallow water for foraging
(Tatu and others 2007) or feel safer when staying
close to the reed beds (Weisner and others 1997).
Likely, bottom-up forces that are related to water
depth such as light and oxygen availability increase
in importance for the vegetation structure in the
transition zone in deeper water, where next to a
lower accessibility, grazing pressure may be lower
due to low foliage availability.
Whereas vegetation expansion was correlated to
water depth but not to vegetation N:P ratio, species
richness was negatively related to vegetation N:P
ratio, but not to water depth. However, in dis-
agreement with our hypothesis, riparian plant
species richness was both in the presence and ab-
sence of grazers (negatively) related to the vegeta-
tion N:P ratio. Grazers significantly reduced species
richness across the gradient of vegetation N:P ra-
tios, which is in line with the results of Gayet and
others (2011) on submerged macrophytes in fish-
ponds, who observed that the impact of mute swan
grazing was not related to pond nutrient status. The
N:P ratio in the vegetation indicated a relative
N-limitation for the vegetation in most of our plots
(N:P < 14, Koerselman and Meuleman 1996;
Gusewell and others 2003), which is most likely
due to the anthropogenic P-enrichment of Dutch
wetlands (Wassen and others 2005; Lamers and
others 2002). As herbivores have been shown to
affect nutrient availability to plants and may
modify the vegetation N:P ratio as well (van den
Wyngaert and others 2003; Bai and others 2012),
the mechanisms underlying the relationship be-
tween the vegetation N:P ratio and riparian plant
species richness and herbivores are complex and
remain to be further elucidated.
Another layer of complexity may appear when
top-down effects on vegetation expansion or
diversity are modulated by predator densities such
as was shown for riparian zones in the Yellowstone
national park and algal communities in reef systems
and near shore kelps (Estes and Palmisan 1974;
Power and others 1985; Marshall and others 2013).
IMPLICATIONS AND CONCLUSIONS
Hillebrand and others (2007) showed that herbi-
vores generally reduced species richness in fresh-
water, but tended to increase richness in terrestrial
systems. In our study in the transition between
those ecosystems, grazing decreased riparian spe-
cies richness, resembling aquatic systems in this
respect. Herbivores further decreased the width and
structure of the riparian vegetation which may
have cascading effects for the numerous species
that dwell in the riparian ecotone (Naiman and
Decamps 1997). Moreover, the riparian width
determines interactions between bordering systems
such as sediment inputs (from land to water and
vice versa) and has complex effects on nutrient
cycling (Verhoeven and others 2006; Yuan and
others 2009). By enforcing sharp boundaries be-
tween different ecosystems, herbivory in the eco-
tone may, therefore, have spatially cascading
consequences for the diversity and functioning of
its bordering ecosystems.
Sharp boundaries under grazing are reported for
several ecosystems, but then commonly refer to
smaller scales, such as mosaic vegetation patches
within an ecosystem. For instance grazing by rab-
bits inhibits shrub and tree expansion in grasslands,
thus maintaining a sharp boundary between
grassland and woodland patches (Bakker and oth-
ers 2004). Similar sharp boundaries have been
observed to be created by red deer between heather
and grassland patches (Farnsworth and Anderson
2001) and by sea urchins between reefs and sea
grass beds (Ogden and others 1973). We demon-
strate that herbivores can also inhibit a gradual
transition between ecosystems, thereby maintain-
ing a sharp boundary on larger spatial scales.
Recently, Silliman and others (2013) emphasized
that edges of resource or vegetation patches can be
particularly prone to grazing, when high numbers
of herbivores aggregate there in the so-called con-
sumer fronts. In wetlands, molting Greylag geese
may temporarily aggregate and graze intensively
on the edges of the vegetation fringe (Vulink and
Van Eerden 1998) resembling a consumer front,
but in the majority of our study sites there were no
consumer fronts. Therefore, our results suggest that
also at average herbivore densities, grazing at the
edges can induce sharp transitions. Herbivores
thereby can enforce sharp boundaries at a small
scale between patches or at the large scale between
whole ecosystems.
ACKNOWLEDGMENTS
The authors acknowledge Deltares for providing
data on the water level fluctuations in each of the
study areas, This Buurman (Hoogheemraadschap De
Stichtse Rijnlanden) for providing data on muskrat
catches. Staatsbosbeheer, Natuurmonumenten, Het
Noordhollands Landschap and Waternet are
Grazing and Environment Shape Sharp Ecotones
acknowledged for allowing and facilitating entrance
to the study areas. Dennis Waasdorp, Nico Helmsing,
Roy Korthout, Jose van Paassen and Isolde van
Riemsdijk, Koos Swart, Thijs de Boer, Lone Rav-
ensbergen and Roel Janssen are acknowledged for
their help with practical work. This study was funded
by Agentschap NL. This is a NIOO 5671 publication.
Data available from the Dryad Digital Repository:
http://doi.org/10.5061/dryad.qp47h.
REFERENCES
Bai YF, Wu JG, Clark CM, Pan QM, Zhang LX, Chen SP, Wang
QB, Han XG. 2012. Grazing alters ecosystem functioning and
C:N:P stoichiometry of grasslands along a regional precipita-
tion gradient. J Appl Ecol 49:1204–15.
Bakker ES, Olff H. 2003. Impact of different-sized herbivores on
recruitment opportunities for subordinate herbs in grasslands.
J Veg Sci 14:465–74.
Bakker ES, Olff H, Vandenberghe C, De Maeyer K, Smit R,
Gleichman JM, Vera FWM. 2004. Ecological anachronisms in
the recruitment of temperate light-demanding tree species in
wooded pastures. J Appl Ecol 41:571–82.
Bakker ES, Ritchie ME, Olff H, Milchunas DG, Knops JMH.
2006. Herbivore impact on grassland plant diversity depends
on habitat productivity and herbivore size. Ecol Lett 9:780–8.
Bakker ES, Sarneel JM, Gulati RD, Lui Z, Van Donk E. 2013.
Restoring macrophyte diversity in shallow temperate lakes:
biotic versus abiotic constraints. Hydrobiologia 710:23–37.
Bakker SA, Vandenberg NJ, Speleers BP. 1994. Vegetation
transitions of floating wetlands in a complex of turbaries be-
tween 1937 and 1989 as determined from aerial photographs
with GIS. Vegetatio 114:161–7.
Barkman JJ, Doing H, Segal S. 1964. Kritische Bemerkungen
und Vorschlage zur quantitativen Vegetationsanalyse. Acta
Bot Neerl 13:394–419.
Bornette G, Puijalon S. 2011. Response of aquatic plants to
abiotic factors: a review. Aquat Sci 73:1–14.
Bos D, Ydenberg R. 2011. Evaluation of alternative management
strategies of muskrat Ondatra zibethicus population control
using a population model. Wildl Biol 17:143–55.
Butler LG, Kielland K. 2008. Acceleration of vegetation turnover
and element cycling by mammalian herbivory in riparian
ecosystems. J Ecol 96:136–44.
Cadenasso ML, Pickett STA. 2000. Linking forest edge structure to
edge function: mediation of herbivore damage. J Ecol 88:31–44.
Chaichana R, Leah R, Moss B. 2011. Seasonal impact of water-
fowl on communities of macrophytes in a shallow lake. Aquat
Bot 95:39–44.
Crawley MJ. 2007. The R Book. Chichester: Wiley.
Danell K. 1979. Reduction of aquatic vegetation following the
colonization of a northern swedish lake by the muskrat,
Ondatra zibethica. Oecologia 38:101–6.
Eskelinen A, Harrison S, Tuomi M. 2012. Plant traits mediate
consumer and nutrient control on plant community produc-
tivity and diversity. Ecology 93:2705–18.
Estes JA, Palmisan JF. 1974. Sea otters: their role in structuring
nearshore communities. Science 185:1058–60.
Evers DE, Sasser CE, Gosselink JG, Fuller DA, Visser JM. 1998.
The impact of vertebrate herbivores on wetland vegetation in
Atchafalaya Bay, Louisiana. Estuaries 21:1–13.
Farnsworth KD, Anderson ARA. 2001. How simple grazing rules
can lead to persistent boundaries in vegetation communities.
Oikos 95:15–24.
Figureuerola J, Green AJ. 2002. Dispersal of aquatic organisms
by waterbirds: a review of past research and priorities for fu-
ture studies. Freshwat Biol 47:483–94.
Fujita Y, Venterink HO, van Bodegom PM, Douma JC, Heil GW,
Holzel N, Jablonska E, Kotowski W, Okruszko T, Pawlikowski
P, de Ruiter PC, Wassen MJ. 2014. Low investment in sexual
reproduction threatens plants adapted to phosphorus limita-
tion. Nature 505:82.
Gayet G, Guillemain M, Fritz H, Mesleard F, Begnis C, Costiou A,
Body G, Curtet L, Broyer J. 2011. Do mute swan (Cygnus olor)
grazing, swan residence and fishpond nutrient availability
interactively control macrophyte communities? Aquat Bot
95:110–16.
Gibson CWD, Brown VK. 1991. The effects of grazing on local
colonization and extinction during early succession. J Veg Sci
2:291–300.
Gusewell S, Koerselman W, Verhoeven JTA. 2003. Biomass N:P
ratios as indicators of nutrient limitation for plant populations
in wetlands. Ecol Appl 13:372–84.
Hidding B, Sarneel JM, Bakker ES. 2014. Flooding tolerance and
horizontal expansion of wetland plants: facilitation by floating
mats? Aquat Bot 113:83–9.
Hillebrand H, Gruner DS, Borer ET, Bracken MES, Cleland EE,
Elser JJ, Harpole WS, Ngai JT, Seabloom EW, Shurin JB,
Smith JE. 2007. Consumer versus resource control of
producer diversity depends on ecosystem type and pro-
ducer community structure. Proc Natl Acad Sci USA
104:10904–9.
Kanga EM, Ogutu JO, Piepho HP, Olff H. 2013. Hippopotamus
and livestock grazing: influences on riparian vegetation and
facilitation of other herbivores in the Mara Region of Kenya.
Landsc Ecol Eng 9:47–58.
Koerselman W, Meuleman AFM. 1996. The vegetation N:P ratio:
a new tool to detect the nature of nutrient limitation. J Appl
Ecol 33:1441–50.
Kuijper DPJ, Bakker JP. 2005. Top-down control of small her-
bivores on salt-marsh vegetation along a productivity gradi-
ent. Ecology 86:914–23.
Lamers LPM, Smolders AJP, Roelofs JGM. 2002. The restoration
of fens in the Netherlands. Hydrobiologia 478:107–30.
Liira J, Feldmann T, Maemets H, Peterson U. 2010. Two decades
of macrophyte expansion on the shores of a large shallow
northern temperate lake: a retrospective series of satellite
images. Aquat Bot 93:207–15.
Marklund O, Sandsten H, Hansson LA, Blindow I. 2002. Effects
of waterfowl and fish on submerged vegetation and macro-
invertebrates. Freshwat Biol 47:2049–59.
Marshall KN, Hobbs NT, Cooper DJ. 2013. Stream hydrology
limits recovery of riparian ecosystems after wolf reintroduc-
tion. Proc R Soc B 280:1756.
Merritt DM, Nilsson C, Jansson R. 2010. Consequences of
propagule dispersal and river fragmentation for riparian plant
community diversity and turnover. Ecol Monogr 80:609–26.
Naiman RJ, Decamps H. 1997. The ecology of interfaces:
Riparian zones. Annu Rev Ecol Syst 28:621–58.
J. M. Sarneel and others
Nilsson C, Svedmark M. 2002. Basic principles and ecological
consequences of changing water regimes: Riparian plant
communities. Environ Manage 30:468–80.
Ogden JC, Brown RA, Salesky N. 1973. Grazing by echinoid
Diadema antillarum Philippi: formation of halos around West-
Indian patch reefs. Science 182:715–17.
Olff H, Ritchie ME. 1998. Effects of herbivores on grassland plant
diversity. Trends Ecol Evol 13:261–5.
Parker JD, Caudill CC, Hay ME. 2007. Beaver herbivory on
aquatic plants. Oecologia 151:616–25.
Power ME, Matthews WJ, Stewart AJ. 1985. Grazing minnows,
piscivorous bass, and stream algae: dynamics of a strong
interaction. Ecology 66:1448–56.
Proulx G. 1997. Estimating fall whole-body weights of Muskrats,
Ondatra zibethicus, from skinned weights. Can Field-Nat
111:643–5.
R Core Team. 2013. R: A language and environment for statis-
tical computing. Vienna, Austia: R Foundation for Statistical
Computing.
Sarneel JM, Geurts JJM, Beltman B, Lamers LPM, Nijzink MM,
Soons MB, Verhoeven JTA. 2010. The effect of nutrient
enrichment of either the bank or the surface water on
shoreline vegetation and decomposition. Ecosystems 13:1275–
86.
Sarneel JM, Soons MB, Geurts JJM, Beltman B, Verhoeven JTA.
2011. Multiple effects of land-use changes impede the colo-
nization of open water in fen ponds. J Veg Sci 22:551–63.
Silliman BR, McCoy MW, Angelini C, Holt RD, Griffin JN, van
de Koppel J. 2013. Consumer fronts, global change, and
runaway collapse in ecosystems. Annu Rev Ecol Evol Syst
44(44):503–38.
Sollie S, Janse JH, Mooij WM, Coops H, Verhoeven JTA. 2008.
The contribution of marsh zones to water quality in Dutch
Shallow Lakes: a modeling study. Environ Manage 42:1002–
16.
Speed JDM, Austrheim G, Mysterud A. 2013. The response of
plant diversity to grazing varies along an elevational gradient.
J Ecol 101:1225.
Tatu KS, Anderson JT, Hindman LJ, Seidel G. 2007. Mute swans’
impact on submerged aquatic vegetation in Chesapeake Bay. J
Wildl Manage 71:1431–9.
van den Wyngaert IJJ, Wienk LD, Sollie S, Bobbink R, Verho-
even JTA. 2003. Long-term effects of yearly grazing by mo-
ulting Greylag geese (Anser anser) on reed (Phragmites australis)
growth and nutrient dynamics. Aquat Bot 75:229–48.
Van Eerden MR, Drent RH, Stahl J, Bakker JP. 2005. Connecting
seas: western Palaearctic continental flyway for water birds in
the perspective of changing land use and climate. Global
Change Biol 11:894–908.
Veen GF, Sarneel JM, Ravensbergen L, Huig N, van Paassen J,
Rip W, Bakker ES. 2013. Aquatic grazers reduce the estab-
lishment and growth of riparian plants along an environ-
mental gradient. Freshwat Biol 58:1794–803.
Verhoeven JTA, Arheimer B, Yin CQ, Hefting MM. 2006. Re-
gional and global concerns over wetlands and water quality.
Trends Ecol Evol 21:96–103.
Vulink JT, Van Eerden MR. 1998. Hydrological conditions and
herbivory as key operators for ecosystem development in
Dutch artificial wetlands. Dordrecht, The Netherlands: Kluwer
Academic Publishers.
Wanner A, Suchrow S, Kiehl K, Meyer W, Pohlmann N, Stock
M, Jensen K. 2014. Scale matters: impact of management
regime on plant species richness and vegetation type diversity
in Wadden Sea salt marshes. Agric Ecosyst Environ 182:69–
79.
Wassen MJ, Venterink HO, Lapshina ED, Tanneberger F. 2005.
Endangered plants persist under phosphorus limitation. Nat-
ure 437:547–50.
Weisner SEB, Strand JA, Sandsten H. 1997. Mechanisms regu-
lating abundance of submerged vegetation in shallow eutro-
phic lakes. Oecologia 109:592–9.
Weltzin JF, Archer S, Heitschmidt RK. 1997. Small-mammal
regulation of vegetation structure in a temperate Savanna.
Ecology 78:751–63.
Wood KA, Stillman RA, Clarke RT, Daunt F, O’Hare MT. 2012.
The impact of waterfowl herbivory on plant standing crop: a
meta-analysis. Hydrobiologia 686:157–67.
Yarrow MM, Marin VH. 2007. Toward conceptual cohesiveness:
a historical analysis of the theory and utility of ecological
boundaries and transition zones. Ecosystems 10:462–76.
Yuan YP, Bingner RL, Locke MA. 2009. A review of effectiveness
of vegetative buffers on sediment trapping in agricultural
areas. Ecohydrology 2:321–36.
Grazing and Environment Shape Sharp Ecotones


![Herbivores ปี5-51 [Read-Only]](https://img.pdfslide.net/doc/110x75/6264f48f9902b31e1a264930/herbivores-5-51-read-only.jpg)