Embed Size (px)
Citation preview
High-Skilled Immigration, STEM Employment, and
Non-Routine-Biased Technical Change∗
Nir JaimovichUniversity of Southern California and NBER
Henry E. SiuUniversity of British Columbia and NBER
June 29, 2016
Abstract
We study the role of foreign-born workers in the growth of employment in STEM oc-cupations since 1980. Given the importance of employment in these fields for research andinnovation, we consider their role in a model featuring endogenous non-routine-biased tech-nical change. We use this model to quantify the impact of high-skilled immigration, and theincreasing tendency of immigrants to work in innovation, for the pace of non-routine-biasedtechnical change, the polarization of employment opportunities, and the evolution of wageinequality since 1980.
Keywords: immigration; STEM; directed technical change; job polarization
∗We thank David Green, Valerie Ramey, and workshop participants at the Bank of Canada for valuablecomments and discussion. Siu thanks the Social Sciences and Humanities Research Council of Canada for support.
1 Introduction
Immigration has constituted an important source of growth in high-skilled employment, inno-
vation, and productivity in the U.S. during the past 30 or 40 years. In this paper, we study
the role of this immigration in accounting for changes in the occupational-skill distribution and
wage inequality experienced over the past 30 years.
There is a growing body of empirical work studying the labor market implications of high-
skilled immigration. Most of this work focuses on the impact on employment outcomes for
other high-skilled workers and specifically, whether there is “crowding-out” or displacement of
the native-born. Though methodological approaches differ across studies, a summary of the
literature is that there is little or no evidence that such displacement exists.1 However, as noted
by Kerr (2013), much less is known about the long-run and general equilibrium impacts of high-
skilled immigration on the U.S. labor market. The aim of this paper is to contribute along
this dimension, and provide a quantitative theoretic framework in which such questions can be
addressed.
The starting point of our analysis, as documented in Section 2 and by Hanson and Slaughter
(2015), is the fact that high-skilled immigrants represent a large and growing share of em-
ployment in STEM occupations—fields related to research, development, and innovation which
are key to productivity and technological progress. As such these high-skilled immigrants and
foreign-born innovators contribute disproportionately to U.S. growth. At the same time, the
economy has experienced technical change that is non-routine-biased, allowing technology to
substitute for labor in performing “routine tasks” during the past 30 years.2
Given this, we present in Section 3 a unified framework of endogenous non-routine-biased
technical change (NBTC, hereafter) with both native- and foreign-born workers. In the model
workers face an occupational choice between employment in production or innovation jobs.
As such, NBTC is the outcome of purposeful activity, namely the equilibrium allocation of
workers to innovation. These elements of the model allow us to present a framework to assess
the general equilibrium implications of high-skilled immigration and changes in occupational
sorting documented in Section 2.
In Section 4, we discuss the calibration and quantitative specification of the model. We then
use the model to quantify the role of high-skilled immigration on non-routine-biased techni-
cal change, its associated polarization of employment opportunities, and the evolution of wage
1See Hunt and Gauthier-Loiselle (2010), Kerr and Lincoln (2010), and Peri et al. (2015). Kerr (2013) providesa very useful overview of the literature on immigration, high-skilled labor markets, and innovation.
2While others have referred to this process as “routine-biased” technical change (see, for instance, Goos et al.(2014) and Autor et al. (2015)), we depart from the literature and use the term non-routine-biased. This is inkeeping with the use of terminology in the literature on skill-biased technical change (see, for instance, Violante(2008)), in which recent technological progress has benefited skilled (versus unskilled) workers. As argued hereand in the literature on job polarization (discussed below), recent technical change has benefited workers innon-routine (versus routine) occupations.
2
inequality since 1980. We find that, contrary to expectation, high-skilled immigration has con-
tributed to a narrowing of wage inequality.
2 Empirical Facts
2.1 Immigration and High-Skilled Employment
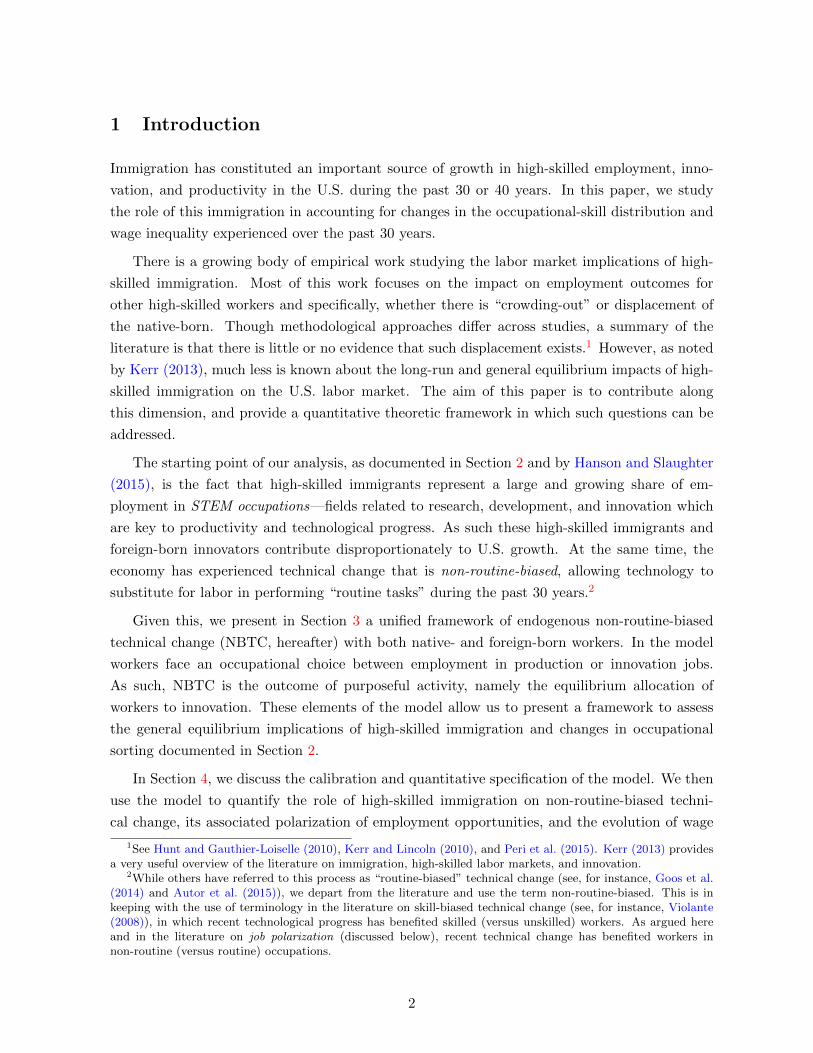
According to the U.S. Census Bureau, the foreign-born share of the population has more than
doubled between 1980 and 2010, from 6.2% to 12.9% (see Grieco et al. (2012)). As a result,
the foreign-born share of high-skilled employment has increased as well. In Table 1, we present
evidence of this using the 5% sample of the 1980 decennial census and the 1% sample of the 2010
American Community Survey (ACS), made available by IPUMS (see Ruggles et al. (2010)). We
restrict attention to the 20-64 year old (or “working age”) population. Given differences in the
questionnaire, we define high-skilled workers as those with at least four years of college in the
1980 census, and those with at least a Bachelor’s degree in the 2010 ACS.3
Evidently, high-skilled, foreign-born employment increased by 5.7 million workers during
this period. As a fraction of total high-skilled employment, the foreign-born share increased
from 7.8% in 1980 to 16.8% in 2010, mirroring the proportional increase observed in the overall
population. The bottom row of Column 1, Table 1 indicates that, of the total increase in
high-skilled employment, approximately 23% is accounted for by the foreign-born.
Employment of high-skilled workers is highly concentrated within certain occupations. To
illustrate this, we adopt the classification system used in the job polarization literature that doc-
uments changes in the occupational employment distribution since the 1980s (see, for instance,
Acemoglu and Autor (2011) and Cortes et al. (2015)). We delineate occupations along two
dimensions—“cognitive” versus “manual,” and “routine” versus “non-routine”—based on the
skill content of tasks performed on the job. The distinction between cognitive and manual jobs
is based on the extent of mental versus physical activity. The distinction between routine and
non-routine occupations is based on the work of Autor et al. (2003). If the tasks involved can be
summarized as a set of specific activities accomplished by following well-defined instructions and
procedures, the occupation is considered routine. If instead the job requires mental or physical
flexibility, problem-solving, or human interaction skills, the occupation is non-routine.
High-skilled employment is concentrated in non-routine cognitive (NRC) occupations. Not
surprisingly, these occupations occupy the upper tail of the occupational wage distribution (see,
for instance, Goos and Manning (2007) and Acemoglu and Autor (2011)). This is true of both
native- and foreign-born workers. The second set of columns of Table 1 display these employment
3For highly related results to those presented in this subsection and the next, see Hanson and Slaughter (2015)who provide more detailed analysis disaggregated by educational attainment and occupation, analysis of wagesand earnings, and discussion on the H1-B visa program and means of entry.
3
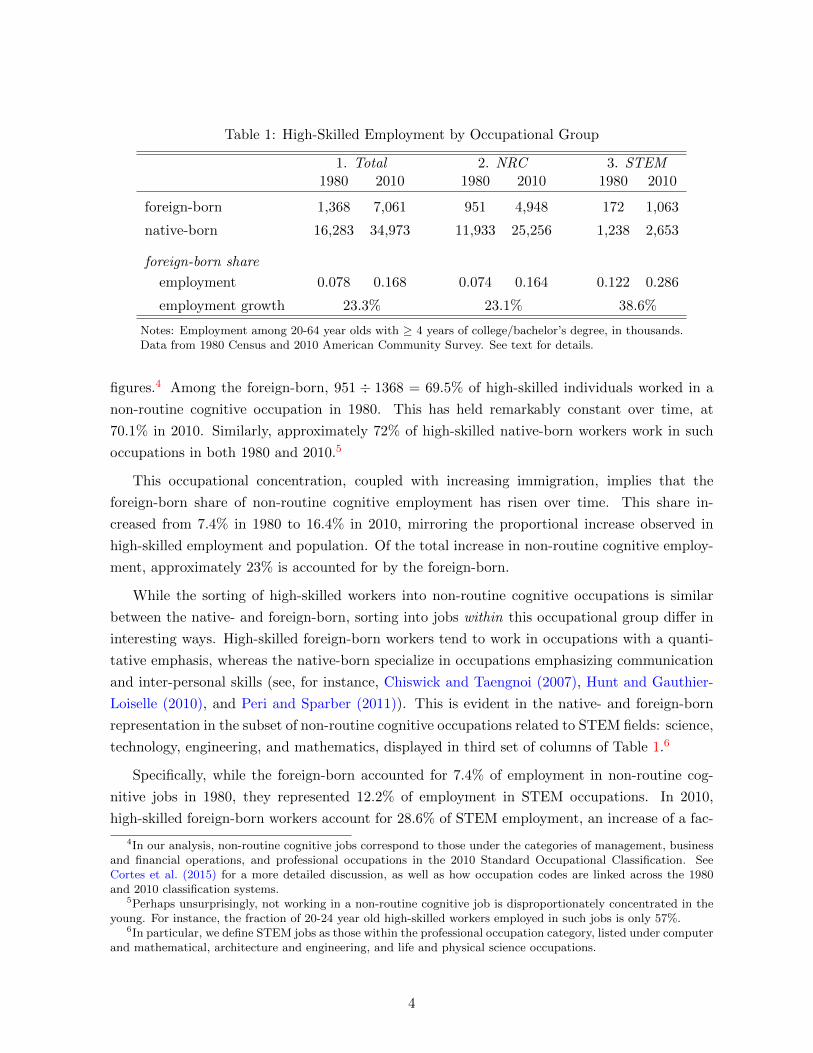
Table 1: High-Skilled Employment by Occupational Group
1. Total 2. NRC 3. STEM1980 2010 1980 2010 1980 2010
foreign-born 1,368 7,061 951 4,948 172 1,063
native-born 16,283 34,973 11,933 25,256 1,238 2,653
foreign-born share
employment 0.078 0.168 0.074 0.164 0.122 0.286
employment growth 23.3% 23.1% 38.6%
Notes: Employment among 20-64 year olds with ≥ 4 years of college/bachelor’s degree, in thousands.Data from 1980 Census and 2010 American Community Survey. See text for details.
figures.4 Among the foreign-born, 951 ÷ 1368 = 69.5% of high-skilled individuals worked in a
non-routine cognitive occupation in 1980. This has held remarkably constant over time, at
70.1% in 2010. Similarly, approximately 72% of high-skilled native-born workers work in such
occupations in both 1980 and 2010.5
This occupational concentration, coupled with increasing immigration, implies that the
foreign-born share of non-routine cognitive employment has risen over time. This share in-
creased from 7.4% in 1980 to 16.4% in 2010, mirroring the proportional increase observed in
high-skilled employment and population. Of the total increase in non-routine cognitive employ-
ment, approximately 23% is accounted for by the foreign-born.
While the sorting of high-skilled workers into non-routine cognitive occupations is similar
between the native- and foreign-born, sorting into jobs within this occupational group differ in
interesting ways. High-skilled foreign-born workers tend to work in occupations with a quanti-
tative emphasis, whereas the native-born specialize in occupations emphasizing communication
and inter-personal skills (see, for instance, Chiswick and Taengnoi (2007), Hunt and Gauthier-
Loiselle (2010), and Peri and Sparber (2011)). This is evident in the native- and foreign-born
representation in the subset of non-routine cognitive occupations related to STEM fields: science,
technology, engineering, and mathematics, displayed in third set of columns of Table 1.6
Specifically, while the foreign-born accounted for 7.4% of employment in non-routine cog-
nitive jobs in 1980, they represented 12.2% of employment in STEM occupations. In 2010,
high-skilled foreign-born workers account for 28.6% of STEM employment, an increase of a fac-
4In our analysis, non-routine cognitive jobs correspond to those under the categories of management, businessand financial operations, and professional occupations in the 2010 Standard Occupational Classification. SeeCortes et al. (2015) for a more detailed discussion, as well as how occupation codes are linked across the 1980and 2010 classification systems.
5Perhaps unsurprisingly, not working in a non-routine cognitive job is disproportionately concentrated in theyoung. For instance, the fraction of 20-24 year old high-skilled workers employed in such jobs is only 57%.
6In particular, we define STEM jobs as those within the professional occupation category, listed under computerand mathematical, architecture and engineering, and life and physical science occupations.
4
tor of approximately 2.5. Of the total increase in STEM employment in the U.S. between 1980
and 2010, approximately 39% is accounted for by the foreign-born (see also Kerr and Lincoln
(2010)).7 Finally, as discussed in the literature, such jobs are tightly related to innovation and
R&D; as such, high-skilled immigration has played an important role in the outcomes and output
of these occupations as measured by patenting, high-tech start-ups, and other measures (see,
for instance, Hunt and Gauthier-Loiselle (2010), Hunt (2011), Peri (2012), Kerr (2013), and the
references therein).
2.2 Nativity Differences in STEM Employment
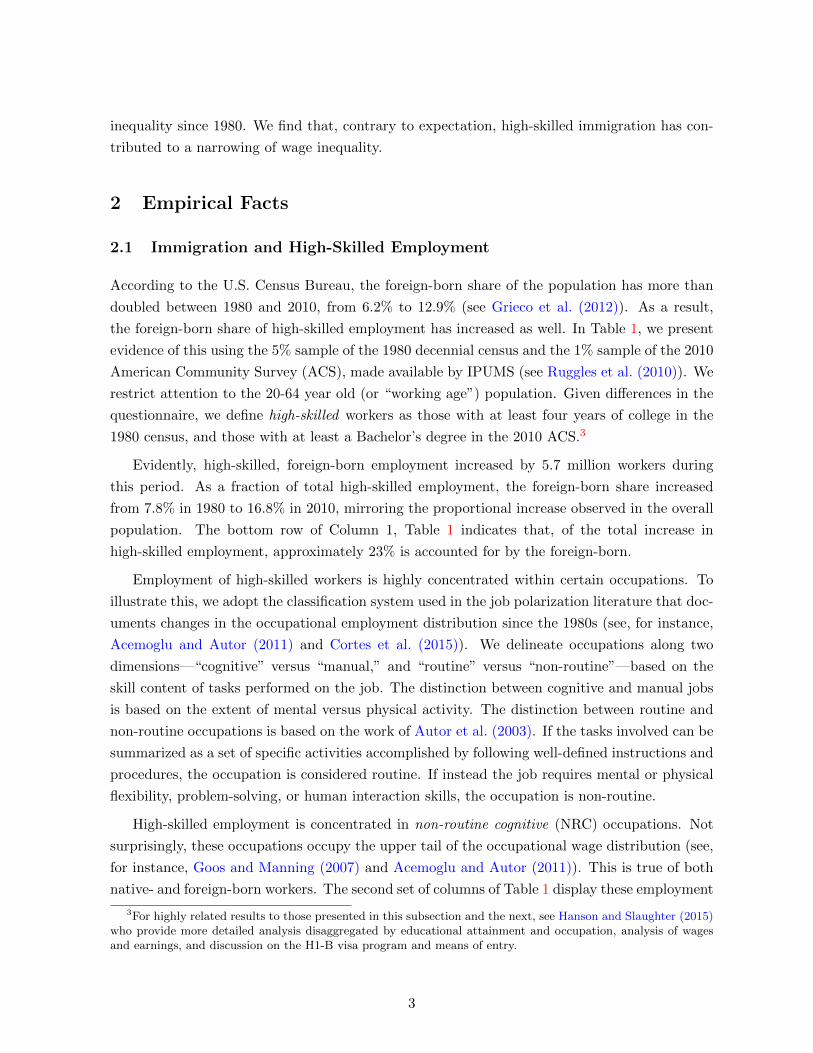
In this subsection, we take a closer look at occupational sorting among high-skilled workers. Our
interest is in the tendency to work in STEM occupations—how this differs between the native-
and foreign-born, and how this difference has changed over time. Panel A of Table 2 presents
the fraction of high-skilled workers who are employed in a STEM occupation; Panel B presents
the fraction, conditional on being employed in a non-routine cognitive occupation. The basic
data are taken from Table 1.
From the perspective of nativity, it is clear that the foreign-born are more likely to work in
STEM occupations than native-born. For instance, the fraction of workers employed in STEM
is 5.0 percentage points greater in 1980 (12.6% versus 7.6%); similarly, conditional on being a
non-routine cognitive worker, the likelihood of being a STEM worker is 7.7 pp greater. As a
point of comparison, the tendency for high-skilled workers born in either India or China to work
in STEM is approximately three times that of the native-born.
Over time this difference has become more pronounced. Consider the tendency of the high-
skilled to work in STEM, conditional on either employment in any occupation, or non-routine
cognitive employment. As the third column in Table 2 makes clear, this tendency has remained
essentially constant for the native-born between 1980 and 2010. By contrast, the fraction of
foreign-born workers in STEM has increased by 2.5 pp in Panel A, and 3.4 pp in Panel B. As
such, the foreign-born tendency toward STEM employment is now twice that of native-born
workers.8
This differential change in tendency is not due simply to differences in demographic change
between native- and foreign-born workers. To see this, let πit be a dummy variable that takes
on the value of 1 if individual i works in a STEM occupation and 0 otherwise (conditional on
either employment or employment in a non-routine cognitive job). We consider a simple linear
7Interestingly, about 21% of the total increase in STEM employment in the U.S. is accounted for by the sourcecountries of India and China alone.
8See also Peri and Sparber (2011) who find that the occupational choice among native-born job switchers isaffected by the foreign-born worker share. This is consistent with our findings on differential trends in sortinginto STEM and Kerr et al. (2013) who study the impact of skilled immigrants on the employment structures ofU.S. firm.
5
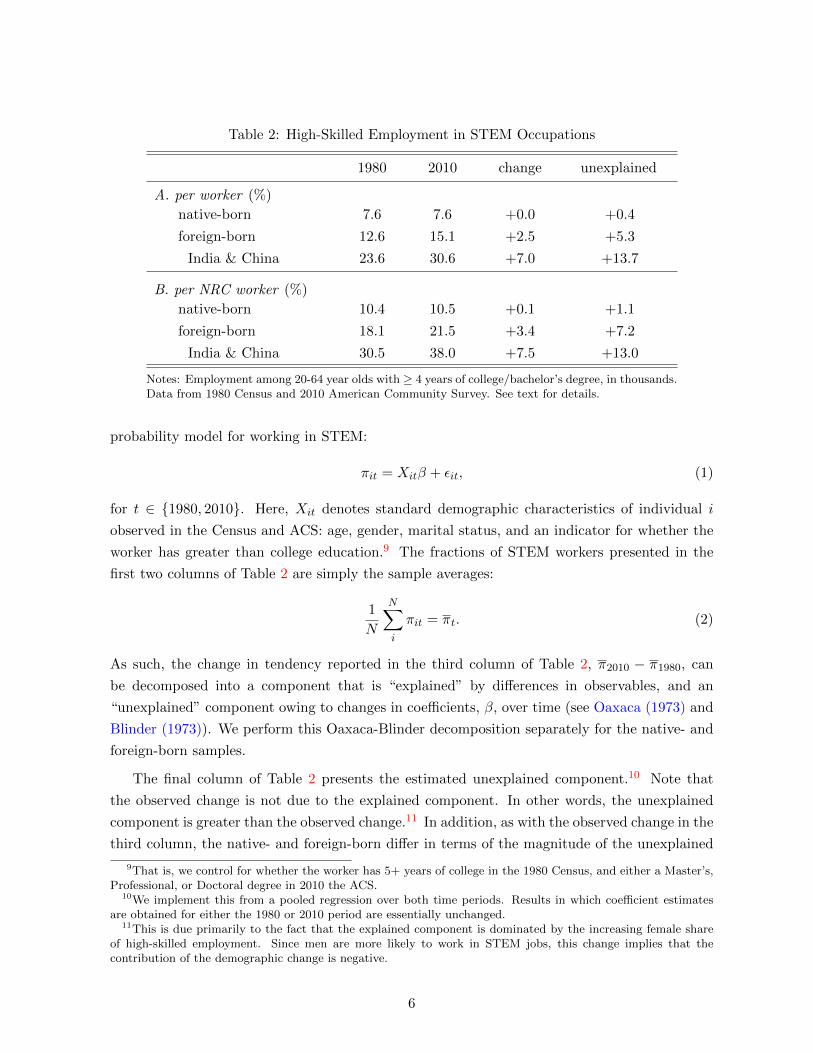
Table 2: High-Skilled Employment in STEM Occupations
1980 2010 change unexplained
A. per worker (%)
native-born 7.6 7.6 +0.0 +0.4
foreign-born 12.6 15.1 +2.5 +5.3
India & China 23.6 30.6 +7.0 +13.7
B. per NRC worker (%)
native-born 10.4 10.5 +0.1 +1.1
foreign-born 18.1 21.5 +3.4 +7.2
India & China 30.5 38.0 +7.5 +13.0
Notes: Employment among 20-64 year olds with ≥ 4 years of college/bachelor’s degree, in thousands.Data from 1980 Census and 2010 American Community Survey. See text for details.
probability model for working in STEM:
πit = Xitβ + εit, (1)
for t ∈ 1980, 2010. Here, Xit denotes standard demographic characteristics of individual i
observed in the Census and ACS: age, gender, marital status, and an indicator for whether the
worker has greater than college education.9 The fractions of STEM workers presented in the
first two columns of Table 2 are simply the sample averages:
1
N
N∑i
πit = πt. (2)
As such, the change in tendency reported in the third column of Table 2, π2010 − π1980, can
be decomposed into a component that is “explained” by differences in observables, and an
“unexplained” component owing to changes in coefficients, β, over time (see Oaxaca (1973) and
Blinder (1973)). We perform this Oaxaca-Blinder decomposition separately for the native- and
foreign-born samples.
The final column of Table 2 presents the estimated unexplained component.10 Note that
the observed change is not due to the explained component. In other words, the unexplained
component is greater than the observed change.11 In addition, as with the observed change in the
third column, the native- and foreign-born differ in terms of the magnitude of the unexplained
9That is, we control for whether the worker has 5+ years of college in the 1980 Census, and either a Master’s,Professional, or Doctoral degree in 2010 the ACS.
10We implement this from a pooled regression over both time periods. Results in which coefficient estimatesare obtained for either the 1980 or 2010 period are essentially unchanged.
11This is due primarily to the fact that the explained component is dominated by the increasing female shareof high-skilled employment. Since men are more likely to work in STEM jobs, this change implies that thecontribution of the demographic change is negative.
6
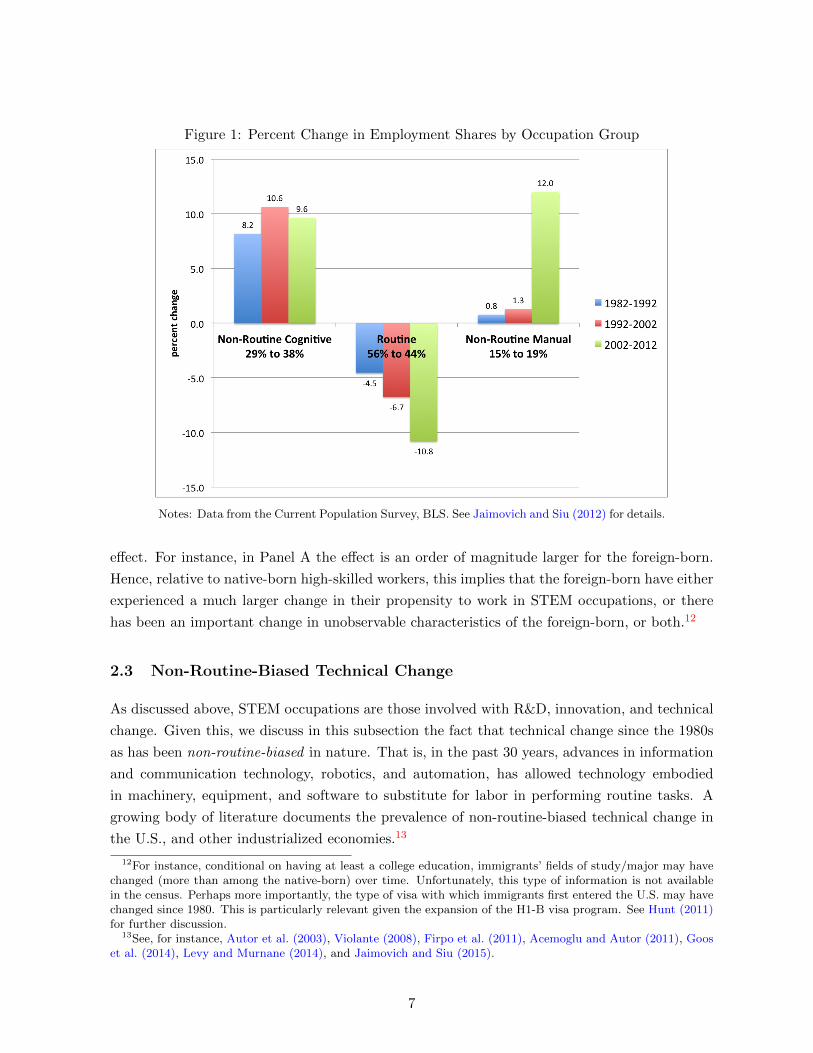
Figure 1: Percent Change in Employment Shares by Occupation Group
Notes: Data from the Current Population Survey, BLS. See Jaimovich and Siu (2012) for details.
effect. For instance, in Panel A the effect is an order of magnitude larger for the foreign-born.
Hence, relative to native-born high-skilled workers, this implies that the foreign-born have either
experienced a much larger change in their propensity to work in STEM occupations, or there
has been an important change in unobservable characteristics of the foreign-born, or both.12
2.3 Non-Routine-Biased Technical Change
As discussed above, STEM occupations are those involved with R&D, innovation, and technical
change. Given this, we discuss in this subsection the fact that technical change since the 1980s
as has been non-routine-biased in nature. That is, in the past 30 years, advances in information
and communication technology, robotics, and automation, has allowed technology embodied
in machinery, equipment, and software to substitute for labor in performing routine tasks. A
growing body of literature documents the prevalence of non-routine-biased technical change in
the U.S., and other industrialized economies.13
12For instance, conditional on having at least a college education, immigrants’ fields of study/major may havechanged (more than among the native-born) over time. Unfortunately, this type of information is not availablein the census. Perhaps more importantly, the type of visa with which immigrants first entered the U.S. may havechanged since 1980. This is particularly relevant given the expansion of the H1-B visa program. See Hunt (2011)for further discussion.
13See, for instance, Autor et al. (2003), Violante (2008), Firpo et al. (2011), Acemoglu and Autor (2011), Gooset al. (2014), Levy and Murnane (2014), and Jaimovich and Siu (2015).
7
This has resulted in a stark change in the occupational-skill distribution of employment.
Industrialized economics have experienced job polarization: the labor market has become po-
larized, with employment share shifting away from middle-skilled, routine occupations, towards
both the high- and low-skill tails of the distribution. To illustrate this, Figure 1 replicates a
figure from Jaimovich and Siu (2012). Each bar represents the percent change in an occupa-
tional group’s share of total employment. Over time, the share of employment in high-skill
(non-routine cognitive) and low-skill (non-routine manual) jobs has been growing. This has
been accompanied by a hollowing out of the middle-skill, routine occupations. In 1982, routine
occupations accounted for approximately 56% of total employment; in 2012, this share has fallen
to 44%. Hence, non-routine-biased technical change (NBTC) has led to a polarization in em-
ployment away from routine, middle-skill occupations toward non-routine cognitive and manual
jobs.
3 Model
Motivated by the findings of Section 2, we consider a simple model of endogenous NBTC. Non-
routine-biased technology is modeled as technology that is substitutable with routine labor in
production. Advances in this technology are the outcome of employment devoted to innovation
activities.
A key element to the model is occupational choice. There are two types of individuals in
the economy: low-skilled and high-skilled. Given the data presented in Section 2, high-skilled
individuals work in non-routine cognitive occupations. For the sake of exposition, we refer
to their choice as either working as innovators (in STEM occupations) in the production of
technology, or as managers (in other non-routine cognitive jobs) in the production of goods.
Low-skilled individuals choose to work in either routine or service occupations (both of which
produce goods).
In Section 4, we use this model to quantify the impact of high-skilled immigration, and the
increasing tendency of immigrants to work in innovation, on the pace of NBTC and labor market
outcomes.
3.1 Production
Industrial structure The model features three sectors of production. In the first sector,
perfectly competitive firms produce gross output (Y ) using a Cobb-Douglas function in “man-
agerial tasks” and “routine tasks.” Managerial tasks are derived from labor input of managers,
LM . Routine tasks are derived from routine labor input, LR, and automation technology, A.
Specifically:
Y = (zLM )α[λAρ + (1− λ)(zLR)ρ](1−α)/ρ, ρ < 1. (3)
8
Here, z represents labor-augmenting technology, which grows exogenously at the rate g ≥ 0. By
contrast, growth in the automation technology is endogenous to purposeful innovation activities
as described below. The degree of substitutability between automation technology and routine
labor is governed by ρ: as ρ→ 1, the two factors approach perfect substitutes.
The input of automation technology is composed of intermediate goods, xi, with measure n,
and a fixed factor F according to:14
A = F 1−σ∫ n
0xσi di, 0 < σ < 1. (4)
We note that this specification of production is related to other work on non-routine-biased
technical change.15
The second sector produces intermediate goods, x. Specifically, we consider a Romer (1990)-
style model in which growth is driven by innovation that expands the variety of intermediate
inputs. We assume that the innovator of a specific variety of input owns a permanent patent on
the production of its associated intermediate good. Each unit of intermediate good is produced
with η units of gross output.
In the third sector, perfectly competitive firms produce output as a linear function of labor
input into service occupations: LS units of service labor input produce wSLS units of output. Fi-
nally, to complete the description of production, we note that gross output is either transformed
1-for-1 into consumption goods, or used as an input in the production of x.
Optimization Normalizing the price of output to one, the first-order conditions for profit
maximization provide expressions for wage rates on managerial and routine labor, the rental
rate on the fixed factor, and the price of intermediate inputs, respectively:
wM = αY L−1M (5)
wR = (1− α)Y Ω(1− λ)zρLρ−1R (6)
r = (1− α)Y Ωλ(1− σ)F (1−σ)ρ−1[∫ n
0xσi di
]ρ(7)
pi = (1− α)Y ΩλF (1−σ)ρ[∫ n
0xσi di
]ρ−1σxσ−1i , (8)
where Ω = [λAρ + (1− λ)(zLR)ρ]−1.
In the intermediate goods sector, the per period profit earned by the innovator of input
variety i is πi = (pi − η)xi. Substituting in (8), the FOC is given by:
xi =
(σΦ
η
) 11−σ
, (9)
14The fixed factor is included simply for technical reasons, namely, to ensure that production of Y is homogenousof degree one in factor inputs LM , LR, F , and xi for all i ∈ [0, n].
15See, for example, Jung and Mercenier (2014) and Acemoglu and Restrepo (2015), as well as Caselli (2015)who studies the effects of experience-biased technical change.
9
where Φ = (1 − α)Y ΩλF (1−σ)ρ [∫ n0 x
σi di]ρ−1
σ. In a symmetric equilibrium, denote xi ≡ x for
all i. Substituting (9) into (8) and the definition of profit yields that the price is a constant
markup over marginal cost:
pi =η
σ≡ p, (10)
and that profits are given by:
πi = (1− σ)Φ1
1−σ
(σ
η
) σ1−σ≡ π. (11)
In the third sector sector, price-taking and profit-maximizing behavior—given the linearity
of the production function—imply that the productivity parameter in this sector, wS , is equal
to the service occupation wage. We assume that wS grows exogenously at the rate g.
Differential effects of NBTC Having characterized optimal demand for the various factors
of production, we note the following. The marginal product of routine labor (MPLR) is given
by the righthand side of (6). As such:
sgn
(∂MPLR∂A
)= sgn (1− α− ρ) . (12)
Hence, an increase in automation technology shifts the “demand curve” for routine labor down
whenever ρ > 1−α. Moreover, given the Cobb-Douglas functional form of (3), managerial labor
and routine tasks are complementary. Thus, we consider an economy where the effects of au-
tomation technology growth are differential: all else equal, it decreases the marginal productivity
of routine workers while increasing the marginal productivity of managers.
3.2 Households
The economy is populated by a large, representative household. The household is composed
of a continuum of family members, which we refer to as “workers.” Each worker supplies one
unit of labor inelastically. Within the household, native-born workers are of measure µnat, and
foreign-born are of measure µfor. There are two types of native-born workers: high-skilled
and low-skilled; we let φ denote the share of high-skilled native-born. For simplicity, given our
interest in high-skilled immigration, we assume that all foreign-born are high-skilled.
Low-skilled workers can be employed in either a routine occupation or a service occupation.
Low-skilled workers differ in their routine work ability, u, which is distributed Υ(u). Given the
date t wage per unit of (effective) routine labor, wRt, a worker with ability u earns u × wRtemployed in the routine occupation. Alternatively, workers earn wSt employed in the service
occupation, regardless of u. Hence, it is optimal for the household to allocate all low-skilled
workers with u < u∗t to employment in the service occupation, where:
u∗twRt = wSt. (13)
10
All workers with u ≥ u∗t are allocated to routine work. We denote slot = Υ(u∗t ) as the fraction
of low-skilled (native-born) workers employed in the service occupation.16
High-skilled workers work either as managers or innovators. High-skilled workers differ in
their innovation ability, a, which is distributed Γ(a). For simplicity, we assume that this is
identical across the native- and foreign-born. A native-born worker with ability a develops
a× fnat × nt new ideas at date t, to which the innovator’s household is bestowed a permanent
patent. Here, fnat > 0 is a productivity parameter, and nt represents the externality of the
aggregate stock of ideas on an individual’s innovative activity, as in Romer (1990). Similarly, a
foreign-born worker with ability a develops a× ffor × nt new ideas.
Alternatively, a high-skilled worker earns wMt employed as a manager, regardless of a. It
is optimal for the household to allocate all native-born high-skilled workers with a < anat∗t as
managers, where:
ζtanat∗t fnatnt = θtwMt. (14)
Here, ζt represents the shadow value to the household of an additional idea, and θt the shadow
value of an additional unit of income, both of which we derive below. Workers with a ≥ anat∗t
are allocated to innovation. Similarly, the cut-off afor∗t is defined as the value that satisfies:
ζtafor∗t ffornt = θtwMt. (15)
We denote shit = Γ(anat∗t ) and sfort = Γ(afor∗t ) as the fraction of high-skilled native- and foreign-
born workers employed as managers.17
The household’s date τ problem is to maximize:
∞∑t=τ
βt−τ[ ∫ φµnat
0log(Cit)di+
∫ µnat
φµnatlog(Cjt)dj +
∫ µnat+µfor
µnatlog(Ckt)dk
], (16)
subject to the budget constraint:∫ φµnat
0Citdi+
∫ µnat
φµnatCjtdj +
∫ µnat+µfor
µnatCktdk +Bt+1 ≤ RtBt + rtF +mtπt+
wMt
[µnatφshit + µforsfort
]+[wSts
lot + wRt
∫ ∞u∗t
u dΥ(u)]µnat(1− φ),
(17)
16Note that we have specified workers as supplying labor inelastically; workers do not face a labor-leisure trade-off, nor do they face the possibility of non-employment. As such, job polarization—generated by our experimentsin the following section—is a result of changes in occupational sorting among low-skilled workers. That is, anydecline in routine employment is reflected as a rise in the number of workers allocated to the service occupation.An alternative, would be to introduce an explicit possibility of non-employment for low-skilled workers. We viewthis as an interesting extension for future research.
17Given that Γ(a) is identical across nativity, fnat 6= ffor allows the model to generate differences in occupa-tional sorting across high-skilled native- and foreign-born workers; this is made explicit via equation (29) below.An alternative would be to allow the distributions to differ by nativity.
11
and the law-of-motion for the household’s stock of patents:
mt+1 = mt + nt
[µnatφfnat
∫ ∞anat∗t
a dΓ(a) + µforffor∫ ∞afor∗t
a dΓ(a)
], (18)
for all t ≥ τ . In (17), Bt+1 denotes one-period bonds purchased at date t that pay a return
of Rt+1 at date t + 1.18 Rental income on the household’s fixed factor is given by rtF . The
second line of (17) denotes household labor income earned by workers in management, service,
and routine employment.
At date t, the household’s stock of ideas is mt. With symmetry, each idea earns flow profit
πt. Patents do not expire or depreciate, so that (18) indicates that mt+1 is simply the stock
today augmented by new ideas developed by high-skilled workers at date t.
Let θt and ζt denote the Lagrange multipliers associated with the date t budget constraint
(17) and law-of-motion (18), respectively. Given preferences, optimality involves allocating the
same consumption level to all workers, regardless of skill or occupation: Cit = Cjt = Ckt =
Ct, ∀i, j, k. As such, we note that our model is suited to the analysis of changes in wage
and income inequality, as opposed to consumption or welfare inequality. Moreover, optimality
implies θt = 1/Ct. The FOC for bond holding is:
θt = βθt+1Rt+1. (19)
The FOC for the household’s stock of ideas is given by:
ζt = βζt+1 + βθt+1πt+1. (20)
Iterating forward, this becomes:
ζt = βθt+1πt+1 + β2θt+2πt+2 + β3θt+3πt+3 + . . . (21)
Dividing by θt and using (19), obtains:
ζtθt
=πt+1
Rt+1+
πt+2
Rt+1Rt+2+
πt+3
Rt+1Rt+2Rt+3+ . . . (22)
As a result, the cut-off condition (14) can be rewritten as:
wMt = anat∗t fnatnt
∞∑i=1
[πt+i∏ij=1Rt+j
]. (23)
That is, occupational choice among high-skilled natives is such that, at anat∗t , the return to
working as a manager (in terms of current wage income) is equated to the present value of
future profit that worker would generate from innovation. Obviously, (15) can be rewritten in
the analogous way, with afor∗t ffor replacing anat∗t fnat above.
18In equilibrium, such bonds are in zero net supply, and simply allow us to designate the household’s discountfactor in the derivations to follow.
12
3.3 Equilibrium and Balanced Growth
Equilibrium in this model is defined in the usual way. Optimization on the part of firms is
summarized by the FOCs (5) through (9). Household optimization is summarized by (13)
through (15), and (17) holding with equality.
Since bonds are in zero net supply, Bt = 0. Labor market clearing requires:
LSt = µnat(1− φ)slot , (24)
LRt = µnat(1− φ)
∫ ∞u∗t
u dΥ(u), (25)
LMt = µnatφshit + µforsfort . (26)
In the ideas market, mt = nt. Using (18), this implies that the growth rate of the aggregate
stock of ideas is given by:
gnt+1 =nt+1 − nt
nt= µnatφfnat
∫ ∞anat∗t
a dΓ(a) + µforffor∫ ∞afor∗t
a dΓ(a). (27)
Finally, the household budget constraint can be used to derive the aggregate resource constraint:
(µnat + µfor)Ct = Yt + wStLSt − ηxtnt. (28)
Equation (27) allows us to consider the determinants of the growth of ideas, i.e. routine-
biased technical change. For instance, an increase in the productivity of innovation, either
fnat or ffor, has a direct effect of increasing gn. In addition, such a change has an effect on
occupational choice: the more productive is innovation, the lower is the threshold productivity
(anat∗ and afor∗) required to equate returns to managerial work and innovation in (14) and (15),
all else equal. Hence, increases in fnat and ffor have an equilibrium effect of inducing greater
resources devoted to innovation that reinforce the direct effect.
In addition, increases in the high-skilled population, either µnatφ or µfor, increase routine-
biased technical change. That is, our model displays a version of the “scale effect” on growth
shared by Romer (1990)-style models; here, the scale effect is in terms of the measure of high-
skilled workers (as opposed to total population per se).
Finally, note that changes in the composition of high-skilled workers affect gn when anat∗ 6=afor∗. From equations (14) and (15), it is easy to see that:
anat∗t
afor∗t
=ffor
fnat. (29)
Suppose, for instance, that ffor > fnat so anat∗ > afor∗; given that the distribution, Γ, is
identical across nativity, this implies that sorting into the innovation occupation is greater
among the foreign-born. In this case, a compositional shift toward more foreign-born workers
13
that leaves the total measure of high-skilled workers unchanged has the effect of increasing the
growth rate of ideas.
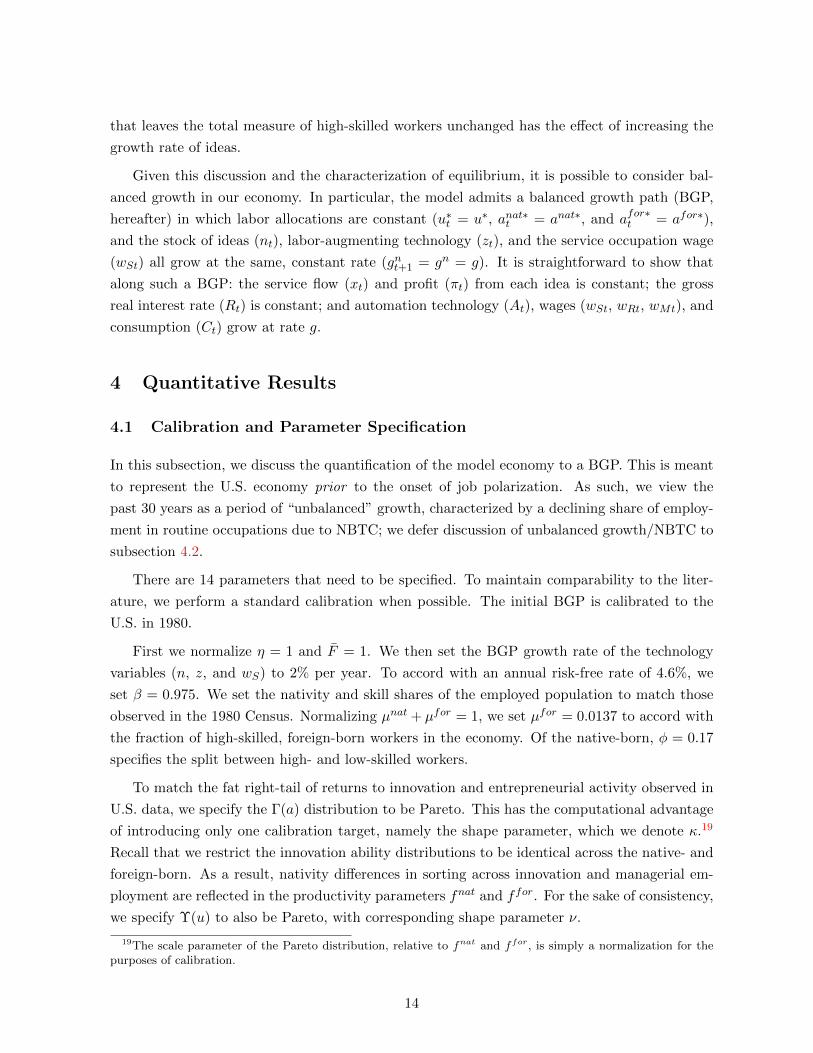
Given this discussion and the characterization of equilibrium, it is possible to consider bal-
anced growth in our economy. In particular, the model admits a balanced growth path (BGP,
hereafter) in which labor allocations are constant (u∗t = u∗, anat∗t = anat∗, and afor∗t = afor∗),
and the stock of ideas (nt), labor-augmenting technology (zt), and the service occupation wage
(wSt) all grow at the same, constant rate (gnt+1 = gn = g). It is straightforward to show that
along such a BGP: the service flow (xt) and profit (πt) from each idea is constant; the gross
real interest rate (Rt) is constant; and automation technology (At), wages (wSt, wRt, wMt), and
consumption (Ct) grow at rate g.
4 Quantitative Results
4.1 Calibration and Parameter Specification
In this subsection, we discuss the quantification of the model economy to a BGP. This is meant
to represent the U.S. economy prior to the onset of job polarization. As such, we view the
past 30 years as a period of “unbalanced” growth, characterized by a declining share of employ-
ment in routine occupations due to NBTC; we defer discussion of unbalanced growth/NBTC to
subsection 4.2.
There are 14 parameters that need to be specified. To maintain comparability to the liter-
ature, we perform a standard calibration when possible. The initial BGP is calibrated to the
U.S. in 1980.
First we normalize η = 1 and F = 1. We then set the BGP growth rate of the technology
variables (n, z, and wS) to 2% per year. To accord with an annual risk-free rate of 4.6%, we
set β = 0.975. We set the nativity and skill shares of the employed population to match those
observed in the 1980 Census. Normalizing µnat + µfor = 1, we set µfor = 0.0137 to accord with
the fraction of high-skilled, foreign-born workers in the economy. Of the native-born, φ = 0.17
specifies the split between high- and low-skilled workers.
To match the fat right-tail of returns to innovation and entrepreneurial activity observed in
U.S. data, we specify the Γ(a) distribution to be Pareto. This has the computational advantage
of introducing only one calibration target, namely the shape parameter, which we denote κ.19
Recall that we restrict the innovation ability distributions to be identical across the native- and
foreign-born. As a result, nativity differences in sorting across innovation and managerial em-
ployment are reflected in the productivity parameters fnat and ffor. For the sake of consistency,
we specify Υ(u) to also be Pareto, with corresponding shape parameter ν.
19The scale parameter of the Pareto distribution, relative to fnat and ffor, is simply a normalization for thepurposes of calibration.
14
Given this, we jointly calibrate following six parameters: the production share parameters
α and λ, the shape parameters ν and κ, and the innovation productivity parameters fnat and
ffor as follows. In order to identify these we specify that along the BGP, the model matches the
following six moments from the 1980 census data. First, we match three “quantity moments.”
Given the results of Section 2, we calibrate the BGP values shi = 0.896 and sfor = 0.819 to
match the fraction of non-routine cognitive workers in managerial (i.e. non-STEM) occupations,
for the native- and foreign-born, respectively. We set slo = 0.2 to match the fraction of low-
skilled workers that work in service (i.e. non-routine manual) occupations. The remaining three
moments relate to prices: (i) a share of total labor income paid to low-skilled (routine and
service) labor of 47%, (ii) a median routine-to-service occupation wage ratio of 1.75, and (iii) a
median managerial-to-routine occupation wage ratio of 1.6.
This leaves the two elasticity parameters in production to be specified. Given the nature of
our results, we set ρ = 0.995. That is, we set the elasticity of substitution between automation
technology and routine labor as close to infinite as (computationally) possible; this allows the
model to maximize the effect of increased innovation and NBTC on the demand for routine
labor. Finally, we set σ = 0.5. In numerical experiments, we find that our results are extremely
robust to the choice of this parameter.
4.2 Nature of the Experiments
As discussed above, the period since 1980 is not well characterized as displaying balanced growth.
The phenomenon of job polarization has meant that employment allocations have not been
constant: the share of employment in routine occupations has been falling, while the shares in
non-routine cognitive and service occupations has been rising. Moreover, inequality between
high- and low-skill wages has increased; more recently, routine and service occupation wages
have converged (see Acemoglu and Autor (2011).)
From the perspective of the model, the past 30 to 40 years has been a period of unbalanced
growth. In particular, NBTC and the accumulation of automation technology has led to a
downward shift in the demand for routine labor, and an outward shift in the demand for high-
skill labor, all else equal. Moreover, rising educational attainment has meant a shift in the
composition of labor supply toward high-skilled workers, and immigration policy has led to a
rise in the foreign-born share of the high-skilled population.
As such, we conduct a series of quantitative experiments in the model to isolate the role
of immigration for the evolution of the economy during this unbalanced growth period. In our
experiments we assume the economy was on a BGP in 1980 and then hit by a number of shocks
that we specify below. After the arrival of the shocks, we track the perfect foresight transition
path of the economy to a new BGP. We specify that the economy arrives at the new BGP in
15
the year 2070, 90 years after the arrival period of the shock.20
Specifically, we assume that in 1980 the economy is hit with two shocks. First, we allow
the fraction µfor to increase at a constant rate; this growth is specified so that after 30 years
of growth, the fraction of high-skilled, foreign-born workers matches that observed in 2010 in
the U.S. data. Second, we allow for a one-time increase in the innovation productivity, ffor,
upon impact of the shock. This causes foreign-born workers to sort more heavily into innovation
as opposed to managerial labor. We do this in a manner that replicates the increase in the
tendency of high-skilled, non-routine cognitive workers to work in STEM occupations observed
among the foreign-born between 1980 and 2010, as reported in the bottom panel of Table 2.
As discussed in subsection 3.3, both of these changes (increasing µfor and ffor) increase
the number of innovators in the economy, and results in an endogenous rise in the growth rate
of ideas. Our experiment causes gn to rise while leaving the growth rates of labor-augmenting
productivity (z) and the service occupation productivity (wS) unchanged at their previous BGP
value. The new BGP is attained in 2070 when the growth rates of z and wS make a one-time
increase from g to the endogenously determined value of gn in that period. From 2070 onward,
µfor becomes constant.
4.3 Results
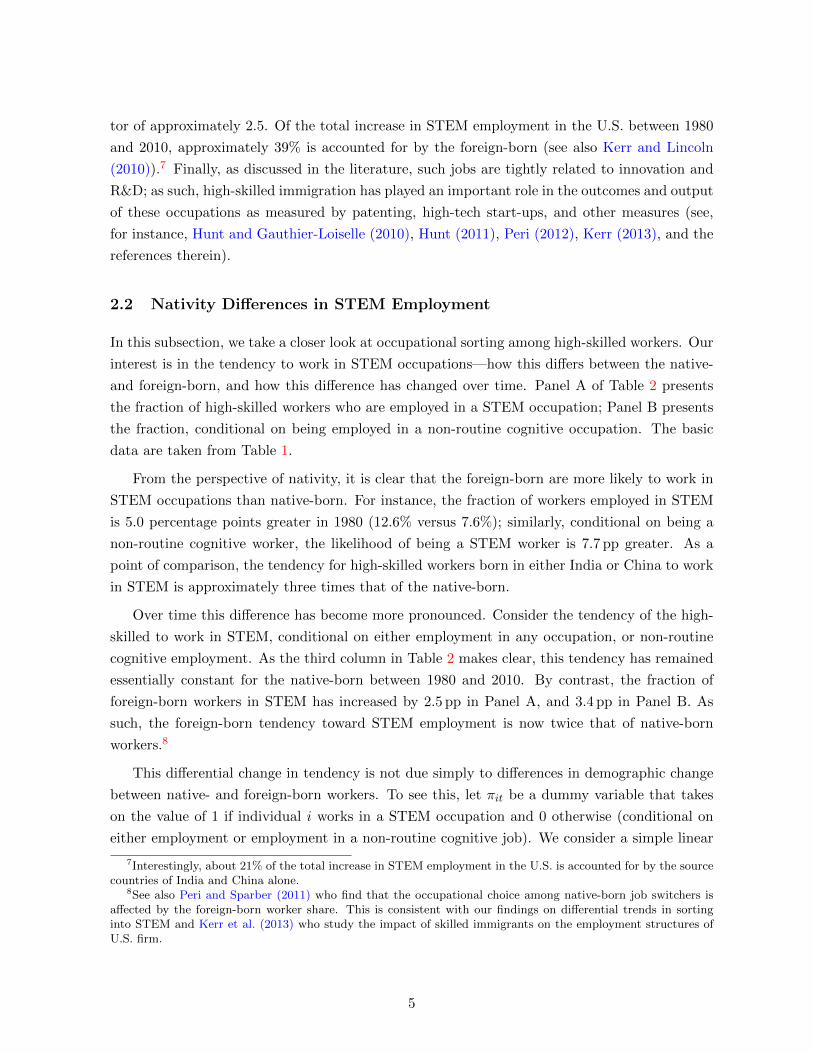
Figure 2 presents the foreign-born population share for the period 1980 to 2010. In all figures, the
red dashed line indicates the time series under the original BGP, while the blue line represents
the immigration experiment detailed in the previous subsection. By construction, the values for
1980 and 2010 along the experiment’s transition path correspond with the values observed in the
1980 Census and 2010 ACS data, representing a four-fold increase. Recall that the foreign-born
population in the model represents only foreign-born, high-skilled employment.
In the upper-left panel of Figure 3, we present the fraction of high-skilled workers who sort
into innovation (1 − sfor) among the foreign-born. By construction, this increases as observed
in the U.S. data, due to the increase in foreign-born innovation productivity. The upper-right
panel presents the same variable for the native-born. In response to the increase in the number
of foreign-born innovators, the fraction of native-born who sort into innovation falls.
Though this effect on native-born innovation is quantitatively small, it is instructive to
understand the force generating it. Native sorting into innovation falls, despite production of
new ideas being linear in the number of innovators; that is, the fall occurs despite innovation
productivity of the native-born, fnat, remaining unchanged in the experiment. Instead, the fall
20In principle, the results of the experiment depend on the date at which the new BGP is attained, becauseagents in the model operate with perfect foresight. However, in experiments not reported here, we find that theresults for the transition path are incredibly insensitive to the choice of this date. For instance, when we set thedate to 2010, the results for the period between 1980 and 2010 are surprisingly similar to the case reported here,with the terminal date set to 2070.
16
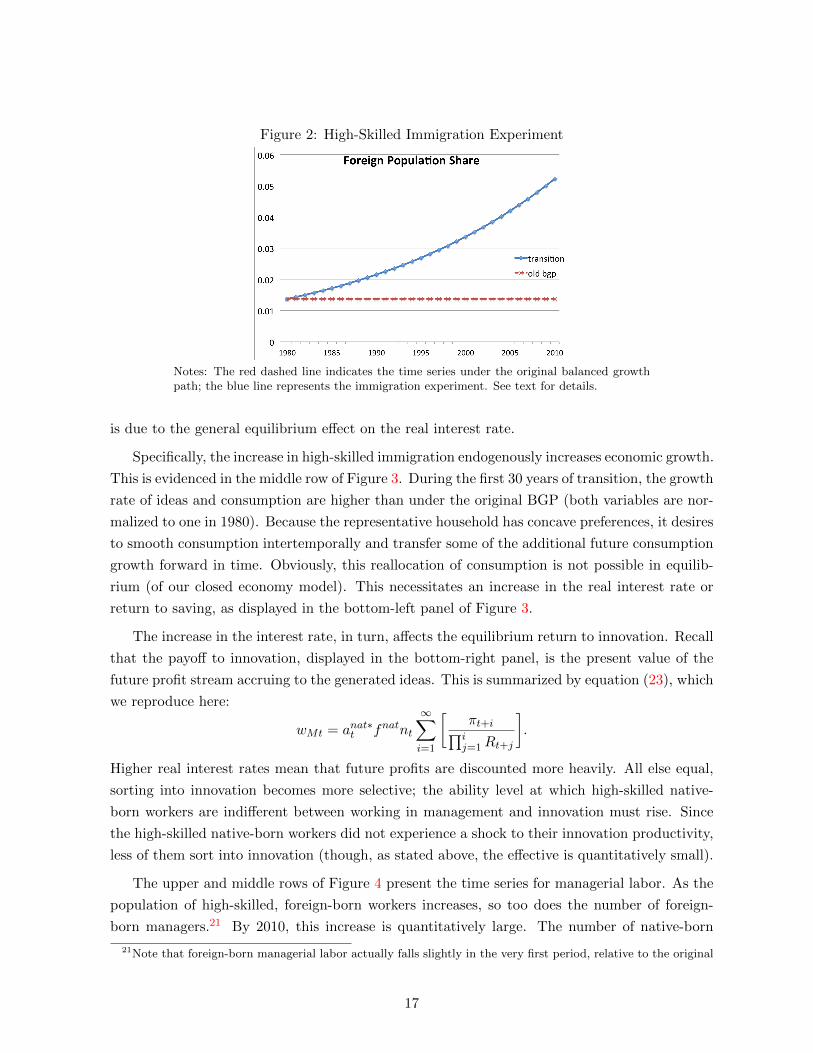
Figure 2: High-Skilled Immigration Experiment
Notes: The red dashed line indicates the time series under the original balanced growthpath; the blue line represents the immigration experiment. See text for details.
is due to the general equilibrium effect on the real interest rate.
Specifically, the increase in high-skilled immigration endogenously increases economic growth.
This is evidenced in the middle row of Figure 3. During the first 30 years of transition, the growth
rate of ideas and consumption are higher than under the original BGP (both variables are nor-
malized to one in 1980). Because the representative household has concave preferences, it desires
to smooth consumption intertemporally and transfer some of the additional future consumption
growth forward in time. Obviously, this reallocation of consumption is not possible in equilib-
rium (of our closed economy model). This necessitates an increase in the real interest rate or
return to saving, as displayed in the bottom-left panel of Figure 3.
The increase in the interest rate, in turn, affects the equilibrium return to innovation. Recall
that the payoff to innovation, displayed in the bottom-right panel, is the present value of the
future profit stream accruing to the generated ideas. This is summarized by equation (23), which
we reproduce here:
wMt = anat∗t fnatnt
∞∑i=1
[πt+i∏ij=1Rt+j
].
Higher real interest rates mean that future profits are discounted more heavily. All else equal,
sorting into innovation becomes more selective; the ability level at which high-skilled native-
born workers are indifferent between working in management and innovation must rise. Since
the high-skilled native-born workers did not experience a shock to their innovation productivity,
less of them sort into innovation (though, as stated above, the effective is quantitatively small).
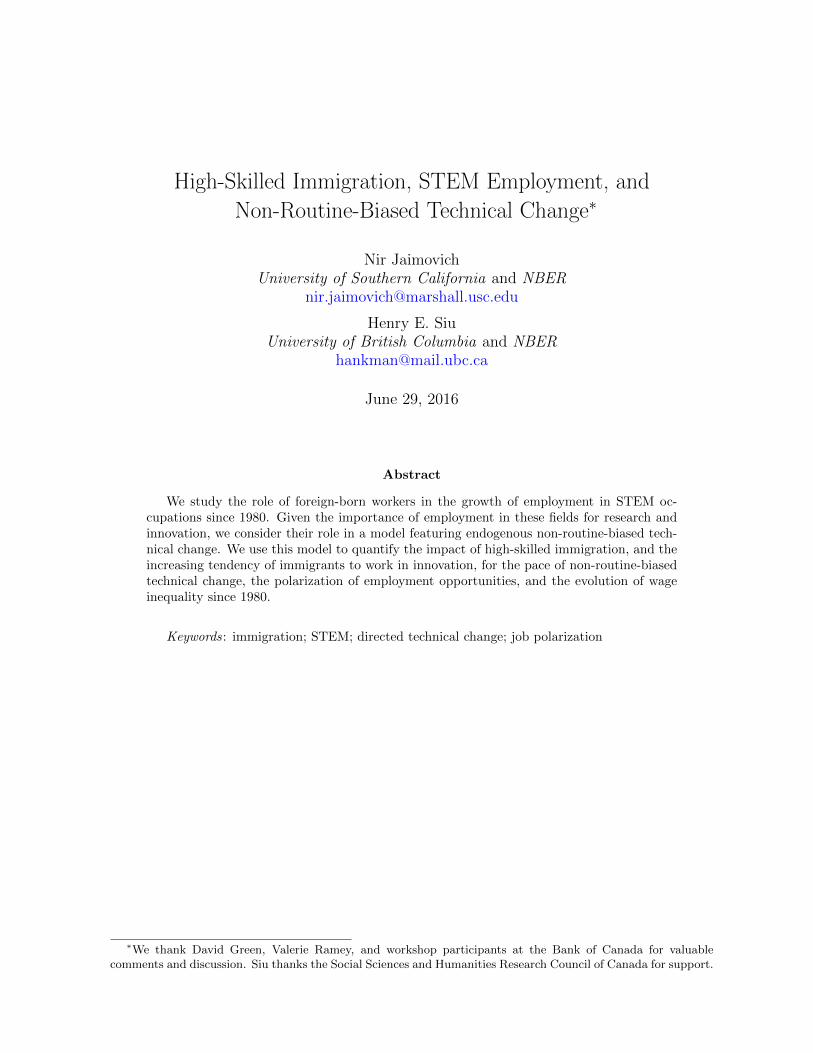
The upper and middle rows of Figure 4 present the time series for managerial labor. As the
population of high-skilled, foreign-born workers increases, so too does the number of foreign-
born managers.21 By 2010, this increase is quantitatively large. The number of native-born
21Note that foreign-born managerial labor actually falls slightly in the very first period, relative to the original
17
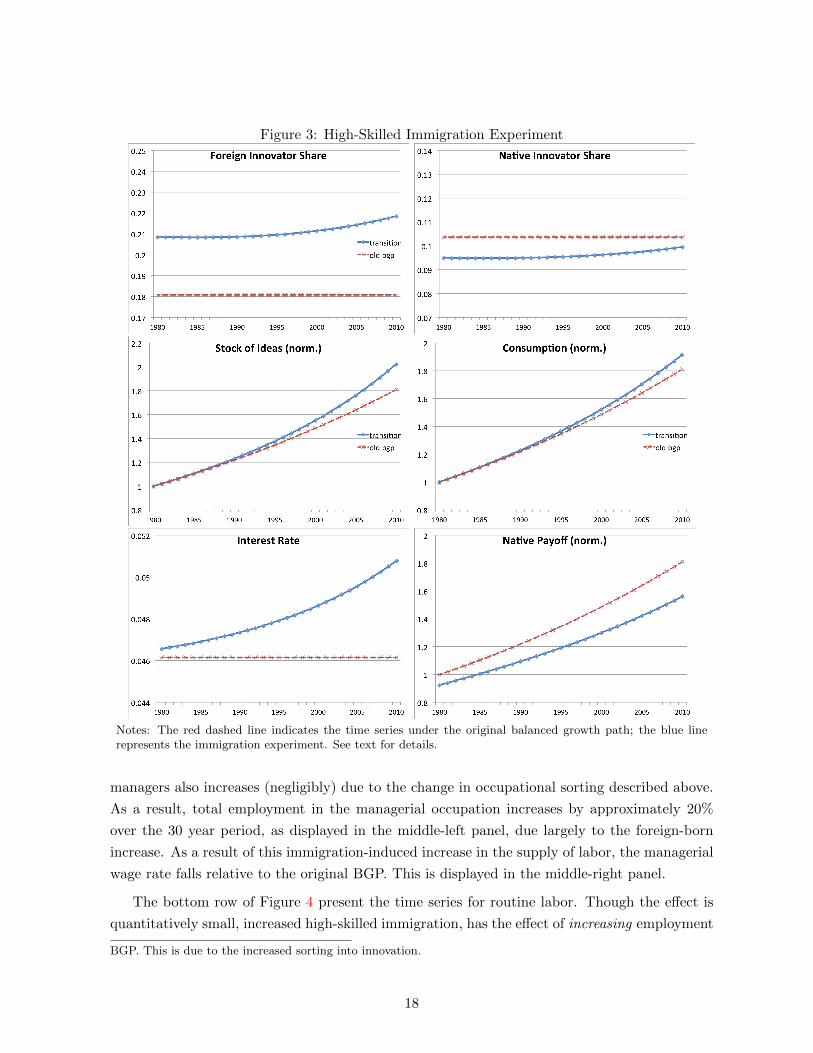
Figure 3: High-Skilled Immigration Experiment
Notes: The red dashed line indicates the time series under the original balanced growth path; the blue linerepresents the immigration experiment. See text for details.
managers also increases (negligibly) due to the change in occupational sorting described above.
As a result, total employment in the managerial occupation increases by approximately 20%
over the 30 year period, as displayed in the middle-left panel, due largely to the foreign-born
increase. As a result of this immigration-induced increase in the supply of labor, the managerial
wage rate falls relative to the original BGP. This is displayed in the middle-right panel.
The bottom row of Figure 4 present the time series for routine labor. Though the effect is
quantitatively small, increased high-skilled immigration, has the effect of increasing employment
BGP. This is due to the increased sorting into innovation.
18
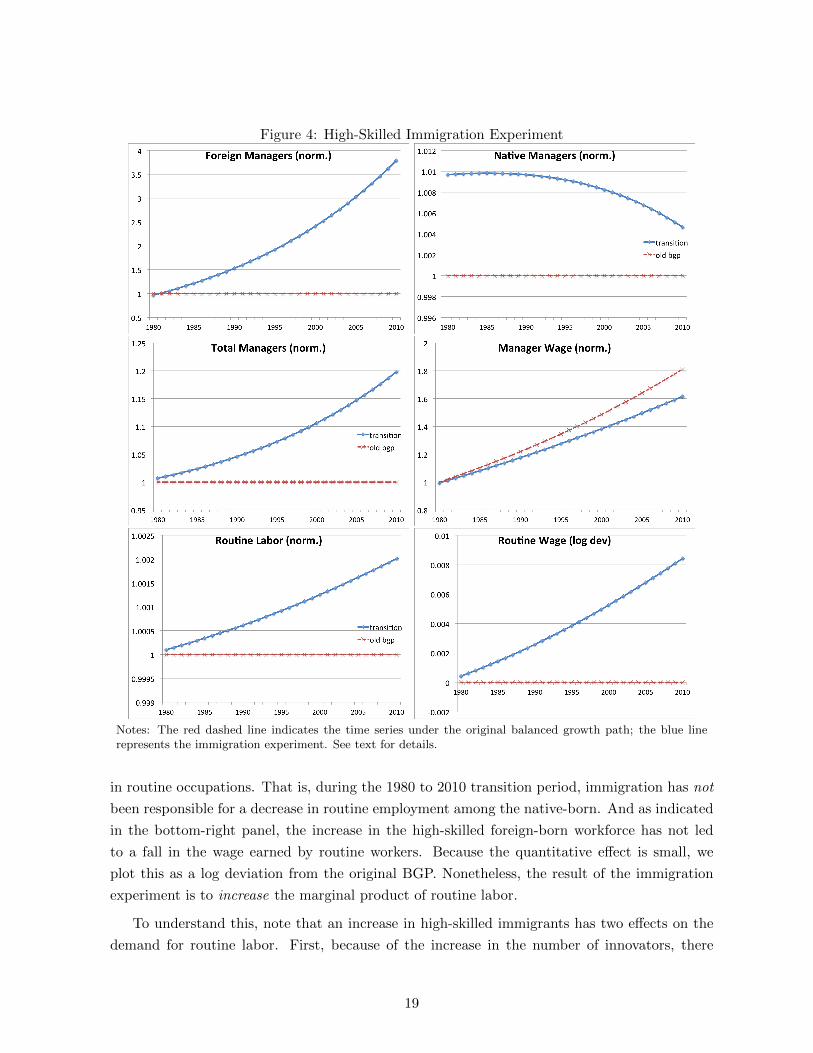
Figure 4: High-Skilled Immigration Experiment
Notes: The red dashed line indicates the time series under the original balanced growth path; the blue linerepresents the immigration experiment. See text for details.
in routine occupations. That is, during the 1980 to 2010 transition period, immigration has not
been responsible for a decrease in routine employment among the native-born. And as indicated
in the bottom-right panel, the increase in the high-skilled foreign-born workforce has not led
to a fall in the wage earned by routine workers. Because the quantitative effect is small, we
plot this as a log deviation from the original BGP. Nonetheless, the result of the immigration
experiment is to increase the marginal product of routine labor.
To understand this, note that an increase in high-skilled immigrants has two effects on the
demand for routine labor. First, because of the increase in the number of innovators, there
19
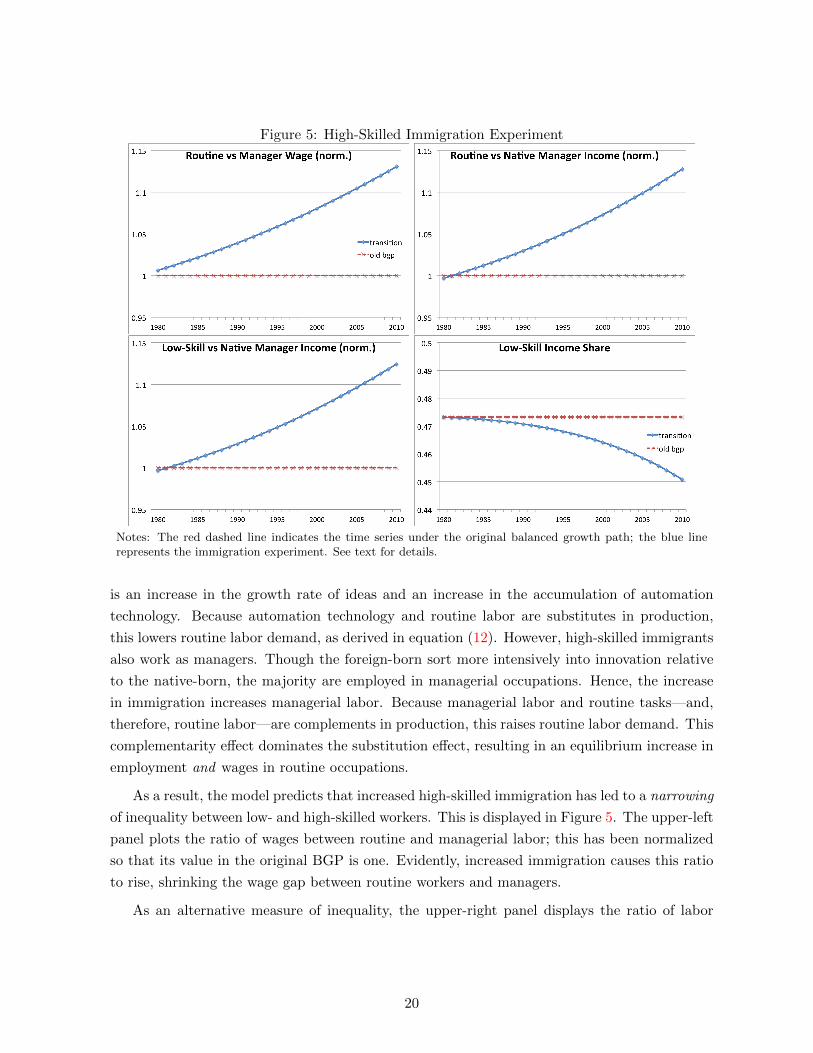
Figure 5: High-Skilled Immigration Experiment
Notes: The red dashed line indicates the time series under the original balanced growth path; the blue linerepresents the immigration experiment. See text for details.
is an increase in the growth rate of ideas and an increase in the accumulation of automation
technology. Because automation technology and routine labor are substitutes in production,
this lowers routine labor demand, as derived in equation (12). However, high-skilled immigrants
also work as managers. Though the foreign-born sort more intensively into innovation relative
to the native-born, the majority are employed in managerial occupations. Hence, the increase
in immigration increases managerial labor. Because managerial labor and routine tasks—and,
therefore, routine labor—are complements in production, this raises routine labor demand. This
complementarity effect dominates the substitution effect, resulting in an equilibrium increase in
employment and wages in routine occupations.
As a result, the model predicts that increased high-skilled immigration has led to a narrowing
of inequality between low- and high-skilled workers. This is displayed in Figure 5. The upper-left
panel plots the ratio of wages between routine and managerial labor; this has been normalized
so that its value in the original BGP is one. Evidently, increased immigration causes this ratio
to rise, shrinking the wage gap between routine workers and managers.
As an alternative measure of inequality, the upper-right panel displays the ratio of labor
20
income earned by native-born routine workers to managers, specifically:
wRt∫∞u∗tu dΥ(u)(1− φ)
wMtφshit. (30)
This differs from the ratio of wages, wRt/wMt, in that it accounts for changes in routine and
managerial employment among the native-born, via changes in occupational sorting.22 While
this statistic is conceptually different, it generates decreasing inequality that is quantitatively
very similar to that observed in the wage gap.23
The lower-left panel displays the ratio of labor income earned by all low-skilled workers
to native-born managers. That is, it adds the income earned by service occupation workers
to the numerator of equation (30). Relative to (30), this provides greater scope for worsened
relative outcomes for the low-skilled, as employment gains in routine occupations come out of
employment in the service occupation. Nonetheless, the change in this statistic is quantitatively
very similar to those discussed above. Finally, the bottom-right panel displays the share of
total income accruing to low-skilled (native-born) labor. Between 1980 and 2010, this falls only
modestly by about 2 pp; this is primarily a mechanical result of the fact that total low-skilled
employment is constant while the experiment adds only high-skilled foreign-born workers over
time.
4.4 Further Analysis
In this section, we provide analytical results to illustrate that relative to the 1980 BGP, the
increase in high-skilled immigration has a quantitatively small effect on non-routine-biased tech-
nical change. As a result, early in the transition path to a new BGP, the substitution effect of
increased automation technology on the demand for routine labor is small.
To see this, consider equation (27) describing the equilibrium growth rate of ideas, where we
have used the fact that Γ(a) is a Pareto distribution with shape parameter κ:
gnt+1 = µnatφfnatκ(anat∗t )1−κ + µforfforκ(afor∗t )1−κ,
where κ ≡ κκ−1 . Log-linearizing this equation obtains:
gn =µnatφfnatκ(anat∗)1−κ
µnatφfnatκ(anat∗)1−κ + µforfforκ(afor∗)1−κ
[µnat + φ+ fnat + (1− κ)anat∗
]+
µforfforκ(afor∗)1−κ
µnatφfnatκ(anat∗)1−κ + µforfforκ(afor∗)1−κ
[µfor + ffor + (1− κ)afor∗
]. (31)
22In addition, increases in routine employment are drawn from the lower end of the skill distribution, Υ(u),from workers who previously sorted into the service occupation.
23In the first two periods of the experiment, the income ratio falls relative to the original BGP; this is dueprimarily to the larger increase manager employment relative to routine employment among the native-born.However, as the transition progresses, this quickly reverses.
21
In our immigration experiment, we leave the measure of high-skilled native-born workers and
native productivity unchanged (µnat = φ = fnat = 0). Moreover, as displayed in Figure 3,
occupational choice among the native-born hardly changes; this implies that the native cutoff
ability hardly changes (anat∗ ≈ 0).
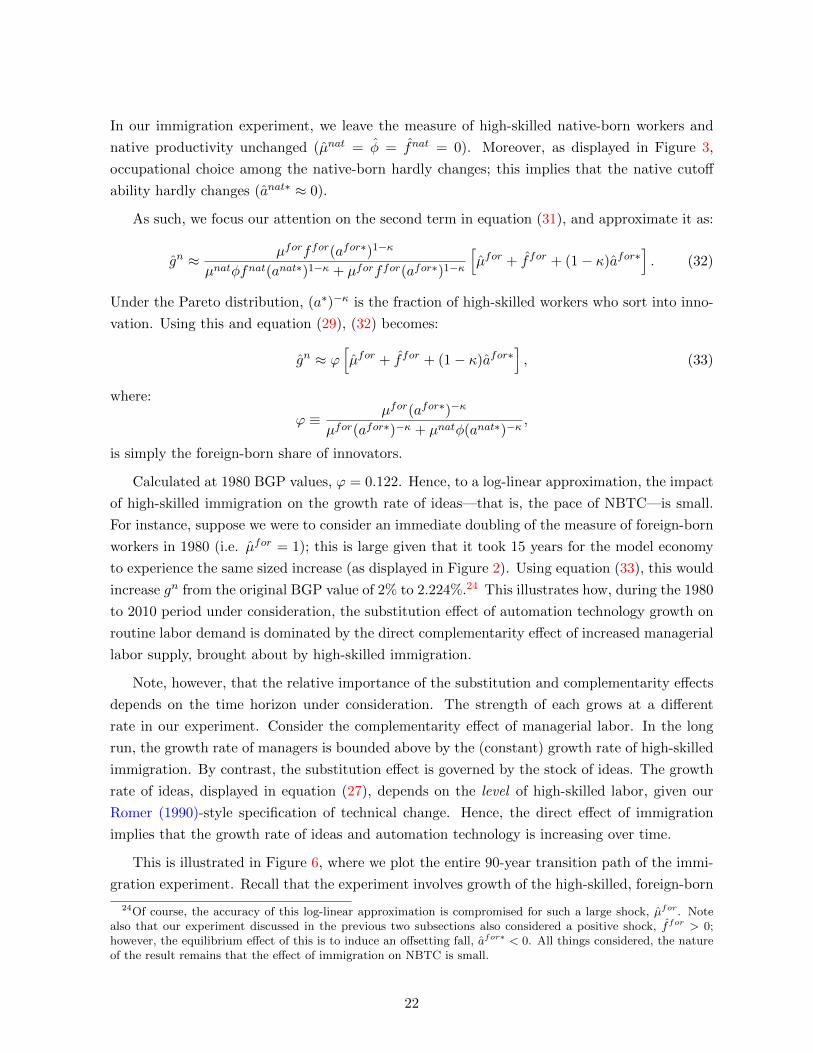
As such, we focus our attention on the second term in equation (31), and approximate it as:
gn ≈ µforffor(afor∗)1−κ
µnatφfnat(anat∗)1−κ + µforffor(afor∗)1−κ
[µfor + ffor + (1− κ)afor∗
]. (32)
Under the Pareto distribution, (a∗)−κ is the fraction of high-skilled workers who sort into inno-
vation. Using this and equation (29), (32) becomes:
gn ≈ ϕ[µfor + ffor + (1− κ)afor∗
], (33)
where:
ϕ ≡ µfor(afor∗)−κ
µfor(afor∗)−κ + µnatφ(anat∗)−κ,
is simply the foreign-born share of innovators.
Calculated at 1980 BGP values, ϕ = 0.122. Hence, to a log-linear approximation, the impact
of high-skilled immigration on the growth rate of ideas—that is, the pace of NBTC—is small.
For instance, suppose we were to consider an immediate doubling of the measure of foreign-born
workers in 1980 (i.e. µfor = 1); this is large given that it took 15 years for the model economy
to experience the same sized increase (as displayed in Figure 2). Using equation (33), this would
increase gn from the original BGP value of 2% to 2.224%.24 This illustrates how, during the 1980
to 2010 period under consideration, the substitution effect of automation technology growth on
routine labor demand is dominated by the direct complementarity effect of increased managerial
labor supply, brought about by high-skilled immigration.
Note, however, that the relative importance of the substitution and complementarity effects
depends on the time horizon under consideration. The strength of each grows at a different
rate in our experiment. Consider the complementarity effect of managerial labor. In the long
run, the growth rate of managers is bounded above by the (constant) growth rate of high-skilled
immigration. By contrast, the substitution effect is governed by the stock of ideas. The growth
rate of ideas, displayed in equation (27), depends on the level of high-skilled labor, given our
Romer (1990)-style specification of technical change. Hence, the direct effect of immigration
implies that the growth rate of ideas and automation technology is increasing over time.
This is illustrated in Figure 6, where we plot the entire 90-year transition path of the immi-
gration experiment. Recall that the experiment involves growth of the high-skilled, foreign-born
24Of course, the accuracy of this log-linear approximation is compromised for such a large shock, µfor. Notealso that our experiment discussed in the previous two subsections also considered a positive shock, ffor > 0;however, the equilibrium effect of this is to induce an offsetting fall, afor∗ < 0. All things considered, the natureof the result remains that the effect of immigration on NBTC is small.
22
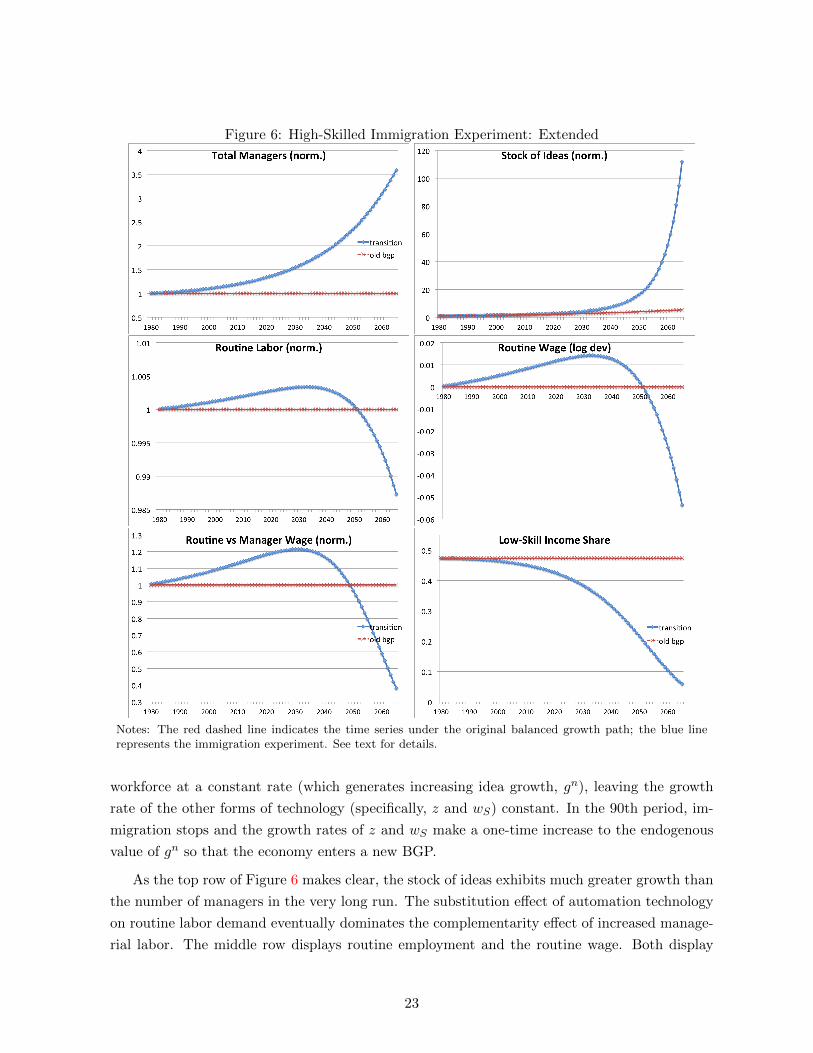
Figure 6: High-Skilled Immigration Experiment: Extended
Notes: The red dashed line indicates the time series under the original balanced growth path; the blue linerepresents the immigration experiment. See text for details.
workforce at a constant rate (which generates increasing idea growth, gn), leaving the growth
rate of the other forms of technology (specifically, z and wS) constant. In the 90th period, im-
migration stops and the growth rates of z and wS make a one-time increase to the endogenous
value of gn so that the economy enters a new BGP.
As the top row of Figure 6 makes clear, the stock of ideas exhibits much greater growth than
the number of managers in the very long run. The substitution effect of automation technology
on routine labor demand eventually dominates the complementarity effect of increased manage-
rial labor. The middle row displays routine employment and the routine wage. Both display
23
about 55 periods of growth during the experiment. However, they begin to decline in about
2035, cross below the values implied by the original BGP in about 2050, and fall precipitously
thereafter. The bottom row displays two measures of inequality between low- and high-skilled
workers. Consider, for instance, the routine-to-manager wage ratio. If high-skilled immigration
growth and NBTC were to continue as predicted by the model until 2070, this wage ratio would
be approximately one-third of its value in the 1980 BGP.
Hence, the impact of high-skilled immigration on polarization and wage inequality are evident
only in the very long run. However, there are many good reasons to question the predictions
from this experiment for outcomes 50 to 60 years hence. This is because of the stark assumptions
made in the model. For instance, the experiment assumes constant growth of the high-skilled
foreign-born population over 90 years, at the substantial growth rates observed between 1980
and 2010. Future immigration policy is obviously uncertain. In addition, it assumes that the
direction of technical change via innovation remains non-routine-biased over the 90 year period.
That is, innovative activity augments automation technology leaving, for instance, the path of
labor-augmenting technology unchanged. While this may be a good representation of the past
30 years, it may not remain the case for the next 60. Finally, on a technical point, the model
assumes Romer (1990)-style scale effects on the growth of non-routine-biased ideas. Augmenting
the model to diminish or eliminate these scale effects would weaken the long-run substitution of
automation technology for routine labor.
As such, we view the predictions of Figure 6 as uncertain and representing an upper bound
of the effects of high-skilled immigration on increasing inequality. In terms of the 1980-2010
experience, the model indicates that immigration has, in fact, reduced inequality.
5 Conclusion
In the last 30 to 40 years, immigration has constituted an important source of growth in high-
skilled employment, innovation, and productivity in the U.S. At the same time, the U.S. has
also experienced technical change that is routine-biased, allowing technology to substitute for
labor in performing routine tasks, leading to job polarization in the labor market and widening
inequality.
In this paper, we study the role of high-skilled immigration in accounting for these changes
in the occupational-skill distribution and wage inequality. Specifically, we consider their role
in a general equilibrium model featuring endogenous non-routine-biased technical change. We
use this model to quantify the impact of high-skilled immigration, and the increasing tendency
of the foreign-born to work in innovation, on the pace of technical change, the polarization
of employment opportunities, and the evolution of wage inequality since 1980. We find that
high-skilled immigration has led to a narrowing of inequality.
24
References
Acemoglu, D. and D. Autor (2011). Skills, tasks and technologies: Implications for employ-
ment and earnings. In O. Ashenfelter and D. Card (Eds.), Handbook of Labor Economics,
Volume 4B, Chapter 12, pp. 1043–1171. Elsevier.
Acemoglu, D. and P. Restrepo (2015). The race between man and machine: Implications of
technology for growth, factor shares and employment. Working paper, MIT.
Autor, D. H., D. Dorn, and G. H. Hanson (2015). Untangling trade and technology: Evidence
from local labour markets. Economic Journal 125, 621–646.
Autor, D. H., F. Levy, and R. J. Murnane (2003). The skill content of recent technological
change: An empirical exploration. Quarterly Journal of Economics 118 (4), 1279–1333.
Blinder, A. (1973). Wage discrimination: Reduced form and structural estimates. Journal of
Human Resources 8, 436–455.
Caselli, F. (2015). Experience-biased technical change. CEPR Discussion Paper 10752.
Chiswick, B. and S. Taengnoi (2007). Occupational choice of high skilled immigrants in the
United States. International Migration 45 (5), 3–34.
Cortes, G. M., N. Jaimovich, C. J. Nekarda, and H. E. Siu (2015). The micro and macro of
disappearing routine jobs: a flows approach.
Firpo, S., N. M. Fortin, and T. Lemieux (2011, February). Occupational tasks and changes in
the wage structure. University of British Columbia.
Goos, M. and A. Manning (2007). Lousy and lovely jobs: The rising polarization of work in
britain. Review of Economics and Statistics 89 (1), 118–133.
Goos, M., A. Manning, and A. Salomons (2014). Explaining job polarization: Routine-biased
technological change and offshoring. American Economic Review 104 (8), 2509–26.
Grieco, E. M., E. Trevelyan, L. Larsen, Y. D. Acosta, C. Gambino, P. de la Cruz, T. Gryn, and
N. Walters (2012). The size, place of birth, and geographic distribution of the foreign-born
population in the United States: 1960 to 2010. Population Division Working Paper 96, U.S.
Census Bureau.
Hanson, G. H. and M. J. Slaughter (2015). High-skilled immigration and the rise of STEM
occupations in US employment. UCSD working paper, September.
Hunt, J. (2011). Which immigrants are most innovative and entrepreneurial? distinctions by
entry visa. Journal of Labor Economics 29 (3), 417–457.
25
Hunt, J. and M. Gauthier-Loiselle (2010). How much does immigration boost innovation? Amer-
ican Economic Journal: Macroeconomics 2 (2), 31–56.
Jaimovich, N. and H. E. Siu (2012). Job polarization and jobless recoveries. NBER Working
Paper 18334.
Jaimovich, N. and H. E. Siu (2015). Jobless recoveries. Third Way NEXT .
Jung, J. and J. Mercenier (2014). Routinization-biased technical change and globalization:
Understanding labor market polarization. Economic Inquiry 52 (4), 1446–1465.
Kerr, S. P., W. R. Kerr, and W. F. Lincoln (2013). Skilled immigration and the employment
structures of U.S. firms. NBER Working Paper 19658.
Kerr, W. (2013). U.S. high-skilled immigration, innovation, and entrepreneurship: Empirical
approaches and evidence. NBER Working Paper 19377.
Kerr, W. and W. Lincoln (2010). The supply side of innovation: H-1B visa reforms and U.S.
ethnic invention. Journal of Labor Economics 38 (3), 473–508.
Levy, F. and R. J. Murnane (2014). Dancing with robots: Human skills for computerized work.
Third Way NEXT .
Oaxaca, R. (1973). Male-female wage differentials in urban labor markets. International Eco-
nomic Review 14, 693–709.
Peri, G. (2012). The effect of immigration on productivity: Evidence from U.S. states. Review
of Economics and Statistics 94 (1), 348–358.
Peri, G., K. Shih, and C. Sparber (2015). Stem workers, h-1b visas, and productivity in us
cities. Journal of Labor Economics 33 (S1), S225–255.
Peri, G. and C. Sparber (2011). Highly educated immigrants and native occupational choice.
Industrial Relations 50 (3), 385–411.
Romer, P. M. (1990). Endogenous technological change. Journal of Political Economy 98 (5),
S71–102.
Ruggles, S., J. T. Alexander, K. Genadek, R. Goeken, M. B. Schroeder, and M. Sobek (2010).
Integrated Public Use Microdata Series: Version 5.0 [machine-readable database].
Violante, G. L. (2008). Skill-biased technical change. In S. N. Durlauf and L. E. Blume (Eds.),
The New Palgrave Dictionary of Economics (Second ed.). Palgrave Macmillan.
26