Embed Size (px)
Citation preview
IEEE Trans. Electr. Insul, Vol EI-12 No 6, December 1977
HIGH SPEED LASER SCHLIEREN STUDIES OF
ELECTRICAL BREAKDOWN IN LIQUID HYDROCARBONS
E. 0. Forster and P. Wong
Corporate Research LaboratoriesExxon Research and Engineering Company
P. 0. Box 45Linden, New Jersey 07036
ABSTRACT
The events occurring just prior, during, and after electrical break-down in liquid hydrocarbons have been photographed using 15 ns laserpulses produced with a ruby laser, to illuminate the space betweentwo parallel plate electrodes, and schlieren optics. In this mannerit was possible to obtain experimental evidence of the density gradientsproduced by the movement of charge carriers during prebreakdown and theenergy released during and after breakdown. Bysplitting the laser beamand delaying one half by 40 ns with respect to the other, the eventsoccurring in the electrode gap could be studied as a function of time.Attempts to use the light emitted prior to breakdown as trigger signalfor the laser were not successful. The initiation and propagation ofbreakdown are discussed in the light of the available photographicevidence.
INTRODUCTION
The phenomenon of electrical breakdown in dielectricliquids has been the subject of many studies over thelast three decades [1]. A review of both the experi-mental results and the many theoretical approaches pub-lished over the last thirty years, indicates that theredoes not exist one unified theory capable of explainingall experimental results [2]. Furthermore, such a re-view reveals clearly that experimental results influ-ence greatly the development of any theory. But, asGallagher [1] has pointed out, the experimental re-sults published in the literature depend extensively onsuch parameters as field configuration, area and separ-ation of electrodes, material and surface state ofelectrodes, purity of the liquids tested, duration andtype of applied voltage, as well as temperature andpressure.
Therefore, the theories based on experimental resultsperformed under certain specific conditions cannot beexpected to explain other results obtained under dif-ferent conditions. In particular, the effect ofelectrode geometry and hence of electric field cannotbe ignored. It would be unwise to expect a theorybased on uniform fields (parallel plate geometry) to beapplicable to a non-uniform field (plate-point, point-point, or sphere-sphere geometry). Similarly, dataobtained at large electrode separations (wide gap)might be expected to lead to a different model thanwould be derived from those collected with smallelectrode separations. A cursory look into the litera-ture will confirm these observations readily. Finally,all investigations recognize that the time scale forobserving the breakdown process is very short.
To gain a fundamental understanding of this breakdownprocess, a transient event lasting only a few nano-seconds, one needs some analytical means capable offollowing the ultrafast events occurring just prior to,during, and immediately after breakdown. Conventional
electronic measuring techniques are inherently limitedby their rather slow response and their inability tofollow changes of many orders of magnitude of suchparameters as current. Moreover, even by taking themost elaborate precautions such as using isolationtransformers and well-shielded cables, the electro-magnetic radiation associated with breakdown hasproved to disturb seriously the electronic measuringequipment. For these reasons, optical methods basedon pulsed illumination appear more suitable for thisstudy of these fast occurrences. Among the variousoptical methods, the schlieren technique appears mostattractive since it permits the visualization ofdensity gradients which can be produced by the motionof charge carriers or by heating within the liquid.Farazmund [3], Hakim et al [4] and Chaband et al [5]used this technique but their work was limited intemporal resolution by the use of conventional lightsources which required rather prolonged exposures.Also, the electrode geometries used by these investi-gators were of the point-point, point-plane and sphere-sphere type, thus rendering the electric field calcu-lations very complicated. Thomas [6] overcame thesedifficulties by taking advantage of the development ofhigh intensity laser sources. He used a very fastlaser pulse as light source for schlieren studies ofprebreakdown events under uniform field conditions.
In the present study 15 nanosecond pulses producedwith a ruby laser were used to illuminate the spacebetween two parallel plate electrodes. In this mannerit became possible to photograph density gradients pro-duced in liquid hydrocarbons by the charge carriersmoving under the influence of a rapidly applied electri-cal stress. This paper presents some of the experi-mental results obtained and discusses their signifi-cance.
435
IEEE Trans. Electr. Insul, Vol EI-12 No 6, December 1977
PHOTO CELL
PRECISION BEAMDELAY SPLITTER
GENERATOR y -
__ 30 NS PULSE B3. S.SWITCH RUBY LASER BEAM
M.,
M __-- - --- ------- -----
MI- LENSKNIFEEDGE
CAMERA
#1SHORT BEAM
Fig. 1: UZtra high speed eZectro-opticaZ system forstudy of electricaZ breakdown in Ziquid hydrocarbons.
EXPERIMENTAL TECHNIQUEThe experimental set up used in this investigation is
basically the same as that described by Wong and Forster[7]. A simplified diagram of it is shown in Figure 1.The Q-switched ruby laser was supplied by Holobeam Inc.Upon triggering of the Pockel cell of the Q-switch, a
laser pulse of up to 1.5 joules of energy and 15 nano-
second duration is generated. This pulse passes througha beam splitter. One beam is delayed with respect tothe other by traversing a longer distance. The delaytime can be adjusted by changing the optical path as
defined by the mirror arrangement. In the experimentsreported here this delay time was of the order of 40nanoseconds. When schlieren pictures were taken, thelaser firing time is referenced to the breakdown timeby means of a photocell which detects the weak reflec-tion of the pulse from the back of the beam splitter.The photocell output and the impulse wave form aredisplayed simultaneously on a Tektronix 556 dual-beamoscilloscope.
A five stage Ferranti impulse generator was used toproduce the impulse voltages ranging from a 50 to275 kV. For the purpose of this study a rise time ofabout 1.4 ps was selected for the impulse wave form andit decayed to 50% of its value in about 50 ps.
A parallel plane electrode system was used. Thecylindrical brass electrodes had a 2.54 cm diameter andwere spaced 6 mm apart. The edges of the electrodeswere rounded to avoid edge effects in conformity withVDI standards, and the surfaces were polished to a
mirror finish. Since parallelism is extremely impor-tant in this plane-plane configuration, careful align-ment is essential. In this setup, the upper electrodewas fixed and the bottom electrode could be adjustedby means of a universal motion drive. The images ofthe electrodes were optically magnified onto a screenwhich permits monitoring of their positions for fineadjustment.
The test liquids (toluene, benzene, n-hexane, iso-octane) were Phillips research grade (99.9 mol% purity)The liquids were first dried by contact with sodiumribbons for two days. Then they were subjected to re-peated cryogenic distillations. A typical processwould involve three such distillations. The liquid wasthen transferred to the test cell using pressurizednitrogen. Throughout the distillation and transferprocess, the liquid was only in contact either withvacuum or nitrogen. The probablility of having oxygenreadsorbed is estimated to be negligible.
In conjunction with the schlieren studies of break-down phenomena, a light detection system was added todetermine whether or not partial discharges wereoccurring which gave off weak light signals. A photo-multiplier tube (PMT) was mounted just outside one ofthe windows of the test cell. The window material waseither pyrex or sapphire. The latter permits the pas-sage of UV light of wavelengths down to 200 nm. Asphototube, either RCA 4832 or RCA 4837, was used. Thefirst one has broad band response characteristics whilethe latter is sensitive only to UV light. In the lightemission experiments, the laser is not activated andthe output of the PMT is displayed simultaneously with
M
MIRRORM
CAMERA #:40 NSDELAYED
TO OSCILLOSCOPE
436
-
'sW
Forster and Wong: Schlieren Studies in Liquid Hydrocarbons
the breakdown voltage waveform on the dual-beam scope.For very low light-emission levels, an amplifier with arisetime of about 1 nanosecond was used to avoid dis-tortion of the emitted light-pulse waveforms.
EXPERIMENTAL RESULTS
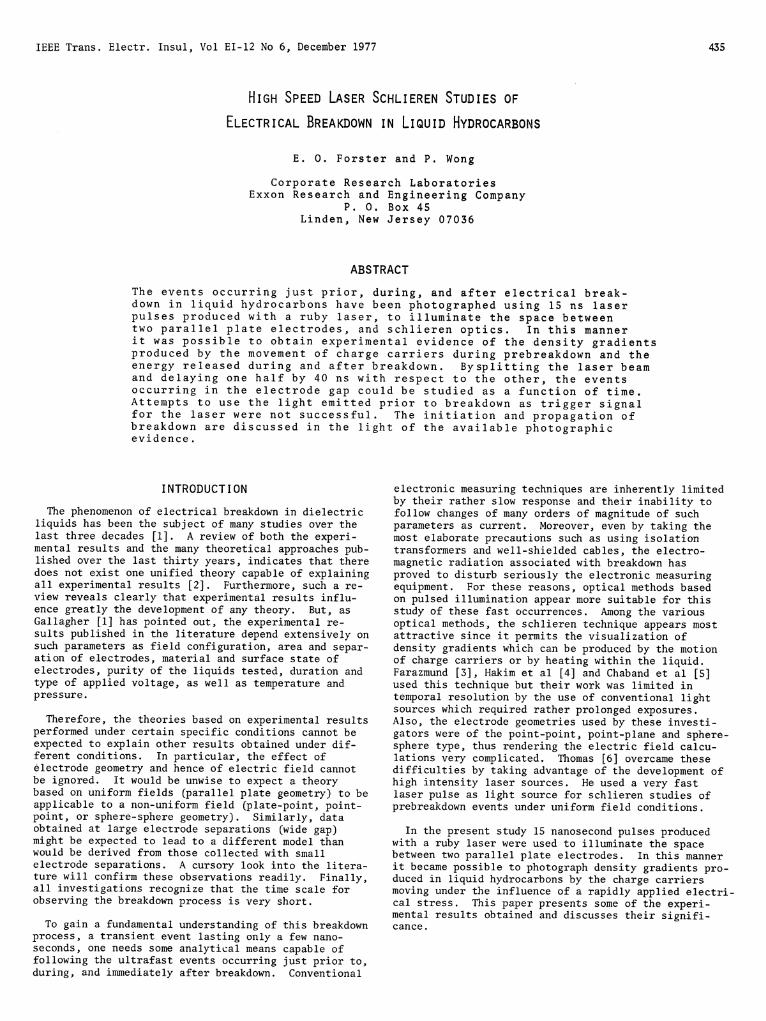
In the experiments reported here, breakdown occurredalways after the applied voltage reached its crestvalue. The time lag between the instant this crestvalue was reached and the occurrence of breakdown, i.e.when the applied voltage starts to collapse, is notreproducible in accordance with the well known statisti-cal nature of the breakdown mechanism. The time forthe complete collapse of the applied voltage was de-duced by Wong and Forster [7] to be of the order of0.5 ± 0.2 ps. The photographic study of the eventsleading to breakdown as well as those occurring duringand after breakdown is therefore a matter of chance.The triggering of the laser via the delay generatorshown in Figure 1, will not always produce a pulse atthe opportune instant. Many hundreds of pictures weretaken and only a few showed events of interest to thisstudy. It became of interest, therefore, to find anevent that could be used to "self-trigger" the lasersystem. Nelson [8] and Chin [9] as well as Smith et al[10] had reported observing light emission in puren-hexane prior to breakdown using needle electrodes.Hence an effort was made to evaluate this lightemission process under uniform field conditions.Earlier, Wong and Forster [7] had shown that the major-ity of the light emitted prior to breakdown occurredin the UV range independent of the nature of the liquid.Using a UV sensitive PMT, this process was recordedtogether with the voltage pulse responsible for thelight emission on a dual beam oscilloscope. The re-sults of this study are shown in Figure 2 for the four
1 2TOLUENE N-HEXANE
liquids tested. In each case the upper trace repre-sents the voltage while the lower one shows the PMToutput. At equal electrode separation (0.5 cm) andapproximately equal applied voltages, the light emissionpatterns are similar in their general shape differingonly in their fine details. In principle the averageamplitude of the emitted light shows a rapid increaseabout 0.5 us before collapse of the applied voltage.The rate of this increase is not identical for theliquids tested but there exists a similarity betweenn-hexane and iso-octane (2,3,3-trimethylpentane) andanother between benzene and toluene. The effect ofpreceding breakdowns on this situation is discussed insome detail in Reference 7. It should be pointed outhere that although the average amplitudes are similarin the early stages, the maximum amplitudes are muchlarger with the saturated hydrocarbons than with thearomatic ones. In either case the amplitude fluctua-tions are so large and of a random nature so that theycannot be used as a trigger signal for the laser. ,
aa. a.
b. b.
a. Voltage PuZse 75KV/cm a. Voltage Pulse 90KV/cmb. PMT Output 0.5V/cm b. PMT Output 0.5V/cm
Time ScaZe 2 ps/cm Time scaZe 5 ps/cm
3ISO-OCTANE
4BENZENE
a. a.
b. b.
a. VoZtage PuZse 80KV/cmb. Pulse Output 0.1V/cm
Time ScaZe 1 us/cm
a. VoZtage Pulse 80KV/cmb. PMT Output l.V/cm
Time ScaZe 1 ps/cm
Fig. 2: Influence of breakdown on light emissioncharacteristics.
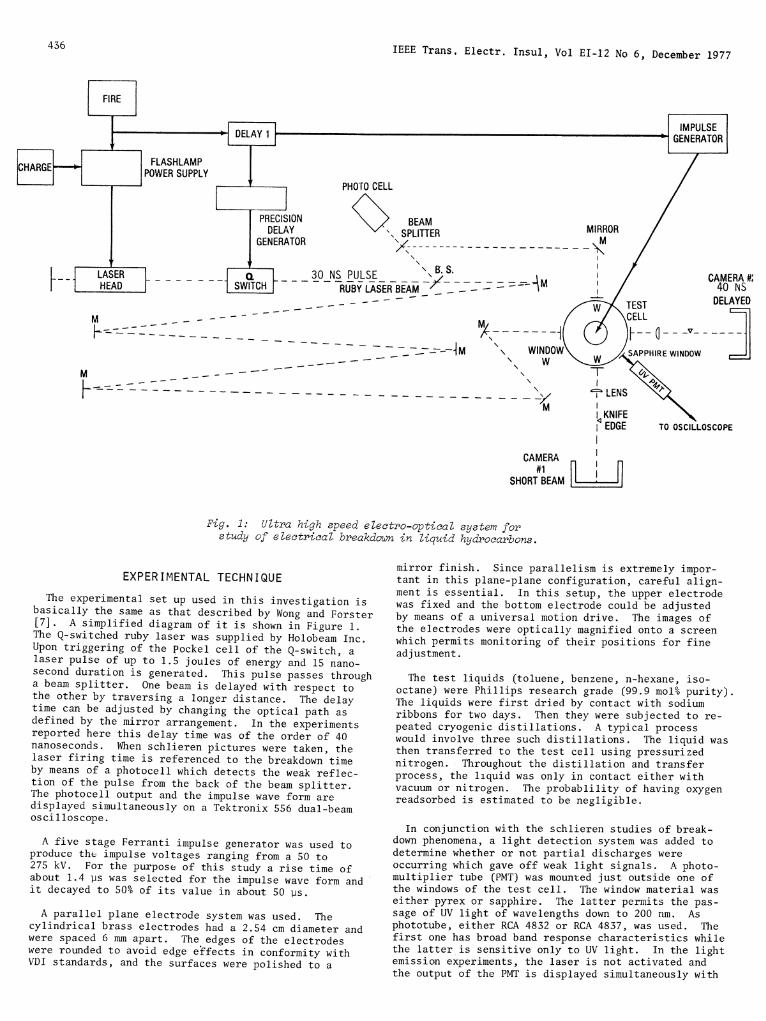
Fig. 3: Prebreakdown phenomena in n-hexane. Electrodeseparation 0.6 cm, anode at top, crest voltage 210 kV.(a) laser fired 23 ps after crest voltage wasreached; (b) same conditions - 40 nanoseconds Zater.
4 37
IEEE Trans. Electr. Insul, Vol EI-12 No 6, December 1977
In conformity with earlier findings [7,11,12],schlieren photographs showed that the electrical break-down process can be described in terms of three stages,namely prebreakdown, breakdown, and postbreakdown events.
Figures 3a and 3b represent a pair of photographs of theprebreakdown stage taken with the schlieren system inthe crossed beam configuration. Figure 3a shows two
important features. First, a tree-like structure can beseen emanating from the cathode surface and second,superimposed on this structure, one notices a trace ofwhite light emitted by the breakdown spark some 600nanoseconds later. This superposition or double ex-
posure is caused by the inability to operate opticalshutters accurately in these short time intervals. Itis necessary, therefore, to transform the laboratoryinto a darkroom and keep the camera shutters open duringthe test. Figure 3b, taken 40 nanoseconds later con-firms the conclusion that the "tree" was the precursorof the spark since it too shows the superposition of thetree and the white light. A case where the two events
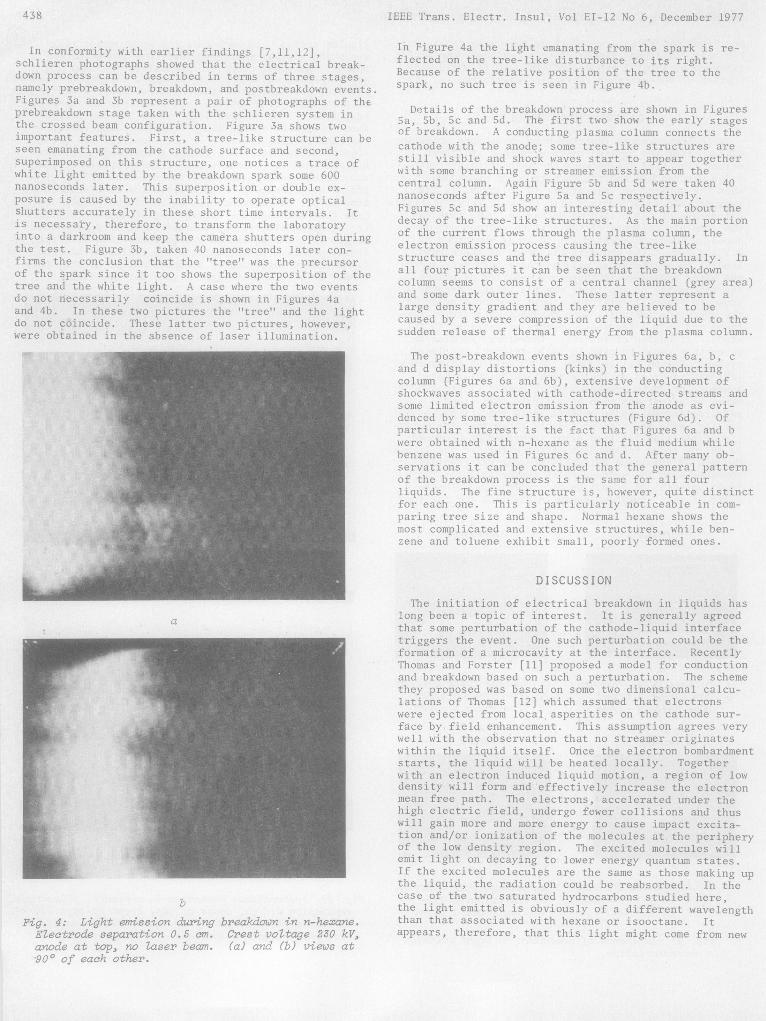
do not necessarily coincide is shown in Figures 4a
and 4b. In these two pictures the "tree" and the lightdo not coincide. These latter two pictures, however,were obtained in the absence of laser illumination.
a
b
Fig. 4: Light emission during breakdown in n-hexane.EZectrode separation 0.5 cm. Crest voltage 230 kV,anode at top, no Zaser beam. (a) and (b) views at900 of each other.
In Figure 4a the light emanating from the spark is re-flected on the tree-like disturbance to its right.Because of the relative position of the tree to thespark, no such tree is seen in Figure 4b.
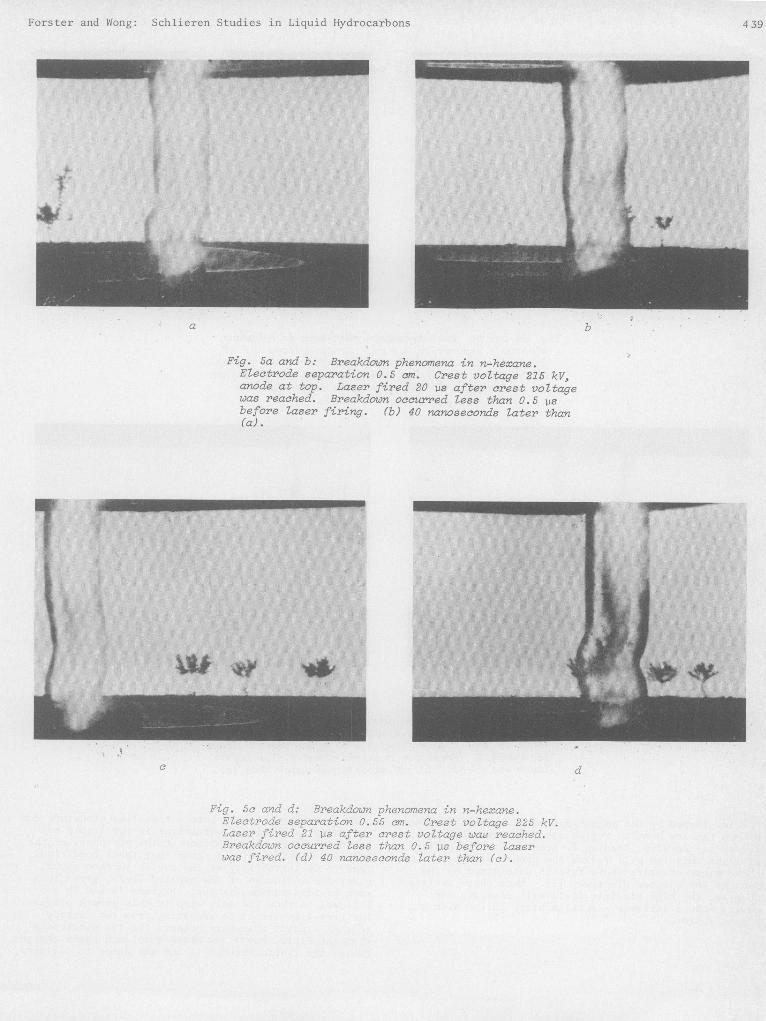
Details of the breakdown process are shown in FiguresSa, Sb, 5c and Sd. The first two show the early stagesof breakdown. A conducting plasma column connects thecathode with the anode; some tree-like structures arestill visible and shock waves start to appear togetherwith some branching or streamer emission from thecentral column. Again Figure 5b and 5d were taken 40nanoseconds after Figure Sa and Sc respectively.Figures Sc and Sd show an interesting detail about thedecay of the tree-like structures. As the main portionof the current flows through the plasma column, theelectron emission process causing the tree-likestructure ceases and the tree disappears gradually. Inall four pictures it can be seen that the breakdowncolumn seems to consist of a central channel (grey area)and some dark outer lines. These latter represent alarge density gradient and they are believed to becaused by a severe compression of the liquid due to thesudden release of thermal energy from the plasma column.
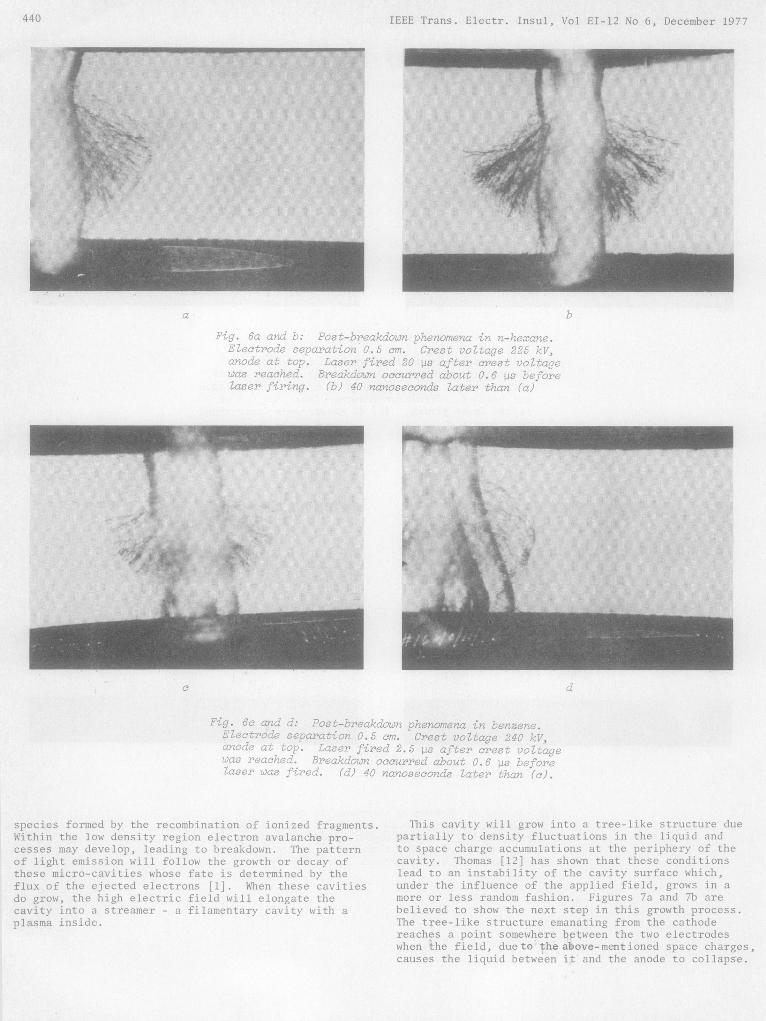
The post-breakdown events shown in Figures 6a, b, cand d display distortions (kinks) in the conductingcolumn (Figures 6a and 6b), extensive development ofshockwaves associated with cathode-directed streams andsome limited electron emission from the anode as evi-denced by some tree-like structures (Figure 6d). Ofparticular interest is the fact that Figures 6a and bwere obtained with n-hexane as the fluid medium whilebenzene was used in Figures 6c and d. After many ob-servations it can be concluded that the general patternof the breakdown process is the same for all fourliquids. The fine structure is, however, quite distinctfor each one. This is particularly noticeable in com-paring tree size and shape. Normal hexane shows themost complicated and extensive structures, while ben-zene and toluene exhibit small, poorly formed ones.
DISCUSSION
The initiation of electrical breakdown in liquids haslong been a topic of interest. It is generally agreedthat some perturbation of the cathode-liquid interfacetriggers the event. One such perturbation could be theformation of a microcavity at the interface. RecentlyThomas and Forster [11] proposed a model for conductionand breakdown based on such a perturbation. The schemethey proposed was based on some two dimensional calcu-lations of Thomas [12] which assumed that electronswere ejected from local asperities on the cathode sur-face by field enhancement. This assumption agrees verywell with the observation that no streamer originateswithin the liquid itself. Once the electron bombardmentstarts, the liquid will be heated locally. Togetherwith an electron induced liquid motion, a region of lowdensity will form and effectively increase the electronmean free path. The electrons, accelerated under thehigh electric field, undergo fewer collisions and thuswill gain more and more energy to cause impact excita-tion and/or ionization of the molecules at the peripheryof the low density region. The excited molecules willemit light on decaying to lower energy quantum states.If the excited molecules are the same as those making upthe liquid, the radiation could be reabsorbed. In thecase of the two saturated hydrocarbons studied here,the light emitted is obviously of a different wavelengththan that associated with hexane or isooctane. Itappears, therefore, that this light might come from new
438
Forster and Wong: Schlieren Studies in Liquid Hydrocarbons
f
a b
Fig. 5a and b: Breakdown phenomena in n-hexane.Electrode separation 0.5 cm. Crest voltage 215 kV,anode at top. Laser fired 20 Vs after crest voltagewas reached. Breakdown occurred Zess than 0.5 Vsbefore Zaser firing. (b) 40 nanoseconds later than(a).
c d
Fig. 5c and d: Breakdown phenomena in n-hexane.EZectrode separation 0.55 cm. Crest voltage 225 kV.Laser fired 21 us after crest voZtage wae reached.Breakdown occurred Zess than 0.5 ps before Zaserwas fired. (d) 40 nanoseconds Zater than (c).
439
.Ak .IVW 4
IEEE Trans. Electr. Insul, Vol EI-12 No 6, December 1977
a b
Fig. 6a and b: Post-breakdown phenomena in n-herane.Zectrode separation 0.5 cm. Crest voItage 22)5 kV,
anode at top. Laser fired 20 ps after crest voZtaaewas reached. Breakdown occurred about 0.6 ps beforeIaser firing. (b) 40 nanoseconds later than (a)
Fig. 6e and d: Post-breakdown phenomena in benzene.Electrode separation 0.5 om. Crest voltage 240 kV,anode at top. Laser fired 2.5 ps after erest voItagewas reached. Breakdlown occurred about 0.6 ps before2aser was firPed. (d) 40 nanoseconds later than (a).
species formed by the recombination of ionized fragments.Within the low density region electron avalanche pro-cesses may develop, leading to hreakdown. The patternof light emission will follow the growth or decay ofthese micro-cavities whose fate is determined by theflux of the ejected electrons [1]. When these cavitiesdo grow, the high electric field will elongate thecavity into a streamer - a filamentary cavity with aplasma inside.
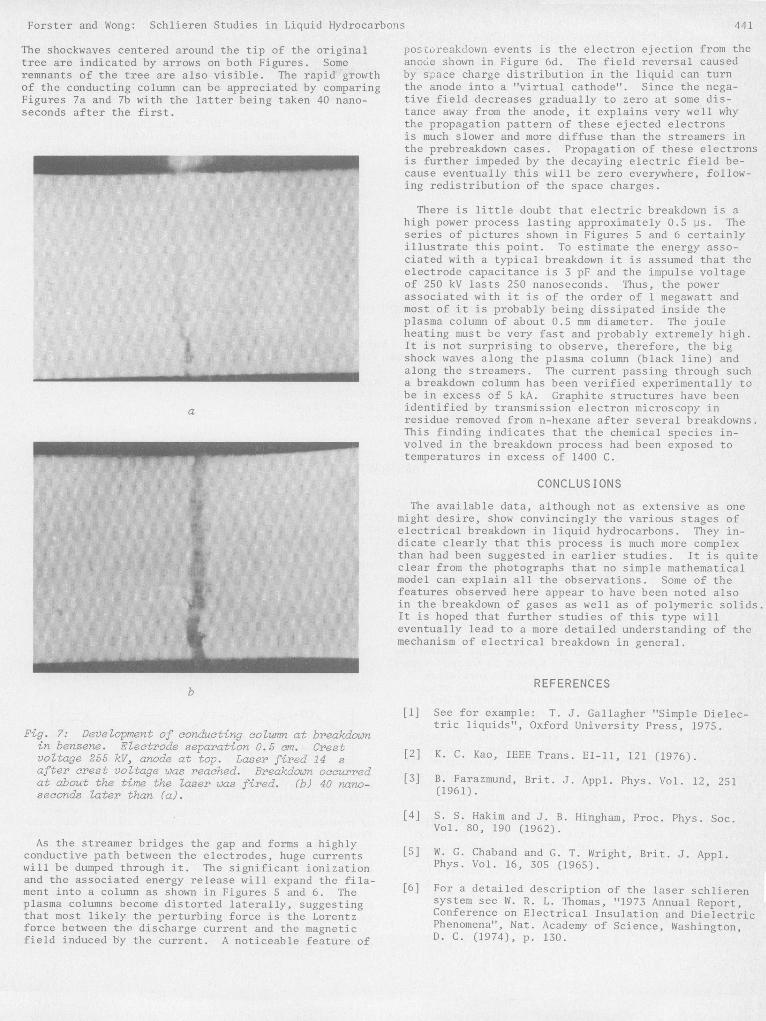
This cavity will grow into a tree-like structure duepartially to density fluctuations in the liquid andto space charge accumulations at the periphery of thecavity. Thomas [12] has shown that these conditionslead to an instability of the cavity surface which,under the influence of the applied field, grows in amore or less random fashion. Figures 7a and 7b arebelieved to show the next step in this growth process.The tree-like structure emanating from the cathodereaches a point somewhere between the two electrodeswhen the field, due to the above-mentioned space charges,causes the liquid between it and the anode to collapse.
440
Forster and Wong: Schlieren Studies in Liquid Hydrocarbons
The shockwaves centered around the tip of the originaltree are indicated by arrows on both Figures. Someremnants of the tree are also visible. The rapid growthof the conducting column can be appreciated by comparingFigures 7a and 7b with the latter being taken 40 nano-seconds after the first.
a
b
Fig. 7: Development of conducting column at breakdownin benzene. Electrode separation 0.5 cm. Crestvoltage 255 kV, anode at top. Laser fired 14 s
after crest voltage was reached. Breakdown occurredat about the time the laser was fired. (b) 40 nano-
seconds later than (a).
As the streamer bridges the gap and forms a highlyconductive path between the electrodes, huge currentswill be dumped through it. The significant ionizationand the associated energy release will expand the fila-ment into a column as shown in Figures 5 and 6. Theplasma columns become distorted laterally, suggestingthat most likely the perturbing force is the Lorentzforce between the discharge current and the magneticfield induced by the current. A noticeable feature of
postureakdown events is the electron ejection from theanode shown in Figure 6d. The field reversal causedby space charge distribution in the liquid can turnthe anode into a "virtual cathode". Since the nega-tive field decreases gradually to zero at some dis-tance away from the anode, it explains very well whythe propagation pattern of these ejected electronsis much slower and more diffuse than the streamers inthe prebreakdown cases. Propagation of these electronsis further impeded by the decaying electric field be-cause eventually this will be zero everywhere, follow-ing redistribution of the space charges.
There is little doubt that electric breakdown is ahigh power process lasting approximately 0.5 ,us. Theseries of pictures shown in Figures 5 and 6 certainlyillustrate this point. To estimate the energy asso-ciated with a typical breakdown it is assumed that theelectrode capacitance is 3 pF and the impulse voltageof 250 kV lasts 250 nanoseconds. Thus, the powerassociated with it is of the order of 1 megawatt andmost of it is probably being dissipated inside theplasma column of about 0.5 mm diameter. The jouleheating must be very fast and probably extremely high.It is not surprising to observe, therefore, the bigshock waves along the plasma column (black line) andalong the streamers. The current passing through sucha breakdown column has been verified experimentally tobe in excess of 5 kA. Graphite structures have beenidentified by transmission electron microscopy inresidue removed from n-hexane after several breakdowns.This finding indicates that the chemical species in-volved in the breakdown process had been exposed totemperatures in excess of 1400 C.
CONCLUS IONS
The available data, although not as extensive as onemight desire, show convincingly the various stages ofelectrical breakdown in liquid hydrocarbons. They in-dicate clearly that this process is much more complexthan had been suggested in earlier studies. It is quiteclear from the photographs that no simple mathematicalmodel can explain all the observations. Some of thefeatures observed here appear to have been noted alsoin the breakdown of gases as well as of polymeric solids.It is hoped that further studies of this type willeventually lead to a more detailed understanding of themechanism of electrical breakdown in general.
REFERENCES
[1] See for example: T. J. Gallagher "Simple Dielec-tric liquids", Oxford University Press, 1975.
[2] K. C. Kao, IEEE Trans. EI-ll, 121 (1976).
[3] B. Farazmund, Brit. J. Appl. Phys. Vol. 12, 251(1961).
[4] S. S. Hakim and J. B. Hingham, Proc. Phys. Soc.Vol. 80, 190 (1962).
[5] W. G. Chaband and G. T. Wright, Brit. J. Appl.Phys. Vol. 16, 305 (1965).
[6] For a detailed description of the laser schlierensystem see W. R. L. Thomas, "1973 Annual Report,Conference on Electrical Insulation and DielectricPhenomena", Nat. Academy of Science, Washington,D. C. (1974), p. 130.
441
IEEE Trans. Electr. Insul, Vol EI-12 No 6, December 1977
[7] P. Wong and E. 0. Forster, Can. J. Chem., Vol. 55,1890 (1977).
[8] J. K. Nelson and P. B. McGrath, Proc. IEEE Vol.122. 1439 (1975).
[9] C. Chiu, J. Phys. Vol. 9, 851 (1976).
[10] C. W. Smith, K. C. Kao, J. H. Calderwood andJ. D, McGree, Nature Vol. 210, 192 (1966).
[11] W. R. L. Thomas and E. 0. Forster, "Proceedingsof the 5th International Conference on Conductionand Breakdown in Dielectric Liquids", Delft,Netherl1ands, (1975), p. 49.
[12] tV. R. L. Thomas, "1974 Annual Report, Conferenceon Electrical Insulatiorn and Dielectric Phenomena,"Nat. Academy of Science, Washington, D.C. (1975),p. 540.
i/anusor-ipt wcas received 30 March 1977, in revised fowr18 Jvlty 1977.
A MASS SPECTROMETRIC STUDY OF DIELECTRIC BREAKDOWN
S. R. Smith, Susan A. S. Smith, Julian F. Johnsonand John Tanaka
Department of Chemistry andInstitute of Materials Science
University of ConnecticutStorrs, Connecticut 06268
ABSTRACT
The volatile degradation materials from a polyimide insulationon magnet wire was studied under thermal stress alone and in thepresence of both thermal and electrical stress. Both types ofexperiments were carried out under vacuum with the apparatusconnected directly to a mass spectrometer. The combination ofthermal and electrical stress led to a different mass spectrometricpattern than that for thermal stress alone. The most markeddifference was the sharp increase in water peaks. The possibleinterpretations are discussed.
INTRODUCTION
The accelerated life testing of electrical insulationis often done by subjecting the sample to thermal stress.
The usual practice is to age the plastic insulatingmaterials in ovens. It is the purpose of this studyto determine whether a simultaneous electrical andthermal stress might change the aging mechanism.
We are postulating that the effect of the insulationunder electrical stress may be not unlike the effect of
polar solvents on the rate of reaction in solution [1],because the electrical potential causes polar groups inthe insulation to align with the electric field. Elec-tron clouds relative to the nuclei are also displacedboth in the molecules of the dielectric and of thereaction intermediates [2]. These polarizationi effectsmay lower the energy of activation of the rate deter-
mining step and increase the rate of decomposition ofthe dielectric. The pyrolytic breakdown of electricalinsulating materials has been extensively studied bythermal analysis [3-7]. It has also been studied bymass spectrometry [8]. To our knowledge, systematicstudies of pyrolytic breakdown under simultaneous
electrical stress have not been carried out.
EXPER IMENTAL
DieZectric Studied
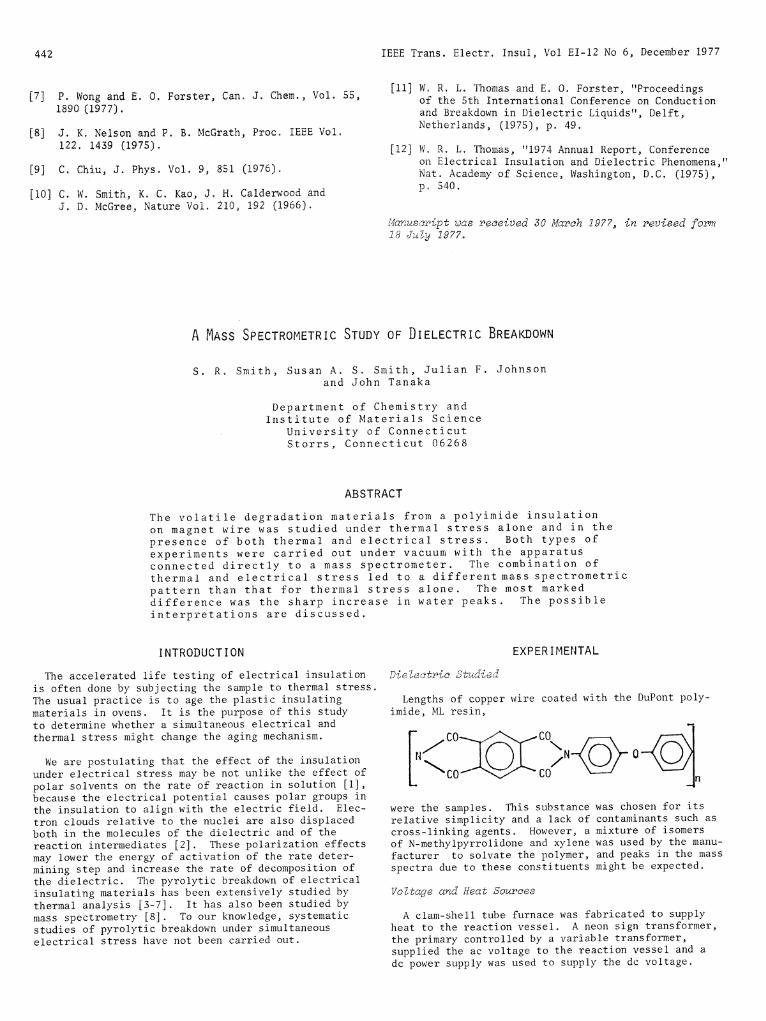
Lengths of copper wvire coated with the DuPont poly-imide, ML resin,
N< N 0CO
were the samples. This substancerelative simplicity and a lack ofcross-linking agents. However, aof N-methylpyrrolidone and xylenefacturer to solvate the polymer,spectra due to these constituents
was chosen for itscontaminants such asmixture of isomerswas used by the manu-and peaks in the massmight be expected.
Voltage and Heat Sources
A clam-shell tube furnace was fabricated to supplyheat to the reaction vessel. A neon sign transformer,the primary controlled by a variable transformer,supplied the ac voltage to the reaction vessel and adc power supply was used to supply the dc voltage.
442