Embed Size (px)
Citation preview

Highspeed photography of impact effects in threepoint bend testing of polymersJ. P. Dear Citation: Journal of Applied Physics 67, 4304 (1990); doi: 10.1063/1.344946 View online: http://dx.doi.org/10.1063/1.344946 View Table of Contents: http://scitation.aip.org/content/aip/journal/jap/67/9?ver=pdfcov Published by the AIP Publishing Articles you may be interested in Notched ThreePoint Bend Testing of GFRP Woven Laminates at Cryogenic Temperatures and Analysis ofFracture and Damage Properties AIP Conf. Proc. 824, 264 (2006); 10.1063/1.2192360 Highspeed photography of surface geometry effects in liquid/solid impact J. Appl. Phys. 63, 1015 (1988); 10.1063/1.340000 Facility for highspeed particle impact testing Rev. Sci. Instrum. 46, 1221 (1975); 10.1063/1.1134449 Optimization of Frame Rates for HighSpeed Photography Rev. Sci. Instrum. 30, 902 (1959); 10.1063/1.1716378 HighSpeed Photography Phys. Today 9, 32 (1956); 10.1063/1.3059894
[This article is copyrighted as indicated in the article. Reuse of AIP content is subject to the terms at: http://scitation.aip.org/termsconditions. Downloaded to ] IP:
130.160.4.77 On: Fri, 19 Dec 2014 23:52:03
High-speed photography of impact effects in three-point bend testing of polymers
J. P. Dear BP Chemicals Lecturer, Department of Mechanical Engineering, Imperial College of Science, Technology@d Medicine, Exhibition Road, London SW7 2BX, United Kingdom
(Received 25 October 1989; accepted for publication 17 January 1990)
The study presented in this paper relates mostly to impact testing of polymers and similar materials to measure their crack resistance and dynamic properties. For some impact testers, then, at low impact velocities the initial transient forces can be very small and short lived so as to be insignificant. This is so that the specimen mostly experiences a steadily increasing strain until it fails. At higher impact velocities both transient and generally increasing strain are both significant in taking the specimen to its failure point. With very high impact velocities, the specimen can fail mostly due to the initial impact forces. It is possible in some cases to cushion the specimen from the initial higher impact transients and related secondary effects such as bounce at the contact points. This is if a steadily increasing strain to fail the specimen is the main requirement. Of course, this is only feasible when the impact forces are not too dominant. However, as material technology has rapidly advanced so dynamic as well as toughness properties of materials have much improved. Also, the variety and mix of properties now available in different materials has greatly increased. With these trends, testing that can combine well impact, strong dynamic forces and steadily increasing strain loading of the specimen is of increasing interest. This can be so that the force-time curve of such testing to failure of a specimen can also be regarded as its dynamic performance signature. A problem is in arranging and monitoring the dynamic forces of such tests so as to be able to analyze effectively test results. These are the factors examined in this paper.
1. INTRODUCTION
Impact testers have become an effective and realistic way of evaluating the toughness of materials that can also have regard for the dynamic properties of the tested specimen. A great deal has been done in recent years to improve testers such as Charpy and Izod and also to develop a wide range of hydraulic, pneumatic, and other powerful testers including high-velocity projectile systems (for example, see Refs. 1-5).
Impact tests can be required for many stages in a product's development and manufacture. This is for the evaluath,,~', of bal\e materials and then their fabrication into complett: structures. For all these tests, a major difficulty is to provide for effective monitoring of what can be large fluctuating, as weIl as more steadily increasing, forces in the specimen that initiate and propagate failure cracks. Another problem can be to interpret precisely force-time and other test data when these are an involved mix of transient, steady strain rate, and other forces.
For some evaluation needs, there may be advantages in using striker and support surfaces in the tester which minimize the excitation of impact transients so that the dominant effects are the high-rate stressing of the specimen. In many other cases, the increasing need is to generate, as realistically as possible, impact transients and steadily increasing forces (0 act together on the specimen. With such combined testing having high impact levels, much care is needed in determining the strength of the respective forces and the sources and expenditure of energy to initiate and propagate failure cracks. Mostly, designers endeavor to relate such impact re-
quirements for their products to standard Charpy, Izod, and other tests without cushion or other modification to the hard support and striker surfaces. Therefore, a main aim of this paper is the better interpretation of test results from such testers when these have large impact transient content combined with other stress and strain data up to and including the failure point of the specimen. This is to include highspeed photography to identify the sources of transient excitations, reveal the bounce behavior of specimens, and other such effects as the specimen is taken to its failure point.
The Charpy tester is often referred to in this paper as it is a very popular item of equipment much used by research and manufacturing staff. However, much of what is discussed relates also to many other impact testers including some of the very large powerful test systems. A basic form of the Charpy impact test is to rest the ends of a bar specimen against two vertical supports and use a swinging pendulum to deliver a calibrated blow and continuing force to the specimen center. Care is needed in shaping and placing the specimen against its supports to obtain good symmetry and so avoid torsional and other unwanted forces combining with the three-point bending of the specimen. The impacting pendulum will, of course, induce longitudinal as well as transverse waves in the specimen. In some cases, the transverse waves will cause the specimen to bounce at its contacts with both the end supports and striker to generate secondary impacts and these will similarly stimulate a variety of forces in the specimen. Of these, often, the more important forces can be those due to the transverse wavefronts from the striker and secondary bounce impacts. Also, important are the reflections of both of these main and secondary transverse
4304 J. Appl. Phys 67 (9). 1 May 1990 0021-8979/90/094304-09$03.00 c' 1990 American Institute of Physics 4304
[This article is copyrighted as indicated in the article. Reuse of AIP content is subject to the terms at: http://scitation.aip.org/termsconditions. Downloaded to ] IP:
130.160.4.77 On: Fri, 19 Dec 2014 23:52:03

wavefronts. In many ways, such tests can represent very well the complex responses that impacts can generate in working materials and structures.
First the Charpy test is discussed in more detail as to the nature of the forces generated in the test specimen. Then, experimental evidence is presented to support this description. This is followed by a discussion as to how Charpy and other test results can best be interpreted and related to standard criteria.
II. IMPACT BEHAVIOR OF CHARPY TEST SPECIMENS
Putting aside shortcomings there may be in test equipment and its instrumentation and considering only the possible dynamic response of the impact specimen prior to crack failure, the following are some of the points that it is thought merit being highlighted. First, there is the need that the specimen is carefully set against the two end support points, ready for a central impact by the striker and other precautions taken to avoid unduly exciting torsional and other unwanted modes. This is so that the instrumentation sensors can be taken to be responding mostly to transverse vibrations, then the following briefly relates to the sequence of events and the type of response to be expected.
For low velocity impacts transient forces acting on the specimen will not be great and also short lived relative to the continuing steady increase of a three-point bending force. Then as the impact velocity is increased so the transient forces will be more in evidence as will the propensity for the specimen to bounce at its contact points with the supports and striker. As to fundamental and harmonic oscillations excited by transverse wavefronts then these can be attributed to both prime and secondary bounce impacts. The tendency will be for the two halves of the bar, each terminated by one end support and the striker, to be separately excited into their fundamental and higher modes. This is not to overlook that these terminations are one-sided but in effect they will be less so as the three-point bend stresses build up. With such a symmetrical configuration, the vibrations in the two halves ofthe bar will be synchronous. This is, ifthey are of the same length and there is equal distance between the striker and the end support points. The extent the specimen overhangs the support points can affect the vibration response of the bar. The striker and end support points being nodes but also bounce points. As to the three-point bend forces, each half of the bar will behave as a cantilever and have a stress distribution accordingly and this can modify the resonant behavior of the specimen.
It is when the level of impact is such that the specimen is driven into a few strong vibrational excursions and then fails that the points made above all have much significance including the bounce effects. For lower velocity impacts, these transients have less influence on the outcome of the test other than to provide some early dynamic working of the specimen. At very high-velocity impacts, the forces will become more concentrated at the center of the bar and it can fail in the first one or two excursions of the vibrations. Experimental work for these very early failure conditions is not presented in this paper but the topic will be discussed.
4305 J. Appl. Phys., Vol. 67, No.9, 1 May 1990
III. EXPERIMENT
The dynamic response of specimens will, of course, depend upon the modulus, density, and damping coefficient and other such properties of the material and its shape and dimensions. The time to failure can depend upon the dynamic force excursions as combined with the steady-state bending forces. The presence of a preformed sharp or blunt crack will also affect the time to failure as well as the crack initiation and propagation characteristics. A main aim of the experimental work is to illustrate the complex mix of forces acting on a specimen subject to a three-point bend impact test prior to discussing analytical methods.
For this study, a selection of polymer materials were used including high-density polyethylene (HOPE), polycarbonate, and epoxy. Framing high-speed photography using an image-converter Imacon camera was employed to capture on film the progressive deformation of the specimen, following impact by a swinging pendulum, up to and including crack failure of the test piece. Streak photography was another photographic technique used to record the contact history between striker and specimen and also between the specimen and its supports. For this streak photography, the light source was behind the swinging pendulum striker so that any gap between striker and specimen could be seen and recorded directly on film. In this case, it was arranged for a narrow aperture within the camera to scan in time the striker face in contact with the specimen to monitor any loss of contact. One purpose of the streak photography was to observe clearly the loss of contact between both the support and striker contact with the specimen. Force-time curves do not show well this loss of contact although it can be surmised from the way the force trace swings down to or near zero values. For these sequences, the flash and camera were triggered by the interruption of a laser beam by the swinging striker at an adjustable time prior to impact with the specimen. These impact studies were conducted using a commercial instrumented Ceast impact facility. Impact velocities up to about 3.6 m s . I were used. These gave times to failure down to about 100 IlS. The striker at the end of the swinging pendulum was instrumented and connected to a transient recorder and there was provision to statically calibrate the system before the experiments.
IV. RESULTS
A. Polyethylene
This is a test of three polyethylene (HOPE) Charpy three-point bend specimens of the same dimensions [length L (65 mm), width W (13 mm), and thickness B (13 mm)], support span S (52 mm), and taken from the same material batch. Each was given a precrack oflength a (al W = 0.3) at its center using a razor-sharp knife. The only difference in the three tests was the change of impact velocity. Figure 1 (a) is for an impact velocity of 1.31 m s - I and it can be seen that the impact transients are small and these are damped out well before the specimen is taken to its failure point. The corresponding high-speed Imacon photographic sequence [see Fig. 2(a)] shows the crack to pass cleanly right through the specimen. Despite the then very sharp coJlapse of the
J. P. Dear 4305
[This article is copyrighted as indicated in the article. Reuse of AIP content is subject to the terms at: http://scitation.aip.org/termsconditions. Downloaded to ] IP:
130.160.4.77 On: Fri, 19 Dec 2014 23:52:03

a
c
~0'k::J uO .
.f~~6
ZO .lI: ........
CD ~O . .f
Time/ms
. 1. Time/ms
FlU. 1. Force-time curve' for fracture ofprenotehed «(jj f.·V = 0.3) Charpy 'pecimen, (dimension, length L co. 65 mm. width If' = L\ mm, and thick-11\.'" R = U mm) at impact ,dncitic, of: (a) 1.31. (b) .1.04. and (e) 3.6 rn ~ I.
force trace, it is to be noted on the force-time diagram that there was no after-failure trace.
Figure I (b) is for an impact velocity of 3.04 m s 1
where the transients are much greater and exist up to and including the specimen's failure point. These transielits are fairly simple oscillatory swings. An important point to note in the corresponding high-speed photographs is that the fast crack has been arrested hefore completely severing the specimen. This would need to be taken into account when computing energy absorbed by the fast crack surfaces, and for detennining other such derived values. On the force-time trace, the fact that the specimen is still partly intact is in evidence by the after-trace following the first failure point. It would appear that several quite strong force excursions were additionally needed before the specimen was completely severed.
Figure I (c) is for an impact velocity of 3.6 m s -1 and here the force excursions are quite violent and tend to lose their simple oscillatory nature and this is partly du!.' to the strong bounce effects which will be discussed later. As shown by the high-speed photograph [Fig. 2 (c) 1, the fast failure crack was arrested about halfway through the specimen.
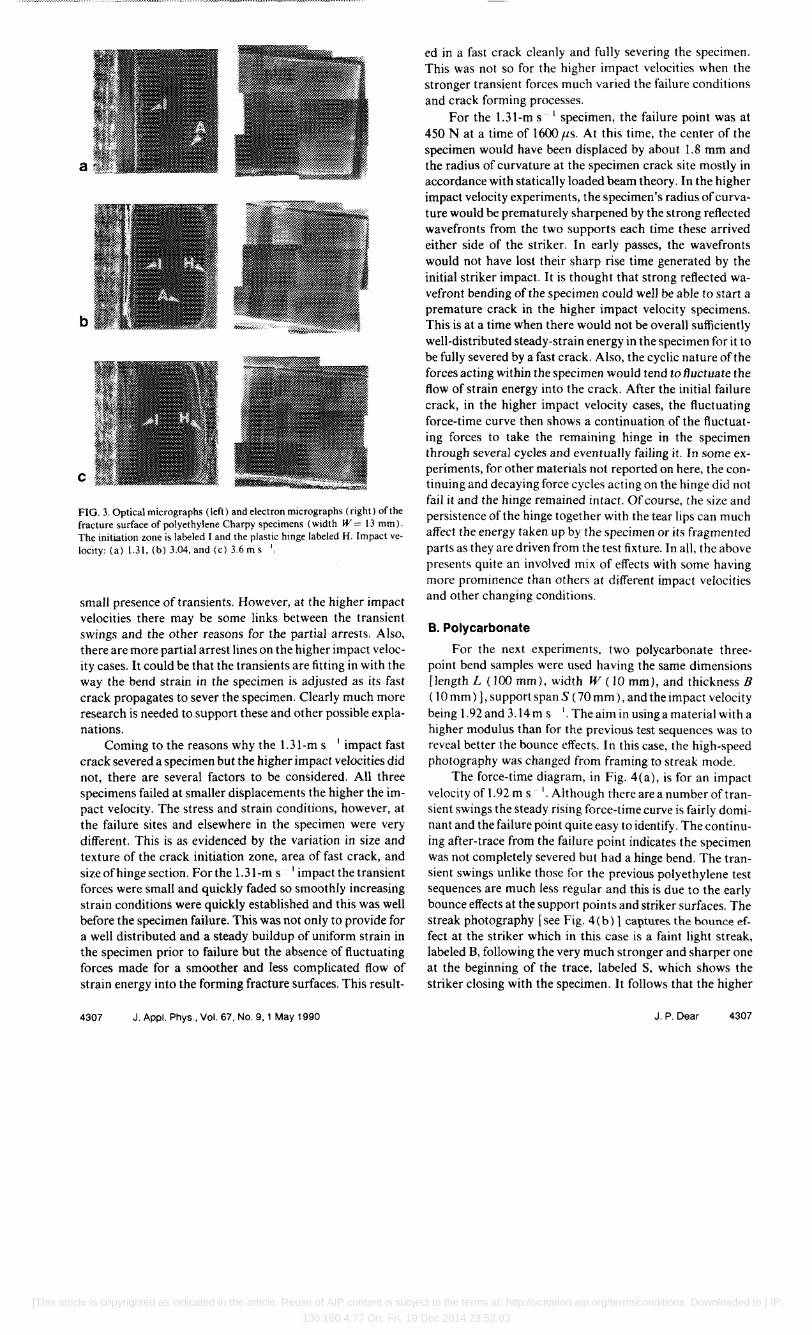
Electron micrographs and optical micrographs of the fracture surfaces for the specimens in Figs. I (a), I (b), and I(c) are shown in Figs. 3(a), 3(b), and 3(c). Well in evidence in these micrographs of the fracture surfaces is the variation in the size of the initiation zone and the hinge zone. Also of interest are what are usually referred to as shadow arrest lines, labeled A, on the fast crack surfaces which could be partly due to the fluctuating forces acting on the specimen.
For these experiments in which polyethylene specimens are fractured at three different impact velocities, an interest-
4306 J. Appl. Phys., Vol. 67. No.9, 1 May 1990
a
b
c FIG. 2. Hlgh-'peed photographic ,cljuence, "fthe fracture nfpolyethylene Charpy 'pecimens (ill Fig. I): (a I Impact velocity 1 . .11 m s I (interframc time -- 40 I")' (h) impact velocity .1.04 m, I (interframc time = 100!ls), and (c) impact \ e10city :\.t, rn s I (intcrframe lime = 10 !ls).
ing point, very relevant to this study, is that only the lowest velocity impact of 1.31 m s 1 cleanly severed the specimen with a fast crack. Comparing this specimen's fracture surface [Fig. 3 (a) 1 with the other two higher velocity tests [Figs. 3 (b) and 3 (c) 1 then the impact of 1.31 m s 1 generated the largest crack initiation zone but negligible hinge effect. The impact of 3.04 m s 1 produced a smaller crack initiation zone but a quite distinct hinge region about T\' the width of the specimen. This trend continues with the 3.6-m s 1 impact producing an even smaller finer texture initiation zone and a considerably larger plastic hinge-bend section. Another factor is that the 1.31-m s I impact had a very distinct partial arrest line about halfway across the fracture surface but apparently this is not strongly related to the very
J. P. Dear 4306
[This article is copyrighted as indicated in the article. Reuse of AIP content is subject to the terms at: http://scitation.aip.org/termsconditions. Downloaded to ] IP:
130.160.4.77 On: Fri, 19 Dec 2014 23:52:03
a
b
c
FIG. 3. Optical micrographs (left) and electron micrographs (right) of the fracture surface of polyethylene Charpy specimens (width W = 13 mm). The initiation zone is labeled I and the plastic hinge labeled H. Impact velocity: (a) 1.31, (b) 3.04, and (c) 3.6 m s '.
small presence of transients. However, at the higher impact velocities there may be some links between the transient swings and the other reasons for the partial arrests. Also, there are more partial arrest lines on the higher impact velocity cases. It could be that the transients are fitting in with the way the bend strain in the specimen is adjusted as its fast crack propagates to sever the specimen. Clearly much more research is needed to support these and other possible explanations.
Coming to the reasons why the 1.31-m s 1 impact fast crack severed a specimen but the higher impact velocities did not, there are several factors to be considered. All three specimens failed at smaller displacements the higher the impact velocity. The stress and strain conditions, however, at the failure sites and elsewhere in the specimen were very different. This is as evidenced by the variation in size and texture of the crack initiation zone, area of fast crack, and size of hinge section. For the 1.31-m s 1 impact the transient forces were small and quickly faded so smoothly increasing strain conditions were quickly established and this was well before the specimen failure. This was not only to provide for a well distributed and a steady buildup of uniform strain in the specimen prior to failure but the absence of fluctuating forces made for a smoother and less complicated flow of strain energy into the forming fracture surfaces. This result-
4307 J. Appl. Phys., Vol. 67, No.9, 1 May 1990
ed in a fast crack cleanly and fully severing the specimen. This was not so for the higher impact velocities when the stronger transient forces much varied the failure conditions and crack forming processes.
For the 1.31-m s - 1 specimen, the failure point was at 450 N at a time of 1600 fls. At this time, the center of the specimen would have been displaced by about 1.8 mm and the radius of curvature at the specimen crack site mostly in accordance with statically loaded beam theory. In the higher impact velocity experiments, the specimen's radius of curvature would be prematurely sharpened by the strong reflected wavefronts from the two supports each time these arrived either side of the striker. In early passes, the wavefronts would not have lost their sharp rise time generated by the initial striker impact. It is thought that strong reflected wavefront bending of the specimen could well be able to start a premature crack in the higher impact velocity specimens. This is at a time when there would not be overall sufficiently well-distributed steady-strain energy in the specimen for it to be funy severed by a fast crack. Also, the cyclic nature of the forces acting within the specimen would tend to fluctuate the flow of strain energy into the crack. After the initial failure crack, in the higher impact velocity cases, the fluctuating force-time curve then shows a continuation of the fluctuating forces to take the remaining hinge in the specimen through several cycles and eventually failing it. In some experiments, for other materials not reported on here, the continuing and decaying force cycles acting on the hinge did not fail it and the hinge remained intact. Of course, the size and persistence of the hinge together with the tear lips can much affect the energy taken up by the specimen or its fragmented parts as they are driven from the test fixture. In all, the above presents quite an involved mix of effects with some having more prominence than others at different impact velocities and other changing conditions.
B. Polycarbonate
For the next experiments, two polycarbonate threepoint bend samples were used having the same dimensions [length L (100 mm), width W (10 mm), and thickness B ( 10 mm) ], support span S (70 mm), and the impact velocity being 1.92 and 3.14m s 1. The aim in using a material witha higher modulus than for the previous test sequences was to reveal better the bounce effects. In this case, the high-speed photography was changed from framing to streak mode.
The force-time diagram, in Fig. 4(a), is for an impact velocity of 1.92 m s - 1. Although there are a number oftransient swings the steady rising force-time curve is fairly dominant and the failure point quite easy to identify_ The continuing after-trace from the failure point indicates the specimen was not completely severed but had a hinge bend. The transient swings unlike those for the previous polyethylene test sequences are much less regular and this is due to the early bounce effects at the support points and striker surfaces. The streak photography [see Fig. 4 (b) ] calltmes. the bounce effect at the striker which in this case is a faint light streak, labeled B, following the very much stronger and sharper one at the beginning of the trace, labeled S, which shows the striker closing with the specimen. It follows that the higher
J. P. Dear 4307
[This article is copyrighted as indicated in the article. Reuse of AIP content is subject to the terms at: http://scitation.aip.org/termsconditions. Downloaded to ] IP:
130.160.4.77 On: Fri, 19 Dec 2014 23:52:03

a
b
c
~O'j~ ~O o· u, b rmnMltt ~ ,
o 0.8 1.6 2.4 3.2 Time/ms
Zl f lo.'~~J\~ o . :16 0.24 0.32
Time/ms
FIG.4. (a) Force-time trace for a blunt prenotched (al W = 0.3) poly carbonate specimen (dimensions:L = lOOmm, W= 10mm,andB= !Omm) and support span of70 mm for an impact velocity of 1.92 m s I (b) Streak photograph of striker-to-specimen contact. Striker making contact with specimen labeled S. Bounce of specimen off striker labeled B. (c) Expansion of early part offorce-tirne trace In la) with same time base as streak photograph in (b).
the modulus of a material. the greater the bounce f(lr a given impact velocity and for the same geometric form and dimensions of the specimen. The bounce process results from the quite fast rising wavefront produced by the initial striker to specimen impact.
This wavefront is reflected by both the supports to send a reversed wavefront back to the center of the specimen. At this stage there is little general three-point bending force acting upon the specimen so the supports are one-sided only. Hence. when the impact wavefront is reversed at the supports. the specimen ends are free to bounce. A single bounce will. of course. generate two secondary force impulses, the first being the impulse to cause the bounce and the second the impulse resulting from the specimen closing again with the support. More than one bounce is possible and the extent the spccim<::n overhangs the supports can affect the bounce period and their intensities. When the two or more bounce impulses from the support arrive back at the center of the specimen. they can cause it to then bounce off the striker. Figure 4( c) is an expansion of the early part of the trace of Fig. 4 (a) and in Fig. 4 (c) this double bounce reflection from the supports can be well seen. The first peak in the trace of Fig. 4( c) shows the initial force acting at the striker/specimen contact that sends the initial transverse wavefront out to the support points. The next two smaller humps relate to the extra striker force needed to overcome the reflected negative pulses and a result of this is that the striker loses contact with the specimen. This is to generate subsequent bounce humps in the force-time trace which are then followed by a second main force impulse and so these transient generations can continue. Comparing the time of the striker bounce as
4308 J. Appl. Phys .. Vol. 67, No.9, 1 May 1990
indicated by the force-time curve and the streak photograph, these agree very well.
In Fig. 5 which is for an impact velocity of 3.14 m s 1.
the streak photograph [Fig. 5 (b) J shows well the stronger and longer bounce with a corresponding brighter and longer streak interval. The expanded force-time trace [Fig. 5 (c) I also indicates well a bounce interval in the now much more violent transient swings. The bounce effects on the forcctime curve transients are well in evidence up to and including the first failure point of the specimen.
C.Epoxy
For the next two experimental sequences, identical epoxy samples were used having the same dimensions [length L (80 mm), width W (10 mm), and thickness B (15 mm) l. and a support span S of 70 mm. Also, the impact velocities and all other experimental conditions were kept the same. The aim being to combine the results of these two impact tests, so that the bounce cffects at both the striker and one of the support points could be captured on film and closely correlated with the force-time curves.
Figures 6( a) and 6( b) set the two force-time curves side by side. This shows that the impacts for each specimen were very similar if not identical. Figures 6( c) and 6( d) are the corresponding streak photographic studies of the bounce at the striker and one of the supports, respectively. Figure 7 is a diagram that brings together the force-time trace and the two streak photographs to show the related bounce sequences at striker and one of the support contact points.
It is to be noted in the force-time curves of Figs. 6(a)
a ~1M -----Q
~0.2
&~ •• "............, , 0.8 1.6 2.4
Time/ms
b
c i:~ N\ u:. ,f\ (1
o 0.08 0.16 0.24 0.32 Time/ms
FIG. 5. (a) Force-time trace for a blunt prenotched (al W = 0.3) polycarbonate specimen [dimensions: length L (100 mm). width W( 10 mm). and thickness B ( 10 mm) J and support span of 70 mm for an impact velocity of 3.14 m s \. (b) Streak photograph of striker-to-specimen contact. Striker dosing with specimen labeled S. Bounce of specimen off striker labeled B. (c) Expansion of early part of force-time trace in (a).
J. P. Dear 4308
[This article is copyrighted as indicated in the article. Reuse of AIP content is subject to the terms at: http://scitation.aip.org/termsconditions. Downloaded to ] IP:
130.160.4.77 On: Fri, 19 Dec 2014 23:52:03

a
z~ in _ .,j\{\,., o 0.08 0.16 0.24 0.32
Time/ms
FIG. 6. (a) and (b) are force-time curves for identical prenotched (a/W = 0.3) epoxy specimens (dimensions: L-80 mm, W = \0 mm, and B = IS mm) at an impact velocity of 3.14 m s I; (c) is the streak photograph corresponding to the force-time curve in (a) showing initial contact labeled S and bounce labeled B at the striker/specimen interface. and (d) is the streak photograph corresponding to the force-time curve in (b) showing bounce labeled B of the specimen from one of the supports.
Z JiI: -80.4 ~
a .f
b
c
Striker closing wi h specimen
~c.~~~-=--S Specimen bou~ing Speclmen~' is ahead of striker leaves striker
Specimen bounces Specimen § off su~~, !88Ves SU~!
~ Stationa~ supports
FIG. 7. (a) Force-time curve of Fig. /) along side distance-time curves for (b) specimen-to-striker contact and (c) specimen-to-end-support contact.
4309 J. Appl. PhyS., Vol. 67, No.9, 1 May 1990
and 6(b) that the reflected peaks from the fixed supports and the ends of the specimen have lost some of their symmetry. This is because the second reflected peak has been diminished relative to the first reflected peak. If the bounce interval had been very short, the reflection from the end of the specimen would have been correspondingly small. It follows that the longer the bounce period, the stronger the reflection from the end of the specimen and the more noticeable its effect on the force-time curve.
D. Other high-velocity impact tests
There is a trend to do more impact testing using gas gun projectiles and other free-flight projectile systems to impact onto material specimens which in some cases are quite large. High-speed photography is very much needed for these studies to capture on film what can be quite an involved behavior of the target specimen. Also, the damage zone can be more confined to the point of impact for higher impact velocities. As well as the impact studies covered in this paper, there is much interest in the point of impact damage that can be done by very high impact velocity projectiles. This is to include liquid-to-solid impacts as well as solid-to-solid impacts; also, for involved impact conditions where material at the impact site can be taken through solid to liquid and other phases. Some of these works which are particularly relevant to the studies presented in this paper are those that examine the effects of V-notches and other contouring of the material surface and also discontinuities within the material such as cavities [this is as to the effect on the generation of stress concentrations (see Refs. 6-12) ). As well as free-flight projectiles being fired against a wide variety of material specimens including composites and assembled structures, there is also an increasing tendency to use such projectiles for initiating crack propagation in equipment such as double-torsion testers (see Leevers and Williams I, ), in which case the transient behavior of the specimen and the support arrangements need to be carefully studied as these can greatly influence the results of tests. As with the Charpy test, high-speed framing and streak photography can be very helpful in capturing the progress of the crack and relating this to the dynamic behavior of the specimen.
Figure 8(a) is an example of a force-time curve for a double-torsion tester equipped with a gas gun firing a projectile at the strike point. The strike point being near to the precrack at one end of the specimen which is a rectangular sheet of polyethylene (HDPE) with a length L of 200 mm, width Wof 100 mm, and thickness B of 6 mm, resting on four corner supports. This arrangement can be seen in the highspeed photography which shows a photographic sequence from above [see Fig. 8 (b)] and beneath the specimen [see Fig. 8 ( c) ]. The upper and lower surfaces of the specimen have thick white bands across the path of the crack. This is to highlight better the progress of the crack and also to reveal how the specimen is distorted up to crack initiation and during crack severance of the specimen. The uQQer surface of the specimen being also gauge-instrumented to provide for crack velocity measurement by this means. Figures 8 (b) and 8 (c) show well that as the crack is progressing along the specimen, there is considerable bounce at the supports in
J. P. Dear 4309
[This article is copyrighted as indicated in the article. Reuse of AIP content is subject to the terms at: http://scitation.aip.org/termsconditions. Downloaded to ] IP:
130.160.4.77 On: Fri, 19 Dec 2014 23:52:03

a
b
FIC;. x (a) F()fcc-tlmc curvc f,lr" double-hlLiion te't at an impact veiocilY "f 15 Ill' I (n) High-... peed ph()lographic ,~quence of the double-torsion It'st \ ie\\Ing from an",e and looking aln'1g the specimclI showing striker. lanekd S. making Cllnlact. Horizontal markings indicating flexure show that the 'pecimen lo,e, C'ontact first with the rear supporh hefore a crack I"" compktely se\cred the 'pecimen (interframe time: 0.25 m,). (e) Sequenct' of the douhle-to"ion lest viewing fr.-,m below the specimen. Again, Il<lrilOntal markIngs on the specimen indicate its flexure A crack. labeled C. "also visible propagating "long the length of the spcclmcn.
evidence and it follows that the crack tip as well as being subject to fast double-torsion bending is also experiencing impulses of energy from transient impact force excursions.
v. ANALYSIS OF IMPACT DATA
Mostly this paper has looked at the difficult area of analysis of impact failure, when as well as the three-point bend or other forcing condit.ions, fluctuating impact forces can much contribute to the failure of the specimen. This is when there have been large impact wavefronts reversed at the supports to return and greatly increase the radius of curvature of the prepared failure site. Other effects mentioned but not cov(:fed in experiments in this paper are the very early failure possibilities before the impact wavefront has reached the specimen end supports. The way specimens can fail under very high early impact conditions does, of course, vary greatly and depends on the specimen's brittleness, toughness, and such properties, and if they are in a composite or other structural form. Fracture surfaces can be very different as to the size and texture of the crack initiation zone, side-lips and
4310 J. Appl. Phys., Vol. 67, No.9, 1 May 1990
other features. It follows that determining such factors as K, and G, for these situations is not always meaningful even if possible. However, if the very high-velocity impact produces a clean or other crack surface similar to that experienced with three-point bend testing at lower impact velocities then some means of making comparisons may well be required. It is clear that if failure of a specimen occurs before impact wavefronts have reached the end supports then it can not be due to bend forces. For transverse wave velocities with an upper limit of about 500 m s t in a polyethylene specimen (plane transverse wave velocity is about 510 m s I for polyethylene) and with a distance from the center to one of the ends of the specimen of 26 mm then this would apply to a failure time of less than 50 J..lS. It follows that for such very early failures of the specimen that it could be inappropriate to use simply the spacing of the end supports for the determination of K c ' Go and other factors. It is to be noted that the striker will not be aware of the end supports until the reflected wavefront has returned to the center of the specimen. Another point is that there could be several discrete passages of the wavefront from the striker to the end supports and back again before oscillations have built up in the two halves of the specimen. If there is bounce at the end supports and striker contact, there can be further complications due to the secondary impacts at the end of each bounce. Generally, such early failures need to be carefully analyzed.
Much work has been done by leading researchers to examine and analyze impact transients of the kind presented in this paper. Some very interesting modelling of the dynamic crack propagation behavior in a three-point bend specimen has been done by Williams, I Williams and Adams,:< and Williams and Crouch. t4 These take the form of spring-mass models in which the transient swings can be mixed with steadily increasing three-point bending strain. This can be done in various ways by assigning different values to the spring-mass elements in the model. Another approach by these researchers15,t~ has been to use finite element models.
Kalthoff has done a great deal of experimental work that examines polymers, metals, and other materials as to their dynamic behavior and how this is related to the crack resistance of these materials under dynamic impact conditions (for example see Refs. 2 and 3). This includes specimen geometry effects such as overhang of the specimen outside of the support points in the case of three-point bend Charpy tests. t7 Also, Kinloch, Kodokian, and Jamarani 1R
have examined the effects that transient oscillations within the specimen can have on the K, and G, values of tested materials.
Before discussing possible analytical methods, there is one point about experimental instrumentation that needs to be made. This is that for these experiments the force sensor was located in the heavy mass of the swinging pendulum so some of the high-frequency components of the impact would not be revealed in the force-time traces. This is to make the transient excursion peaks less sharp and the effects of the fast rise time of the wavefront less obvious. There can be many other differences in the force-time traces when comparing traces from sensors on the striker and traces from sensors on the specimen. t9
J. P. Dear 4310
[This article is copyrighted as indicated in the article. Reuse of AIP content is subject to the terms at: http://scitation.aip.org/termsconditions. Downloaded to ] IP:
130.160.4.77 On: Fri, 19 Dec 2014 23:52:03

Table I summarizes the early contact behavior for specimens which strongly exhibited bounce. There are several points to be made about the force-time signatures. When a striker first makes contact with the Charpy-type specimen, then a common feature is that the center of the specimen is accelerated to or near to the striker velocity by the first transient peak. Thus the height of the first peak can be well related to the impact velocity and nearly proportional to it (compare Figs. 4 and 5 where the peak heights are 0.2 and 0.4 kN for impact velocities of 1.92 and 3.14 m s - 1, respectively). As the transit time of the transverse wave is a function of frequency, then the sharper the impact, the shorter the transit time from the impact center to the end supports and so the time to the first loss of contact or bounce is also reduced. Also, the higher the impact velocity, the sharper the impact wavefront and the stronger the force that then acts on the support points. This will increase the bounce of the specimen at the support points and the strength of the returning wavefront to the striker and the subsequent bounce caused between specimen and striker. Given in Table I are te which is the time to first loss of contact between striker and specimen, tb.stnk which is the time for which the specimen center bounces free of the striker, and tb.supp (for the epoxy specimen) which is the time for which the specimen bounces free of the support point. For additional information, details ofa test of a specimen with a width W of 6 mm are included which, of course, has a different stiffness and transverse wave transit time as the tabulated results show.
It is now quite common to find impact testers that have built-in microprocessors and other computing aids. A thought is that these could be programmed to generate a variety of model data against which results of tests on unknown material specimens could be compared. This is to relate a tested specimen's dynamic properties and crack resistance to known information about a range of materials. These kinds of comparisons have advanced a great deal in recent years as indeed so has data processing for analysis work generally. This is with ever faster computers and much improved data-handling capacity such that performance signature matching of many kinds is becoming widely used. In the case of a three-point bend Charpy test, the transient effects tend to be of the following categories:
(i) small transients with a steadily increasing bending force which dominates the failure of the specimen;
TABLE I. Summary of initial contact behavior of specimen materials that strongly exhibited bounce at the striker, showing time to first loss of contact with striker te. time for which specimen and striker were out of contact tb.,,, ••• and for the epoxy specimen. time for which striker and support were
out of contact tb.,upp'
Specimen W Impact velocity te (b.slnk t b.supp
material (mm) (m s - t) (ms) (ms) (ms)
PC (Fig. 4) \0 1.92 0.17 0.07 PC (Fig. 5) \0 3.14 0.15 0.12 PC (not shown) 6 3.14 0.23 0.3 Epoxy (Fig. 6) \0 3.14 0.12 0.06 0.13
4311 J. Appl. Phys .• Vol. 67. No. 9.1 May 1990
(ii) stronger transient swings starting to affect the failure of the specimen but not so great as to cause notable bounce at the striker and support contact points;
(iii) large transient swings in force with significant bounce effects which could be regarded as secondary impacts phase related to the initial impact by the transverse wavefront transit time of the specimen; and
(iv) very early impact failure of the specimen before the transverse wavefront has reached the end supports or soon after.
Only a little computing aid would be needed for category (i). Category (ii) could be well covered by mass-spring and other such models, and category (iii) may require the ability to generate two or more signals that could be mixed and phased to correspond to the force-time signal obtained from the specimen under test. Category (iv) failures would be more related to impacts with unsupported specimens and would need to be appropriately considered. It is thought there is much scope for research in this area because analysis of such impact properties is becoming increasingly important for many applications of materials; also, for studying force-time traces of impact in structures particularly where involved composite materials are employed. One of the important objectives is to analyze more precisely the forces acting to initiate and propagate a crack through the specimen and the way energy is consumed to create the new crack surfaces.
VI. CONCLUSIONS
A reason for this research, although mostly to understand better the results of three-point bend tests such as obtained from high-velocity Charpy tests, was also to start looking more widely at impact transients per se related to testing of materials. Clearly there is a great deal more research needed in the increasingly important area of impact properties of materials and structures. This is not only as it is becoming increasingly important to understand more fully impact and high-stress transfer properties of available materials but also to keep up with advances in material technologies. These are rapidly producing new generations of very different materials having a wide variety of impact performance and dynamic qualities that meet the ever changing needs of industry.
It is essential that testing and interpretation of results are appropriately improved. One of the objectives of this research was to identify areas that higher degree students could research that were related to these topics that fitted in well with the needs of industry to have better information about impact properties of materials.
Increasingly important in the impact testing of materials is to be able to analyze quickly the effects of transients as well as steady-rate bending or other straining of the test specimen. This is to present the users oftest equipment with information closely related to the resultant failure crack surfaces (as pertains to the size of the initiation zone, fast crack surface, tear lips, and plastic hinge section). A key factor is the dynamic properties of the specimen stimulated by the impact which are referred to in this paper as the dynamic performance signatures. These signatures can contain a lot
J. P. Dear 4311
[This article is copyrighted as indicated in the article. Reuse of AIP content is subject to the terms at: http://scitation.aip.org/termsconditions. Downloaded to ] IP:
130.160.4.77 On: Fri, 19 Dec 2014 23:52:03

of information not only about initial impact forces, effects of bounce at the supports, and striker contact with t he specimen, but also the damping factor and other such qualities of the material. The important point is that these properties would be those that the material exhibit under realistic impact testing conditions up to and including its failure processes. It follows that whenever higher rate stressing of materials introduces large transients in the specimen then much care is needed in identifying all the significant factors that contributed to the failure of the specimen as highlighted in this paper.
ACKNOWLEDGMENTS
I wish to thank Professor 1. O. Williams and Dr. A. 1. Kinloch for introducing me to this interesting problem of dynamic impact testing and for their many helpful discussions. I am very grateful to BP Chemicals for their sponsorship and helpful interest in this research activity and continuing related studies.
4312 J. Appl. Phys .. Vol. 67. No.9. 1 May 1990
'J. G. Williams. Int. J. Fract. 33. 47 (19H7) . . J. F Kalthoff. Int. J. Frac!. 27. 277 (1987). \ J. F. Kalthoff. in I/Illldhook Oil Fxp('f'imcl1/Il/Jleclllll1in. edited hy A. S. Kohayashi (Prcntice-Hall. Englewood Cliffs. NJ. I9RX). p. 430.
"A. S. Kohayashi. Eng. Frac!. Mcch. 23. D (1986). 'J. G. Williams and G. C. Adams. Int. J. Fract. 33. 209 (1<)87). \'J.I'. DearandJ. E. Field.J. Appl. Phys.63.1015 (19X8).
J. P. Dear. J. E. Field. and A. J. Walton. Nature 332.505 ( 1988). '1. E. Field. J. P. Dear. and J. E. Ogren. J. App!. Ph),s. 65.533 (1<)89) "s. van dcr Zwaag. J. P. Dear. and J. E. Field. Philo". Mag. Ser. A 53. 101
( 1(86).
'''J. E. Field.M. B. Le"er.andJ.I'. Dear. Proc. R.Soc. LonlionScr. A4(1l. 225(1985).
"J. P. Dear and J. E. Field. in Proceedings of the 7th International Conference on Erosion hy LilJuid and Solid Impact. edited by J. E. Field and J. P. Dear. Cavendish Laboratory. Cambridge. UK ( 1987). paper 3.
I.'J. P. Dear and 1. E. Field. J. Fluid Mech. 190.409 (In8). ,\ P. S. Leevers and J. G. Williams. in Proceeding" of the International C(lll
ference on Mechanical and Physical Behaviour of Materials under Dynamic L.oading. Ajaccio. Corsica ( 1988). p. 23 I
'" B. A. Crouch and J. G. William,. J. Mech. Phy,. Solids 36, I (19XX). "B. A. Crouch, Ph.D. thL"is, Universitv of London. 19Xh. ", B. A. Crouch (private communicatio;]). IC W. Biihme and J. F Kalthoff. Int. J. Frac!. 20. 139 I I n2).
,< A. J. Kinloch. G. A. Kodokian, and M. B. Jamarani. J. Mater. Sci. 22, 4111 (1987)
'" J. P. Dear and J. H. MacGillivray. J. Mater. Sci. (in press).
J. P. Dear 4312
[This article is copyrighted as indicated in the article. Reuse of AIP content is subject to the terms at: http://scitation.aip.org/termsconditions. Downloaded to ] IP:
130.160.4.77 On: Fri, 19 Dec 2014 23:52:03


![Laurence W. McKeen, PhD - Pentasil Used in Medical Devices.pdf · of branched polymers include star polymers, comb polymers, brush polymers, dendronized polymers [1], ladders, and](https://img.pdfslide.net/doc/110x75/5fd30108783da00f76371237/laurence-w-mckeen-phd-pentasil-used-in-medical-devicespdf-of-branched-polymers.jpg)