Embed Size (px)
Citation preview
HORIZON DISCOVERY
APPLICATION NOTE
High-Throughput Screening in Colorectal Organoids – Proof of Concept Study
Tim Scales, Annette Little & David Sorrell Horizon Discovery, Waterbeach, Cambridge, UK
IntroductionThere is a need to perform high-throughput screens in more complex culture systems that better model the tumour microenvironment (TME) compared to standard 2D assay formats. To address this need Horizon developed OncoSignature 3D, a panel of approximately 200 cancer cell lines amenable to screening in a 3D spheroid format on Horizon’s cellular HTS platform (Figure 1). While spheroids are excellent for modelling various aspects of the TME such as nutrient, oxygen and chemical gradients, and cell-to-cell interactions, they typically lack the cellular heterogeneity of the original tumour and are derived from cancer cell lines that have been extensively passaged since isolation from the patient. To address these limitations, we have extended our screening capabilities to patient-derived organoids, which display a heterogeneity of cell types and recapitulate the micro-anatomy of the original tumour. Organoids have historically been difficult to use in high-throughput screens due to limited quantities and significant batch-to-batch variation, however, these obstacles have been overcome by our partners Cellesce using novel bioprocessing technologies. Here we demonstrate the amenability of screening colorectal cancer organoids generated by Cellesce in a 384-well based high-throughput compatible assay.
Figure 1. Overview of Horizon’s cellular HTS platform
MethodTwo colorectal organoid lines derived from separate patients (A andB) that differ in genotype (Table 1) and morphology (Figure 2) weresupplied by Cellesce. Organoids were plated in reduced growthfactor Matrigel (Corning) in 384-well plates and dosed withcompounds after 48 h. After a further 5 d incubation, cell viabilitywas assessed using CellTiter-Glo 3D® (Promega).
Gene Isolation A Isolation B
KRAS WT G12D
BRAF K601E WT
EGRF R521K WT
Table 1. Overview of Horizon’s cellular HTS platform
ResultsThe two colorectal organoid lines tested both displayed significantgrowth over the course of the assay and displayed the characteristicmorphology previously reported for colorectal cancer organoids:Isolation A and B both exhibited visible lumen and Isolation Bdisplaying a more convoluted structure reminiscent of villi andcrypts (Figure 2).
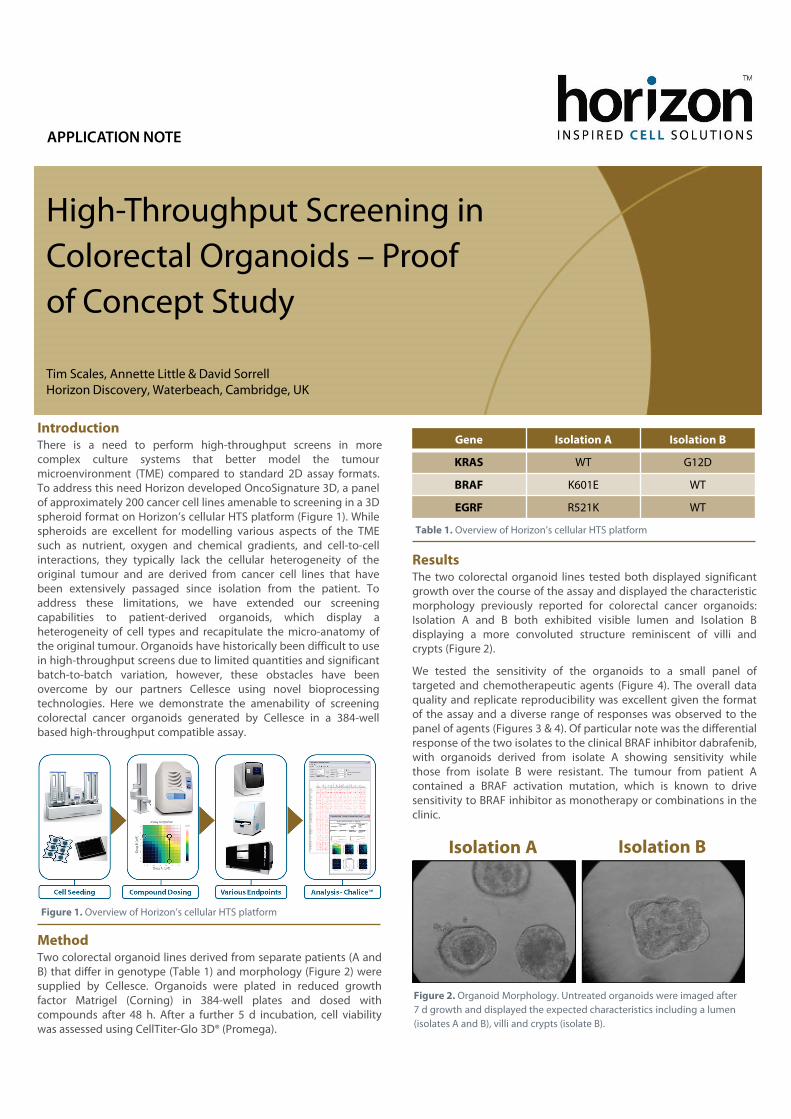
We tested the sensitivity of the organoids to a small panel oftargeted and chemotherapeutic agents (Figure 4). The overall dataquality and replicate reproducibility was excellent given the formatof the assay and a diverse range of responses was observed to thepanel of agents (Figures 3 & 4). Of particular note was the differentialresponse of the two isolates to the clinical BRAF inhibitor dabrafenib,with organoids derived from isolate A showing sensitivity whilethose from isolate B were resistant. The tumour from patient Acontained a BRAF activation mutation, which is known to drivesensitivity to BRAF inhibitor as monotherapy or combinations in theclinic.
Isolation A Isolation B
Figure 2. Organoid Morphology. Untreated organoids were imaged after 7 d growth and displayed the expected characteristics including a lumen (isolates A and B), villi and crypts (isolate B).
+ 44 (0)1223 976000+ 44 (0)1223 [email protected]
If you have any questions:
t +44 (0) 1223 976 000 (UK) or +1 855 772 4252 (USA)f + 44 (0)1223 655 581e [email protected] www.horizondiscovery.comHorizon Discovery, 8100 Cambridge Research Park, Waterbeach, Cambridge, CB25 9TL, United Kingdom
Figure 3. Organoid growth during assay. Organoids were imaged on the day of seeding (-48 h), at the point of dosing (0 h), 72 h post-treatment (72 h) and 120 h post-treatment (120 h). Organoids treated with DMSO showed clear growth over the course of the assay, in contrast those treated with 100 nM trametinib did not grow.
ConclusionUtilising colorectal organoids from Cellesce we were able to demonstrate robust assay performance in a viability-based compound screen using Celltiter-Glo 3D®. The genotypic responses of the organoids to BRAF inhibition modelled known clinical responses confirming the potential of this type of screening for predicting clinical response and patient stratification. This proof of concept study demonstrates Horizon’s capability to screen organoids with compounds, either as single agent or in combination, in a format amenable to high-throughput screening. In addition to CellTiter-Glo 3D®, this format will also be compatible to a range of other plate reader-based or high content imaging readouts.
Figure 4. Viability assay dose response curve. Two organoid isolates weretreated with 9-point doses of a variety of agents in a CellTiter-Glo 3D®based viability assay.
-48 h 0 h 72 h 120 h Dabrafenib(BRAF inhibitor)
Trametinib(MEK inhibitor)
Cetuximab(EGFR inhibitor)
LGK974(PORCN inhibitor)
Fluorouracil(DNA replication inhibitor)
Oxaliplatin(DNA synthesis inhibitor)
Tram
etin
ib10
0nMIsol
atio
nB
DM
SOTr
amet
inib
100
nMD
MSO
Isol
atio
nA