Embed Size (px)
Citation preview
HIGHER EDUCATION AND WORK SURVEY OF GRADUATES OF THE UNIVERSITY OF MALAWI
WHO GRADUATED BETWEEN 1987 AND 1995
by S.N ZEMBERE AND M.P.M. CHINYAMA
Research Paper
Number XXX
Page 2
HIGHER EDUCATION AND WORK SURVEY OF GRADUATES OF THE UNIVERSITY OF MALAWI
WHO GRADUATED BETWEEN 1987 AND 1995
FOREWORD
This research presents the results of the tracer study of the graduates of the University of Malawi who graduated between 1987 and 1995. The objective of this tracer study was to examine the career patterns of the graduates and hopefully this tracer study forms a basis for evaluating current programmes of the University of Malawi through the graduates' reactions to the programmes.
This study was undertaken as part of the Association of African Universities (AAU) UNESCO Unitwin network on higher education research in Africa. The valuable data obtained will assist greatly in future planning of activities and programmes in the University of Malawi. It is hoped that this study will complement previous studies of similar nature.
Thanks are due to the Association of African Universities, without whose financial support and guidance, the study would not have been undertaken. The authors would also like to acknowledge the valuable contribution made by Harald Schomburg and Prof. Ulrich Teichler, who during the research acted as resource persons, Mr. N. Chizani of the Centre for Social Research - University of Malawi for developing a programme for data entry and analysis, Mrs Malikebu and Mr. Jeremiah Phiri for their willingness to enter the data on the computers.
Page 3
INTRODUCTION
The University of Malawi comprises five constituent colleges with a central administration situated in Zomba. The colleges are Bunda College of Agriculture in Lilongwe, Chancellor College in Zomba, Kamuzu College of Nursing in Lilongwe, College of Medicine and The Polytechnic in Blantyre.
From its humble beginnings in the early 60's the University has been the only institution of higher learning in the country. As such it has been entrusted with the responsibility of providing highly trained personnel required both in government and industry, carry out research and provide leadership in all aspects of national development.
The University of Malawi awarded the first certificates to its deserving graduates in 1968. By 1987 the University of Malawi had awarded seven thousand, five hundred and fourteen degrees, diplomas and certificates (7514). Up until 1988, no systematic study had been carried out to determine the influence of its programmes in meeting human resources needs of Malawi society and economy.
A tracer study to shed some light on the above was launched in July 1988 by the then Vice Chancellor Dr. J.M Dubbey. The tracer study whose implementation was made possible by Human Resource and Institutional Development (HIRD) project of the United States of America covered the period from 1968 to 1987.
The current tracer study has covered the period from 1987 to 1995. This tracer study has special significance. First, it provides a continuation of the process of evaluation of the performance of the University of Malawi, and secondly the results will form the first ever comparative studies with the results from ten other similar studies on higher education in Africa. Selected Universities in Africa, include five from Nigeria, one from Ghana, Kenya, Uganda, Tanzania, and Malawi.
Page 4
OBJECTIVES
The main objectives of the tracer study were to: (i) investigate the transition process from higher education to work; (ii) shed light on the course of employment and work over a five year
period after graduation; (iii) analyse the relationships between higher education and work in a
broad perspective which includes the fulfilment of personal goals such as job satisfaction and objective measurement like job position, income, job security and the type of work;
(iv) find out what factors are important for professional success of graduates taking into account personal factors like gender, work motivation, acquired qualification during course of study and labour market conditions;
(v) evaluate on the basis of the experience and views of graduates, central aspects of the University, including resources, facilities and curriculum and get feedback for their improvement;
(vi) identify key aspects of the continuing professional education of graduates, and themes and kinds of courses, including extent, cost, location, reasons for participation, proposals for University courses.
METHODOLOGY
Between 1987 and 1995, three thousand, nine hundred and thirty - four students (3934) graduated from the University of Malawi. Out of this, two thousand were targeted for this study. Having completed the preparation of the questionnaires, twenty questionnaires were sent out to carefully selected graduates of the University of Malawi to pre-test the questionnaires. Each degree field of study was represented in the pre-test and generally respondents felt that the questionnaire was fairly clear and straightforward though too long. The questionnaire captured all the information required to meet the objectives and it was therefore acceptable.
Page 5
The researchers then solicited for addresses from all the graduates of the University of Malawi who graduated between 1987 and 1995 through radio and newspaper advertisements. The researchers also visited offices in the city of Blantyre collecting the addresses personally from graduates. Another effective way which was used to trace the graduates was to write Personnel Managers of different organisations and companies which are known for employing a large number of graduates to send the researchers names of all graduates employed by their organisations.
In total, one thousand, nine hundred and seventy-five (1,975) questionnaires were sent by post to graduates, representing 98.7 percent of the targeted population. Properly completed returned questionnaires totaled five hundred and sixty three (563). Eighteen uncompleted questionnaires were received plus twelve partially completed questionnaires from graduates who had either a Diploma or were still unemployed. In total five hundred and seventy-five questionnaires were returned to the researchers, and out of these, thirty (30) questionnaires were discarded. Therefore the rate of return was 28.5 percent.
Most questions in the questionnaire invited the respondents to respond on a five point scale with one representing very good to five representing very bad. The results were entered into the computers using D-Base and then converted to SPSS for analysis. Using year of graduation, sector of employment and Bachelor's degree field, the results were aggregated accordingly.
ENROLMENT AND STUDY PROVISIONS
Enrolment The number of years of study for the degree programmes in the
University of Malawi vary from four to six years. In some cases the period of study is more than six years especially for those courses which require that a candidate spend a year or two before crossing over to that course, for instance Law and Medicine. Up until 1990 Engineering programme was a six years course before changing to present five years while, Nursing is still a six years course. Since the tracer study covered those graduating between 1987 and 1995, the results show that the number of respondents on the year of first enrolment decreases from 6 percent in 1991 to zero in the period 1993 to 1995. It is likely that the majority of students who enrolled in this
Page 6
period were not yet through with their studies in 1995 and could not participate in this study.
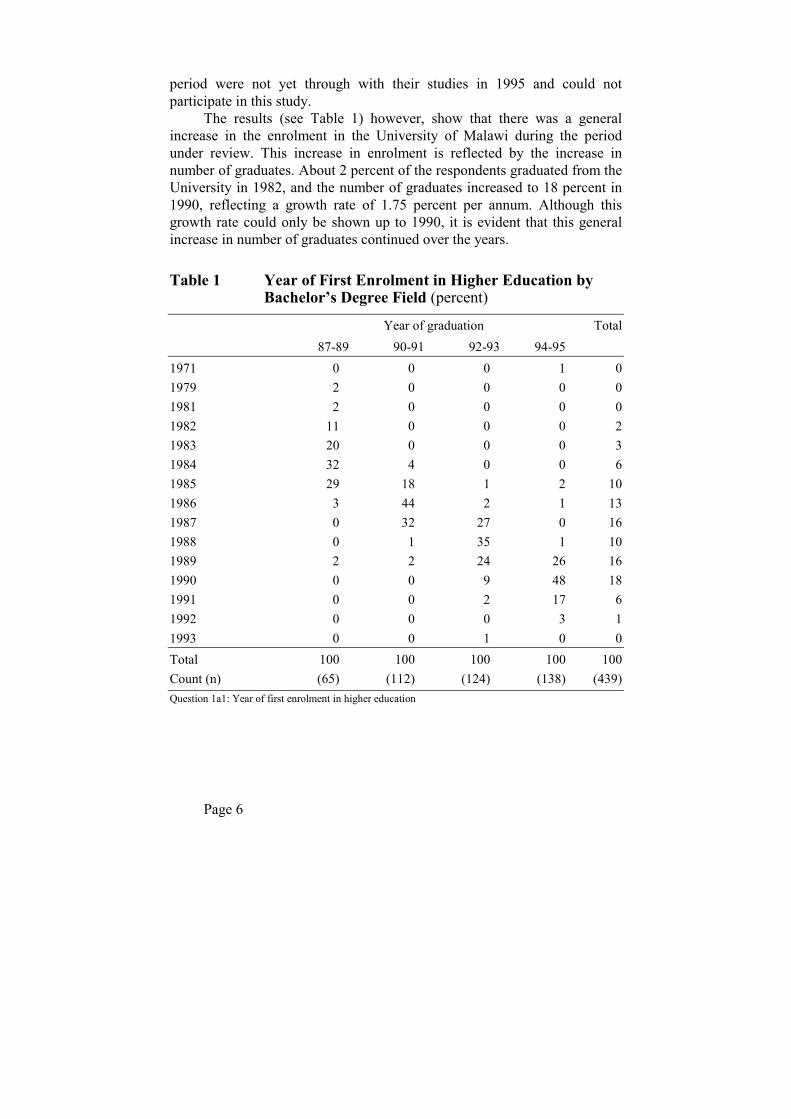
The results (see Table 1) however, show that there was a general increase in the enrolment in the University of Malawi during the period under review. This increase in enrolment is reflected by the increase in number of graduates. About 2 percent of the respondents graduated from the University in 1982, and the number of graduates increased to 18 percent in 1990, reflecting a growth rate of 1.75 percent per annum. Although this growth rate could only be shown up to 1990, it is evident that this general increase in number of graduates continued over the years.
Table 1 Year of First Enrolment in Higher Education by Bachelor’s Degree Field (percent)
Year of graduation Total 87-89 90-91 92-93 94-95
1971 0 0 0 1 0 1979 2 0 0 0 0 1981 2 0 0 0 0 1982 11 0 0 0 2 1983 20 0 0 0 3 1984 32 4 0 0 6 1985 29 18 1 2 10 1986 3 44 2 1 13 1987 0 32 27 0 16 1988 0 1 35 1 10 1989 2 2 24 26 16 1990 0 0 9 48 18 1991 0 0 2 17 6 1992 0 0 0 3 1 1993 0 0 1 0 0 Total 100 100 100 100 100 Count (n) (65) (112) (124) (138) (439) Question 1a1: Year of first enrolment in higher education
Page 7
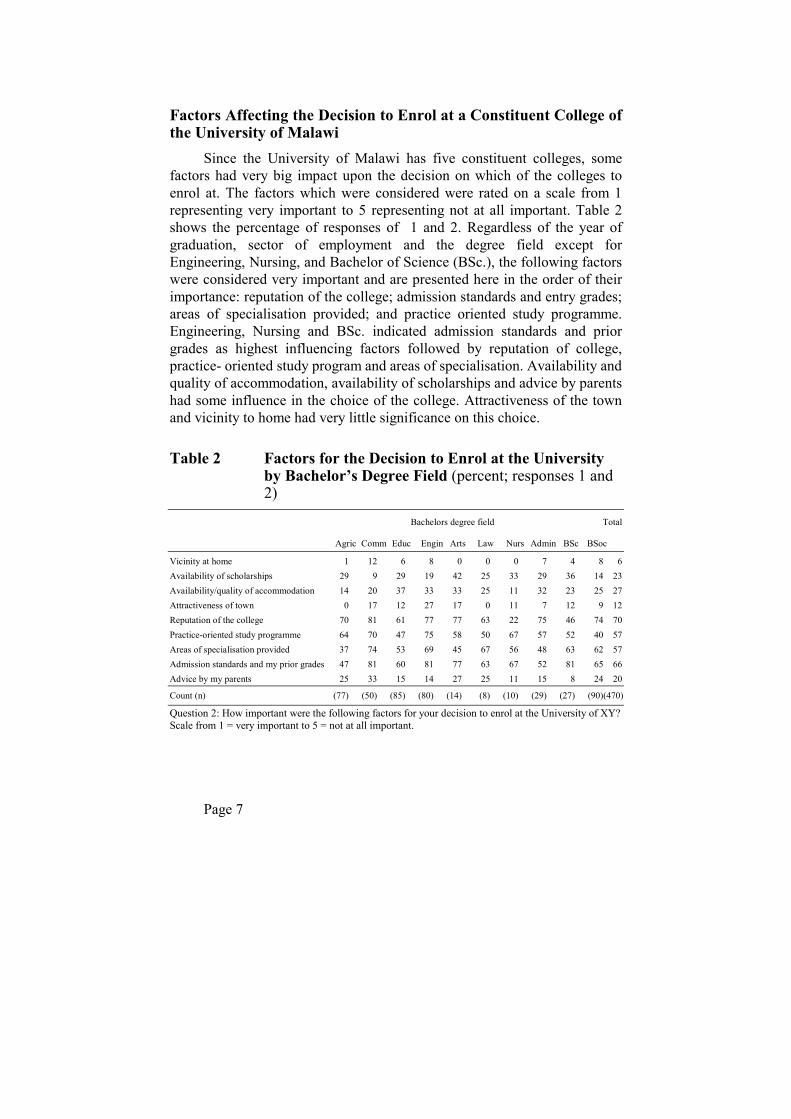
Factors Affecting the Decision to Enrol at a Constituent College of the University of Malawi
Since the University of Malawi has five constituent colleges, some factors had very big impact upon the decision on which of the colleges to enrol at. The factors which were considered were rated on a scale from 1 representing very important to 5 representing not at all important. Table 2 shows the percentage of responses of 1 and 2. Regardless of the year of graduation, sector of employment and the degree field except for Engineering, Nursing, and Bachelor of Science (BSc.), the following factors were considered very important and are presented here in the order of their importance: reputation of the college; admission standards and entry grades; areas of specialisation provided; and practice oriented study programme. Engineering, Nursing and BSc. indicated admission standards and prior grades as highest influencing factors followed by reputation of college, practice- oriented study program and areas of specialisation. Availability and quality of accommodation, availability of scholarships and advice by parents had some influence in the choice of the college. Attractiveness of the town and vicinity to home had very little significance on this choice.
Table 2 Factors for the Decision to Enrol at the University by Bachelor’s Degree Field (percent; responses 1 and 2)
Bachelors degree field Total
Agric Comm Educ Engin Arts Law Nurs Admin BSc BSoc
Vicinity at home 1 12 6 8 0 0 0 7 4 8 6 Availability of scholarships 29 9 29 19 42 25 33 29 36 14 23 Availability/quality of accommodation 14 20 37 33 33 25 11 32 23 25 27 Attractiveness of town 0 17 12 27 17 0 11 7 12 9 12 Reputation of the college 70 81 61 77 77 63 22 75 46 74 70 Practice-oriented study programme 64 70 47 75 58 50 67 57 52 40 57 Areas of specialisation provided 37 74 53 69 45 67 56 48 63 62 57 Admission standards and my prior grades 47 81 60 81 77 63 67 52 81 65 66 Advice by my parents 25 33 15 14 27 25 11 15 8 24 20
Count (n) (77) (50) (85) (80) (14) (8) (10) (29) (27) (90)(470)
Question 2: How important were the following factors for your decision to enrol at the University of XY? Scale from 1 = very important to 5 = not at all important.
Page 8
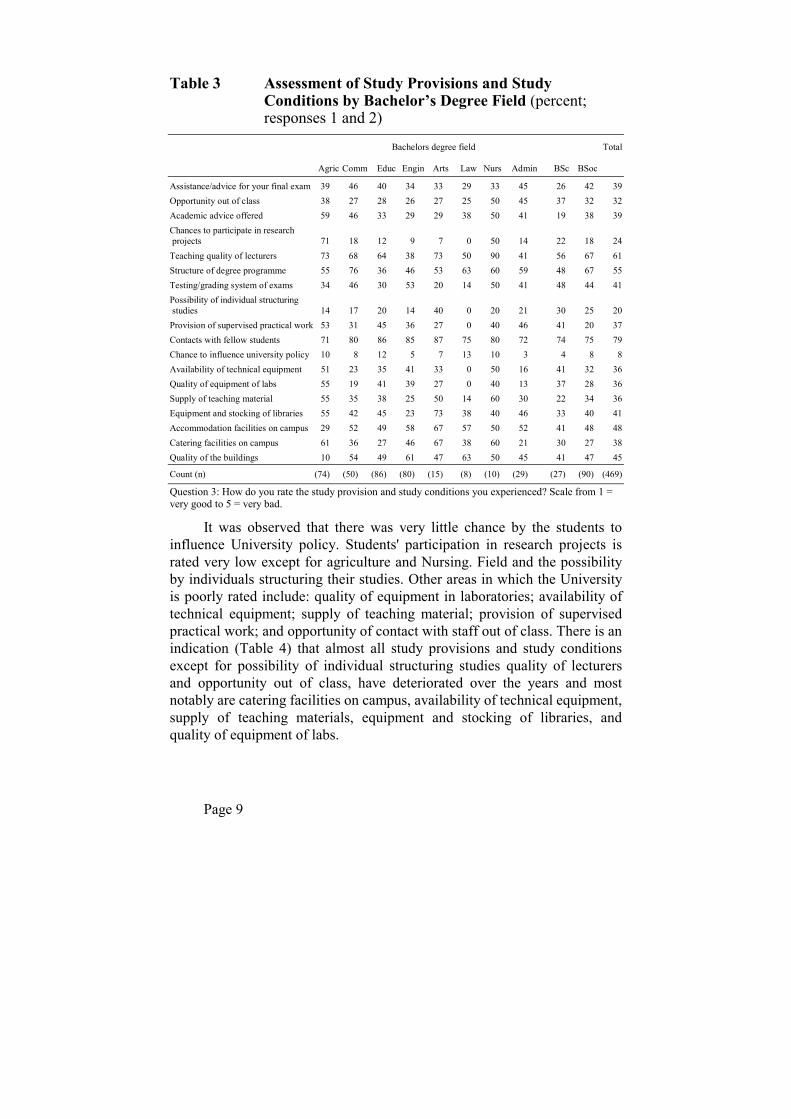
Graduates were asked to rate the study provisions and conditions they experienced at their colleges, using a scale 1 to 5 very good and very bad respectively. The results (Table 3) for responses 1 and 2, show that there are very small differences in study provisions and study conditions in the constituent colleges of the University. Overall, irrespective of the degree field, year of graduation and sector of employment, contacts with fellow students was rated very high (79 percent). Other factors which were considered good are: teaching quality of lecturers (61 percent), structure of degree programme (55 percent); accommodation facilities on campus (48 percent); quality of buildings (45 percent); catering facilities on campus; equipment and stocking of libraries; academic advice offered; assistance for final exams; testing/grading system of exams. Though the overall picture of teaching quality of lecturers is good in the whole University, the Engineering field indicated lowest amongst all degree fields. This is probably due to fewer highly qualified (PhD holder) lecturers in this field. Laboratory facilities in general are poor coupled with the fact that even teaching staff is inadequate.
Page 9
Table 3 Assessment of Study Provisions and Study Conditions by Bachelor’s Degree Field (percent; responses 1 and 2)
Bachelors degree field Total
Agric Comm Educ Engin Arts Law Nurs Admin BSc BSoc
Assistance/advice for your final exam 39 46 40 34 33 29 33 45 26 42 39 Opportunity out of class 38 27 28 26 27 25 50 45 37 32 32 Academic advice offered 59 46 33 29 29 38 50 41 19 38 39 Chances to participate in research projects 71 18 12 9 7 0 50 14 22 18 24 Teaching quality of lecturers 73 68 64 38 73 50 90 41 56 67 61 Structure of degree programme 55 76 36 46 53 63 60 59 48 67 55 Testing/grading system of exams 34 46 30 53 20 14 50 41 48 44 41 Possibility of individual structuring studies 14 17 20 14 40 0 20 21 30 25 20 Provision of supervised practical work 53 31 45 36 27 0 40 46 41 20 37 Contacts with fellow students 71 80 86 85 87 75 80 72 74 75 79 Chance to influence university policy 10 8 12 5 7 13 10 3 4 8 8 Availability of technical equipment 51 23 35 41 33 0 50 16 41 32 36 Quality of equipment of labs 55 19 41 39 27 0 40 13 37 28 36 Supply of teaching material 55 35 38 25 50 14 60 30 22 34 36 Equipment and stocking of libraries 55 42 45 23 73 38 40 46 33 40 41 Accommodation facilities on campus 29 52 49 58 67 57 50 52 41 48 48 Catering facilities on campus 61 36 27 46 67 38 60 21 30 27 38 Quality of the buildings 10 54 49 61 47 63 50 45 41 47 45
Count (n) (74) (50) (86) (80) (15) (8) (10) (29) (27) (90) (469)
Question 3: How do you rate the study provision and study conditions you experienced? Scale from 1 = very good to 5 = very bad.
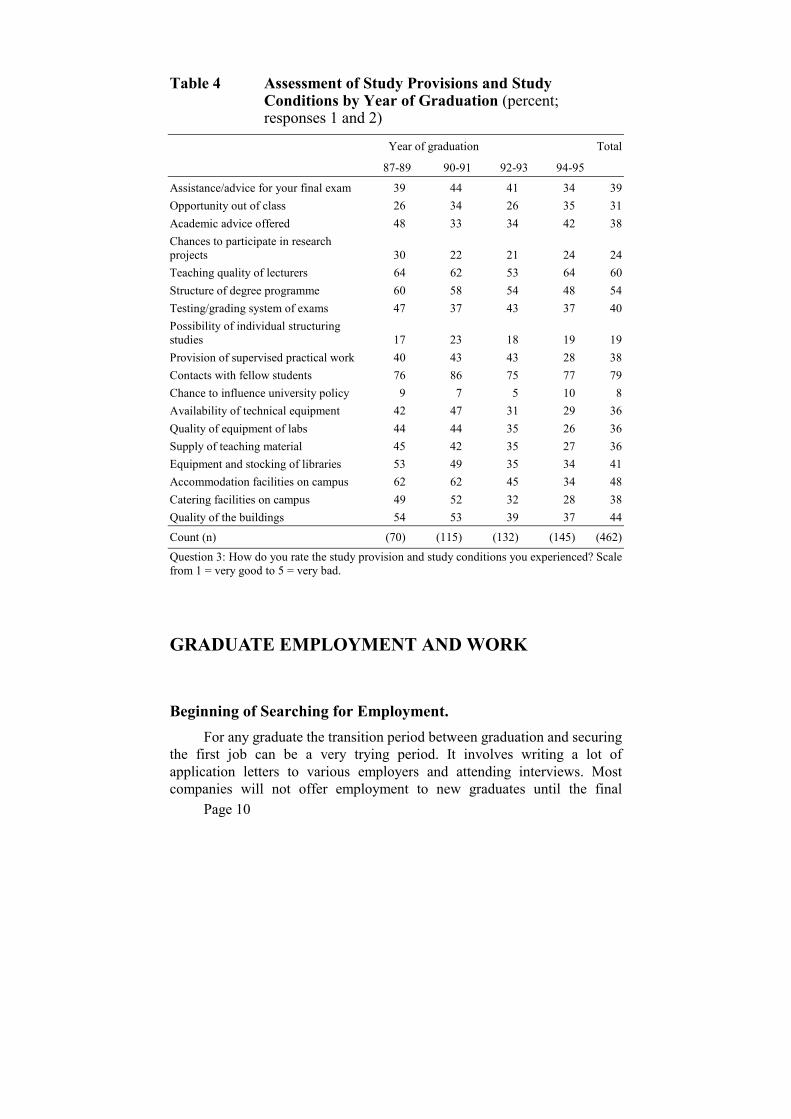
It was observed that there was very little chance by the students to influence University policy. Students' participation in research projects is rated very low except for agriculture and Nursing. Field and the possibility by individuals structuring their studies. Other areas in which the University is poorly rated include: quality of equipment in laboratories; availability of technical equipment; supply of teaching material; provision of supervised practical work; and opportunity of contact with staff out of class. There is an indication (Table 4) that almost all study provisions and study conditions except for possibility of individual structuring studies quality of lecturers and opportunity out of class, have deteriorated over the years and most notably are catering facilities on campus, availability of technical equipment, supply of teaching materials, equipment and stocking of libraries, and quality of equipment of labs.
Page 10
Table 4 Assessment of Study Provisions and Study Conditions by Year of Graduation (percent; responses 1 and 2)
Year of graduation Total
87-89 90-91 92-93 94-95
Assistance/advice for your final exam 39 44 41 34 39 Opportunity out of class 26 34 26 35 31 Academic advice offered 48 33 34 42 38 Chances to participate in research projects 30 22 21 24 24 Teaching quality of lecturers 64 62 53 64 60 Structure of degree programme 60 58 54 48 54 Testing/grading system of exams 47 37 43 37 40 Possibility of individual structuring studies 17 23 18 19 19 Provision of supervised practical work 40 43 43 28 38 Contacts with fellow students 76 86 75 77 79 Chance to influence university policy 9 7 5 10 8 Availability of technical equipment 42 47 31 29 36 Quality of equipment of labs 44 44 35 26 36 Supply of teaching material 45 42 35 27 36 Equipment and stocking of libraries 53 49 35 34 41 Accommodation facilities on campus 62 62 45 34 48 Catering facilities on campus 49 52 32 28 38 Quality of the buildings 54 53 39 37 44
Count (n) (70) (115) (132) (145) (462) Question 3: How do you rate the study provision and study conditions you experienced? Scale from 1 = very good to 5 = very bad.
GRADUATE EMPLOYMENT AND WORK
Beginning of Searching for Employment. For any graduate the transition period between graduation and securing
the first job can be a very trying period. It involves writing a lot of application letters to various employers and attending interviews. Most companies will not offer employment to new graduates until the final
Page 11
examination results are known. Knowing that it takes so long to secure a job and the anxiety to receive the first pay after graduation, most of the graduates start searching for employment way before graduation. Table 5 depict some interesting responses from the graduates as to when they started searching for employment. The majority of graduates, 76 percent started the search for employment before graduation and 11 percent began searching for employment after graduation.
Table 5 Time of Start of Search for Employment by Bachelor’s Degree Field (percent)
Bachelors degree field Total
Agric Comm Educ Engin Arts Law Nurs Admin BSc BSoc
Before graduation 92 89 43 79 79 57 20 86 70 87 76 After graduation 7 11 9 17 14 29 0 5 19 10 11 Did not seek employment 1 0 48 4 7 14 70 10 11 3 13 Other 0 0 0 0 0 0 10 0 0 0 0
Total 100 100 100 100 100 100 100 100 100 100 100 Count (n) (71) (47) (77) (77) (14) (7) (10) (21) (27) (90) (441)
Question 6: When did you start seeking a job?
About 13 percent of the respondents did not seek employment. The largest number (70 percent) of those who did not seek employment were from Nursing and 48 percent from education. Graduates from these fields are normally employed by the government and therefore do not struggle to get a job.
Duration of Seeking Employment and Number of Contacts The study revealed that in all fields, on average, it took about four
months after graduation to secure a job (see Table 6). In education, the average duration was about two months while Public Administration graduates took on average six months representing the longest period before securing a job after graduation.
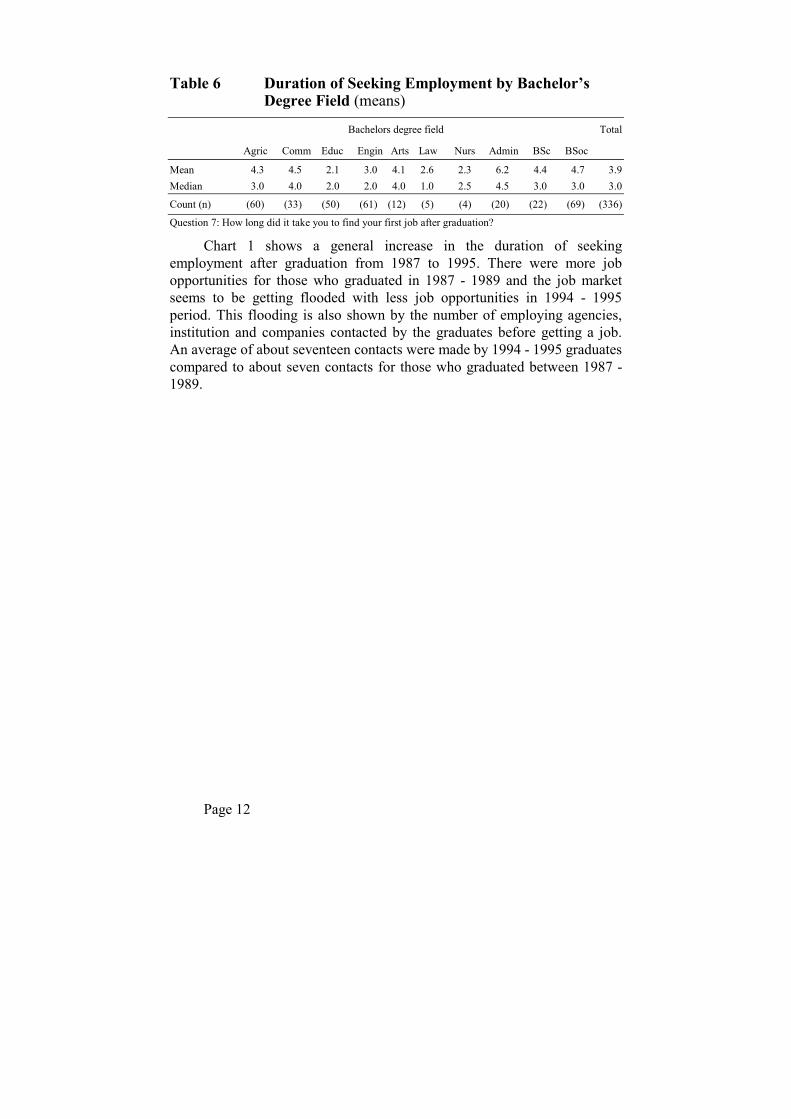
Page 12
Table 6 Duration of Seeking Employment by Bachelor’s Degree Field (means)
Bachelors degree field Total
Agric Comm Educ Engin Arts Law Nurs Admin BSc BSoc
Mean 4.3 4.5 2.1 3.0 4.1 2.6 2.3 6.2 4.4 4.7 3.9 Median 3.0 4.0 2.0 2.0 4.0 1.0 2.5 4.5 3.0 3.0 3.0
Count (n) (60) (33) (50) (61) (12) (5) (4) (20) (22) (69) (336)
Question 7: How long did it take you to find your first job after graduation?
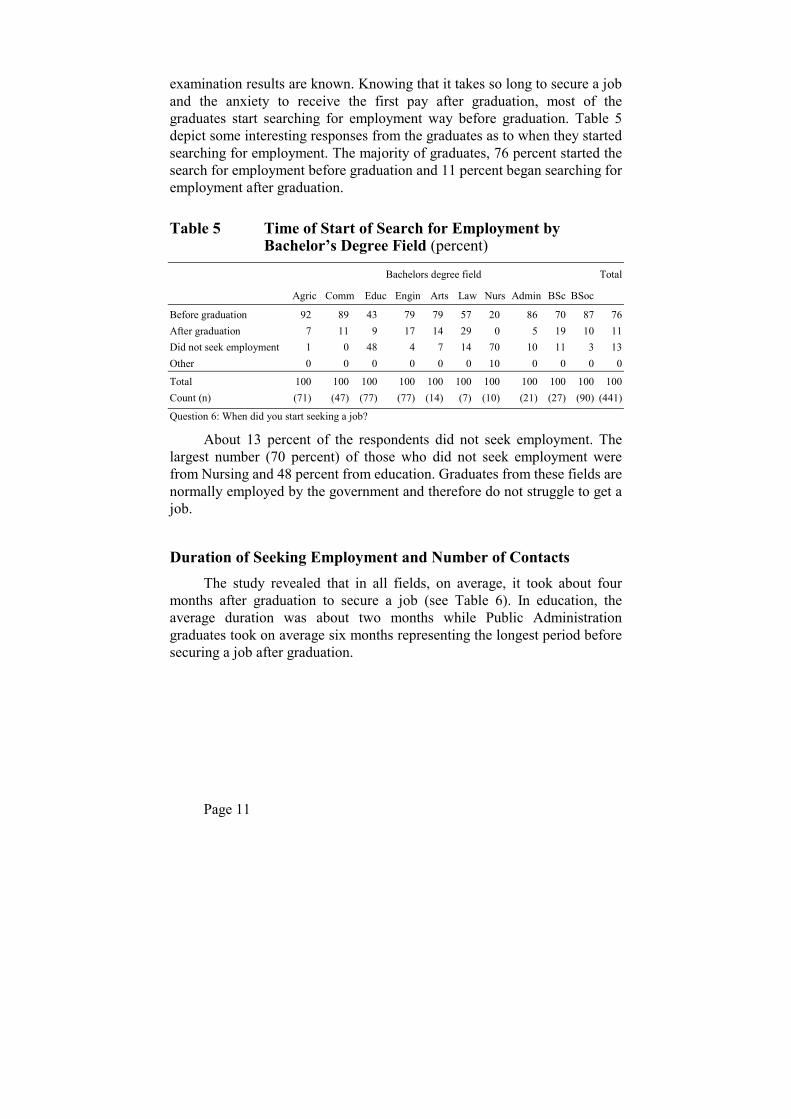
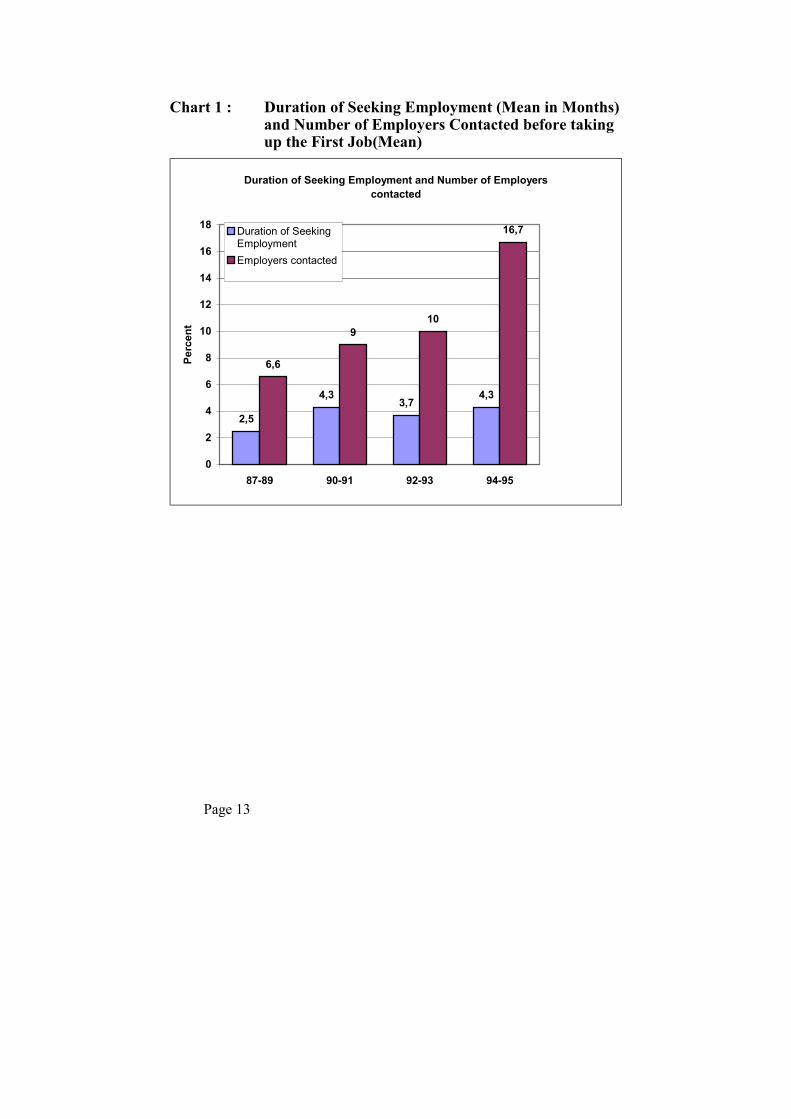
Chart 1 shows a general increase in the duration of seeking employment after graduation from 1987 to 1995. There were more job opportunities for those who graduated in 1987 - 1989 and the job market seems to be getting flooded with less job opportunities in 1994 - 1995 period. This flooding is also shown by the number of employing agencies, institution and companies contacted by the graduates before getting a job. An average of about seventeen contacts were made by 1994 - 1995 graduates compared to about seven contacts for those who graduated between 1987 - 1989.
Page 13
Chart 1 : Duration of Seeking Employment (Mean in Months) and Number of Employers Contacted before taking up the First Job(Mean)
Duration of Seeking Employment and Number of Employers contacted
2,5
4,33,7
4,3
6,6
910
16,7
0
2
4
6
8
10
12
14
16
18
87-89 90-91 92-93 94-95
Perc
ent
Duration of SeekingEmploymentEmployers contacted
Page 14
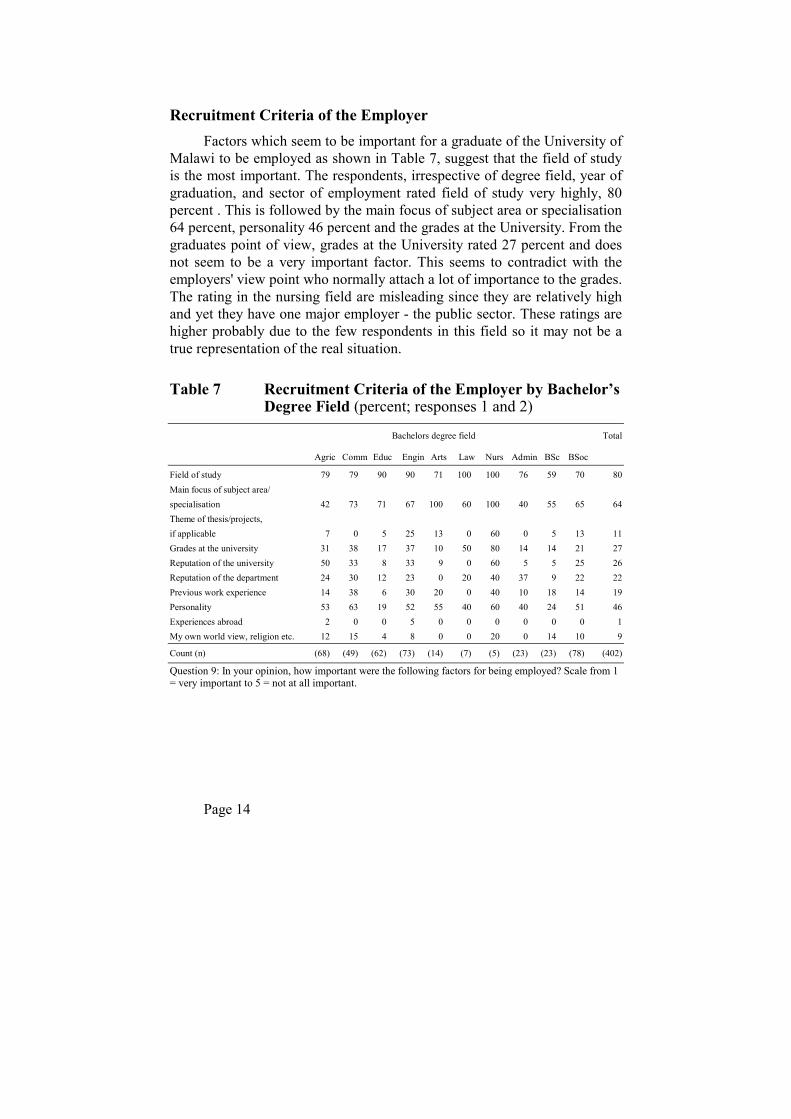
Recruitment Criteria of the Employer Factors which seem to be important for a graduate of the University of
Malawi to be employed as shown in Table 7, suggest that the field of study is the most important. The respondents, irrespective of degree field, year of graduation, and sector of employment rated field of study very highly, 80 percent . This is followed by the main focus of subject area or specialisation 64 percent, personality 46 percent and the grades at the University. From the graduates point of view, grades at the University rated 27 percent and does not seem to be a very important factor. This seems to contradict with the employers' view point who normally attach a lot of importance to the grades. The rating in the nursing field are misleading since they are relatively high and yet they have one major employer - the public sector. These ratings are higher probably due to the few respondents in this field so it may not be a true representation of the real situation.
Table 7 Recruitment Criteria of the Employer by Bachelor’s Degree Field (percent; responses 1 and 2)
Bachelors degree field Total
Agric Comm Educ Engin Arts Law Nurs Admin BSc BSoc
Field of study 79 79 90 90 71 100 100 76 59 70 80 Main focus of subject area/ specialisation 42 73 71 67 100 60 100 40 55 65 64 Theme of thesis/projects, if applicable 7 0 5 25 13 0 60 0 5 13 11 Grades at the university 31 38 17 37 10 50 80 14 14 21 27 Reputation of the university 50 33 8 33 9 0 60 5 5 25 26 Reputation of the department 24 30 12 23 0 20 40 37 9 22 22 Previous work experience 14 38 6 30 20 0 40 10 18 14 19 Personality 53 63 19 52 55 40 60 40 24 51 46 Experiences abroad 2 0 0 5 0 0 0 0 0 0 1 My own world view, religion etc. 12 15 4 8 0 0 20 0 14 10 9
Count (n) (68) (49) (62) (73) (14) (7) (5) (23) (23) (78) (402)
Question 9: In your opinion, how important were the following factors for being employed? Scale from 1 = very important to 5 = not at all important.
Page 15
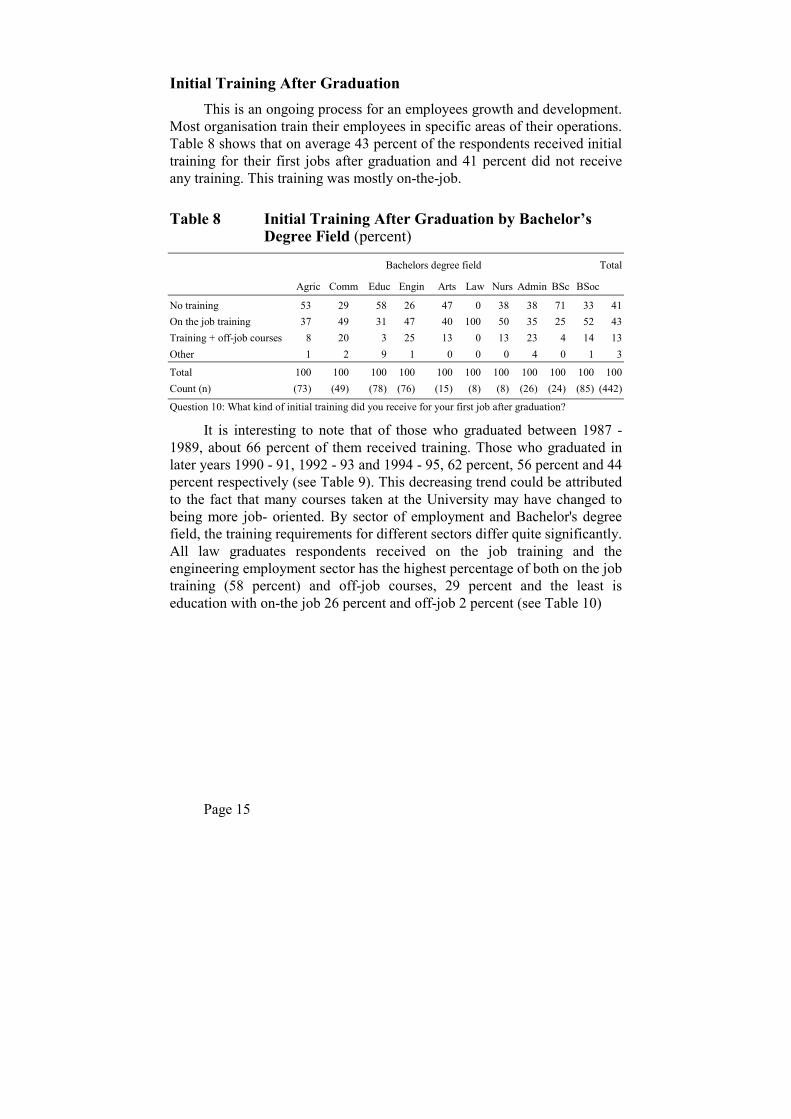
Initial Training After Graduation This is an ongoing process for an employees growth and development.
Most organisation train their employees in specific areas of their operations. Table 8 shows that on average 43 percent of the respondents received initial training for their first jobs after graduation and 41 percent did not receive any training. This training was mostly on-the-job.
Table 8 Initial Training After Graduation by Bachelor’s Degree Field (percent)
Bachelors degree field Total
Agric Comm Educ Engin Arts Law Nurs Admin BSc BSoc
No training 53 29 58 26 47 0 38 38 71 33 41 On the job training 37 49 31 47 40 100 50 35 25 52 43 Training + off-job courses 8 20 3 25 13 0 13 23 4 14 13 Other 1 2 9 1 0 0 0 4 0 1 3
Total 100 100 100 100 100 100 100 100 100 100 100 Count (n) (73) (49) (78) (76) (15) (8) (8) (26) (24) (85) (442)
Question 10: What kind of initial training did you receive for your first job after graduation?
It is interesting to note that of those who graduated between 1987 - 1989, about 66 percent of them received training. Those who graduated in later years 1990 - 91, 1992 - 93 and 1994 - 95, 62 percent, 56 percent and 44 percent respectively (see Table 9). This decreasing trend could be attributed to the fact that many courses taken at the University may have changed to being more job- oriented. By sector of employment and Bachelor's degree field, the training requirements for different sectors differ quite significantly. All law graduates respondents received on the job training and the engineering employment sector has the highest percentage of both on the job training (58 percent) and off-job courses, 29 percent and the least is education with on-the job 26 percent and off-job 2 percent (see Table 10)
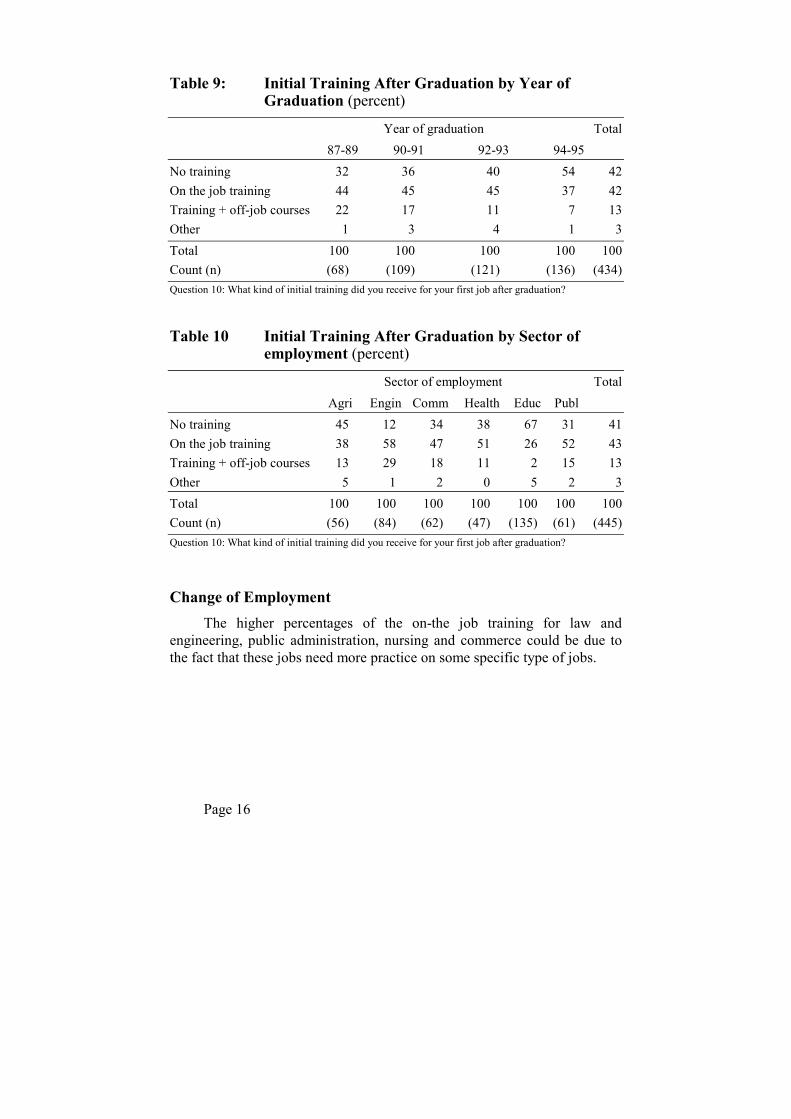
Page 16
Table 9: Initial Training After Graduation by Year of Graduation (percent)
Year of graduation Total 87-89 90-91 92-93 94-95
No training 32 36 40 54 42 On the job training 44 45 45 37 42 Training + off-job courses 22 17 11 7 13 Other 1 3 4 1 3 Total 100 100 100 100 100 Count (n) (68) (109) (121) (136) (434) Question 10: What kind of initial training did you receive for your first job after graduation?
Table 10 Initial Training After Graduation by Sector of employment (percent)
Sector of employment Total Agri Engin Comm Health Educ Publ
No training 45 12 34 38 67 31 41 On the job training 38 58 47 51 26 52 43 Training + off-job courses 13 29 18 11 2 15 13 Other 5 1 2 0 5 2 3 Total 100 100 100 100 100 100 100 Count (n) (56) (84) (62) (47) (135) (61) (445) Question 10: What kind of initial training did you receive for your first job after graduation?
Change of Employment The higher percentages of the on-the job training for law and
engineering, public administration, nursing and commerce could be due to the fact that these jobs need more practice on some specific type of jobs.

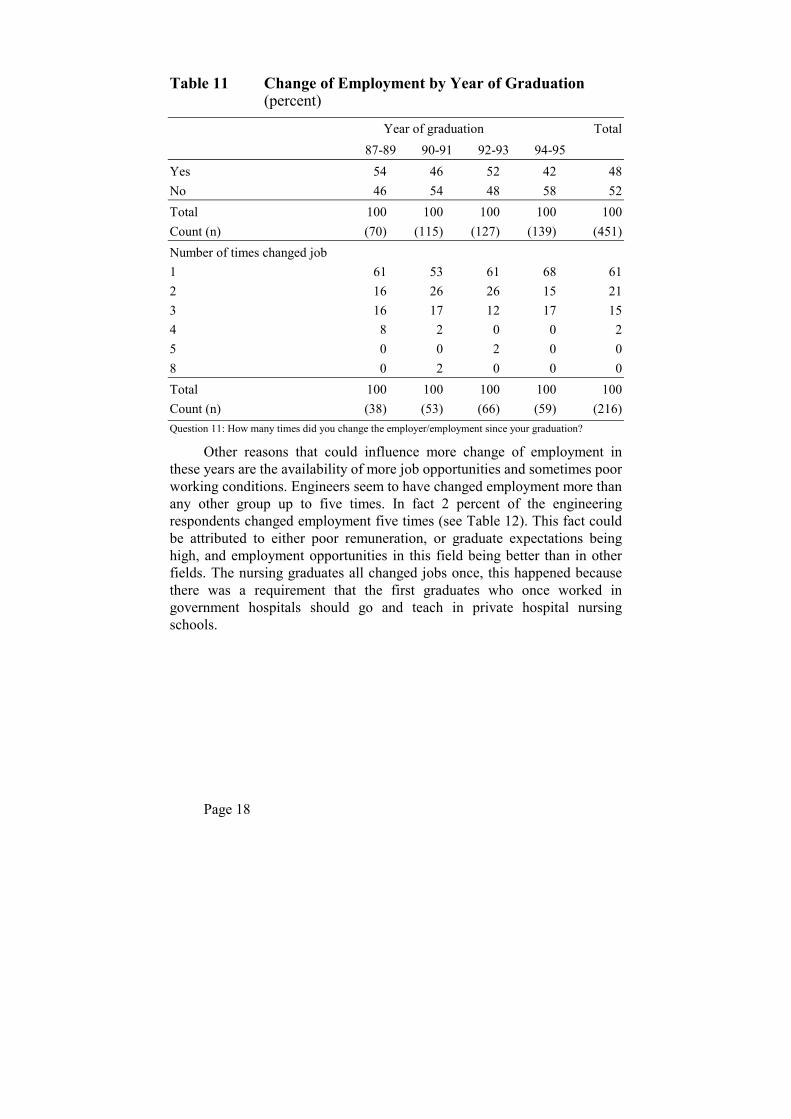
Page 17
Nearly 50 percent of the respondents have changed jobs and the remaining 50 percent have not changed jobs as yet. Table 11 shows that at least about 97 percent of the cohorts have changed jobs from one to three times. Those who graduated between 1987 and 1989, it is shown that an average 54 percent have changed jobs. On the other hand, of those who graduated between 1994 and 1995, 42 percent have changed jobs. It seems changing of job among other things is a function of time. Since the 1987 - 1989 graduates have stayed for a longer time in employment they have had more opportunity to make cross-over.
Page 18
Table 11 Change of Employment by Year of Graduation (percent)
Year of graduation Total 87-89 90-91 92-93 94-95
Yes 54 46 52 42 48 No 46 54 48 58 52 Total 100 100 100 100 100 Count (n) (70) (115) (127) (139) (451) Number of times changed job 1 61 53 61 68 61 2 16 26 26 15 21 3 16 17 12 17 15 4 8 2 0 0 2 5 0 0 2 0 0 8 0 2 0 0 0 Total 100 100 100 100 100 Count (n) (38) (53) (66) (59) (216) Question 11: How many times did you change the employer/employment since your graduation?
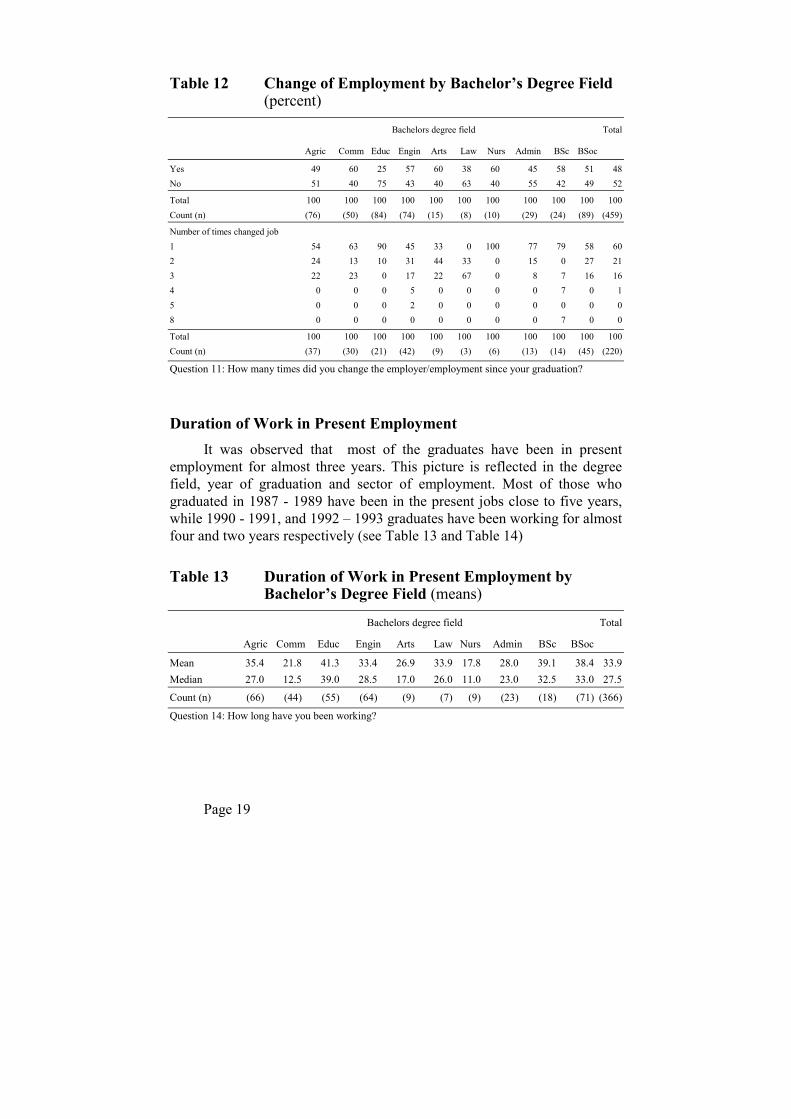
Other reasons that could influence more change of employment in these years are the availability of more job opportunities and sometimes poor working conditions. Engineers seem to have changed employment more than any other group up to five times. In fact 2 percent of the engineering respondents changed employment five times (see Table 12). This fact could be attributed to either poor remuneration, or graduate expectations being high, and employment opportunities in this field being better than in other fields. The nursing graduates all changed jobs once, this happened because there was a requirement that the first graduates who once worked in government hospitals should go and teach in private hospital nursing schools.
Page 19
Table 12 Change of Employment by Bachelor’s Degree Field (percent)
Bachelors degree field Total
Agric Comm Educ Engin Arts Law Nurs Admin BSc BSoc
Yes 49 60 25 57 60 38 60 45 58 51 48 No 51 40 75 43 40 63 40 55 42 49 52
Total 100 100 100 100 100 100 100 100 100 100 100 Count (n) (76) (50) (84) (74) (15) (8) (10) (29) (24) (89) (459)
Number of times changed job 1 54 63 90 45 33 0 100 77 79 58 60 2 24 13 10 31 44 33 0 15 0 27 21 3 22 23 0 17 22 67 0 8 7 16 16 4 0 0 0 5 0 0 0 0 7 0 1 5 0 0 0 2 0 0 0 0 0 0 0 8 0 0 0 0 0 0 0 0 7 0 0
Total 100 100 100 100 100 100 100 100 100 100 100 Count (n) (37) (30) (21) (42) (9) (3) (6) (13) (14) (45) (220)
Question 11: How many times did you change the employer/employment since your graduation?
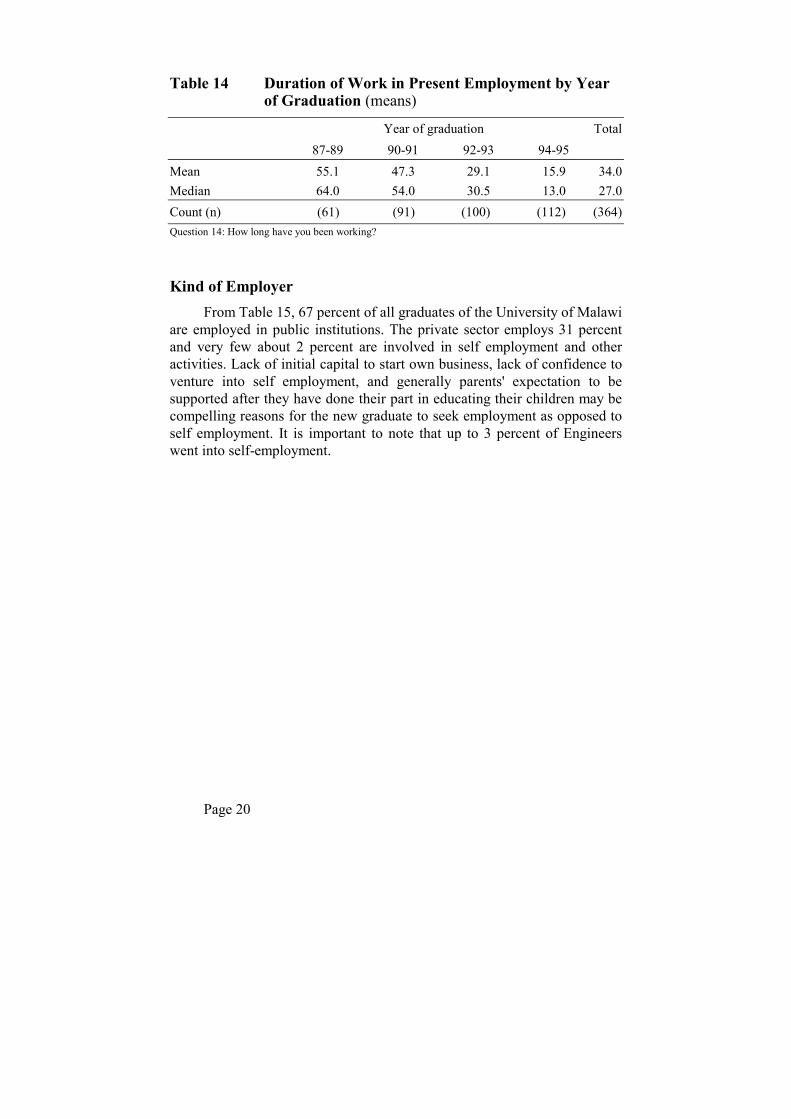
Duration of Work in Present Employment It was observed that most of the graduates have been in present
employment for almost three years. This picture is reflected in the degree field, year of graduation and sector of employment. Most of those who graduated in 1987 - 1989 have been in the present jobs close to five years, while 1990 - 1991, and 1992 – 1993 graduates have been working for almost four and two years respectively (see Table 13 and Table 14)
Table 13 Duration of Work in Present Employment by Bachelor’s Degree Field (means)
Bachelors degree field Total
Agric Comm Educ Engin Arts Law Nurs Admin BSc BSoc
Mean 35.4 21.8 41.3 33.4 26.9 33.9 17.8 28.0 39.1 38.4 33.9 Median 27.0 12.5 39.0 28.5 17.0 26.0 11.0 23.0 32.5 33.0 27.5
Count (n) (66) (44) (55) (64) (9) (7) (9) (23) (18) (71) (366)
Question 14: How long have you been working?
Page 20
Table 14 Duration of Work in Present Employment by Year of Graduation (means)
Year of graduation Total 87-89 90-91 92-93 94-95
Mean 55.1 47.3 29.1 15.9 34.0 Median 64.0 54.0 30.5 13.0 27.0 Count (n) (61) (91) (100) (112) (364) Question 14: How long have you been working?
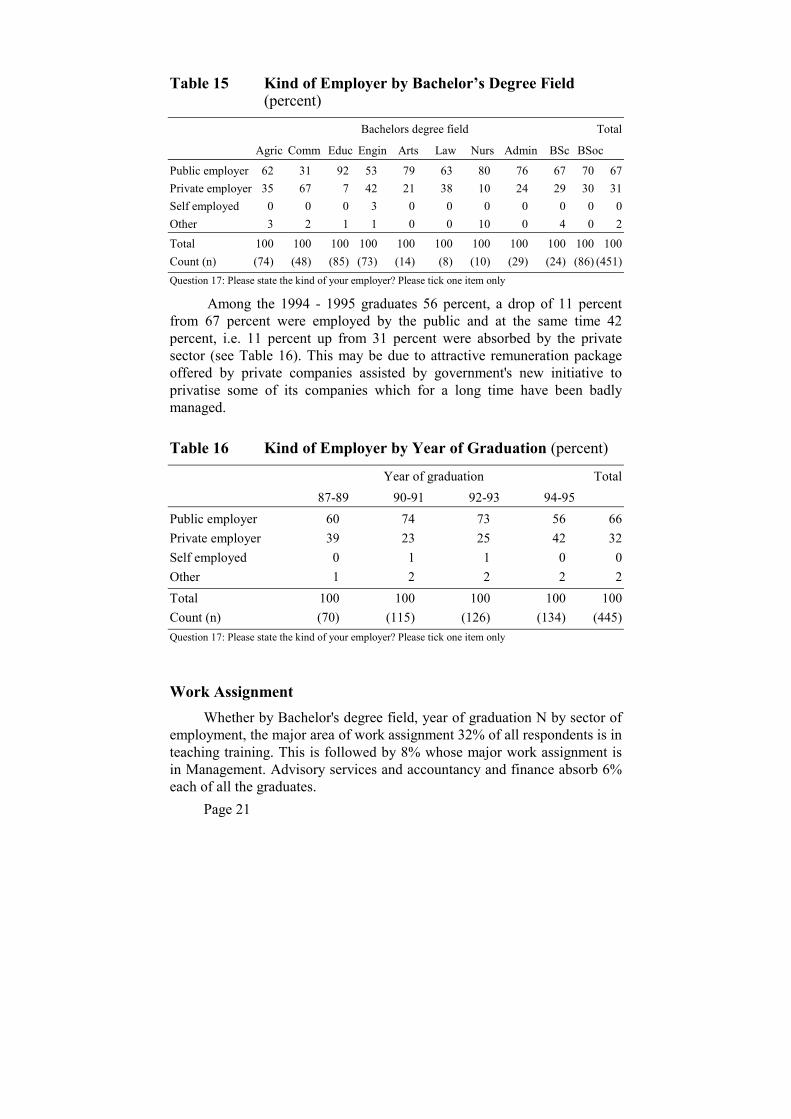
Kind of Employer From Table 15, 67 percent of all graduates of the University of Malawi
are employed in public institutions. The private sector employs 31 percent and very few about 2 percent are involved in self employment and other activities. Lack of initial capital to start own business, lack of confidence to venture into self employment, and generally parents' expectation to be supported after they have done their part in educating their children may be compelling reasons for the new graduate to seek employment as opposed to self employment. It is important to note that up to 3 percent of Engineers went into self-employment.
Page 21
Table 15 Kind of Employer by Bachelor’s Degree Field (percent)
Bachelors degree field Total
Agric Comm Educ Engin Arts Law Nurs Admin BSc BSoc
Public employer 62 31 92 53 79 63 80 76 67 70 67 Private employer 35 67 7 42 21 38 10 24 29 30 31 Self employed 0 0 0 3 0 0 0 0 0 0 0 Other 3 2 1 1 0 0 10 0 4 0 2 Total 100 100 100 100 100 100 100 100 100 100 100 Count (n) (74) (48) (85) (73) (14) (8) (10) (29) (24) (86) (451) Question 17: Please state the kind of your employer? Please tick one item only
Among the 1994 - 1995 graduates 56 percent, a drop of 11 percent from 67 percent were employed by the public and at the same time 42 percent, i.e. 11 percent up from 31 percent were absorbed by the private sector (see Table 16). This may be due to attractive remuneration package offered by private companies assisted by government's new initiative to privatise some of its companies which for a long time have been badly managed.
Table 16 Kind of Employer by Year of Graduation (percent)
Year of graduation Total 87-89 90-91 92-93 94-95
Public employer 60 74 73 56 66 Private employer 39 23 25 42 32 Self employed 0 1 1 0 0 Other 1 2 2 2 2 Total 100 100 100 100 100 Count (n) (70) (115) (126) (134) (445) Question 17: Please state the kind of your employer? Please tick one item only
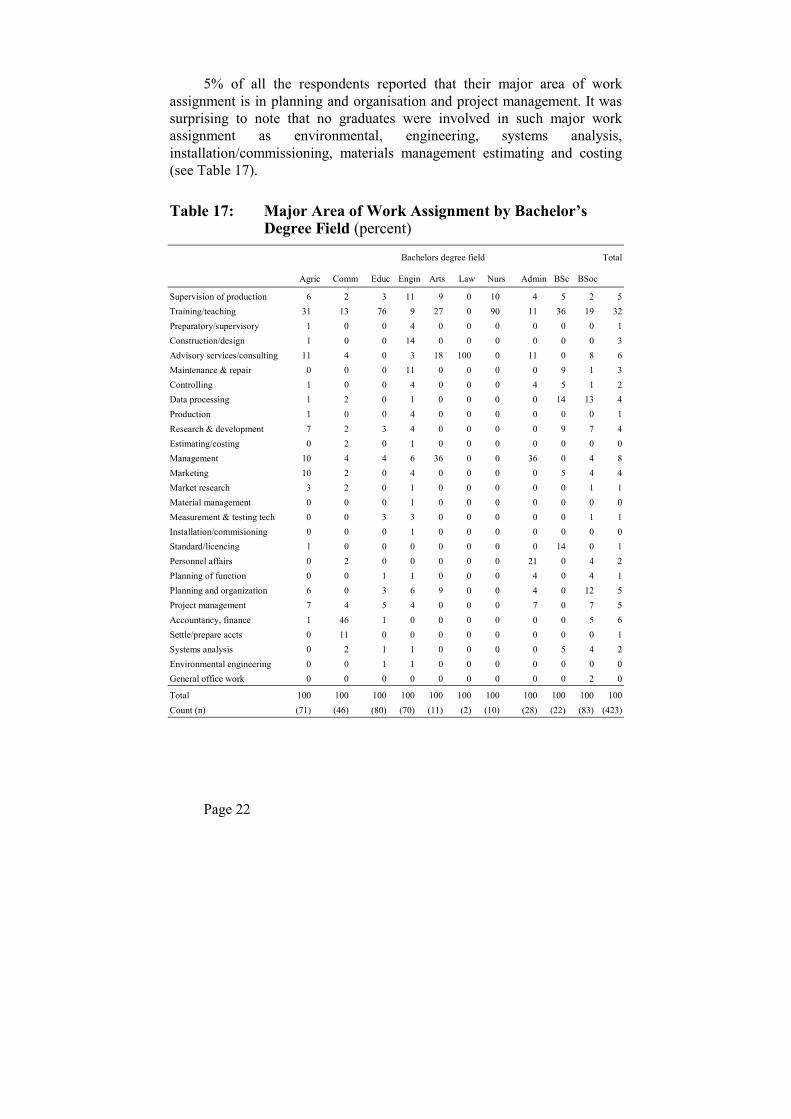
Work Assignment Whether by Bachelor's degree field, year of graduation N by sector of
employment, the major area of work assignment 32% of all respondents is in teaching training. This is followed by 8% whose major work assignment is in Management. Advisory services and accountancy and finance absorb 6% each of all the graduates.
Page 22
5% of all the respondents reported that their major area of work assignment is in planning and organisation and project management. It was surprising to note that no graduates were involved in such major work assignment as environmental, engineering, systems analysis, installation/commissioning, materials management estimating and costing (see Table 17).
Table 17: Major Area of Work Assignment by Bachelor’s Degree Field (percent)
Bachelors degree field Total
Agric Comm Educ Engin Arts Law Nurs Admin BSc BSoc
Supervision of production 6 2 3 11 9 0 10 4 5 2 5 Training/teaching 31 13 76 9 27 0 90 11 36 19 32 Preparatory/supervisory 1 0 0 4 0 0 0 0 0 0 1 Construction/design 1 0 0 14 0 0 0 0 0 0 3 Advisory services/consulting 11 4 0 3 18 100 0 11 0 8 6 Maintenance & repair 0 0 0 11 0 0 0 0 9 1 3 Controlling 1 0 0 4 0 0 0 4 5 1 2 Data processing 1 2 0 1 0 0 0 0 14 13 4 Production 1 0 0 4 0 0 0 0 0 0 1 Research & development 7 2 3 4 0 0 0 0 9 7 4 Estimating/costing 0 2 0 1 0 0 0 0 0 0 0 Management 10 4 4 6 36 0 0 36 0 4 8 Marketing 10 2 0 4 0 0 0 0 5 4 4 Market research 3 2 0 1 0 0 0 0 0 1 1 Material management 0 0 0 1 0 0 0 0 0 0 0 Measurement & testing tech 0 0 3 3 0 0 0 0 0 1 1 Installation/commisioning 0 0 0 1 0 0 0 0 0 0 0 Standard/licencing 1 0 0 0 0 0 0 0 14 0 1 Personnel affairs 0 2 0 0 0 0 0 21 0 4 2 Planning of function 0 0 1 1 0 0 0 4 0 4 1 Planning and organization 6 0 3 6 9 0 0 4 0 12 5 Project management 7 4 5 4 0 0 0 7 0 7 5 Accountancy, finance 1 46 1 0 0 0 0 0 0 5 6 Settle/prepare accts 0 11 0 0 0 0 0 0 0 0 1 Systems analysis 0 2 1 1 0 0 0 0 5 4 2 Environmental engineering 0 0 1 1 0 0 0 0 0 0 0 General office work 0 0 0 0 0 0 0 0 0 2 0
Total 100 100 100 100 100 100 100 100 100 100 100 Count (n) (71) (46) (80) (70) (11) (2) (10) (28) (22) (83) (423)
Page 23
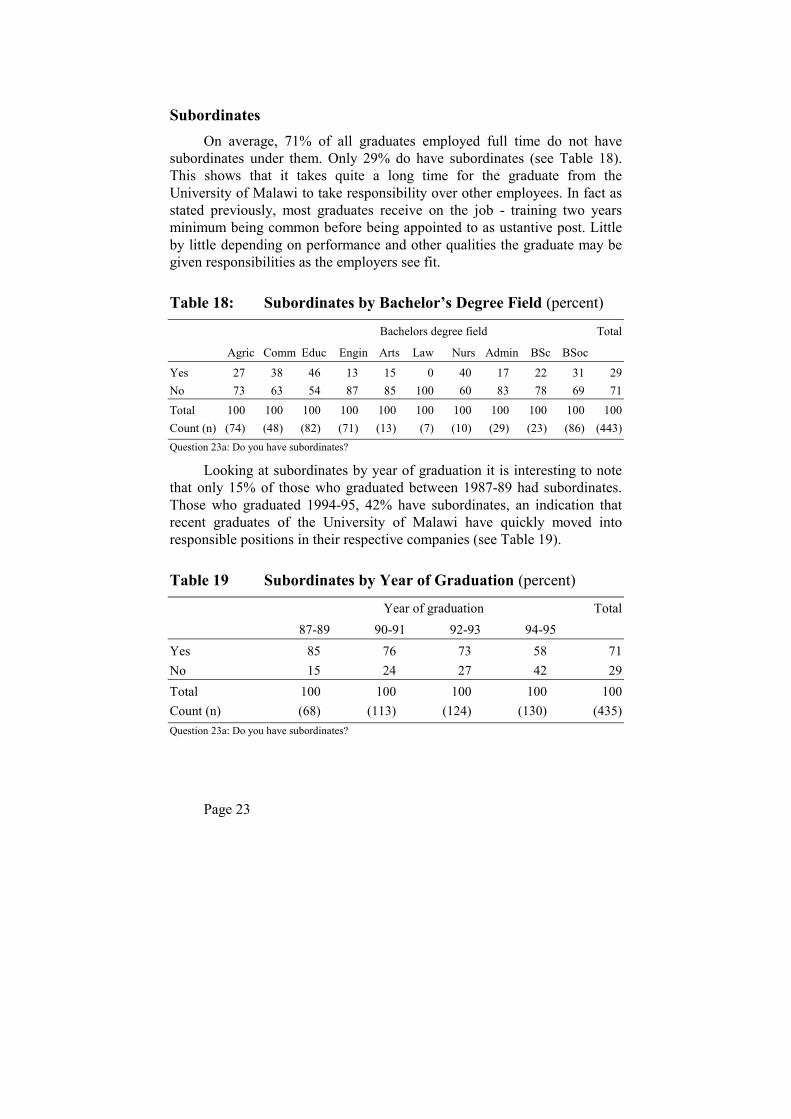
Subordinates On average, 71% of all graduates employed full time do not have
subordinates under them. Only 29% do have subordinates (see Table 18). This shows that it takes quite a long time for the graduate from the University of Malawi to take responsibility over other employees. In fact as stated previously, most graduates receive on the job - training two years minimum being common before being appointed to as ustantive post. Little by little depending on performance and other qualities the graduate may be given responsibilities as the employers see fit.
Table 18: Subordinates by Bachelor’s Degree Field (percent)
Bachelors degree field Total
Agric Comm Educ Engin Arts Law Nurs Admin BSc BSoc
Yes 27 38 46 13 15 0 40 17 22 31 29 No 73 63 54 87 85 100 60 83 78 69 71 Total 100 100 100 100 100 100 100 100 100 100 100 Count (n) (74) (48) (82) (71) (13) (7) (10) (29) (23) (86) (443) Question 23a: Do you have subordinates?
Looking at subordinates by year of graduation it is interesting to note that only 15% of those who graduated between 1987-89 had subordinates. Those who graduated 1994-95, 42% have subordinates, an indication that recent graduates of the University of Malawi have quickly moved into responsible positions in their respective companies (see Table 19).
Table 19 Subordinates by Year of Graduation (percent)
Year of graduation Total 87-89 90-91 92-93 94-95
Yes 85 76 73 58 71 No 15 24 27 42 29 Total 100 100 100 100 100 Count (n) (68) (113) (124) (130) (435) Question 23a: Do you have subordinates?
Page 24
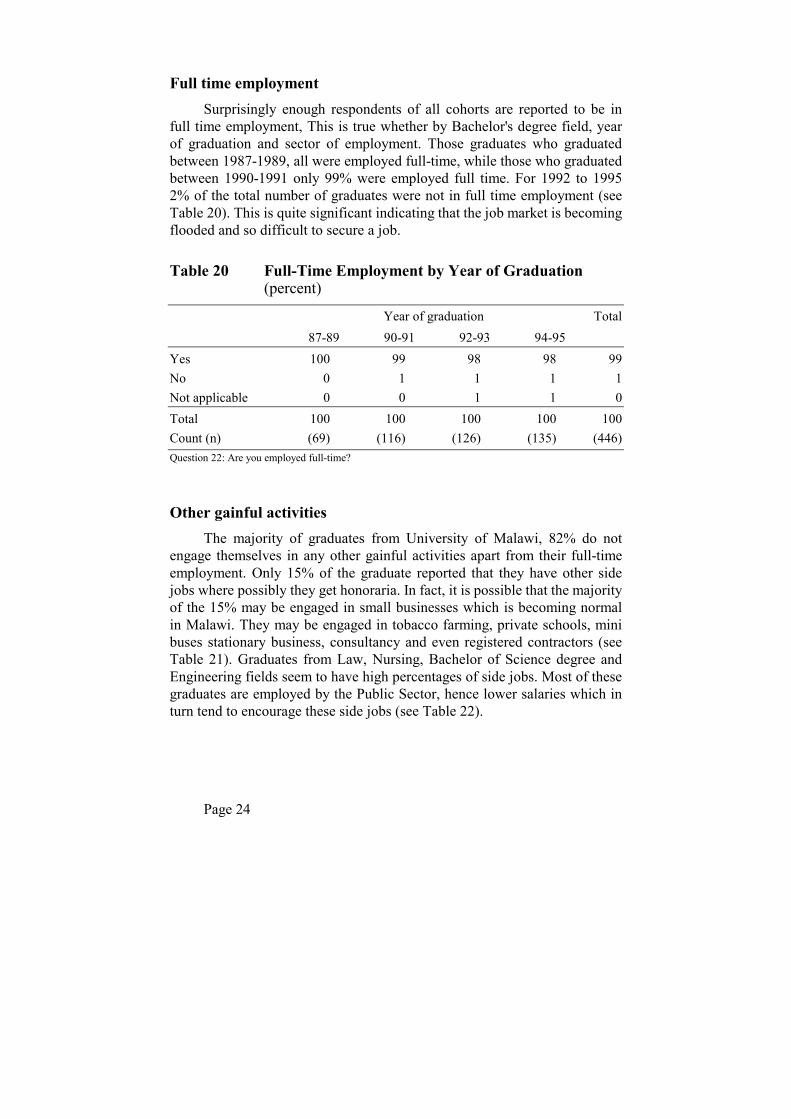
Full time employment Surprisingly enough respondents of all cohorts are reported to be in
full time employment, This is true whether by Bachelor's degree field, year of graduation and sector of employment. Those graduates who graduated between 1987-1989, all were employed full-time, while those who graduated between 1990-1991 only 99% were employed full time. For 1992 to 1995 2% of the total number of graduates were not in full time employment (see Table 20). This is quite significant indicating that the job market is becoming flooded and so difficult to secure a job.
Table 20 Full-Time Employment by Year of Graduation (percent)
Year of graduation Total 87-89 90-91 92-93 94-95
Yes 100 99 98 98 99 No 0 1 1 1 1 Not applicable 0 0 1 1 0 Total 100 100 100 100 100 Count (n) (69) (116) (126) (135) (446) Question 22: Are you employed full-time?
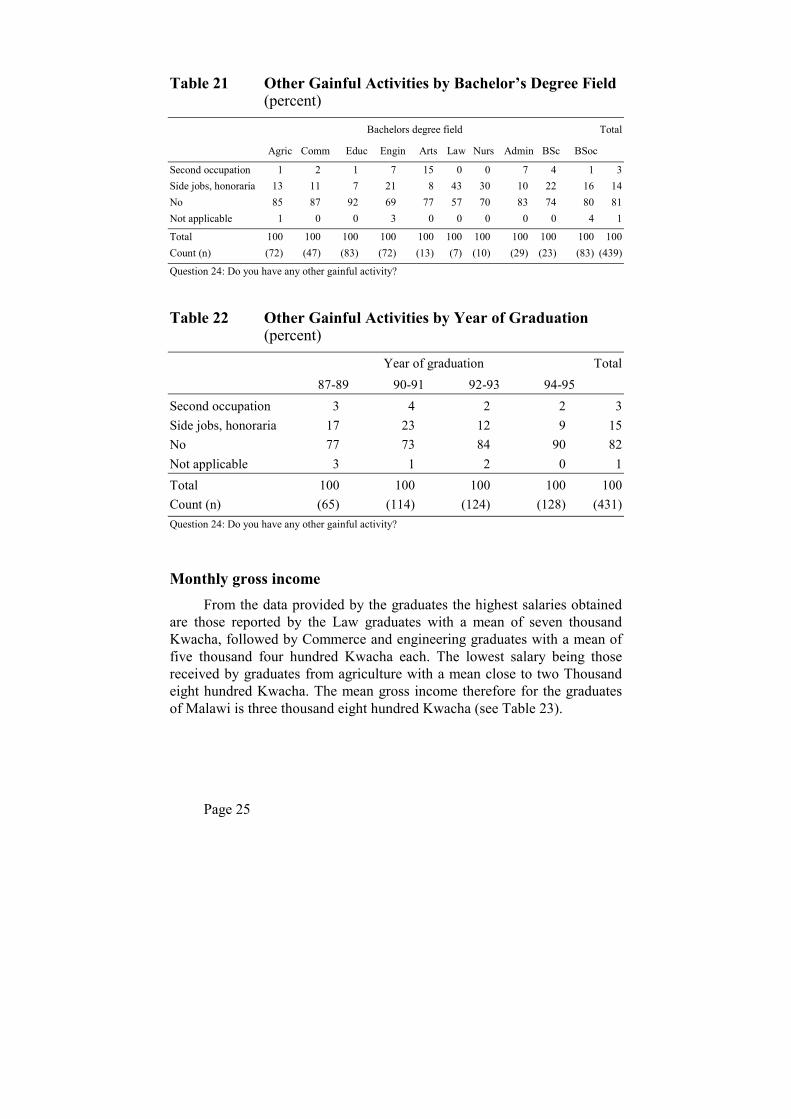
Other gainful activities The majority of graduates from University of Malawi, 82% do not
engage themselves in any other gainful activities apart from their full-time employment. Only 15% of the graduate reported that they have other side jobs where possibly they get honoraria. In fact, it is possible that the majority of the 15% may be engaged in small businesses which is becoming normal in Malawi. They may be engaged in tobacco farming, private schools, mini buses stationary business, consultancy and even registered contractors (see Table 21). Graduates from Law, Nursing, Bachelor of Science degree and Engineering fields seem to have high percentages of side jobs. Most of these graduates are employed by the Public Sector, hence lower salaries which in turn tend to encourage these side jobs (see Table 22).
Page 25
Table 21 Other Gainful Activities by Bachelor’s Degree Field (percent)
Bachelors degree field Total
Agric Comm Educ Engin Arts Law Nurs Admin BSc BSoc
Second occupation 1 2 1 7 15 0 0 7 4 1 3 Side jobs, honoraria 13 11 7 21 8 43 30 10 22 16 14 No 85 87 92 69 77 57 70 83 74 80 81 Not applicable 1 0 0 3 0 0 0 0 0 4 1
Total 100 100 100 100 100 100 100 100 100 100 100 Count (n) (72) (47) (83) (72) (13) (7) (10) (29) (23) (83) (439)
Question 24: Do you have any other gainful activity?
Table 22 Other Gainful Activities by Year of Graduation (percent)
Year of graduation Total 87-89 90-91 92-93 94-95
Second occupation 3 4 2 2 3 Side jobs, honoraria 17 23 12 9 15 No 77 73 84 90 82 Not applicable 3 1 2 0 1 Total 100 100 100 100 100 Count (n) (65) (114) (124) (128) (431) Question 24: Do you have any other gainful activity?
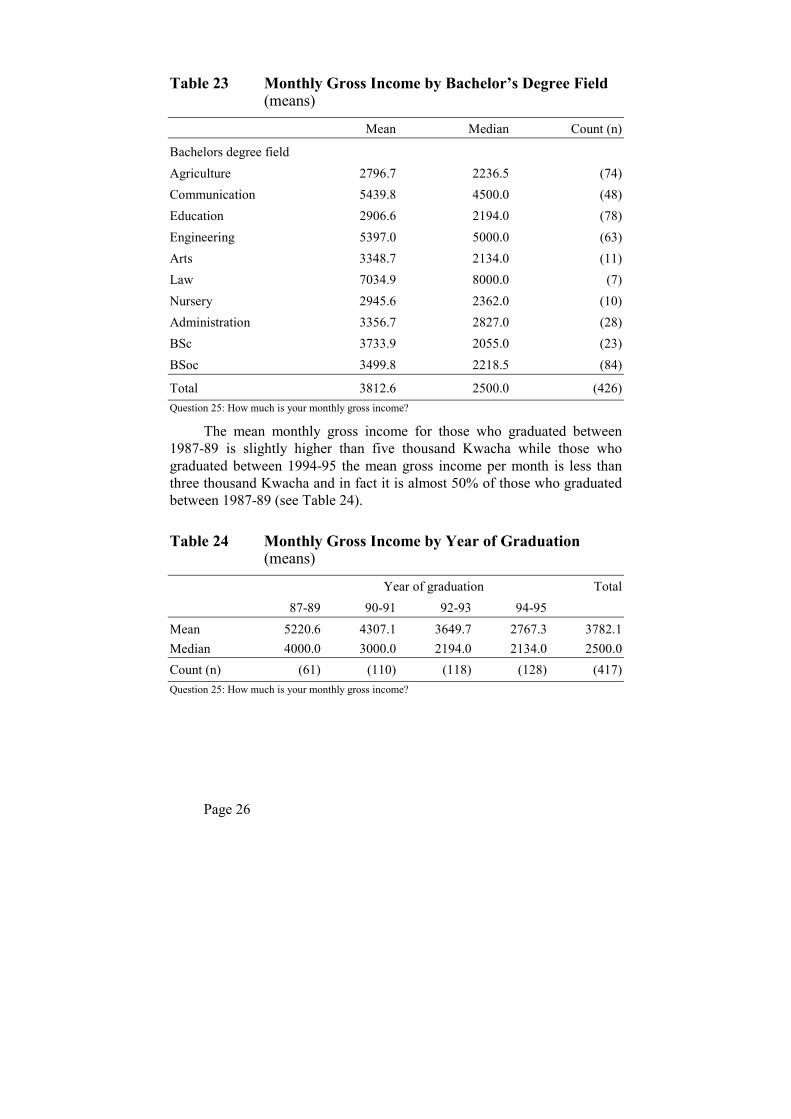
Monthly gross income From the data provided by the graduates the highest salaries obtained
are those reported by the Law graduates with a mean of seven thousand Kwacha, followed by Commerce and engineering graduates with a mean of five thousand four hundred Kwacha each. The lowest salary being those received by graduates from agriculture with a mean close to two Thousand eight hundred Kwacha. The mean gross income therefore for the graduates of Malawi is three thousand eight hundred Kwacha (see Table 23).
Page 26
Table 23 Monthly Gross Income by Bachelor’s Degree Field (means)
Mean Median Count (n)
Bachelors degree field Agriculture 2796.7 2236.5 (74) Communication 5439.8 4500.0 (48) Education 2906.6 2194.0 (78) Engineering 5397.0 5000.0 (63) Arts 3348.7 2134.0 (11) Law 7034.9 8000.0 (7) Nursery 2945.6 2362.0 (10) Administration 3356.7 2827.0 (28) BSc 3733.9 2055.0 (23) BSoc 3499.8 2218.5 (84)
Total 3812.6 2500.0 (426) Question 25: How much is your monthly gross income?
The mean monthly gross income for those who graduated between 1987-89 is slightly higher than five thousand Kwacha while those who graduated between 1994-95 the mean gross income per month is less than three thousand Kwacha and in fact it is almost 50% of those who graduated between 1987-89 (see Table 24).
Table 24 Monthly Gross Income by Year of Graduation (means)
Year of graduation Total 87-89 90-91 92-93 94-95
Mean 5220.6 4307.1 3649.7 2767.3 3782.1 Median 4000.0 3000.0 2194.0 2134.0 2500.0 Count (n) (61) (110) (118) (128) (417) Question 25: How much is your monthly gross income?
Page 27
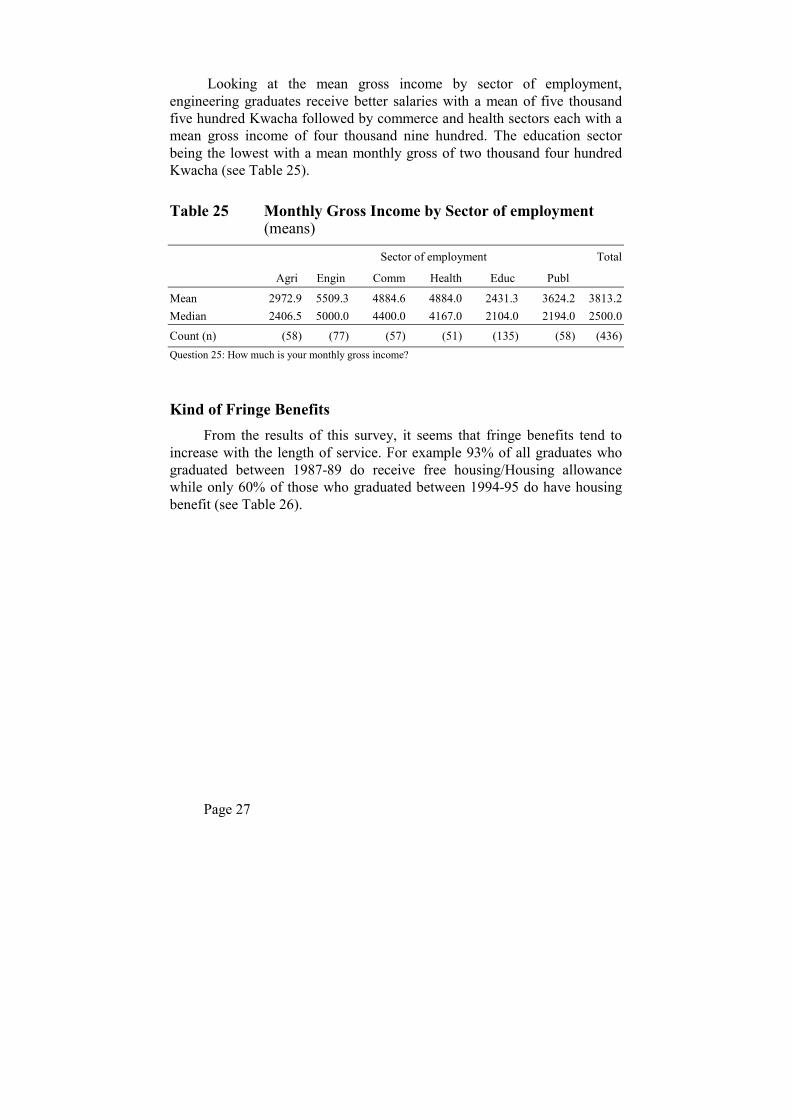
Looking at the mean gross income by sector of employment, engineering graduates receive better salaries with a mean of five thousand five hundred Kwacha followed by commerce and health sectors each with a mean gross income of four thousand nine hundred. The education sector being the lowest with a mean monthly gross of two thousand four hundred Kwacha (see Table 25).
Table 25 Monthly Gross Income by Sector of employment (means)
Sector of employment Total
Agri Engin Comm Health Educ Publ
Mean 2972.9 5509.3 4884.6 4884.0 2431.3 3624.2 3813.2 Median 2406.5 5000.0 4400.0 4167.0 2104.0 2194.0 2500.0
Count (n) (58) (77) (57) (51) (135) (58) (436) Question 25: How much is your monthly gross income?
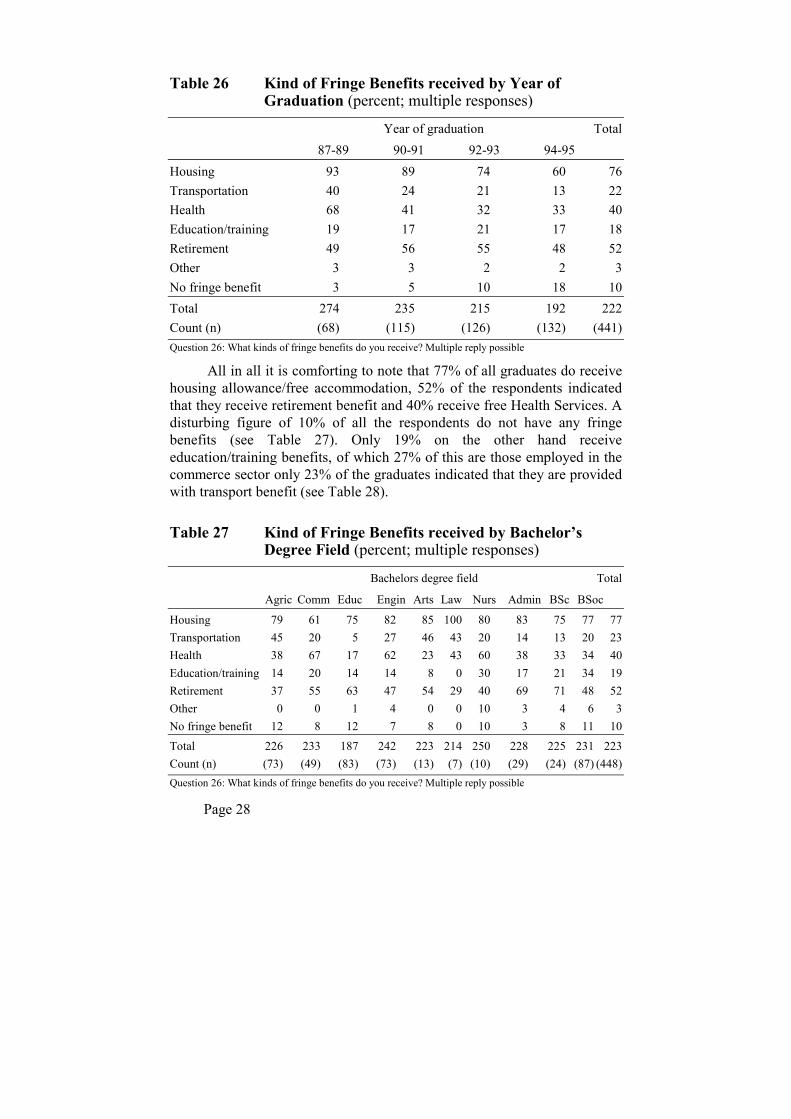
Kind of Fringe Benefits From the results of this survey, it seems that fringe benefits tend to
increase with the length of service. For example 93% of all graduates who graduated between 1987-89 do receive free housing/Housing allowance while only 60% of those who graduated between 1994-95 do have housing benefit (see Table 26).
Page 28
Table 26 Kind of Fringe Benefits received by Year of Graduation (percent; multiple responses)
Year of graduation Total 87-89 90-91 92-93 94-95
Housing 93 89 74 60 76 Transportation 40 24 21 13 22 Health 68 41 32 33 40 Education/training 19 17 21 17 18 Retirement 49 56 55 48 52 Other 3 3 2 2 3 No fringe benefit 3 5 10 18 10 Total 274 235 215 192 222 Count (n) (68) (115) (126) (132) (441) Question 26: What kinds of fringe benefits do you receive? Multiple reply possible
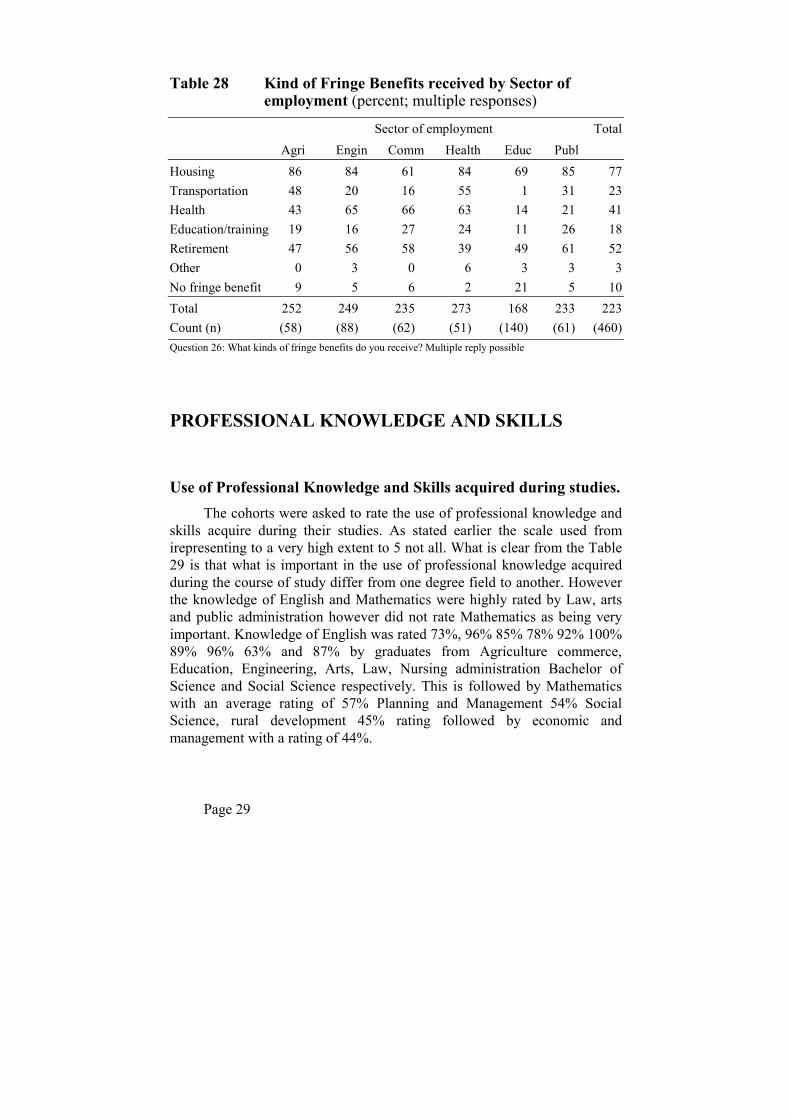
All in all it is comforting to note that 77% of all graduates do receive housing allowance/free accommodation, 52% of the respondents indicated that they receive retirement benefit and 40% receive free Health Services. A disturbing figure of 10% of all the respondents do not have any fringe benefits (see Table 27). Only 19% on the other hand receive education/training benefits, of which 27% of this are those employed in the commerce sector only 23% of the graduates indicated that they are provided with transport benefit (see Table 28).
Table 27 Kind of Fringe Benefits received by Bachelor’s Degree Field (percent; multiple responses)
Bachelors degree field Total
Agric Comm Educ Engin Arts Law Nurs Admin BSc BSoc
Housing 79 61 75 82 85 100 80 83 75 77 77 Transportation 45 20 5 27 46 43 20 14 13 20 23 Health 38 67 17 62 23 43 60 38 33 34 40 Education/training 14 20 14 14 8 0 30 17 21 34 19 Retirement 37 55 63 47 54 29 40 69 71 48 52 Other 0 0 1 4 0 0 10 3 4 6 3 No fringe benefit 12 8 12 7 8 0 10 3 8 11 10
Total 226 233 187 242 223 214 250 228 225 231 223 Count (n) (73) (49) (83) (73) (13) (7) (10) (29) (24) (87) (448) Question 26: What kinds of fringe benefits do you receive? Multiple reply possible
Page 29
Table 28 Kind of Fringe Benefits received by Sector of employment (percent; multiple responses)
Sector of employment Total Agri Engin Comm Health Educ Publ
Housing 86 84 61 84 69 85 77 Transportation 48 20 16 55 1 31 23 Health 43 65 66 63 14 21 41 Education/training 19 16 27 24 11 26 18 Retirement 47 56 58 39 49 61 52 Other 0 3 0 6 3 3 3 No fringe benefit 9 5 6 2 21 5 10 Total 252 249 235 273 168 233 223 Count (n) (58) (88) (62) (51) (140) (61) (460) Question 26: What kinds of fringe benefits do you receive? Multiple reply possible
PROFESSIONAL KNOWLEDGE AND SKILLS
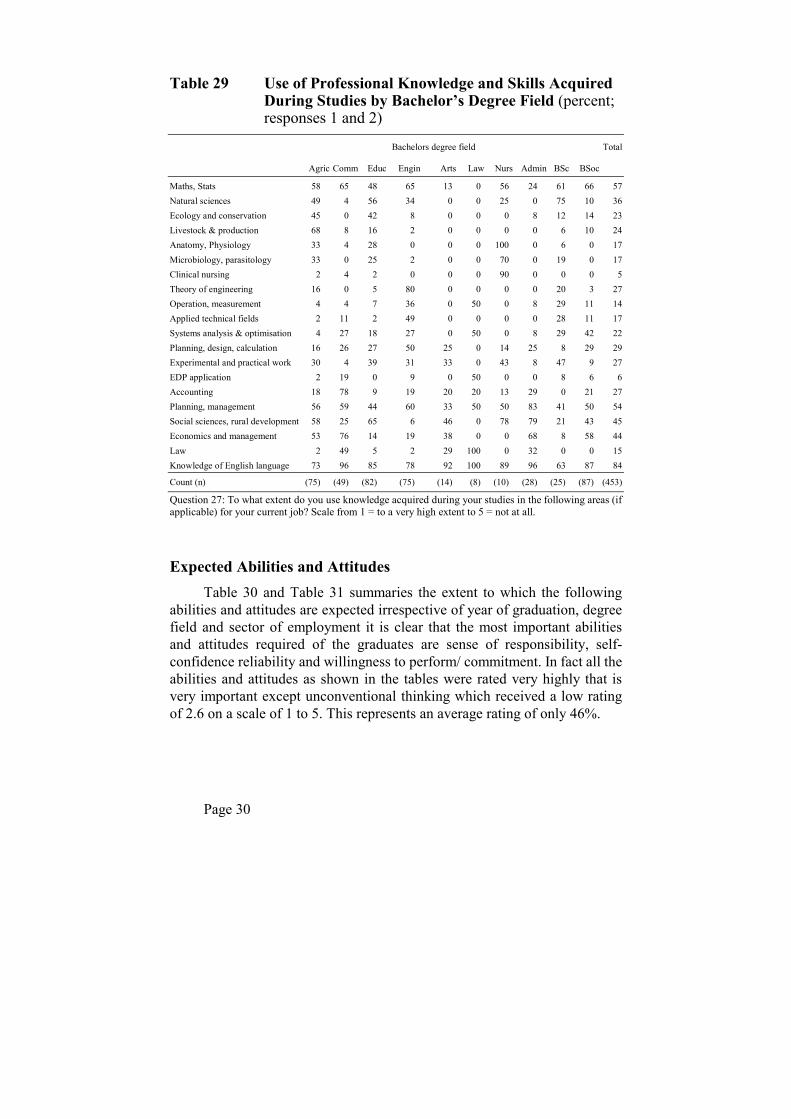
Use of Professional Knowledge and Skills acquired during studies. The cohorts were asked to rate the use of professional knowledge and
skills acquire during their studies. As stated earlier the scale used from irepresenting to a very high extent to 5 not all. What is clear from the Table 29 is that what is important in the use of professional knowledge acquired during the course of study differ from one degree field to another. However the knowledge of English and Mathematics were highly rated by Law, arts and public administration however did not rate Mathematics as being very important. Knowledge of English was rated 73%, 96% 85% 78% 92% 100% 89% 96% 63% and 87% by graduates from Agriculture commerce, Education, Engineering, Arts, Law, Nursing administration Bachelor of Science and Social Science respectively. This is followed by Mathematics with an average rating of 57% Planning and Management 54% Social Science, rural development 45% rating followed by economic and management with a rating of 44%.
Page 30
Table 29 Use of Professional Knowledge and Skills Acquired During Studies by Bachelor’s Degree Field (percent; responses 1 and 2)
Bachelors degree field Total
Agric Comm Educ Engin Arts Law Nurs Admin BSc BSoc
Maths, Stats 58 65 48 65 13 0 56 24 61 66 57 Natural sciences 49 4 56 34 0 0 25 0 75 10 36 Ecology and conservation 45 0 42 8 0 0 0 8 12 14 23 Livestock & production 68 8 16 2 0 0 0 0 6 10 24 Anatomy, Physiology 33 4 28 0 0 0 100 0 6 0 17 Microbiology, parasitology 33 0 25 2 0 0 70 0 19 0 17 Clinical nursing 2 4 2 0 0 0 90 0 0 0 5 Theory of engineering 16 0 5 80 0 0 0 0 20 3 27 Operation, measurement 4 4 7 36 0 50 0 8 29 11 14 Applied technical fields 2 11 2 49 0 0 0 0 28 11 17 Systems analysis & optimisation 4 27 18 27 0 50 0 8 29 42 22 Planning, design, calculation 16 26 27 50 25 0 14 25 8 29 29 Experimental and practical work 30 4 39 31 33 0 43 8 47 9 27 EDP application 2 19 0 9 0 50 0 0 8 6 6 Accounting 18 78 9 19 20 20 13 29 0 21 27 Planning, management 56 59 44 60 33 50 50 83 41 50 54 Social sciences, rural development 58 25 65 6 46 0 78 79 21 43 45 Economics and management 53 76 14 19 38 0 0 68 8 58 44 Law 2 49 5 2 29 100 0 32 0 0 15 Knowledge of English language 73 96 85 78 92 100 89 96 63 87 84
Count (n) (75) (49) (82) (75) (14) (8) (10) (28) (25) (87) (453)
Question 27: To what extent do you use knowledge acquired during your studies in the following areas (if applicable) for your current job? Scale from 1 = to a very high extent to 5 = not at all.
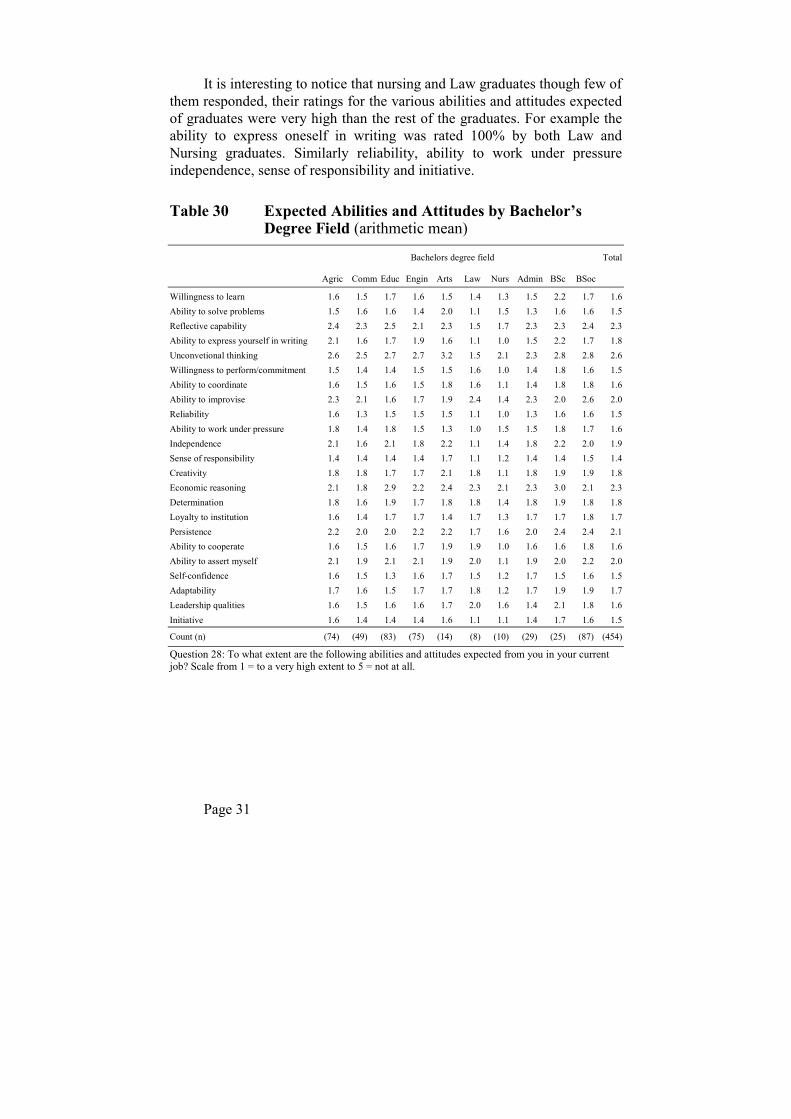
Expected Abilities and Attitudes Table 30 and Table 31 summaries the extent to which the following
abilities and attitudes are expected irrespective of year of graduation, degree field and sector of employment it is clear that the most important abilities and attitudes required of the graduates are sense of responsibility, self-confidence reliability and willingness to perform/ commitment. In fact all the abilities and attitudes as shown in the tables were rated very highly that is very important except unconventional thinking which received a low rating of 2.6 on a scale of 1 to 5. This represents an average rating of only 46%.
Page 31
It is interesting to notice that nursing and Law graduates though few of them responded, their ratings for the various abilities and attitudes expected of graduates were very high than the rest of the graduates. For example the ability to express oneself in writing was rated 100% by both Law and Nursing graduates. Similarly reliability, ability to work under pressure independence, sense of responsibility and initiative.
Table 30 Expected Abilities and Attitudes by Bachelor’s Degree Field (arithmetic mean)
Bachelors degree field Total
Agric Comm Educ Engin Arts Law Nurs Admin BSc BSoc
Willingness to learn 1.6 1.5 1.7 1.6 1.5 1.4 1.3 1.5 2.2 1.7 1.6 Ability to solve problems 1.5 1.6 1.6 1.4 2.0 1.1 1.5 1.3 1.6 1.6 1.5 Reflective capability 2.4 2.3 2.5 2.1 2.3 1.5 1.7 2.3 2.3 2.4 2.3 Ability to express yourself in writing 2.1 1.6 1.7 1.9 1.6 1.1 1.0 1.5 2.2 1.7 1.8 Unconvetional thinking 2.6 2.5 2.7 2.7 3.2 1.5 2.1 2.3 2.8 2.8 2.6 Willingness to perform/commitment 1.5 1.4 1.4 1.5 1.5 1.6 1.0 1.4 1.8 1.6 1.5 Ability to coordinate 1.6 1.5 1.6 1.5 1.8 1.6 1.1 1.4 1.8 1.8 1.6 Ability to improvise 2.3 2.1 1.6 1.7 1.9 2.4 1.4 2.3 2.0 2.6 2.0 Reliability 1.6 1.3 1.5 1.5 1.5 1.1 1.0 1.3 1.6 1.6 1.5 Ability to work under pressure 1.8 1.4 1.8 1.5 1.3 1.0 1.5 1.5 1.8 1.7 1.6 Independence 2.1 1.6 2.1 1.8 2.2 1.1 1.4 1.8 2.2 2.0 1.9 Sense of responsibility 1.4 1.4 1.4 1.4 1.7 1.1 1.2 1.4 1.4 1.5 1.4 Creativity 1.8 1.8 1.7 1.7 2.1 1.8 1.1 1.8 1.9 1.9 1.8 Economic reasoning 2.1 1.8 2.9 2.2 2.4 2.3 2.1 2.3 3.0 2.1 2.3 Determination 1.8 1.6 1.9 1.7 1.8 1.8 1.4 1.8 1.9 1.8 1.8 Loyalty to institution 1.6 1.4 1.7 1.7 1.4 1.7 1.3 1.7 1.7 1.8 1.7 Persistence 2.2 2.0 2.0 2.2 2.2 1.7 1.6 2.0 2.4 2.4 2.1 Ability to cooperate 1.6 1.5 1.6 1.7 1.9 1.9 1.0 1.6 1.6 1.8 1.6 Ability to assert myself 2.1 1.9 2.1 2.1 1.9 2.0 1.1 1.9 2.0 2.2 2.0 Self-confidence 1.6 1.5 1.3 1.6 1.7 1.5 1.2 1.7 1.5 1.6 1.5 Adaptability 1.7 1.6 1.5 1.7 1.7 1.8 1.2 1.7 1.9 1.9 1.7 Leadership qualities 1.6 1.5 1.6 1.6 1.7 2.0 1.6 1.4 2.1 1.8 1.6 Initiative 1.6 1.4 1.4 1.4 1.6 1.1 1.1 1.4 1.7 1.6 1.5
Count (n) (74) (49) (83) (75) (14) (8) (10) (29) (25) (87) (454)
Question 28: To what extent are the following abilities and attitudes expected from you in your current job? Scale from 1 = to a very high extent to 5 = not at all.
Page 32
Table 31 Expected Abilities and Attitudes by Bachelor’s Degree Field (percent; responses 1 and 2)
Bachelors degree field Total
Agric Comm Educ Engin Arts Law Nurs Admin BSc BSoc
Willingness to learn 88 90 85 81 85 88 90 88 64 86 85 Ability to solve problems 92 84 88 92 62 100 90 93 88 85 88 Reflective capability 55 60 50 70 64 100 70 63 57 56 59 Ability to express yourself in writing 65 81 81 75 93 100 100 86 63 80 77 Unconvetional thinking 45 49 42 45 45 83 70 54 38 41 46 Willingness to perform/commitment 87 94 93 90 83 86 100 93 83 87 90 Ability to coordinate 88 90 84 91 85 88 100 93 83 78 86 Ability to improvise 64 67 87 84 75 38 80 61 71 53 70 Reliability 86 98 91 92 92 100 100 93 83 78 89 Ability to work under pressure 78 96 75 89 93 100 90 89 79 81 84 Independence 68 86 67 76 54 100 90 72 58 71 72 Sense of responsibility 92 92 93 93 79 100 100 93 96 90 92 Creativity 80 83 82 80 64 75 100 75 75 71 78 Economic reasoning 72 80 41 56 62 75 70 55 33 66 60 Determination 79 90 75 85 69 88 90 72 71 78 80 Loyalty to institution 85 90 78 79 86 86 90 74 79 78 81 Persistence 64 75 73 58 62 86 80 54 58 55 64 Ability to cooperate 89 94 92 81 71 71 100 82 88 80 86 Ability to assert myself 69 74 71 70 79 75 100 73 70 70 72 Self-confidence 87 90 98 87 77 88 100 83 91 87 89 Adaptability 86 88 90 77 77 75 100 82 71 76 82 Leadership qualities 85 85 83 87 79 75 80 89 67 84 83 Initiative 86 92 93 92 86 100 100 93 83 84 89
Count (n) (74) (49) (83) (75) (14) (8) (10) (29) (25) (87) (454)
Question 28: To what extent are the following abilities and attitudes expected from you in your current job? Scale from 1 = to a very high extent to 5 = not at all.
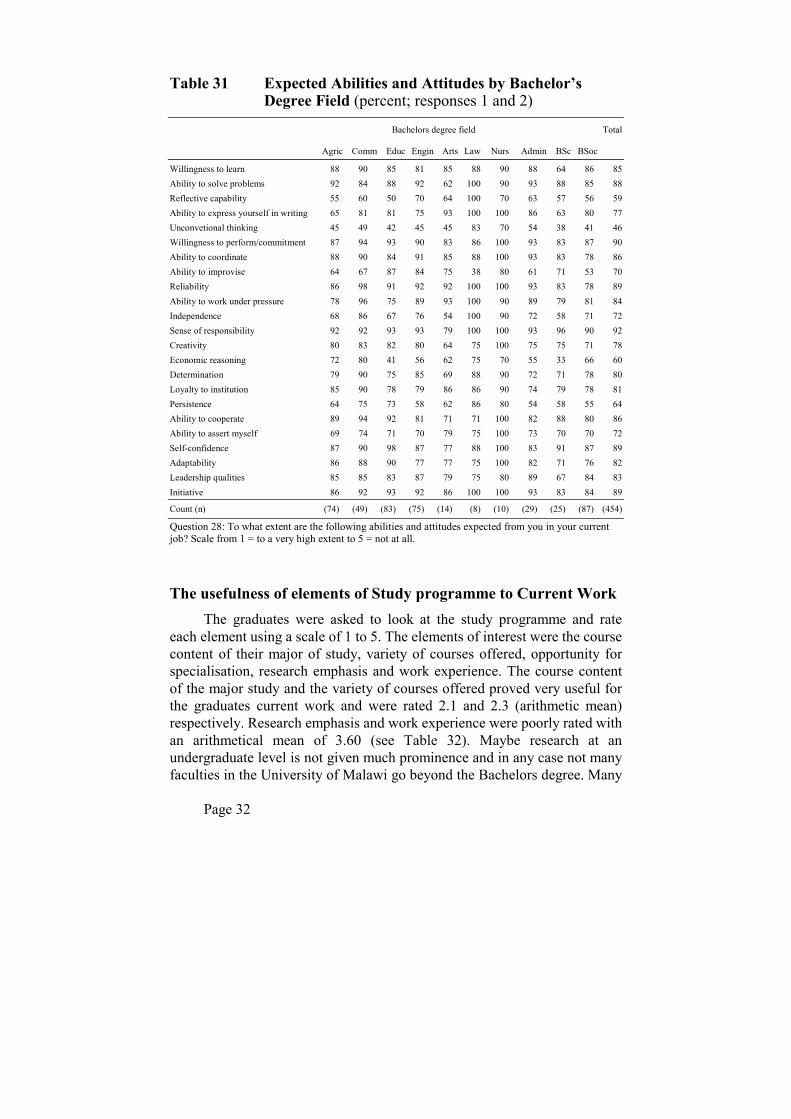
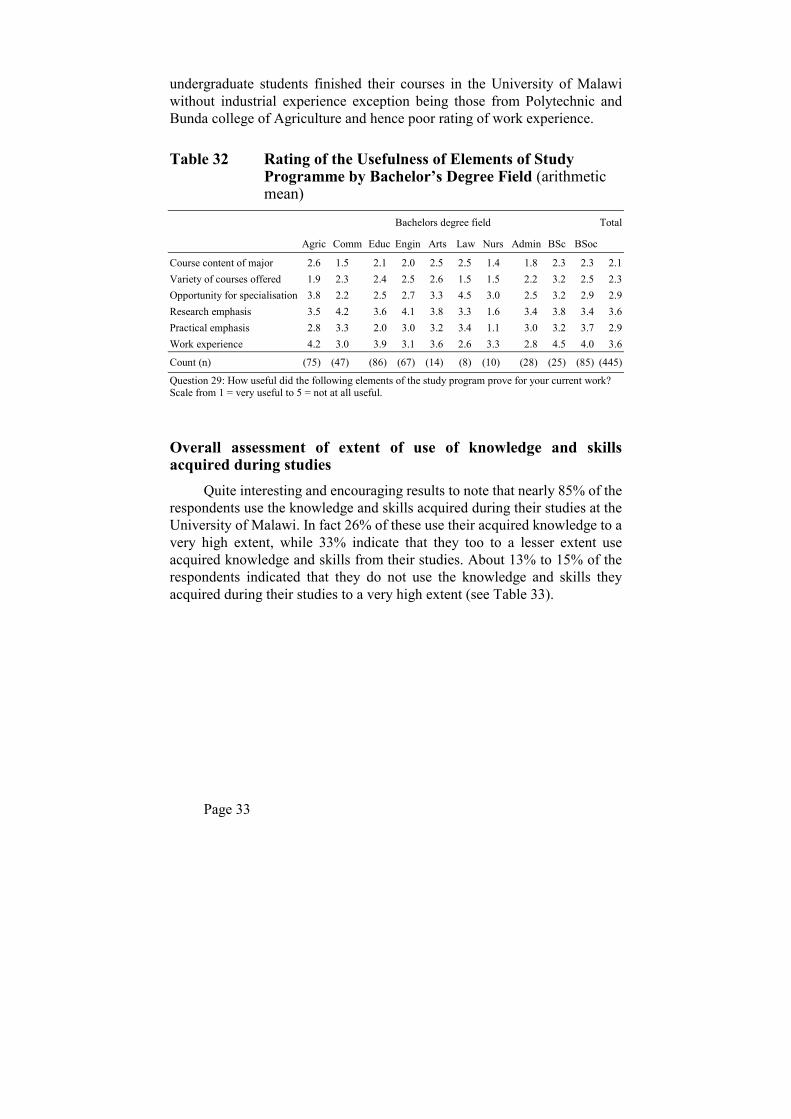
The usefulness of elements of Study programme to Current Work The graduates were asked to look at the study programme and rate
each element using a scale of 1 to 5. The elements of interest were the course content of their major of study, variety of courses offered, opportunity for specialisation, research emphasis and work experience. The course content of the major study and the variety of courses offered proved very useful for the graduates current work and were rated 2.1 and 2.3 (arithmetic mean) respectively. Research emphasis and work experience were poorly rated with an arithmetical mean of 3.60 (see Table 32). Maybe research at an undergraduate level is not given much prominence and in any case not many faculties in the University of Malawi go beyond the Bachelors degree. Many
Page 33
undergraduate students finished their courses in the University of Malawi without industrial experience exception being those from Polytechnic and Bunda college of Agriculture and hence poor rating of work experience.
Table 32 Rating of the Usefulness of Elements of Study Programme by Bachelor’s Degree Field (arithmetic mean)
Bachelors degree field Total
Agric Comm Educ Engin Arts Law Nurs Admin BSc BSoc
Course content of major 2.6 1.5 2.1 2.0 2.5 2.5 1.4 1.8 2.3 2.3 2.1 Variety of courses offered 1.9 2.3 2.4 2.5 2.6 1.5 1.5 2.2 3.2 2.5 2.3 Opportunity for specialisation 3.8 2.2 2.5 2.7 3.3 4.5 3.0 2.5 3.2 2.9 2.9 Research emphasis 3.5 4.2 3.6 4.1 3.8 3.3 1.6 3.4 3.8 3.4 3.6 Practical emphasis 2.8 3.3 2.0 3.0 3.2 3.4 1.1 3.0 3.2 3.7 2.9 Work experience 4.2 3.0 3.9 3.1 3.6 2.6 3.3 2.8 4.5 4.0 3.6
Count (n) (75) (47) (86) (67) (14) (8) (10) (28) (25) (85) (445)
Question 29: How useful did the following elements of the study program prove for your current work? Scale from 1 = very useful to 5 = not at all useful.
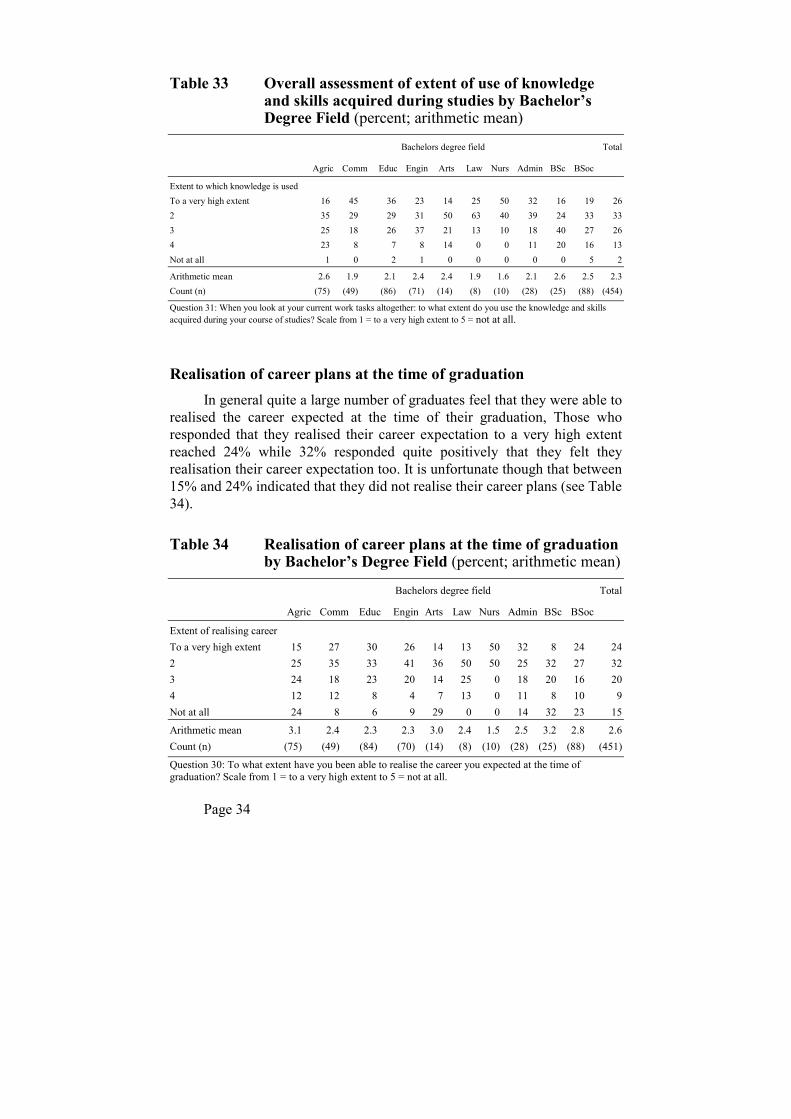
Overall assessment of extent of use of knowledge and skills acquired during studies
Quite interesting and encouraging results to note that nearly 85% of the respondents use the knowledge and skills acquired during their studies at the University of Malawi. In fact 26% of these use their acquired knowledge to a very high extent, while 33% indicate that they too to a lesser extent use acquired knowledge and skills from their studies. About 13% to 15% of the respondents indicated that they do not use the knowledge and skills they acquired during their studies to a very high extent (see Table 33).
Page 34
Table 33 Overall assessment of extent of use of knowledge and skills acquired during studies by Bachelor’s Degree Field (percent; arithmetic mean)
Bachelors degree field Total
Agric Comm Educ Engin Arts Law Nurs Admin BSc BSoc
Extent to which knowledge is used To a very high extent 16 45 36 23 14 25 50 32 16 19 26 2 35 29 29 31 50 63 40 39 24 33 33 3 25 18 26 37 21 13 10 18 40 27 26 4 23 8 7 8 14 0 0 11 20 16 13 Not at all 1 0 2 1 0 0 0 0 0 5 2
Arithmetic mean 2.6 1.9 2.1 2.4 2.4 1.9 1.6 2.1 2.6 2.5 2.3 Count (n) (75) (49) (86) (71) (14) (8) (10) (28) (25) (88) (454)
Question 31: When you look at your current work tasks altogether: to what extent do you use the knowledge and skills acquired during your course of studies? Scale from 1 = to a very high extent to 5 = not at all.
Realisation of career plans at the time of graduation In general quite a large number of graduates feel that they were able to
realised the career expected at the time of their graduation, Those who responded that they realised their career expectation to a very high extent reached 24% while 32% responded quite positively that they felt they realisation their career expectation too. It is unfortunate though that between 15% and 24% indicated that they did not realise their career plans (see Table 34).
Table 34 Realisation of career plans at the time of graduation by Bachelor’s Degree Field (percent; arithmetic mean)
Bachelors degree field Total
Agric Comm Educ Engin Arts Law Nurs Admin BSc BSoc
Extent of realising career To a very high extent 15 27 30 26 14 13 50 32 8 24 24 2 25 35 33 41 36 50 50 25 32 27 32 3 24 18 23 20 14 25 0 18 20 16 20 4 12 12 8 4 7 13 0 11 8 10 9 Not at all 24 8 6 9 29 0 0 14 32 23 15
Arithmetic mean 3.1 2.4 2.3 2.3 3.0 2.4 1.5 2.5 3.2 2.8 2.6 Count (n) (75) (49) (84) (70) (14) (8) (10) (28) (25) (88) (451)
Question 30: To what extent have you been able to realise the career you expected at the time of graduation? Scale from 1 = to a very high extent to 5 = not at all.
Page 35
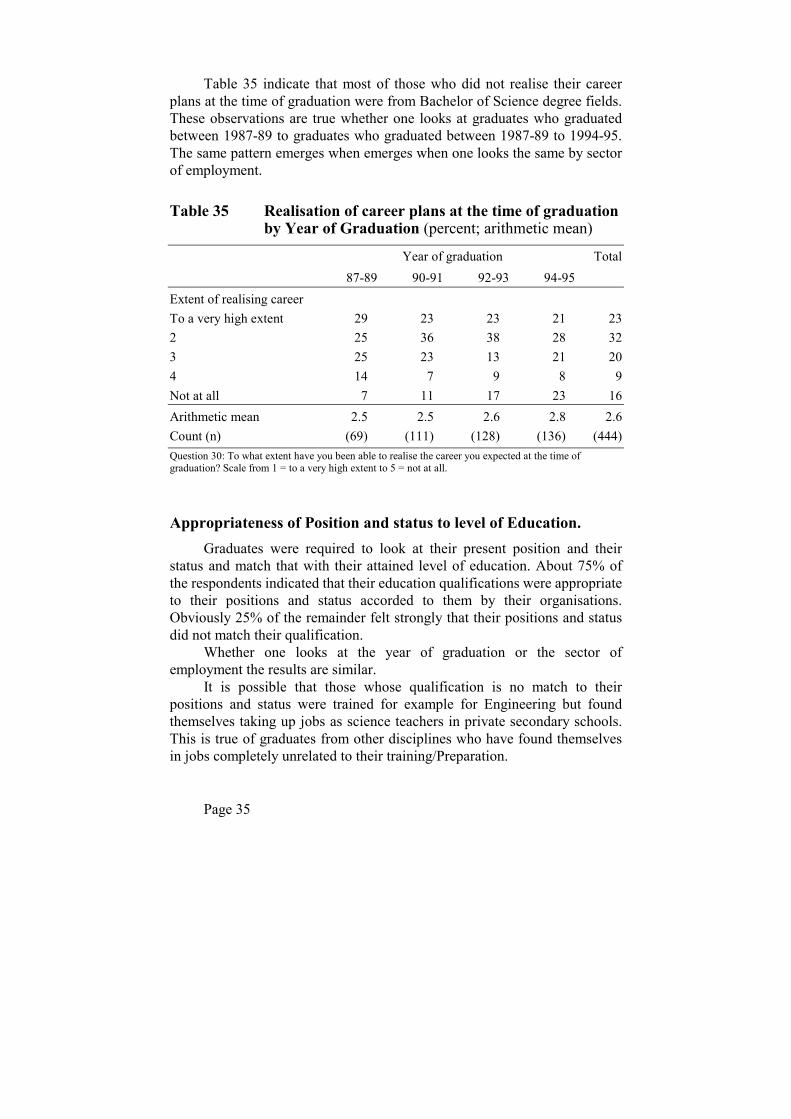
Table 35 indicate that most of those who did not realise their career plans at the time of graduation were from Bachelor of Science degree fields. These observations are true whether one looks at graduates who graduated between 1987-89 to graduates who graduated between 1987-89 to 1994-95. The same pattern emerges when emerges when one looks the same by sector of employment.
Table 35 Realisation of career plans at the time of graduation by Year of Graduation (percent; arithmetic mean)
Year of graduation Total 87-89 90-91 92-93 94-95
Extent of realising career To a very high extent 29 23 23 21 23 2 25 36 38 28 32 3 25 23 13 21 20 4 14 7 9 8 9 Not at all 7 11 17 23 16 Arithmetic mean 2.5 2.5 2.6 2.8 2.6 Count (n) (69) (111) (128) (136) (444) Question 30: To what extent have you been able to realise the career you expected at the time of graduation? Scale from 1 = to a very high extent to 5 = not at all.
Appropriateness of Position and status to level of Education. Graduates were required to look at their present position and their
status and match that with their attained level of education. About 75% of the respondents indicated that their education qualifications were appropriate to their positions and status accorded to them by their organisations. Obviously 25% of the remainder felt strongly that their positions and status did not match their qualification.
Whether one looks at the year of graduation or the sector of employment the results are similar.
It is possible that those whose qualification is no match to their positions and status were trained for example for Engineering but found themselves taking up jobs as science teachers in private secondary schools. This is true of graduates from other disciplines who have found themselves in jobs completely unrelated to their training/Preparation.
Page 36
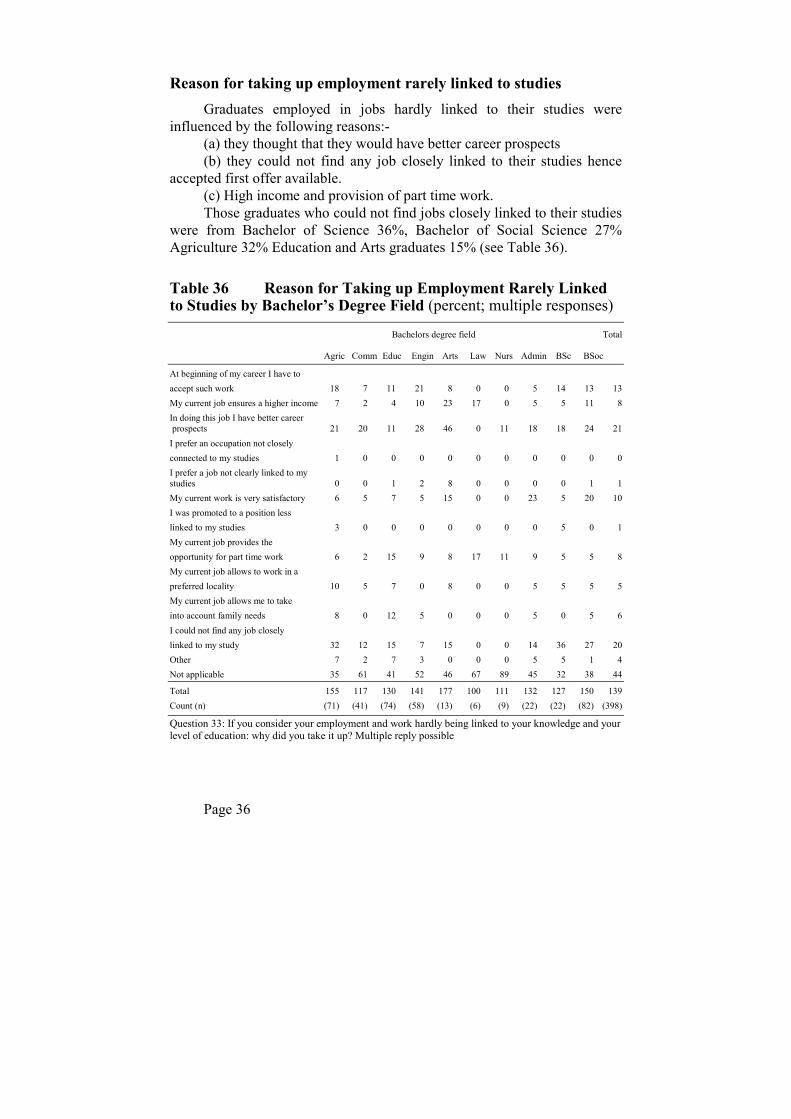
Reason for taking up employment rarely linked to studies Graduates employed in jobs hardly linked to their studies were
influenced by the following reasons:- (a) they thought that they would have better career prospects (b) they could not find any job closely linked to their studies hence
accepted first offer available. (c) High income and provision of part time work. Those graduates who could not find jobs closely linked to their studies
were from Bachelor of Science 36%, Bachelor of Social Science 27% Agriculture 32% Education and Arts graduates 15% (see Table 36).
Table 36 Reason for Taking up Employment Rarely Linked to Studies by Bachelor’s Degree Field (percent; multiple responses)
Bachelors degree field Total
Agric Comm Educ Engin Arts Law Nurs Admin BSc BSoc
At beginning of my career I have to accept such work 18 7 11 21 8 0 0 5 14 13 13 My current job ensures a higher income 7 2 4 10 23 17 0 5 5 11 8 In doing this job I have better career prospects 21 20 11 28 46 0 11 18 18 24 21 I prefer an occupation not closely connected to my studies 1 0 0 0 0 0 0 0 0 0 0 I prefer a job not clearly linked to my studies 0 0 1 2 8 0 0 0 0 1 1 My current work is very satisfactory 6 5 7 5 15 0 0 23 5 20 10 I was promoted to a position less linked to my studies 3 0 0 0 0 0 0 0 5 0 1 My current job provides the opportunity for part time work 6 2 15 9 8 17 11 9 5 5 8 My current job allows to work in a preferred locality 10 5 7 0 8 0 0 5 5 5 5 My current job allows me to take into account family needs 8 0 12 5 0 0 0 5 0 5 6 I could not find any job closely linked to my study 32 12 15 7 15 0 0 14 36 27 20 Other 7 2 7 3 0 0 0 5 5 1 4 Not applicable 35 61 41 52 46 67 89 45 32 38 44
Total 155 117 130 141 177 100 111 132 127 150 139 Count (n) (71) (41) (74) (58) (13) (6) (9) (22) (22) (82) (398)
Question 33: If you consider your employment and work hardly being linked to your knowledge and your level of education: why did you take it up? Multiple reply possible
Page 37
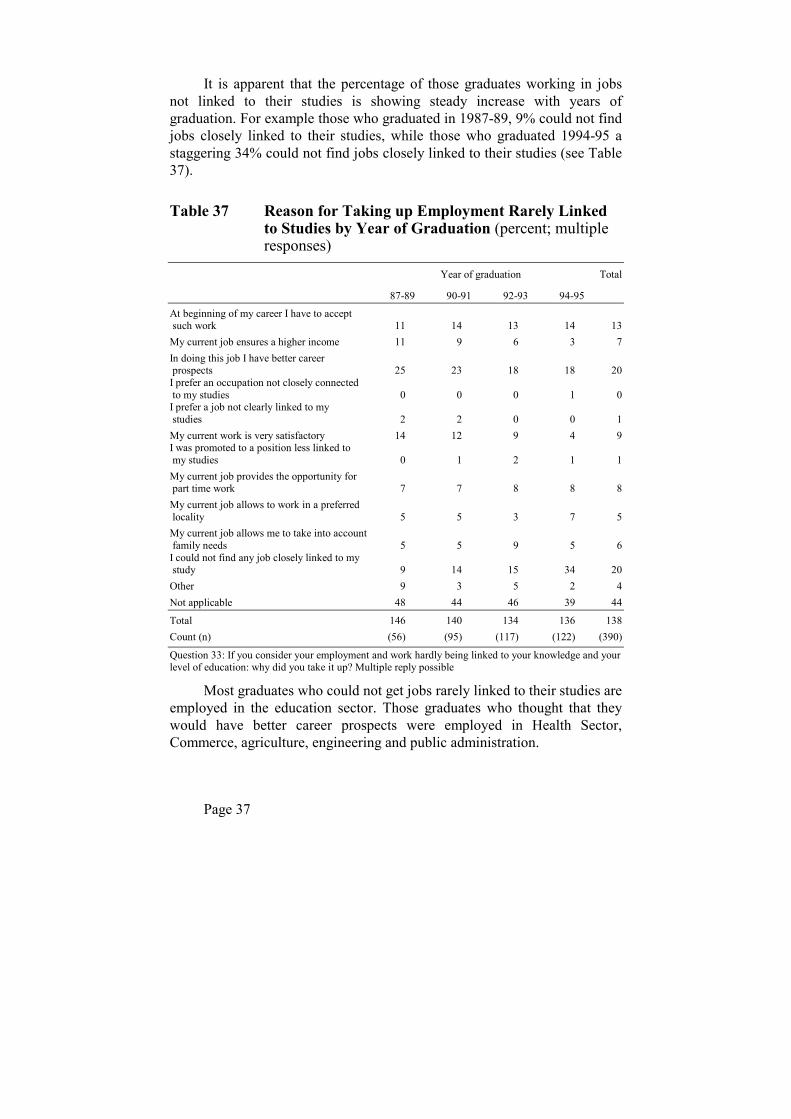
It is apparent that the percentage of those graduates working in jobs not linked to their studies is showing steady increase with years of graduation. For example those who graduated in 1987-89, 9% could not find jobs closely linked to their studies, while those who graduated 1994-95 a staggering 34% could not find jobs closely linked to their studies (see Table 37).
Table 37 Reason for Taking up Employment Rarely Linked to Studies by Year of Graduation (percent; multiple responses)
Year of graduation Total
87-89 90-91 92-93 94-95
At beginning of my career I have to accept such work 11 14 13 14 13 My current job ensures a higher income 11 9 6 3 7 In doing this job I have better career prospects 25 23 18 18 20 I prefer an occupation not closely connected to my studies 0 0 0 1 0 I prefer a job not clearly linked to my studies 2 2 0 0 1 My current work is very satisfactory 14 12 9 4 9 I was promoted to a position less linked to my studies 0 1 2 1 1 My current job provides the opportunity for part time work 7 7 8 8 8 My current job allows to work in a preferred locality 5 5 3 7 5 My current job allows me to take into account family needs 5 5 9 5 6 I could not find any job closely linked to my study 9 14 15 34 20 Other 9 3 5 2 4 Not applicable 48 44 46 39 44
Total 146 140 134 136 138 Count (n) (56) (95) (117) (122) (390)
Question 33: If you consider your employment and work hardly being linked to your knowledge and your level of education: why did you take it up? Multiple reply possible
Most graduates who could not get jobs rarely linked to their studies are employed in the education sector. Those graduates who thought that they would have better career prospects were employed in Health Sector, Commerce, agriculture, engineering and public administration.
Page 38
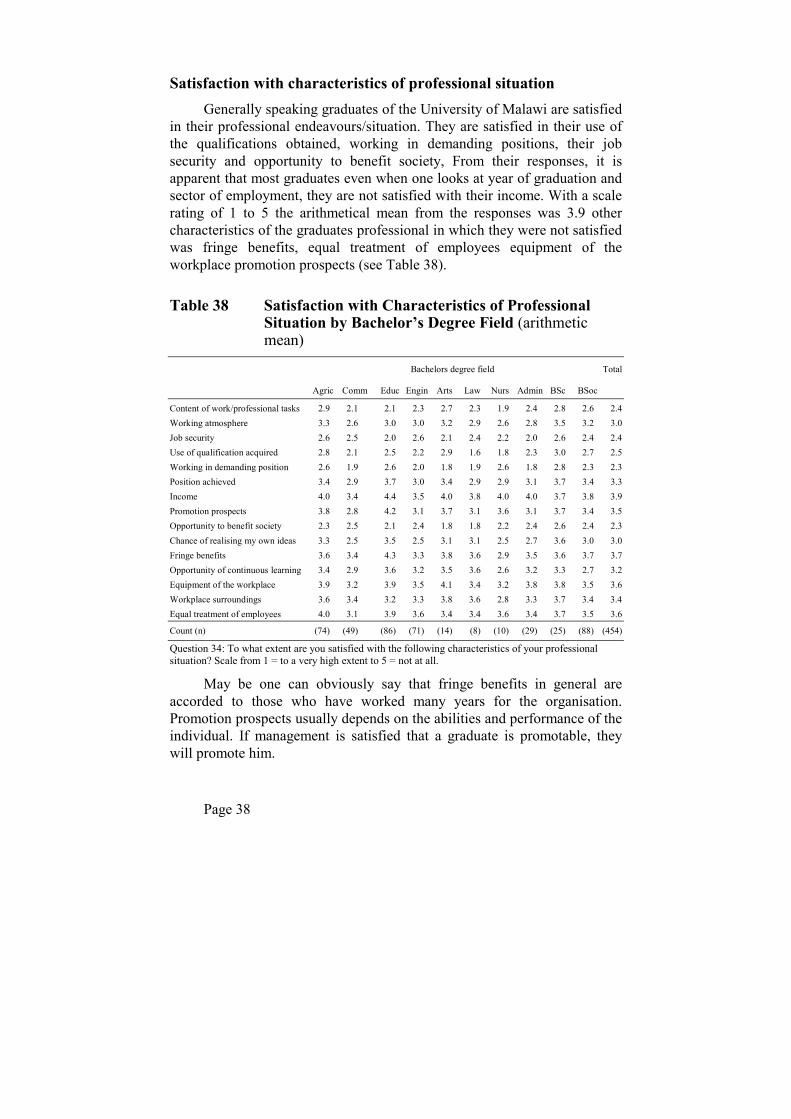
Satisfaction with characteristics of professional situation Generally speaking graduates of the University of Malawi are satisfied
in their professional endeavours/situation. They are satisfied in their use of the qualifications obtained, working in demanding positions, their job security and opportunity to benefit society, From their responses, it is apparent that most graduates even when one looks at year of graduation and sector of employment, they are not satisfied with their income. With a scale rating of 1 to 5 the arithmetical mean from the responses was 3.9 other characteristics of the graduates professional in which they were not satisfied was fringe benefits, equal treatment of employees equipment of the workplace promotion prospects (see Table 38).
Table 38 Satisfaction with Characteristics of Professional Situation by Bachelor’s Degree Field (arithmetic mean)
Bachelors degree field Total
Agric Comm Educ Engin Arts Law Nurs Admin BSc BSoc
Content of work/professional tasks 2.9 2.1 2.1 2.3 2.7 2.3 1.9 2.4 2.8 2.6 2.4 Working atmosphere 3.3 2.6 3.0 3.0 3.2 2.9 2.6 2.8 3.5 3.2 3.0 Job security 2.6 2.5 2.0 2.6 2.1 2.4 2.2 2.0 2.6 2.4 2.4 Use of qualification acquired 2.8 2.1 2.5 2.2 2.9 1.6 1.8 2.3 3.0 2.7 2.5 Working in demanding position 2.6 1.9 2.6 2.0 1.8 1.9 2.6 1.8 2.8 2.3 2.3 Position achieved 3.4 2.9 3.7 3.0 3.4 2.9 2.9 3.1 3.7 3.4 3.3 Income 4.0 3.4 4.4 3.5 4.0 3.8 4.0 4.0 3.7 3.8 3.9 Promotion prospects 3.8 2.8 4.2 3.1 3.7 3.1 3.6 3.1 3.7 3.4 3.5 Opportunity to benefit society 2.3 2.5 2.1 2.4 1.8 1.8 2.2 2.4 2.6 2.4 2.3 Chance of realising my own ideas 3.3 2.5 3.5 2.5 3.1 3.1 2.5 2.7 3.6 3.0 3.0 Fringe benefits 3.6 3.4 4.3 3.3 3.8 3.6 2.9 3.5 3.6 3.7 3.7 Opportunity of continuous learning 3.4 2.9 3.6 3.2 3.5 3.6 2.6 3.2 3.3 2.7 3.2 Equipment of the workplace 3.9 3.2 3.9 3.5 4.1 3.4 3.2 3.8 3.8 3.5 3.6 Workplace surroundings 3.6 3.4 3.2 3.3 3.8 3.6 2.8 3.3 3.7 3.4 3.4 Equal treatment of employees 4.0 3.1 3.9 3.6 3.4 3.4 3.6 3.4 3.7 3.5 3.6
Count (n) (74) (49) (86) (71) (14) (8) (10) (29) (25) (88) (454)
Question 34: To what extent are you satisfied with the following characteristics of your professional situation? Scale from 1 = to a very high extent to 5 = not at all.
May be one can obviously say that fringe benefits in general are accorded to those who have worked many years for the organisation. Promotion prospects usually depends on the abilities and performance of the individual. If management is satisfied that a graduate is promotable, they will promote him.
Page 39
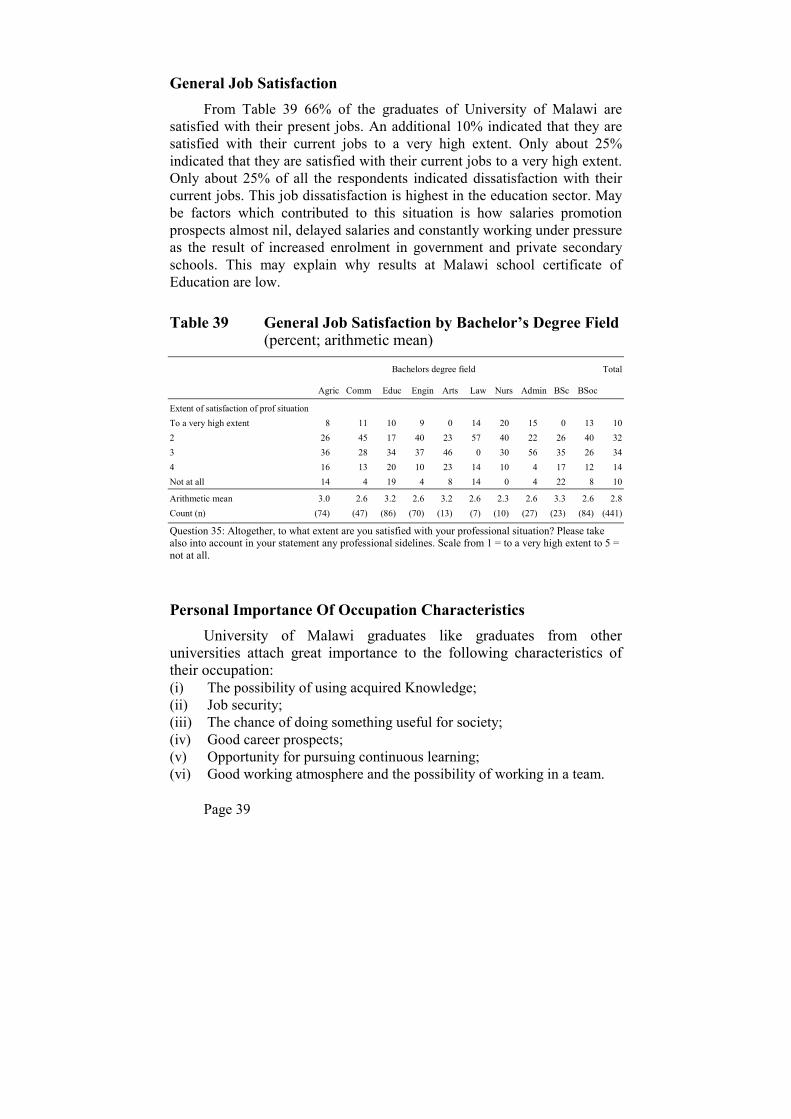
General Job Satisfaction From Table 39 66% of the graduates of University of Malawi are
satisfied with their present jobs. An additional 10% indicated that they are satisfied with their current jobs to a very high extent. Only about 25% indicated that they are satisfied with their current jobs to a very high extent. Only about 25% of all the respondents indicated dissatisfaction with their current jobs. This job dissatisfaction is highest in the education sector. May be factors which contributed to this situation is how salaries promotion prospects almost nil, delayed salaries and constantly working under pressure as the result of increased enrolment in government and private secondary schools. This may explain why results at Malawi school certificate of Education are low.
Table 39 General Job Satisfaction by Bachelor’s Degree Field (percent; arithmetic mean)
Bachelors degree field Total
Agric Comm Educ Engin Arts Law Nurs Admin BSc BSoc
Extent of satisfaction of prof situation To a very high extent 8 11 10 9 0 14 20 15 0 13 10 2 26 45 17 40 23 57 40 22 26 40 32 3 36 28 34 37 46 0 30 56 35 26 34 4 16 13 20 10 23 14 10 4 17 12 14 Not at all 14 4 19 4 8 14 0 4 22 8 10
Arithmetic mean 3.0 2.6 3.2 2.6 3.2 2.6 2.3 2.6 3.3 2.6 2.8 Count (n) (74) (47) (86) (70) (13) (7) (10) (27) (23) (84) (441)
Question 35: Altogether, to what extent are you satisfied with your professional situation? Please take also into account in your statement any professional sidelines. Scale from 1 = to a very high extent to 5 = not at all.
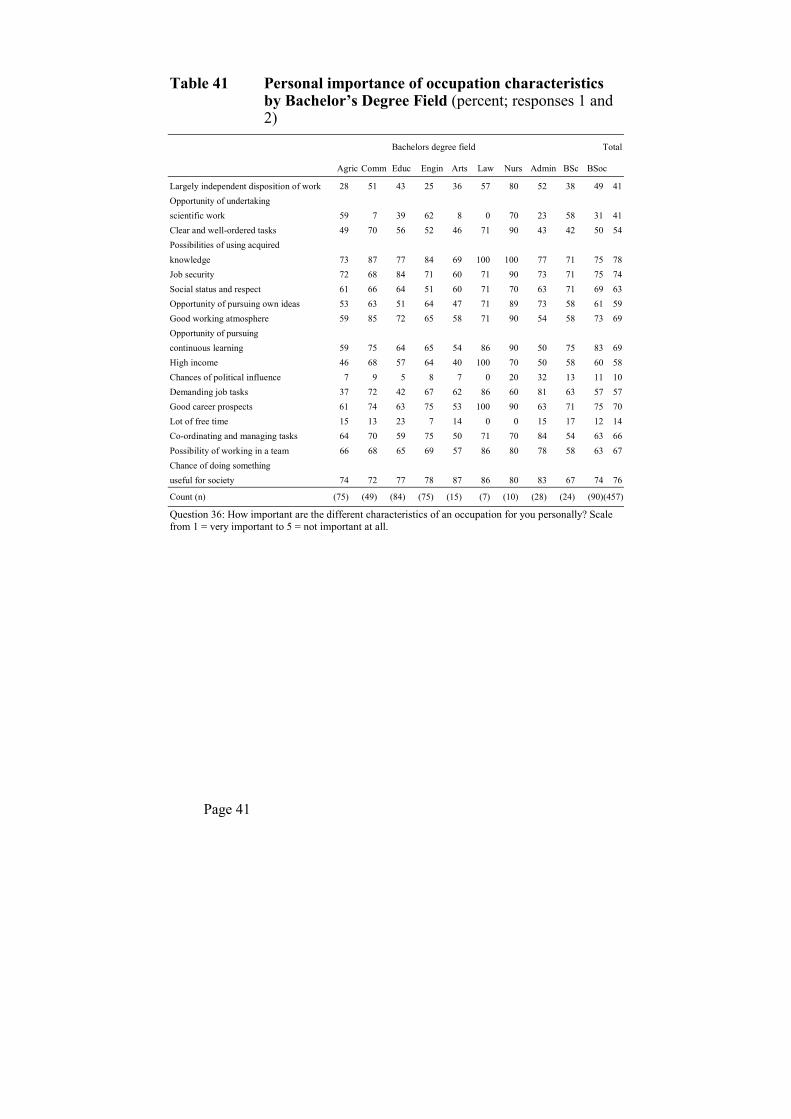
Personal Importance Of Occupation Characteristics University of Malawi graduates like graduates from other
universities attach great importance to the following characteristics of their occupation: (i) The possibility of using acquired Knowledge; (ii) Job security; (iii) The chance of doing something useful for society; (iv) Good career prospects; (v) Opportunity for pursuing continuous learning; (vi) Good working atmosphere and the possibility of working in a team.
Page 40
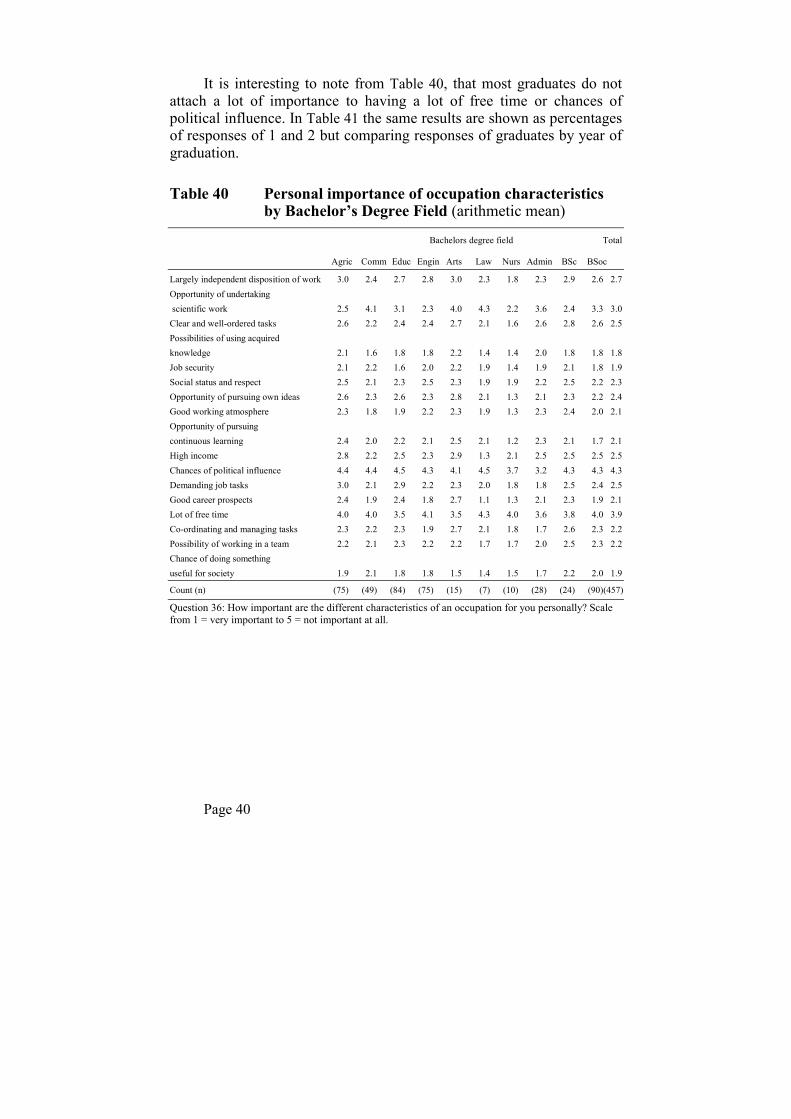
It is interesting to note from Table 40, that most graduates do not attach a lot of importance to having a lot of free time or chances of political influence. In Table 41 the same results are shown as percentages of responses of 1 and 2 but comparing responses of graduates by year of graduation.
Table 40 Personal importance of occupation characteristics by Bachelor’s Degree Field (arithmetic mean)
Bachelors degree field Total
Agric Comm Educ Engin Arts Law Nurs Admin BSc BSoc
Largely independent disposition of work 3.0 2.4 2.7 2.8 3.0 2.3 1.8 2.3 2.9 2.6 2.7 Opportunity of undertaking scientific work 2.5 4.1 3.1 2.3 4.0 4.3 2.2 3.6 2.4 3.3 3.0 Clear and well-ordered tasks 2.6 2.2 2.4 2.4 2.7 2.1 1.6 2.6 2.8 2.6 2.5 Possibilities of using acquired knowledge 2.1 1.6 1.8 1.8 2.2 1.4 1.4 2.0 1.8 1.8 1.8 Job security 2.1 2.2 1.6 2.0 2.2 1.9 1.4 1.9 2.1 1.8 1.9 Social status and respect 2.5 2.1 2.3 2.5 2.3 1.9 1.9 2.2 2.5 2.2 2.3 Opportunity of pursuing own ideas 2.6 2.3 2.6 2.3 2.8 2.1 1.3 2.1 2.3 2.2 2.4 Good working atmosphere 2.3 1.8 1.9 2.2 2.3 1.9 1.3 2.3 2.4 2.0 2.1 Opportunity of pursuing continuous learning 2.4 2.0 2.2 2.1 2.5 2.1 1.2 2.3 2.1 1.7 2.1 High income 2.8 2.2 2.5 2.3 2.9 1.3 2.1 2.5 2.5 2.5 2.5 Chances of political influence 4.4 4.4 4.5 4.3 4.1 4.5 3.7 3.2 4.3 4.3 4.3 Demanding job tasks 3.0 2.1 2.9 2.2 2.3 2.0 1.8 1.8 2.5 2.4 2.5 Good career prospects 2.4 1.9 2.4 1.8 2.7 1.1 1.3 2.1 2.3 1.9 2.1 Lot of free time 4.0 4.0 3.5 4.1 3.5 4.3 4.0 3.6 3.8 4.0 3.9 Co-ordinating and managing tasks 2.3 2.2 2.3 1.9 2.7 2.1 1.8 1.7 2.6 2.3 2.2 Possibility of working in a team 2.2 2.1 2.3 2.2 2.2 1.7 1.7 2.0 2.5 2.3 2.2 Chance of doing something useful for society 1.9 2.1 1.8 1.8 1.5 1.4 1.5 1.7 2.2 2.0 1.9
Count (n) (75) (49) (84) (75) (15) (7) (10) (28) (24) (90)(457)
Question 36: How important are the different characteristics of an occupation for you personally? Scale from 1 = very important to 5 = not important at all.
Page 41
Table 41 Personal importance of occupation characteristics by Bachelor’s Degree Field (percent; responses 1 and 2)
Bachelors degree field Total
Agric Comm Educ Engin Arts Law Nurs Admin BSc BSoc
Largely independent disposition of work 28 51 43 25 36 57 80 52 38 49 41 Opportunity of undertaking scientific work 59 7 39 62 8 0 70 23 58 31 41 Clear and well-ordered tasks 49 70 56 52 46 71 90 43 42 50 54 Possibilities of using acquired knowledge 73 87 77 84 69 100 100 77 71 75 78 Job security 72 68 84 71 60 71 90 73 71 75 74 Social status and respect 61 66 64 51 60 71 70 63 71 69 63 Opportunity of pursuing own ideas 53 63 51 64 47 71 89 73 58 61 59 Good working atmosphere 59 85 72 65 58 71 90 54 58 73 69 Opportunity of pursuing continuous learning 59 75 64 65 54 86 90 50 75 83 69 High income 46 68 57 64 40 100 70 50 58 60 58 Chances of political influence 7 9 5 8 7 0 20 32 13 11 10 Demanding job tasks 37 72 42 67 62 86 60 81 63 57 57 Good career prospects 61 74 63 75 53 100 90 63 71 75 70 Lot of free time 15 13 23 7 14 0 0 15 17 12 14 Co-ordinating and managing tasks 64 70 59 75 50 71 70 84 54 63 66 Possibility of working in a team 66 68 65 69 57 86 80 78 58 63 67 Chance of doing something useful for society 74 72 77 78 87 86 80 83 67 74 76
Count (n) (75) (49) (84) (75) (15) (7) (10) (28) (24) (90)(457)
Question 36: How important are the different characteristics of an occupation for you personally? Scale from 1 = very important to 5 = not important at all.
Page 42
CONCLUSION
Although the number of respondents to the questionnaires was low about 29.4 percent, a lot of valuable information has been gathered.
During the period under review, 1987 to 1995, there was a general increase, about 2 percent, in the enrolment in the University. This increase has had some negative effects on study provisions due to lack of growth in terms of resources within the University. The University of Malawi, in general, except for few courses, has provided very little chances to students to participate in research, to influence university policy and the possibility of individual students to structure their studies. The University has, however, maintained other study provision at a high level, for example, students interaction, teaching quality of lecturers, accommodation facilities on campus, just to mention a few. Despite the fact that the University of Malawi is one institution, graduates have varied reasons for enrolling to a particular college by the reputation of the college, admission standards and the student grades, practice-oriented study programmes, and areas of specialisation provided. The courses being offered have generally changed in all constituent colleges of the University of Malawi towards to more job-oriented. This has enabled most of the graduates to work with little or no initial training after graduation. For those that have received some training, it has been mostly on-the-job.
The opportunities of securing a job by a graduate have declined over the years. Searching for employment starts way before graduation for most of the graduates. The period of seeking employment has increased from an average of 2.5 months in 1987-89 to an average of 4.3 months in 1994-95. Consequently, this has increased the number of contacts that a graduate has to make before securing a job from an average of seven contacts in 1987-89 to an average of seventeen contacts in 1994-95.
Most of the graduates have changed jobs more than once. A high percentage of those who have changed jobs once or twice are graduates who graduated between 1992 and 1995. This is the case because recently most graduates are employed initially in jobs not linked to their training due to job scarcity. They only move to jobs related to their training later, hence the high number of graduates who have changed employment.
Page 43
The majority of the University of Malawi graduates are employed in the education sector (public employer). Most of these fill vacancies in secondary schools as teachers. Very few of the graduates are not on full-time employment. Although the number of graduates who are not full-time has increased over the years, the increase is not significant. Malawian graduates generally find it unusual to engage themselves in other side jobs besides their full-time employment.
Different degree fields fetch different salary packages. This also depends upon the sector of employment. The monthly gross income from full-time employment for those employed in the public sector is pathetically low. Unfortunately, coupled with low salaries, they do not have substantial fringe benefits. Most of them enjoy only housing and retirement benefits.
The use of professional knowledge and skills acquired during studies is a very important factor in job satisfaction. This usage differ from one degree field to another but general, for UNIMA it is to a very high extent. The knowledge of English which is the official language in Malawi was highly rated. This indicates that the communication skills are very important irrespective of which degree field. In addition to the knowledge and skills Mich graduates use, other abilities and attitudes which graduates of the University of Malavi seem to have faired well are: (i) Sense of responsibility; (ii) Self confidence; (iii) Reliability; (iv) Ability to solve problems; (v) Initiative; (vi) Willingness to learn (vii) Ability to work under pressure; and (viii) Leadership qualities.
The course content as well as the variety of courses offered proved very useful to graduates current work. Quite a large number of graduates feel that they are able to realise the career they expected at the time of their graduation, and in addition they are generally satisfied in their use of the qualifications they obtained, working in demanding positions, their job security and opportunity to benefit society, except for their income, fringe benefits, equal treatment of employees, equipment of the workplace and promotion prospects.