Embed Size (px)
Citation preview
Investor Contact 7930 Jones Branch DriveJill Slattery McLean, VA 22102+1 703 883 6043 ir.hilton.com
Media ContactNigel Glennie+1 703 883 5262
Hilton Reports First Quarter Results
MCLEAN, VA (May 5, 2021) - Hilton Worldwide Holdings Inc. ("Hilton" or the "Company") (NYSE: HLT) today reported its first quarter 2021 results. The following results reflect the material impact that the novel coronavirus ("COVID-19") pandemic has had on Hilton's business. Highlights include:
• Diluted EPS was $(0.39) for the first quarter, and diluted EPS, adjusted for special items, was $0.02
• Net loss was $109 million for the first quarter
• Adjusted EBITDA was $198 million for the first quarter
• System-wide comparable RevPAR decreased 38.4 percent on a currency neutral basis for the first quarter from the same period in 2020
• Approved 21,900 new rooms for development during the first quarter, bringing Hilton's development pipeline to 399,000 rooms as of March 31, 2021
• Added 16,500 rooms to Hilton's system in the first quarter, contributing to 13,100 net additional rooms during the period and approximately 5.8 percent annualized net unit growth from March 31, 2020
• As of April 28, 2021, 97 percent of Hilton's system-wide hotels were open
• In March 2021, repaid $250 million of the outstanding debt balance under the Revolving Credit Facility, for a total of $500 million repaid in the first quarter
1
Overview
Christopher J. Nassetta, President & Chief Executive Officer of Hilton, said, "We are pleased with our first quarter results. While rising COVID-19 cases and tightened travel restrictions, particularly across Europe and our Asia Pacific region, weighed on demand in January and February, we saw meaningful improvement in March and April. We expect this positive momentum to continue as vaccines are more widely distributed and our customers feel safe traveling again. We continue to grow our portfolio of hotels in exciting destinations throughout the world, giving our guests more options than ever before to make a Hilton hotel a part of their plans as travel resumes."
The COVID-19 pandemic adversely affected the Asia Pacific region beginning in January 2020 before spanning to the Americas and Europe, Middle East and Africa regions in mid-March 2020. Therefore, the results for the three months ended March 31, 2021 are not comparable to the results for the three months ended March 31, 2020. The operations of approximately 275 properties, which are primarily located in the United States ("U.S.") and Europe, were suspended for some period of time during the three months ended March 31, 2021, as compared to approximately 730 properties during the three months ended March 31, 2020.
For the three months ended March 31, 2021, system-wide comparable RevPAR decreased 38.4 percent compared to the same period in 2020 due to both occupancy and ADR decreases. Additionally, as a result of the pandemic, fee revenues decreased 34 percent during the three months ended March 31, 2021 compared to the same period in 2020.
For the three months ended March 31, 2021, diluted EPS was $(0.39) and diluted EPS, adjusted for special items, was $0.02 compared to $0.06 and $0.74, respectively, for the three months ended March 31, 2020. Net income (loss) and Adjusted EBITDA were $(109) million and $198 million, respectively, for the three months ended March 31, 2021, compared to $18 million and $363 million, respectively, for the three months ended March 31, 2020.
Development
In the first quarter of 2021, Hilton opened 105 new hotels totaling 16,500 rooms and achieved net unit growth of 13,100 rooms. Since the beginning of the year, Hilton has opened its 100th Curio Collection by Hilton, the 1,500-room Virgin Hotels Las Vegas, and its 50th Tapestry Collection by Hilton, demonstrating the strength of its newer, conversion-friendly brands, and executed a management agreement for the first Signia by Hilton, a 975-room new construction project in Atlanta. Additionally, during the quarter, Hilton added over 5,000 rooms to its development pipeline in connection with the exclusive management license agreement with Country Garden to introduce and develop Home2 Suites by Hilton branded properties in China.
As of March 31, 2021, Hilton's development pipeline totaled over 2,570 hotels consisting of nearly 399,000 rooms throughout 114 countries and territories, including 31 countries and territories where Hilton does not currently have any existing hotels. Additionally, of the rooms in the development pipeline, 241,000 rooms were located outside the U.S., and 204,000 rooms were under construction.
Balance Sheet and Liquidity
As of March 31, 2021, Hilton had $10.1 billion of long-term debt outstanding, excluding deferred financing costs and discount, with a weighted average interest rate of 3.66 percent. Excluding finance lease liabilities and other debt of Hilton's consolidated variable interest entities, Hilton had $9.8 billion of long-term debt outstanding with a weighted average interest rate of 3.61 percent and no scheduled maturities until 2024. During the three months ended March 31, 2021, Hilton repaid $500 million of the outstanding debt balance under its $1.75 billion senior secured revolving credit facility (the "Revolving Credit Facility"), resulting in an available borrowing capacity of $500 million. Total cash and cash equivalents were $2,447 million as of March 31, 2021, including $45 million of restricted cash and cash equivalents.
Conference Call
Hilton will host a conference call to discuss first quarter 2021 results on May 5, 2021 at 10:00 a.m. Eastern Time. Participants may listen to the live webcast by logging on to the Hilton Investor Relations website at https://ir.hilton.com/events-and-presentations. A replay and transcript of the webcast will be available within 24 hours after the live event at https://ir.hilton.com/financial-reporting/quarterly-results/2021.
Alternatively, participants may listen to the live call by dialing 1-888-317-6003 in the U.S. or 1-412-317-6061 internationally using the conference ID 7766511. Participants are encouraged to dial into the call or link to the webcast at least fifteen minutes prior to the scheduled start time. A telephone replay will be available for seven days following the call. To access the telephone replay, dial 1-877-344-7529 in the U.S. or 1-412-317-0088 internationally using the conference ID 10154242.
Forward-Looking Statements
This press release contains forward-looking statements within the meaning of Section 27A of the Securities Act of 1933, as amended, and Section 21E of the Securities Exchange Act of 1934, as amended. These statements include, but are not limited
2
to, statements related to the expectations regarding the impact of the COVID-19 pandemic, the performance of Hilton's business, financial results, liquidity and capital resources and other non-historical statements. In some cases, these forward-looking statements can be identified by the use of words such as "outlook," "believes," "expects," "potential," "continues," "may," "will," "should," "could," "seeks," "projects," "predicts," "intends," "plans," "estimates," "anticipates" or the negative version of these words or other comparable words. Such forward-looking statements are subject to various risks and uncertainties including, among others, risks inherent to the hospitality industry, macroeconomic factors beyond Hilton's control, risks related to the impact of the COVID-19 pandemic, competition for hotel guests and management and franchise contracts, risks related to doing business with third-party hotel owners, performance of Hilton's information technology systems, growth of reservation channels outside of Hilton's system, risks of doing business outside of the U.S. and Hilton's indebtedness. Additional factors that could cause Hilton's results to differ materially from those described in the forward-looking statements can be found under the section entitled "Part I—Item 1A. Risk Factors" of Hilton's Annual Report on Form 10-K for the fiscal year ended December 31, 2020, filed with the Securities and Exchange Commission (the "SEC"), as such factors may be further updated from time to time in Hilton's periodic filings with the SEC, which are accessible on the SEC's website at www.sec.gov. Accordingly, there are or will be important factors that could cause actual outcomes or results to differ materially from those indicated in these statements. These factors should not be construed as exhaustive and should be read in conjunction with the other cautionary statements that are included in this press release and in Hilton's filings with the SEC. The Company undertakes no obligation to publicly update or review any forward-looking statement, whether as a result of new information, future developments or otherwise, except as required by law.
Non-GAAP Financial Measures
The Company refers to certain financial measures that are not recognized under U.S. generally accepted accounting principles ("GAAP") in this press release, including: net income, adjusted for special items; diluted EPS, adjusted for special items; EBITDA; Adjusted EBITDA; Adjusted EBITDA margin; net debt; and net debt to Adjusted EBITDA ratio. See the schedules to this press release, including the "Definitions" section, for additional information and reconciliations of such non-GAAP financial measures.
About Hilton
Hilton (NYSE: HLT) is a leading global hospitality company with a portfolio of 18 world-class brands comprising more than 6,500 properties and more than one million rooms in 119 countries and territories. Dedicated to fulfilling its founding vision to fill the earth with the light and warmth of hospitality, Hilton has welcomed more than 3 billion guests in its more than 100-year history, earned a top spot on the 2020 World's Best Workplaces list and was named the 2020 Global Industry Leader on the Dow Jones Sustainability Indices. In 2020, Hilton CleanStay was introduced, bringing an industry-defining standard of cleanliness and disinfection to hotels worldwide. Through the award-winning guest loyalty program Hilton Honors, the more than 115 million members who book directly with Hilton can earn Points for hotel stays and experiences money can't buy. With the free Hilton Honors mobile app, guests can book their stay, select their room, check in, unlock their door with a Digital Key and check out, all from their smartphone. Visit newsroom.hilton.com for more information, and connect with Hilton on facebook.com/hiltonnewsroom, twitter.com/hiltonnewsroom, linkedin.com/company/hilton, instagram.com/hiltonnewsroom and youtube.com/hiltonnewsroom.
3

HILTON WORLDWIDE HOLDINGS INC.EARNINGS RELEASE SCHEDULES
TABLE OF CONTENTS
PageCondensed Consolidated Statements of Operations 5Comparable and Currency Neutral System-Wide Hotel Operating Statistics 6Property Summary 7Capital Expenditures and Contract Acquisition Costs 8Reconciliations of Non-GAAP Financial Measures 9Definitions 12
4
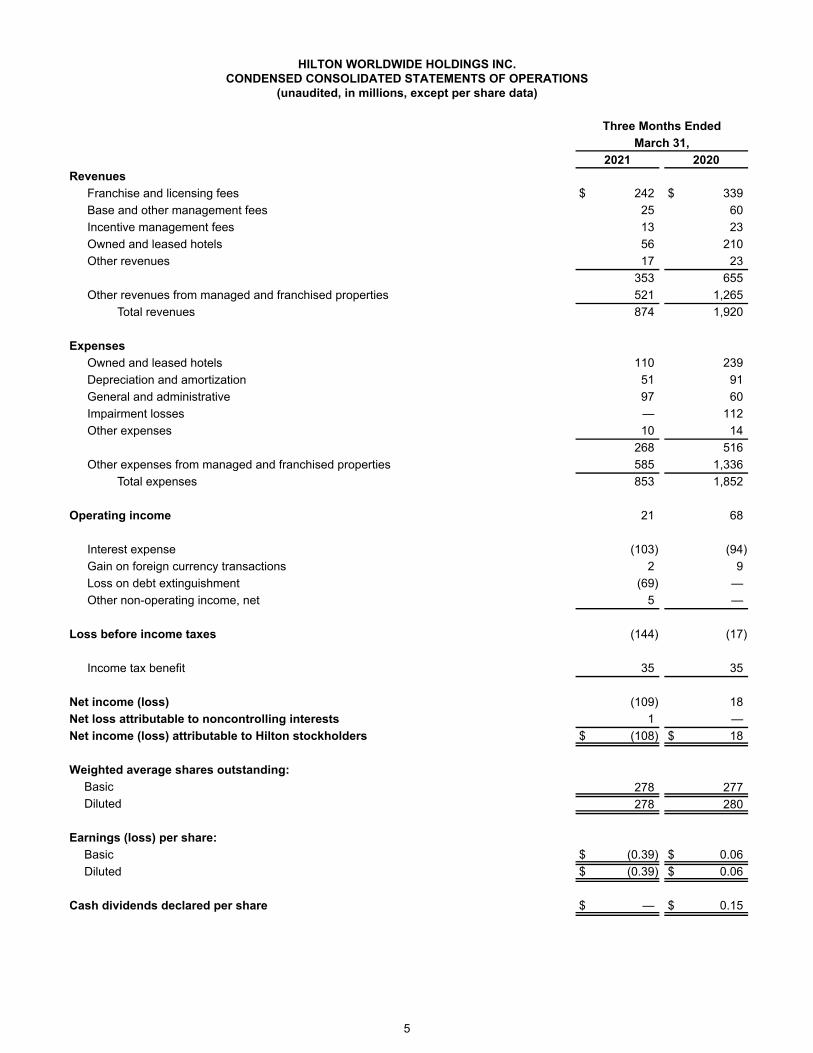
HILTON WORLDWIDE HOLDINGS INC.CONDENSED CONSOLIDATED STATEMENTS OF OPERATIONS
(unaudited, in millions, except per share data)
Three Months EndedMarch 31,
2021 2020Revenues
Franchise and licensing fees $ 242 $ 339 Base and other management fees 25 60 Incentive management fees 13 23 Owned and leased hotels 56 210 Other revenues 17 23
353 655 Other revenues from managed and franchised properties 521 1,265
Total revenues 874 1,920
ExpensesOwned and leased hotels 110 239 Depreciation and amortization 51 91 General and administrative 97 60 Impairment losses — 112 Other expenses 10 14
268 516 Other expenses from managed and franchised properties 585 1,336
Total expenses 853 1,852
Operating income 21 68
Interest expense (103) (94) Gain on foreign currency transactions 2 9 Loss on debt extinguishment (69) — Other non-operating income, net 5 —
Loss before income taxes (144) (17)
Income tax benefit 35 35
Net income (loss) (109) 18 Net loss attributable to noncontrolling interests 1 — Net income (loss) attributable to Hilton stockholders $ (108) $ 18
Weighted average shares outstanding:Basic 278 277 Diluted 278 280
Earnings (loss) per share:Basic $ (0.39) $ 0.06 Diluted $ (0.39) $ 0.06
Cash dividends declared per share $ — $ 0.15
5
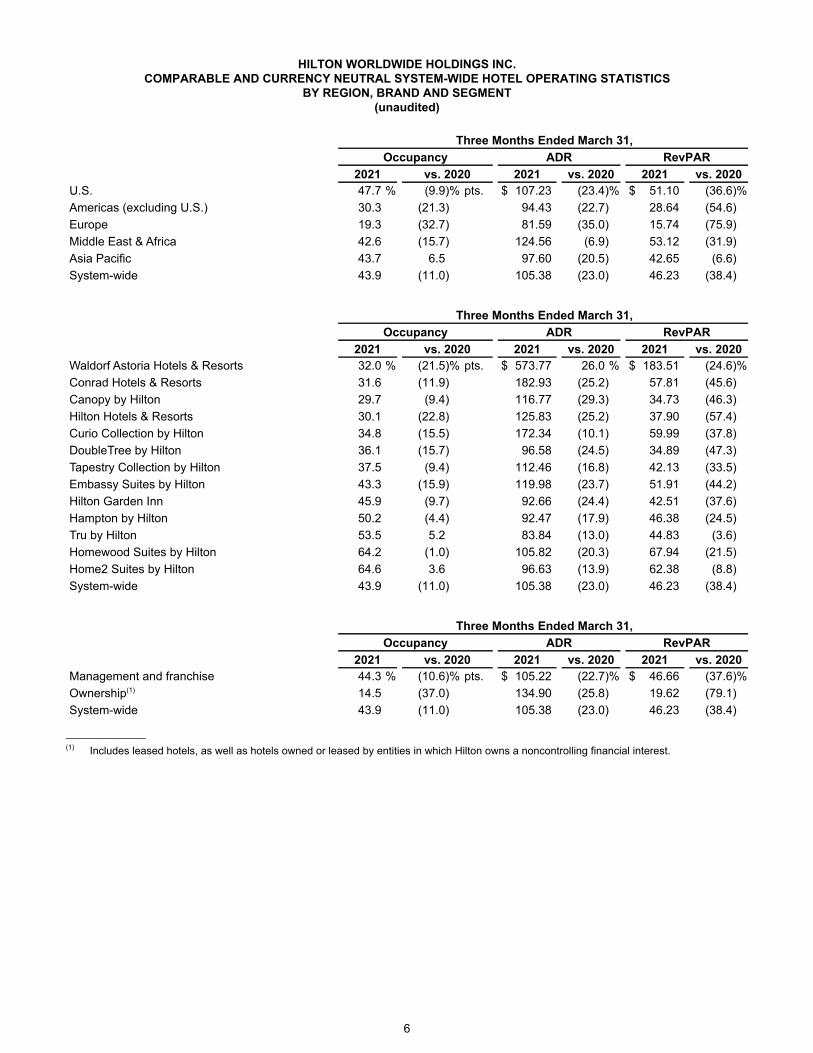
HILTON WORLDWIDE HOLDINGS INC.COMPARABLE AND CURRENCY NEUTRAL SYSTEM-WIDE HOTEL OPERATING STATISTICS
BY REGION, BRAND AND SEGMENT(unaudited)
Three Months Ended March 31,Occupancy ADR RevPAR
2021 vs. 2020 2021 vs. 2020 2021 vs. 2020U.S. 47.7 % (9.9) % pts. $ 107.23 (23.4) % $ 51.10 (36.6) %Americas (excluding U.S.) 30.3 (21.3) 94.43 (22.7) 28.64 (54.6) Europe 19.3 (32.7) 81.59 (35.0) 15.74 (75.9) Middle East & Africa 42.6 (15.7) 124.56 (6.9) 53.12 (31.9) Asia Pacific 43.7 6.5 97.60 (20.5) 42.65 (6.6) System-wide 43.9 (11.0) 105.38 (23.0) 46.23 (38.4)
Three Months Ended March 31,Occupancy ADR RevPAR
2021 vs. 2020 2021 vs. 2020 2021 vs. 2020Waldorf Astoria Hotels & Resorts 32.0 % (21.5) % pts. $ 573.77 26.0 % $ 183.51 (24.6) %Conrad Hotels & Resorts 31.6 (11.9) 182.93 (25.2) 57.81 (45.6) Canopy by Hilton 29.7 (9.4) 116.77 (29.3) 34.73 (46.3) Hilton Hotels & Resorts 30.1 (22.8) 125.83 (25.2) 37.90 (57.4) Curio Collection by Hilton 34.8 (15.5) 172.34 (10.1) 59.99 (37.8) DoubleTree by Hilton 36.1 (15.7) 96.58 (24.5) 34.89 (47.3) Tapestry Collection by Hilton 37.5 (9.4) 112.46 (16.8) 42.13 (33.5) Embassy Suites by Hilton 43.3 (15.9) 119.98 (23.7) 51.91 (44.2) Hilton Garden Inn 45.9 (9.7) 92.66 (24.4) 42.51 (37.6) Hampton by Hilton 50.2 (4.4) 92.47 (17.9) 46.38 (24.5) Tru by Hilton 53.5 5.2 83.84 (13.0) 44.83 (3.6) Homewood Suites by Hilton 64.2 (1.0) 105.82 (20.3) 67.94 (21.5) Home2 Suites by Hilton 64.6 3.6 96.63 (13.9) 62.38 (8.8) System-wide 43.9 (11.0) 105.38 (23.0) 46.23 (38.4)
Three Months Ended March 31,Occupancy ADR RevPAR
2021 vs. 2020 2021 vs. 2020 2021 vs. 2020Management and franchise 44.3 % (10.6) % pts. $ 105.22 (22.7) % $ 46.66 (37.6) %Ownership(1) 14.5 (37.0) 134.90 (25.8) 19.62 (79.1) System-wide 43.9 (11.0) 105.38 (23.0) 46.23 (38.4)
____________(1) Includes leased hotels, as well as hotels owned or leased by entities in which Hilton owns a noncontrolling financial interest.
6
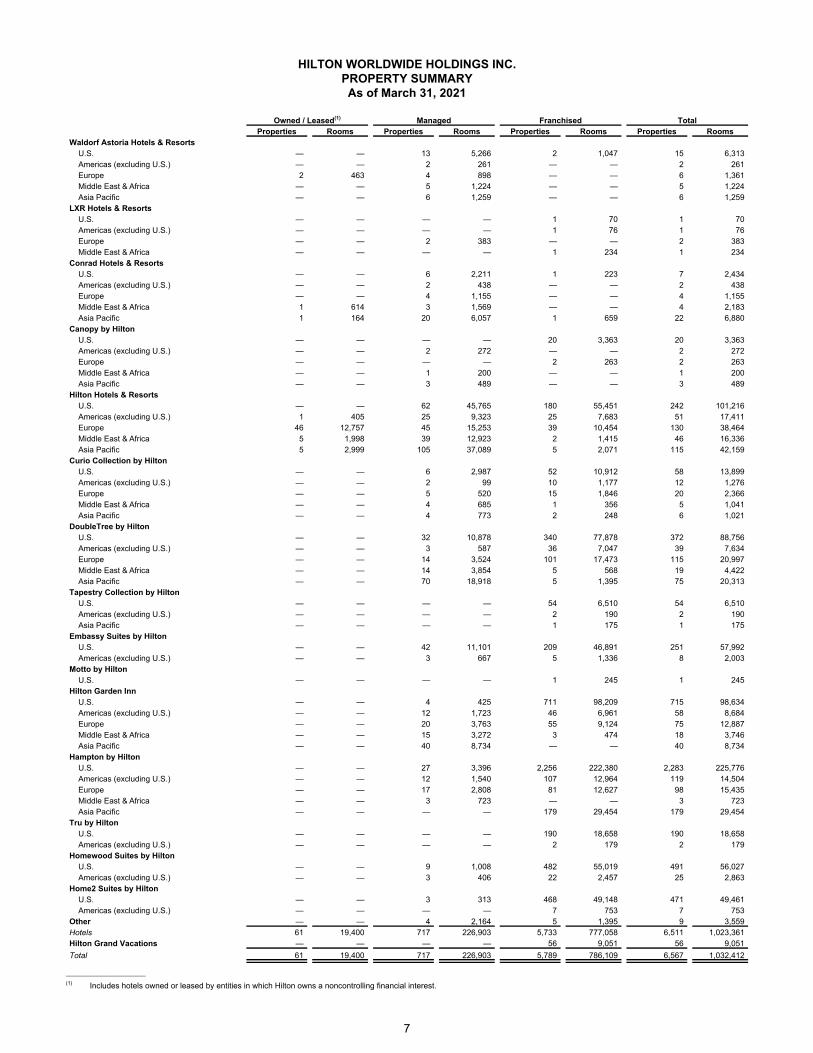
HILTON WORLDWIDE HOLDINGS INC.PROPERTY SUMMARYAs of March 31, 2021
Owned / Leased(1) Managed Franchised TotalProperties Rooms Properties Rooms Properties Rooms Properties Rooms
Waldorf Astoria Hotels & ResortsU.S. — — 13 5,266 2 1,047 15 6,313 Americas (excluding U.S.) — — 2 261 — — 2 261 Europe 2 463 4 898 — — 6 1,361 Middle East & Africa — — 5 1,224 — — 5 1,224 Asia Pacific — — 6 1,259 — — 6 1,259
LXR Hotels & ResortsU.S. — — — — 1 70 1 70 Americas (excluding U.S.) — — — — 1 76 1 76 Europe — — 2 383 — — 2 383 Middle East & Africa — — — — 1 234 1 234
Conrad Hotels & ResortsU.S. — — 6 2,211 1 223 7 2,434 Americas (excluding U.S.) — — 2 438 — — 2 438 Europe — — 4 1,155 — — 4 1,155 Middle East & Africa 1 614 3 1,569 — — 4 2,183 Asia Pacific 1 164 20 6,057 1 659 22 6,880
Canopy by HiltonU.S. — — — — 20 3,363 20 3,363 Americas (excluding U.S.) — — 2 272 — — 2 272 Europe — — — — 2 263 2 263 Middle East & Africa — — 1 200 — — 1 200 Asia Pacific — — 3 489 — — 3 489
Hilton Hotels & ResortsU.S. — — 62 45,765 180 55,451 242 101,216 Americas (excluding U.S.) 1 405 25 9,323 25 7,683 51 17,411 Europe 46 12,757 45 15,253 39 10,454 130 38,464 Middle East & Africa 5 1,998 39 12,923 2 1,415 46 16,336 Asia Pacific 5 2,999 105 37,089 5 2,071 115 42,159
Curio Collection by HiltonU.S. — — 6 2,987 52 10,912 58 13,899 Americas (excluding U.S.) — — 2 99 10 1,177 12 1,276 Europe — — 5 520 15 1,846 20 2,366 Middle East & Africa — — 4 685 1 356 5 1,041 Asia Pacific — — 4 773 2 248 6 1,021
DoubleTree by HiltonU.S. — — 32 10,878 340 77,878 372 88,756 Americas (excluding U.S.) — — 3 587 36 7,047 39 7,634 Europe — — 14 3,524 101 17,473 115 20,997 Middle East & Africa — — 14 3,854 5 568 19 4,422 Asia Pacific — — 70 18,918 5 1,395 75 20,313
Tapestry Collection by HiltonU.S. — — — — 54 6,510 54 6,510 Americas (excluding U.S.) — — — — 2 190 2 190 Asia Pacific — — — — 1 175 1 175
Embassy Suites by HiltonU.S. — — 42 11,101 209 46,891 251 57,992 Americas (excluding U.S.) — — 3 667 5 1,336 8 2,003
Motto by HiltonU.S. — — — — 1 245 1 245
Hilton Garden InnU.S. — — 4 425 711 98,209 715 98,634 Americas (excluding U.S.) — — 12 1,723 46 6,961 58 8,684 Europe — — 20 3,763 55 9,124 75 12,887 Middle East & Africa — — 15 3,272 3 474 18 3,746 Asia Pacific — — 40 8,734 — — 40 8,734
Hampton by HiltonU.S. — — 27 3,396 2,256 222,380 2,283 225,776 Americas (excluding U.S.) — — 12 1,540 107 12,964 119 14,504 Europe — — 17 2,808 81 12,627 98 15,435 Middle East & Africa — — 3 723 — — 3 723 Asia Pacific — — — — 179 29,454 179 29,454
Tru by HiltonU.S. — — — — 190 18,658 190 18,658 Americas (excluding U.S.) — — — — 2 179 2 179
Homewood Suites by HiltonU.S. — — 9 1,008 482 55,019 491 56,027 Americas (excluding U.S.) — — 3 406 22 2,457 25 2,863
Home2 Suites by HiltonU.S. — — 3 313 468 49,148 471 49,461 Americas (excluding U.S.) — — — — 7 753 7 753
Other — — 4 2,164 5 1,395 9 3,559 Hotels 61 19,400 717 226,903 5,733 777,058 6,511 1,023,361 Hilton Grand Vacations — — — — 56 9,051 56 9,051 Total 61 19,400 717 226,903 5,789 786,109 6,567 1,032,412
____________________(1) Includes hotels owned or leased by entities in which Hilton owns a noncontrolling financial interest.
7
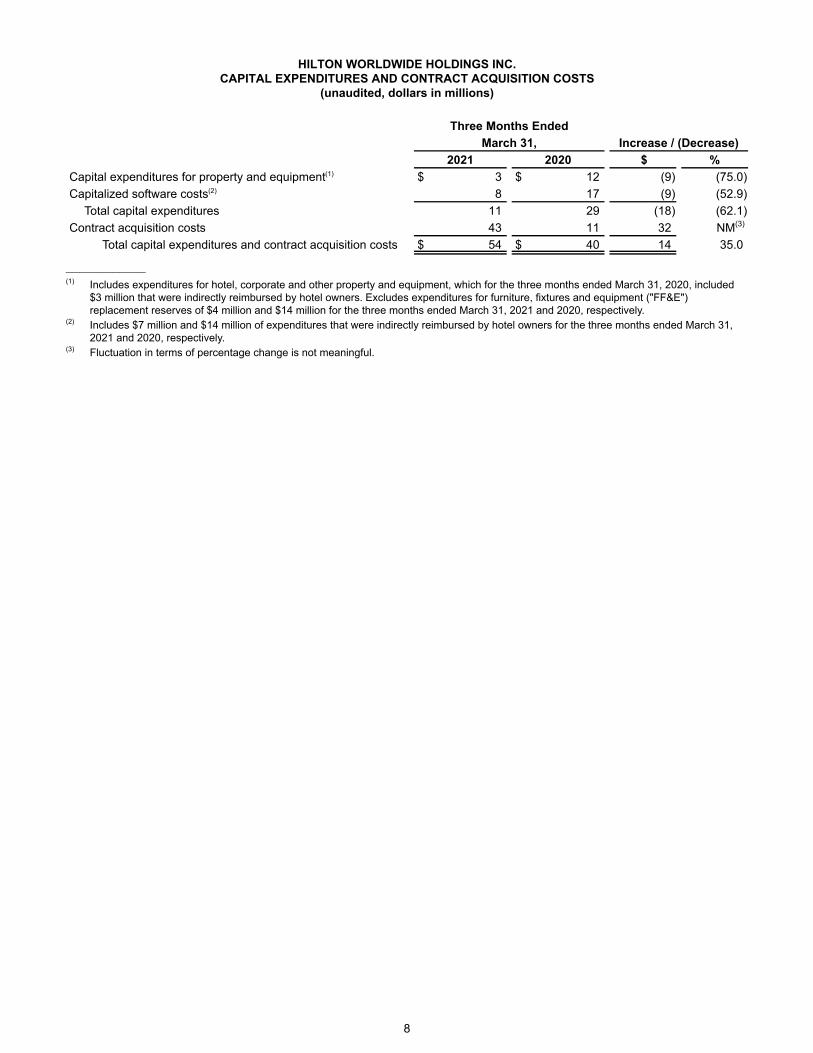
HILTON WORLDWIDE HOLDINGS INC.CAPITAL EXPENDITURES AND CONTRACT ACQUISITION COSTS
(unaudited, dollars in millions)
Three Months EndedMarch 31, Increase / (Decrease)
2021 2020 $ %Capital expenditures for property and equipment(1) $ 3 $ 12 (9) (75.0) Capitalized software costs(2) 8 17 (9) (52.9)
Total capital expenditures 11 29 (18) (62.1) Contract acquisition costs 43 11 32 NM(3)
Total capital expenditures and contract acquisition costs $ 54 $ 40 14 35.0
____________(1) Includes expenditures for hotel, corporate and other property and equipment, which for the three months ended March 31, 2020, included
$3 million that were indirectly reimbursed by hotel owners. Excludes expenditures for furniture, fixtures and equipment ("FF&E") replacement reserves of $4 million and $14 million for the three months ended March 31, 2021 and 2020, respectively.
(2) Includes $7 million and $14 million of expenditures that were indirectly reimbursed by hotel owners for the three months ended March 31, 2021 and 2020, respectively.
(3) Fluctuation in terms of percentage change is not meaningful.
8
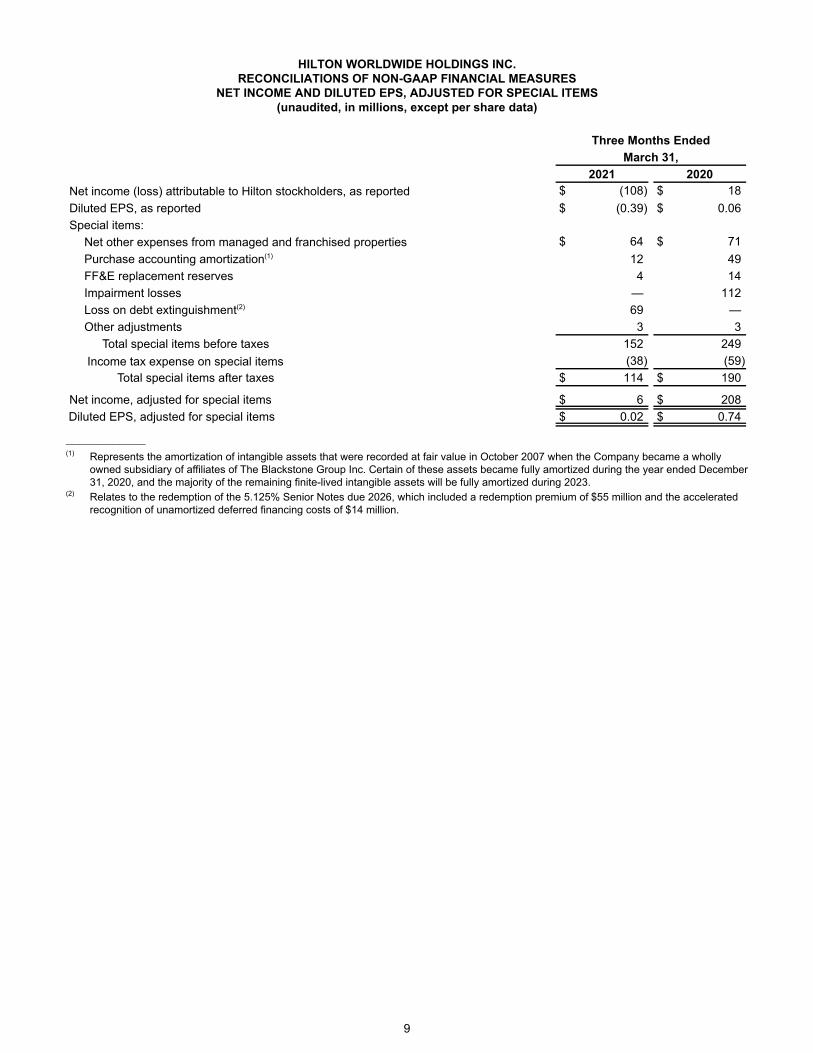
HILTON WORLDWIDE HOLDINGS INC.RECONCILIATIONS OF NON-GAAP FINANCIAL MEASURES
NET INCOME AND DILUTED EPS, ADJUSTED FOR SPECIAL ITEMS(unaudited, in millions, except per share data)
Three Months EndedMarch 31,
2021 2020Net income (loss) attributable to Hilton stockholders, as reported $ (108) $ 18 Diluted EPS, as reported $ (0.39) $ 0.06 Special items:
Net other expenses from managed and franchised properties $ 64 $ 71 Purchase accounting amortization(1) 12 49 FF&E replacement reserves 4 14 Impairment losses — 112 Loss on debt extinguishment(2) 69 — Other adjustments 3 3
Total special items before taxes 152 249 Income tax expense on special items (38) (59)
Total special items after taxes $ 114 $ 190
Net income, adjusted for special items $ 6 $ 208 Diluted EPS, adjusted for special items $ 0.02 $ 0.74
____________(1) Represents the amortization of intangible assets that were recorded at fair value in October 2007 when the Company became a wholly
owned subsidiary of affiliates of The Blackstone Group Inc. Certain of these assets became fully amortized during the year ended December 31, 2020, and the majority of the remaining finite-lived intangible assets will be fully amortized during 2023.
(2) Relates to the redemption of the 5.125% Senior Notes due 2026, which included a redemption premium of $55 million and the accelerated recognition of unamortized deferred financing costs of $14 million.
9
HILTON WORLDWIDE HOLDINGS INC.RECONCILIATIONS OF NON-GAAP FINANCIAL MEASURES
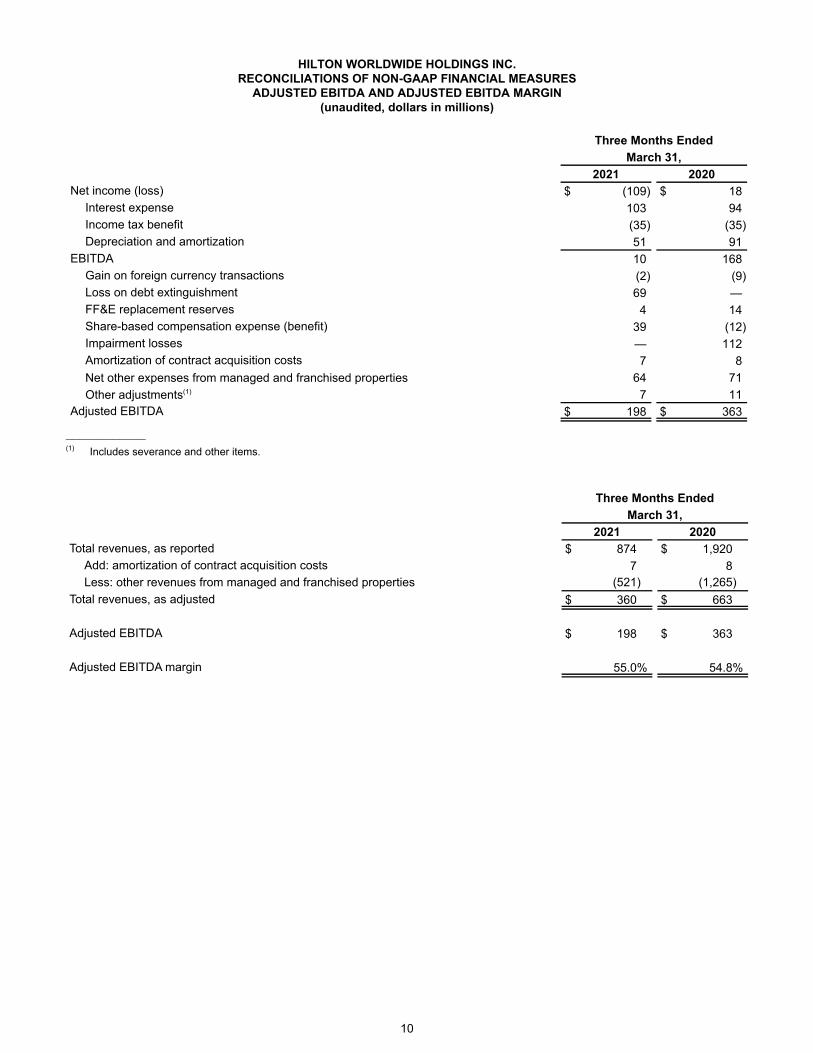
ADJUSTED EBITDA AND ADJUSTED EBITDA MARGIN(unaudited, dollars in millions)
Three Months EndedMarch 31,
2021 2020Net income (loss) $ (109) $ 18
Interest expense 103 94 Income tax benefit (35) (35) Depreciation and amortization 51 91
EBITDA 10 168 Gain on foreign currency transactions (2) (9) Loss on debt extinguishment 69 — FF&E replacement reserves 4 14 Share-based compensation expense (benefit) 39 (12) Impairment losses — 112 Amortization of contract acquisition costs 7 8 Net other expenses from managed and franchised properties 64 71 Other adjustments(1) 7 11
Adjusted EBITDA $ 198 $ 363
____________(1) Includes severance and other items.
Three Months EndedMarch 31,
2021 2020Total revenues, as reported $ 874 $ 1,920
Add: amortization of contract acquisition costs 7 8 Less: other revenues from managed and franchised properties (521) (1,265)
Total revenues, as adjusted $ 360 $ 663
Adjusted EBITDA $ 198 $ 363
Adjusted EBITDA margin 55.0% 54.8%
10
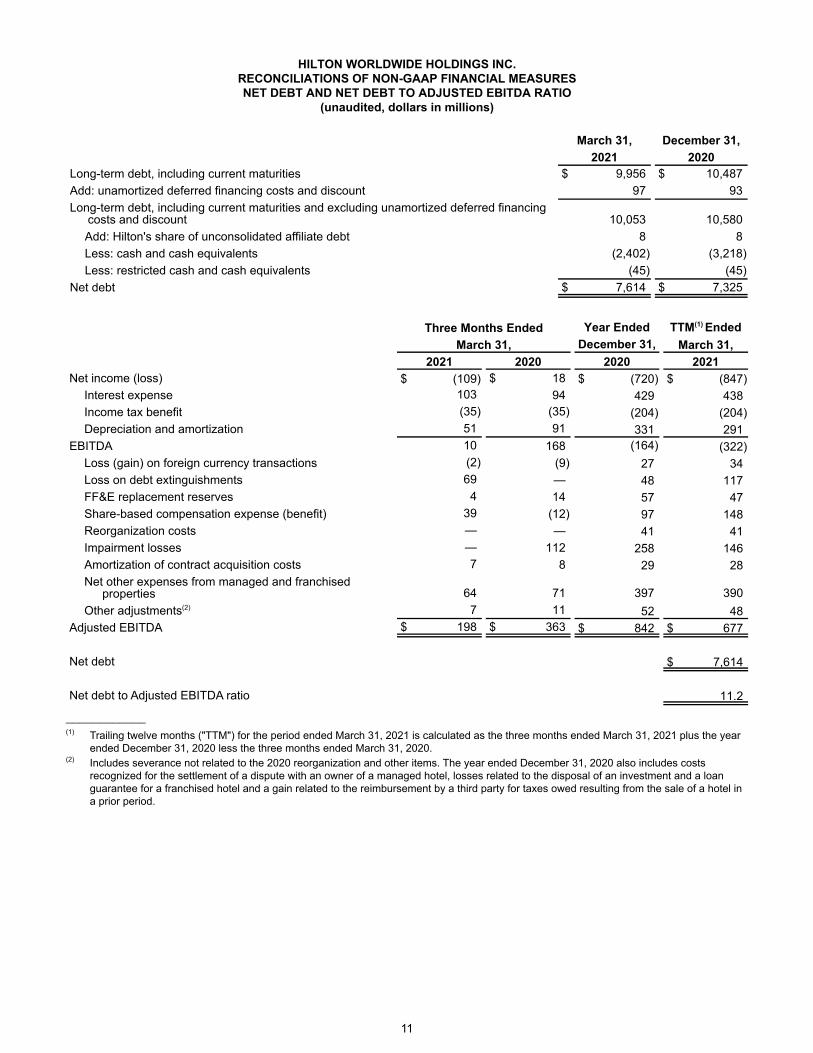
HILTON WORLDWIDE HOLDINGS INC.RECONCILIATIONS OF NON-GAAP FINANCIAL MEASURESNET DEBT AND NET DEBT TO ADJUSTED EBITDA RATIO
(unaudited, dollars in millions)
March 31, December 31,2021 2020
Long-term debt, including current maturities $ 9,956 $ 10,487 Add: unamortized deferred financing costs and discount 97 93 Long-term debt, including current maturities and excluding unamortized deferred financing
costs and discount 10,053 10,580 Add: Hilton's share of unconsolidated affiliate debt 8 8 Less: cash and cash equivalents (2,402) (3,218) Less: restricted cash and cash equivalents (45) (45)
Net debt $ 7,614 $ 7,325
Three Months Ended Year Ended TTM(1) EndedMarch 31, December 31, March 31,
2021 2020 2020 2021Net income (loss) $ (109) $ 18 $ (720) $ (847)
Interest expense 103 94 429 438 Income tax benefit (35) (35) (204) (204) Depreciation and amortization 51 91 331 291
EBITDA 10 168 (164) (322) Loss (gain) on foreign currency transactions (2) (9) 27 34 Loss on debt extinguishments 69 — 48 117 FF&E replacement reserves 4 14 57 47 Share-based compensation expense (benefit) 39 (12) 97 148 Reorganization costs — — 41 41 Impairment losses — 112 258 146 Amortization of contract acquisition costs 7 8 29 28 Net other expenses from managed and franchised
properties 64 71 397 390 Other adjustments(2) 7 11 52 48
Adjusted EBITDA $ 198 $ 363 $ 842 $ 677
Net debt $ 7,614
Net debt to Adjusted EBITDA ratio 11.2
____________(1) Trailing twelve months ("TTM") for the period ended March 31, 2021 is calculated as the three months ended March 31, 2021 plus the year
ended December 31, 2020 less the three months ended March 31, 2020.(2) Includes severance not related to the 2020 reorganization and other items. The year ended December 31, 2020 also includes costs
recognized for the settlement of a dispute with an owner of a managed hotel, losses related to the disposal of an investment and a loan guarantee for a franchised hotel and a gain related to the reimbursement by a third party for taxes owed resulting from the sale of a hotel in a prior period.
11
HILTON WORLDWIDE HOLDINGS INC.DEFINITIONS
Trailing Twelve Month Financial Information
This press release includes certain unaudited financial information for the TTM period ended March 31, 2021, which is calculated as the three months ended March 31, 2021 plus the year ended December 31, 2020 less the three months ended March 31, 2020. This presentation is not in accordance with GAAP. However, the Company believes that this presentation provides useful information to investors regarding its recent financial performance, and it views this presentation of the four most recently completed fiscal quarters as a key measurement period for investors to assess its historical results. In addition, the Company's management uses TTM information to evaluate the Company's financial performance for ongoing planning purposes.
The COVID-19 pandemic had a material adverse impact on the Company's results for the TTM period ended March 31, 2021, and the Company expects it will continue to have a significant adverse impact on the Company's results of operations in the near term. As such, this interim period, as well as upcoming periods, are unlikely to be comparable to periods prior to the onset of the pandemic or to other periods affected by the pandemic, and are not indicative of future performance. As such, TTM information may not be useful for projecting future operating results.
Net Income (Loss), Adjusted for Special Items, and Diluted EPS, Adjusted for Special Items
Net income (loss), adjusted for special items, and diluted earnings (loss) per share ("EPS"), adjusted for special items, are not recognized terms under GAAP and should not be considered as alternatives to net income (loss) or other measures of financial performance or liquidity derived in accordance with GAAP. In addition, the Company's definition of net income (loss), adjusted for special items, and diluted EPS, adjusted for special items, may not be comparable to similarly titled measures of other companies.
Net income (loss), adjusted for special items, and diluted EPS, adjusted for special items, are included to assist investors in performing meaningful comparisons of past, present and future operating results and as a means of highlighting the results of the Company's ongoing operations.
EBITDA, Adjusted EBITDA and Adjusted EBITDA Margin
Earnings (loss) before interest expense, taxes and depreciation and amortization ("EBITDA"), presented herein, reflects net income (loss), excluding interest expense, a provision for income tax benefit (expense) and depreciation and amortization.
Adjusted EBITDA, presented herein, is calculated as EBITDA, as previously defined, further adjusted to exclude certain items, including gains, losses, revenues and expenses in connection with: (i) asset dispositions for both consolidated and unconsolidated equity investments; (ii) foreign currency transactions; (iii) debt restructurings and retirements; (iv) FF&E replacement reserves required under certain lease agreements; (v) share-based compensation; (vi) reorganization, severance, relocation and other expenses; (vii) non-cash impairment; (viii) amortization of contract acquisition costs; (ix) the net effect of reimbursable costs included in other revenues and other expenses from managed and franchised properties; and (x) other items.
Adjusted EBITDA margin represents Adjusted EBITDA as a percentage of total revenues, adjusted to exclude the amortization of contract acquisition costs and other revenues from managed and franchised properties.
The Company believes that EBITDA, Adjusted EBITDA and Adjusted EBITDA margin provide useful information to investors about the Company and its financial condition and results of operations for the following reasons: (i) these measures are among the measures used by the Company's management team to evaluate its operating performance and make day-to-day operating decisions and (ii) these measures are frequently used by securities analysts, investors and other interested parties as a common performance measure to compare results or estimate valuations across companies in the industry. Additionally, these measures exclude certain items that can vary widely across different industries and among competitors within the Company's industry. For instance, interest expense and income taxes are dependent on company specifics, including, among other things, capital structure and operating jurisdictions, respectively, and, therefore, could vary significantly across companies. Depreciation and amortization, as well as amortization of contract acquisition costs, are dependent upon company policies, including the method of acquiring and depreciating assets and the useful lives that are used. For Adjusted EBITDA, the Company also excludes items such as: (i) FF&E replacement reserves for leased hotels to be consistent with the treatment of FF&E for owned hotels, where it is capitalized and depreciated over the life of the FF&E; (ii) share-based compensation, as this could vary widely among companies due to the different plans in place and the usage of them; (iii) the net effect of the Company's cost reimbursement revenues and reimbursed expenses, as the Company contractually does not operate the related programs to generate a profit over the terms of the respective contracts; and (iv) other items, such as amounts related to debt restructurings and retirements and reorganization and related severance costs, that are not core to the Company's operations and are not reflective of the Company's operating performance.
EBITDA, Adjusted EBITDA and Adjusted EBITDA margin are not recognized terms under GAAP and should not be considered as alternatives to net income (loss) or other measures of financial performance or liquidity derived in accordance with GAAP. The
12
Company's definitions of EBITDA, Adjusted EBITDA and Adjusted EBITDA margin may not be comparable to similarly titled measures of other companies and may have limitations as analytical tools.
Net Debt and Net Debt to Adjusted EBITDA Ratio
Net debt and net debt to Adjusted EBITDA ratio, presented herein, are non-GAAP financial measures that the Company uses to evaluate its financial leverage. Net debt is calculated as: (i) long-term debt, including current maturities and excluding unamortized deferred financing costs and discount and (ii) the Company's share of unconsolidated affiliate debt; reduced by: (a) cash and cash equivalents and (b) restricted cash and cash equivalents. Net debt should not be considered as a substitute to debt presented in accordance with GAAP and net debt to Adjusted EBITDA ratio should not be considered as an alternative to measures of financial condition derived in accordance with GAAP. Net debt and net debt to Adjusted EBITDA ratio may not be comparable to a similarly titled measures of other companies.
The Company believes net debt and net debt to Adjusted EBITDA ratio provide useful information about its indebtedness to investors as they are frequently used by securities analysts, investors and other interested parties to compare the indebtedness of companies.
Comparable Hotels
The Company defines comparable hotels as those that: (i) were active and operating in the Company's system for at least one full calendar year as of the end of the current period, and open January 1st of the previous year; (ii) have not undergone a change in brand or ownership type during the current or comparable periods reported; and (iii) have not sustained substantial property damage, business interruption, undergone large-scale capital projects or for which comparable results were not available. Of the 6,511 hotels in the Company's system as of March 31, 2021, 5,642 hotels were classified as comparable hotels. The 869 non-comparable hotels included 48 hotels, or less than one percent of the total hotels in the system, that were removed from the comparable group during the last twelve months because they sustained substantial property damage, business interruption, underwent large-scale capital projects or comparable results were otherwise not available.
When considering business interruption in the context of the Company's definition of comparable hotels, any hotel that had completely or partially suspended operations on a temporary basis at any point as a result of the COVID-19 pandemic was considered to be part of the definition of comparable hotels. Despite these temporary suspensions of hotel operations, the Company believes that including these hotels within the hotel operating statistics of occupancy, average daily rate ("ADR") and revenue per available room ("RevPAR"), reflects the underlying results of the business for the three months ended March 31, 2021 and 2020.
Occupancy
Occupancy represents the total number of room nights sold divided by the total number of room nights available at a hotel or group of hotels for a given period. Occupancy measures the utilization of the hotels' available capacity. Management uses occupancy to gauge demand at a specific hotel or group of hotels in a given period. Occupancy levels also help management determine achievable ADR pricing levels as demand for hotel rooms increases or decreases.
ADR
ADR represents hotel room revenue divided by the total number of room nights sold for a given period. ADR measures average room price attained by a hotel, and ADR trends provide useful information concerning the pricing environment and the nature of the customer base of a hotel or group of hotels. ADR is a commonly used performance measure in the industry, and management uses ADR to assess pricing levels that the Company is able to generate by type of customer, as changes in rates charged to customers have different effects on overall revenues and incremental profitability than changes in occupancy, as described above.
RevPAR
RevPAR is calculated by dividing hotel room revenue by the total number of room nights available to guests for a given period. Management considers RevPAR to be a meaningful indicator of the Company's performance as it provides a metric correlated to two primary and key drivers of operations at a hotel or group of hotels, as previously described: occupancy and ADR. RevPAR is also a useful indicator in measuring performance over comparable periods for comparable hotels.
References to RevPAR, ADR and occupancy throughout this press release are presented on a comparable basis, and references to RevPAR and ADR are presented on a currency neutral basis, unless otherwise noted. As such, comparisons of these hotel operating statistics for the three months ended March 31, 2021 and 2020 use the exchange rates for the three months ended March 31, 2021.
13