Embed Size (px)
Citation preview
LJournal of Experimental Marine Biology and Ecology,212 (1997) 239–258
Histological indices of the nutritional condition of sardine,Sardina pilchardus (Walbaum) larvae off the north coast of
Spain
*I.R.B. McFadzen , S.H. Coombs, N.C. HallidayNatural Environment Research Council, Plymouth Marine Laboratory, Prospect Place, West Hoe,
Plymouth, PL1 3DH, UK
Received 25 January 1996; revised 27 September 1996; accepted 10 October 1996
Abstract
Larvae of sardine (Sardina pilchardus) were sampled off the north coast of Spain from March toJune 1992 as part of a programme to investigate factors affecting subsequent recruitment.Histological analyses of the larvae were carried out as a measure of nutritional condition forcomparison with environmental variables and subsequent survival at the juvenile stage. Tissueswere grouped into short-term indicators of nutritional condition, including the digestive tract, liverand pancreas, and long-term indicators represented by cartilage, notochord and muscle tissue.Long-term indices showed little difference between months, most specimens being in relativelygood condition. Short-term indices showed greater variation because larvae sampled in March andMay were in significantly poorer condition than those in April and June. A third measure ofcondition, the presence of irreversibly damaged tissue indicated that larvae sampled in March werein the poorest condition. This measure of condition was suggested as being the most objectiveassessment with respect to potential larval mortality. It was not possible to compare larvalcondition with survival to the juvenile stage because only an insignificant number of larvae fromspawning along the north coast of Spain recruited to the nursery area; most juveniles were derivedfrom spawning further to the south. It was suggested that offshore transport associated withupwelling off the north-west coast was responsible for the loss of larvae from the north coast andmay be a more significant factor in determining recruitment than nutritional condition. 1997Elsevier Science B.V.
Keywords: Histological analyses; Nutritional condition; Sardina pilchardus
*Corresponding author.
0022-0981/97/$17.00 1997 Elsevier Science B.V. All rights reservedPII S0022-0981( 96 )02755-4
240 I.R.B. McFadzen et al. / J. Exp. Mar. Biol. Ecol. 212 (1997) 239 –258
1. Introduction
The concept of a critical period in the early life-history of fish larvae is wellestablished, with variability in larval mortality being recognised as an important factoraffecting subsequent recruitment (May, 1974; Heath, 1992). Low food availability is asignificant determinant of larval mortality (Hunter, 1976) and is also reflected in lownutritional condition (Theilacker and Watanabe, 1989). Measures of larval condition can,
˚therefore, be used as indicators of survival and potential recruitment (Hakanson, 1993).Various analyses of nutritional condition of fish larvae have been reported (e.g.,
˚elemental composition, Ehrlich, 1974; histology, O’Connell, 1980; lipids, Hakanson,1989; morphometry, Frank and McRuer, 1989; RNA:DNA ratio, Clemmesen, 1987;otolith growth rate, Campana and Neilson, 1985). In the present study a set ofhistological criteria, as originally outlined by O’Connell (1976) for determiningcondition in anchovy larvae (Engraulis mordax), were used to investigate changes incondition of sardine (Sardina pilchardus) larvae off the north and north-west coasts ofSpain. Advantages of the histological approach are the ability to grade a number oftissues in an individual larva and to differentiate between short-term and long-term fooddeprivation (O’Connell, 1976).
The present study forms part of a European SARP programme (Sardine AnchovyRecruitment Project; IOC, 1989) in which larval abundance (Fig. 1) is compared withsubsequent juvenile recruitment and related to environmental conditions during the
´larval phase (Lopez-Jamar et al., in press). The nutritional condition of larvae describedin the present paper, based on histological criteria, was also measured for comparisonwith juvenile recruitment and food availability during the larval phase.
2. Materials and methods
2.1. Larval sampling
Sampling for sardine larvae was carried out on a series of five cruises along the north´and north-west coasts of Spain between March and July 1992 (Lopez-Jamar et al., in
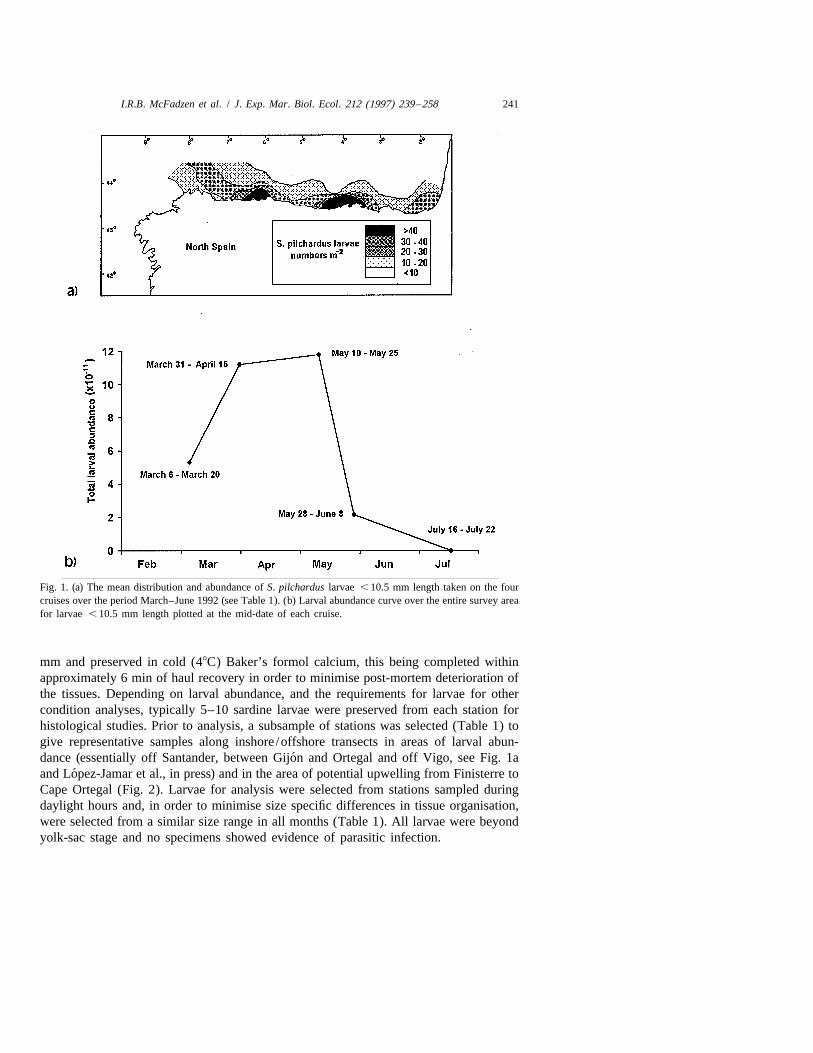
press). Plankton sampling was by means of oblique slow speed ( | 2.5 knot) 50 cmdiameter bongo net tows (200 mm mesh aperture) to 100 m depth, or within 10 m of thebottom. Station positions were based on 8 nautical mile spacings extending out from thecoast (Fig. 2). For collection of microzooplankton, a fine mesh (53 mm mesh aperture)10 cm diameter bongo net was mounted above the main nets. Flowmeters were fitted toone side of each set of nets to measure the volume of water filtered. At all stations CTDdepth profiles were obtained. Few larvae were available on the final cruise (16–22 July;Fig. 1b) thus restricting the present study to specimens taken on the first four cruisesbetween March and June (Table 1).
On completion of a haul ( | 10 min duration), the nets were briefly rinsed beforeremoval of the cod-ends for preservation of the 53 mm mesh samples (4% formaldehydesolution) and preliminary sorting of the 200 mm mesh samples for sardine larvae.Specimens for histological analyses were measured (standard length) to the nearest 0.1
I.R.B. McFadzen et al. / J. Exp. Mar. Biol. Ecol. 212 (1997) 239 –258 241
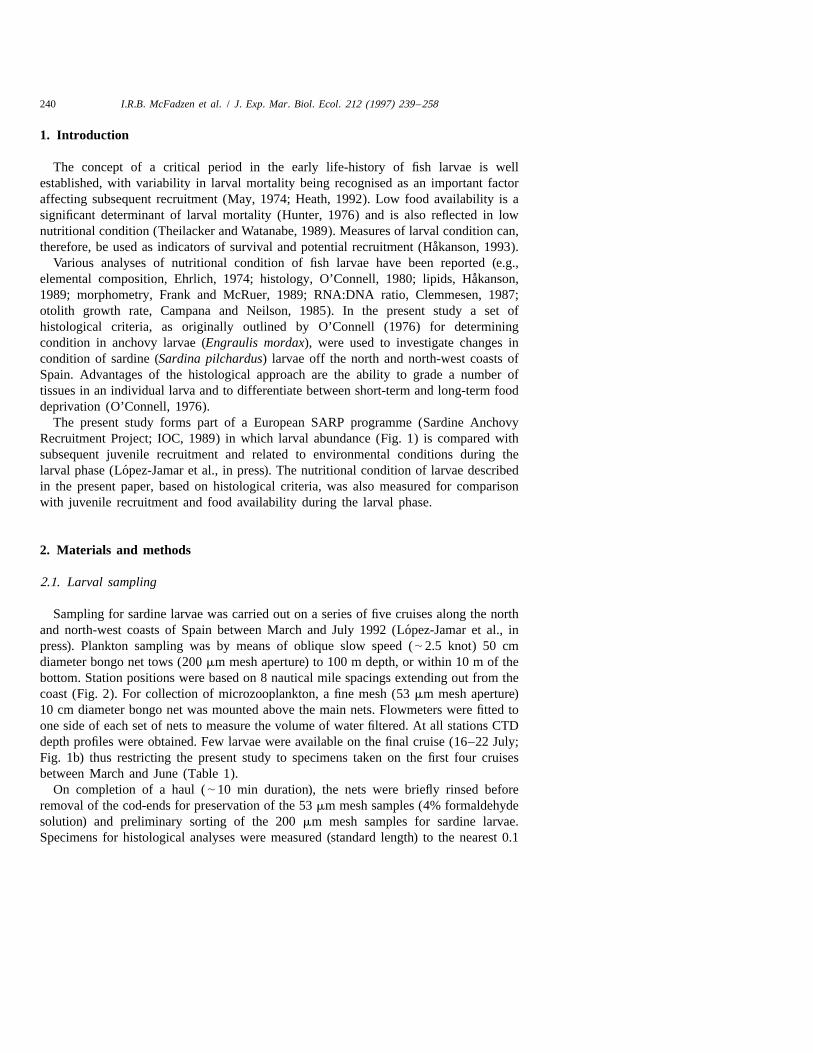
Fig. 1. (a) The mean distribution and abundance of S. pilchardus larvae , 10.5 mm length taken on the fourcruises over the period March–June 1992 (see Table 1). (b) Larval abundance curve over the entire survey areafor larvae , 10.5 mm length plotted at the mid-date of each cruise.
mm and preserved in cold (48C) Baker’s formol calcium, this being completed withinapproximately 6 min of haul recovery in order to minimise post-mortem deterioration ofthe tissues. Depending on larval abundance, and the requirements for larvae for othercondition analyses, typically 5–10 sardine larvae were preserved from each station forhistological studies. Prior to analysis, a subsample of stations was selected (Table 1) togive representative samples along inshore /offshore transects in areas of larval abun-
´dance (essentially off Santander, between Gijon and Ortegal and off Vigo, see Fig. 1a´and Lopez-Jamar et al., in press) and in the area of potential upwelling from Finisterre to
Cape Ortegal (Fig. 2). Larvae for analysis were selected from stations sampled duringdaylight hours and, in order to minimise size specific differences in tissue organisation,were selected from a similar size range in all months (Table 1). All larvae were beyondyolk-sac stage and no specimens showed evidence of parasitic infection.
242 I.R.B. McFadzen et al. / J. Exp. Mar. Biol. Ecol. 212 (1997) 239 –258
Fig. 2. Station positions for the four cruises off northern Spain. Dots indicate station positions and the adjacentnumbers indicate the number of months in which specimens were taken for histological grading.
The remainder of the 200 mm sample was preserved in 4% formaldehyde solution for´subsequent analysis of the remaining sardine larvae (Lopez-Jamar et al., in press). The
53 mm microzooplankton were analysed for the prey items selected by sardine larvae, asdetermined from gut content analysis, essentially these being copepod eggs, nauplii andcopepodite stages (Conway et al., 1991), to give food concentrations by area and cruise(Conway et al., 1994).
2.2. Histology
Subsequent to the cruise the preserved larvae were processed for methacrylateembedding (McFadzen et al., 1994). Larvae were then serially sectioned at 1–3 mmTable 1Sample information
Cruise Dates (1992) No. of No. of No. of Standard lengthstations larvae larvae of larvae inselected examined graded for which all tissuesfor analysis histologically all tissues were graded
Mean (mm)6S.D.
BO Cornide de Saavedra 6 March–20 March 11 46 37 5.9961.66MarchBO Cornide de Saavedra 31 March–15 April 13 70 64 7.0361.81AprilFS Valdivia 10 May–25 May 11 51 39 6.3561.08MayRRS Challenger 28 May–8 June 15 73 67 6.4161.94June
I.R.B. McFadzen et al. / J. Exp. Mar. Biol. Ecol. 212 (1997) 239 –258 243
intervals in the sagittal plane, using Ralph glass knives and stained in Lee’s methyleneblue–basic fuchsin (Bennett et al., 1976). The plane of sectioning was approximate andno attempt was made to straighten larvae. Glycogen activity in the hepatic vacuoles andoesophageal goblet cells was determined from sections stained in periodic acid–Schiff(PAS) with an amylase control and coverslips mounted in Canada balsam (Bancroft,1967).
2.3. Histological grading
The nutritional condition of larvae was based on the histological grading of thecellular condition of selected tissues, as outlined below, based on criteria used byO’Connell (1976) for anchovy (Engraulis mordax) larvae. Tissues were graded from therelatively labile digestive tract and associated glands (Table 2) with rapid response timesto food deprivation (McFadzen et al., 1994), to the more resistant tissues of the cartilage,notochord and muscle (Table 3). These latter tissues are relatively robust as laboratorystudies have demonstrated that damage occurs only after prolonged periods of fooddeprivation (Theilacker, 1986; McFadzen et al., 1994). The histological variables used todetermine the extent of nutritional stress show growth and differentiation during normaldevelopment, but are not capable of demonstrating major changes in morphologicalorganisation between the different sizes of larvae studied.
Initial inspection of the tissues was carried out to reject specimens with evidence ofautolytic degradation (Hibiya, 1982). Examination of the remaining larvae was carried
¨out with a Wild M20 microscope using standard Kholer illumination. Before assigningthe nutritional grade to a particular tissue, multiple sections taken throughout each larvawere examined for a representative assessment of the overall degree of tissue conditionwithin the specimen. The classification of a tissue grade was based on the poorestobserved condition of each specific tissue. It was not unusual for a specimen to have asuperficially healthy tissue condition, but when additional sections of the same tissuewere viewed, they were found to have regions of degenerative necrosis. Such foci ofnecrosis are irreversible and hence indicative of poorest possible condition.
Multiple sections were examined to assess the degree of tissue alteration throughoutthe specimen and each selected tissue variable assigned one of three grades (see Tables 2and 3) from healthy (scoring 1) to degraded (scoring 3) based on the poorest observedcondition in each specific tissue. The nutritional condition of each larva was thencharacterised as the mean score for all variables in all tissues indicative of eithershort-term (Table 2) or long-term (Table 3) food deprivation. The results used were onlythose for larvae in which all tissues could be assessed. A modification of O’Connell’s(O’Connell, 1976) method was to grade the foregut rather than the hindgut region of thedigestive tract. O’Connell (1976) stated that the condition of anchovy larvae could beevaluated from histological grading that does not include the status of the hindgutinclusions; therefore, this tissue characteristic was not graded in the present study. Theforegut was chosen for grading primarily due to the close physical association of theforegut to the hepato–pancreatic tissues and the ease of locating this tissue followingsectioning of any larvae with strong lateral bends. An additional record was kept oflarvae which had one or more extensively necrotic tissues, a condition comparable to the
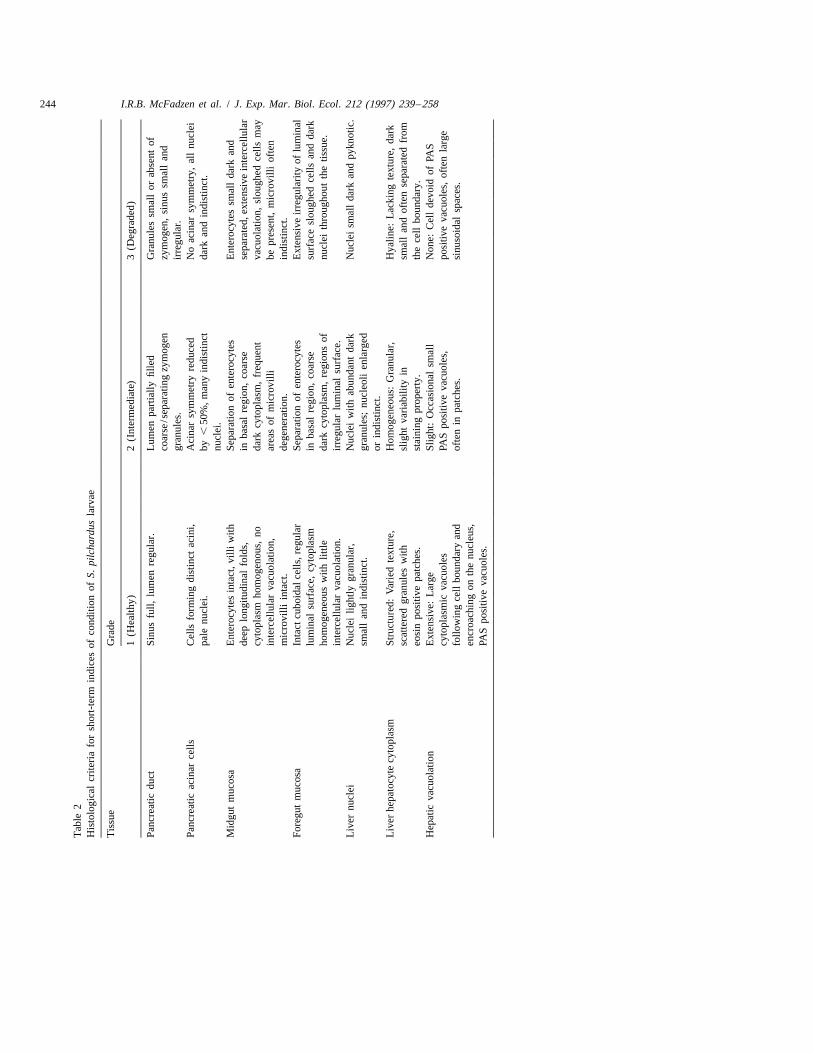
244 I.R.B. McFadzen et al. / J. Exp. Mar. Biol. Ecol. 212 (1997) 239 –258
Tab
le2
His
tolo
gica
lcr
iteri
afo
rsh
ort-
term
indi
ces
ofco
nditi
onof
S.pi
lcha
rdus
larv
ae
Tis
sue
Gra
de
1(H
ealth
y)2
(Int
erm
edia
te)
3(D
egra
ded)
Panc
reat
icdu
ctSi
nus
full,
lum
enre
gula
r.L
umen
part
ially
fille
dG
ranu
les
smal
lor
abse
ntof
coar
se/s
epar
atin
gzy
mog
enzy
mog
en,
sinu
ssm
all
and
gran
ules
.ir
regu
lar.
Panc
reat
icac
inar
cells
Cel
lsfo
rmin
gdi
stin
ctac
ini,
Aci
nar
sym
met
ryre
duce
dN
oac
inar
sym
met
ry,
all
nucl
eipa
lenu
clei
.by
,50
%,m
any
indi
stin
ctda
rkan
din
dist
inct
.nu
clei
.M
idgu
tm
ucos
aE
nter
ocyt
esin
tact
,vill
iw
ithSe
para
tion
ofen
tero
cyte
sE
nter
ocyt
essm
all
dark
and
deep
long
itudi
nal
fold
s,in
basa
lre
gion
,co
arse
sepa
rate
d,ex
tens
ive
inte
rcel
lula
rcy
topl
asm
hom
ogen
ous,
noda
rkcy
topl
asm
,fr
eque
ntva
cuol
atio
n,sl
ough
edce
llsm
ayin
terc
ellu
lar
vacu
olat
ion,
area
sof
mic
rovi
llibe
pres
ent,
mic
rovi
lliof
ten
mic
rovi
lliin
tact
.de
gene
ratio
n.in
dist
inct
.Fo
regu
tm
ucos
aIn
tact
cubo
idal
cells
,reg
ular
Sepa
ratio
nof
ente
rocy
tes
Ext
ensi
veir
regu
lari
tyof
lum
inal
lum
inal
surf
ace,
cyto
plas
min
basa
lre
gion
,co
arse
surf
ace
slou
ghed
cells
and
dark
hom
ogen
eous
with
little
dark
cyto
plas
m,
regi
ons
ofnu
clei
thro
ugho
utth
etis
sue.
inte
rcel
lula
rva
cuol
atio
n.ir
regu
lar
lum
inal
surf
ace.
Liv
ernu
clei
Nuc
lei
light
lygr
anul
ar,
Nuc
lei
with
abun
dant
dark
Nuc
lei
smal
lda
rkan
dpy
knot
ic.
smal
lan
din
dist
inct
.gr
anul
es;
nucl
eoli
enla
rged
orin
dist
inct
.L
iver
hepa
tocy
tecy
topl
asm
Stru
ctur
ed:
Var
ied
text
ure,
Hom
ogen
eous
:G
ranu
lar,
Hya
line:
Lac
king
text
ure,
dark
scat
tere
dgr
anul
esw
ithsl
ight
vari
abili
tyin
smal
lan
dof
ten
sepa
rate
dfr
omeo
sin
posi
tive
patc
hes.
stai
ning
prop
erty
.th
ece
llbo
unda
ry.
Hep
atic
vacu
olat
ion
Ext
ensi
ve:
Lar
geSl
ight
:O
ccas
iona
lsm
all
Non
e:C
ell
devo
idof
PAS
cyto
plas
mic
vacu
oles
PAS
posi
tive
vacu
oles
,po
sitiv
eva
cuol
es,
ofte
nla
rge
follo
win
gce
llbo
unda
ryan
dof
ten
inpa
tche
s.si
nuso
idal
spac
es.
encr
oach
ing
onth
enu
cleu
s,PA
Spo
sitiv
eva
cuol
es.
I.R.B. McFadzen et al. / J. Exp. Mar. Biol. Ecol. 212 (1997) 239 –258 245
Table 3Histological criteria for long-term indices of condition of S. pilchardus larvae
Tissue Grade
1 (Healthy) 2 (Intermediate) 3 (Degraded)
Cartilage Chondrocyte nuclei Nuclei in variable Condensed nuclei,round and granular, degree of condensation, cytoplasm reduced,capsular space filled cytoplasm often collapse ofwith cytoplasm. contracted to occupy chondrocytes within
only a portion of the capsular matrix shell.capsular space.
Notochord No separation of the Isolated regions of Extensive shrinkageturgid notochord from notochord shrinkage. away from the trunktrunk muscle. muscle.
Trunk muscle Parallel fibres, Slight separation of Pronounced fibremyofibrils striated, fibres, loss of myofibril separation, highlyabundant basophilic striation, variable reduced myofibrilinterfibril tissue. nuclear staining, striations, dark
reduced basophilic indistinct nuclei.tissue.
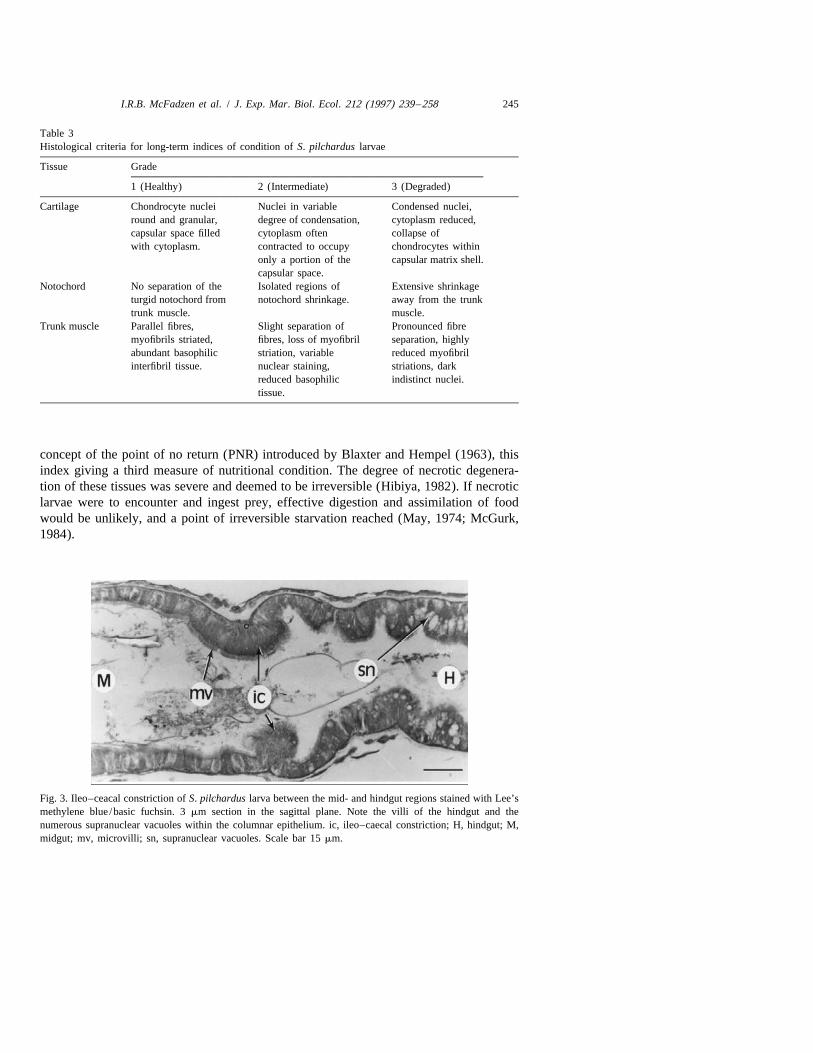
concept of the point of no return (PNR) introduced by Blaxter and Hempel (1963), thisindex giving a third measure of nutritional condition. The degree of necrotic degenera-tion of these tissues was severe and deemed to be irreversible (Hibiya, 1982). If necroticlarvae were to encounter and ingest prey, effective digestion and assimilation of foodwould be unlikely, and a point of irreversible starvation reached (May, 1974; McGurk,1984).
Fig. 3. Ileo–ceacal constriction of S. pilchardus larva between the mid- and hindgut regions stained with Lee’smethylene blue /basic fuchsin. 3 mm section in the sagittal plane. Note the villi of the hindgut and thenumerous supranuclear vacuoles within the columnar epithelium. ic, ileo–caecal constriction; H, hindgut; M,midgut; mv, microvilli; sn, supranuclear vacuoles. Scale bar 15 mm.
246 I.R.B. McFadzen et al. / J. Exp. Mar. Biol. Ecol. 212 (1997) 239 –258
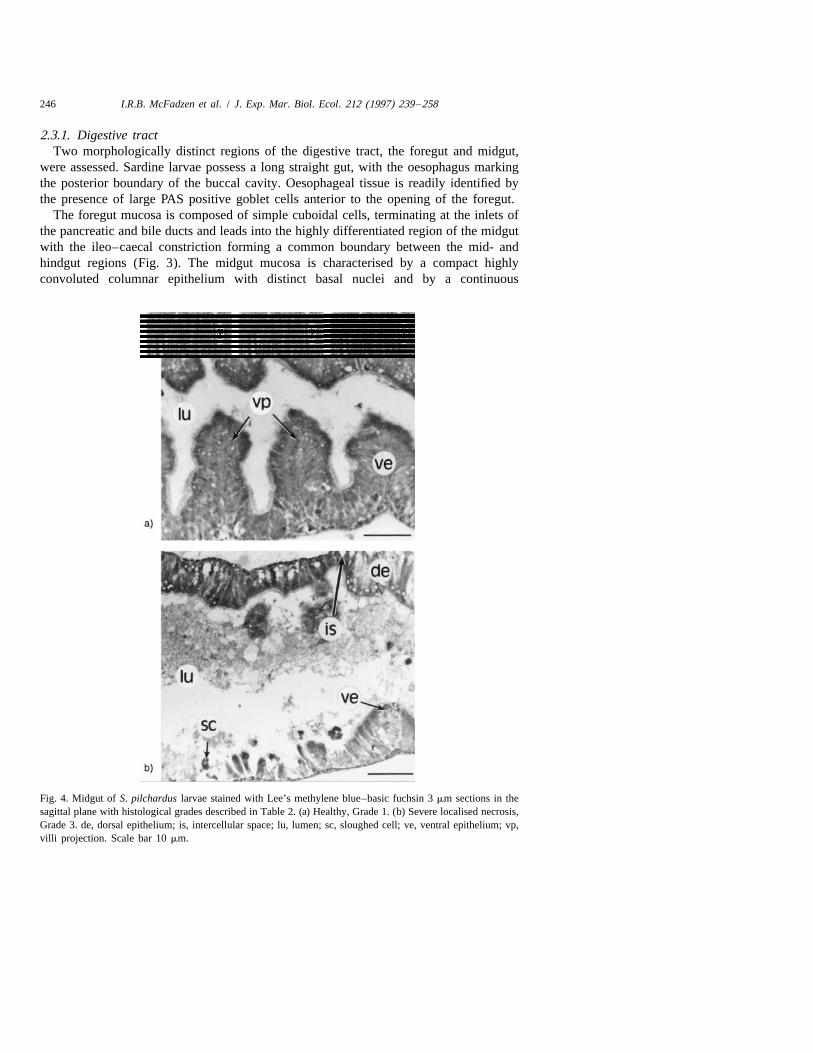
2.3.1. Digestive tractTwo morphologically distinct regions of the digestive tract, the foregut and midgut,
were assessed. Sardine larvae possess a long straight gut, with the oesophagus markingthe posterior boundary of the buccal cavity. Oesophageal tissue is readily identified bythe presence of large PAS positive goblet cells anterior to the opening of the foregut.
The foregut mucosa is composed of simple cuboidal cells, terminating at the inlets ofthe pancreatic and bile ducts and leads into the highly differentiated region of the midgutwith the ileo–caecal constriction forming a common boundary between the mid- andhindgut regions (Fig. 3). The midgut mucosa is characterised by a compact highlyconvoluted columnar epithelium with distinct basal nuclei and by a continuous
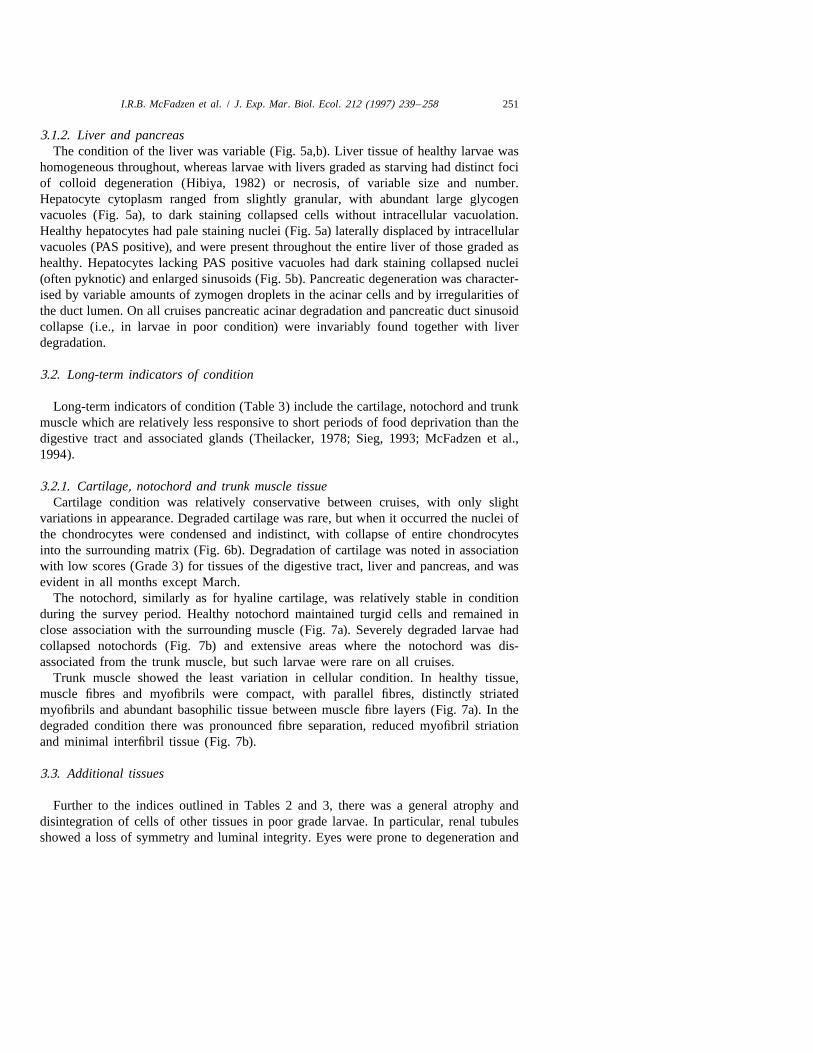
Fig. 4. Midgut of S. pilchardus larvae stained with Lee’s methylene blue–basic fuchsin 3 mm sections in thesagittal plane with histological grades described in Table 2. (a) Healthy, Grade 1. (b) Severe localised necrosis,Grade 3. de, dorsal epithelium; is, intercellular space; lu, lumen; sc, sloughed cell; ve, ventral epithelium; vp,villi projection. Scale bar 10 mm.
I.R.B. McFadzen et al. / J. Exp. Mar. Biol. Ecol. 212 (1997) 239 –258 247
microvillous border (Fig. 4a).Vacuolation of the midgut was prominent, care being takento distinguish vacuolisation as a result of degenerative processes from digestive activitydue to lipid digestion. Intracellular lipid vacuoles are characterised by loss of cyto-plasmic staining, nuclear displacement, do not stain positively with PAS and have a
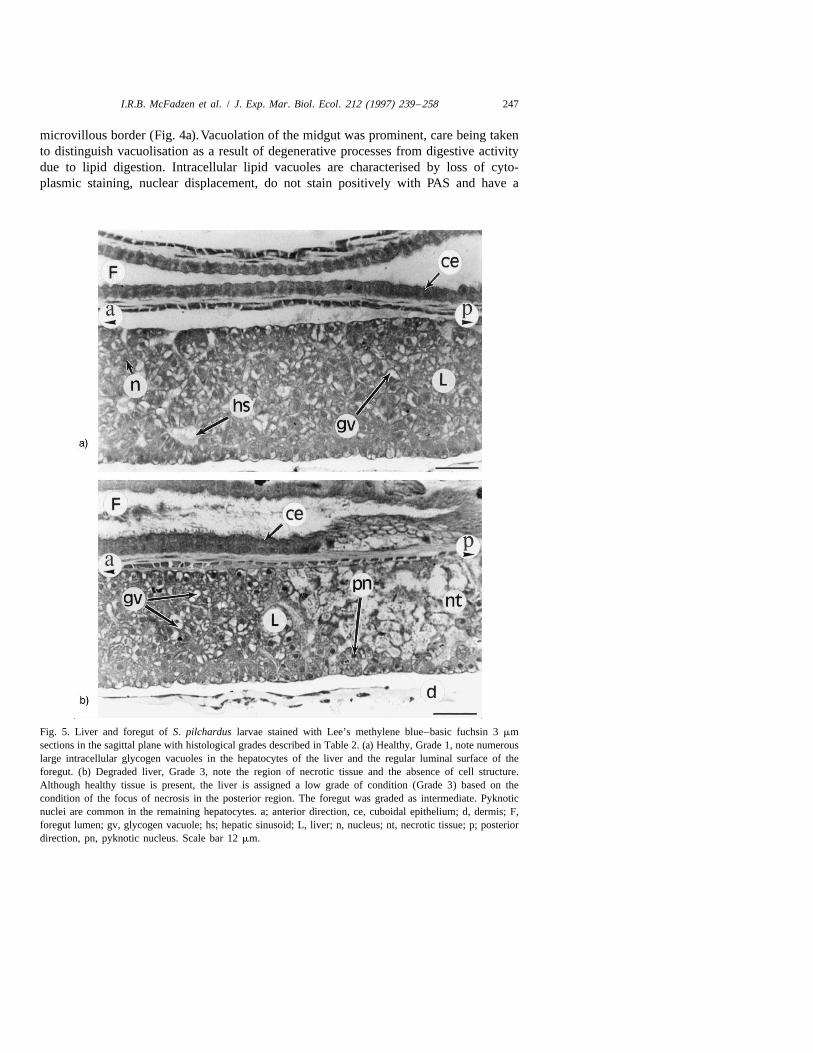
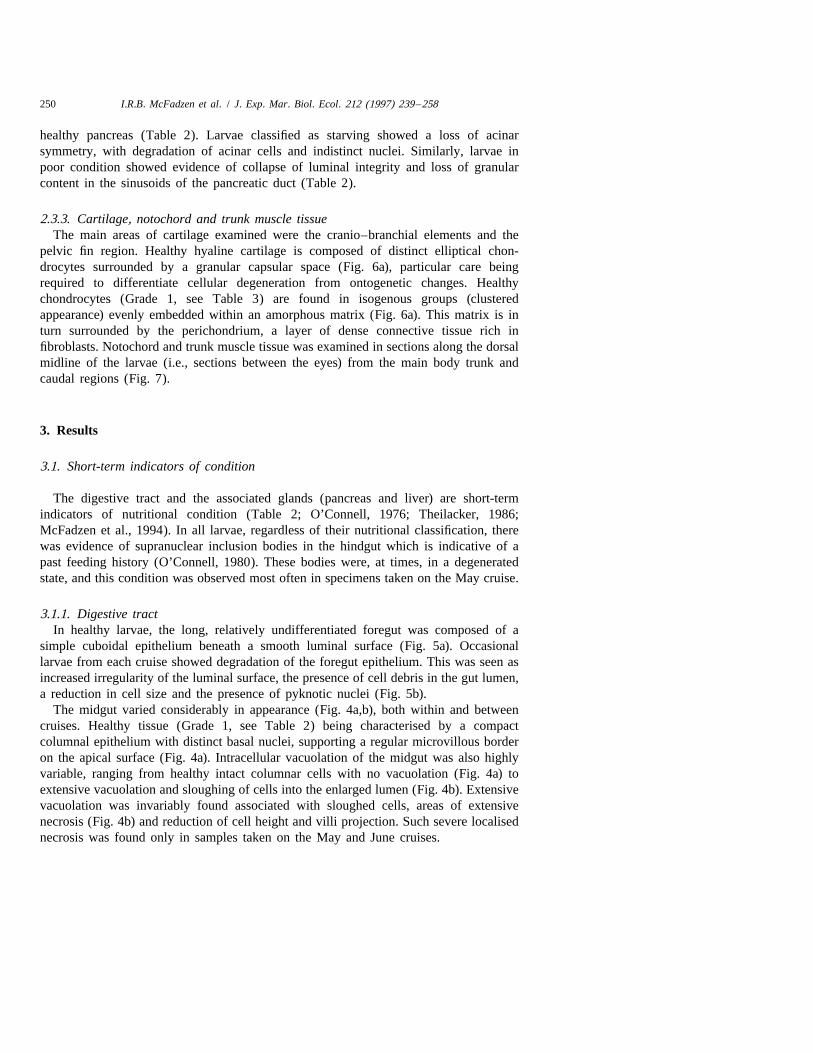
Fig. 5. Liver and foregut of S. pilchardus larvae stained with Lee’s methylene blue–basic fuchsin 3 mmsections in the sagittal plane with histological grades described in Table 2. (a) Healthy, Grade 1, note numerouslarge intracellular glycogen vacuoles in the hepatocytes of the liver and the regular luminal surface of theforegut. (b) Degraded liver, Grade 3, note the region of necrotic tissue and the absence of cell structure.Although healthy tissue is present, the liver is assigned a low grade of condition (Grade 3) based on thecondition of the focus of necrosis in the posterior region. The foregut was graded as intermediate. Pyknoticnuclei are common in the remaining hepatocytes. a; anterior direction, ce, cuboidal epithelium; d, dermis; F,foregut lumen; gv, glycogen vacuole; hs; hepatic sinusoid; L, liver; n, nucleus; nt, necrotic tissue; p; posteriordirection, pn, pyknotic nucleus. Scale bar 12 mm.
248 I.R.B. McFadzen et al. / J. Exp. Mar. Biol. Ecol. 212 (1997) 239 –258
general spherical appearance, whereas degenerative vacuolisation is associated withreduced cell size, necrosis and increased eosinophilic staining properties (Cowey andRoberts, 1978; Roberts, 1978; Hibiya, 1982). The relatively short hindgut extends to theanus. Hindgut epithelium is composed of compact columnar cells, covered on theirluminal surfaces by microvilli. These cells have large distinct basal nuclei, and arecharacterised by eosinophilic inclusion bodies in the supranuclear cytoplasm (Fig. 3)these being indicative of past feeding. The size and number of the supranuclear inclusionbodies is variable, and their presence is determined by feeding intensity and gut passagerates (Iwai and Tanaka, 1968).
2.3.2. Liver and pancreasThe liver is compact and elongate, lying ventral to the foregut. It is composed of
hepatocytes, containing pale staining regular nuclei (Fig. 5). Liver hepatocyte condition,particularly the relative amount of intracellular vacuolation associated with glycogenstorage, has been shown to be responsive to food availability (O’Connell, 1976).
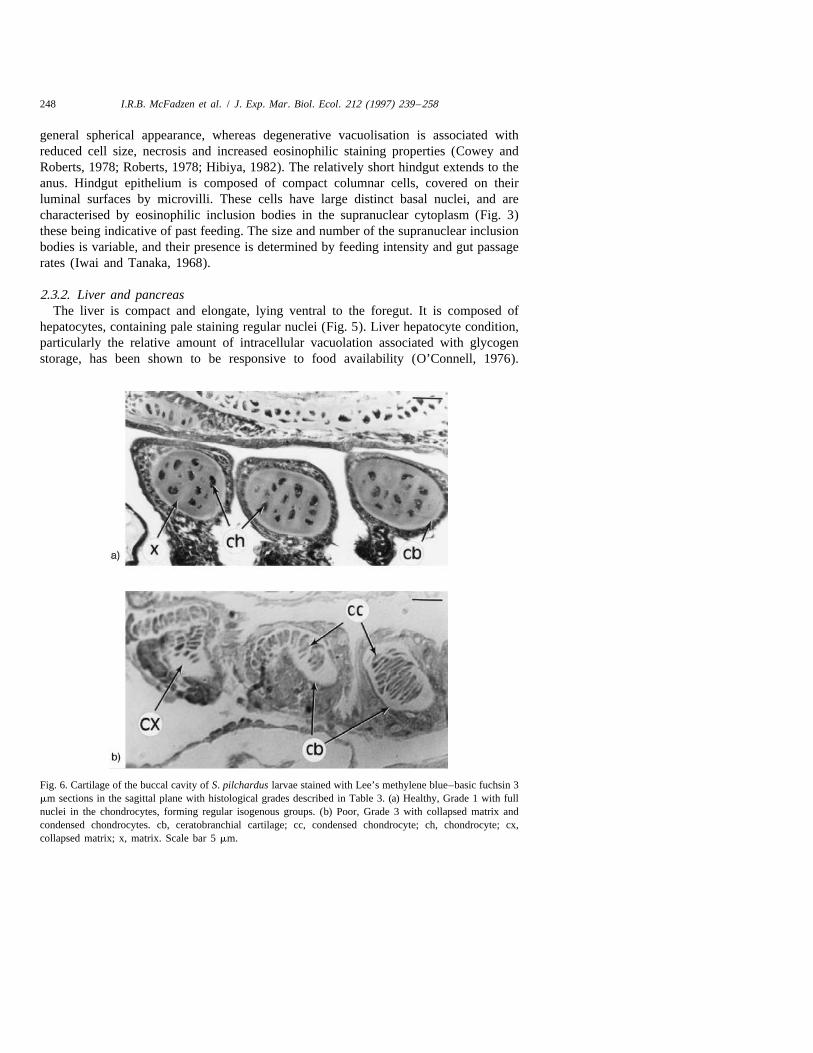
Fig. 6. Cartilage of the buccal cavity of S. pilchardus larvae stained with Lee’s methylene blue–basic fuchsin 3mm sections in the sagittal plane with histological grades described in Table 3. (a) Healthy, Grade 1 with fullnuclei in the chondrocytes, forming regular isogenous groups. (b) Poor, Grade 3 with collapsed matrix andcondensed chondrocytes. cb, ceratobranchial cartilage; cc, condensed chondrocyte; ch, chondrocyte; cx,collapsed matrix; x, matrix. Scale bar 5 mm.
I.R.B. McFadzen et al. / J. Exp. Mar. Biol. Ecol. 212 (1997) 239 –258 249
Hepatocyte cytoplasm, intracellular vacuolation and nuclear condition are variable(O’Connell, 1976; Theilacker, 1986) and thus were graded separately (Table 2), inaccordance with previous studies (O’Connell, 1976; Theilacker, 1986).
The pancreas is a compact basophilic gland of mixed endocrine and exocrine function,lying in close association with the liver and foregut. Healthy pancreatic acinar cells arepyramidal, forming distinct circular acini which contain varying numbers of smalleosinophilic storage granules (zymogen) in the cell apex above a distinct nucleus.Distinctive regular ducts containing numerous zymogen granules are found throughout a
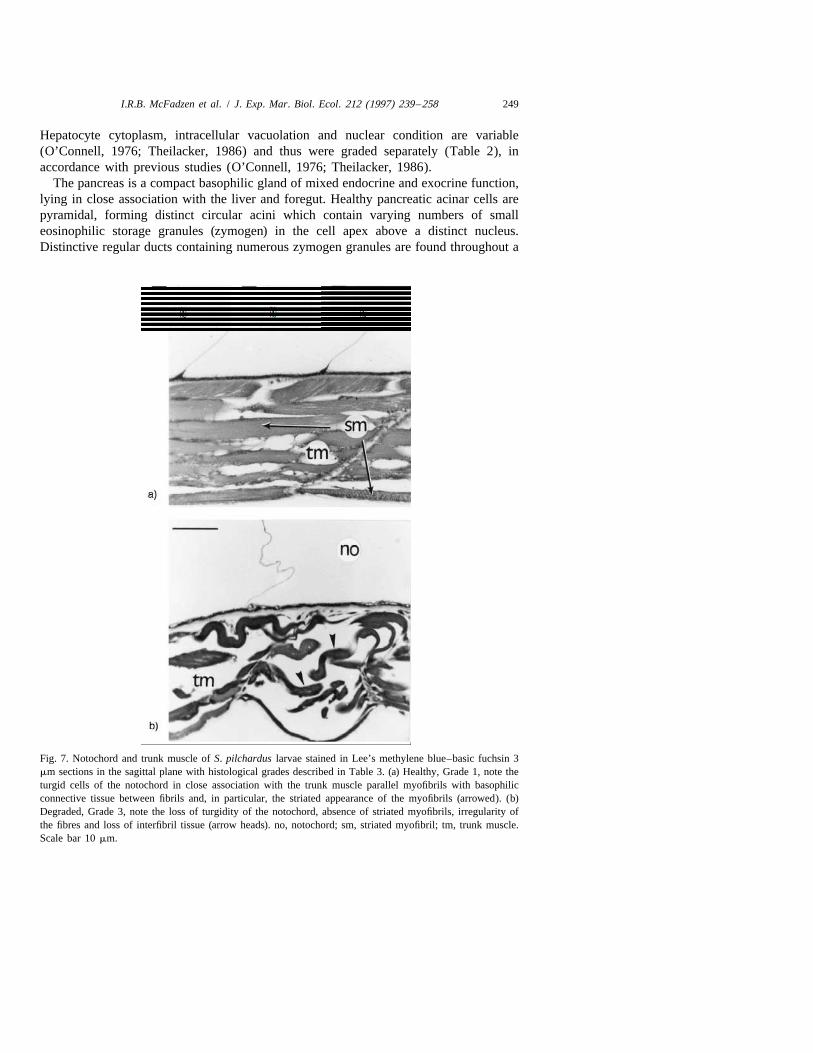
Fig. 7. Notochord and trunk muscle of S. pilchardus larvae stained in Lee’s methylene blue–basic fuchsin 3mm sections in the sagittal plane with histological grades described in Table 3. (a) Healthy, Grade 1, note theturgid cells of the notochord in close association with the trunk muscle parallel myofibrils with basophilicconnective tissue between fibrils and, in particular, the striated appearance of the myofibrils (arrowed). (b)Degraded, Grade 3, note the loss of turgidity of the notochord, absence of striated myofibrils, irregularity ofthe fibres and loss of interfibril tissue (arrow heads). no, notochord; sm, striated myofibril; tm, trunk muscle.Scale bar 10 mm.
250 I.R.B. McFadzen et al. / J. Exp. Mar. Biol. Ecol. 212 (1997) 239 –258
healthy pancreas (Table 2). Larvae classified as starving showed a loss of acinarsymmetry, with degradation of acinar cells and indistinct nuclei. Similarly, larvae inpoor condition showed evidence of collapse of luminal integrity and loss of granularcontent in the sinusoids of the pancreatic duct (Table 2).
2.3.3. Cartilage, notochord and trunk muscle tissueThe main areas of cartilage examined were the cranio–branchial elements and the
pelvic fin region. Healthy hyaline cartilage is composed of distinct elliptical chon-drocytes surrounded by a granular capsular space (Fig. 6a), particular care beingrequired to differentiate cellular degeneration from ontogenetic changes. Healthychondrocytes (Grade 1, see Table 3) are found in isogenous groups (clusteredappearance) evenly embedded within an amorphous matrix (Fig. 6a). This matrix is inturn surrounded by the perichondrium, a layer of dense connective tissue rich infibroblasts. Notochord and trunk muscle tissue was examined in sections along the dorsalmidline of the larvae (i.e., sections between the eyes) from the main body trunk andcaudal regions (Fig. 7).
3. Results
3.1. Short-term indicators of condition
The digestive tract and the associated glands (pancreas and liver) are short-termindicators of nutritional condition (Table 2; O’Connell, 1976; Theilacker, 1986;McFadzen et al., 1994). In all larvae, regardless of their nutritional classification, therewas evidence of supranuclear inclusion bodies in the hindgut which is indicative of apast feeding history (O’Connell, 1980). These bodies were, at times, in a degeneratedstate, and this condition was observed most often in specimens taken on the May cruise.
3.1.1. Digestive tractIn healthy larvae, the long, relatively undifferentiated foregut was composed of a
simple cuboidal epithelium beneath a smooth luminal surface (Fig. 5a). Occasionallarvae from each cruise showed degradation of the foregut epithelium. This was seen asincreased irregularity of the luminal surface, the presence of cell debris in the gut lumen,a reduction in cell size and the presence of pyknotic nuclei (Fig. 5b).
The midgut varied considerably in appearance (Fig. 4a,b), both within and betweencruises. Healthy tissue (Grade 1, see Table 2) being characterised by a compactcolumnal epithelium with distinct basal nuclei, supporting a regular microvillous borderon the apical surface (Fig. 4a). Intracellular vacuolation of the midgut was also highlyvariable, ranging from healthy intact columnar cells with no vacuolation (Fig. 4a) toextensive vacuolation and sloughing of cells into the enlarged lumen (Fig. 4b). Extensivevacuolation was invariably found associated with sloughed cells, areas of extensivenecrosis (Fig. 4b) and reduction of cell height and villi projection. Such severe localisednecrosis was found only in samples taken on the May and June cruises.
I.R.B. McFadzen et al. / J. Exp. Mar. Biol. Ecol. 212 (1997) 239 –258 251
3.1.2. Liver and pancreasThe condition of the liver was variable (Fig. 5a,b). Liver tissue of healthy larvae was
homogeneous throughout, whereas larvae with livers graded as starving had distinct fociof colloid degeneration (Hibiya, 1982) or necrosis, of variable size and number.Hepatocyte cytoplasm ranged from slightly granular, with abundant large glycogenvacuoles (Fig. 5a), to dark staining collapsed cells without intracellular vacuolation.Healthy hepatocytes had pale staining nuclei (Fig. 5a) laterally displaced by intracellularvacuoles (PAS positive), and were present throughout the entire liver of those graded ashealthy. Hepatocytes lacking PAS positive vacuoles had dark staining collapsed nuclei(often pyknotic) and enlarged sinusoids (Fig. 5b). Pancreatic degeneration was character-ised by variable amounts of zymogen droplets in the acinar cells and by irregularities ofthe duct lumen. On all cruises pancreatic acinar degradation and pancreatic duct sinusoidcollapse (i.e., in larvae in poor condition) were invariably found together with liverdegradation.
3.2. Long-term indicators of condition
Long-term indicators of condition (Table 3) include the cartilage, notochord and trunkmuscle which are relatively less responsive to short periods of food deprivation than thedigestive tract and associated glands (Theilacker, 1978; Sieg, 1993; McFadzen et al.,1994).
3.2.1. Cartilage, notochord and trunk muscle tissueCartilage condition was relatively conservative between cruises, with only slight
variations in appearance. Degraded cartilage was rare, but when it occurred the nuclei ofthe chondrocytes were condensed and indistinct, with collapse of entire chondrocytesinto the surrounding matrix (Fig. 6b). Degradation of cartilage was noted in associationwith low scores (Grade 3) for tissues of the digestive tract, liver and pancreas, and wasevident in all months except March.
The notochord, similarly as for hyaline cartilage, was relatively stable in conditionduring the survey period. Healthy notochord maintained turgid cells and remained inclose association with the surrounding muscle (Fig. 7a). Severely degraded larvae hadcollapsed notochords (Fig. 7b) and extensive areas where the notochord was dis-associated from the trunk muscle, but such larvae were rare on all cruises.
Trunk muscle showed the least variation in cellular condition. In healthy tissue,muscle fibres and myofibrils were compact, with parallel fibres, distinctly striatedmyofibrils and abundant basophilic tissue between muscle fibre layers (Fig. 7a). In thedegraded condition there was pronounced fibre separation, reduced myofibril striationand minimal interfibril tissue (Fig. 7b).
3.3. Additional tissues
Further to the indices outlined in Tables 2 and 3, there was a general atrophy anddisintegration of cells of other tissues in poor grade larvae. In particular, renal tubulesshowed a loss of symmetry and luminal integrity. Eyes were prone to degeneration and
252 I.R.B. McFadzen et al. / J. Exp. Mar. Biol. Ecol. 212 (1997) 239 –258
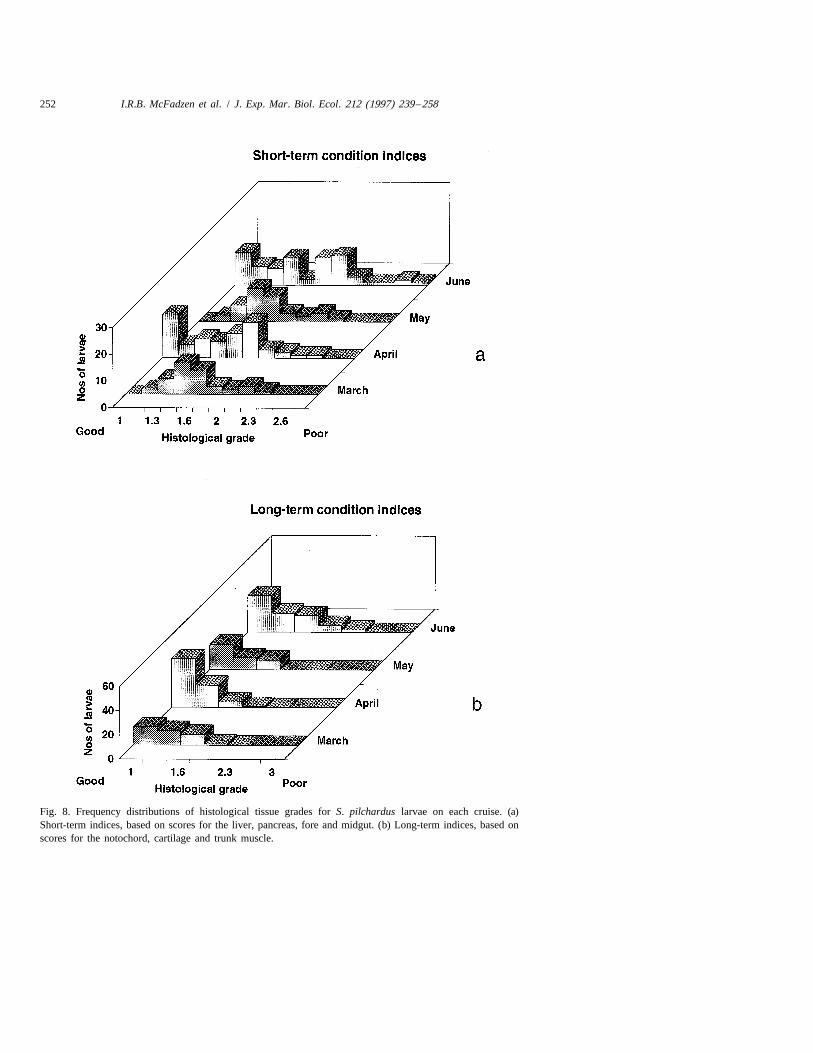
Fig. 8. Frequency distributions of histological tissue grades for S. pilchardus larvae on each cruise. (a)Short-term indices, based on scores for the liver, pancreas, fore and midgut. (b) Long-term indices, based onscores for the notochord, cartilage and trunk muscle.
I.R.B. McFadzen et al. / J. Exp. Mar. Biol. Ecol. 212 (1997) 239 –258 253
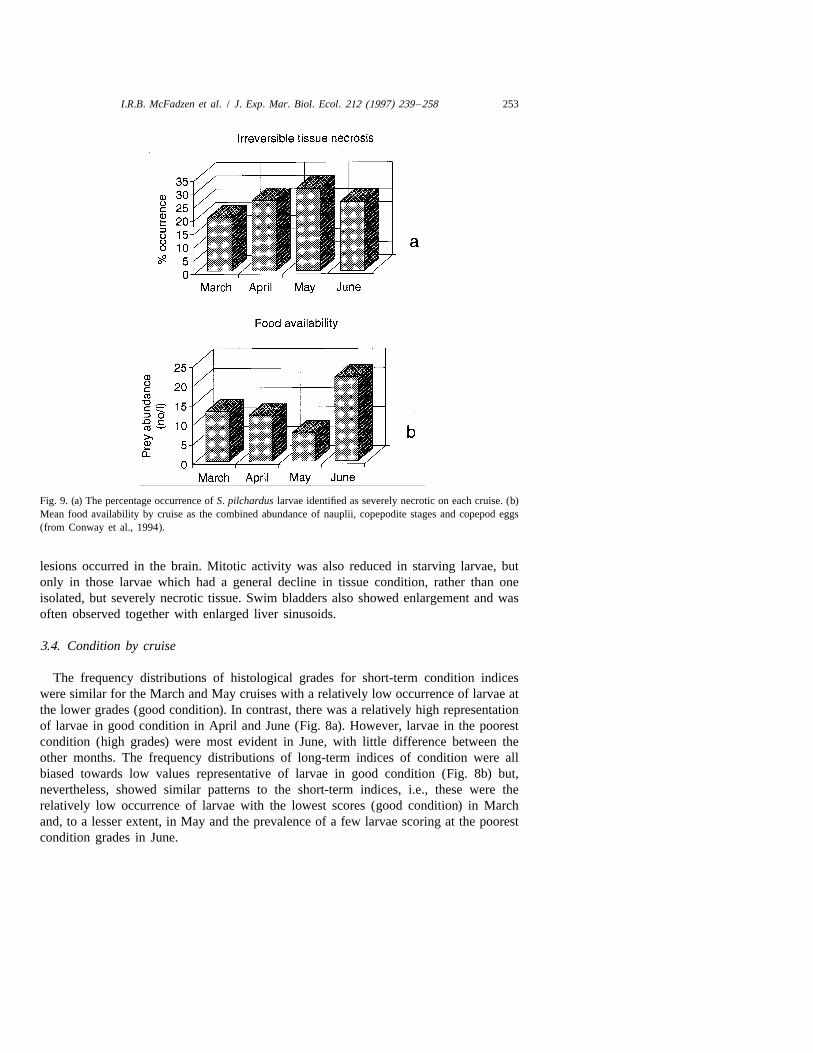
Fig. 9. (a) The percentage occurrence of S. pilchardus larvae identified as severely necrotic on each cruise. (b)Mean food availability by cruise as the combined abundance of nauplii, copepodite stages and copepod eggs(from Conway et al., 1994).
lesions occurred in the brain. Mitotic activity was also reduced in starving larvae, butonly in those larvae which had a general decline in tissue condition, rather than oneisolated, but severely necrotic tissue. Swim bladders also showed enlargement and wasoften observed together with enlarged liver sinusoids.
3.4. Condition by cruise
The frequency distributions of histological grades for short-term condition indiceswere similar for the March and May cruises with a relatively low occurrence of larvae atthe lower grades (good condition). In contrast, there was a relatively high representationof larvae in good condition in April and June (Fig. 8a). However, larvae in the poorestcondition (high grades) were most evident in June, with little difference between theother months. The frequency distributions of long-term indices of condition were allbiased towards low values representative of larvae in good condition (Fig. 8b) but,nevertheless, showed similar patterns to the short-term indices, i.e., these were therelatively low occurrence of larvae with the lowest scores (good condition) in Marchand, to a lesser extent, in May and the prevalence of a few larvae scoring at the poorestcondition grades in June.
254 I.R.B. McFadzen et al. / J. Exp. Mar. Biol. Ecol. 212 (1997) 239 –258
An additional, more stringent, measure of larval condition is plotted in Fig. 9a as thepercentage of larvae in which any single tissue was necrotic to the extent that recoveryof the larvae would have been improbable, irrespective of subsequent feeding level (pastPNR). For this variable, larvae in March were scored in the best condition (20.0% withnecrotic tissue), in May in the poorest condition (30.8%) and at intermediate levels inApril and June (25.0% and 25.0% respectively).
4. Discussion
Assessments of larval condition, as indices of survival potential, are most usefullybased on processes operating on longer time-scales than the feeding rhythmicity of fish
˚larvae (Coombs and Hakanson, 1991). The benefits of histological methods for suchmeasures are that a range of tissues responsive to both short-term and long-term feedinghistory can be simultaneously examined and some assessment can be made of theaetiology of the stressor, i.e., the source of tissue degeneration ascribed to foodavailability (Theilacker, 1986; Theilacker and Watanabe, 1989; Margulies, 1993),contaminant exposure (Wester and Canton, 1991; Johnson and Bergman, 1984), orparasitic /disease effects (Lom, 1970). Further benefits of the histological approachutilising methacrylate embedding, as in the present study, are that it provides thinsections with minimal processing artefact and gives a high degree of tissue resolution todistinguish environmentally derived stress effects from autolytic change. Inevitably,there will have been some influence on tissue condition during capture and sorting of thelarvae. However, the effects of mechanical damage will have been similar betweencruises since there was no essential change in the sampling protocol, and the lack of anyclear relationship between tissue condition (Fig. 8), and the seasonal change in water
´temperature (Lopez-Jamar et al., in press) does not suggest that temperature effects haveintroduced any serious bias in the results.
In the present study, the condition of sardine larvae was based on the histologicalgrading of the cellular properties of selected tissues, based principally on criteria used byO’Connell (1976). A number of other studies (e.g., Ehrlich et al., 1976; O’Connell,1976, 1980; Theilacker, 1978, 1986; Theilacker and Watanabe, 1989; Sieg, 1993;Margulies, 1993) have shown that histopathological responses to low food availabilityare common to many teleost larvae and that the fundamental cellular mechanisms ofatrophy and degeneration are not species specific (Roberts, 1978; Hibiya, 1982;Margulies, 1993). All tissues within an individual specimen are responsive to fooddeprivation so that the selection of suitable diagnostic criteria (O’Connell, 1976) enablesthe various alterations in cellular structure, organisation, shape, size and histochemicalproperty to be recognised. Such cellular alterations are caused by deficiency in the localsupply of nutrients derived from inadequate feeding (Hibiya, 1982), and do notnecessarily reflect the role of the tissue in food assimilation or digestive activity.
Although laboratory experiments to rear sardine larvae were an unsuccessful part ofthe present work, and therefore there is no specific validation of the histological indices,the criteria used in the present paper are sufficiently generalised to be applicable to mostfish species and, to some extent, throughout most vertebrates (Johnson and Bergman,
I.R.B. McFadzen et al. / J. Exp. Mar. Biol. Ecol. 212 (1997) 239 –258 255
1984). However, some conditions, such as contraction and localised degeneration of themidgut epithelium, have been described as symptomatic of disease as well as starvation(Roberts, 1978). Since there was no evidence of parasitic infection or localised oedemaor haemorrhaging, the present observations are likely to relate entirely to variations infeeding. Similarly, Lom (1970) reported cellular alterations due to protozoan infectionsbut no signs of such infection were observed in sardine larvae of the present study.
Both short-term and long-term indices of condition showed similar relative changes intissue grade between cruises (Fig. 8). However, there was a noticeable difference in theshape of the frequency distributions of short-term and long-term indices. Long-termgrades were biased towards low values (good condition) whereas short-term indicesshowed a broader spread of values with the distributions extending to values . 2, thisbeing indicative of relatively poor condition. It is, perhaps, not unexpected thatlong-term indices give a consistent indication of larvae in good condition, sinceindividuals with any accumulation of poor short-term condition might be expected tohave been removed by some combination of starvation and predation mortality. Similarobservations of the generally healthy status of field-caught larvae have been reportedelsewhere (O’Connell, 1980; Pitcher and Hart, 1982; Theilacker, 1986; Owen et al.,1989). Conversely, short-term indices, which represent the more immediate effects offood availability, may be too closely associated with transient events to be a goodanalogue of survival. Since the necrotic classification (Fig. 9a) represents both a fixedcriterion, itself dependent on food availability, and unequivocally identifies larvae whichare not destined to survive (May, 1974; McGurk, 1984), this may be the most preciseindicator of potential survival (Blaxter and Hempel, 1963). However, although thenecrotic tissue classification showed larvae to be in relatively poor condition in May, inaccord with the short-term and long-term indices, there was no substantial agreement forthe other months. Laboratory rearing experiments are perhaps required to resolve suchapparent discrepancies, in particular by establishing the stability of both short- andlong-term indices with variation in food availability.
There was little indication of any significant truncation of values at the poor conditionend of the distribution of short-term condition values (Fig. 8a) which might indicatepreferential predation on larvae in low condition (Buckley, 1984). In contrast, there wasnoticeable truncation of the lower limb (good condition) of the distribution of short-termindices in March and May. It is unlikely that predation pressure would be greater forlarvae in good condition, thus the low representation of larvae at the better grades mayindicate relatively poor feeding conditions during these cruises; relatively low foodavailability during May (Fig. 9b) supports this conclusion. However, the lack of anyoverall correlation between food availability and histological condition does not supportany close relationship between these variables. At the same time it should be recognisedthat the measures of food availability in the present study are derived from integratedtows down the water column (Conway et al., 1994), while vertical stratification can lead
´to markedly different concentrations at discrete depths (Coombs et al., 1983; Fernandez-Puelles et al., 1993). Thus, depth-integrated plankton tows are not necessarily the mostprecise estimates of the actual prey field experienced by the larvae.
In the present study, the primary reason for measuring the condition of larvae was forcomparisons with subsequent survival to the juvenile stage. The hypothesis under test
256 I.R.B. McFadzen et al. / J. Exp. Mar. Biol. Ecol. 212 (1997) 239 –258
being that condition indices, as a measure of incipient mortality, are an analogue orpredictor of subsequent survival. In the context of the SARP programme in which thestudy was based, larval survival was to be determined from a comparison of thebirth-date distribution of surviving juveniles, derived from back-calculation of their agedistribution from otolith daily growth-ring counts, with the larval abundance curve (Fig.1b). It is clear from the foregoing results that larval condition, as measured byhistological methods, grades larvae from the May cruise in consistently poor condition.
´Complementary findings are summarised by Lopez-Jamar et al. (in press) for measure-ments of larval condition on the same cruises from carbon, RNA/DNA and enzymeanalyses. However, observations on the birth-date distribution of sardine juveniles takenduring the summer and autumn of 1992 at the main nursery grounds off Galicia foundnegligible survival of larvae from spawning between March and June, i.e., the entireperiod during which measures of larval condition were taken. The majority of survivinglarvae were from January birth-dates, before the time at which spawning commencesalong the north coast of Spain; the conclusion was that the surviving juveniles had
´recruited from spawning in Portuguese waters further to the south (Lopez-Jamar et al., inpress). It is possible that larvae from spawning along the north coast were recruited asjuveniles elsewhere than off Galicia, but neither oceanographic nor information fromjuvenile surveys suggests that this takes place generally (Robles et al., 1991; Porteiro etal., 1993).
Thus, although relatively consistent measures of larval condition were derived, whichmight relate to some index of survival at the time the larvae were sampled, it wouldappear that subsequent mortality obscured any value of these indices for prediction ofjuvenile recruitment. One possible source of such mortality, in the particular situation ofsardine spawning along the north coast of Spain, is the effect of upwelling and offshoretransport in the Finesterre /Cape Ortegal region (Chesney and Alonso-Noval, 1989).Larvae are required to traverse this region to pass from the spawning areas along thenorth coast to the juvenile nursery areas off Galicia (Chesney and Alonso-Noval, 1989;Cabanas et al., 1992). The offshore directed tail of larval distribution north of CapeOrtegal (Fig. 1a) does gives some indication that offshore transport associated withupwelling, characteristic of that region in the summer months (Chesney and Alonso-
´Noval, 1989; Lopez-Jamar et al., in press), may have resulted in the failure of larvaefrom the north coast to reach the nursery grounds off Galicia in 1992. In other years,starvation mortality, as suggested, may have occurred for many of the larvae during theMay cruise, thus having a more dominant effect on juvenile recruitment strength.
Acknowledgments
This work forms part of the programme of the Strategic Research Project 1(Productivity and Physical Structure In Pelagic Ecosystems) of the Plymouth MarineLaboratory, a component institute of the UK Natural Environment Research Council.Finance was provided, in part, by the Commission of the European Communities (DGXIV) under contract M.A. 1. 96. and by the UK Department of the Environment (DOE)under contract PECD 7/7/359. The authors gratefully acknowledge the assistance of theofficers, crew and all participants on the cruises.
I.R.B. McFadzen et al. / J. Exp. Mar. Biol. Ecol. 212 (1997) 239 –258 257
References
Bancroft, J.D., 1967. An introduction to histochemical technique. Butterworths, London, 268 pp.Bennett, H.S., A.D. Wyrick, S.W. Lee and J.W. McNeil, 1976. Science and art in preparing tissues embedded in
plastic for light microscopy, with specific reference to glycol methacrylate, glass knives and simple stains.Stain Technol., Vol. 51, pp. 71–97.
Blaxter, J.H.S. and G. Hempel, 1963. The influence of egg size on herring larvae (Clupea harengus). J. Cons.,Vol. 28, pp. 211–240.
Buckley, L.J., 1984. RNA–DNA ratio: an index of larval fish growth in the sea. Mar. Biol., Vol. 80, pp.291–298.
Cabanas, J.H., G. Diaz de Rio, A. Lavin and T. Nunes, 1992. Hydrographic conditions off the Galician coast,NW of Spain, during an upwelling event. Biol. Inst. Esp. Oceanogr., Vol. 8, pp. 27–40.
Campana, S.E. and J.D. Neilson, 1985. Microstructure of fish otoliths. Can. J. Fish. Aquat. Sci., Vol. 42, pp.1014–1032.
Chesney, E.J. and M. Alonso-Noval, 1989. Coastal upwelling and the early life history of sardines (Sardina´pilchardus) along the Galician coast of Spain. Rapp. P.-v. Reun. Cons. int. Explor. Mer., Vol. 191, pp.
63–69.Clemmesen, C.M., 1987. A highly sensitive method to determine RNA and DNA contents in individual fish
larvae. International Council for the Exploration of the Sea. (C.M. papers and reports) L:22, 14 pp.´Conway, D.P.V., P.R.G. Tranter, M.L. Fernandez de Puelles and S.H. Coombs, 1991. Feeding of larval sprat
(Sprattus sprattus) and sardine (Sardina pilchardus). International Council for the Exploration of the Sea.(C.M. papers and reports) L:76, 23 pp.
´Conway, D.P.V., S.H. Coombs, M.L. Fernandez de Puelles and P.R.G. Tranter, 1994. Feeding of larval sardine(Sardina pilchardus) off the north coast of Spain. Bol. Inst. Esp. Oceanogr., Vol. 10, pp. 165–175.
Coombs, S.H., J.A. Lindley and C.A. Fosh, 1983.Vertical distribution of larvae of mackerel Scomber scombrusand microplankton, with some conclusions on feeding conditions and survey methods. In, Proceedings ofthe expert consultation to examine changes in the abundance and species composition of neritic fish
´resources. San Jose, Costa Rica 18–29 April 1983. FAO. Fish. Rep., Vol. 291, pp. 939–954.˚Coombs, S.H. and J.L. Hakanson, 1991. Diel variation in lipid and elemental composition of sprat (Sprattus
sprattus) larvae at mixed and stratified sites in the German Bight of the North Sea. International Councilfor the Exploration of the Sea. (C.M. papers and reports) L:49, 11 pp.
Cowey, C.B. and R.F. Roberts, 1978. Nutritional pathology of teleosts. In, Fish Pathology, edited by R.F.`Roberts, Bailliere Tindall, London, pp. 216–226.
Ehrlich, K.F., 1974. Chemical changes during growth and starvation of herring larvae. In, The Early LifeHistory of Fish, edited by J.H.S. Blaxter, Springer, Berlin, pp. 301–323.
Ehrlich, K.F., J.H.S. Blaxter and R. Pemberton, 1976. Morphological and histological changes during thegrowth and starvation of herring and plaice larvae. Mar. Biol., Vol. 35, pp. 105–118.
´Fernandez-Puelles, M.L., L. Valdes, M. Varela and M.T. Alvarez-Ossorio, 1993. Diel variations in verticaldistribution of copepods in the north Iberian coast. International Council for the Exploration of the Sea.(C.M. papers and reports) L:51, 25 pp.
Frank, K.T. and J. McRuer, 1989. Nutritional status of field-collected haddock (Melanogrammus aeglefinus)larvae from southwestern Nova Scotia: an assessment based on morphometric and vertical distribution data.Can. J. Fish. Aquat. Sci., Vol. 46, pp. 125–133.
˚Hakanson, J.L., 1989. Condition of larval anchovy (Engraulis mordax) in the southern California Bight, asmeasured through lipid analysis. Mar. Biol., Vol. 102, pp. 153–160.
˚Hakanson, J.L., 1993. Nutritional condition and growth rate of anchovy larvae (Engraulis mordax) in theCalifornia current: two contrasting years. Mar. Biol., Vol. 115, pp. 309–316.
Heath, M.R., 1992. Field investigations of the early life stages of marine fish. Adv. Mar. Biol., Vol. 28, pp.1–174.
Hibiya, T., 1982. An Atlas of Fish Histology. Normal and Pathological Features, Kodansha, Tokyo, 147 pp.Hunter, J.R., 1976. Report of a colloquium on larval fish mortality studies and their relation to fishery
research, January 1975. US. Dept. Commer., NOAA Tech. Rep. NMFS CIRC., 5 pp.IOC, (1989). IOC workshop report of the expert consultation on the Sardine Anchovy Recruitment Project
(SARP). IOC Workshop Rep. 66. International Oceanographic Commission, UNESCO, Paris, 57 pp.
258 I.R.B. McFadzen et al. / J. Exp. Mar. Biol. Ecol. 212 (1997) 239 –258
Iwai, T. and M. Tanaka, 1968. The comparative study of the digestive tract of teleost larvae-III. Epithelial cellsin the posterior gut of the halfbeak larvae. Bull. Jap. Soc. Scient. Fish., Vol. 34, pp. 44–48.
Johnson, R.D. and H.L. Bergman, 1984. Use of histopathology in aquatic toxicology: a critique. In,Contaminant effects on fisheries, edited by V.W. Cairns, P.V. Hodson and J.O. Nriagu, Wiley, New York, pp.19–36.
Lom, J., 1970. Protozoa causing diseases in marine fishes. In, A Symposium on Diseases of Fishes andShellfish, edited by S.F. Snieszko. Am. Fish. Soc. Special Publication, pp. 101–123.
´ ´Lopez-Jamar, E., S.H. Coombs, A. Garcıa, R. Knust and W. Nellen, in press. The distribution of larvae ofsardine (Sardina pilchardus) off the North Atlantic coast of Spain in relation to environmental conditions.Bol. Inst. Esp. Oceanogr.
Margulies, D., 1993. Assessment of the nutritional condition of larval and early juvenile tuna and Spanishmackerel in the Panama Bight. Mar. Biol., Vol. 115, pp. 317–330.
May, R.C., 1974. Larval mortality in marine fishes and the critical period concept. In, The early life history offish, edited by J.H.S. Blaxter, Springer, Berlin, pp. 3–19.
McFadzen, I.R.B., D.M. Lowe and S.H. Coombs, 1994. Histological changes in starved turbot larvae(Scophthalmus maximus) quantified by digital image analysis. J. Fish Biol., Vol. 44, pp. 255–262.
McGurk, M.D., 1984. Effects of delayed feeding and temperature on the age of irreversible starvation and onthe rates of growth and mortality of Pacific herring. Mar. Biol., Vol. 84, pp. 13–26.
O’Connell, C.P., 1976. Histological criteria for diagnosing the starving condition in early post yolk sac larvaeof the northern anchovy, Engraulis mordax. J. Exp. Mar. Biol. Ecol., Vol. 25, pp. 285–312.
O’Connell, C.P., 1980. Percentage of starving northern anchovy, Engraulis mordax larvae in the sea asestimated by histological methods. Fish. Bull. US., Vol. 78, pp. 475–489.
˜Owen, R.W., N.C.H. Lo, J.L. Butler, G.H. Theilacker, A. Alvarino, J.R. Hunter and Y. Watanabe, 1989.Spawning and survival patterns of larval northern anchovy, Engraulis mordax, in contrasting environments-a site intensive study. Fish. Bull. US, Vol. 87, pp. 673–688.
Pitcher, T.J. and P.J. Hart, 1982. Fisheries Ecology, Croom Helm, London, 414 pp.Porteiro, C., J. Miquel, P. Carrera, M. Meixide and J.M. Cabanas, 1993. Abundance estimation and distribution
of sardine in northern Spain (North of IX a and XIII c divisions). International Council for the Explorationof the Sea. (C.M. papers and reports) H:28, 19 pp.
Roberts, R.F., 1978. The pathophysiology and systematic pathology of teleosts. In, Fish Pathology, edited by`R.F. Roberts, Bailliere Tindall, London, pp. 55–91.
Robles, R., C. Porteiro and J.M. Cabanas, 1991. The stock of Atlanto-Iberian sardine: possible causes ofvariability. International Council for the Exploration of the Sea. (C.M. papers and reports) No. 31: Session3, 11 pp.
Sieg, S., 1993. Histological alterations in larval Coregonus lavaretus, during prolonged starvation in thelaboratory. In, Fish Ecotoxicology and Ecophysiology, edited by T. Braunbeck, W. Hanke and H. Segner,VCH Verlagsgeselleschaft mbH, Weinheim, pp. 217–226.
Theilacker, G.H., 1978. Effects of starvation on the histological and morphological characteristics of jackmackerel, Trachurus symmetricus larvae. Fish. Bull. US., Vol. 76, pp. 403–414.
Theilacker, G.H., 1986. Starvation-induced mortality of young sea-caught jack mackerel, Trachurus symmet-ricus, determined with histological and morphological methods. Fish. Bull. US., Vol. 84, pp. 1–18.
Theilacker, G.H. and Y. Watanabe, 1989. Midgut cell height defines nutritional status of laboratory raisedlarval northern anchovy, Engraulis mordax. Fish. Bull. US., Vol. 87, pp. 457–469.
Wester, P.W. and J.H. Canton, 1991. The usefulness of histopathology in aquatic toxicity studies. Comp.Biochem. Physiol., Vol. 100 C, pp. 115–117.