Embed Size (px)
DESCRIPTION
http://www.ijrsa.org/paperInfo.aspx?ID=4826 In this paper, a novel model for the representation of geographic environnements has been proposed called Holonic Virtual Geographic Environments, in which the holonic approach is employed as a computational geographic methodology and holarchy as organizational principle. Our approach allows automatically building virtual geographic environments using data provided by geographic information systems and enables an explicit representation of the geographic environment for multi-Agent systems in which agents are situated and with which they interact. Taking into account geometric, topologic, and semantic characteristics of the geographic environment, we propose the use of the holonic approach to build the environment holarchy. Our holonic model has been depicted using two different environments: an urban environment and a natural environment.
Citation preview
International Journal of Remote Sensing Applications Volume 3 Issue 3, September 2013 www.ijrsa.org
117
Holonic Virtual Geographic Environments Mehdi Mekni*1
Math, Science and Technology Department, University of Minnesota Crookston
2900 University Avenue, Crookston, MN 56716
Abstract
In this paper, a novel model for the representation of
geographic environnements has been proposed called
Holonic Virtual Geographic Environments, in which the holonic
approach is employed as a computational geographic
methodology and holarchy as organizational principle. Our
approach allows automatically building virtual geographic
environments using data provided by geographic
information systems and enables an explicit representation
of the geographic environment for multi‐Agent systems in
which agents are situated and with which they interact.
Taking into account geometric, topologic, and semantic
characteristics of the geographic environment, we propose
the use of the holonic approach to build the environment
holarchy. Our holonic model has been depicted using two
different environments: an urban environment and a natural
environment.
Keywords
Situated Multi‐Agent Systems; Geographic Information Systems;
Geo‐Simulation
Introduction
The importance of the environment as a first‐order
abstraction is particularly apparent for Situated Multi‐
Agent Systems (SMAS) (Weyns, Omicini, Odell, 2007)
that are characterized with an explicit spatial
environment called Virtual Geographic Environment
(VGE) in which agents are situated. Indeed, such a
representation must take into account the geometrical
information corresponding to various geographic
features. Moreover, this representation must qualify
space by means of association of semantics with
geographic features in order to allow spatial reasoning.
Geographic Information Systems (GIS) provide such
features but in an inefficient way when fast and
automated spatial reasoning algorithms are in
consideration (Mekni, 2010). In addition, modelling
large scale geographic environments is a complex
process (Yang., Gong, Hu, Wang, 2006).
Current approaches aim at regarding the environment
as a monolithic structure which considerably reduces
the capacity to handle large scale, real world
environments (Rodriguez, Hilaire, Galland, Koukam,
2006). In order to build realistic SMAS, we need an
explicit environment representation which efficiently
organises the geographic features, accurately captures
the real world complexity, and reliably models large
scale geographic environments.
The holonic approach has been successfully applied to
a wide range of applications including industrial
(Fletcher, Hughes, 2006), military (McGuire, Liggins,
Wojcik, Benaskeur, Brennan, 2006), environment
monitoring (Mekni, 2010), to name a few. Moreover,
the holonic approach is a suitable organizational
paradigm that may be helpful for the space
decomposition and organization of geographic
features (Rodriguez, Hilaire, Galland, Koukam, 2006).
The term “holon” was originally coined by Arthur
Koestler (Koestler, 1967), based on the Greek word
“holos” for “whole” and the suffix “–on” that denotes
“part”. According to Koestler, a holon , a fractal
structure that is stable, coherent, consists of several
holons acting as sub‐structures. In this definition, a
holon itself can be considered as part of a higher level
architecture of holons. As an illustration in geographic
context, a holonic decomposition of the geographic
environment would comprise regions which in turn
consist of groups of cells that can be further
decomposed, and so on. Furthermore, the geographic
environment may be part of a province and a country.
None of these components can be understood
completely without its sub‐components or the super
component they are part of. Several holons, having
each its own identity, can exist together as components
of a given system.
In this system, called a holarchy, holons are
independent with respect to their subordinate parts
and simultaneously dependent of parts of higher
hierarchic levels. Thus, a holarchy denotes a
hierarchical organization of holons having a recursive
structure (Koestler, 1967). This structure can guarantee
performance stability, predictability, flexibility,
adaptability, and global optimization of hierarchical
www.ijrsa.org International Journal of Remote Sensing Applications Volume 3 Issue 3, September 2013
118
control (Rodriguez, Hilaire, Galland, Koukam, 2006).
In this paper, a novel approach has been proposed to
model Holonic Virtual Geographic Environments (HVGE)
in which the holonic approach is utilized as a
computational geographic methodology and the
holarchy as an organizational principle. Our approach
provides an exact representation of the geographic
environment using GIS data. This representation is
organised as a topological graph, enhanced with data
integrating both quantitative data (like the geometry)
and qualitative information (like the types of zones
such as roads and buildings). This study focuses on
the environment description and takes advantage of
the holonic approach in order to address the following
issues: 1) the way to efficiently and accurately model
complex geographic spaces in order to build accurate
VGE; 2) the way to structure, organize, and inform
such a VGE in order to provide an easy and fast access
to data describing the real world to situated agents to
reason about it.
Next section presents a discussion of related works on
modelling and representation of geographic
environments. In Section 3, we introduce the
geographic concepts used in our model. Section 4
presents our novel holonic modelling approach of
large scale geographic environments. In order to
demonstrate the generic aspect of the proposed model,
in Section 5 two different experimental models are
shown. The first refers to a geographic holonic model
representing the Montmorency experimental forest
(St.Lawrence Region, QC, Canada). The second
illustrates the urban holonic model of a part of Quebec
city (QC, Canada). Section 5 concludes the paper and
presents future work.
Related Work
While most works on Multi‐Agent Systems (MAS) out
emphasis on the design of autonomous agents
organisations, few research works have been found
addressing the environment description and
representation. Farenc proposed an informed
environment dedicated to urban life simulation, which
is based on a hierarchical decomposition of a urban
scene into environment entities providing geometrical
information associated with semantic notions (Farenc,
Boulic, Thalmann, 1999). This approach puts forward
the importance ofthe integration of additional
information in order to enrich the environment
description but lacks a systematic method to
decompose the geographic environment (FIG. 1).
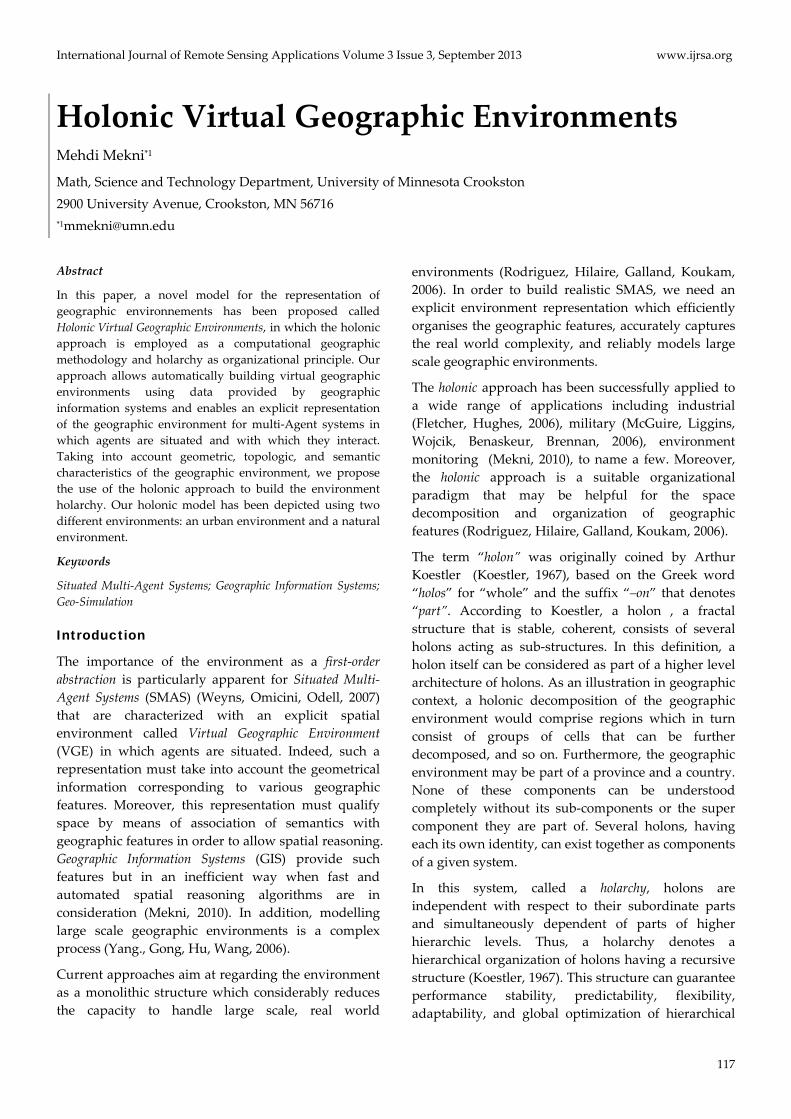
FIG. 1 INFORMED ENVIRONMENT DEDICATED TO URBAN
LIFE SIMULATION
Musse used this informed environment to animate
human crowds by using a hierarchical control (Musse,
2000): a virtual human agent belongs to a group that
belongs to a crowd, and an agent applies the general
behaviours defined at the group level. However, very
few works on the modelling of large scale geographic
environments using the holonic approach have been
found in the literature.
Authors in (Rodriguez, Hilaire, Galland, Koukam,
2006) proposed a geographic representation of an
industrial plant for traffic analysis purposes. This
study uses the holonic approach to decompose real
world environment in terms of holonsand shows the
contribution of such an approach in reducing the
complexity of real world environments and
demonstrates the capability of the holonic approach to
organize various geographic features (road, exchange
point, segment, link). However, there isno available
information about the methodology they use to build
what they call 3D virtual world. In addition, there is
limitation in these authorsʹ claims that their approach
can be used to model large scale geographic
environments. First of all, the focus of their work is on
traffic analysis; therefore the model only takes into
account the geographic features that are involved in
the traffic flow. Secondly, the surface of the industrial
plant is around (2km2) which is a relatively small area
to be qualified as a large scale geographic environment.
The lack of efficient models capable to represent large
scale geographic environments while the geometric,
topologic, and semantic characteristics of the space in
consideration motivated us to propose a novel
approach based on a holonic approach which allows
the combination of semantic data, accurate subdivision
of the space, and the offer of an environment holarchy
built upon a topological graph. In the following
International Journal of Remote Sensing Applications Volume 3 Issue 3, September 2013 www.ijrsa.org
119
section, the fundamental geographic concepts
involved in this work is introduced.
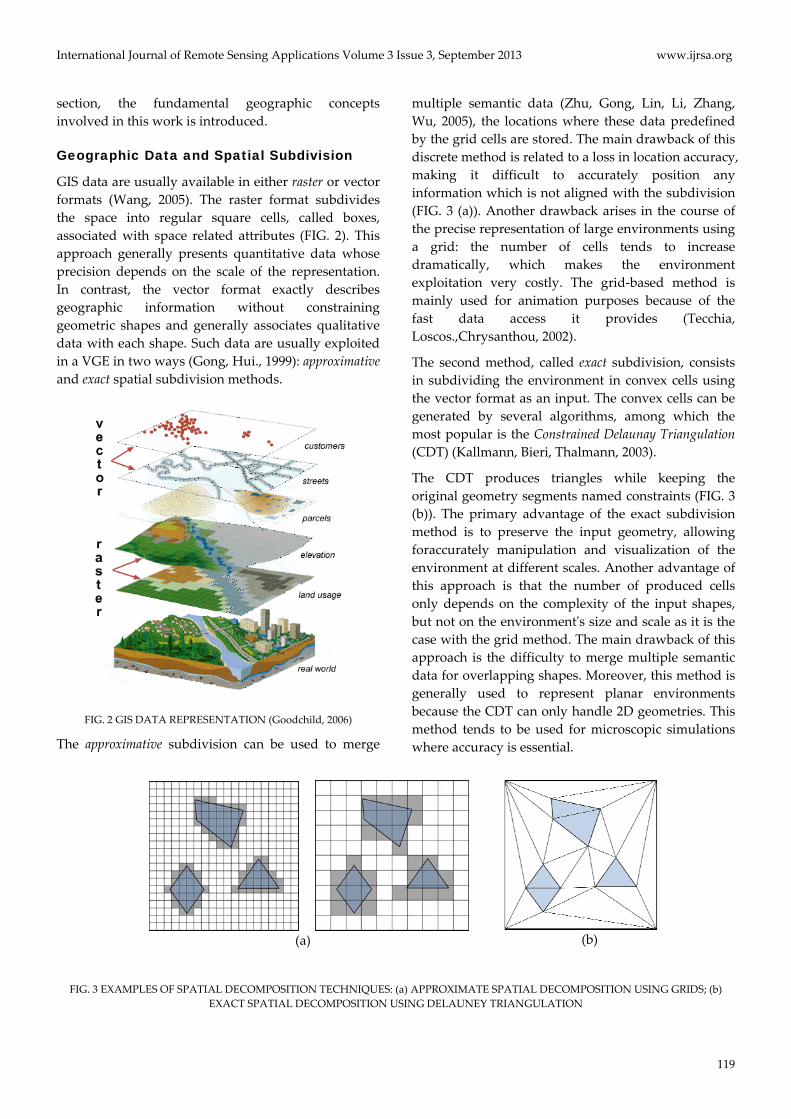
Geographic Data and Spatial Subdivision
GIS data are usually available in either raster or vector
formats (Wang, 2005). The raster format subdivides
the space into regular square cells, called boxes,
associated with space related attributes (FIG. 2). This
approach generally presents quantitative data whose
precision depends on the scale of the representation.
In contrast, the vector format exactly describes
geographic information without constraining
geometric shapes and generally associates qualitative
data with each shape. Such data are usually exploited
in a VGE in two ways (Gong, Hui., 1999): approximative
and exact spatial subdivision methods.
FIG. 2 GIS DATA REPRESENTATION (Goodchild, 2006)
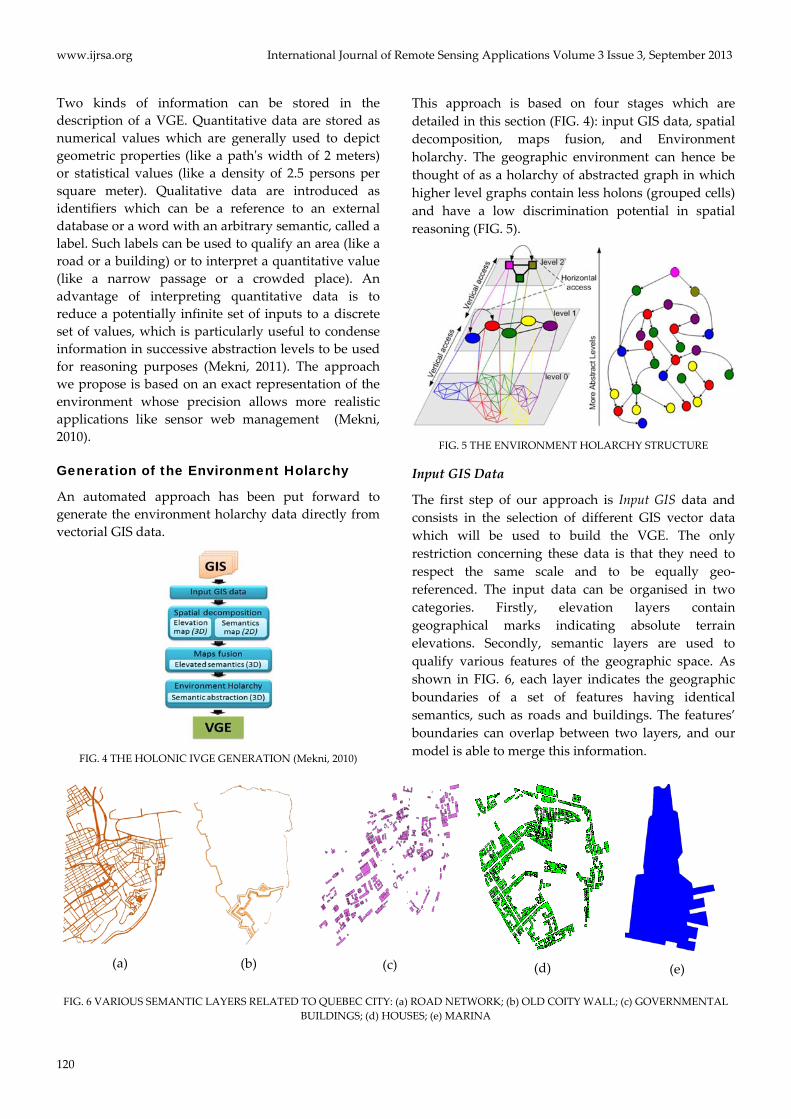
The approximative subdivision can be used to merge
multiple semantic data (Zhu, Gong, Lin, Li, Zhang,
Wu, 2005), the locations where these data predefined
by the grid cells are stored. The main drawback of this
discrete method is related to a loss in location accuracy,
making it difficult to accurately position any
information which is not aligned with the subdivision
(FIG. 3 (a)). Another drawback arises in the course of
the precise representation of large environments using
a grid: the number of cells tends to increase
dramatically, which makes the environment
exploitation very costly. The grid‐based method is
mainly used for animation purposes because of the
fast data access it provides (Tecchia,
Loscos.,Chrysanthou, 2002).
The second method, called exact subdivision, consists
in subdividing the environment in convex cells using
the vector format as an input. The convex cells can be
generated by several algorithms, among which the
most popular is the Constrained Delaunay Triangulation
(CDT) (Kallmann, Bieri, Thalmann, 2003).
The CDT produces triangles while keeping the
original geometry segments named constraints (FIG. 3
(b)). The primary advantage of the exact subdivision
method is to preserve the input geometry, allowing
foraccurately manipulation and visualization of the
environment at different scales. Another advantage of
this approach is that the number of produced cells
only depends on the complexity of the input shapes,
but not on the environmentʹs size and scale as it is the
case with the grid method. The main drawback of this
approach is the difficulty to merge multiple semantic
data for overlapping shapes. Moreover, this method is
generally used to represent planar environments
because the CDT can only handle 2D geometries. This
method tends to be used for microscopic simulations
where accuracy is essential.
(a)
(b)
FIG. 3 EXAMPLES OF SPATIAL DECOMPOSITION TECHNIQUES: (a) APPROXIMATE SPATIAL DECOMPOSITION USING GRIDS; (b)
EXACT SPATIAL DECOMPOSITION USING DELAUNEY TRIANGULATION
www.ijrsa.org International Journal of Remote Sensing Applications Volume 3 Issue 3, September 2013
120
Two kinds of information can be stored in the
description of a VGE. Quantitative data are stored as
numerical values which are generally used to depict
geometric properties (like a pathʹs width of 2 meters)
or statistical values (like a density of 2.5 persons per
square meter). Qualitative data are introduced as
identifiers which can be a reference to an external
database or a word with an arbitrary semantic, called a
label. Such labels can be used to qualify an area (like a
road or a building) or to interpret a quantitative value
(like a narrow passage or a crowded place). An
advantage of interpreting quantitative data is to
reduce a potentially infinite set of inputs to a discrete
set of values, which is particularly useful to condense
information in successive abstraction levels to be used
for reasoning purposes (Mekni, 2011). The approach
we propose is based on an exact representation of the
environment whose precision allows more realistic
applications like sensor web management (Mekni,
2010).
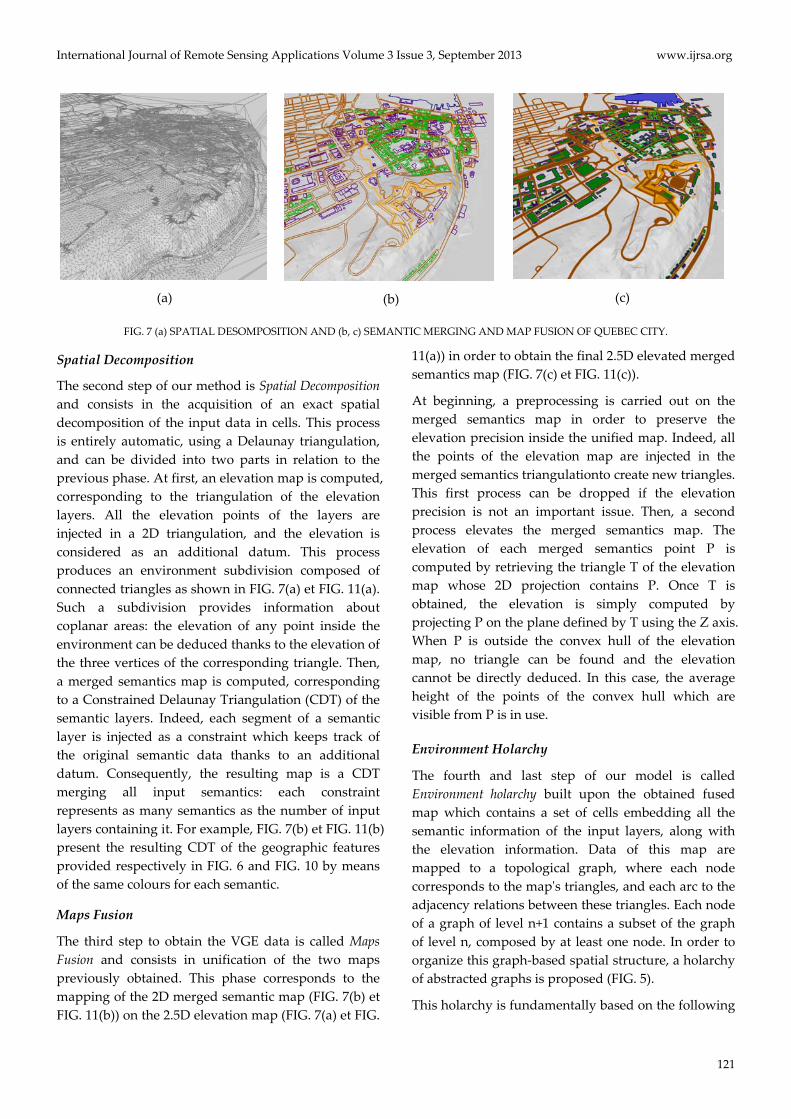
Generation of the Environment Holarchy
An automated approach has been put forward to
generate the environment holarchy data directly from
vectorial GIS data.
FIG. 4 THE HOLONIC IVGE GENERATION (Mekni, 2010)
This approach is based on four stages which are
detailed in this section (FIG. 4): input GIS data, spatial
decomposition, maps fusion, and Environment
holarchy. The geographic environment can hence be
thought of as a holarchy of abstracted graph in which
higher level graphs contain less holons (grouped cells)
and have a low discrimination potential in spatial
reasoning (FIG. 5).
FIG. 5 THE ENVIRONMENT HOLARCHY STRUCTURE
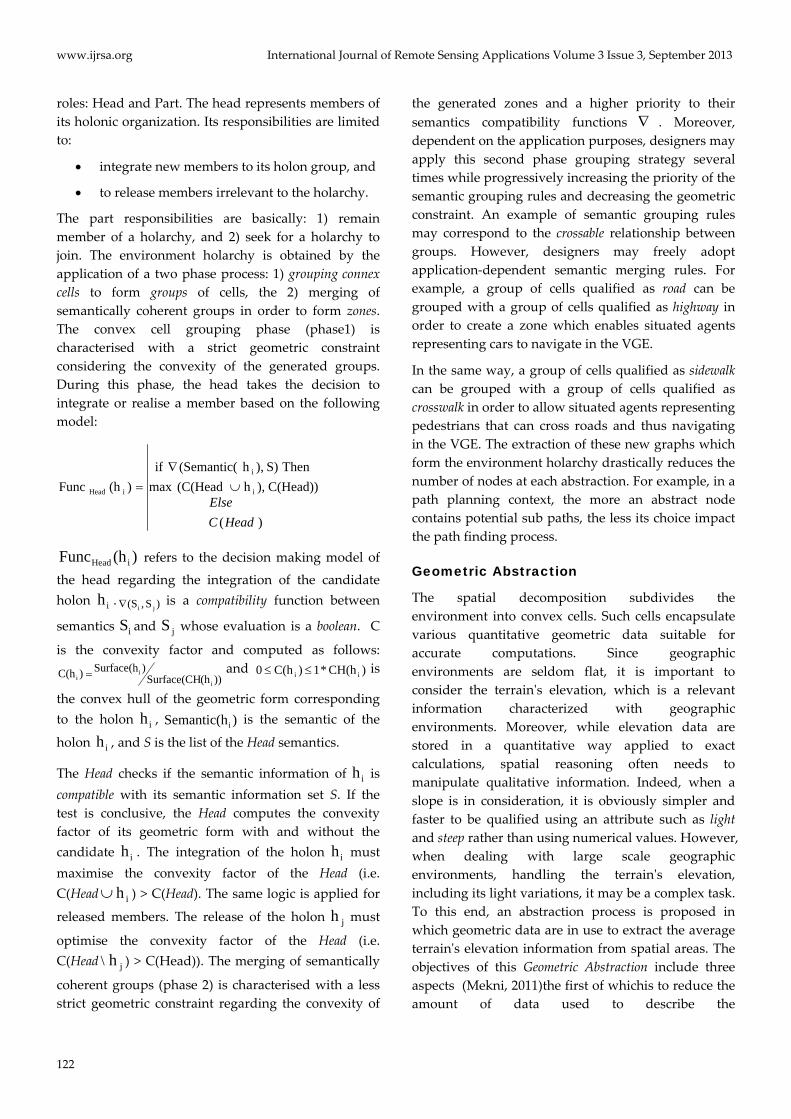
Input GIS Data
The first step of our approach is Input GIS data and
consists in the selection of different GIS vector data
which will be used to build the VGE. The only
restriction concerning these data is that they need to
respect the same scale and to be equally geo‐
referenced. The input data can be organised in two
categories. Firstly, elevation layers contain
geographical marks indicating absolute terrain
elevations. Secondly, semantic layers are used to
qualify various features of the geographic space. As
shown in FIG. 6, each layer indicates the geographic
boundaries of a set of features having identical
semantics, such as roads and buildings. The features’
boundaries can overlap between two layers, and our
model is able to merge this information.
(a)
(b) (c)
(d)
(e)
FIG. 6 VARIOUS SEMANTIC LAYERS RELATED TO QUEBEC CITY: (a) ROAD NETWORK; (b) OLD COITY WALL; (c) GOVERNMENTAL
BUILDINGS; (d) HOUSES; (e) MARINA
International Journal of Remote Sensing Applications Volume 3 Issue 3, September 2013 www.ijrsa.org
121
(a)
(b)
(c)
FIG. 7 (a) SPATIAL DESOMPOSITION AND (b, c) SEMANTIC MERGING AND MAP FUSION OF QUEBEC CITY.
Spatial Decomposition
The second step of our method is Spatial Decomposition
and consists in the acquisition of an exact spatial
decomposition of the input data in cells. This process
is entirely automatic, using a Delaunay triangulation,
and can be divided into two parts in relation to the
previous phase. At first, an elevation map is computed,
corresponding to the triangulation of the elevation
layers. All the elevation points of the layers are
injected in a 2D triangulation, and the elevation is
considered as an additional datum. This process
produces an environment subdivision composed of
connected triangles as shown in FIG. 7(a) et FIG. 11(a).
Such a subdivision provides information about
coplanar areas: the elevation of any point inside the
environment can be deduced thanks to the elevation of
the three vertices of the corresponding triangle. Then,
a merged semantics map is computed, corresponding
to a Constrained Delaunay Triangulation (CDT) of the
semantic layers. Indeed, each segment of a semantic
layer is injected as a constraint which keeps track of
the original semantic data thanks to an additional
datum. Consequently, the resulting map is a CDT
merging all input semantics: each constraint
represents as many semantics as the number of input
layers containing it. For example, FIG. 7(b) et FIG. 11(b)
present the resulting CDT of the geographic features
provided respectively in FIG. 6 and FIG. 10 by means
of the same colours for each semantic.
Maps Fusion
The third step to obtain the VGE data is called Maps
Fusion and consists in unification of the two maps
previously obtained. This phase corresponds to the
mapping of the 2D merged semantic map (FIG. 7(b) et
FIG. 11(b)) on the 2.5D elevation map (FIG. 7(a) et FIG.
11(a)) in order to obtain the final 2.5D elevated merged
semantics map (FIG. 7(c) et FIG. 11(c)).
At beginning, a preprocessing is carried out on the
merged semantics map in order to preserve the
elevation precision inside the unified map. Indeed, all
the points of the elevation map are injected in the
merged semantics triangulationto create new triangles.
This first process can be dropped if the elevation
precision is not an important issue. Then, a second
process elevates the merged semantics map. The
elevation of each merged semantics point P is
computed by retrieving the triangle T of the elevation
map whose 2D projection contains P. Once T is
obtained, the elevation is simply computed by
projecting P on the plane defined by T using the Z axis.
When P is outside the convex hull of the elevation
map, no triangle can be found and the elevation
cannot be directly deduced. In this case, the average
height of the points of the convex hull which are
visible from P is in use.
Environment Holarchy
The fourth and last step of our model is called
Environment holarchy built upon the obtained fused
map which contains a set of cells embedding all the
semantic information of the input layers, along with
the elevation information. Data of this map are
mapped to a topological graph, where each node
corresponds to the mapʹs triangles, and each arc to the
adjacency relations between these triangles. Each node
of a graph of level n+1 contains a subset of the graph
of level n, composed by at least one node. In order to
organize this graph‐based spatial structure, a holarchy
of abstracted graphs is proposed (FIG. 5).
This holarchy is fundamentally based on the following
www.ijrsa.org International Journal of Remote Sensing Applications Volume 3 Issue 3, September 2013
122
roles: Head and Part. The head represents members of
its holonic organization. Its responsibilities are limited
to:
integrate new members to its holon group, and
to release members irrelevant to the holarchy.
The part responsibilities are basically: 1) remain
member of a holarchy, and 2) seek for a holarchy to
join. The environment holarchy is obtained by the
application of a two phase process: 1) grouping connex
cells to form groups of cells, the 2) merging of
semantically coherent groups in order to form zones.
The convex cell grouping phase (phase1) is
characterised with a strict geometric constraint
considering the convexity of the generated groups.
During this phase, the head takes the decision to
integrate or realise a member based on the following
model:
)(
C(Head)) ),h (C(Headmax
Then S) ),h(Semantic( if
)(hFunc i
i
iHead
HeadC
Else
)(hFunc iHead refers to the decision making model of
the head regarding the integration of the candidate
holon ih . )S ,(S ji is a compatibility function between
semantics iS and jS whose evaluation is a boolean. C
is the convexity factor and computed as follows:
))(hSurface(CH)Surface(h )C(h
i
ii and )CH(h*1)C(h0 ii is
the convex hull of the geometric form corresponding
to the holon ih , )Semantic(hi is the semantic of the
holon ih , and S is the list of the Head semantics.
The Head checks if the semantic information of ih is
compatible with its semantic information set S. If the
test is conclusive, the Head computes the convexity
factor of its geometric form with and without the
candidate ih . The integration of the holon ih must
maximise the convexity factor of the Head (i.e.
C(Head ih ) > C(Head). The same logic is applied for
released members. The release of the holon jh must
optimise the convexity factor of the Head (i.e.
C(Head\ jh ) > C(Head)). The merging of semantically
coherent groups (phase 2) is characterised with a less
strict geometric constraint regarding the convexity of
the generated zones and a higher priority to their
semantics compatibility functions . Moreover,
dependent on the application purposes, designers may
apply this second phase grouping strategy several
times while progressively increasing the priority of the
semantic grouping rules and decreasing the geometric
constraint. An example of semantic grouping rules
may correspond to the crossable relationship between
groups. However, designers may freely adopt
application‐dependent semantic merging rules. For
example, a group of cells qualified as road can be
grouped with a group of cells qualified as highway in
order to create a zone which enables situated agents
representing cars to navigate in the VGE.
In the same way, a group of cells qualified as sidewalk
can be grouped with a group of cells qualified as
crosswalk in order to allow situated agents representing
pedestrians that can cross roads and thus navigating
in the VGE. The extraction of these new graphs which
form the environment holarchy drastically reduces the
number of nodes at each abstraction. For example, in a
path planning context, the more an abstract node
contains potential sub paths, the less its choice impact
the path finding process.
Geometric Abstraction
The spatial decomposition subdivides the
environment into convex cells. Such cells encapsulate
various quantitative geometric data suitable for
accurate computations. Since geographic
environments are seldom flat, it is important to
consider the terrainʹs elevation, which is a relevant
information characterized with geographic
environments. Moreover, while elevation data are
stored in a quantitative way applied to exact
calculations, spatial reasoning often needs to
manipulate qualitative information. Indeed, when a
slope is in consideration, it is obviously simpler and
faster to be qualified using an attribute such as light
and steep rather than using numerical values. However,
when dealing with large scale geographic
environments, handling the terrainʹs elevation,
including its light variations, it may be a complex task.
To this end, an abstraction process is proposed in
which geometric data are in use to extract the average
terrainʹs elevation information from spatial areas. The
objectives of this Geometric Abstraction include three
aspects (Mekni, 2011)the first of whichis to reduce the
amount of data used to describe the
International Journal of Remote Sensing Applications Volume 3 Issue 3, September 2013 www.ijrsa.org
123
environmentthento detect anomalies, deviations, and
aberrations in elevation dataand the last is about the
geometric abstraction enhancing the environmental
description by integrating qualitative information
characterising the terrainʹs elevations.
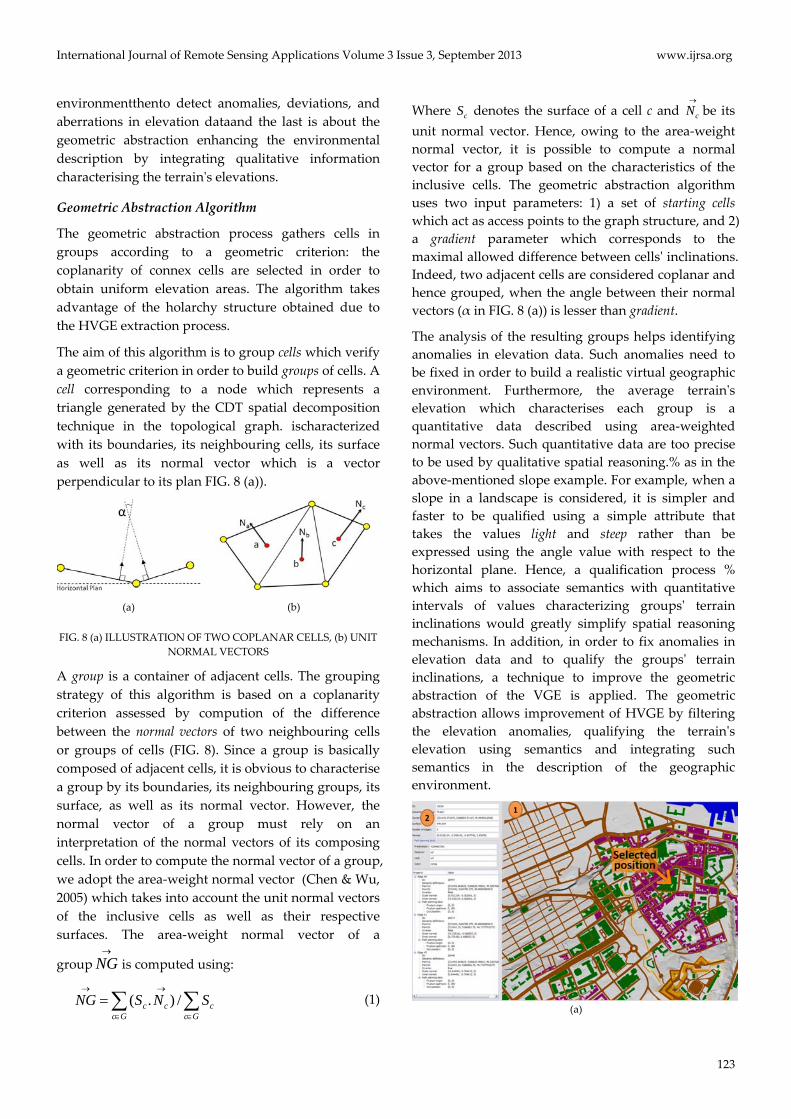
Geometric Abstraction Algorithm
The geometric abstraction process gathers cells in
groups according to a geometric criterion: the
coplanarity of connex cells are selected in order to
obtain uniform elevation areas. The algorithm takes
advantage of the holarchy structure obtained due to
the HVGE extraction process.
The aim of this algorithm is to group cells which verify
a geometric criterion in order to build groups of cells. A
cell corresponding to a node which represents a
triangle generated by the CDT spatial decomposition
technique in the topological graph. ischaracterized
with its boundaries, its neighbouring cells, its surface
as well as its normal vector which is a vector
perpendicular to its plan FIG. 8 (a)).
(a) (b)
FIG. 8 (a) ILLUSTRATION OF TWO COPLANAR CELLS, (b) UNIT
NORMAL VECTORS
A group is a container of adjacent cells. The grouping
strategy of this algorithm is based on a coplanarity
criterion assessed by compution of the difference
between the normal vectors of two neighbouring cells
or groups of cells (FIG. 8). Since a group is basically
composed of adjacent cells, it is obvious to characterise
a group by its boundaries, its neighbouring groups, its
surface, as well as its normal vector. However, the
normal vector of a group must rely on an
interpretation of the normal vectors of its composing
cells. In order to compute the normal vector of a group,
we adopt the area‐weight normal vector (Chen & Wu,
2005) which takes into account the unit normal vectors
of the inclusive cells as well as their respective
surfaces. The area‐weight normal vector of a
group
NG is computed using:
Gc
cGc
cc SNSNG /).( (1)
Where cS denotes the surface of a cell c and
cN be its
unit normal vector. Hence, owing to the area‐weight
normal vector, it is possible to compute a normal
vector for a group based on the characteristics of the
inclusive cells. The geometric abstraction algorithm
uses two input parameters: 1) a set of starting cells
which act as access points to the graph structure, and 2)
a gradient parameter which corresponds to the
maximal allowed difference between cellsʹ inclinations.
Indeed, two adjacent cells are considered coplanar and
hence grouped, when the angle between their normal
vectors (α in FIG. 8 (a)) is lesser than gradient.
The analysis of the resulting groups helps identifying
anomalies in elevation data. Such anomalies need to
be fixed in order to build a realistic virtual geographic
environment. Furthermore, the average terrainʹs
elevation which characterises each group is a
quantitative data described using area‐weighted
normal vectors. Such quantitative data are too precise
to be used by qualitative spatial reasoning.% as in the
above‐mentioned slope example. For example, when a
slope in a landscape is considered, it is simpler and
faster to be qualified using a simple attribute that
takes the values light and steep rather than be
expressed using the angle value with respect to the
horizontal plane. Hence, a qualification process %
which aims to associate semantics with quantitative
intervals of values characterizing groupsʹ terrain
inclinations would greatly simplify spatial reasoning
mechanisms. In addition, in order to fix anomalies in
elevation data and to qualify the groupsʹ terrain
inclinations, a technique to improve the geometric
abstraction of the VGE is applied. The geometric
abstraction allows improvement of HVGE by filtering
the elevation anomalies, qualifying the terrainʹs
elevation using semantics and integrating such
semantics in the description of the geographic
environment.
(a)
www.ijrsa.org International Journal of Remote Sensing Applications Volume 3 Issue 3, September 2013
124
(b)
FIG. 9 (a) 2D MAP VISUA:LIZATION OF THE HVGE. (1) UNIFIED
MAP, (2) INFORMATION ABOUT THE SELECTED POSITION. (b)
RESULTS OF THE GEOMEYRIC ABSTRACTION PROCESS
A detailed description of the geometric abstraction
algorithm as well as GIS data filtering and elevation
qualification processes are provided in (Mekni, 2011).
The geometric abstraction built using a graph traversal
algorithm groups cells based on their area‐weighted
normal vectors (FIG. 9 (b)). The objectives of the
geometric abstraction include three aspectsthe first of
which is to qualify the terrainʹs elevation of
geographic environments in order to simplify spatial
reasoning mechanisms, and second of which is to
identify and fix elevation anomalies in initial GIS
dataas well as to enriche the description of geographic
environments by integrating elevation semantics.
Results
In order to highlight the generic aspect of our holonic
approach to model large scale geographic
environments, two different kinds of environments
have been selected, one of which is a urban
environment corresponding to a part of Quebec city
(QC, Canada) which covers an area of 35 km2. This
urban environment is extracted from various GIS data
sources FIG. 6.
The first level of the environment holarchy
approximately contains 125,000 triangles (cells). While
the second level contains around 77 000 groups of cells,
and finally the third level encompasses 12 000 zones.
the other one is a geographic environment
representing the Montmorency experimental forest
(St.Lawrence Region, Quebec, Canada) and covering an
area of 47 km2. This natural environment is extracted
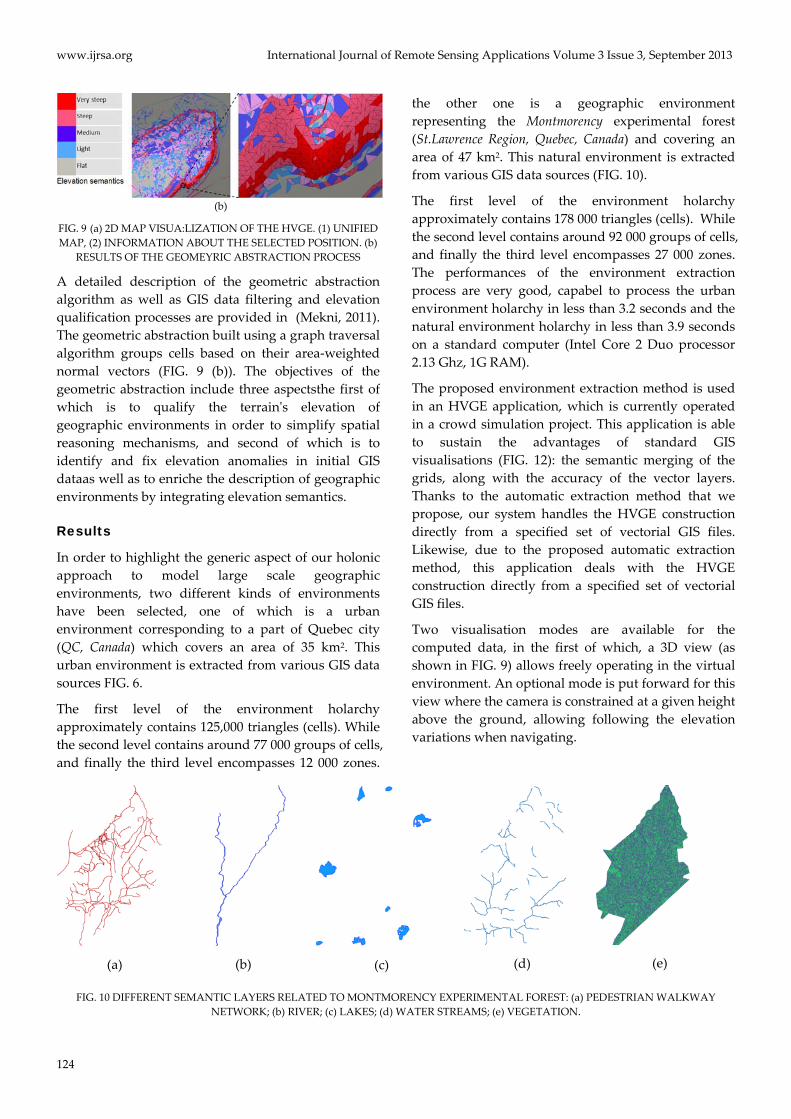
from various GIS data sources (FIG. 10).
The first level of the environment holarchy
approximately contains 178 000 triangles (cells). While
the second level contains around 92 000 groups of cells,
and finally the third level encompasses 27 000 zones.
The performances of the environment extraction
process are very good, capabel to process the urban
environment holarchy in less than 3.2 seconds and the
natural environment holarchy in less than 3.9 seconds
on a standard computer (Intel Core 2 Duo processor
2.13 Ghz, 1G RAM).
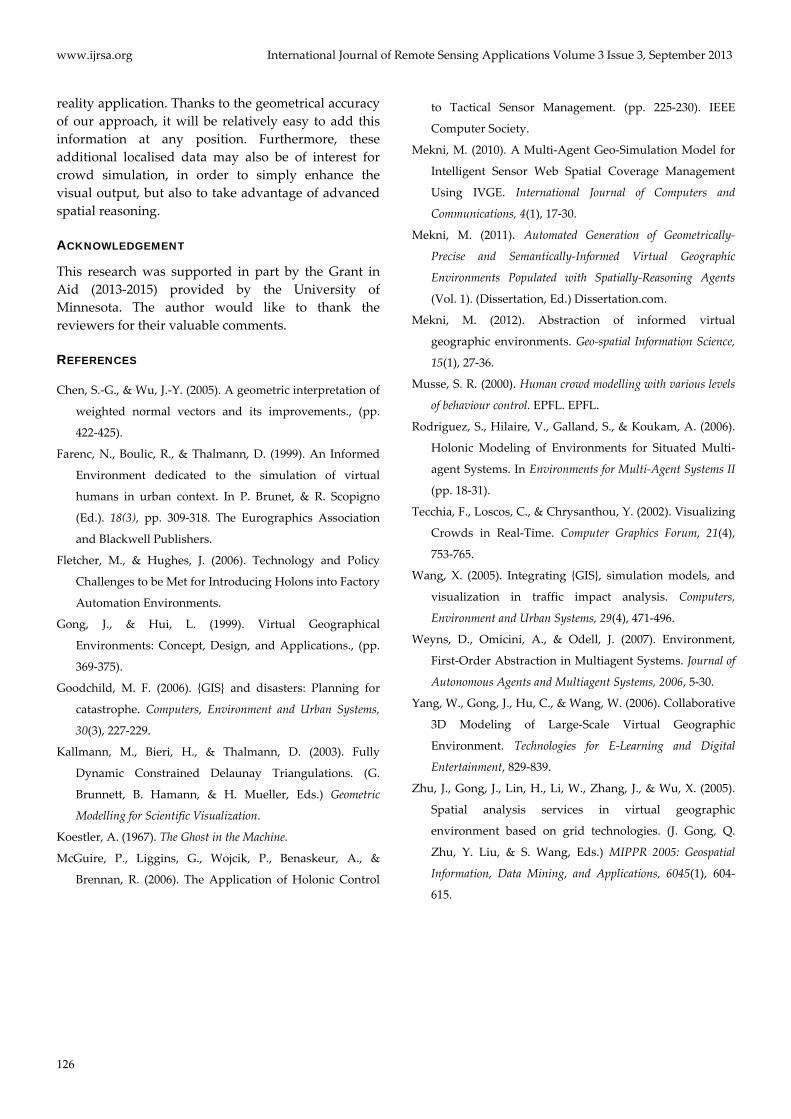
The proposed environment extraction method is used
in an HVGE application, which is currently operated
in a crowd simulation project. This application is able
to sustain the advantages of standard GIS
visualisations (FIG. 12): the semantic merging of the
grids, along with the accuracy of the vector layers.
Thanks to the automatic extraction method that we
propose, our system handles the HVGE construction
directly from a specified set of vectorial GIS files.
Likewise, due to the proposed automatic extraction
method, this application deals with the HVGE
construction directly from a specified set of vectorial
GIS files.
Two visualisation modes are available for the
computed data, in the first of which, a 3D view (as
shown in FIG. 9) allows freely operating in the virtual
environment. An optional mode is put forward for this
view where the camera is constrained at a given height
above the ground, allowing following the elevation
variations when navigating.
(a)
(b)
(c)
(d)
(e)
FIG. 10 DIFFERENT SEMANTIC LAYERS RELATED TO MONTMORENCY EXPERIMENTAL FOREST: (a) PEDESTRIAN WALKWAY
NETWORK; (b) RIVER; (c) LAKES; (d) WATER STREAMS; (e) VEGETATION.
International Journal of Remote Sensing Applications Volume 3 Issue 3, September 2013 www.ijrsa.org
125
(a) (b)
(c)
FIG. 11 (a) SPATIAL DESOMPOSITION, (b, c) SEMANTIC MERGING AND MAP FUSION OF MONTMORENCY EXPERIMENTAL FOREST
Secondly, an upper view is proposed with orthogonal
projection to represent the GIS data as a standard map.
In this view, the user can scroll an zoom the map ((1)
in FIG. 9), allowingfor accurate view of any portion of
the environment. Additionally, one can select a
position in the environment in order to retrieve the
corresponding data ((2) in FIG. 9), such as the
underlying triangle geometry, the corresponding
height, or the associated semantics.
FIG. 12 GIS VISUALISATION APPROACHS. THE PROPOSED
HOLONIC IVGE MERGES INFORMATION AND PRESENVES
GEOMETRIC ACCURACY
Conclusions
In this paper, a novel holonic approach has been
proposed to model large scale geographic
environments. This approach extracts an environment
holarchy from realistic GIS data and combines the
grid‐based facility to merge geographic semantic
information with the accuracy of vector‐based
geometric representations. The interest of a holonic
view of the environment is that it provides a scalable
multilevel model to express complex real world
environments.
The holonic approach opens perspectives to represent
different levels of detail, from a high‐level coarse‐
grained view of the environment to a low‐level fine‐
grained one. In addition, the suitability of the holonic
approach has been shown to organise the data
generated by the exact space decomposition into an
environment holarchy. The environment holarchy
allows us to take advantage of common and efficient
graph theory algorithms to examine its structure, and
especially graph traversal ones. Interactation with the
environment holarchy isto retrieve nodes which
correspond to cells, groups of cells, or zones;
depending on the holarchy level. Once a node is
obtained, it is possible to extract its corresponding
data such as the elevation and the semantics
information.
Given the above‐mentioned characteristics, the
environment holarchy opens large perspectives to
many spatial reasoning algorithms that can be easily
applied, such as path planning or virtual navigation.
Actually, we are currently working on an industrial
application of the VGE for sensor webs management
(Mekni, 2010). Indeed, this informed environment is
particularly well suited to such a domain, since it
allows efficient path planning, navigation, and
deployment algorithms and provides useful spatial
data needed for situated sensor agentsʹ behaviours.
Further improvement on the environment description
should be made by using topological graph
abstractions, which will allow us to reduce the
complexity of the graph exploration algorithms, and
also to deduce additional properties, such as the
reachable areas for a human being with respect to
variations of land slopes. Then, new information
should be attached to the environment description in
order to represent mobile or decorative elements.
These elements could be humans, vehicles, or even
street signs, dependent on the objectives of the virtual
www.ijrsa.org International Journal of Remote Sensing Applications Volume 3 Issue 3, September 2013
126
reality application. Thanks to the geometrical accuracy
of our approach, it will be relatively easy to add this
information at any position. Furthermore, these
additional localised data may also be of interest for
crowd simulation, in order to simply enhance the
visual output, but also to take advantage of advanced
spatial reasoning.
ACKNOWLEDGEMENT
This research was supported in part by the Grant in
Aid (2013‐2015) provided by the University of
Minnesota. The author would like to thank the
reviewers for their valuable comments.
REFERENCES
Chen, S.‐G., & Wu, J.‐Y. (2005). A geometric interpretation of
weighted normal vectors and its improvements., (pp.
422‐425).
Farenc, N., Boulic, R., & Thalmann, D. (1999). An Informed
Environment dedicated to the simulation of virtual
humans in urban context. In P. Brunet, & R. Scopigno
(Ed.). 18(3), pp. 309‐318. The Eurographics Association
and Blackwell Publishers.
Fletcher, M., & Hughes, J. (2006). Technology and Policy
Challenges to be Met for Introducing Holons into Factory
Automation Environments.
Gong, J., & Hui, L. (1999). Virtual Geographical
Environments: Concept, Design, and Applications., (pp.
369‐375).
Goodchild, M. F. (2006). {GIS} and disasters: Planning for
catastrophe. Computers, Environment and Urban Systems,
30(3), 227‐229.
Kallmann, M., Bieri, H., & Thalmann, D. (2003). Fully
Dynamic Constrained Delaunay Triangulations. (G.
Brunnett, B. Hamann, & H. Mueller, Eds.) Geometric
Modelling for Scientific Visualization.
Koestler, A. (1967). The Ghost in the Machine.
McGuire, P., Liggins, G., Wojcik, P., Benaskeur, A., &
Brennan, R. (2006). The Application of Holonic Control
to Tactical Sensor Management. (pp. 225‐230). IEEE
Computer Society.
Mekni, M. (2010). A Multi‐Agent Geo‐Simulation Model for
Intelligent Sensor Web Spatial Coverage Management
Using IVGE. International Journal of Computers and
Communications, 4(1), 17‐30.
Mekni, M. (2011). Automated Generation of Geometrically‐
Precise and Semantically‐Informed Virtual Geographic
Environments Populated with Spatially‐Reasoning Agents
(Vol. 1). (Dissertation, Ed.) Dissertation.com.
Mekni, M. (2012). Abstraction of informed virtual
geographic environments. Geo‐spatial Information Science,
15(1), 27‐36.
Musse, S. R. (2000). Human crowd modelling with various levels
of behaviour control. EPFL. EPFL.
Rodriguez, S., Hilaire, V., Galland, S., & Koukam, A. (2006).
Holonic Modeling of Environments for Situated Multi‐
agent Systems. In Environments for Multi‐Agent Systems II
(pp. 18‐31).
Tecchia, F., Loscos, C., & Chrysanthou, Y. (2002). Visualizing
Crowds in Real‐Time. Computer Graphics Forum, 21(4),
753‐765.
Wang, X. (2005). Integrating {GIS}, simulation models, and
visualization in traffic impact analysis. Computers,
Environment and Urban Systems, 29(4), 471‐496.
Weyns, D., Omicini, A., & Odell, J. (2007). Environment,
First‐Order Abstraction in Multiagent Systems. Journal of
Autonomous Agents and Multiagent Systems, 2006, 5‐30.
Yang, W., Gong, J., Hu, C., & Wang, W. (2006). Collaborative
3D Modeling of Large‐Scale Virtual Geographic
Environment. Technologies for E‐Learning and Digital
Entertainment, 829‐839.
Zhu, J., Gong, J., Lin, H., Li, W., Zhang, J., & Wu, X. (2005).
Spatial analysis services in virtual geographic
environment based on grid technologies. (J. Gong, Q.
Zhu, Y. Liu, & S. Wang, Eds.) MIPPR 2005: Geospatial
Information, Data Mining, and Applications, 6045(1), 604‐
615.