Embed Size (px)
Citation preview

University of Wisconsin System Overview
Informational Paper 32
Wisconsin Legislative Fiscal Bureau January, 2015

University of Wisconsin System Overview
Prepared by
Emily Pope
Wisconsin Legislative Fiscal Bureau One East Main, Suite 301
Madison, WI 53703 http://legis.wisconsin.gov/lfb

TABLE OF CONTENTS
History ................................................................................................................................................... 1 Governance ............................................................................................................................................ 2 Relationships with Other Agencies and Programs ............................................................................... 5 Missions of UW System Institutions .................................................................................................... 6 Enrollment ............................................................................................................................................. 8 Admissions .......................................................................................................................................... 13 Campus Characteristics ....................................................................................................................... 15 Academic Programs ........................................................................................................................... 17 Budget .................................................................................................................................................. 19 Program Revenue Balances ................................................................................................................ 22 Tuition ................................................................................................................................................. 24 UW Personnel...................................................................................................................................... 27

1
University of Wisconsin System Overview
This paper provides an overview of the Uni-versity of Wisconsin System including a descrip-tion of the System's history, governance, enroll-ment, admissions, campus characteristics, aca-demic programs, budget, tuition, and personnel.
History
Prior to 1971, the state's institutions of higher education were organized into two separate sys-tems: the University of Wisconsin, consisting of campuses at Madison, Milwaukee, Green Bay, and Parkside plus 10 freshman-sophomore cen-ters and UW-Extension; and the Wisconsin State University System, consisting of the Eau Claire, La Crosse, Oshkosh, Platteville, River Falls, Ste-vens Point, Stout, Superior, and Whitewater campuses plus four freshman-sophomore centers. Chapter 100, Laws of 1971, merged the two uni-versity systems under a single Board of Regents. The 1971 legislation did not create a single, con-solidated statutory chapter to govern the system but, rather, provided for a study committee to de-velop such a chapter for the merged university system. Legislation passed in 1974 completed the merger process by establishing Chapter 36 of the statutes as the statutory foundation of the Univer-sity of Wisconsin System now consisting of: 13 universities; a unified, two-year college system with 13 campuses; and a statewide extension. The UW system is one of the largest merged sys-tems in the country, enrolling approximately 180,000 students. The pre-merger University of Wisconsin was created by the State Constitution and implement-ed by state law in 1848. At the time of merger in 1971, it consisted of the original land-grant uni-versity at Madison (1849); four-year campuses at
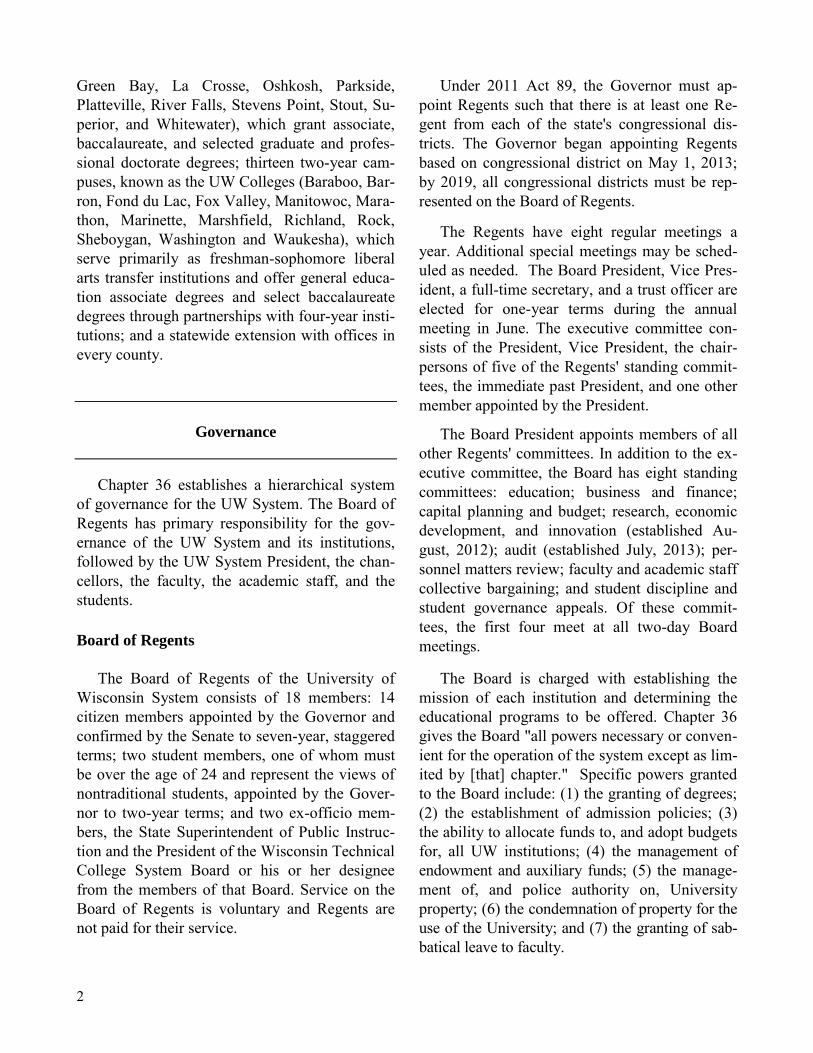
Milwaukee (created by a merger of extension fa-cilities and a state teacher's college in 1956), Green Bay (1968), and Parkside (1968); 10 freshman-sophomore centers (separated from the statewide extension facilities in 1964); and statewide extension. Total 1971 enrollment was 69,554. Governance was by the Regents of the University of Wisconsin, a board of 10 members, nine of whom were appointed by the Governor and confirmed by the Senate for nine-year terms. The State Superintendent of Public Instruction served as the tenth member of the board. The Wisconsin State Universities (WSU) Sys-tem had its origins in an 1857 state law creating the Board of Regents of Normal Schools. The first of nine such institutions (including Milwau-kee) was opened at Platteville in 1866 and the last at Eau Claire in 1916. The normal schools operated as two-year institutions until 1927, when they received authority to grant baccalaure-ate degrees in education and were renamed State Teachers Colleges. With the addition of liberal arts programs in 1951, they became Wisconsin State Colleges and in 1964 were designated Wis-consin State Universities. Stout, established as an independent home economics college, became part of the Wisconsin State Colleges in 1955. At the time of merger in 1971, the Board had 14 members, including the State Superintendent of Public Instruction and 13 citizens appointed by the Governor and confirmed by the Senate for five-year terms. The WSU System consisted of the nine universities and four freshman-sophomore branch campuses with a total enroll-ment of 64,148. The current UW System (see Figure I) con-sists of two doctoral campuses (Madison, Mil-waukee), which grant baccalaureate, master's, doctoral, and advanced professional degrees; eleven comprehensive campuses (Eau Claire,
2
Green Bay, La Crosse, Oshkosh, Parkside, Platteville, River Falls, Stevens Point, Stout, Su-perior, and Whitewater), which grant associate, baccalaureate, and selected graduate and profes-sional doctorate degrees; thirteen two-year cam-puses, known as the UW Colleges (Baraboo, Bar-ron, Fond du Lac, Fox Valley, Manitowoc, Mara-thon, Marinette, Marshfield, Richland, Rock, Sheboygan, Washington and Waukesha), which serve primarily as freshman-sophomore liberal arts transfer institutions and offer general educa-tion associate degrees and select baccalaureate degrees through partnerships with four-year insti-tutions; and a statewide extension with offices in every county.
Governance
Chapter 36 establishes a hierarchical system of governance for the UW System. The Board of Regents has primary responsibility for the gov-ernance of the UW System and its institutions, followed by the UW System President, the chan-cellors, the faculty, the academic staff, and the students. Board of Regents
The Board of Regents of the University of Wisconsin System consists of 18 members: 14 citizen members appointed by the Governor and confirmed by the Senate to seven-year, staggered terms; two student members, one of whom must be over the age of 24 and represent the views of nontraditional students, appointed by the Gover-nor to two-year terms; and two ex-officio mem-bers, the State Superintendent of Public Instruc-tion and the President of the Wisconsin Technical College System Board or his or her designee from the members of that Board. Service on the Board of Regents is voluntary and Regents are not paid for their service.
Under 2011 Act 89, the Governor must ap-point Regents such that there is at least one Re-gent from each of the state's congressional dis-tricts. The Governor began appointing Regents based on congressional district on May 1, 2013; by 2019, all congressional districts must be rep-resented on the Board of Regents.
The Regents have eight regular meetings a year. Additional special meetings may be sched-uled as needed. The Board President, Vice Pres-ident, a full-time secretary, and a trust officer are elected for one-year terms during the annual meeting in June. The executive committee con-sists of the President, Vice President, the chair-persons of five of the Regents' standing commit-tees, the immediate past President, and one other member appointed by the President.
The Board President appoints members of all other Regents' committees. In addition to the ex-ecutive committee, the Board has eight standing committees: education; business and finance; capital planning and budget; research, economic development, and innovation (established Au-gust, 2012); audit (established July, 2013); per-sonnel matters review; faculty and academic staff collective bargaining; and student discipline and student governance appeals. Of these commit-tees, the first four meet at all two-day Board meetings.
The Board is charged with establishing the mission of each institution and determining the educational programs to be offered. Chapter 36 gives the Board "all powers necessary or conven-ient for the operation of the system except as lim-ited by [that] chapter." Specific powers granted to the Board include: (1) the granting of degrees; (2) the establishment of admission policies; (3) the ability to allocate funds to, and adopt budgets for, all UW institutions; (4) the management of endowment and auxiliary funds; (5) the manage-ment of, and police authority on, University property; (6) the condemnation of property for the use of the University; and (7) the granting of sab-batical leave to faculty.
3
FIGURE I
Campuses of the University of Wisconsin System
■ Universities ● Freshman-Sophomore Colleges UW-Extension Offices in every county
■ UW-Oshkosh
■ UW-Superior
■ UW-River Falls
■ UW-Stevens Point
■ UW-Eau Claire
UW-Green Bay ■
■ UW-Stout
UW-Madison ■
UW-Platteville ■ ■ UW-Whitewater
UW-Milwaukee ■
UW-Parkside ■
● UW-Barron County
UW-Marinette County ●
UW-Rock County ●
UW-Waukesha County ●
UW-Richland ●
UW-Baraboo/Sauk County ●
UW-Marshfield/Wood County ●
■ UW-La Crosse
UW-Fox Valley ● UW-Manitowoc County ●
UW-Sheboygan County ●
UW-Washington County ●
● UW-Marathon County
UW-Fond du Lac ●
4
The Board appoints the President of the Uni-versity System; the chancellors and vice chancel-lors of the 13 universities and the UW-Extension and UW Colleges; the deans who head each of the UW Colleges; and all other UW System em-ployees except those appointed by the UW Sys-tem President. The Board also appoints the direc-tors of the State Laboratory of Hygiene and the Psychiatric Institute, the State Cartographer, and the State Geologist. Through July 1, 2015, the Board of Regents sets the salaries of all unclassi-fied UW employees. Beginning on July 1, 2015, the Board will set the salaries of all UW employ-ees except the salaries of employees assigned to UW-Madison, which will be set by the chancellor of that institution, and employees covered by col-lective bargaining agreements.
President and UW System Administration The President of the UW System is charged with implementing Regent policies and adminis-tering the UW System. The President directs UW System Administration, located in Madison. UW System Administration was established to assist the Board of Regents and the UW System Presi-dent in: (1) establishing policies and monitoring, reviewing, and evaluating those policies; (2) co-ordinating program development and operation among institutions; (3) planning the programmat-ic, financial, and physical development of the system; (4) maintaining fiscal control; and (5) compiling and recommending educational pro-grams, operating budgets, and building programs for the Board. In addition to a President, there is a senior vice president for administration, who serves as the chief operating officer of the UW System; a senior vice president for academic and student affairs; a vice president for finance; and a vice president for university relations within System administration. While the UW System President has the power to appoint and dismiss each Sys-tem senior vice president, vice president, associ-ate vice president, and assistant vice president,
the Board sets the salaries and duties of these administrators. For 2014-15, System Administra-tion has a total budget of $14.8 million and 70 authorized positions. Chancellors: There are 14 chancellors in the UW System: one for each of the thirteen four-year institutions and one joint chancellor for the UW Colleges and UW-Extension. The chancel-lors serve at the pleasure of the Board of Regents and report to the UW System President and the Board. As the executive heads of their respective faculties and institutions, chancellors are respon-sible for administering Board policies under the direction of the UW System President. Subject to Board policy and in consultation with their facul-ties, the chancellors are responsible for curricu-lum design; setting degree requirements; deter-mining academic standards; establishing grading systems; defining and administering institutional standards for faculty appointments, evaluation, promotion, and recommendations for tenure; rec-ommending individual merit increases; adminis-tering auxiliary services; and budget manage-ment. Under 2011 Act 32, additional responsibilities were granted to the UW-Madison Chancellor. During the 2011-13 biennium, the UW-Madison Chancellor was responsible for the development of a new personnel system for all employees as-signed to UW-Madison and was authorized to provide supplemental pay plans to UW-Madison employees if approved by the Joint Committee on Employment Relations (JCOER). The Board of Regents was responsible for the development of a new personnel system for, and could provide supplemental pay plans to, all other UW employ-ees. Beginning in the 2011-13 biennium and con-tinuing in future biennia, the UW-Madison chan-cellor is required to submit an annual accounta-bility report to the Governor and the Legislature for that institution and may create or abolish gen-eral purpose revenue (GPR) positions at UW-Madison pursuant to a memorandum of under-standing with the Department of Administration.
5
Beginning on July 1, 2015, the UW-Madison Chancellor will have the authority to set salaries for UW-Madison employees subject to state stat-utes and the state compensation plan, will submit recommendations to the Director of the Office of State Employment Relations regarding pay plan adjustments for UW-Madison employees, and will negotiate contracts with labor organizations representing UW-Madison employees subject to approval by JCOER. With regard to all other UW institutions and employees, statutes grant these responsibilities to the Board of Regents.
Faculty: The faculty of each institution is re-sponsible for the immediate governance of the institution and has the right to actively participate in institutional policy development. As such, the faculty has the primary responsibility for aca-demic and educational activities and faculty per-sonnel matters. The faculty of each institution has the right to determine their own organizational structure and to select representatives to partici-pate in institutional governance.
Academic Staff: The academic staff mem-bers of each institution have the right to be active participants in the immediate governance of and policy development for the institution. They have primary responsibility for the formulation and review of all policies and procedures concerning academic staff including personnel matters. The academic staff of each institution has the right to determine their own organizational structure and to select representatives to participate in institu-tional governance.
Students: The students of each institution have primary responsibility for the formulation and review of policies concerning student life, services, and interests, and may actively partici-pate in the immediate governance of and policy development for the institution. In consultation with the chancellor, subject to final confirmation of the Board, students are responsible for disposi-tion of those student fees which constitute sub-stantial support for campus student activities. The
students of each institution have the right to de-termine their own organizational structure and to select representatives to participate in institution-al governance.
Relationships With Other
Agencies and Programs
Coordination with the Wisconsin Technical
College System (WTCS). Coordination of UW and technical college programs is required by statute. Under Chapter 36, the Board of Regents may not broaden the UW System's post-high school training mission without the approval of the WTCS Board. Likewise, the WTCS Board may not broaden its system's collegiate transfer program offerings without the approval of the Board of Regents. To facilitate coordination be-tween the two systems, the president of each governing board serves as an ex-officio member of the other board.
The UW System and WTCS also work to-gether to facilitate the transfer of students be-tween the two systems. As required by 2013 Act 20, the Board of Regents and the WTCS Board entered into an agreement to allow students to transfer no fewer than 30 general education cred-its earned at any institution within the two sys-tems to any other institution within the two sys-tems. The agreement, which took effect on July 1, 2014, identifies specific courses offered by the technical colleges and each UW institution whose credits would be transferable. In addition, UW institutions and technical col-leges may enter into articulation agreements or work together on collaborative degree programs. Articulation agreements provide that certain courses taken at one institution will transfer to the other institution. There are currently two WTCS and UW systemwide articulation agree-ments in the areas of nursing and early childhood
6
education and more than 500 program-to-program articulation agreements in place be-tween individual UW institutions and technical college districts. Collaborative degree programs are degree programs offered by two or more partner institutions. As of 2013-14, there were 13 collaborative degree programs offered by part-nered UW and WTCS institutions. The WTCS Board and the Board of Regents entered into a data exchange agreement in 2001 to allow the UW System to track transfer students from WTCS institutions, assess the outcomes of these students, and identify potential areas for new transfer students. The UW System Office of Policy Analysis and Research periodically re-leases studies related to students who have trans-ferred from Wisconsin technical colleges to UW institutions.
City and County Relationships with the
UW Colleges. The counties, and in some cases the cities, in which the two-year UW Colleges are situated own and maintain the buildings, fa-cilities, and grounds of the campuses. In 2013, cities and counties budgeted a total of $11.3 mil-lion for debt service, small projects, and opera-tions related to the UW Colleges.
Educational Communications Board
(ECB). This agency is responsible for maintain-ing statewide public radio and television net-works and for the presentation of educational, cultural, informational, and public service pro-gramming. Statutes direct the Board of Regents to maintain and operate a public radio station and a public television station, WHA and WHA-TV, both located in Madison; to enter into an affilia-tion agreement with ECB to air educational pro-gramming on those stations; and to provide ECB with access to equipment and space. Together, ECB and UW-Extension's Division of Broadcast and Media Innovations operate Wisconsin public radio (WPR) and Wisconsin public television (WPT). Including WHA, the Board of Regents holds licenses for 15 radio stations, nine of which
are affiliated with WPR. By statute, one UW Re-gent and one UW System designee sit on the ECB Board.
Department of Public Instruction (DPI). This agency is responsible for providing direction and supervision of public elementary and sec-ondary education. The Superintendent of Public Instruction is a member of the Board of Regents.
Higher Educational Aids Board (HEAB). This agency has primary responsibility for the state's student financial aid system. The 11 HEAB Board members include a member of the Board of Regents, a financial aid administrator from an institution in the UW System, and a UW student.
Special Programs. A number of special pro-grams are affiliated with the UW System by stat-ute. Among these programs are: (1) Agricultural Demonstration Stations, established by the Board of Regents through the College of Agricultural and Life Sciences at UW-Madison for the pur-pose of aiding in agricultural development; (2) the Geological and Natural History Survey, oper-ated by the UW-Extension and located in Madi-son, which studies the geology, water, soils, plants, fish, and animal life of the state; (3) the State Laboratory of Hygiene, attached to UW-Madison and governed by its own board, which serves as the state's public and environmental health laboratory; (4) the Veterinary Diagnostic Laboratory, attached to UW-Madison and gov-erned by its own board; (5) the State Cartogra-pher, located at UW-Madison; and (6) the Wis-consin Environmental Education Board (WEEB), located at UW-Stevens Point, which is charged with the development, dissemination, and presen-tation of environmental education programs.
Missions of UW System Institutions
As provided in Chapter 36 of the statutes, the
7
mission of the UW System is to develop human resources, to discover and disseminate knowledge, to extend knowledge and its applica-tion beyond the boundaries of its campuses, and to serve and stimulate society by developing in students heightened intellectual, cultural and hu-mane sensitivities; scientific, professional and technological expertise; and a sense of purpose. Inherent in this broad mission are methods of in-struction, research, extended training, and public service designed to educate people and improve the human condition. By statute, the Board must establish a mission statement for each institution delineating specific program responsibilities and types of degrees to be granted. In addition to these institutional mis-sions, known as "select missions," the Board has also established two "core missions": one for the two doctoral institutions, Madison and Milwau-kee; and one for the eleven comprehensive insti-tutions. These mission statements were initially approved by the Board of Regents in 1974.
Core Missions
Doctoral Campuses (Madison and Milwau-kee). To offer baccalaureate, master's, doctoral, and advanced professional degrees; conduct or-ganized programs of research; assist UW-Extension in its function and encourage faculty and academic staff to participate in outreach ac-tivities; provide educational and research re-sources unique to doctoral campuses to other campuses and government agencies; seek racial and ethnic diversification of the student body and staff; and support activities designed to promote the economic development of the state. Comprehensive Campuses (11 four-year in-stitutions). To offer associate, baccalaureate, and selected graduate programs; emphasize teaching excellence; provide a core of liberal studies as a foundation for its degrees; offer programs of preprofessional curricular offerings; engage in scholarly activity; assist UW-Extension in its
function and encourage faculty and staff to par-ticipate in outreach activities; participate in inter-institutional relationships; seek racial and ethnic diversification of the student body and staff; and support activities designed to promote the eco-nomic development of the state.
Select Missions The mission of each individual institution is known as its "select mission." The select mission of each institution defines the particular purpose and focus of that institution. These mission statements serve as the planning documents for the growth and development of the institution. However, a mission statement does not provide any particular program entitlement not specifical-ly authorized by the Board. The content of indi-vidual institution's select missions is varied. Some include populations to be served, some name subjects to be taught, and some specify ac-ademic approaches to be taken.
An institution's select mission can be revised following a process provided in Board policy. Most recently, the Board approved revisions to the select missions of La Crosse and Stout in 2009, of Eau Claire and Oshkosh in 2010, of the UW Colleges in 2011, of Platteville in 2014, and approved addendums to the select missions of Green Bay, La Crosse, and Stout in 2014. The UW Colleges, UW-Extension, and UW System Administration also have select missions.
UW Colleges (13 two-year institutions). The UW Colleges serve primarily as freshman-sophomore liberal arts transfer institutions. The UW Colleges awards Associate of Arts and Sci-ence degrees and, beginning in fall, 2013, a sin-gle baccalaureate degree, the Bachelor of Ap-plied Arts and Sciences, aimed at meeting local and individual needs. The mission of the UW Colleges includes providing high-quality educa-tional programs that are accessible and affordable and bringing the resources of the University to the communities in which its campuses are locat-ed.
8
UW-Extension. By partnering with the 26 UW campuses, county and tribal governments, and other public and private organizations, UW-Extension brings the resources of the University to all Wisconsin residents. Its activities enable individuals, families, businesses, and communi-ties to achieve personal growth, professional suc-cess and organizational effectiveness through formal and informal learning; address the chang-ing needs of the state and society by applying relevant university research; and gain greater ac-cess to educational, cultural, and civic resources through the use of technologies. In addition, Ex-tension supports the UW System mission by providing leadership for the university's statewide public service mission; integrating scholarly approaches to outreach across many academic disciplines; and addressing the specific educational needs of underserved, disadvantaged, and nontraditional students.
UW System Administration. UW System Administration helps to develop, implement, monitor, and evaluate policies enacted by the Board of Regents to align university programs with the current and future need of the state and nation.
Enrollment
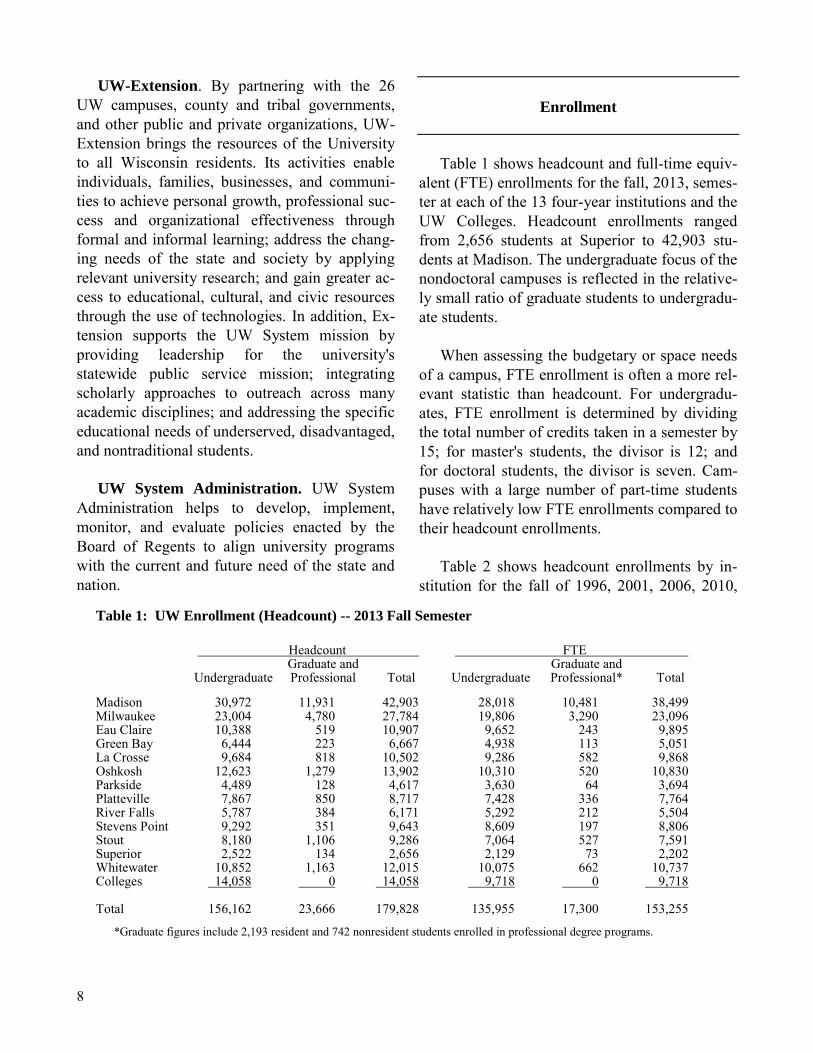
Table 1 shows headcount and full-time equiv-alent (FTE) enrollments for the fall, 2013, semes-ter at each of the 13 four-year institutions and the UW Colleges. Headcount enrollments ranged from 2,656 students at Superior to 42,903 stu-dents at Madison. The undergraduate focus of the nondoctoral campuses is reflected in the relative-ly small ratio of graduate students to undergradu-ate students. When assessing the budgetary or space needs of a campus, FTE enrollment is often a more rel-evant statistic than headcount. For undergradu-ates, FTE enrollment is determined by dividing the total number of credits taken in a semester by 15; for master's students, the divisor is 12; and for doctoral students, the divisor is seven. Cam-puses with a large number of part-time students have relatively low FTE enrollments compared to their headcount enrollments. Table 2 shows headcount enrollments by in-stitution for the fall of 1996, 2001, 2006, 2010,
Table 1: UW Enrollment (Headcount) -- 2013 Fall Semester
Headcount FTE Graduate and Graduate and Undergraduate Professional Total Undergraduate Professional* Total Madison 30,972 11,931 42,903 28,018 10,481 38,499 Milwaukee 23,004 4,780 27,784 19,806 3,290 23,096 Eau Claire 10,388 519 10,907 9,652 243 9,895 Green Bay 6,444 223 6,667 4,938 113 5,051 La Crosse 9,684 818 10,502 9,286 582 9,868 Oshkosh 12,623 1,279 13,902 10,310 520 10,830 Parkside 4,489 128 4,617 3,630 64 3,694 Platteville 7,867 850 8,717 7,428 336 7,764 River Falls 5,787 384 6,171 5,292 212 5,504 Stevens Point 9,292 351 9,643 8,609 197 8,806 Stout 8,180 1,106 9,286 7,064 527 7,591 Superior 2,522 134 2,656 2,129 73 2,202 Whitewater 10,852 1,163 12,015 10,075 662 10,737 Colleges 14,058 0 14,058 9,718 0 9,718 Total 156,162 23,666 179,828 135,955 17,300 153,255 *Graduate figures include 2,193 resident and 742 nonresident students enrolled in professional degree programs.
9
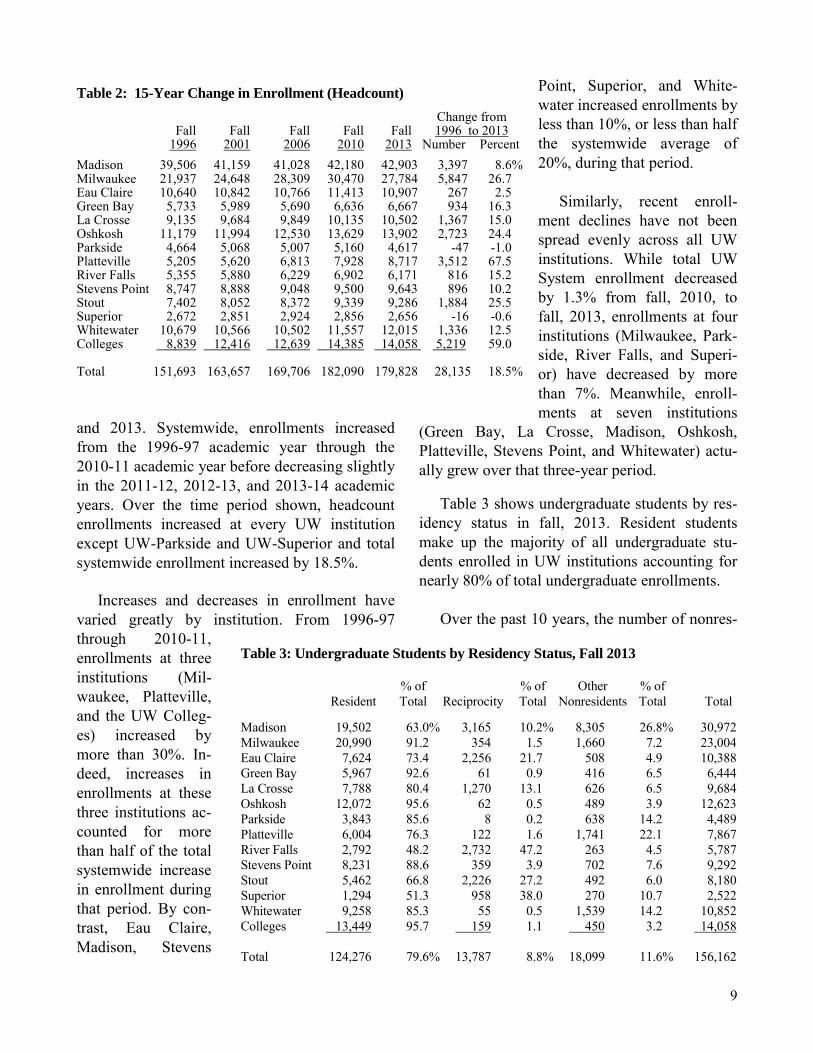
and 2013. Systemwide, enrollments increased from the 1996-97 academic year through the 2010-11 academic year before decreasing slightly in the 2011-12, 2012-13, and 2013-14 academic years. Over the time period shown, headcount enrollments increased at every UW institution except UW-Parkside and UW-Superior and total systemwide enrollment increased by 18.5%.
Increases and decreases in enrollment have varied greatly by institution. From 1996-97 through 2010-11, enrollments at three institutions (Mil-waukee, Platteville, and the UW Colleg-es) increased by more than 30%. In-deed, increases in enrollments at these three institutions ac-counted for more than half of the total systemwide increase in enrollment during that period. By con-trast, Eau Claire, Madison, Stevens
Point, Superior, and White-water increased enrollments by less than 10%, or less than half the systemwide average of 20%, during that period. Similarly, recent enroll-ment declines have not been spread evenly across all UW institutions. While total UW System enrollment decreased by 1.3% from fall, 2010, to fall, 2013, enrollments at four institutions (Milwaukee, Park-side, River Falls, and Superi-or) have decreased by more than 7%. Meanwhile, enroll-ments at seven institutions
(Green Bay, La Crosse, Madison, Oshkosh, Platteville, Stevens Point, and Whitewater) actu-ally grew over that three-year period. Table 3 shows undergraduate students by res-idency status in fall, 2013. Resident students make up the majority of all undergraduate stu-dents enrolled in UW institutions accounting for nearly 80% of total undergraduate enrollments. Over the past 10 years, the number of nonres-
Table 2: 15-Year Change in Enrollment (Headcount) Change from Fall Fall Fall Fall Fall 1996 to 2013 1996 2001 2006 2010 2013 Number Percent
Madison 39,506 41,159 41,028 42,180 42,903 3,397 8.6% Milwaukee 21,937 24,648 28,309 30,470 27,784 5,847 26.7 Eau Claire 10,640 10,842 10,766 11,413 10,907 267 2.5 Green Bay 5,733 5,989 5,690 6,636 6,667 934 16.3 La Crosse 9,135 9,684 9,849 10,135 10,502 1,367 15.0 Oshkosh 11,179 11,994 12,530 13,629 13,902 2,723 24.4 Parkside 4,664 5,068 5,007 5,160 4,617 -47 -1.0 Platteville 5,205 5,620 6,813 7,928 8,717 3,512 67.5 River Falls 5,355 5,880 6,229 6,902 6,171 816 15.2 Stevens Point 8,747 8,888 9,048 9,500 9,643 896 10.2 Stout 7,402 8,052 8,372 9,339 9,286 1,884 25.5 Superior 2,672 2,851 2,924 2,856 2,656 -16 -0.6 Whitewater 10,679 10,566 10,502 11,557 12,015 1,336 12.5 Colleges 8,839 12,416 12,639 14,385 14,058 5,219 59.0 Total 151,693 163,657 169,706 182,090 179,828 28,135 18.5%
Table 3: Undergraduate Students by Residency Status, Fall 2013
% of % of Other % of Resident Total Reciprocity Total Nonresidents Total Total Madison 19,502 63.0% 3,165 10.2% 8,305 26.8% 30,972 Milwaukee 20,990 91.2 354 1.5 1,660 7.2 23,004 Eau Claire 7,624 73.4 2,256 21.7 508 4.9 10,388 Green Bay 5,967 92.6 61 0.9 416 6.5 6,444 La Crosse 7,788 80.4 1,270 13.1 626 6.5 9,684 Oshkosh 12,072 95.6 62 0.5 489 3.9 12,623 Parkside 3,843 85.6 8 0.2 638 14.2 4,489 Platteville 6,004 76.3 122 1.6 1,741 22.1 7,867 River Falls 2,792 48.2 2,732 47.2 263 4.5 5,787 Stevens Point 8,231 88.6 359 3.9 702 7.6 9,292 Stout 5,462 66.8 2,226 27.2 492 6.0 8,180 Superior 1,294 51.3 958 38.0 270 10.7 2,522 Whitewater 9,258 85.3 55 0.5 1,539 14.2 10,852 Colleges 13,449 95.7 159 1.1 450 3.2 14,058 Total 124,276 79.6% 13,787 8.8% 18,099 11.6% 156,162
10
ident undergraduate students not covered by rec-iprocity agreements has increased dramatically, from 9,924 in fall, 2003, to 18,099 in fall, 2013. Nonresident students can be an important source of revenue for institutions as they generally pay higher tuition than resident students. Nonresident undergraduate tuition is $16,250 higher than res-ident tuition at Madison, $9,729 higher at Mil-waukee, and $7,573 higher at the comprehensive institutions. Because nonresident tuition is set at an amount higher than instructional costs, non-resident tuition revenues can be used to fund ad-ditional resident students or to partially offset reductions in state general purpose revenue (GPR) funding for the University. The largest percentages of nonresident stu-dents not covered by a reciprocity agreement are found at Madison and Platteville. As the flagship institution, Madison attracts students from a wid-er geographic area than other UW institutions. The relatively high percentage of non-reciprocity, nonresident students enrolled at Platteville is at-tributable to a tuition discount which has been offered to Illinois and Iowa students enrolled in certain programs since fall, 2005. In addition to Madison and Platteville, nonresident students not covered by reciprocity agreements made up more than 10% of undergraduate enrollment at Parkside, Superior, and Whitewater. Enrollment of nonresident students who are not covered by a reciprocity agreement is limited by Regent policy. Through the 2012-13 academic year, Regent policy limited enrollment of these students to 25% of total undergraduate enroll-ment at any institution. At the request of UW-Madison, this policy was modified in December, 2012, such that the three-year average of nonres-ident, nonreciprocity students should not exceed 27.5% of total undergraduate enrollment at any institution. The Minnesota-Wisconsin Higher Education Reciprocity Agreement allows Minnesota and Wisconsin residents to attend higher education
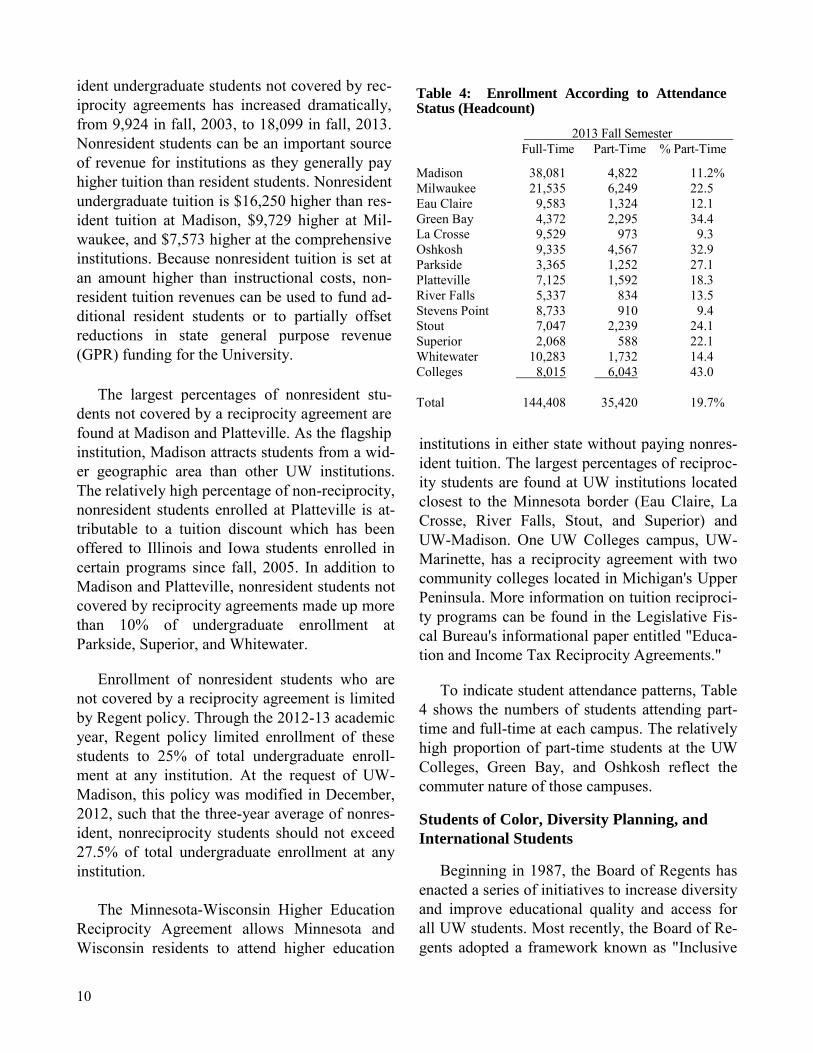
institutions in either state without paying nonres-ident tuition. The largest percentages of reciproc-ity students are found at UW institutions located closest to the Minnesota border (Eau Claire, La Crosse, River Falls, Stout, and Superior) and UW-Madison. One UW Colleges campus, UW-Marinette, has a reciprocity agreement with two community colleges located in Michigan's Upper Peninsula. More information on tuition reciproci-ty programs can be found in the Legislative Fis-cal Bureau's informational paper entitled "Educa-tion and Income Tax Reciprocity Agreements." To indicate student attendance patterns, Table 4 shows the numbers of students attending part-time and full-time at each campus. The relatively high proportion of part-time students at the UW Colleges, Green Bay, and Oshkosh reflect the commuter nature of those campuses. Students of Color, Diversity Planning, and
International Students
Beginning in 1987, the Board of Regents has enacted a series of initiatives to increase diversity and improve educational quality and access for all UW students. Most recently, the Board of Re-gents adopted a framework known as "Inclusive
Table 4: Enrollment According to Attendance Status (Headcount) 2013 Fall Semester Full-Time Part-Time % Part-Time
Madison 38,081 4,822 11.2% Milwaukee 21,535 6,249 22.5 Eau Claire 9,583 1,324 12.1 Green Bay 4,372 2,295 34.4 La Crosse 9,529 973 9.3 Oshkosh 9,335 4,567 32.9 Parkside 3,365 1,252 27.1 Platteville 7,125 1,592 18.3 River Falls 5,337 834 13.5 Stevens Point 8,733 910 9.4 Stout 7,047 2,239 24.1 Superior 2,068 588 22.1 Whitewater 10,283 1,732 14.4 Colleges 8,015 6,043 43.0 Total 144,408 35,420 19.7%
11
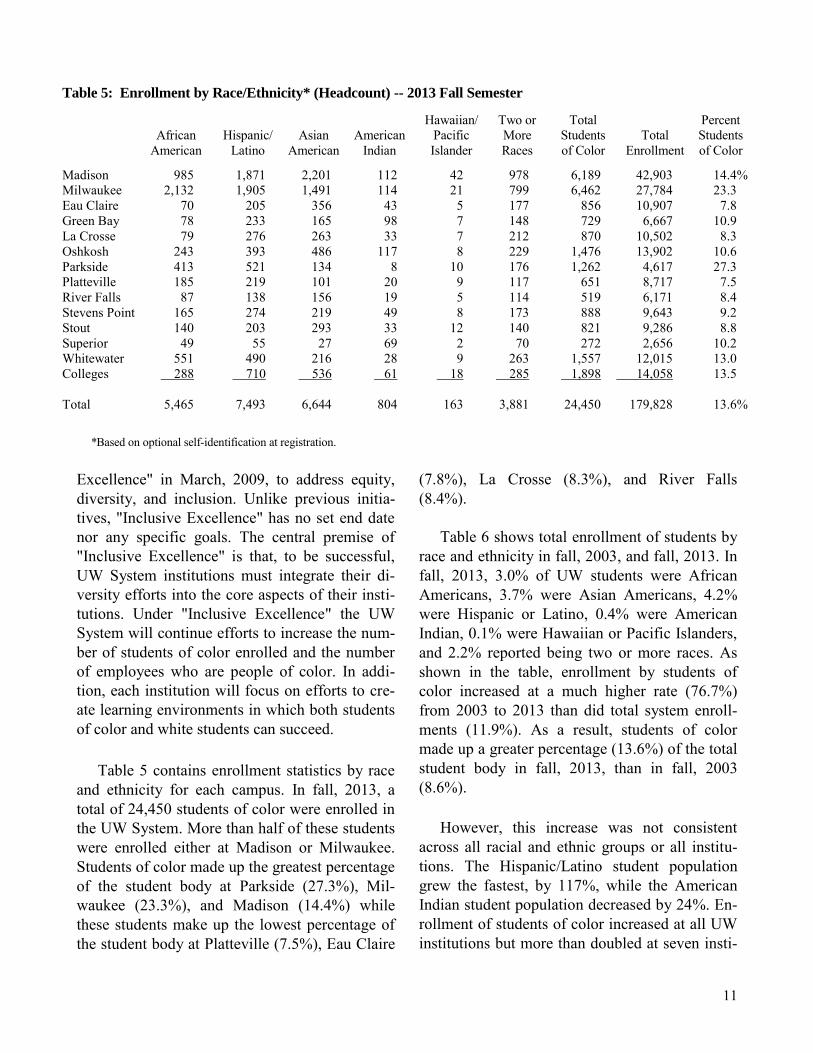
Excellence" in March, 2009, to address equity, diversity, and inclusion. Unlike previous initia-tives, "Inclusive Excellence" has no set end date nor any specific goals. The central premise of "Inclusive Excellence" is that, to be successful, UW System institutions must integrate their di-versity efforts into the core aspects of their insti-tutions. Under "Inclusive Excellence" the UW System will continue efforts to increase the num-ber of students of color enrolled and the number of employees who are people of color. In addi-tion, each institution will focus on efforts to cre-ate learning environments in which both students of color and white students can succeed. Table 5 contains enrollment statistics by race and ethnicity for each campus. In fall, 2013, a total of 24,450 students of color were enrolled in the UW System. More than half of these students were enrolled either at Madison or Milwaukee. Students of color made up the greatest percentage of the student body at Parkside (27.3%), Mil-waukee (23.3%), and Madison (14.4%) while these students make up the lowest percentage of the student body at Platteville (7.5%), Eau Claire
(7.8%), La Crosse (8.3%), and River Falls (8.4%).
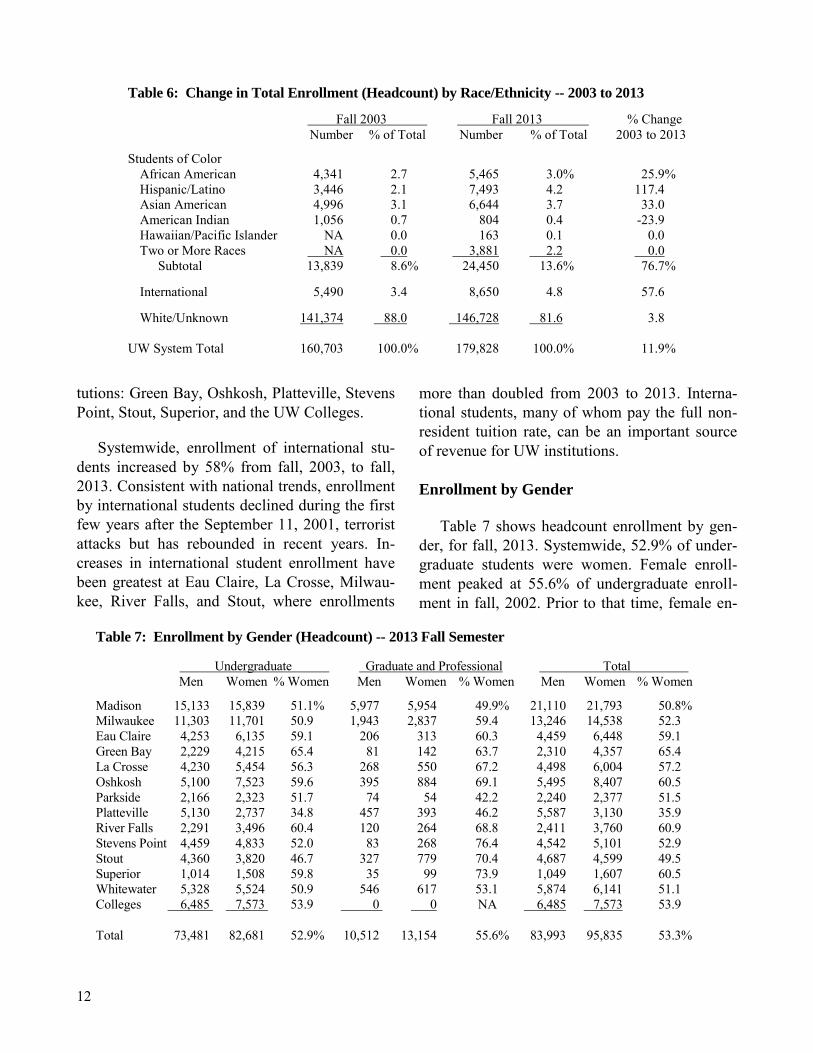
Table 6 shows total enrollment of students by race and ethnicity in fall, 2003, and fall, 2013. In fall, 2013, 3.0% of UW students were African Americans, 3.7% were Asian Americans, 4.2% were Hispanic or Latino, 0.4% were American Indian, 0.1% were Hawaiian or Pacific Islanders, and 2.2% reported being two or more races. As shown in the table, enrollment by students of color increased at a much higher rate (76.7%) from 2003 to 2013 than did total system enroll-ments (11.9%). As a result, students of color made up a greater percentage (13.6%) of the total student body in fall, 2013, than in fall, 2003 (8.6%). However, this increase was not consistent across all racial and ethnic groups or all institu-tions. The Hispanic/Latino student population grew the fastest, by 117%, while the American Indian student population decreased by 24%. En-rollment of students of color increased at all UW institutions but more than doubled at seven insti-
Table 5: Enrollment by Race/Ethnicity* (Headcount) -- 2013 Fall Semester
Hawaiian/ Two or Total Percent African Hispanic/ Asian American Pacific More Students Total Students American Latino American Indian Islander Races of Color Enrollment of Color
Madison 985 1,871 2,201 112 42 978 6,189 42,903 14.4% Milwaukee 2,132 1,905 1,491 114 21 799 6,462 27,784 23.3 Eau Claire 70 205 356 43 5 177 856 10,907 7.8 Green Bay 78 233 165 98 7 148 729 6,667 10.9 La Crosse 79 276 263 33 7 212 870 10,502 8.3 Oshkosh 243 393 486 117 8 229 1,476 13,902 10.6 Parkside 413 521 134 8 10 176 1,262 4,617 27.3 Platteville 185 219 101 20 9 117 651 8,717 7.5 River Falls 87 138 156 19 5 114 519 6,171 8.4 Stevens Point 165 274 219 49 8 173 888 9,643 9.2 Stout 140 203 293 33 12 140 821 9,286 8.8 Superior 49 55 27 69 2 70 272 2,656 10.2 Whitewater 551 490 216 28 9 263 1,557 12,015 13.0 Colleges 288 710 536 61 18 285 1,898 14,058 13.5 Total 5,465 7,493 6,644 804 163 3,881 24,450 179,828 13.6%
*Based on optional self-identification at registration.
12
tutions: Green Bay, Oshkosh, Platteville, Stevens Point, Stout, Superior, and the UW Colleges.
Systemwide, enrollment of international stu-dents increased by 58% from fall, 2003, to fall, 2013. Consistent with national trends, enrollment by international students declined during the first few years after the September 11, 2001, terrorist attacks but has rebounded in recent years. In-creases in international student enrollment have been greatest at Eau Claire, La Crosse, Milwau-kee, River Falls, and Stout, where enrollments
more than doubled from 2003 to 2013. Interna-tional students, many of whom pay the full non-resident tuition rate, can be an important source of revenue for UW institutions.
Enrollment by Gender
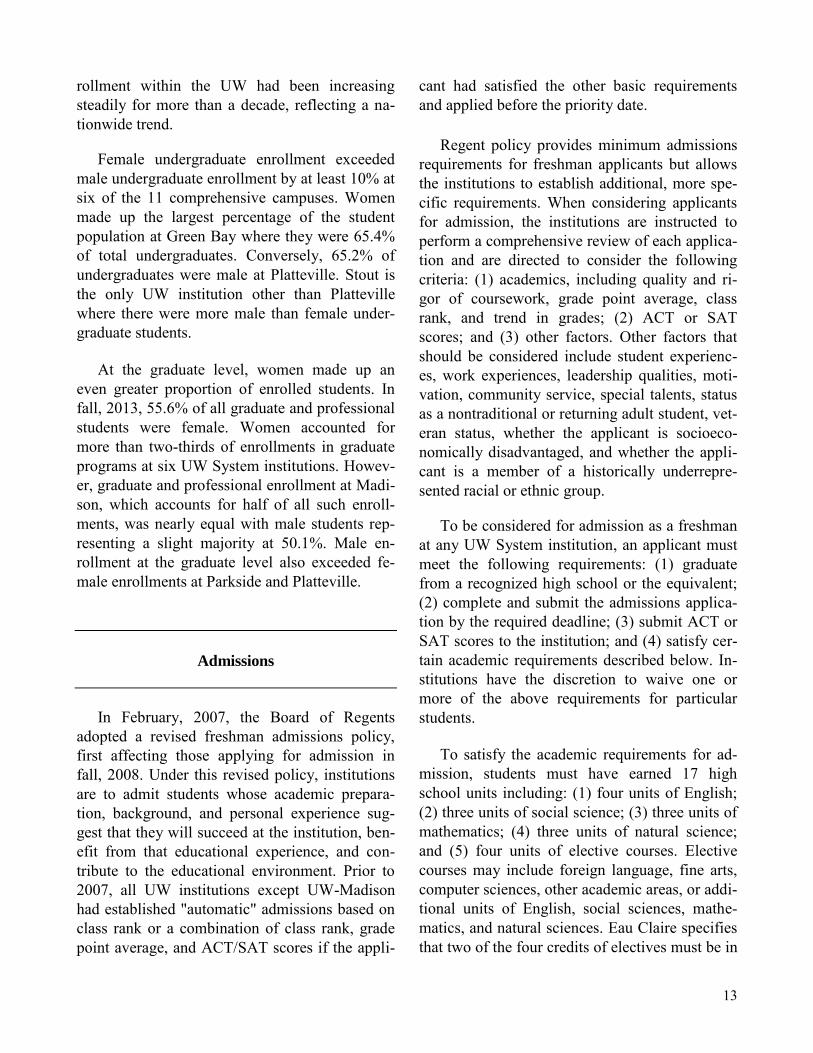
Table 7 shows headcount enrollment by gen-der, for fall, 2013. Systemwide, 52.9% of under-graduate students were women. Female enroll-ment peaked at 55.6% of undergraduate enroll-ment in fall, 2002. Prior to that time, female en-
Table 6: Change in Total Enrollment (Headcount) by Race/Ethnicity -- 2003 to 2013 Fall 2003 Fall 2013 % Change Number % of Total Number % of Total 2003 to 2013
Students of Color African American 4,341 2.7 5,465 3.0% 25.9% Hispanic/Latino 3,446 2.1 7,493 4.2 117.4 Asian American 4,996 3.1 6,644 3.7 33.0 American Indian 1,056 0.7 804 0.4 -23.9 Hawaiian/Pacific Islander NA 0.0 163 0.1 0.0 Two or More Races NA 0.0 3,881 2.2 0.0 Subtotal 13,839 8.6% 24,450 13.6% 76.7% International 5,490 3.4 8,650 4.8 57.6 White/Unknown 141,374 88.0 146,728 81.6 3.8 UW System Total 160,703 100.0% 179,828 100.0% 11.9%
Table 7: Enrollment by Gender (Headcount) -- 2013 Fall Semester Undergraduate Graduate and Professional Total Men Women % Women Men Women % Women Men Women % Women
Madison 15,133 15,839 51.1% 5,977 5,954 49.9% 21,110 21,793 50.8% Milwaukee 11,303 11,701 50.9 1,943 2,837 59.4 13,246 14,538 52.3 Eau Claire 4,253 6,135 59.1 206 313 60.3 4,459 6,448 59.1 Green Bay 2,229 4,215 65.4 81 142 63.7 2,310 4,357 65.4 La Crosse 4,230 5,454 56.3 268 550 67.2 4,498 6,004 57.2 Oshkosh 5,100 7,523 59.6 395 884 69.1 5,495 8,407 60.5 Parkside 2,166 2,323 51.7 74 54 42.2 2,240 2,377 51.5 Platteville 5,130 2,737 34.8 457 393 46.2 5,587 3,130 35.9 River Falls 2,291 3,496 60.4 120 264 68.8 2,411 3,760 60.9 Stevens Point 4,459 4,833 52.0 83 268 76.4 4,542 5,101 52.9 Stout 4,360 3,820 46.7 327 779 70.4 4,687 4,599 49.5 Superior 1,014 1,508 59.8 35 99 73.9 1,049 1,607 60.5 Whitewater 5,328 5,524 50.9 546 617 53.1 5,874 6,141 51.1 Colleges 6,485 7,573 53.9 0 0 NA 6,485 7,573 53.9 Total 73,481 82,681 52.9% 10,512 13,154 55.6% 83,993 95,835 53.3%
13
rollment within the UW had been increasing steadily for more than a decade, reflecting a na-tionwide trend.
Female undergraduate enrollment exceeded male undergraduate enrollment by at least 10% at six of the 11 comprehensive campuses. Women made up the largest percentage of the student population at Green Bay where they were 65.4% of total undergraduates. Conversely, 65.2% of undergraduates were male at Platteville. Stout is the only UW institution other than Platteville where there were more male than female under-graduate students. At the graduate level, women made up an even greater proportion of enrolled students. In fall, 2013, 55.6% of all graduate and professional students were female. Women accounted for more than two-thirds of enrollments in graduate programs at six UW System institutions. Howev-er, graduate and professional enrollment at Madi-son, which accounts for half of all such enroll-ments, was nearly equal with male students rep-resenting a slight majority at 50.1%. Male en-rollment at the graduate level also exceeded fe-male enrollments at Parkside and Platteville.
Admissions
In February, 2007, the Board of Regents adopted a revised freshman admissions policy, first affecting those applying for admission in fall, 2008. Under this revised policy, institutions are to admit students whose academic prepara-tion, background, and personal experience sug-gest that they will succeed at the institution, ben-efit from that educational experience, and con-tribute to the educational environment. Prior to 2007, all UW institutions except UW-Madison had established "automatic" admissions based on class rank or a combination of class rank, grade point average, and ACT/SAT scores if the appli-
cant had satisfied the other basic requirements and applied before the priority date. Regent policy provides minimum admissions requirements for freshman applicants but allows the institutions to establish additional, more spe-cific requirements. When considering applicants for admission, the institutions are instructed to perform a comprehensive review of each applica-tion and are directed to consider the following criteria: (1) academics, including quality and ri-gor of coursework, grade point average, class rank, and trend in grades; (2) ACT or SAT scores; and (3) other factors. Other factors that should be considered include student experienc-es, work experiences, leadership qualities, moti-vation, community service, special talents, status as a nontraditional or returning adult student, vet-eran status, whether the applicant is socioeco-nomically disadvantaged, and whether the appli-cant is a member of a historically underrepre-sented racial or ethnic group.
To be considered for admission as a freshman at any UW System institution, an applicant must meet the following requirements: (1) graduate from a recognized high school or the equivalent; (2) complete and submit the admissions applica-tion by the required deadline; (3) submit ACT or SAT scores to the institution; and (4) satisfy cer-tain academic requirements described below. In-stitutions have the discretion to waive one or more of the above requirements for particular students. To satisfy the academic requirements for ad-mission, students must have earned 17 high school units including: (1) four units of English; (2) three units of social science; (3) three units of mathematics; (4) three units of natural science; and (5) four units of elective courses. Elective courses may include foreign language, fine arts, computer sciences, other academic areas, or addi-tional units of English, social sciences, mathe-matics, and natural sciences. Eau Claire specifies that two of the four credits of electives must be in
14
a single foreign language. Regent policy allows students who have at-tended high schools that do not use the traditional unit structure to submit a competency-based pro-file in lieu of a traditional transcript. To be con-sidered for admission, the applicant's profile must indicate evidence of preparation at a level com-parable to that of the traditional academic unit requirements. In addition, students who have not or will not graduate from a recognized high school must provide evidence that the require-ments for a high school equivalency certificate or diploma have been satisfied by either the GED examination, the Wisconsin High School Equiva-lency Program, or other established criteria. In the fall, 2013, the systemwide admission rate for new freshman was 94.0% for Wisconsin residents, 79.4% for Minnesota reciprocity stu-dents, and 62.9% for other nonresidents. The av-erage ACT score for new freshmen enrolling in fall, 2013, was 23.6, compared to 23.1 for new freshmen enrolling in fall, 2003. In 2012, the most recent year for which data is available, 31.5% of Wisconsin students who graduated from high school in the spring enrolled in a UW institution the following fall. This service rate is down slightly from 33.1% in 2007. Transfer Students and Agreements
Transfer students represent a significant por-tion of new enrollments at UW institutions. Dur-ing the 2012-13 academic year, 9,396 undergrad-uates entered the UW System as new transfer students. Of these students, 45.8% transferred from institutions in other states and U.S. territo-ries, 39.4% transferred from Wisconsin technical colleges, 10.5% transferred from private colleges within Wisconsin, and the remaining 4.2% trans-ferred from institutions in foreign countries. In addition to the above transfer students, 5,824 stu-dents transferred from one UW institution to an-other. This number includes 2,557 students who transferred from the UW Colleges to UW four-
year institutions. For students transferring into or within the UW System, the statewide admission rate was 85.9%. In recent years, the Board of Regents have adopted policies to facilitate student transfers from Wisconsin technical colleges institutions to the UW System. Under current Regent policy, which was most recently modified in 2011, stu-dents may generally transfer up to 72 credits from a non-baccalaureate institution, including a Wisconsin technical college, to a four-year UW institution. Students who have completed an As-sociate of Arts or an Associate of Science degree through a WTCS liberal arts collegiate transfer program that is specifically aligned with associ-ate degrees awarded by UW institutions are con-sidered to have satisfied the general education requirements of the receiving UW institution. There are currently liberal arts collegiate transfer programs at five technical colleges: Chippewa Valley, Madison, Milwaukee, Nicolet, and West-ern. In addition, the Board of Regents and the WTCS Board entered into an agreement in June, 2014, which allows students to transfer no fewer than 30 general education credits earned at any institution within the two systems to any other institution within the two systems. The agree-ment, which was required by 2013 Act 20, will be in effect from July 1, 2014, to June 30, 2015, and will be renewed annually. The agreement identifies 11 WTCS courses totaling 38 credits that can be transferred to any UW institution and would satisfy general education or general degree requirements at the receiving institution. The agreement similarly identifies between 9 and 11 courses at each UW institution, totaling between 31 and 40 credits, that can be transferred to any other UW institution or Wisconsin technical col-lege. Transfers by technical college students to UW institutions increased significantly through 2010-11 but have declined slightly since that year.
15
From 2000-01 to 2010-11, the number of new transfers from WTCS institutions increased by 67%, from 2,290 to 3,816. From 2010-11 to 2012-13, the most recent year for which data is available, these transfers declined by 3%.
Campus Characteristics
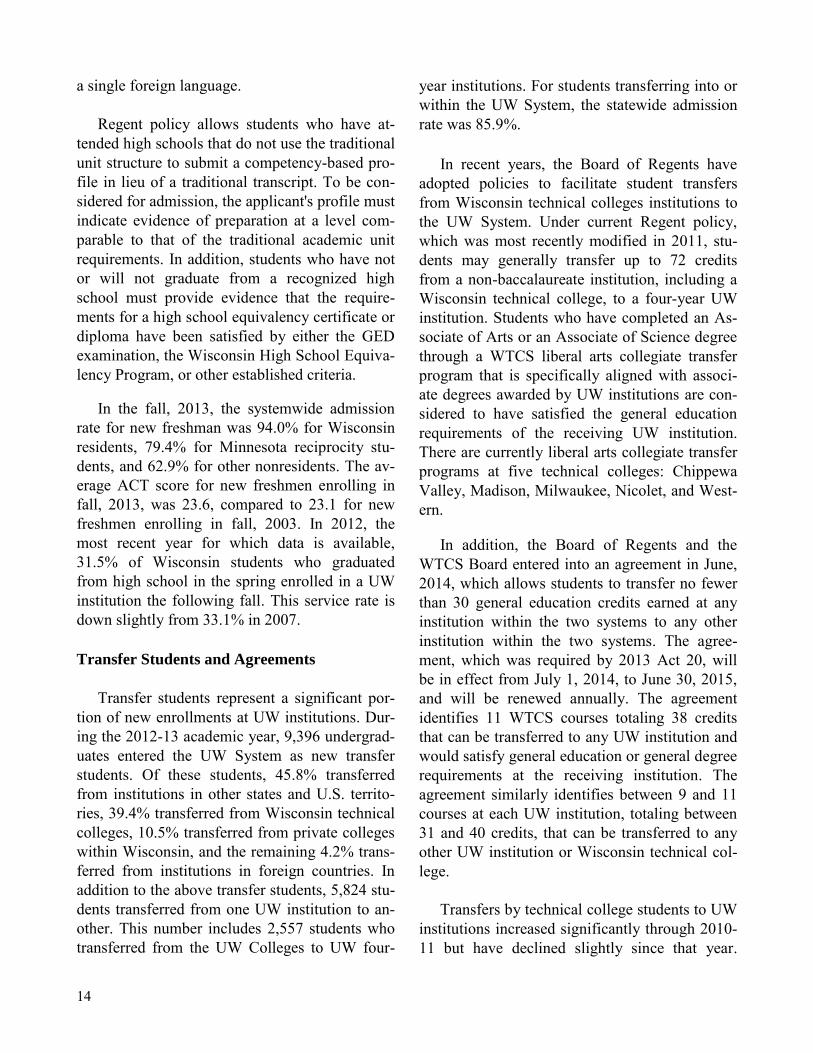
Table 8 contains various statistics illustrating the unique nature of each of the four-year institu-tions. Madison, the UW System's "flagship" re-search university, has the lowest admission rate of any UW institution and its freshmen class en-ters with the highest average test scores. Of the comprehensive institutions, Eau Claire and La Crosse are the most selective with both relatively low admissions rates and relatively high average ACT scores. Similar to Madison, students at these institutions are more likely to attend full-time and be younger than 25 years old. By con-trast, Green Bay, Parkside, and the UW Colleges have older student bodies and more part-time students. These statistics reflect the larger non-traditional populations of those campuses. Madison, Milwaukee, and Oshkosh, the three largest of the four-year institutions, have the largest class sizes for undergraduate students. At Madison, 17% of lower division courses have 100 or more students compared to 10% at Mil-waukee and 8% at Oshkosh. By contrast, courses offered by the UW Colleges, Parkside, Stout, and Superior are more likely to be smaller. At the UW Colleges and Superior, 81% of lower-division courses have 30 or fewer students. Supe-rior offers the highest percentage of upper-division courses with 30 or fewer students with 90% of upper-division courses falling into that category. At Stout, 81% of upper-division cours-es have fewer than 30 students and 80% of such courses are of that size at Parkside. Of UW institutions, Stevens Point has the
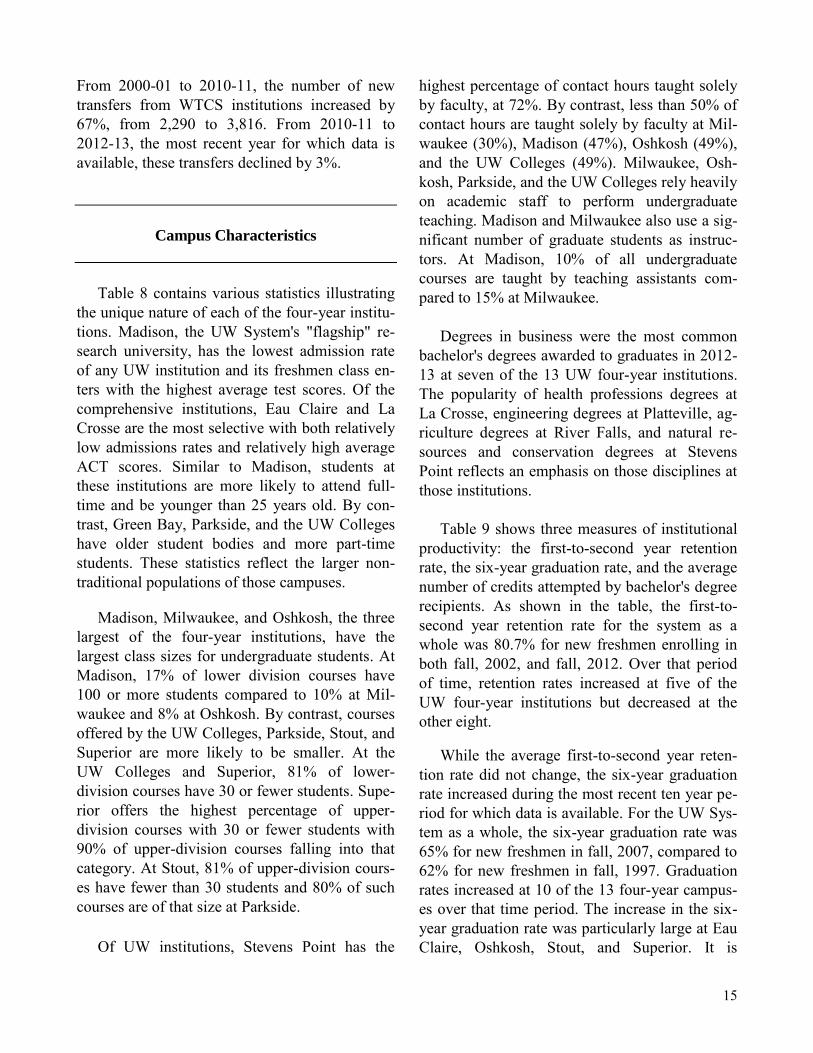
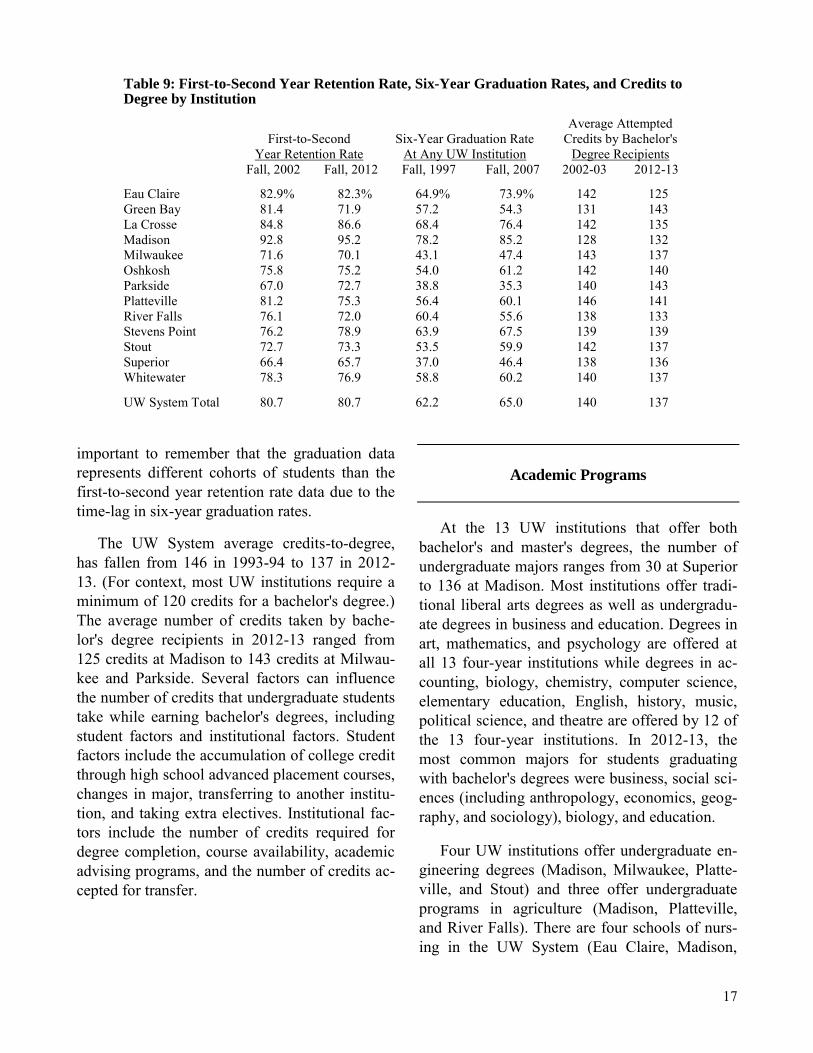
highest percentage of contact hours taught solely by faculty, at 72%. By contrast, less than 50% of contact hours are taught solely by faculty at Mil-waukee (30%), Madison (47%), Oshkosh (49%), and the UW Colleges (49%). Milwaukee, Osh-kosh, Parkside, and the UW Colleges rely heavily on academic staff to perform undergraduate teaching. Madison and Milwaukee also use a sig-nificant number of graduate students as instruc-tors. At Madison, 10% of all undergraduate courses are taught by teaching assistants com-pared to 15% at Milwaukee. Degrees in business were the most common bachelor's degrees awarded to graduates in 2012-13 at seven of the 13 UW four-year institutions. The popularity of health professions degrees at La Crosse, engineering degrees at Platteville, ag-riculture degrees at River Falls, and natural re-sources and conservation degrees at Stevens Point reflects an emphasis on those disciplines at those institutions. Table 9 shows three measures of institutional productivity: the first-to-second year retention rate, the six-year graduation rate, and the average number of credits attempted by bachelor's degree recipients. As shown in the table, the first-to-second year retention rate for the system as a whole was 80.7% for new freshmen enrolling in both fall, 2002, and fall, 2012. Over that period of time, retention rates increased at five of the UW four-year institutions but decreased at the other eight. While the average first-to-second year reten-tion rate did not change, the six-year graduation rate increased during the most recent ten year pe-riod for which data is available. For the UW Sys-tem as a whole, the six-year graduation rate was 65% for new freshmen in fall, 2007, compared to 62% for new freshmen in fall, 1997. Graduation rates increased at 10 of the 13 four-year campus-es over that time period. The increase in the six-year graduation rate was particularly large at Eau Claire, Oshkosh, Stout, and Superior. It is
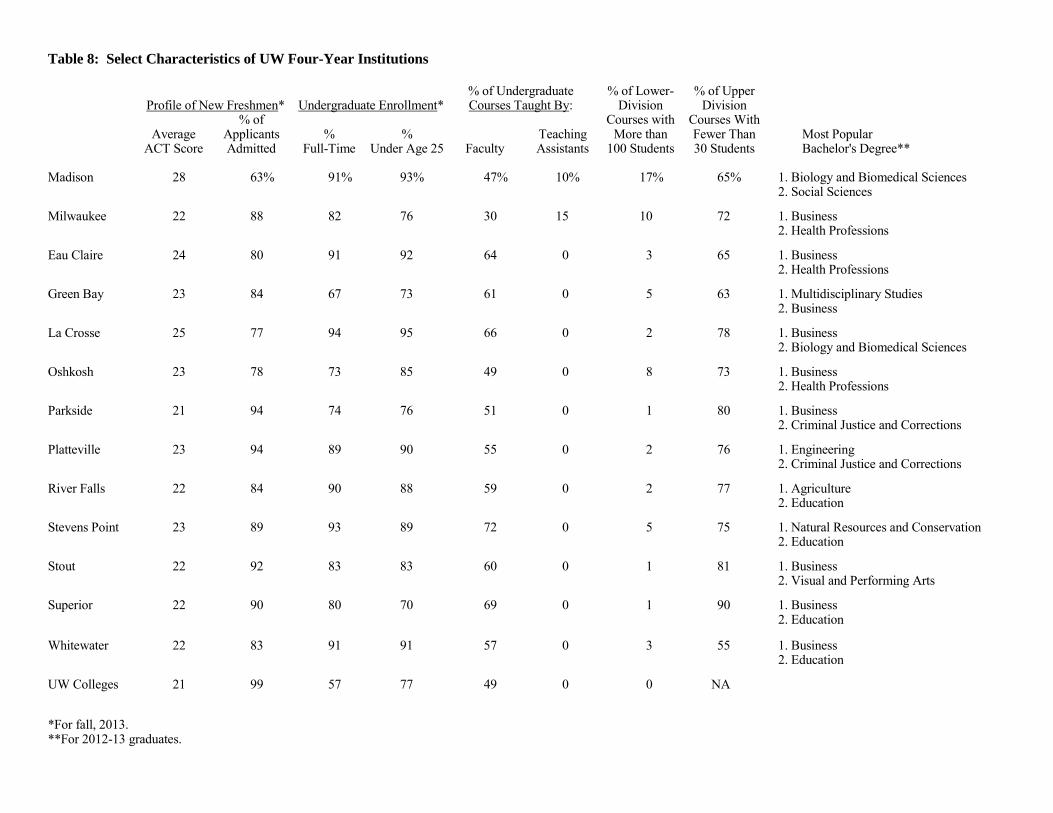
Table 8: Select Characteristics of UW Four-Year Institutions
% of Undergraduate % of Lower- % of Upper Profile of New Freshmen* Undergraduate Enrollment* Courses Taught By: Division Division % of Courses with Courses With Average Applicants % % Teaching More than Fewer Than Most Popular ACT Score Admitted Full-Time Under Age 25 Faculty Assistants 100 Students 30 Students Bachelor's Degree** Madison 28 63% 91% 93% 47% 10% 17% 65% 1. Biology and Biomedical Sciences 2. Social Sciences Milwaukee 22 88 82 76 30 15 10 72 1. Business 2. Health Professions Eau Claire 24 80 91 92 64 0 3 65 1. Business 2. Health Professions Green Bay 23 84 67 73 61 0 5 63 1. Multidisciplinary Studies 2. Business La Crosse 25 77 94 95 66 0 2 78 1. Business 2. Biology and Biomedical Sciences Oshkosh 23 78 73 85 49 0 8 73 1. Business 2. Health Professions Parkside 21 94 74 76 51 0 1 80 1. Business 2. Criminal Justice and Corrections Platteville 23 94 89 90 55 0 2 76 1. Engineering 2. Criminal Justice and Corrections River Falls 22 84 90 88 59 0 2 77 1. Agriculture 2. Education Stevens Point 23 89 93 89 72 0 5 75 1. Natural Resources and Conservation 2. Education Stout 22 92 83 83 60 0 1 81 1. Business 2. Visual and Performing Arts Superior 22 90 80 70 69 0 1 90 1. Business 2. Education Whitewater 22 83 91 91 57 0 3 55 1. Business 2. Education UW Colleges 21 99 57 77 49 0 0 NA *For fall, 2013. **For 2012-13 graduates.
17
important to remember that the graduation data represents different cohorts of students than the first-to-second year retention rate data due to the time-lag in six-year graduation rates. The UW System average credits-to-degree, has fallen from 146 in 1993-94 to 137 in 2012-13. (For context, most UW institutions require a minimum of 120 credits for a bachelor's degree.) The average number of credits taken by bache-lor's degree recipients in 2012-13 ranged from 125 credits at Madison to 143 credits at Milwau-kee and Parkside. Several factors can influence the number of credits that undergraduate students take while earning bachelor's degrees, including student factors and institutional factors. Student factors include the accumulation of college credit through high school advanced placement courses, changes in major, transferring to another institu-tion, and taking extra electives. Institutional fac-tors include the number of credits required for degree completion, course availability, academic advising programs, and the number of credits ac-cepted for transfer.
Academic Programs
At the 13 UW institutions that offer both bachelor's and master's degrees, the number of undergraduate majors ranges from 30 at Superior to 136 at Madison. Most institutions offer tradi-tional liberal arts degrees as well as undergradu-ate degrees in business and education. Degrees in art, mathematics, and psychology are offered at all 13 four-year institutions while degrees in ac-counting, biology, chemistry, computer science, elementary education, English, history, music, political science, and theatre are offered by 12 of the 13 four-year institutions. In 2012-13, the most common majors for students graduating with bachelor's degrees were business, social sci-ences (including anthropology, economics, geog-raphy, and sociology), biology, and education. Four UW institutions offer undergraduate en-gineering degrees (Madison, Milwaukee, Platte-ville, and Stout) and three offer undergraduate programs in agriculture (Madison, Platteville, and River Falls). There are four schools of nurs-ing in the UW System (Eau Claire, Madison,
Table 9: First-to-Second Year Retention Rate, Six-Year Graduation Rates, and Credits to Degree by Institution
Average Attempted First-to-Second Six-Year Graduation Rate Credits by Bachelor's Year Retention Rate At Any UW Institution Degree Recipients Fall, 2002 Fall, 2012 Fall, 1997 Fall, 2007 2002-03 2012-13
Eau Claire 82.9% 82.3% 64.9% 73.9% 142 125 Green Bay 81.4 71.9 57.2 54.3 131 143 La Crosse 84.8 86.6 68.4 76.4 142 135 Madison 92.8 95.2 78.2 85.2 128 132 Milwaukee 71.6 70.1 43.1 47.4 143 137 Oshkosh 75.8 75.2 54.0 61.2 142 140 Parkside 67.0 72.7 38.8 35.3 140 143 Platteville 81.2 75.3 56.4 60.1 146 141 River Falls 76.1 72.0 60.4 55.6 138 133 Stevens Point 76.2 78.9 63.9 67.5 139 139 Stout 72.7 73.3 53.5 59.9 142 137 Superior 66.4 65.7 37.0 46.4 138 136 Whitewater 78.3 76.9 58.8 60.2 140 137
UW System Total 80.7 80.7 62.2 65.0 140 137
18
Milwaukee, and Oshkosh) and one school of ar-chitecture at Milwaukee. The number of master's degree programs of-fered by the comprehensive institutions ranges from four at Parkside to 21 at Stout. Milwaukee offers 53 master's programs while Madison offers 148. The most common master's degree programs are in business, education, and the health profes-sions. Master's of business administration (MBA) degrees are offered at Madison, Milwaukee, Eau Claire, La Crosse, Oshkosh, Parkside, River Falls, and Whitewater. Madison and Milwaukee are the only UW in-stitutions that offer doctoral (Ph.D.) programs. Madison offers 104 Ph.D. programs while Mil-waukee offers 31. However, five of the compre-hensive institutions currently offer professional doctorates. Eau Claire and Oshkosh offer a pro-fessional doctorate in nursing practice, La Crosse offers a doctor of physical therapy degree, Whitewater offers a doctorate in business admin-istration, and Stevens Point offers a doctorate in education in career and technical education and a doctor of audiology degree in collaboration with Madison. The professional schools of law, medi-cine, veterinary medicine, and pharmacy are all located on the Madison campus. Collaborative Degree Programs
The UW System offers additional educational opportunities through collaborations between in-stitutions both within and outside of the UW Sys-tem. Collaborative degree programs are formal arrangements among institutions to provide ac-cess to a degree program at multiple locations, to provide courses offered by different institutions as part of a single program, or both. Since 1998, the number of collaborative degree programs has increased significantly from only three such pro-grams in that year to 82 programs in 2013-14. All UW System institutions, including each UW Colleges campus, participate in at least one
collaborative degree program. Of the 82 collabo-rative programs in place in 2013-14, 20 involved two or more UW four-year institutions, 26 in-volved a four-year institution and one or more UW Colleges campuses, 13 involved one or more four-year institutions and one or more Wisconsin technical college, and 23 involved one or more UW four-year institution and a private college located in this state or a college or university lo-cated in another state or country.
Online and Distance Learning Programs
All UW institutions offer distance learning programs, the majority of which are now offered online. These programs have been aggregated by the UW System at its "e-campus" site. Currently, 47 certificate programs, two associate degree programs, 36 bachelor's degree programs, 44 master's degrees programs, and two doctorate degree programs are accessible via the UW Sys-tem "e-campus." In addition, a small number of courses are offered through video or audiconfer-encing or in print or multimedia formats. Some distance courses are "blended" meaning that they include some number of on-campus, in-person sessions. In 2012-13, a total of 5,442 distance education courses were offered and total enroll-ment in these courses exceeded 128,000. Dis-tance education course offerings and enrollments have more than quadrupled since 2003-04. Beginning in January, 2014, students have been able to enroll in self-paced, competency-based programs offered through the UW Flexible Option platform. Designed for working adults, these programs are offered entirely online and do not use the traditional semester-based calendar. Instead, students enroll in three-month "subscrip-tion periods" which begin on the second day of each month. Students make progress towards a degree by completing assessments to demonstrate that they have mastered a competency. There are currently four degree programs and three certificates offered through the Flexible Op-
19
tion. These programs include an associate's de-gree of arts and sciences; bachelor's degrees in nursing, biomedical sciences diagnostic imaging, and information science and technology; and cer-tificates in business and technical communica-tions, global skills, and sales. The associate's de-gree is offered by the UW Colleges, the bache-lor's degrees and the certificate in business and technical communications are offered by UW-Milwaukee, and the remaining two certificates are offered by UW-Parkside. The degrees in nursing and biomedical sciences diagnostic imag-ing are only open to individuals who have al-ready completed associate's degrees in those fields. Through September, 2014, a total of 214 students had enrolled in UW Flexible Option programs.
Budget
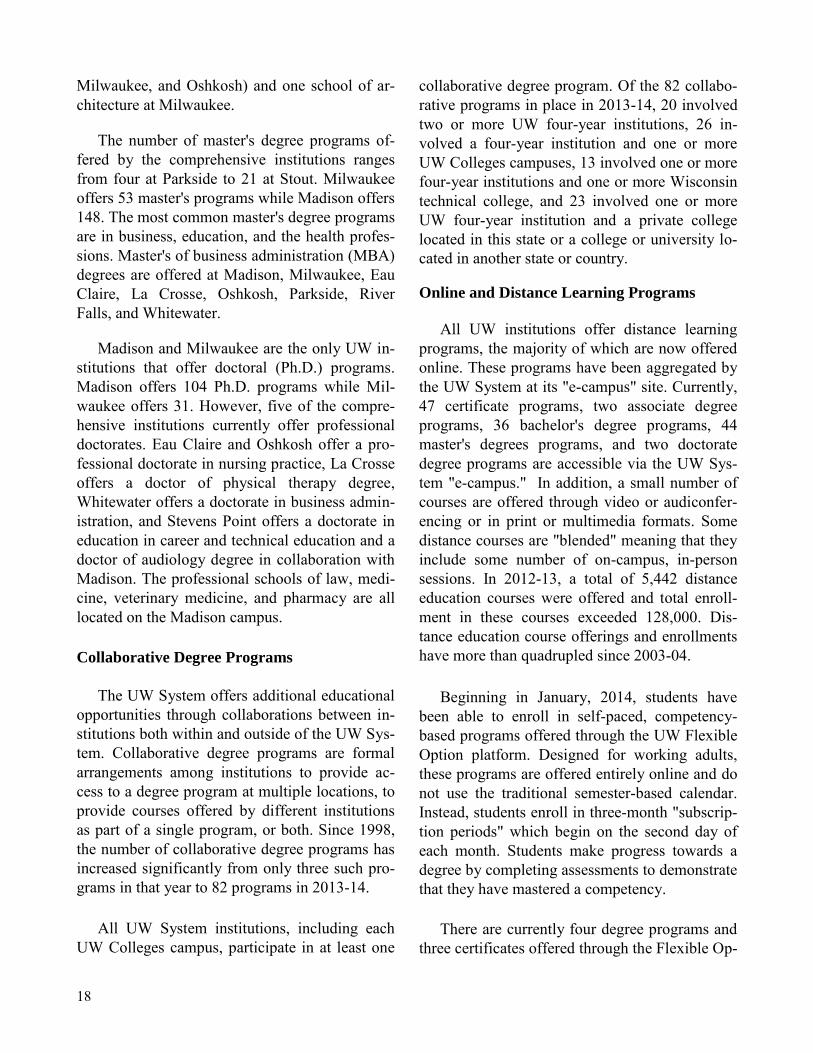
The University's 2014-15 budget totals $6,097.9 million of which $1,178.2 million, or 19.3%, is funded from state general purpose rev-enue (GPR). The University's operating budget is shown by fund source in Table 10. Not all of the funding listed in the table is available for discre-tionary use by the Regents to support university programs. Significant amounts are dedicated to specific purposes such as: (1) federal grants, con-
tracts, and appropriations, including funding for research and student financial aid other than di-rect student loans ($870.7 million); (2) federal direct student loans ($794.2 million); (3) auxilia-ry operations for activities such as dormitories, athletics, and student centers ($848.2 million); (4) gifts and trust income ($572.8 million); and (5) state-funded debt service payments ($245.1 million). Indirect cost reimbursements are federal monies for indirect costs related to grants and contracts. Operational receipts are fees for ser-vices for other operations such as non-credit out-reach programs.
The University combines its GPR-general program operations allocation with money re-ceived from tuition and a portion of federal indi-rect cost reimbursements to create a pool of funds that it uses to fund its general program opera-tions. This pool is known as the "GPR/fees pool." The GPR/fees pool excludes tuition generated by differential tuition, self-supporting programs, and increases in enrollment and GPR provided for debt service. In 2014-15, the University had a general program operations budget of $2.2 bil-lion.
2011 Act 32 consolidated many of the UW System's GPR, program revenue (PR), and feder-al appropriations. Prior to Act 32, the UW Sys-tem had 28 GPR appropriations, 39 PR appropri-ations, and four federal appropriations; under current law, the UW System has three GPR ap-propriations, one for general program operations, one for System Administration and one for debt service; five PR appropriations; and one federal appropriation. Separate GPR, PR, and federal appropriations were maintained for the State La-boratory of Hygiene and the Veterinary Diagnos-tic Laboratory, both of which are attached to UW-Madison. In addition, there are 13 segregat-ed revenue appropriations for the UW System. Unlike other state agencies, Act 32 authorized the UW System to retain any interest earnings asso-ciated with balances in its PR appropriations. Typically, these earnings would accrue to the
Table 10: UW System Operating Budget -- 2014-15 Fiscal Year Source of Funds Amount Percent
State GPR $1,178,197,283 19.3% Tuition 1,348,961,629 22.1 Federal 1,664,977,207 27.3 Auxiliary Operations 848,179,027 13.9 Gifts and Trust Income 572,847,745 9.4 Operational Receipts 299,560,054 4.9 Indirect Cost Reimbursement 149,147,917 2.4 Services Provided to Hospital Authority 36,000,000 0.6 Total $6,097,870,862 100.0%
20
benefit of the general fund.
Other than federal funds provided for finan-cial aid, most federal grants and contracts result from specific project proposals at individual in-stitutions. Gifts are usually provided to specific institutions, as opposed to the system as a whole, and may be provided for a specific purpose. Due to the manner in which these funds are generated, Madison accounts for the largest share of these funds, including 83% of federal special projects grants and contracts expenditures and 94% of gift expenditures in 2013-14.
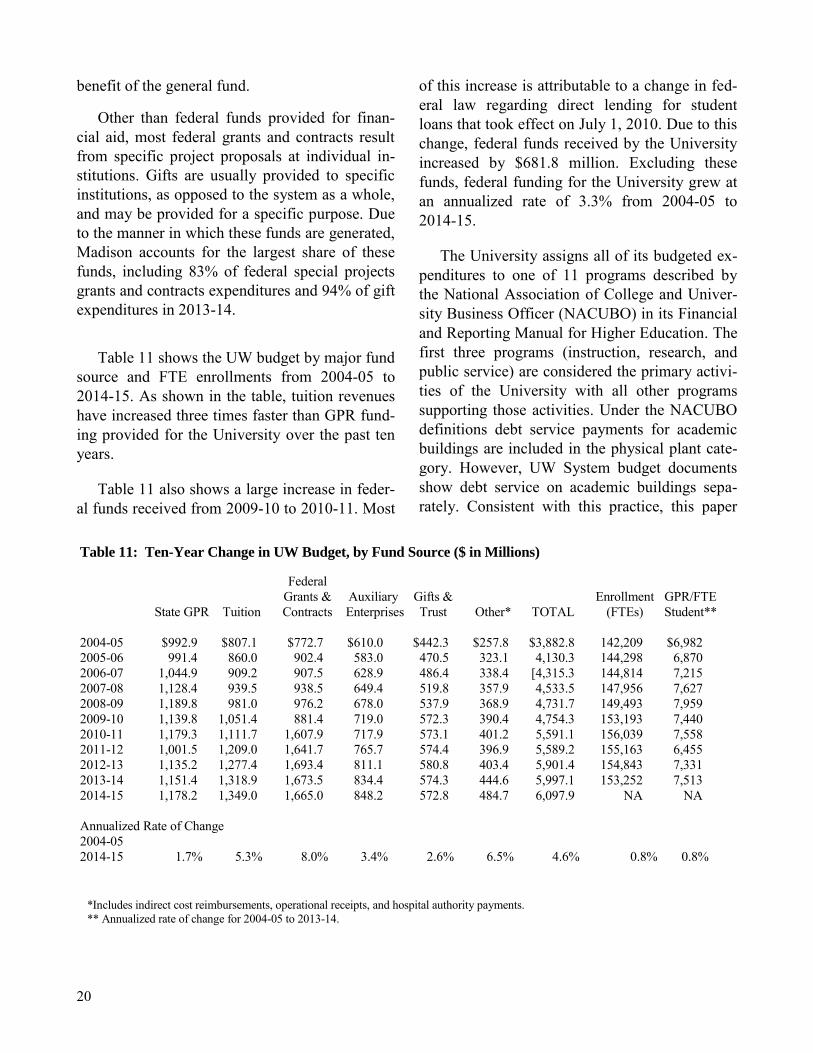
Table 11 shows the UW budget by major fund source and FTE enrollments from 2004-05 to 2014-15. As shown in the table, tuition revenues have increased three times faster than GPR fund-ing provided for the University over the past ten years.
Table 11 also shows a large increase in feder-al funds received from 2009-10 to 2010-11. Most
of this increase is attributable to a change in fed-eral law regarding direct lending for student loans that took effect on July 1, 2010. Due to this change, federal funds received by the University increased by $681.8 million. Excluding these funds, federal funding for the University grew at an annualized rate of 3.3% from 2004-05 to 2014-15.
The University assigns all of its budgeted ex-penditures to one of 11 programs described by the National Association of College and Univer-sity Business Officer (NACUBO) in its Financial and Reporting Manual for Higher Education. The first three programs (instruction, research, and public service) are considered the primary activi-ties of the University with all other programs supporting those activities. Under the NACUBO definitions debt service payments for academic buildings are included in the physical plant cate-gory. However, UW System budget documents show debt service on academic buildings sepa-rately. Consistent with this practice, this paper
Table 11: Ten-Year Change in UW Budget, by Fund Source ($ in Millions)
Federal Grants & Auxiliary Gifts & Enrollment GPR/FTE State GPR Tuition Contracts Enterprises Trust Other* TOTAL (FTEs) Student**
2004-05 $992.9 $807.1 $772.7 $610.0 $442.3 $257.8 $3,882.8 142,209 $6,982 2005-06 991.4 860.0 902.4 583.0 470.5 323.1 4,130.3 144,298 6,870 2006-07 1,044.9 909.2 907.5 628.9 486.4 338.4 [4,315.3 144,814 7,215 2007-08 1,128.4 939.5 938.5 649.4 519.8 357.9 4,533.5 147,956 7,627 2008-09 1,189.8 981.0 976.2 678.0 537.9 368.9 4,731.7 149,493 7,959 2009-10 1,139.8 1,051.4 881.4 719.0 572.3 390.4 4,754.3 153,193 7,440 2010-11 1,179.3 1,111.7 1,607.9 717.9 573.1 401.2 5,591.1 156,039 7,558 2011-12 1,001.5 1,209.0 1,641.7 765.7 574.4 396.9 5,589.2 155,163 6,455 2012-13 1,135.2 1,277.4 1,693.4 811.1 580.8 403.4 5,901.4 154,843 7,331 2013-14 1,151.4 1,318.9 1,673.5 834.4 574.3 444.6 5,997.1 153,252 7,513 2014-15 1,178.2 1,349.0 1,665.0 848.2 572.8 484.7 6,097.9 NA NA Annualized Rate of Change 2004-05 2014-15 1.7% 5.3% 8.0% 3.4% 2.6% 6.5% 4.6% 0.8% 0.8% *Includes indirect cost reimbursements, operational receipts, and hospital authority payments. ** Annualized rate of change for 2004-05 to 2013-14.
21
shows debt service on academic buildings sepa-rately from physical plant. 1. Instruction (22.1% of the total budget for 2014-15). All activities through which a stu-dent may earn credit toward a degree or certifi-cate granted by the University. Expenditures for remedial instruction are also included even though these courses may not carry degree credit. This program also includes costs for curriculum planning and development, departmental research and public service not separately budgeted; course catalogs, bulletins, and timetables; com-puting costs charged back to users; library, media services, and special course fees; departmental computer labs; credit-bearing internships and co-op programs; recruitment and retention of in-structional faculty; and the administration of study abroad programs. Instruction excludes: (a) all non-credit instruction other than remedial in-struction; (b) separately budgeted academic ad-vising; (c) separately budgeted course and curric-ulum development; (d) professional development for faculty members and sabbaticals; and (e) campus, college, or school-wide computer labs. 2. Research (17.5%). All research activities conducted under the terms of a research contract, a project funded by external agencies, or a pro-ject funded by an institution's operating budget. Included are expenditures for individual and pro-ject research, as well as those of research insti-tutes and centers. Also includes grants admin-istration costs including proposal development and accounting services. Research excludes de-partmental research that is not separately budget-ed.
3. Public Service (4.6%). Activities that primarily benefit individuals or groups external to the institution and all non-credit instruction other than remedial instruction. This program includes community service programs, confer-ences, institutes, general advisory services, refer-ence bureaus, radio and television, and consulting services. Radio and television broadcasts that
primarily support instruction or are operated as a student service program are excluded.
4. Academic Support (7.2%). Activities that primarily support the institution's instruc-tional, research, and public service missions. These activities include: (a) the retention, preser-vation, and display of educational materials, gen-erally in libraries or museums; (b) the provision of services that directly assist the academic func-tions of the institution, such as demonstration schools; (c) media, such as audiovisual services, and technology, such as computing support; (d) academic administration and personnel develop-ment; and (e) separately budgeted support for course and curriculum development.
5. Hospitals (0.6%). This program was re-moved from the UW budget in 1996-97 due to the transfer of the UW Hospital and Clinics to a separate hospital authority. The moneys remain-ing in the budget represent expenditures by UW-Madison that are reimbursed by the University of Wisconsin Hospital and Clinics Authority.
6. Farm Operations (0.2%). All activities that provide laboratory farm support including field stations.
7. Student Services (8.2%). All activities whose primary purpose is to contribute to the emotional and physical well-being of students and their intellectual, cultural, and social devel-opment outside of formal instruction. These ac-tivities include student activities, cultural events, student newspapers, intramural athletics, student organizations, intercollegiate athletics, counsel-ing, career guidance, student aid administration, student health services, child care, and transpor-tation. This program also includes the admissions and registrar functions of the institution including orientation programs and the maintenance of stu-dent records. 8. Financial Aid (19.1%). All scholarships, fellowships, and loans provided to students. This
22
program excludes student employment, which is budgeted among the various other programs where such employment is used, and administra-tive costs.
Due to a change in federal law that took effect on July 1, 2010, the Department of Education now makes loans directly to students instead of through private lenders. These loans are deliv-ered to the student through the institution and are reflected in each institution's budget. As a result of this federal law change, financial aid as a por-tion of the UW System budget increased from 7.2% in 2009-10 to 19.2% in 2010-11. All other programs were reduced proportionally.
9. Auxiliary Enterprises (7.0%). Self-supporting activities that exist to provide goods or services to students, faculty, and staff, and that charge fees directly related to the cost of those goods and services. This program includes hous-ing, food services, retail sales, and parking.
10. Physical Plant (5.6%). All expenditures related to the operation and maintenance of fa-cilities and grounds other than those charged to auxiliary enterprises. This program includes fa-cilities planning and capital budgeting, utilities, fire protection, and similar items. Operations and maintenance services provided to auxiliary enter-prises are shown in that program and excluded here.
11. Institutional Support (4.0%). This pro-gram includes: (a) executive management, in-cluding the chancellor, the chancellor's cabinet, and their immediate office support staff, costs related to the Board of Regents and the faculty Senates, and legal services; (b) fiscal operations, including the accounting office, budget office, bursar, and audit functions; (c) general admin-istration and logistical services, including per-sonnel administration and payroll, space man-agement, risk management, purchasing, institu-tional research, campus-wide communications, and protective services; (d) administrative com-puter support; and (e) public relations and devel-
opment. Institutional support excludes administrative duties related to specific functions, like an aca-demic department secretary or a research grant administrator, which are included under the func-tional area they support, such as instruction or research.
12. Debt Service on Academic Buildings (4.0%). Principal and interest payments on gen-eral obligation debt. Table 12 provides a detail of 2014-15 budget allocations by institution and program, including debt service on academic buildings. Table 12 also shows the source of funds for each program. GPR funding for individual institutions is deter-mined by the Board of Regents and is based on past allocations and funding changes approved by the Legislature. The amounts shown for auxiliary enterprises in Tables 11 and 12 differ because certain activities, such as intercollegiate athletics and student health services, are classified as aux-iliary enterprises in one table and as student ser-vices in the other.
Program Revenue Balances
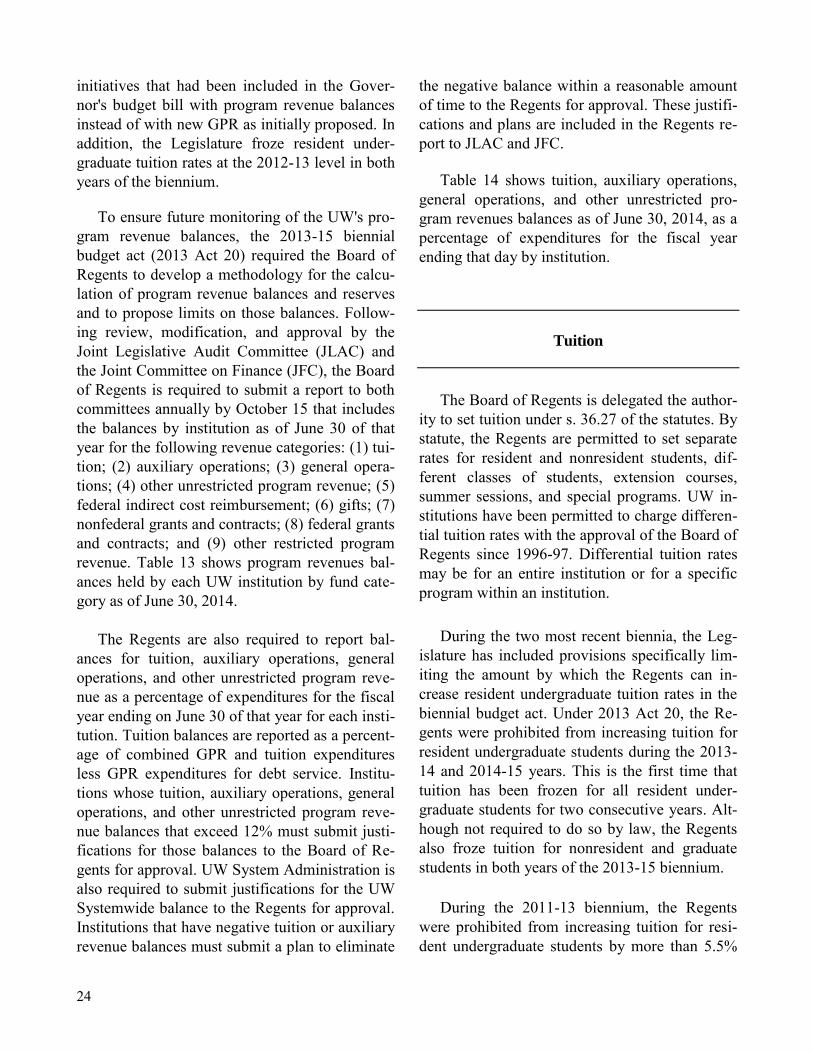
All of the UW System's program revenue ap-propriations are continuing appropriations. This means that unspent balances can be carried over from one year to the next. In April, 2013, legisla-tors became aware that the UW System had pro-gram revenue appropriation balances totaling over $1 billion as of June 30, 2012, including $414.1 million in tuition revenue balances. In response, the 2013-15 biennial budget bill was modified to require the UW System to transfer a portion of those funds to the Higher Educational Aids Board (HEAB) to fund the Wisconsin Grant program for UW students in 2013-14. The UW System was also required to fund a number of
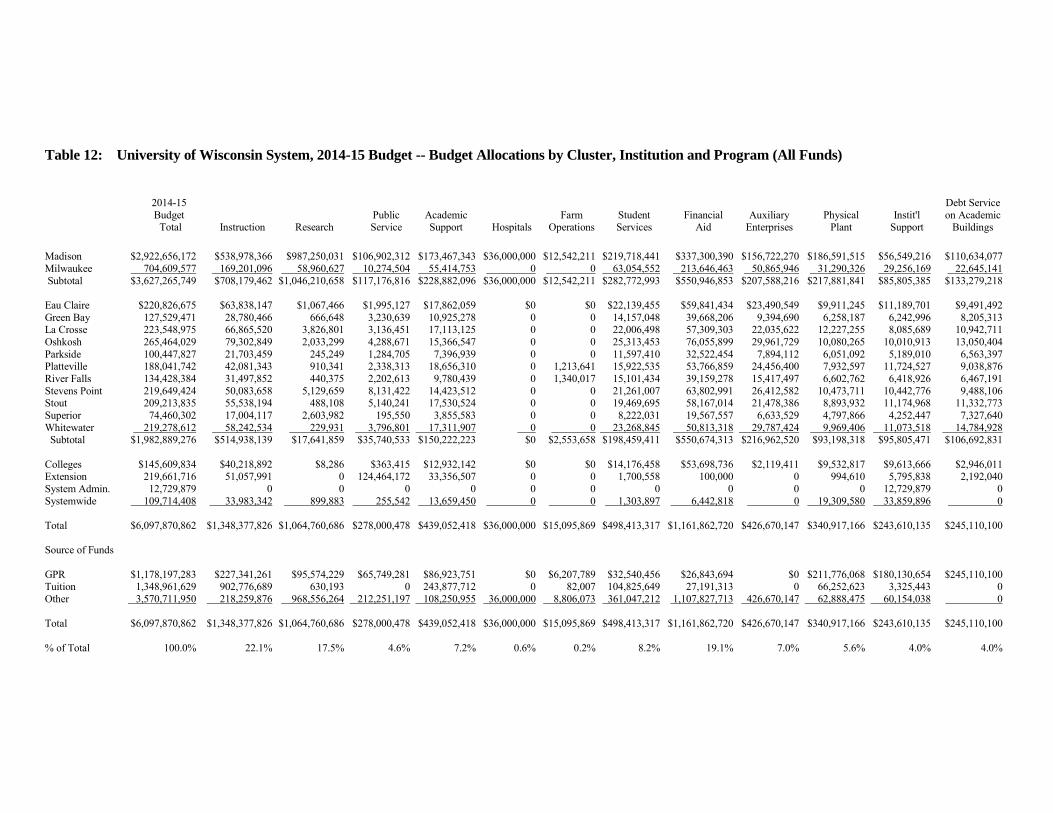
Table 12: University of Wisconsin System, 2014-15 Budget -- Budget Allocations by Cluster, Institution and Program (All Funds)
2014-15 Debt Service Budget Public Academic Farm Student Financial Auxiliary Physical Instit'l on Academic Total Instruction Research Service Support Hospitals Operations Services Aid Enterprises Plant Support Buildings
Madison $2,922,656,172 $538,978,366 $987,250,031 $106,902,312 $173,467,343 $36,000,000 $12,542,211 $219,718,441 $337,300,390 $156,722,270 $186,591,515 $56,549,216 $110,634,077 Milwaukee 704,609,577 169,201,096 58,960,627 10,274,504 55,414,753 0 0 63,054,552 213,646,463 50,865,946 31,290,326 29,256,169 22,645,141 Subtotal $3,627,265,749 $708,179,462 $1,046,210,658 $117,176,816 $228,882,096 $36,000,000 $12,542,211 $282,772,993 $550,946,853 $207,588,216 $217,881,841 $85,805,385 $133,279,218 Eau Claire $220,826,675 $63,838,147 $1,067,466 $1,995,127 $17,862,059 $0 $0 $22,139,455 $59,841,434 $23,490,549 $9,911,245 $11,189,701 $9,491,492 Green Bay 127,529,471 28,780,466 666,648 3,230,639 10,925,278 0 0 14,157,048 39,668,206 9,394,690 6,258,187 6,242,996 8,205,313 La Crosse 223,548,975 66,865,520 3,826,801 3,136,451 17,113,125 0 0 22,006,498 57,309,303 22,035,622 12,227,255 8,085,689 10,942,711 Oshkosh 265,464,029 79,302,849 2,033,299 4,288,671 15,366,547 0 0 25,313,453 76,055,899 29,961,729 10,080,265 10,010,913 13,050,404 Parkside 100,447,827 21,703,459 245,249 1,284,705 7,396,939 0 0 11,597,410 32,522,454 7,894,112 6,051,092 5,189,010 6,563,397 Platteville 188,041,742 42,081,343 910,341 2,338,313 18,656,310 0 1,213,641 15,922,535 53,766,859 24,456,400 7,932,597 11,724,527 9,038,876 River Falls 134,428,384 31,497,852 440,375 2,202,613 9,780,439 0 1,340,017 15,101,434 39,159,278 15,417,497 6,602,762 6,418,926 6,467,191 Stevens Point 219,649,424 50,083,658 5,129,659 8,131,422 14,423,512 0 0 21,261,007 63,802,991 26,412,582 10,473,711 10,442,776 9,488,106 Stout 209,213,835 55,538,194 488,108 5,140,241 17,530,524 0 0 19,469,695 58,167,014 21,478,386 8,893,932 11,174,968 11,332,773 Superior 74,460,302 17,004,117 2,603,982 195,550 3,855,583 0 0 8,222,031 19,567,557 6,633,529 4,797,866 4,252,447 7,327,640 Whitewater 219,278,612 58,242,534 229,931 3,796,801 17,311,907 0 0 23,268,845 50,813,318 29,787,424 9,969,406 11,073,518 14,784,928 Subtotal $1,982,889,276 $514,938,139 $17,641,859 $35,740,533 $150,222,223 $0 $2,553,658 $198,459,411 $550,674,313 $216,962,520 $93,198,318 $95,805,471 $106,692,831 Colleges $145,609,834 $40,218,892 $8,286 $363,415 $12,932,142 $0 $0 $14,176,458 $53,698,736 $2,119,411 $9,532,817 $9,613,666 $2,946,011 Extension 219,661,716 51,057,991 0 124,464,172 33,356,507 0 0 1,700,558 100,000 0 994,610 5,795,838 2,192,040 System Admin. 12,729,879 0 0 0 0 0 0 0 0 0 0 12,729,879 0 Systemwide 109,714,408 33,983,342 899,883 255,542 13,659,450 0 0 1,303,897 6,442,818 0 19,309,580 33,859,896 0 Total $6,097,870,862 $1,348,377,826 $1,064,760,686 $278,000,478 $439,052,418 $36,000,000 $15,095,869 $498,413,317 $1,161,862,720 $426,670,147 $340,917,166 $243,610,135 $245,110,100 Source of Funds GPR $1,178,197,283 $227,341,261 $95,574,229 $65,749,281 $86,923,751 $0 $6,207,789 $32,540,456 $26,843,694 $0 $211,776,068 $180,130,654 $245,110,100 Tuition 1,348,961,629 902,776,689 630,193 0 243,877,712 0 82,007 104,825,649 27,191,313 0 66,252,623 3,325,443 0 Other 3,570,711,950 218,259,876 968,556,264 212,251,197 108,250,955 36,000,000 8,806,073 361,047,212 1,107,827,713 426,670,147 62,888,475 60,154,038 0 Total $6,097,870,862 $1,348,377,826 $1,064,760,686 $278,000,478 $439,052,418 $36,000,000 $15,095,869 $498,413,317 $1,161,862,720 $426,670,147 $340,917,166 $243,610,135 $245,110,100 % of Total 100.0% 22.1% 17.5% 4.6% 7.2% 0.6% 0.2% 8.2% 19.1% 7.0% 5.6% 4.0% 4.0%
24
initiatives that had been included in the Gover-nor's budget bill with program revenue balances instead of with new GPR as initially proposed. In addition, the Legislature froze resident under-graduate tuition rates at the 2012-13 level in both years of the biennium. To ensure future monitoring of the UW's pro-gram revenue balances, the 2013-15 biennial budget act (2013 Act 20) required the Board of Regents to develop a methodology for the calcu-lation of program revenue balances and reserves and to propose limits on those balances. Follow-ing review, modification, and approval by the Joint Legislative Audit Committee (JLAC) and the Joint Committee on Finance (JFC), the Board of Regents is required to submit a report to both committees annually by October 15 that includes the balances by institution as of June 30 of that year for the following revenue categories: (1) tui-tion; (2) auxiliary operations; (3) general opera-tions; (4) other unrestricted program revenue; (5) federal indirect cost reimbursement; (6) gifts; (7) nonfederal grants and contracts; (8) federal grants and contracts; and (9) other restricted program revenue. Table 13 shows program revenues bal-ances held by each UW institution by fund cate-gory as of June 30, 2014. The Regents are also required to report bal-ances for tuition, auxiliary operations, general operations, and other unrestricted program reve-nue as a percentage of expenditures for the fiscal year ending on June 30 of that year for each insti-tution. Tuition balances are reported as a percent-age of combined GPR and tuition expenditures less GPR expenditures for debt service. Institu-tions whose tuition, auxiliary operations, general operations, and other unrestricted program reve-nue balances that exceed 12% must submit justi-fications for those balances to the Board of Re-gents for approval. UW System Administration is also required to submit justifications for the UW Systemwide balance to the Regents for approval. Institutions that have negative tuition or auxiliary revenue balances must submit a plan to eliminate
the negative balance within a reasonable amount of time to the Regents for approval. These justifi-cations and plans are included in the Regents re-port to JLAC and JFC. Table 14 shows tuition, auxiliary operations, general operations, and other unrestricted pro-gram revenues balances as of June 30, 2014, as a percentage of expenditures for the fiscal year ending that day by institution.
Tuition
The Board of Regents is delegated the author-ity to set tuition under s. 36.27 of the statutes. By statute, the Regents are permitted to set separate rates for resident and nonresident students, dif-ferent classes of students, extension courses, summer sessions, and special programs. UW in-stitutions have been permitted to charge differen-tial tuition rates with the approval of the Board of Regents since 1996-97. Differential tuition rates may be for an entire institution or for a specific program within an institution. During the two most recent biennia, the Leg-islature has included provisions specifically lim-iting the amount by which the Regents can in-crease resident undergraduate tuition rates in the biennial budget act. Under 2013 Act 20, the Re-gents were prohibited from increasing tuition for resident undergraduate students during the 2013-14 and 2014-15 years. This is the first time that tuition has been frozen for all resident under-graduate students for two consecutive years. Alt-hough not required to do so by law, the Regents also froze tuition for nonresident and graduate students in both years of the 2013-15 biennium. During the 2011-13 biennium, the Regents were prohibited from increasing tuition for resi-dent undergraduate students by more than 5.5%
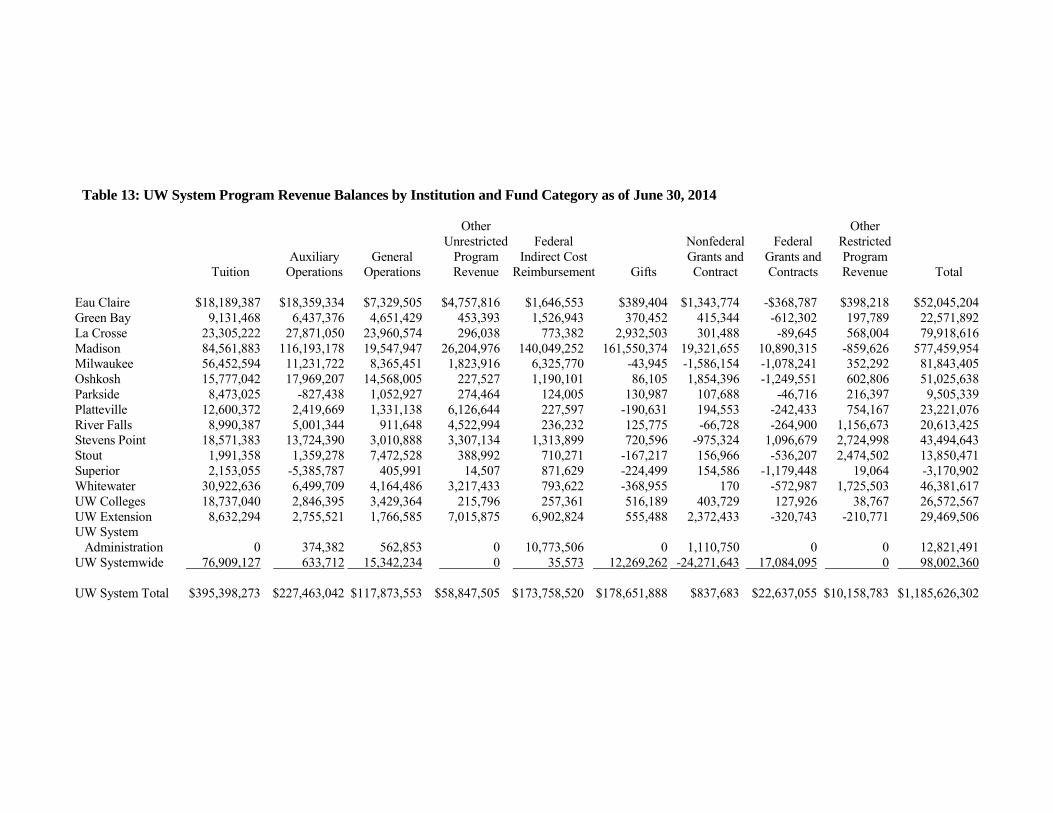
Table 13: UW System Program Revenue Balances by Institution and Fund Category as of June 30, 2014 Other Other Unrestricted Federal Nonfederal Federal Restricted Auxiliary General Program Indirect Cost Grants and Grants and Program Tuition Operations Operations Revenue Reimbursement Gifts Contract Contracts Revenue Total
Eau Claire $18,189,387 $18,359,334 $7,329,505 $4,757,816 $1,646,553 $389,404 $1,343,774 -$368,787 $398,218 $52,045,204 Green Bay 9,131,468 6,437,376 4,651,429 453,393 1,526,943 370,452 415,344 -612,302 197,789 22,571,892 La Crosse 23,305,222 27,871,050 23,960,574 296,038 773,382 2,932,503 301,488 -89,645 568,004 79,918,616 Madison 84,561,883 116,193,178 19,547,947 26,204,976 140,049,252 161,550,374 19,321,655 10,890,315 -859,626 577,459,954 Milwaukee 56,452,594 11,231,722 8,365,451 1,823,916 6,325,770 -43,945 -1,586,154 -1,078,241 352,292 81,843,405 Oshkosh 15,777,042 17,969,207 14,568,005 227,527 1,190,101 86,105 1,854,396 -1,249,551 602,806 51,025,638 Parkside 8,473,025 -827,438 1,052,927 274,464 124,005 130,987 107,688 -46,716 216,397 9,505,339 Platteville 12,600,372 2,419,669 1,331,138 6,126,644 227,597 -190,631 194,553 -242,433 754,167 23,221,076 River Falls 8,990,387 5,001,344 911,648 4,522,994 236,232 125,775 -66,728 -264,900 1,156,673 20,613,425 Stevens Point 18,571,383 13,724,390 3,010,888 3,307,134 1,313,899 720,596 -975,324 1,096,679 2,724,998 43,494,643 Stout 1,991,358 1,359,278 7,472,528 388,992 710,271 -167,217 156,966 -536,207 2,474,502 13,850,471 Superior 2,153,055 -5,385,787 405,991 14,507 871,629 -224,499 154,586 -1,179,448 19,064 -3,170,902 Whitewater 30,922,636 6,499,709 4,164,486 3,217,433 793,622 -368,955 170 -572,987 1,725,503 46,381,617 UW Colleges 18,737,040 2,846,395 3,429,364 215,796 257,361 516,189 403,729 127,926 38,767 26,572,567 UW Extension 8,632,294 2,755,521 1,766,585 7,015,875 6,902,824 555,488 2,372,433 -320,743 -210,771 29,469,506 UW System Administration 0 374,382 562,853 0 10,773,506 0 1,110,750 0 0 12,821,491 UW Systemwide 76,909,127 633,712 15,342,234 0 35,573 12,269,262 -24,271,643 17,084,095 0 98,002,360 UW System Total $395,398,273 $227,463,042 $117,873,553 $58,847,505 $173,758,520 $178,651,888 $837,683 $22,637,055 $10,158,783 $1,185,626,302
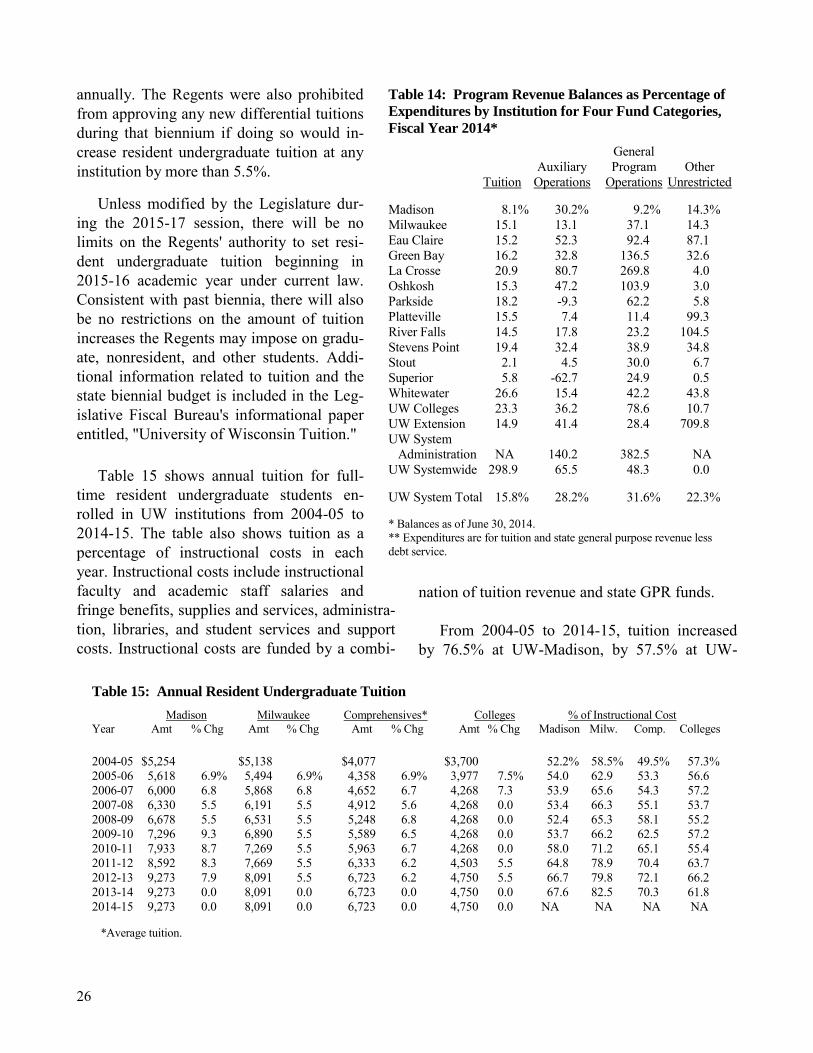
26
annually. The Regents were also prohibited from approving any new differential tuitions during that biennium if doing so would in-crease resident undergraduate tuition at any institution by more than 5.5%.
Unless modified by the Legislature dur-ing the 2015-17 session, there will be no limits on the Regents' authority to set resi-dent undergraduate tuition beginning in 2015-16 academic year under current law. Consistent with past biennia, there will also be no restrictions on the amount of tuition increases the Regents may impose on gradu-ate, nonresident, and other students. Addi-tional information related to tuition and the state biennial budget is included in the Leg-islative Fiscal Bureau's informational paper entitled, "University of Wisconsin Tuition." Table 15 shows annual tuition for full-time resident undergraduate students en-rolled in UW institutions from 2004-05 to 2014-15. The table also shows tuition as a percentage of instructional costs in each year. Instructional costs include instructional faculty and academic staff salaries and fringe benefits, supplies and services, administra-tion, libraries, and student services and support costs. Instructional costs are funded by a combi-
nation of tuition revenue and state GPR funds. From 2004-05 to 2014-15, tuition increased by 76.5% at UW-Madison, by 57.5% at UW-
Table 15: Annual Resident Undergraduate Tuition Madison Milwaukee Comprehensives* Colleges % of Instructional Cost Year Amt % Chg Amt % Chg Amt % Chg Amt % Chg Madison Milw. Comp. Colleges
2004-05 $5,254 $5,138 $4,077 $3,700 52.2% 58.5% 49.5% 57.3% 2005-06 5,618 6.9% 5,494 6.9% 4,358 6.9% 3,977 7.5% 54.0 62.9 53.3 56.6 2006-07 6,000 6.8 5,868 6.8 4,652 6.7 4,268 7.3 53.9 65.6 54.3 57.2 2007-08 6,330 5.5 6,191 5.5 4,912 5.6 4,268 0.0 53.4 66.3 55.1 53.7 2008-09 6,678 5.5 6,531 5.5 5,248 6.8 4,268 0.0 52.4 65.3 58.1 55.2 2009-10 7,296 9.3 6,890 5.5 5,589 6.5 4,268 0.0 53.7 66.2 62.5 57.2 2010-11 7,933 8.7 7,269 5.5 5,963 6.7 4,268 0.0 58.0 71.2 65.1 55.4 2011-12 8,592 8.3 7,669 5.5 6,333 6.2 4,503 5.5 64.8 78.9 70.4 63.7 2012-13 9,273 7.9 8,091 5.5 6,723 6.2 4,750 5.5 66.7 79.8 72.1 66.2 2013-14 9,273 0.0 8,091 0.0 6,723 0.0 4,750 0.0 67.6 82.5 70.3 61.8 2014-15 9,273 0.0 8,091 0.0 6,723 0.0 4,750 0.0 NA NA NA NA *Average tuition.
Table 14: Program Revenue Balances as Percentage of
Expenditures by Institution for Four Fund Categories,
Fiscal Year 2014*
General Auxiliary Program Other Tuition Operations Operations Unrestricted Madison 8.1% 30.2% 9.2% 14.3% Milwaukee 15.1 13.1 37.1 14.3 Eau Claire 15.2 52.3 92.4 87.1 Green Bay 16.2 32.8 136.5 32.6 La Crosse 20.9 80.7 269.8 4.0 Oshkosh 15.3 47.2 103.9 3.0 Parkside 18.2 -9.3 62.2 5.8 Platteville 15.5 7.4 11.4 99.3 River Falls 14.5 17.8 23.2 104.5 Stevens Point 19.4 32.4 38.9 34.8 Stout 2.1 4.5 30.0 6.7 Superior 5.8 -62.7 24.9 0.5 Whitewater 26.6 15.4 42.2 43.8 UW Colleges 23.3 36.2 78.6 10.7 UW Extension 14.9 41.4 28.4 709.8 UW System Administration NA 140.2 382.5 NA UW Systemwide 298.9 65.5 48.3 0.0 UW System Total 15.8% 28.2% 31.6% 22.3% * Balances as of June 30, 2014. ** Expenditures are for tuition and state general purpose revenue less debt service.
27
Milwaukee, by an average of 64.9% at the com-prehensive institutions, and by 28.4% at the UW Colleges. As tuition has increased at a faster rate than GPR support for the University, tuition as a portion of instructional costs has increased. In 2004-05, students paid between 49% and 59% of their instructional costs while in 2013-14 students pay between 61% and 83% of their instructional costs. In addition to tuition charges, all students are assessed segregated fees to finance a wide variety of student activities including parking and trans-portation services, student activities, student un-ions and student centers, and intramural and in-tercollegiate athletics. Unlike tuition rates, segre-gated fees are determined by institution. In 2014-15, segregated fees at the four-year campuses range from $908 at Platteville to $1,460 at Green Bay, while fees at the UW Colleges range from $269 to $493. Total tuition and fees by campus are shown in Table 16.
UW Personnel
In 2014-15, the UW System had 35,469 budg-eted full-time equivalent (FTE) positions. This total includes 32,333 faculty and staff and 3,137 student assistants. Through June 30, 2015, uni-versity personnel will consist of four general cat-egories of employees: faculty, academic staff, classified staff, and student assistants. Faculty are defined as individuals holding a specific rank within an academic department or its functional equivalent. Duties of faculty mem-bers include teaching, research, and public ser-vice. In 2014-15, there are 6,879 budgeted FTE faculty positions at UW institutions. There are four ranks of faculty: instructor, assistant profes-sor, associate professor, and full professor. All full professors and associate professors have been
granted tenure. By statute, the Board of Regents may grant tenure to a faculty member if the ap-propriate chancellor and academic department or functional equivalent have recommended such action. Prior to being granted tenure, faculty members have probationary appointments which may last up to seven years. The length of a proba-tionary period may be extended if the faculty member takes a leave of absence during that time. Systemwide, 39.2% of UW faculty are full professors, 28.7% are associate professors, 31.4% are assistant professors, and 0.7% are instructors or other unranked faculty. The percentage of full professors at the four-year campuses ranges from 18.9% (Green Bay) to 58% (Madison). For each faculty rank, there is a systemwide minimum sal-ary, but no maximum. The UW also employs 15,100 budgeted FTE academic staff. Academic staff are defined statu-torily as professional and administrative person-nel other than faculty whose duties are primarily associated with higher education institutions or their administration. Academic staff positions may involve teaching, research, public service, academic support activities, or academic program administration. Other positions are designated as academic staff because their duties require close peer relationships with members of the faculty and academic administrators or because the posi-tion is distinct to higher education. The Madison campus accounts for 59% of all academic staff. Approximately 68% of all academic staff is fund-ed from sources other than GPR and tuition. The UW System groups academic staff into eleven categories: (1) executives; (2) academic program directors; (3) instructional academic staff; (4) research academic staff; (5) directors; (6) administrative officers; (7) other academic staff; (8) program managers; (9) professionals; (10) employees in training; and (11) others. Pro-fessional, director, administrative officer, and
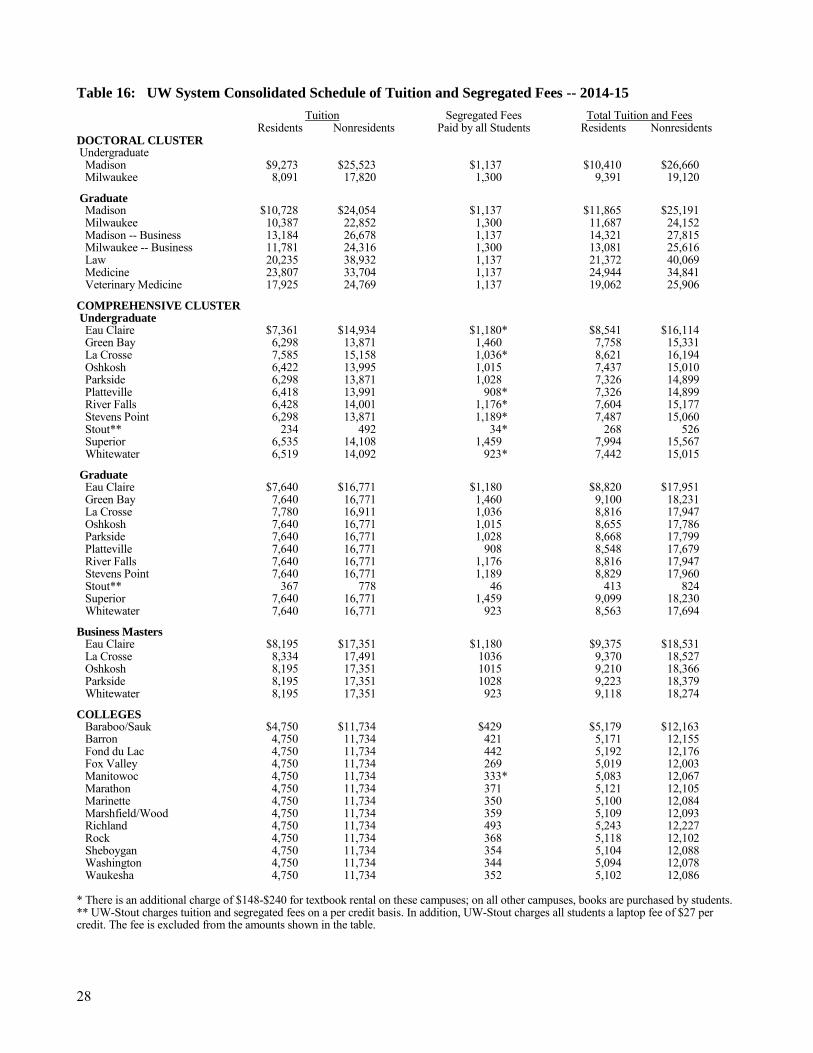
28
Table 16: UW System Consolidated Schedule of Tuition and Segregated Fees -- 2014-15
Tuition Segregated Fees Total Tuition and Fees Residents Nonresidents Paid by all Students Residents Nonresidents DOCTORAL CLUSTER Undergraduate Madison $9,273 $25,523 $1,137 $10,410 $26,660 Milwaukee 8,091 17,820 1,300 9,391 19,120 Graduate Madison $10,728 $24,054 $1,137 $11,865 $25,191 Milwaukee 10,387 22,852 1,300 11,687 24,152 Madison -- Business 13,184 26,678 1,137 14,321 27,815 Milwaukee -- Business 11,781 24,316 1,300 13,081 25,616 Law 20,235 38,932 1,137 21,372 40,069 Medicine 23,807 33,704 1,137 24,944 34,841 Veterinary Medicine 17,925 24,769 1,137 19,062 25,906 COMPREHENSIVE CLUSTER Undergraduate Eau Claire $7,361 $14,934 $1,180* $8,541 $16,114 Green Bay 6,298 13,871 1,460 7,758 15,331 La Crosse 7,585 15,158 1,036* 8,621 16,194 Oshkosh 6,422 13,995 1,015 7,437 15,010 Parkside 6,298 13,871 1,028 7,326 14,899 Platteville 6,418 13,991 908* 7,326 14,899 River Falls 6,428 14,001 1,176* 7,604 15,177 Stevens Point 6,298 13,871 1,189* 7,487 15,060 Stout** 234 492 34* 268 526 Superior 6,535 14,108 1,459 7,994 15,567 Whitewater 6,519 14,092 923* 7,442 15,015 Graduate Eau Claire $7,640 $16,771 $1,180 $8,820 $17,951 Green Bay 7,640 16,771 1,460 9,100 18,231 La Crosse 7,780 16,911 1,036 8,816 17,947 Oshkosh 7,640 16,771 1,015 8,655 17,786 Parkside 7,640 16,771 1,028 8,668 17,799 Platteville 7,640 16,771 908 8,548 17,679 River Falls 7,640 16,771 1,176 8,816 17,947 Stevens Point 7,640 16,771 1,189 8,829 17,960 Stout** 367 778 46 413 824 Superior 7,640 16,771 1,459 9,099 18,230 Whitewater 7,640 16,771 923 8,563 17,694 Business Masters Eau Claire $8,195 $17,351 $1,180 $9,375 $18,531 La Crosse 8,334 17,491 1036 9,370 18,527 Oshkosh 8,195 17,351 1015 9,210 18,366 Parkside 8,195 17,351 1028 9,223 18,379 Whitewater 8,195 17,351 923 9,118 18,274 COLLEGES Baraboo/Sauk $4,750 $11,734 $429 $5,179 $12,163 Barron 4,750 11,734 421 5,171 12,155 Fond du Lac 4,750 11,734 442 5,192 12,176 Fox Valley 4,750 11,734 269 5,019 12,003 Manitowoc 4,750 11,734 333* 5,083 12,067 Marathon 4,750 11,734 371 5,121 12,105 Marinette 4,750 11,734 350 5,100 12,084 Marshfield/Wood 4,750 11,734 359 5,109 12,093 Richland 4,750 11,734 493 5,243 12,227 Rock 4,750 11,734 368 5,118 12,102 Sheboygan 4,750 11,734 354 5,104 12,088 Washington 4,750 11,734 344 5,094 12,078 Waukesha 4,750 11,734 352 5,102 12,086 * There is an additional charge of $148-$240 for textbook rental on these campuses; on all other campuses, books are purchased by students. ** UW-Stout charges tuition and segregated fees on a per credit basis. In addition, UW-Stout charges all students a laptop fee of $27 per credit. The fee is excluded from the amounts shown in the table.
29
program manager job titles are assigned to one of eleven salary grades with a specified salary min-ima and maxima. Instructional academic staff and research academic staff titles are assigned a minimum salary, but no maximum salary. Professionals, instructional academic staff, and research academic staff are three of the larg-est academic staff categories. Combined, these three categories make up 68% of the total aca-demic staff. Professionals are the largest group of academic staff; in 2014-15, approximately 40% of all budgeted academic staff belong to this group. Examples of titles categorized as profes-sionals include librarian, academic planner, advi-sor, budget planner, counselor, database adminis-trator, editor, facility planning specialist, infor-mation manager, institutional planner, psycholo-gist, residence hall manager, student health nurse, student services coordinator, and legal counsel. Instructional academic staff is another large academic staff category at 20% of the total. In-structional academic staff provide credit instruc-tion and training to students in an academic dis-cipline. The number of instructional academic staff has increased significantly over the past decade. From 2004-05 to 2014-15, budgeted in-structional academic staff increased from 2,042 to 2,993, or 47%. This far outpaced growth in the faculty and all other academic staff categories which increased by 5% and 26%, respectively. Research academic staff account for an addi-tional 8% of all academic staff. Research aca-demic staff conduct research, identify research problems, design methodology, and perform oth-er related activities. Over 90% of research aca-demic staff positions are assigned to Madison which reflects its large research program.
Unlike faculty and academic staff positions, which are governed by statute, administrative rules, and UW Board of Regents policy, classi-fied staff positions are governed by statute and the administrative rules established by the Office
of State Employment Relations (OSER). In 2014-15, there are 10,354 budgeted FTE classified staff positions within the UW System. Under 2011 Act 32, the Board of Regents and the UW-Madison Chancellor were granted the authority to create two new personnel systems: one for all employees assigned to UW-Madison and one for all other UW employees. These per-sonnel systems were to take effect on July 1, 2013, but 2013 Act 20 delayed the effective date of the personnel systems until July 1, 2015. The new personnel systems must include a civil ser-vice system, a grievance procedure that addresses employee terminations, and provisions that ad-dress employee discipline and workplace safety. Statues require that the Joint Committee on Em-ployment Relations (JCOER) approve the per-sonnel systems before they can be implemented. JCOER approved both personnel systems in April, 2014. When the new personnel systems take effect on July 1, 2015, all UW positions will be gov-erned by statute, administrative rule, and UW Board of Regents policy and none will be gov-erned by OSER administrative rules. In effect, there will cease to be any classified staff posi-tions at UW institutions. Statutes provide that after the new personnel systems take effect UW employees who held classified staff positions on June 30, 2015, may only be removed, suspended without pay, discharged, reduced in base pay or demoted for just cause and may appeal all such actions.
Table 17 shows budgeted, full-time equivalent faculty and staff by institution for 2014-15 for all funding sources, excluding student assistants. As shown in Table 18, including student assistants, the UW System has 35,282 authorized positions, or half of all authorized state positions. When only GPR positions are considered, the Universi-ty's 18,433 authorized GPR positions represent 51.3% of the state's total authorized GPR posi-tions. Under 2011 Act 32 and 2013 Act 20, posi-
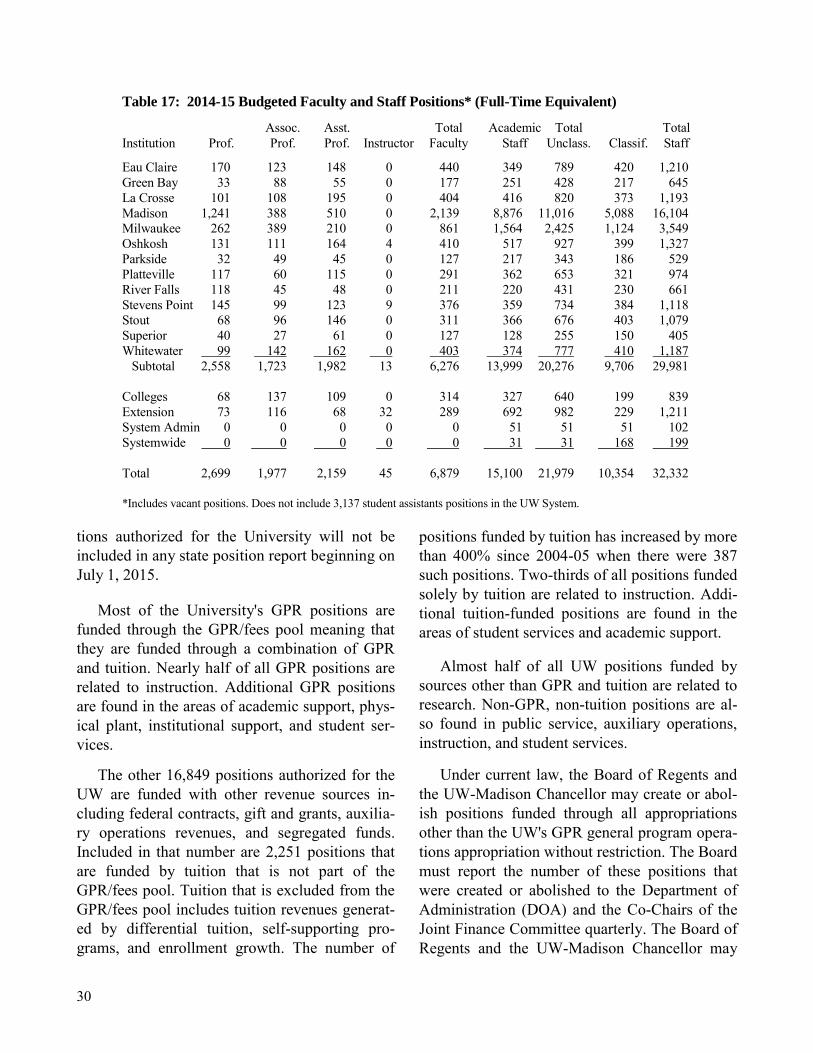
30
tions authorized for the University will not be included in any state position report beginning on July 1, 2015.
Most of the University's GPR positions are funded through the GPR/fees pool meaning that they are funded through a combination of GPR and tuition. Nearly half of all GPR positions are related to instruction. Additional GPR positions are found in the areas of academic support, phys-ical plant, institutional support, and student ser-vices.
The other 16,849 positions authorized for the UW are funded with other revenue sources in-cluding federal contracts, gift and grants, auxilia-ry operations revenues, and segregated funds. Included in that number are 2,251 positions that are funded by tuition that is not part of the GPR/fees pool. Tuition that is excluded from the GPR/fees pool includes tuition revenues generat-ed by differential tuition, self-supporting pro-grams, and enrollment growth. The number of
positions funded by tuition has increased by more than 400% since 2004-05 when there were 387 such positions. Two-thirds of all positions funded solely by tuition are related to instruction. Addi-tional tuition-funded positions are found in the areas of student services and academic support. Almost half of all UW positions funded by sources other than GPR and tuition are related to research. Non-GPR, non-tuition positions are al-so found in public service, auxiliary operations, instruction, and student services. Under current law, the Board of Regents and the UW-Madison Chancellor may create or abol-ish positions funded through all appropriations other than the UW's GPR general program opera-tions appropriation without restriction. The Board must report the number of these positions that were created or abolished to the Department of Administration (DOA) and the Co-Chairs of the Joint Finance Committee quarterly. The Board of Regents and the UW-Madison Chancellor may
Table 17: 2014-15 Budgeted Faculty and Staff Positions* (Full-Time Equivalent)
Assoc. Asst. Total Academic Total Total Institution Prof. Prof. Prof. Instructor Faculty Staff Unclass. Classif. Staff
Eau Claire 170 123 148 0 440 349 789 420 1,210 Green Bay 33 88 55 0 177 251 428 217 645 La Crosse 101 108 195 0 404 416 820 373 1,193 Madison 1,241 388 510 0 2,139 8,876 11,016 5,088 16,104 Milwaukee 262 389 210 0 861 1,564 2,425 1,124 3,549 Oshkosh 131 111 164 4 410 517 927 399 1,327 Parkside 32 49 45 0 127 217 343 186 529 Platteville 117 60 115 0 291 362 653 321 974 River Falls 118 45 48 0 211 220 431 230 661 Stevens Point 145 99 123 9 376 359 734 384 1,118 Stout 68 96 146 0 311 366 676 403 1,079 Superior 40 27 61 0 127 128 255 150 405 Whitewater 99 142 162 0 403 374 777 410 1,187 Subtotal 2,558 1,723 1,982 13 6,276 13,999 20,276 9,706 29,981 Colleges 68 137 109 0 314 327 640 199 839 Extension 73 116 68 32 289 692 982 229 1,211 System Admin 0 0 0 0 0 51 51 51 102 Systemwide 0 0 0 0 0 31 31 168 199 Total 2,699 1,977 2,159 45 6,879 15,100 21,979 10,354 32,332 *Includes vacant positions. Does not include 3,137 student assistants positions in the UW System.
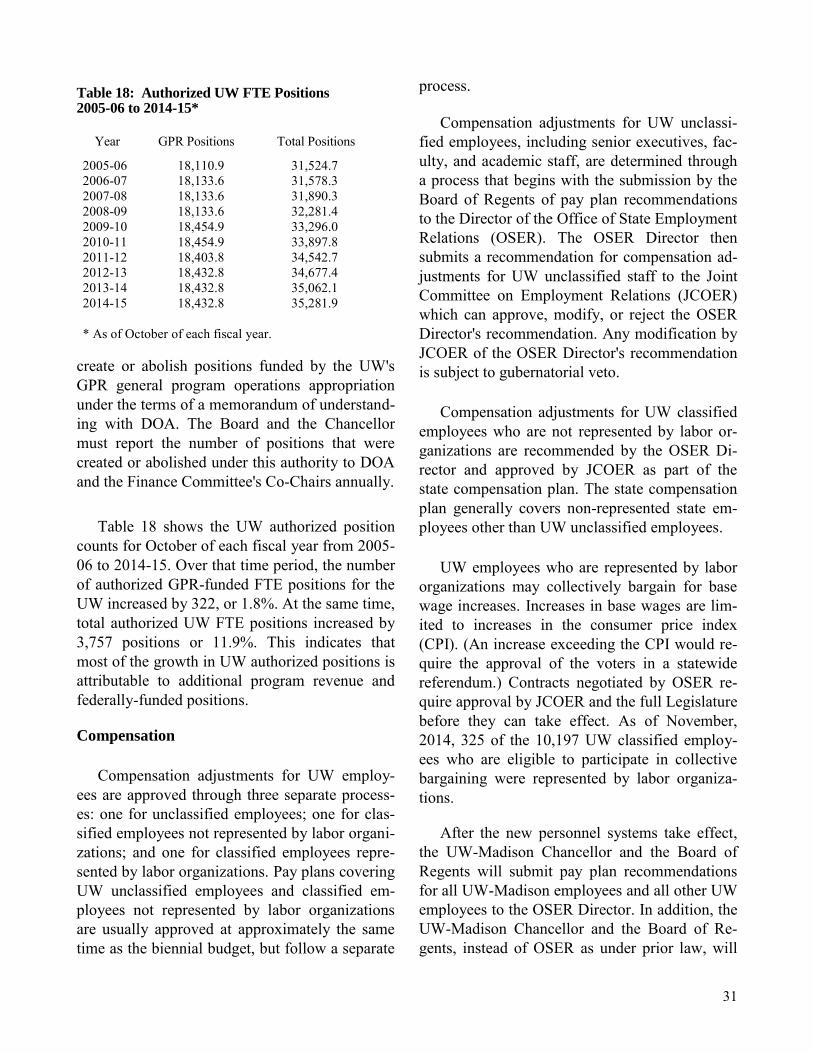
31
create or abolish positions funded by the UW's GPR general program operations appropriation under the terms of a memorandum of understand-ing with DOA. The Board and the Chancellor must report the number of positions that were created or abolished under this authority to DOA and the Finance Committee's Co-Chairs annually. Table 18 shows the UW authorized position counts for October of each fiscal year from 2005-06 to 2014-15. Over that time period, the number of authorized GPR-funded FTE positions for the UW increased by 322, or 1.8%. At the same time, total authorized UW FTE positions increased by 3,757 positions or 11.9%. This indicates that most of the growth in UW authorized positions is attributable to additional program revenue and federally-funded positions.
Compensation
Compensation adjustments for UW employ-ees are approved through three separate process-es: one for unclassified employees; one for clas-sified employees not represented by labor organi-zations; and one for classified employees repre-sented by labor organizations. Pay plans covering UW unclassified employees and classified em-ployees not represented by labor organizations are usually approved at approximately the same time as the biennial budget, but follow a separate
process. Compensation adjustments for UW unclassi-fied employees, including senior executives, fac-ulty, and academic staff, are determined through a process that begins with the submission by the Board of Regents of pay plan recommendations to the Director of the Office of State Employment Relations (OSER). The OSER Director then submits a recommendation for compensation ad-justments for UW unclassified staff to the Joint Committee on Employment Relations (JCOER) which can approve, modify, or reject the OSER Director's recommendation. Any modification by JCOER of the OSER Director's recommendation is subject to gubernatorial veto. Compensation adjustments for UW classified employees who are not represented by labor or-ganizations are recommended by the OSER Di-rector and approved by JCOER as part of the state compensation plan. The state compensation plan generally covers non-represented state em-ployees other than UW unclassified employees. UW employees who are represented by labor organizations may collectively bargain for base wage increases. Increases in base wages are lim-ited to increases in the consumer price index (CPI). (An increase exceeding the CPI would re-quire the approval of the voters in a statewide referendum.) Contracts negotiated by OSER re-quire approval by JCOER and the full Legislature before they can take effect. As of November, 2014, 325 of the 10,197 UW classified employ-ees who are eligible to participate in collective bargaining were represented by labor organiza-tions. After the new personnel systems take effect, the UW-Madison Chancellor and the Board of Regents will submit pay plan recommendations for all UW-Madison employees and all other UW employees to the OSER Director. In addition, the UW-Madison Chancellor and the Board of Re-gents, instead of OSER as under prior law, will
Table 18: Authorized UW FTE Positions 2005-06 to 2014-15*
Year GPR Positions Total Positions
2005-06 18,110.9 31,524.7 2006-07 18,133.6 31,578.3 2007-08 18,133.6 31,890.3 2008-09 18,133.6 32,281.4 2009-10 18,454.9 33,296.0 2010-11 18,454.9 33,897.8 2011-12 18,403.8 34,542.7 2012-13 18,432.8 34,677.4 2013-14 18,432.8 35,062.1 2014-15 18,432.8 35,281.9 * As of October of each fiscal year.
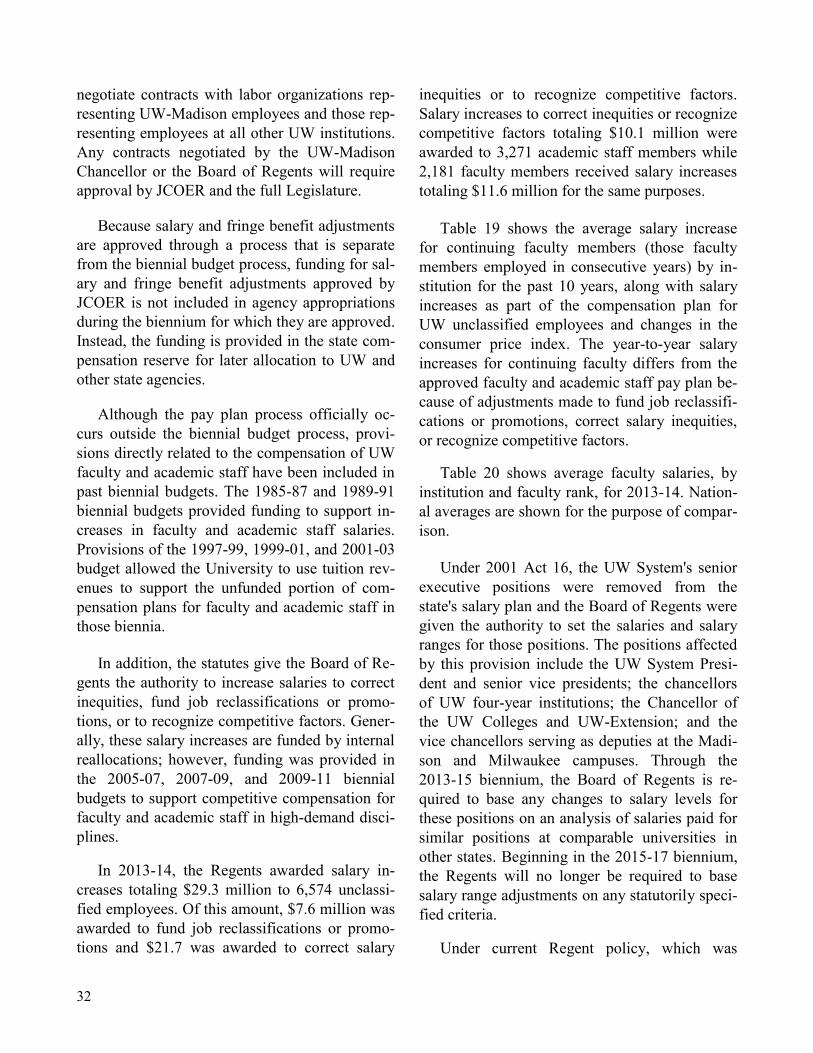
32
negotiate contracts with labor organizations rep-resenting UW-Madison employees and those rep-resenting employees at all other UW institutions. Any contracts negotiated by the UW-Madison Chancellor or the Board of Regents will require approval by JCOER and the full Legislature. Because salary and fringe benefit adjustments are approved through a process that is separate from the biennial budget process, funding for sal-ary and fringe benefit adjustments approved by JCOER is not included in agency appropriations during the biennium for which they are approved. Instead, the funding is provided in the state com-pensation reserve for later allocation to UW and other state agencies. Although the pay plan process officially oc-curs outside the biennial budget process, provi-sions directly related to the compensation of UW faculty and academic staff have been included in past biennial budgets. The 1985-87 and 1989-91 biennial budgets provided funding to support in-creases in faculty and academic staff salaries. Provisions of the 1997-99, 1999-01, and 2001-03 budget allowed the University to use tuition rev-enues to support the unfunded portion of com-pensation plans for faculty and academic staff in those biennia. In addition, the statutes give the Board of Re-gents the authority to increase salaries to correct inequities, fund job reclassifications or promo-tions, or to recognize competitive factors. Gener-ally, these salary increases are funded by internal reallocations; however, funding was provided in the 2005-07, 2007-09, and 2009-11 biennial budgets to support competitive compensation for faculty and academic staff in high-demand disci-plines. In 2013-14, the Regents awarded salary in-creases totaling $29.3 million to 6,574 unclassi-fied employees. Of this amount, $7.6 million was awarded to fund job reclassifications or promo-tions and $21.7 was awarded to correct salary
inequities or to recognize competitive factors. Salary increases to correct inequities or recognize competitive factors totaling $10.1 million were awarded to 3,271 academic staff members while 2,181 faculty members received salary increases totaling $11.6 million for the same purposes.
Table 19 shows the average salary increase for continuing faculty members (those faculty members employed in consecutive years) by in-stitution for the past 10 years, along with salary increases as part of the compensation plan for UW unclassified employees and changes in the consumer price index. The year-to-year salary increases for continuing faculty differs from the approved faculty and academic staff pay plan be-cause of adjustments made to fund job reclassifi-cations or promotions, correct salary inequities, or recognize competitive factors.
Table 20 shows average faculty salaries, by institution and faculty rank, for 2013-14. Nation-al averages are shown for the purpose of compar-ison. Under 2001 Act 16, the UW System's senior executive positions were removed from the state's salary plan and the Board of Regents were given the authority to set the salaries and salary ranges for those positions. The positions affected by this provision include the UW System Presi-dent and senior vice presidents; the chancellors of UW four-year institutions; the Chancellor of the UW Colleges and UW-Extension; and the vice chancellors serving as deputies at the Madi-son and Milwaukee campuses. Through the 2013-15 biennium, the Board of Regents is re-quired to base any changes to salary levels for these positions on an analysis of salaries paid for similar positions at comparable universities in other states. Beginning in the 2015-17 biennium, the Regents will no longer be required to base salary range adjustments on any statutorily speci-fied criteria. Under current Regent policy, which was
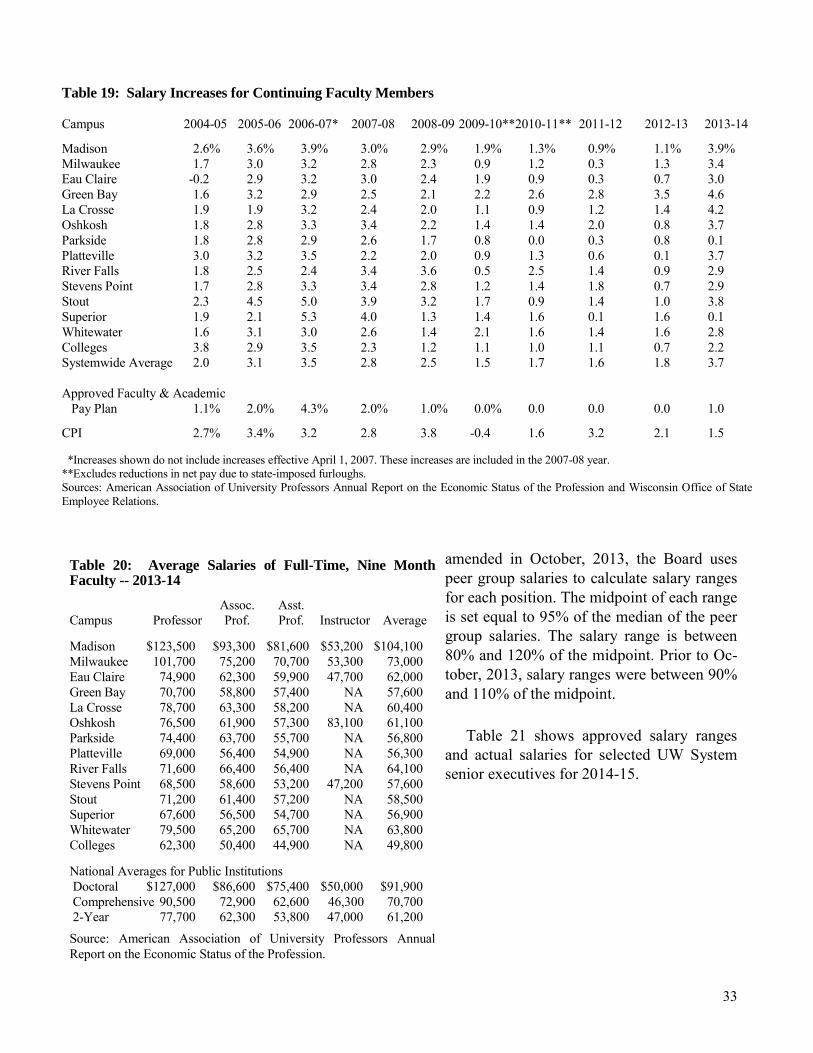
33
amended in October, 2013, the Board uses peer group salaries to calculate salary ranges for each position. The midpoint of each range is set equal to 95% of the median of the peer group salaries. The salary range is between 80% and 120% of the midpoint. Prior to Oc-tober, 2013, salary ranges were between 90% and 110% of the midpoint. Table 21 shows approved salary ranges and actual salaries for selected UW System senior executives for 2014-15.
Table 20: Average Salaries of Full-Time, Nine Month Faculty -- 2013-14
Assoc. Asst. Campus Professor Prof. Prof. Instructor Average Madison $123,500 $93,300 $81,600 $53,200 $104,100 Milwaukee 101,700 75,200 70,700 53,300 73,000 Eau Claire 74,900 62,300 59,900 47,700 62,000 Green Bay 70,700 58,800 57,400 NA 57,600 La Crosse 78,700 63,300 58,200 NA 60,400 Oshkosh 76,500 61,900 57,300 83,100 61,100 Parkside 74,400 63,700 55,700 NA 56,800 Platteville 69,000 56,400 54,900 NA 56,300 River Falls 71,600 66,400 56,400 NA 64,100 Stevens Point 68,500 58,600 53,200 47,200 57,600 Stout 71,200 61,400 57,200 NA 58,500 Superior 67,600 56,500 54,700 NA 56,900 Whitewater 79,500 65,200 65,700 NA 63,800 Colleges 62,300 50,400 44,900 NA 49,800 National Averages for Public Institutions Doctoral $127,000 $86,600 $75,400 $50,000 $91,900 Comprehensive 90,500 72,900 62,600 46,300 70,700 2-Year 77,700 62,300 53,800 47,000 61,200
Source: American Association of University Professors Annual Report on the Economic Status of the Profession.
Table 19: Salary Increases for Continuing Faculty Members
Campus 2004-05 2005-06 2006-07* 2007-08 2008-09 2009-10**2010-11** 2011-12 2012-13 2013-14
Madison 2.6% 3.6% 3.9% 3.0% 2.9% 1.9% 1.3% 0.9% 1.1% 3.9% Milwaukee 1.7 3.0 3.2 2.8 2.3 0.9 1.2 0.3 1.3 3.4 Eau Claire -0.2 2.9 3.2 3.0 2.4 1.9 0.9 0.3 0.7 3.0 Green Bay 1.6 3.2 2.9 2.5 2.1 2.2 2.6 2.8 3.5 4.6 La Crosse 1.9 1.9 3.2 2.4 2.0 1.1 0.9 1.2 1.4 4.2 Oshkosh 1.8 2.8 3.3 3.4 2.2 1.4 1.4 2.0 0.8 3.7 Parkside 1.8 2.8 2.9 2.6 1.7 0.8 0.0 0.3 0.8 0.1 Platteville 3.0 3.2 3.5 2.2 2.0 0.9 1.3 0.6 0.1 3.7 River Falls 1.8 2.5 2.4 3.4 3.6 0.5 2.5 1.4 0.9 2.9 Stevens Point 1.7 2.8 3.3 3.4 2.8 1.2 1.4 1.8 0.7 2.9 Stout 2.3 4.5 5.0 3.9 3.2 1.7 0.9 1.4 1.0 3.8 Superior 1.9 2.1 5.3 4.0 1.3 1.4 1.6 0.1 1.6 0.1 Whitewater 1.6 3.1 3.0 2.6 1.4 2.1 1.6 1.4 1.6 2.8 Colleges 3.8 2.9 3.5 2.3 1.2 1.1 1.0 1.1 0.7 2.2 Systemwide Average 2.0 3.1 3.5 2.8 2.5 1.5 1.7 1.6 1.8 3.7 Approved Faculty & Academic Pay Plan 1.1% 2.0% 4.3% 2.0% 1.0% 0.0% 0.0 0.0 0.0 1.0
CPI 2.7% 3.4% 3.2 2.8 3.8 -0.4 1.6 3.2 2.1 1.5 *Increases shown do not include increases effective April 1, 2007. These increases are included in the 2007-08 year. **Excludes reductions in net pay due to state-imposed furloughs. Sources: American Association of University Professors Annual Report on the Economic Status of the Profession and Wisconsin Office of State Employee Relations.
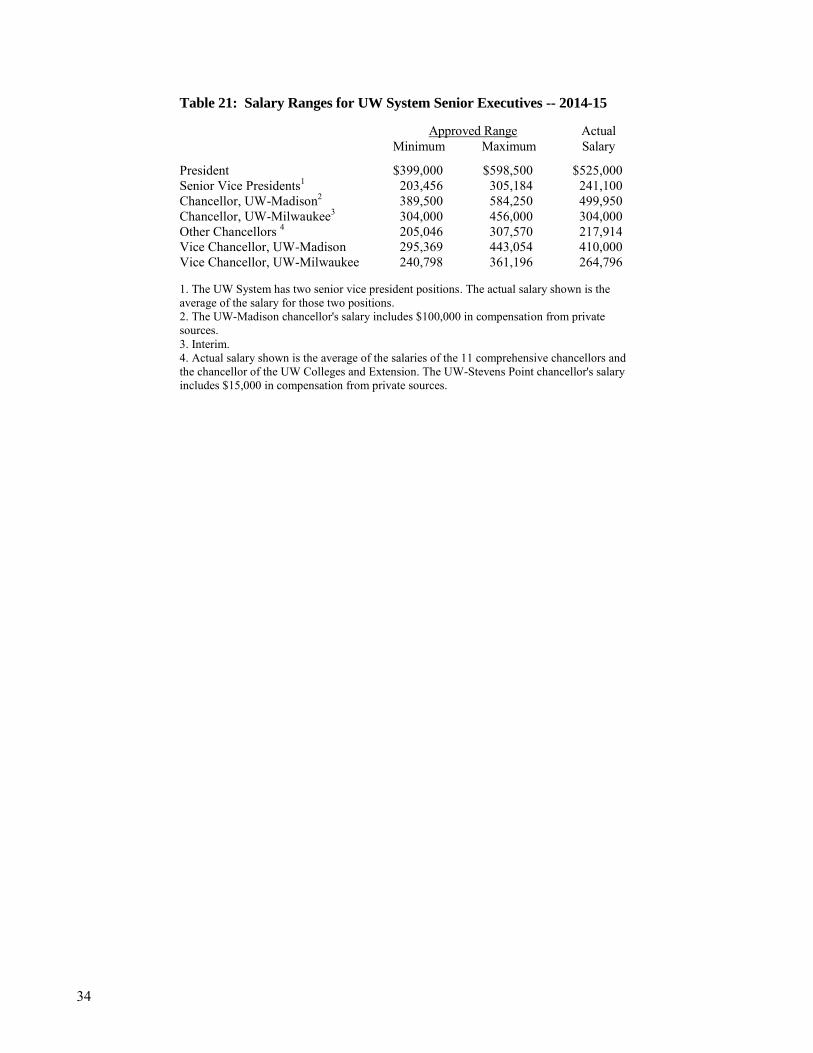
34
Table 21: Salary Ranges for UW System Senior Executives -- 2014-15 Approved Range Actual Minimum Maximum Salary
President $399,000 $598,500 $525,000 Senior Vice Presidents1 203,456 305,184 241,100 Chancellor, UW-Madison2 389,500 584,250 499,950 Chancellor, UW-Milwaukee3 304,000 456,000 304,000 Other Chancellors 4 205,046 307,570 217,914 Vice Chancellor, UW-Madison 295,369 443,054 410,000 Vice Chancellor, UW-Milwaukee 240,798 361,196 264,796 1. The UW System has two senior vice president positions. The actual salary shown is the average of the salary for those two positions. 2. The UW-Madison chancellor's salary includes $100,000 in compensation from private sources. 3. Interim. 4. Actual salary shown is the average of the salaries of the 11 comprehensive chancellors and the chancellor of the UW Colleges and Extension. The UW-Stevens Point chancellor's salary includes $15,000 in compensation from private sources.