Embed Size (px)
Citation preview

HOT ISSUES FACING HOME HEALTH & HOSPICE AGENCIESLuke JamesChief Strategy OfficerEncompass Home Health & Hospice
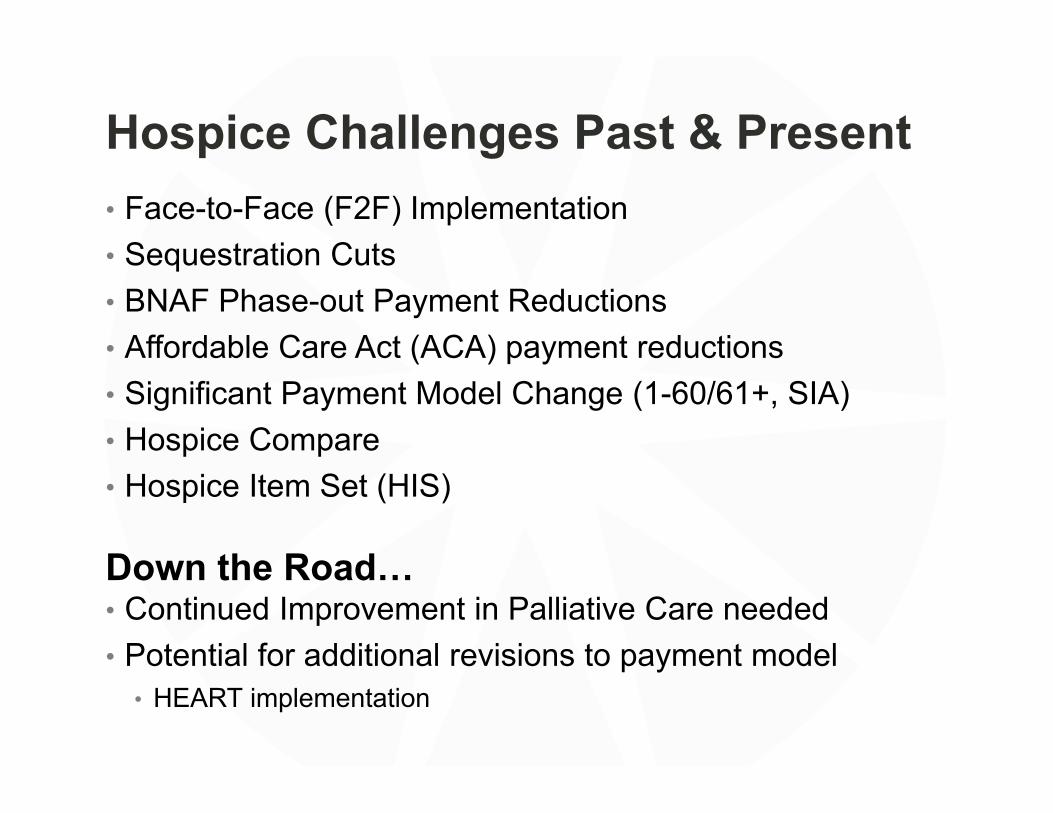
Hospice Challenges Past & Present• Face-to-Face (F2F) Implementation• Sequestration Cuts• BNAF Phase-out Payment Reductions• Affordable Care Act (ACA) payment reductions• Significant Payment Model Change (1-60/61+, SIA)• Hospice Compare• Hospice Item Set (HIS)
Down the Road…• Continued Improvement in Palliative Care needed• Potential for additional revisions to payment model
• HEART implementation
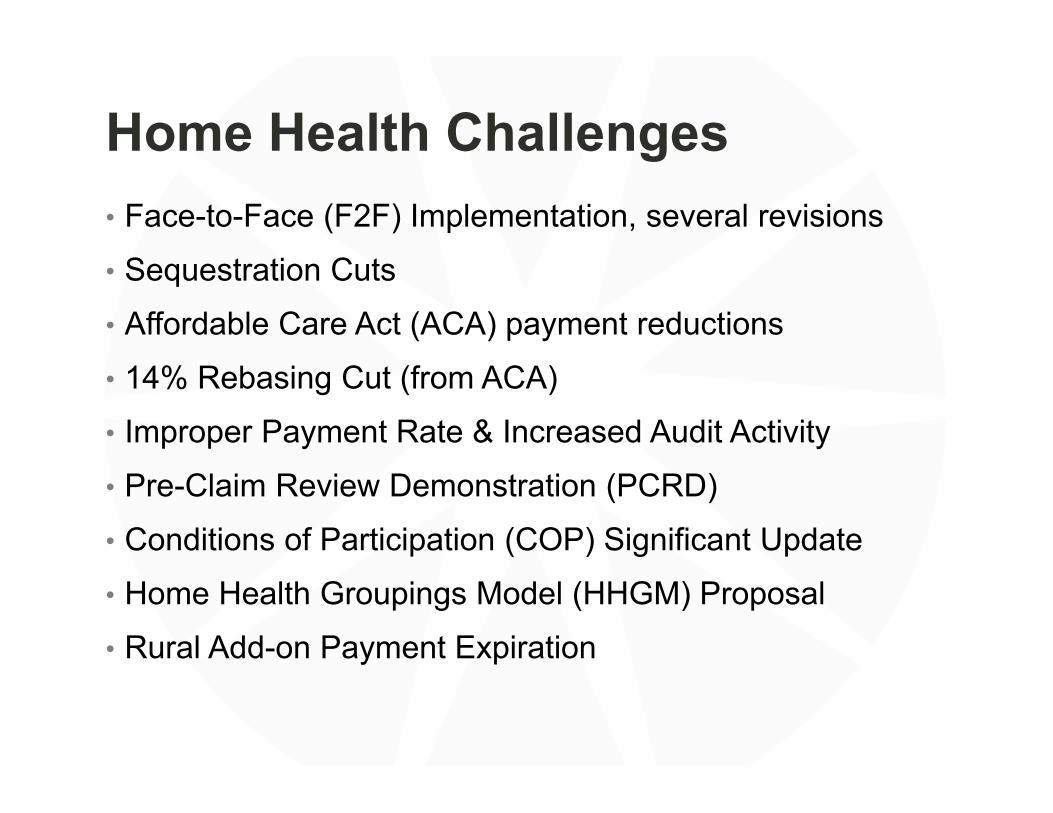
Home Health Challenges• Face-to-Face (F2F) Implementation, several revisions• Sequestration Cuts• Affordable Care Act (ACA) payment reductions• 14% Rebasing Cut (from ACA)• Improper Payment Rate & Increased Audit Activity• Pre-Claim Review Demonstration (PCRD)• Conditions of Participation (COP) Significant Update• Home Health Groupings Model (HHGM) Proposal• Rural Add-on Payment Expiration
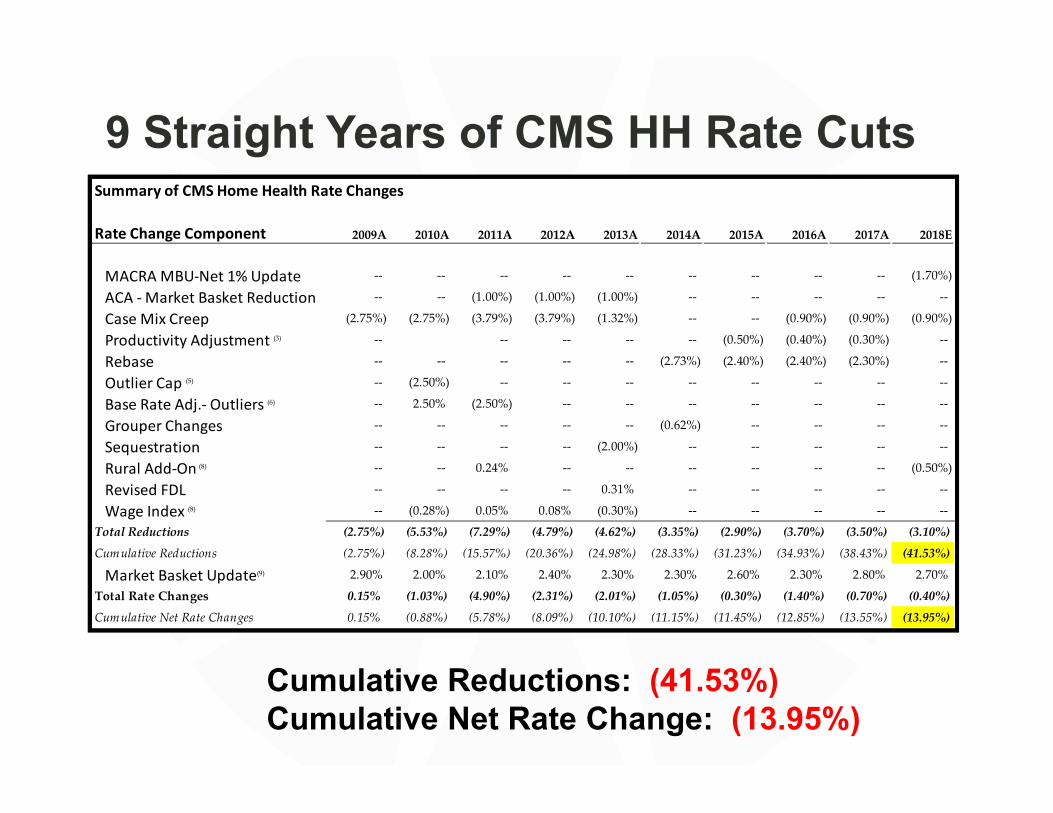
9 Straight Years of CMS HH Rate Cuts
Cumulative Reductions: (41.53%)Cumulative Net Rate Change: (13.95%)
Summary of CMS Home Health Rate Changes
Rate Change Component 2009A 2010A 2011A 2012A 2013A 2014A 2015A 2016A 2017A 2018E
MACRA MBU‐Net 1% Update ‐‐ ‐‐ ‐‐ ‐‐ ‐‐ ‐‐ ‐‐ ‐‐ ‐‐ (1.70%)
ACA ‐ Market Basket Reduction ‐‐ ‐‐ (1.00%) (1.00%) (1.00%) ‐‐ ‐‐ ‐‐ ‐‐ ‐‐
Case Mix Creep (2.75%) (2.75%) (3.79%) (3.79%) (1.32%) ‐‐ ‐‐ (0.90%) (0.90%) (0.90%)
Productivity Adjustment (3) ‐‐ ‐‐ ‐‐ ‐‐ ‐‐ (0.50%) (0.40%) (0.30%) ‐‐
Rebase ‐‐ ‐‐ ‐‐ ‐‐ ‐‐ (2.73%) (2.40%) (2.40%) (2.30%) ‐‐
Outlier Cap (5) ‐‐ (2.50%) ‐‐ ‐‐ ‐‐ ‐‐ ‐‐ ‐‐ ‐‐ ‐‐
Base Rate Adj.‐ Outliers (6) ‐‐ 2.50% (2.50%) ‐‐ ‐‐ ‐‐ ‐‐ ‐‐ ‐‐ ‐‐
Grouper Changes ‐‐ ‐‐ ‐‐ ‐‐ ‐‐ (0.62%) ‐‐ ‐‐ ‐‐ ‐‐
Sequestration ‐‐ ‐‐ ‐‐ ‐‐ (2.00%) ‐‐ ‐‐ ‐‐ ‐‐ ‐‐
Rural Add‐On (8) ‐‐ ‐‐ 0.24% ‐‐ ‐‐ ‐‐ ‐‐ ‐‐ ‐‐ (0.50%)
Revised FDL ‐‐ ‐‐ ‐‐ ‐‐ 0.31% ‐‐ ‐‐ ‐‐ ‐‐ ‐‐
Wage Index (8) ‐‐ (0.28%) 0.05% 0.08% (0.30%) ‐‐ ‐‐ ‐‐ ‐‐ ‐‐
Total Reductions (2.75%) (5.53%) (7.29%) (4.79%) (4.62%) (3.35%) (2.90%) (3.70%) (3.50%) (3.10%)
Cumulative Reductions (2.75%) (8.28%) (15.57%) (20.36%) (24.98%) (28.33%) (31.23%) (34.93%) (38.43%) (41.53%)
Market Basket Update(9) 2.90% 2.00% 2.10% 2.40% 2.30% 2.30% 2.60% 2.30% 2.80% 2.70%
Total Rate Changes 0.15% (1.03%) (4.90%) (2.31%) (2.01%) (1.05%) (0.30%) (1.40%) (0.70%) (0.40%)
Cumulative Net Rate Changes 0.15% (0.88%) (5.78%) (8.09%) (10.10%) (11.15%) (11.45%) (12.85%) (13.55%) (13.95%)
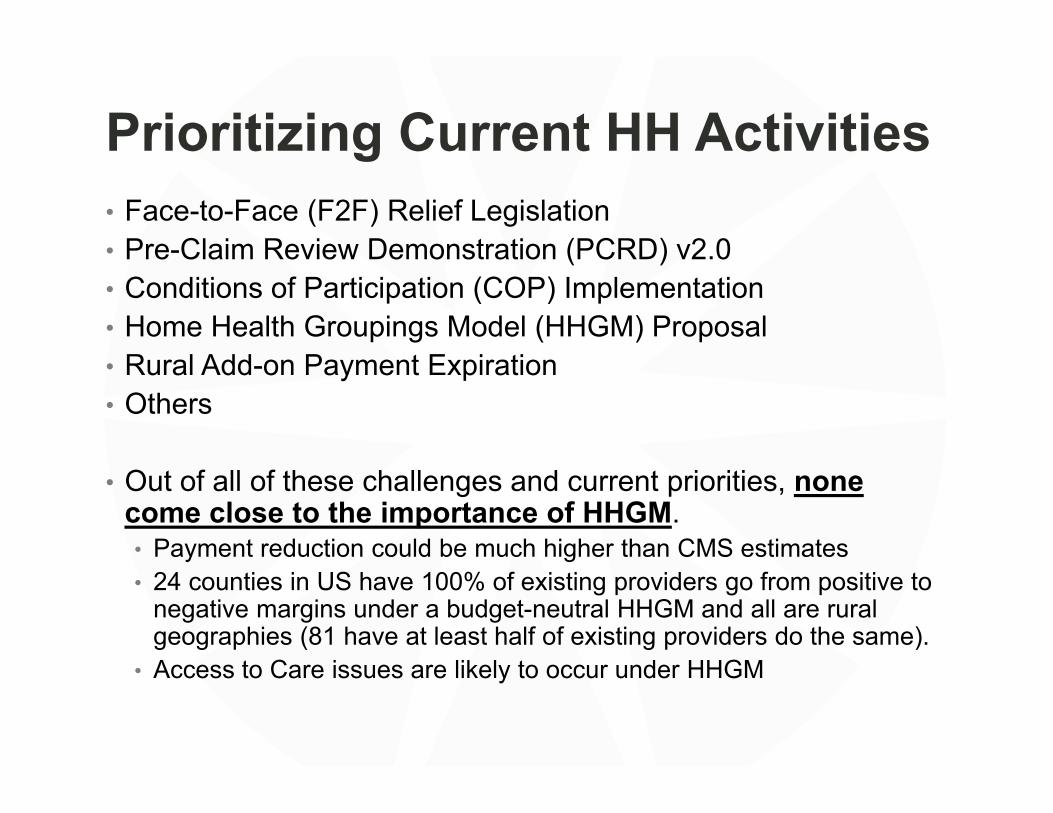
Prioritizing Current HH Activities• Face-to-Face (F2F) Relief Legislation• Pre-Claim Review Demonstration (PCRD) v2.0• Conditions of Participation (COP) Implementation• Home Health Groupings Model (HHGM) Proposal• Rural Add-on Payment Expiration• Others
• Out of all of these challenges and current priorities, none come close to the importance of HHGM.• Payment reduction could be much higher than CMS estimates• 24 counties in US have 100% of existing providers go from positive to
negative margins under a budget-neutral HHGM and all are rural geographies (81 have at least half of existing providers do the same).
• Access to Care issues are likely to occur under HHGM
HHGM BACKGROUND
© 2017 Dobson DaVanzo & Associates, LLC. All Rights Reserved. 6
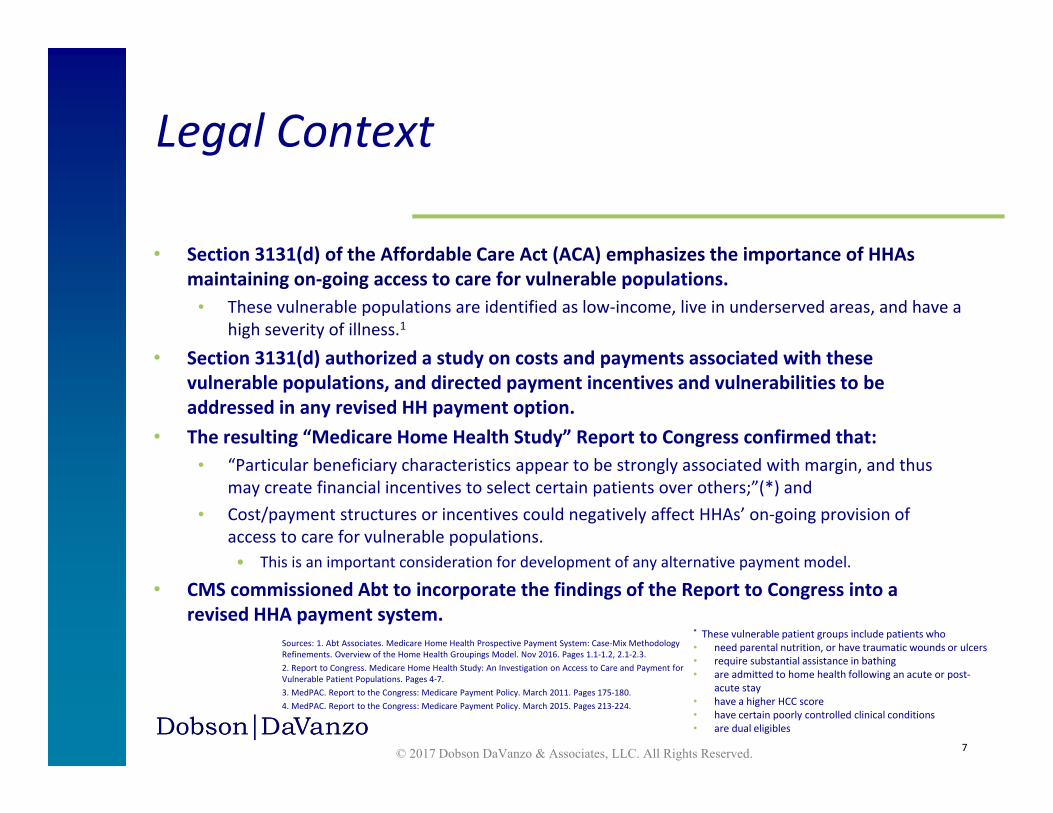
• Section 3131(d) of the Affordable Care Act (ACA) emphasizes the importance of HHAs maintaining on‐going access to care for vulnerable populations.
• These vulnerable populations are identified as low‐income, live in underserved areas, and have a high severity of illness.1
• Section 3131(d) authorized a study on costs and payments associated with these vulnerable populations, and directed payment incentives and vulnerabilities to be addressed in any revised HH payment option.
• The resulting “Medicare Home Health Study” Report to Congress confirmed that: • “Particular beneficiary characteristics appear to be strongly associated with margin, and thus
may create financial incentives to select certain patients over others;”(*) and• Cost/payment structures or incentives could negatively affect HHAs’ on‐going provision of
access to care for vulnerable populations.• This is an important consideration for development of any alternative payment model.
• CMS commissioned Abt to incorporate the findings of the Report to Congress into a revised HHA payment system.
Legal Context
© 2017 Dobson DaVanzo & Associates, LLC. All Rights Reserved. 7
Sources: 1. Abt Associates. Medicare Home Health Prospective Payment System: Case‐Mix Methodology Refinements. Overview of the Home Health Groupings Model. Nov 2016. Pages 1.1‐1.2, 2.1‐2.3.2. Report to Congress. Medicare Home Health Study: An Investigation on Access to Care and Payment for Vulnerable Patient Populations. Pages 4‐7.3. MedPAC. Report to the Congress: Medicare Payment Policy. March 2011. Pages 175‐180.4. MedPAC. Report to the Congress: Medicare Payment Policy. March 2015. Pages 213‐224.
* These vulnerable patient groups include patients who• need parental nutrition, or have traumatic wounds or ulcers• require substantial assistance in bathing• are admitted to home health following an acute or post‐
acute stay• have a higher HCC score• have certain poorly controlled clinical conditions• are dual eligibles
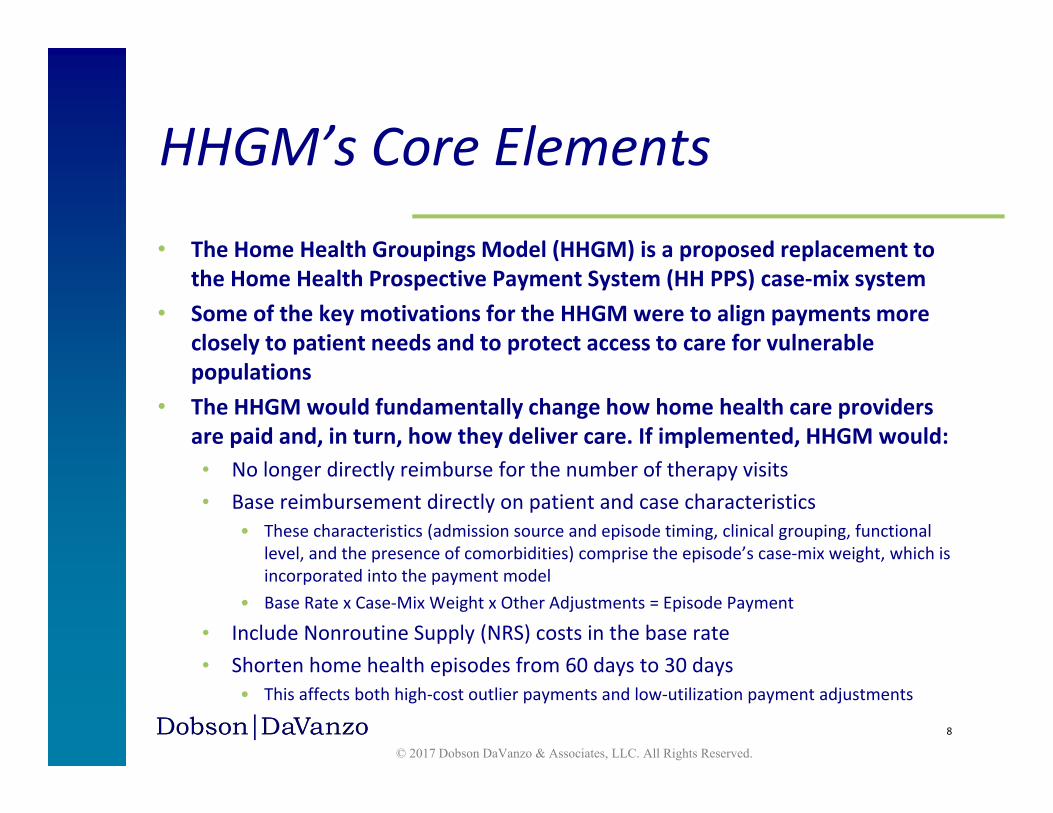
HHGM’s Core Elements• The Home Health Groupings Model (HHGM) is a proposed replacement to
the Home Health Prospective Payment System (HH PPS) case‐mix system• Some of the key motivations for the HHGM were to align payments more
closely to patient needs and to protect access to care for vulnerable populations
• The HHGM would fundamentally change how home health care providers are paid and, in turn, how they deliver care. If implemented, HHGM would:• No longer directly reimburse for the number of therapy visits• Base reimbursement directly on patient and case characteristics
• These characteristics (admission source and episode timing, clinical grouping, functional level, and the presence of comorbidities) comprise the episode’s case‐mix weight, which is incorporated into the payment model
• Base Rate x Case‐Mix Weight x Other Adjustments = Episode Payment
• Include Nonroutine Supply (NRS) costs in the base rate• Shorten home health episodes from 60 days to 30 days
• This affects both high‐cost outlier payments and low‐utilization payment adjustments
8
© 2017 Dobson DaVanzo & Associates, LLC. All Rights Reserved.
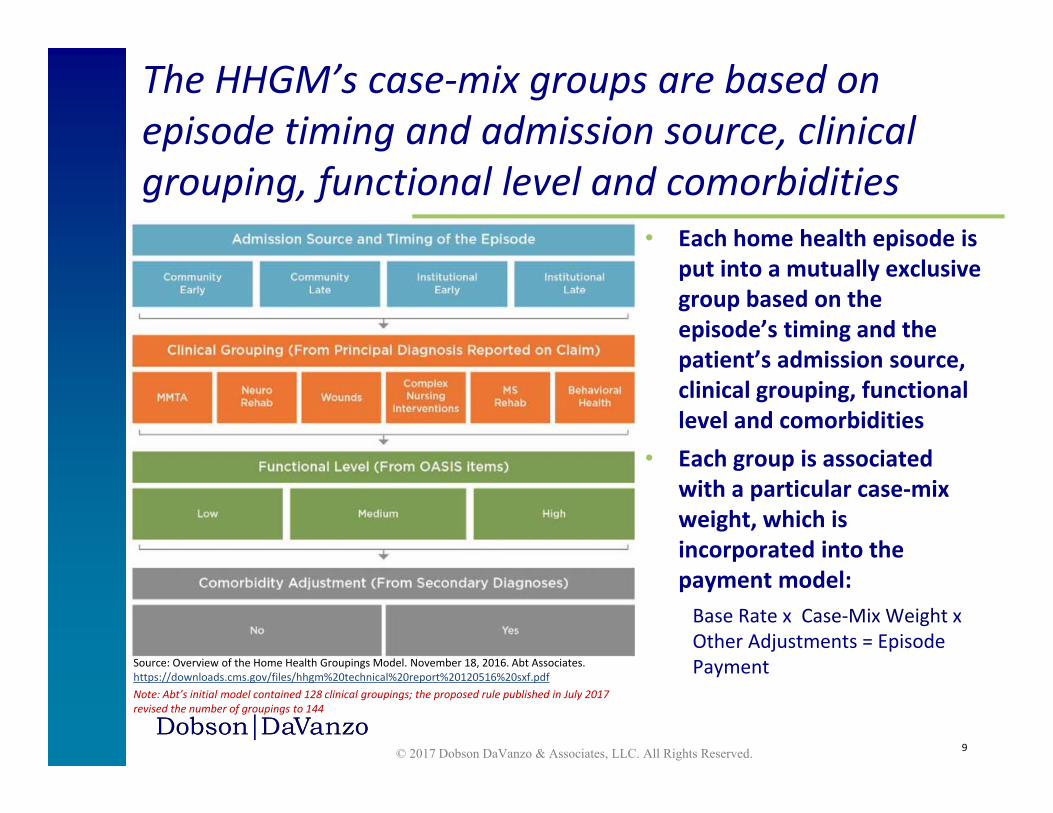
• Each home health episode is put into a mutually exclusive group based on the episode’s timing and the patient’s admission source, clinical grouping, functional level and comorbidities
• Each group is associated with a particular case‐mix weight, which is incorporated into the payment model:Base Rate x Case‐Mix Weight x Other Adjustments = Episode Payment
The HHGM’s case‐mix groups are based on episode timing and admission source, clinical grouping, functional level and comorbidities
© 2017 Dobson DaVanzo & Associates, LLC. All Rights Reserved.
Source: Overview of the Home Health Groupings Model. November 18, 2016. Abt Associates. https://downloads.cms.gov/files/hhgm%20technical%20report%20120516%20sxf.pdfNote: Abt’s initial model contained 128 clinical groupings; the proposed rule published in July 2017 revised the number of groupings to 144
9
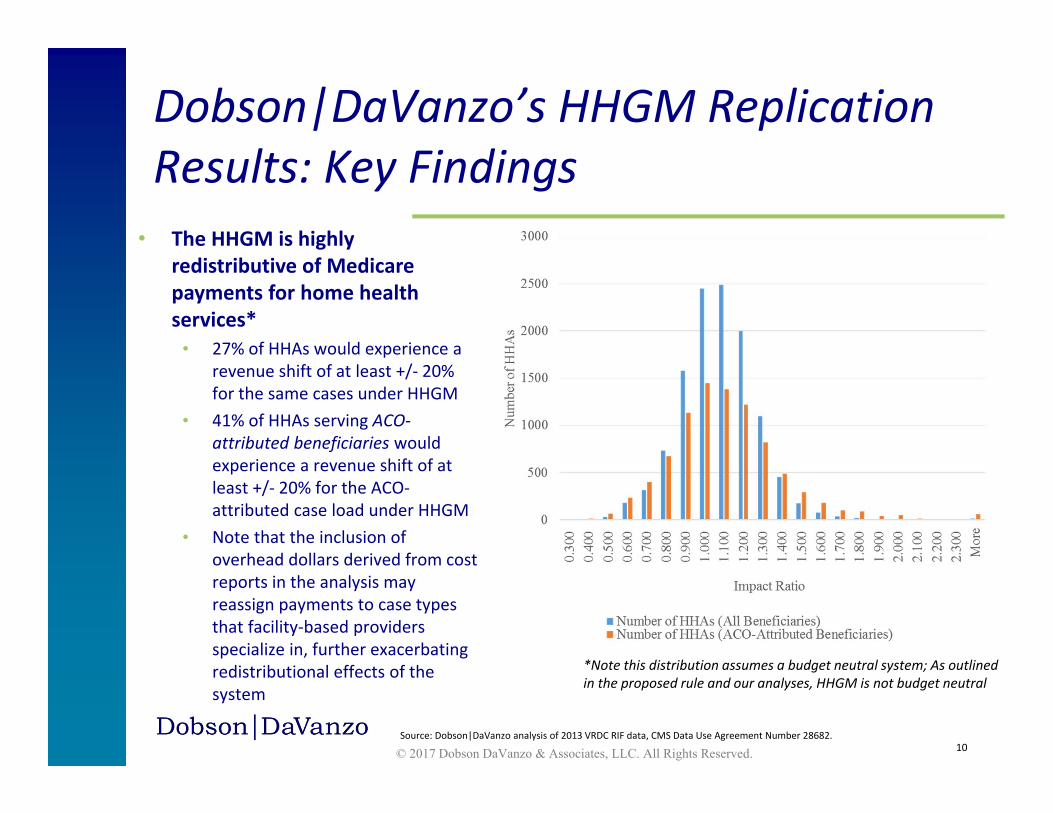
Dobson|DaVanzo’s HHGM Replication Results: Key Findings
© 2017 Dobson DaVanzo & Associates, LLC. All Rights Reserved.
• The HHGM is highly redistributive of Medicare payments for home health services*
• 27% of HHAs would experience a revenue shift of at least +/‐ 20% for the same cases under HHGM
• 41% of HHAs serving ACO‐attributed beneficiaries would experience a revenue shift of at least +/‐ 20% for the ACO‐attributed case load under HHGM
• Note that the inclusion of overhead dollars derived from cost reports in the analysis may reassign payments to case types that facility‐based providers specialize in, further exacerbating redistributional effects of the system
10Source: Dobson|DaVanzo analysis of 2013 VRDC RIF data, CMS Data Use Agreement Number 28682.
*Note this distribution assumes a budget neutral system; As outlined in the proposed rule and our analyses, HHGM is not budget neutral
• As described in the proposed rule, HHGM revenues are derived by:• Calculating the 60‐day base episode payment rate.• Dividing it in half to apply to 30‐day episodes.
• However, the transition from 60‐day episodes to 30‐day episodes invalidates 15.4% of 30‐day episodes without compensating for the decrease in revenues.• In other words, there are periods of time where coverage was paid under
the old system that would no longer be paid under the new system.• The base payment rate is not adjusted to account for this difference.
• There are additional episodes excluded from the analytic file that were paid under current law.• E.g. Episodes that did not link to HHGM clinical group or to an OASIS assessment.• It is unclear what portion of HH PPS payments these cases represent. These may
be largely compensated for in agency coding changes under the HHGM rules.
HHGM is substantially below budget neutral before accounting for possible behavioral offsets
© 2017 Dobson DaVanzo & Associates, LLC. All Rights Reserved. 11
© 2017 Dobson DaVanzo & Associates, LLC. All Rights Reserved. 12
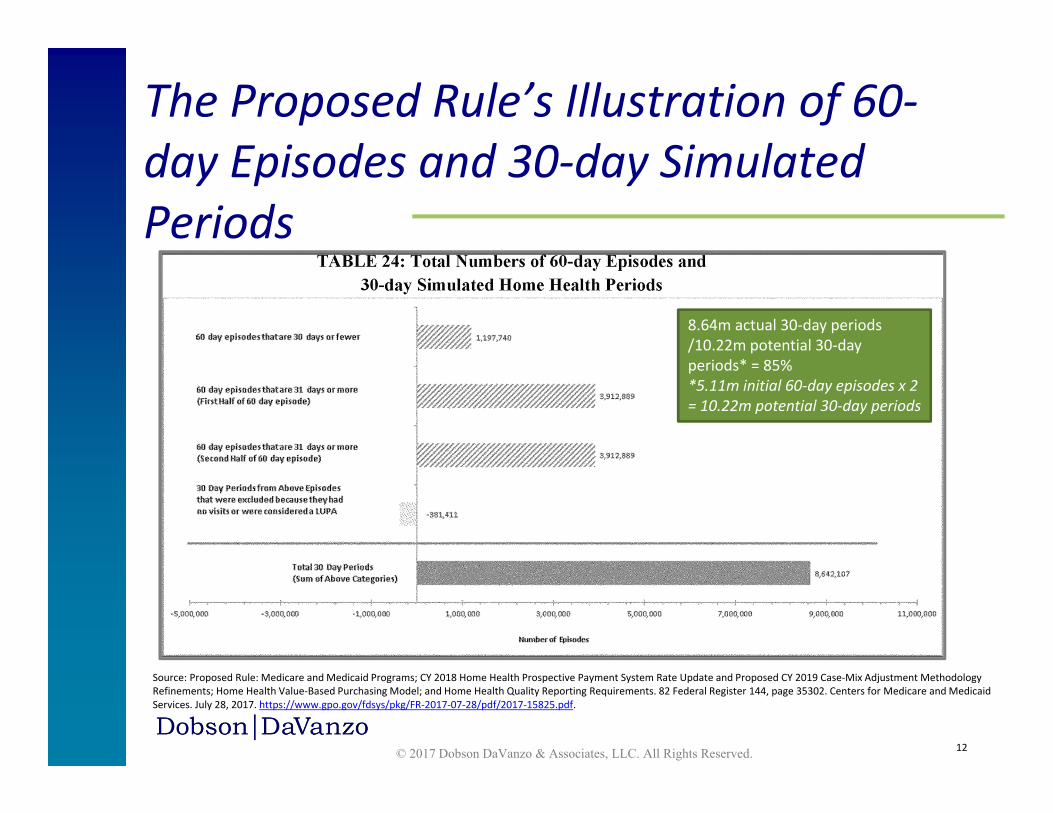
The Proposed Rule’s Illustration of 60‐day Episodes and 30‐day Simulated Periods
Source: Proposed Rule: Medicare and Medicaid Programs; CY 2018 Home Health Prospective Payment System Rate Update and Proposed CY 2019 Case‐Mix Adjustment Methodology Refinements; Home Health Value‐Based Purchasing Model; and Home Health Quality Reporting Requirements. 82 Federal Register 144, page 35302. Centers for Medicare and Medicaid Services. July 28, 2017. https://www.gpo.gov/fdsys/pkg/FR‐2017‐07‐28/pdf/2017‐15825.pdf.
8.64m actual 30‐day periods /10.22m potential 30‐day periods* = 85%*5.11m initial 60‐day episodes x 2 = 10.22m potential 30‐day periods
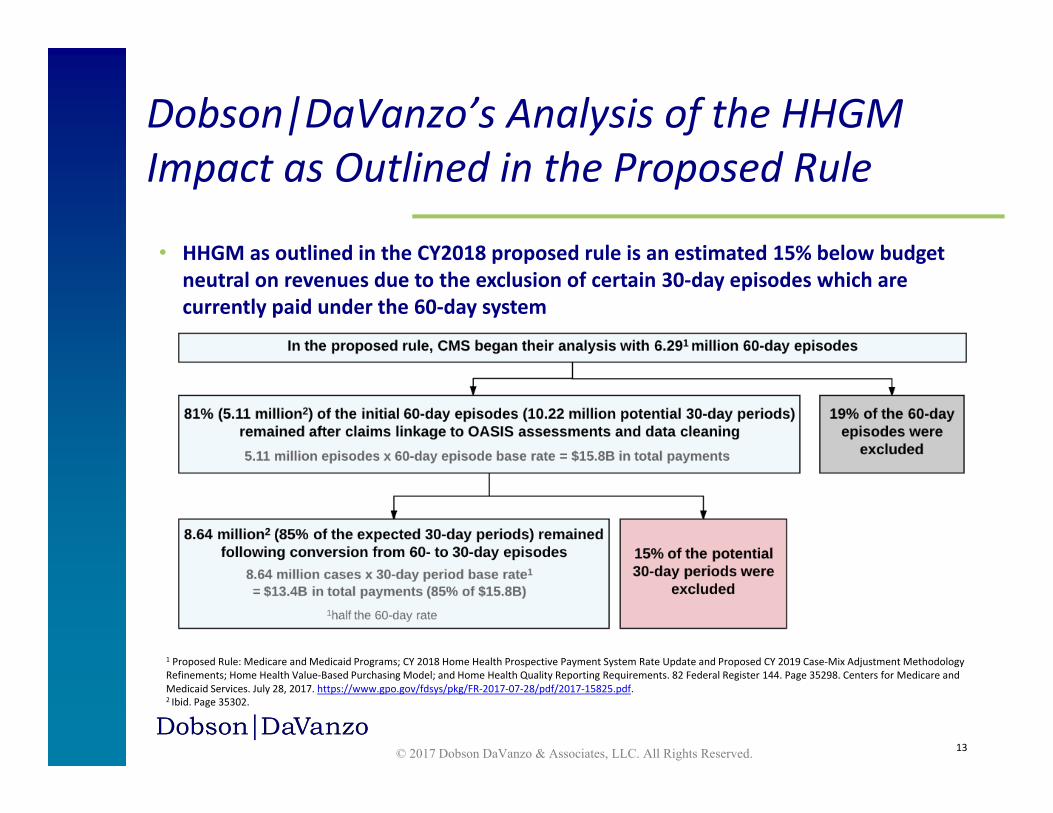
• HHGM as outlined in the CY2018 proposed rule is an estimated 15% below budget neutral on revenues due to the exclusion of certain 30‐day episodes which are currently paid under the 60‐day system
© 2017 Dobson DaVanzo & Associates, LLC. All Rights Reserved. 13
Dobson|DaVanzo’s Analysis of the HHGM Impact as Outlined in the Proposed Rule
1 Proposed Rule: Medicare and Medicaid Programs; CY 2018 Home Health Prospective Payment System Rate Update and Proposed CY 2019 Case‐Mix Adjustment Methodology Refinements; Home Health Value‐Based Purchasing Model; and Home Health Quality Reporting Requirements. 82 Federal Register 144. Page 35298. Centers for Medicare and Medicaid Services. July 28, 2017. https://www.gpo.gov/fdsys/pkg/FR‐2017‐07‐28/pdf/2017‐15825.pdf. 2 Ibid. Page 35302.
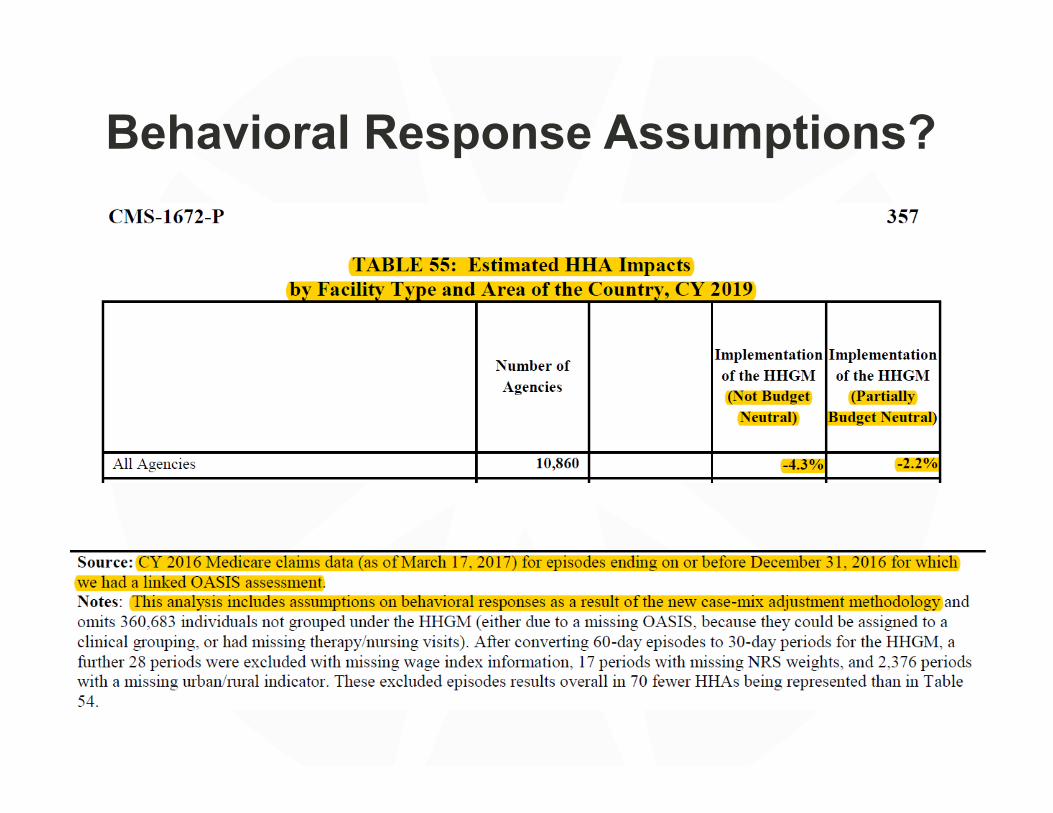
Behavioral Response Assumptions?
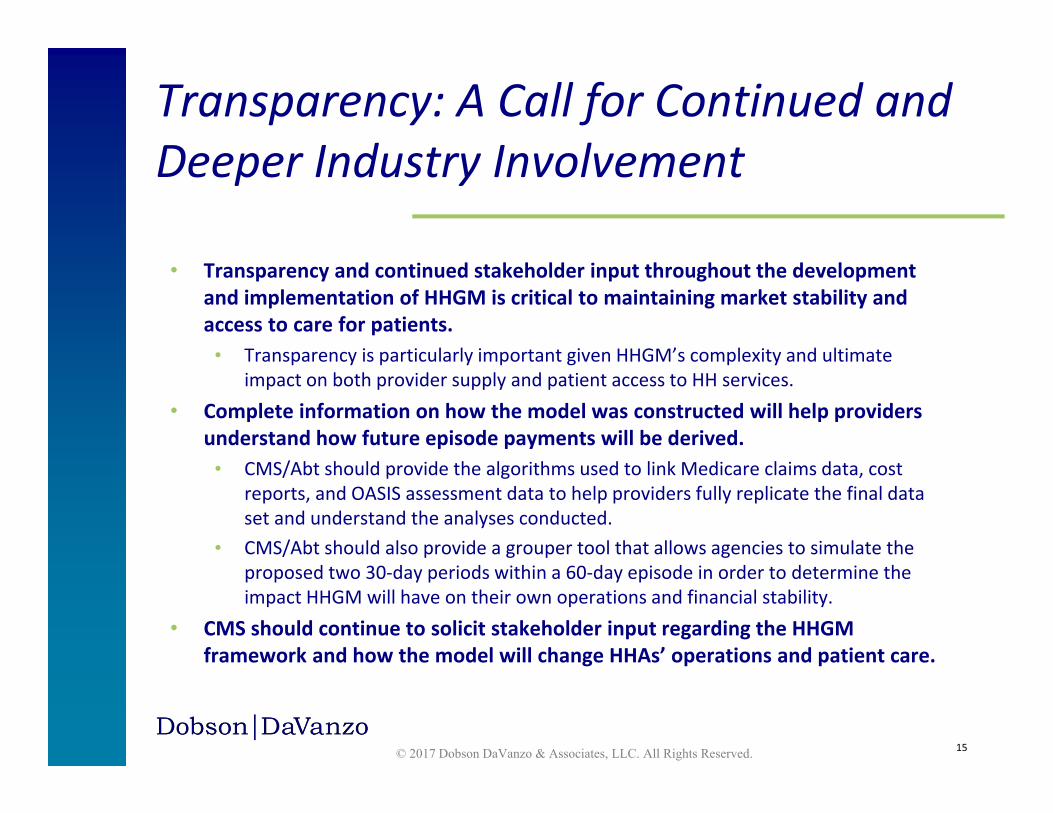
• Transparency and continued stakeholder input throughout the development and implementation of HHGM is critical to maintaining market stability and access to care for patients.
• Transparency is particularly important given HHGM’s complexity and ultimate impact on both provider supply and patient access to HH services.
• Complete information on how the model was constructed will help providers understand how future episode payments will be derived.
• CMS/Abt should provide the algorithms used to link Medicare claims data, cost reports, and OASIS assessment data to help providers fully replicate the final data set and understand the analyses conducted.
• CMS/Abt should also provide a grouper tool that allows agencies to simulate the proposed two 30‐day periods within a 60‐day episode in order to determine the impact HHGM will have on their own operations and financial stability.
• CMS should continue to solicit stakeholder input regarding the HHGM framework and how the model will change HHAs’ operations and patient care.
Transparency: A Call for Continued and Deeper Industry Involvement
© 2017 Dobson DaVanzo & Associates, LLC. All Rights Reserved. 15
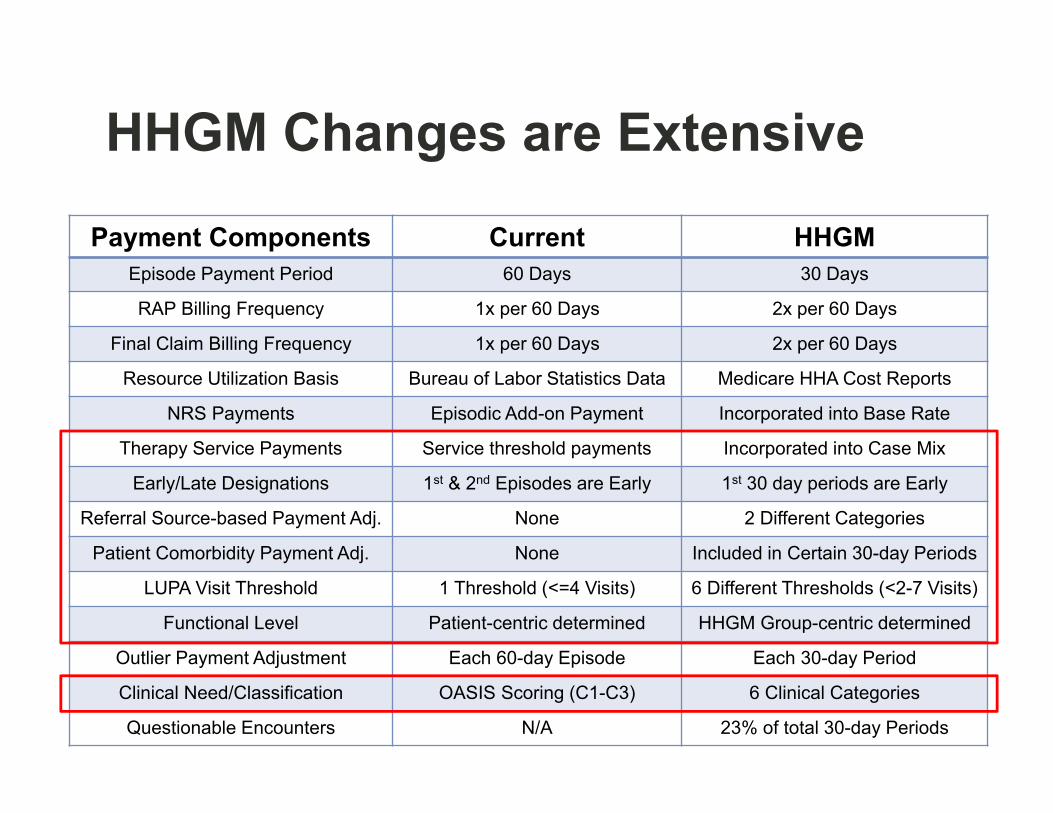
HHGM Changes are Extensive
Payment Components Current HHGMEpisode Payment Period 60 Days 30 Days
RAP Billing Frequency 1x per 60 Days 2x per 60 Days
Final Claim Billing Frequency 1x per 60 Days 2x per 60 Days
Resource Utilization Basis Bureau of Labor Statistics Data Medicare HHA Cost Reports
NRS Payments Episodic Add-on Payment Incorporated into Base Rate
Therapy Service Payments Service threshold payments Incorporated into Case Mix
Early/Late Designations 1st & 2nd Episodes are Early 1st 30 day periods are Early
Referral Source-based Payment Adj. None 2 Different Categories
Patient Comorbidity Payment Adj. None Included in Certain 30-day Periods
LUPA Visit Threshold 1 Threshold (<=4 Visits) 6 Different Thresholds (<2-7 Visits)
Functional Level Patient-centric determined HHGM Group-centric determined
Outlier Payment Adjustment Each 60-day Episode Each 30-day Period
Clinical Need/Classification OASIS Scoring (C1-C3) 6 Clinical Categories
Questionable Encounters N/A 23% of total 30-day Periods
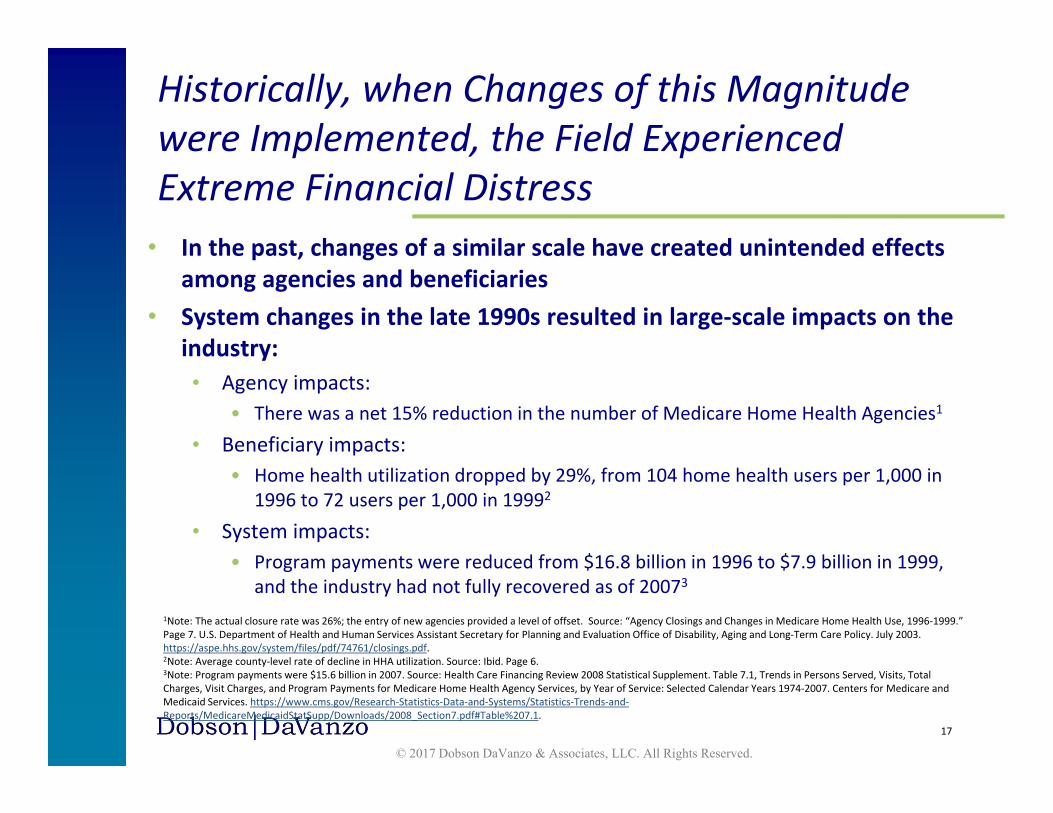
Historically, when Changes of this Magnitude were Implemented, the Field Experienced Extreme Financial Distress
• In the past, changes of a similar scale have created unintended effects among agencies and beneficiaries
• System changes in the late 1990s resulted in large‐scale impacts on the industry:• Agency impacts:
• There was a net 15% reduction in the number of Medicare Home Health Agencies1
• Beneficiary impacts: • Home health utilization dropped by 29%, from 104 home health users per 1,000 in
1996 to 72 users per 1,000 in 19992
• System impacts: • Program payments were reduced from $16.8 billion in 1996 to $7.9 billion in 1999,
and the industry had not fully recovered as of 20073
17
© 2017 Dobson DaVanzo & Associates, LLC. All Rights Reserved.
1Note: The actual closure rate was 26%; the entry of new agencies provided a level of offset. Source: “Agency Closings and Changes in Medicare Home Health Use, 1996‐1999.” Page 7. U.S. Department of Health and Human Services Assistant Secretary for Planning and Evaluation Office of Disability, Aging and Long‐Term Care Policy. July 2003. https://aspe.hhs.gov/system/files/pdf/74761/closings.pdf. 2Note: Average county‐level rate of decline in HHA utilization. Source: Ibid. Page 6. 3Note: Program payments were $15.6 billion in 2007. Source: Health Care Financing Review 2008 Statistical Supplement. Table 7.1, Trends in Persons Served, Visits, Total Charges, Visit Charges, and Program Payments for Medicare Home Health Agency Services, by Year of Service: Selected Calendar Years 1974‐2007. Centers for Medicare and Medicaid Services. https://www.cms.gov/Research‐Statistics‐Data‐and‐Systems/Statistics‐Trends‐and‐Reports/MedicareMedicaidStatSupp/Downloads/2008_Section7.pdf#Table%207.1.
Points to Consider
© 2017 Dobson DaVanzo & Associates, LLC. All Rights Reserved. 18
• The HHGM represents a major shift from the current payment system • The HHGM has the potential to significantly redistribute payments
and revenues • By setting costs equal to payments, the HHGM essentially rebases the
system to a lower level• Paired with the lack of budget neutrality, the HHGM would stress the
system in compounding ways and potentially create unintended consequences
• Historically, changes of this magnitude have placed agencies in jeopardy, with negative impacts on beneficiaries, providers, and the post‐acute care landscape
Materials Recently Made Available
What’s Ahead? SummaryIn spite of the challenges, we KNOW that home-based care is vital to our nation’s healthcare future
• Our country cannot afford a care delivery system that at its core lacks a thriving, effective and efficient home health industry.
• Technology will continue to allow better care to be provided in the most cost-effective and patient-preferred setting—the home.
Our industry MUST effectively illustrate and share our value proposition
• We have countless amazing stories of helping and healing in the home• Shame on us if we don’t believe enough in what we do to tell our
stories
“With Great Knowledge Comes Great Responsibility” • We must collect, analyze, interpret, understand, and use our data• Data is a powerful resource that allows us to standardize our care with
respect to clinically appropriate and cost-effective interventions