Embed Size (px)
Citation preview
December 2011
Hotels & Tourism Conference
Section Particulars
Section – I Tourism & Hospitality Industry Overview
Table of Contents
Section – I Tourism & Hospitality Industry Overview
Section – II Investment Rationale & Change in Business Model
Section – III Government Initiatives & Investments in the Industry
Section – IV Financial Norms from a Debt and Equity Perspective
Section – V Emerging Financing Opportunities in Hospitality
Section – VI Case Studies
Section – I: Tourism & Hospitality Industry Overview
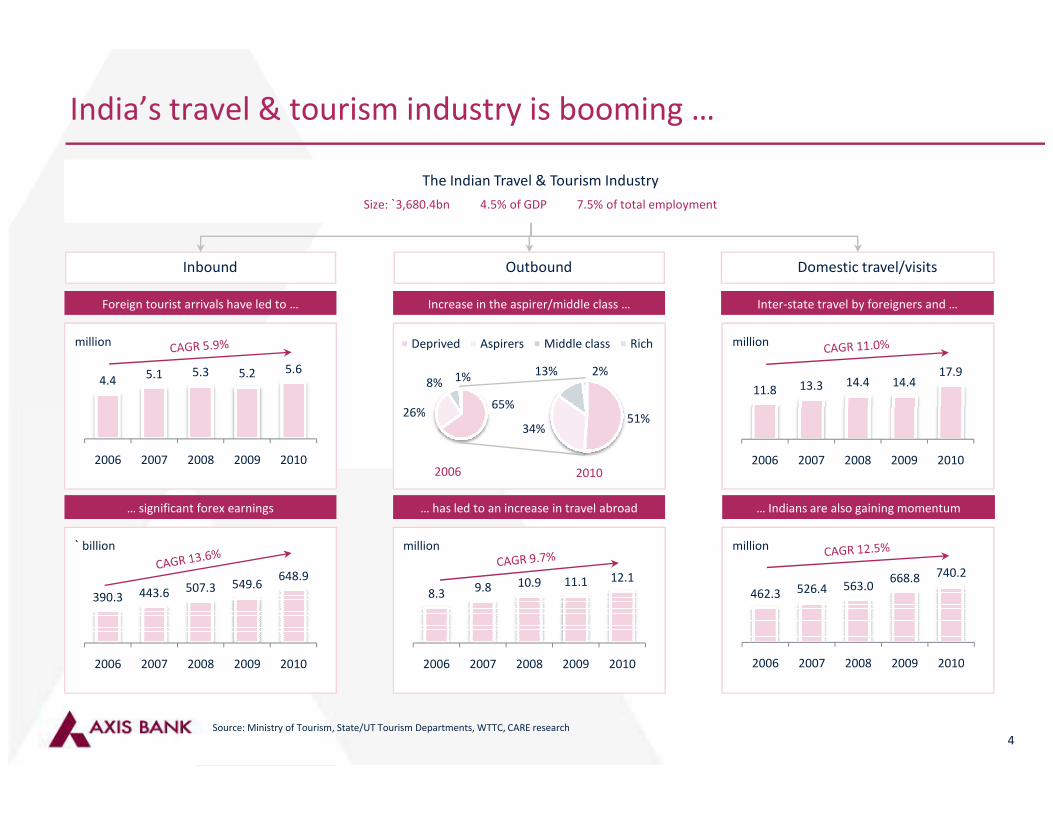
65%26%
8% 1%
Deprived Aspirers Middle class Rich
13% 2%
India’s travel & tourism industry is booming …
Inbound Outbound Domestic travel/visits
4.4 5.1 5.3 5.2 5.6
million million
Foreign tourist arrivals have led to … Increase in the aspirer/middle class … Inter-state travel by foreigners and …
The Indian Travel & Tourism Industry
Size: `3,680.4bn 4.5% of GDP 7.5% of total employment
11.8 13.3 14.4 14.4 17.9
million
65%26% 51%
34%
4Source: Ministry of Tourism, State/UT Tourism Departments, WTTC, CARE research
2006 2007 2008 2009 2010
390.3 443.6 507.3 549.6 648.9
2006 2007 2008 2009 2010
8.3 9.8 10.9 11.1 12.1
2006 2007 2008 2009 2010
` billion million
… significant forex earnings … has led to an increase in travel abroad
2006 20102006 2007 2008 2009 2010
462.3 526.4 563.0 668.8 740.2
2006 2007 2008 2009 2010
… Indians are also gaining momentum
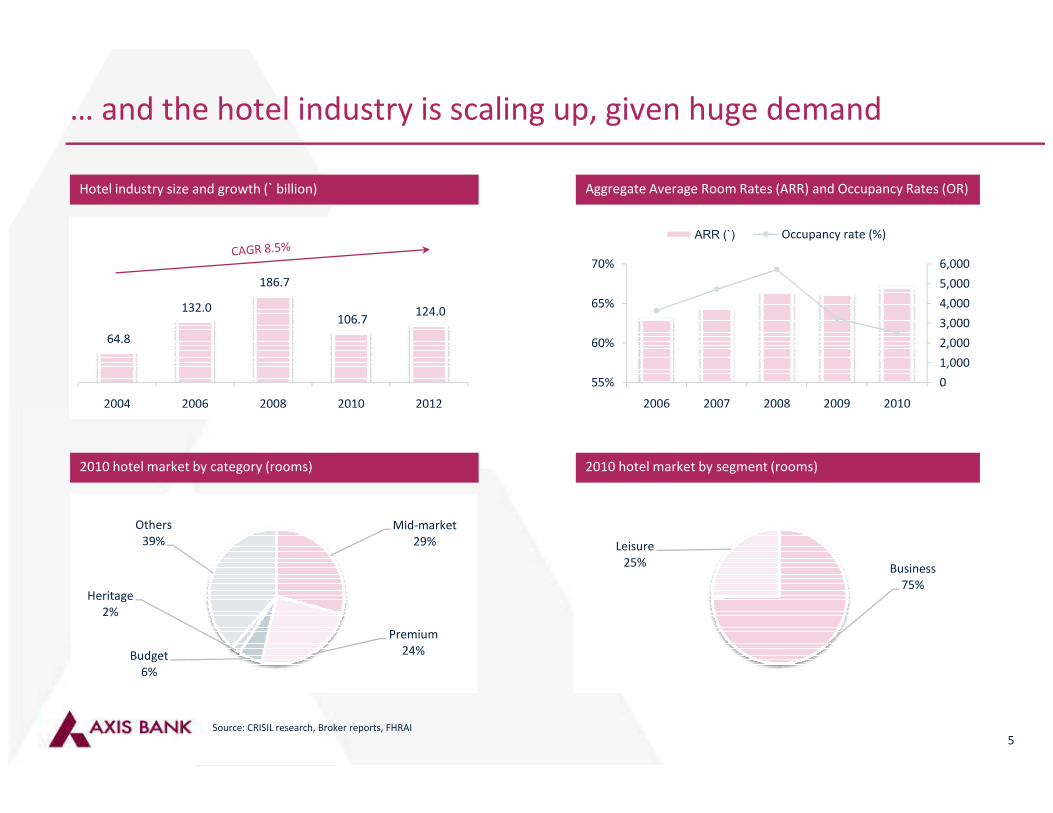
… and the hotel industry is scaling up, given huge demand
Hotel industry size and growth (` billion) Aggregate Average Room Rates (ARR) and Occupancy Rates (OR)
64.8
132.0
186.7
106.7 124.0
2004 2006 2008 2010 2012
55%
60%
65%
70%
2006 2007 2008 2009 2010
0
1,000
2,000
3,000
4,000
5,000
6,000
ARR (`) Occupancy rate (%)
5Source: CRISIL research, Broker reports, FHRAI
2010 hotel market by category (rooms) 2010 hotel market by segment (rooms)
2004 2006 2008 2010 2012 2006 2007 2008 2009 2010
Mid-market
29%
Premium
24%Budget
6%
Heritage
2%
Others
39%
Business
75%
Leisure
25%
Section – II: Investment Rationale & Change in Business Model
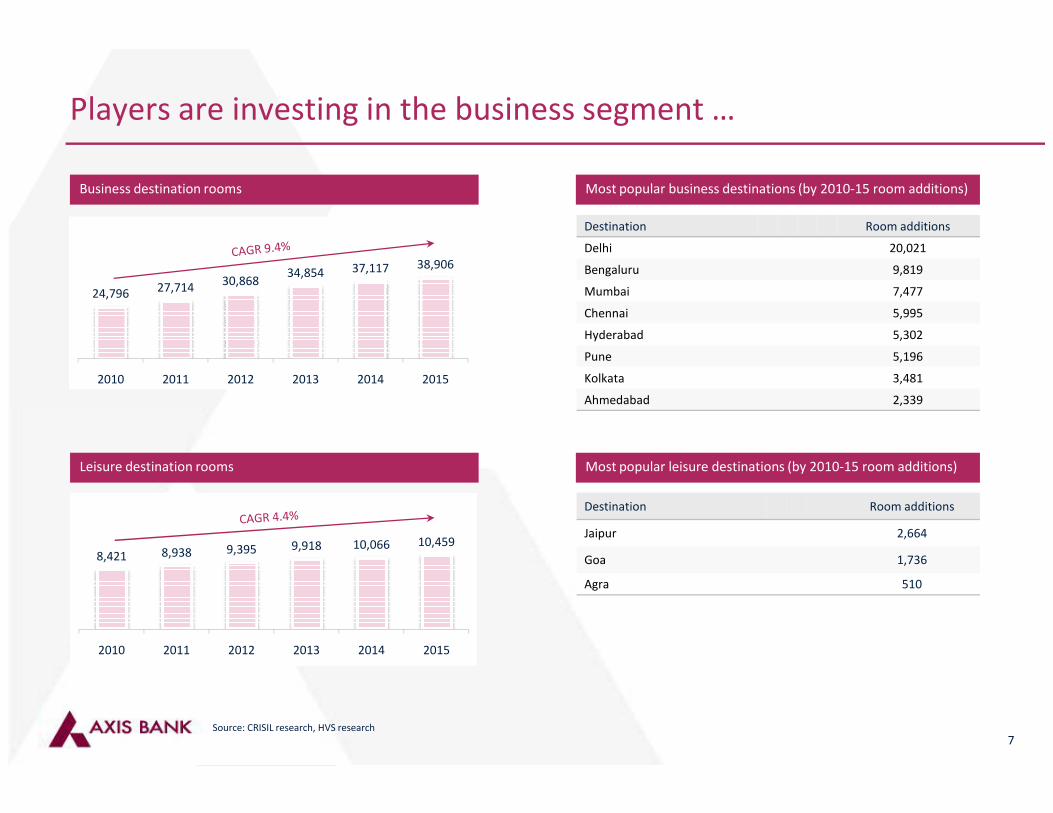
Players are investing in the business segment …
Business destination rooms Most popular business destinations (by 2010-15 room additions)
24,796 27,714 30,868
34,854 37,117 38,906
2010 2011 2012 2013 2014 2015
Destination Room additions
Delhi 20,021
Bengaluru 9,819
Mumbai 7,477
Chennai 5,995
Hyderabad 5,302
Pune 5,196
Kolkata 3,481
Ahmedabad 2,339
7
Leisure destination rooms Most popular leisure destinations (by 2010-15 room additions)
Destination Room additions
Jaipur 2,664
Goa 1,736
Agra 510
Source: CRISIL research, HVS research
8,421 8,938 9,395 9,918 10,066 10,459
2010 2011 2012 2013 2014 2015
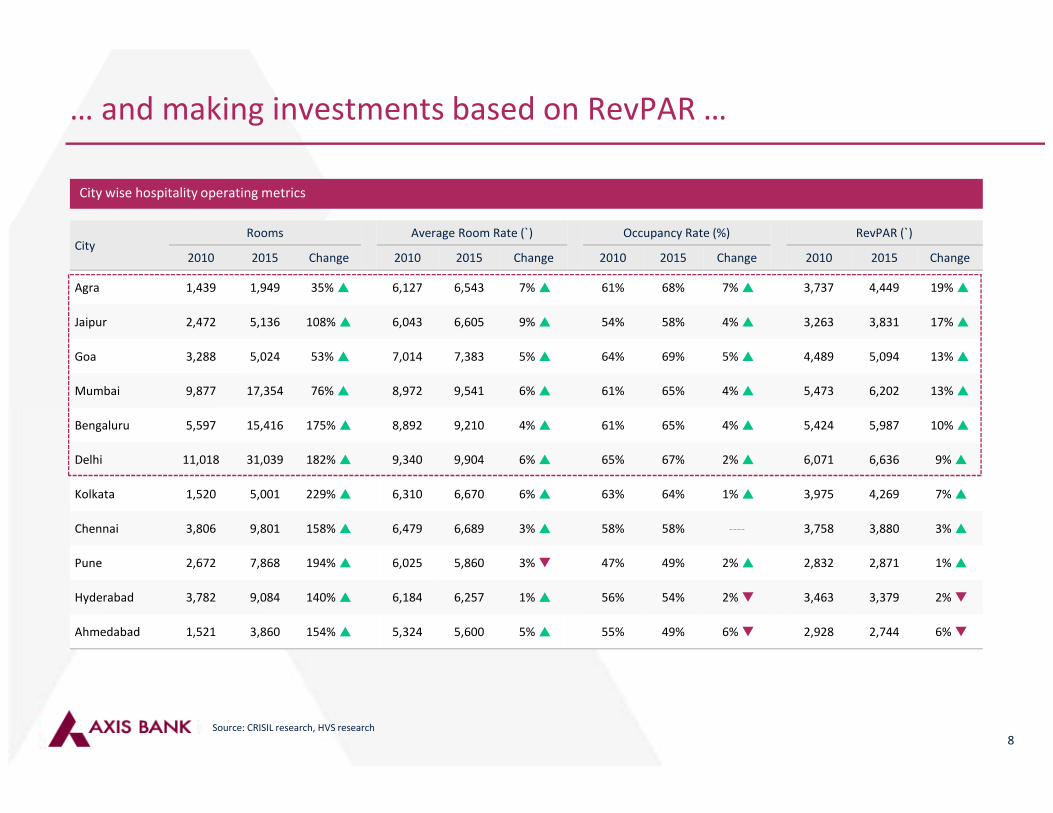
… and making investments based on RevPAR …
CityRooms Average Room Rate (`) Occupancy Rate (%) RevPAR (`)
2010 2015 Change 2010 2015 Change 2010 2015 Change 2010 2015 Change
Agra 1,439 1,949 35% � 6,127 6,543 7% � 61% 68% 7% � 3,737 4,449 19% �
Jaipur 2,472 5,136 108% � 6,043 6,605 9% � 54% 58% 4% � 3,263 3,831 17% �
Goa 3,288 5,024 53% � 7,014 7,383 5% � 64% 69% 5% � 4,489 5,094 13% �
Mumbai 9,877 17,354 76% � 8,972 9,541 6% � 61% 65% 4% � 5,473 6,202 13% �
City wise hospitality operating metrics
8
Bengaluru 5,597 15,416 175% � 8,892 9,210 4% � 61% 65% 4% � 5,424 5,987 10% �
Delhi 11,018 31,039 182% � 9,340 9,904 6% � 65% 67% 2% � 6,071 6,636 9% �
Kolkata 1,520 5,001 229% � 6,310 6,670 6% � 63% 64% 1% � 3,975 4,269 7% �
Chennai 3,806 9,801 158% � 6,479 6,689 3% � 58% 58% ---- 3,758 3,880 3% �
Pune 2,672 7,868 194% � 6,025 5,860 3% � 47% 49% 2% � 2,832 2,871 1% �
Hyderabad 3,782 9,084 140% � 6,184 6,257 1% � 56% 54% 2% � 3,463 3,379 2% �
Ahmedabad 1,521 3,860 154% � 5,324 5,600 5% � 55% 49% 6% � 2,928 2,744 6% �
Source: CRISIL research, HVS research
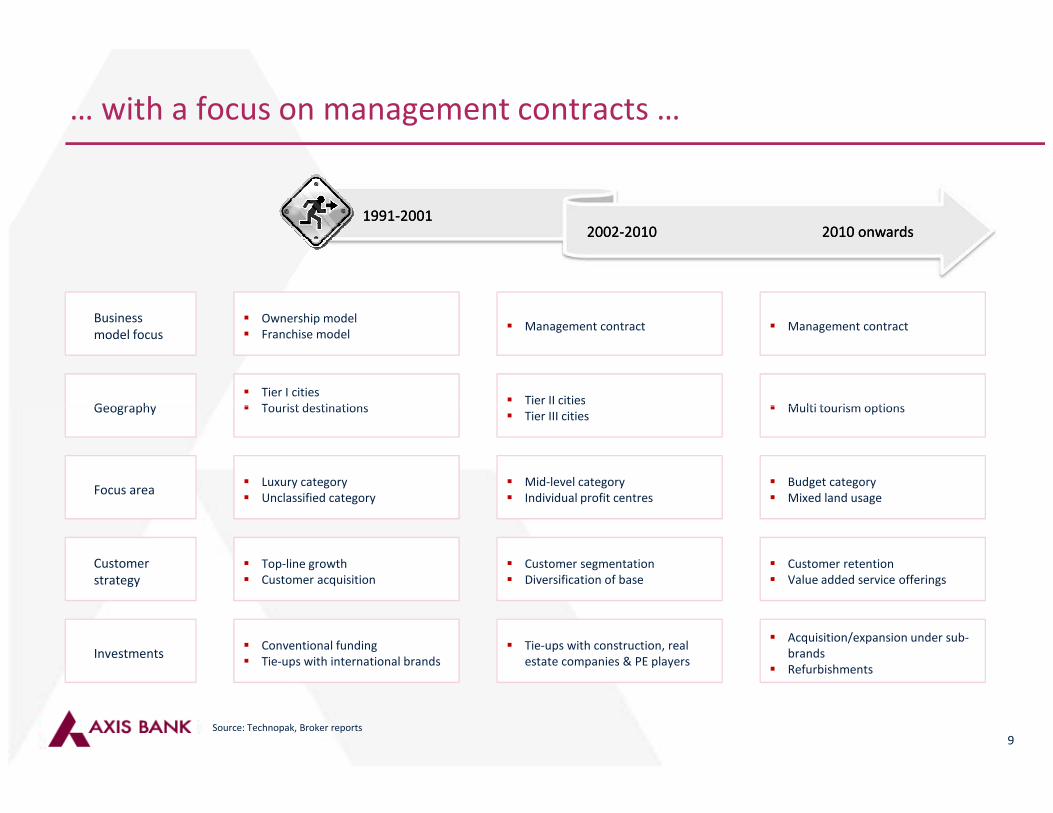
… with a focus on management contracts …
� Ownership model
� Franchise model� Management contract � Management contract
Business
model focus
1991-20011991-20012002-20102002-2010 2010 onwards2010 onwards
� Tier I cities
� Tourist destinations� Tier II cities
� Multi tourism optionsGeography
9
� Tourist destinations�
� Tier III cities� Multi tourism optionsGeography
� Luxury category
� Unclassified category
� Mid-level category
� Individual profit centres
� Budget category
� Mixed land usageFocus area
� Top-line growth
� Customer acquisition
� Customer segmentation
� Diversification of base
� Customer retention
� Value added service offerings
Customer
strategy
� Conventional funding
� Tie-ups with international brands
� Tie-ups with construction, real
estate companies & PE players
� Acquisition/expansion under sub-
brands
� Refurbishments
Investments
Source: Technopak, Broker reports
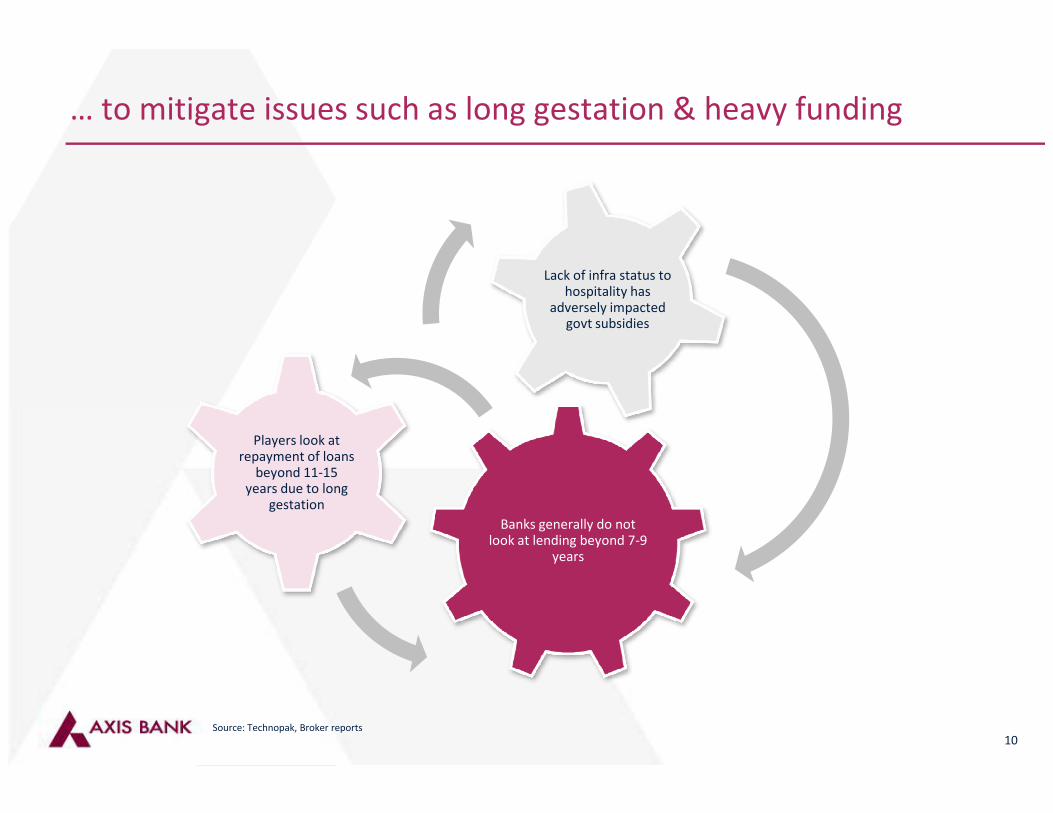
… to mitigate issues such as long gestation & heavy funding
Lack of infra status to hospitality has
adversely impacted govt subsidies
10
Banks generally do not look at lending beyond 7-9
years
Players look at repayment of loans
beyond 11-15 years due to long
gestation
Source: Technopak, Broker reports

Section – III: Government Initiatives & Investments in the Industry
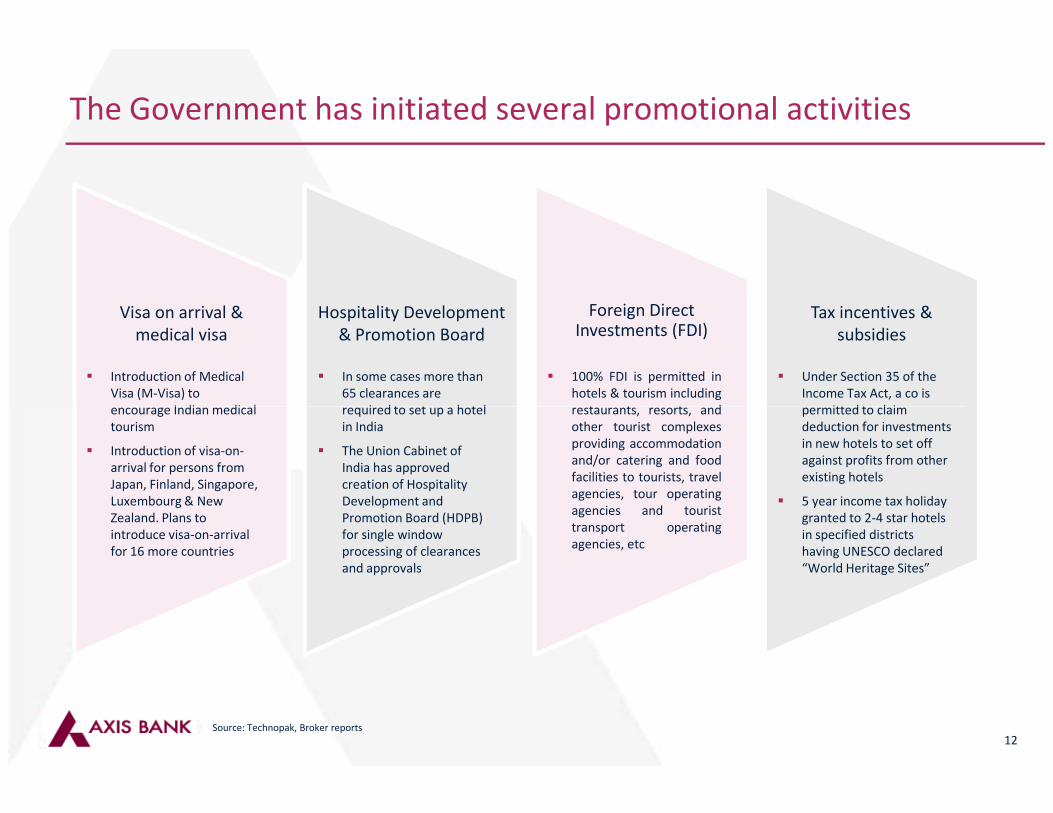
The Government has initiated several promotional activities
Visa on arrival &
medical visa
Hospitality Development
& Promotion Board
Foreign Direct Investments (FDI)
Tax incentives &
subsidies
� Introduction of Medical
Visa (M-Visa) to
encourage Indian medical
� In some cases more than
65 clearances are
required to set up a hotel
� 100% FDI is permitted in
hotels & tourism including
restaurants, resorts, and
� Under Section 35 of the
Income Tax Act, a co is
permitted to claim
12
encourage Indian medical
tourism
� Introduction of visa-on-
arrival for persons from
Japan, Finland, Singapore,
Luxembourg & New
Zealand. Plans to
introduce visa-on-arrival
for 16 more countries
required to set up a hotel
in India
� The Union Cabinet of
India has approved
creation of Hospitality
Development and
Promotion Board (HDPB)
for single window
processing of clearances
and approvals
restaurants, resorts, and
other tourist complexes
providing accommodation
and/or catering and food
facilities to tourists, travel
agencies, tour operating
agencies and tourist
transport operating
agencies, etc
permitted to claim
deduction for investments
in new hotels to set off
against profits from other
existing hotels
� 5 year income tax holiday
granted to 2-4 star hotels
in specified districts
having UNESCO declared
“World Heritage Sites”
Source: Technopak, Broker reports
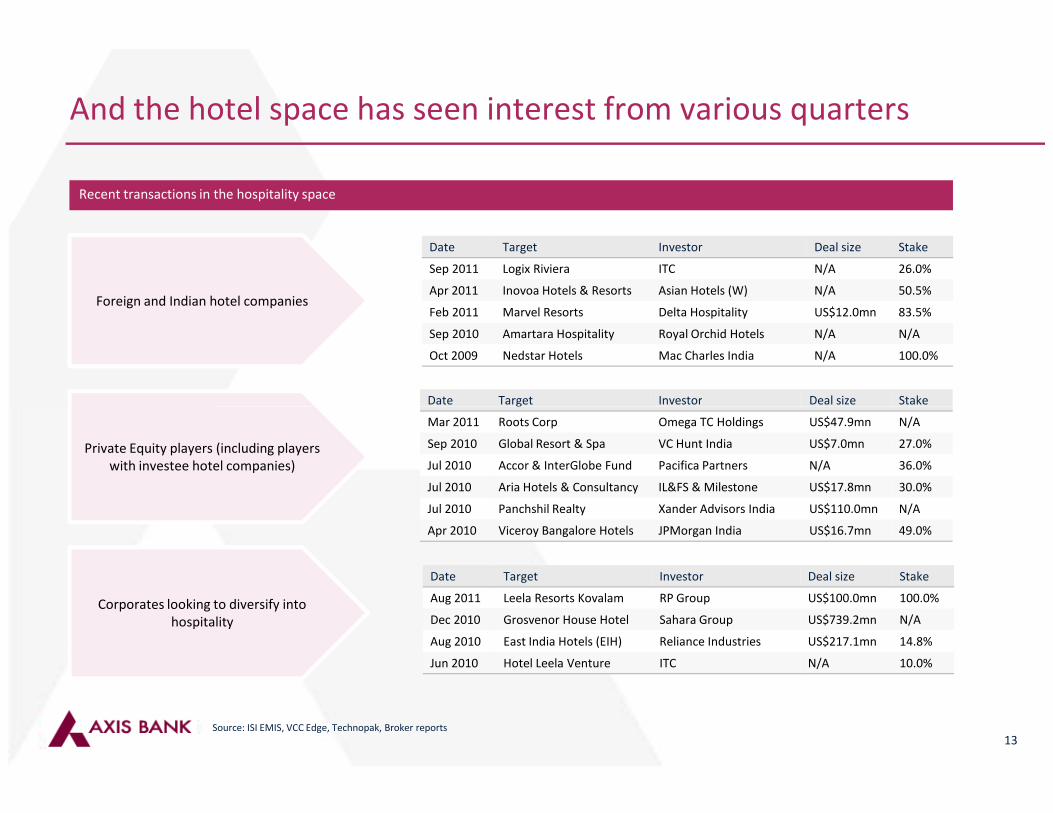
And the hotel space has seen interest from various quarters
Date Target Investor Deal size Stake
Sep 2011 Logix Riviera ITC N/A 26.0%
Apr 2011 Inovoa Hotels & Resorts Asian Hotels (W) N/A 50.5%
Feb 2011 Marvel Resorts Delta Hospitality US$12.0mn 83.5%
Sep 2010 Amartara Hospitality Royal Orchid Hotels N/A N/A
Oct 2009 Nedstar Hotels Mac Charles India N/A 100.0%
Date Target Investor Deal size Stake
Foreign and Indian hotel companies
Recent transactions in the hospitality space
13Source: ISI EMIS, VCC Edge, Technopak, Broker reports
Mar 2011 Roots Corp Omega TC Holdings US$47.9mn N/A
Sep 2010 Global Resort & Spa VC Hunt India US$7.0mn 27.0%
Jul 2010 Accor & InterGlobe Fund Pacifica Partners N/A 36.0%
Jul 2010 Aria Hotels & Consultancy IL&FS & Milestone US$17.8mn 30.0%
Jul 2010 Panchshil Realty Xander Advisors India US$110.0mn N/A
Apr 2010 Viceroy Bangalore Hotels JPMorgan India US$16.7mn 49.0%
Date Target Investor Deal size Stake
Aug 2011 Leela Resorts Kovalam RP Group US$100.0mn 100.0%
Dec 2010 Grosvenor House Hotel Sahara Group US$739.2mn N/A
Aug 2010 East India Hotels (EIH) Reliance Industries US$217.1mn 14.8%
Jun 2010 Hotel Leela Venture ITC N/A 10.0%
Private Equity players (including players
with investee hotel companies)
Corporates looking to diversify into
hospitality
Section – IV: Financial Norms from a Debt and Equity Perspective
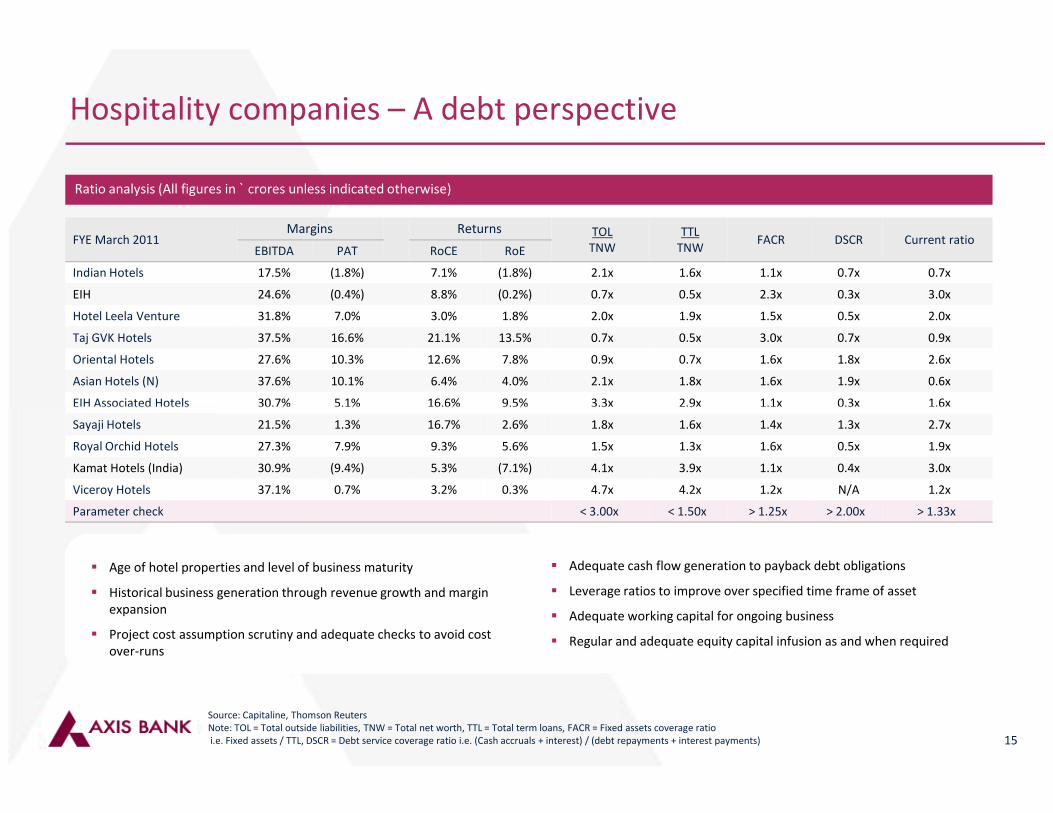
Hospitality companies – A debt perspective
FYE March 2011Margins Returns TOL
TNW
TTL
TNWFACR DSCR Current ratio
EBITDA PAT RoCE RoE
Indian Hotels 17.5% (1.8%) 7.1% (1.8%) 2.1x 1.6x 1.1x 0.7x 0.7x
EIH 24.6% (0.4%) 8.8% (0.2%) 0.7x 0.5x 2.3x 0.3x 3.0x
Hotel Leela Venture 31.8% 7.0% 3.0% 1.8% 2.0x 1.9x 1.5x 0.5x 2.0x
Taj GVK Hotels 37.5% 16.6% 21.1% 13.5% 0.7x 0.5x 3.0x 0.7x 0.9x
Oriental Hotels 27.6% 10.3% 12.6% 7.8% 0.9x 0.7x 1.6x 1.8x 2.6x
Asian Hotels (N) 37.6% 10.1% 6.4% 4.0% 2.1x 1.8x 1.6x 1.9x 0.6x
EIH Associated Hotels 30.7% 5.1% 16.6% 9.5% 3.3x 2.9x 1.1x 0.3x 1.6x
Ratio analysis (All figures in ` crores unless indicated otherwise)
15
EIH Associated Hotels 30.7% 5.1% 16.6% 9.5% 3.3x 2.9x 1.1x 0.3x 1.6x
Sayaji Hotels 21.5% 1.3% 16.7% 2.6% 1.8x 1.6x 1.4x 1.3x 2.7x
Royal Orchid Hotels 27.3% 7.9% 9.3% 5.6% 1.5x 1.3x 1.6x 0.5x 1.9x
Kamat Hotels (India) 30.9% (9.4%) 5.3% (7.1%) 4.1x 3.9x 1.1x 0.4x 3.0x
Viceroy Hotels 37.1% 0.7% 3.2% 0.3% 4.7x 4.2x 1.2x N/A 1.2x
Parameter check < 3.00x < 1.50x > 1.25x > 2.00x > 1.33x
� Age of hotel properties and level of business maturity
� Historical business generation through revenue growth and margin
expansion
� Project cost assumption scrutiny and adequate checks to avoid cost
over-runs
� Adequate cash flow generation to payback debt obligations
� Leverage ratios to improve over specified time frame of asset
� Adequate working capital for ongoing business
� Regular and adequate equity capital infusion as and when required
Source: Capitaline, Thomson Reuters
Note: TOL = Total outside liabilities, TNW = Total net worth, TTL = Total term loans, FACR = Fixed assets coverage ratio
i.e. Fixed assets / TTL, DSCR = Debt service coverage ratio i.e. (Cash accruals + interest) / (debt repayments + interest payments)
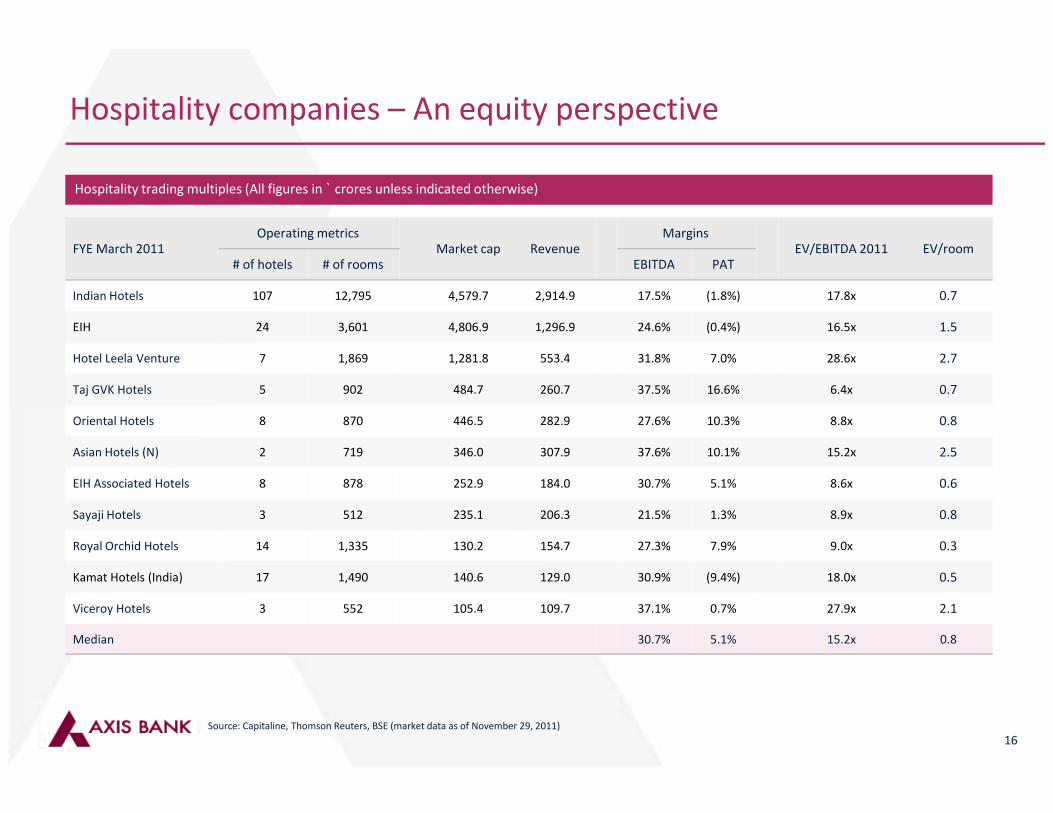
Hospitality companies – An equity perspective
FYE March 2011Operating metrics
Market cap RevenueMargins
EV/EBITDA 2011 EV/room# of hotels # of rooms EBITDA PAT
Indian Hotels 107 12,795 4,579.7 2,914.9 17.5% (1.8%) 17.8x 0.7
EIH 24 3,601 4,806.9 1,296.9 24.6% (0.4%) 16.5x 1.5
Hotel Leela Venture 7 1,869 1,281.8 553.4 31.8% 7.0% 28.6x 2.7
Taj GVK Hotels 5 902 484.7 260.7 37.5% 16.6% 6.4x 0.7
Hospitality trading multiples (All figures in ` crores unless indicated otherwise)
16
Oriental Hotels 8 870 446.5 282.9 27.6% 10.3% 8.8x 0.8
Asian Hotels (N) 2 719 346.0 307.9 37.6% 10.1% 15.2x 2.5
EIH Associated Hotels 8 878 252.9 184.0 30.7% 5.1% 8.6x 0.6
Sayaji Hotels 3 512 235.1 206.3 21.5% 1.3% 8.9x 0.8
Royal Orchid Hotels 14 1,335 130.2 154.7 27.3% 7.9% 9.0x 0.3
Kamat Hotels (India) 17 1,490 140.6 129.0 30.9% (9.4%) 18.0x 0.5
Viceroy Hotels 3 552 105.4 109.7 37.1% 0.7% 27.9x 2.1
Median 30.7% 5.1% 15.2x 0.8
Source: Capitaline, Thomson Reuters, BSE (market data as of November 29, 2011)
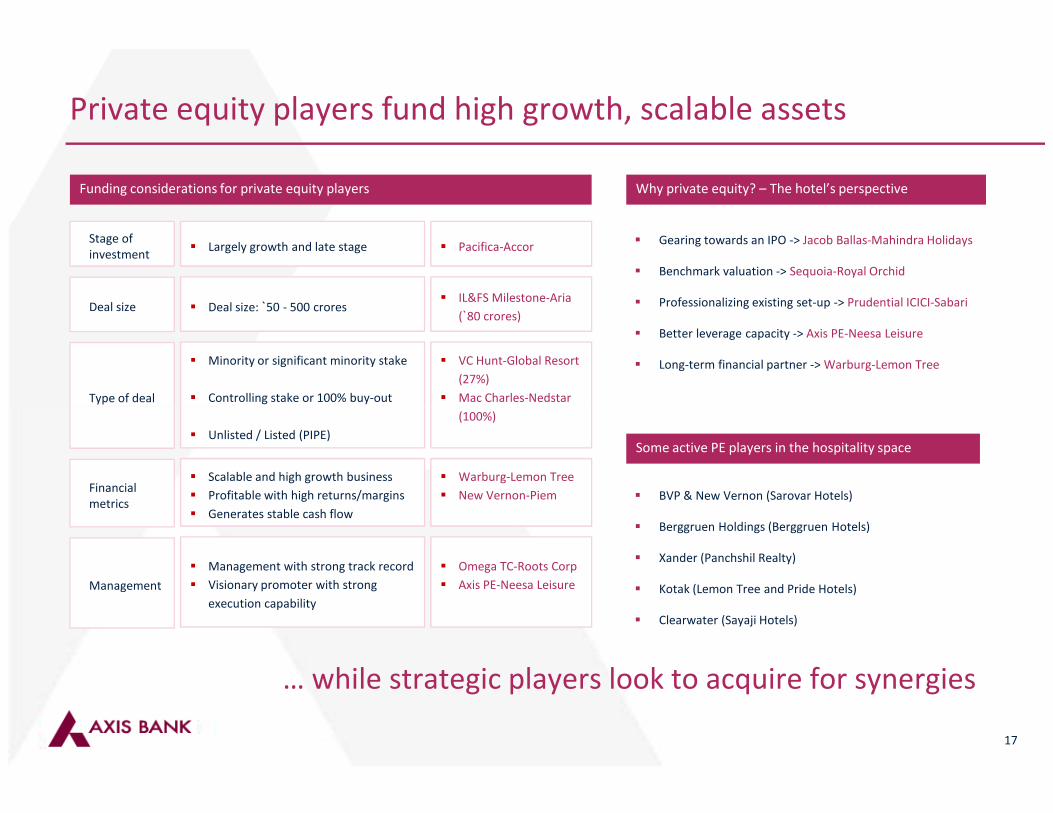
Private equity players fund high growth, scalable assets
Funding considerations for private equity players
� Largely growth and late stageStage of
investment
� Deal size: `50 - 500 croresDeal size
� Minority or significant minority stake
� Controlling stake or 100% buy-outType of deal
� Pacifica-Accor
� IL&FS Milestone-Aria
(`80 crores)
� VC Hunt-Global Resort
(27%)
� Mac Charles-Nedstar
� Gearing towards an IPO -> Jacob Ballas-Mahindra Holidays
� Benchmark valuation -> Sequoia-Royal Orchid
� Professionalizing existing set-up -> Prudential ICICI-Sabari
� Better leverage capacity -> Axis PE-Neesa Leisure
� Long-term financial partner -> Warburg-Lemon Tree
Why private equity? – The hotel’s perspective
17
… while strategic players look to acquire for synergies
� Unlisted / Listed (PIPE)
� Scalable and high growth business
� Profitable with high returns/margins
� Generates stable cash flow
Financial
metrics
� Management with strong track record
� Visionary promoter with strong
execution capability
Management
(100%)
� Warburg-Lemon Tree
� New Vernon-Piem
� Omega TC-Roots Corp
� Axis PE-Neesa Leisure
Some active PE players in the hospitality space
� BVP & New Vernon (Sarovar Hotels)
� Berggruen Holdings (Berggruen Hotels)
� Xander (Panchshil Realty)
� Kotak (Lemon Tree and Pride Hotels)
� Clearwater (Sayaji Hotels)
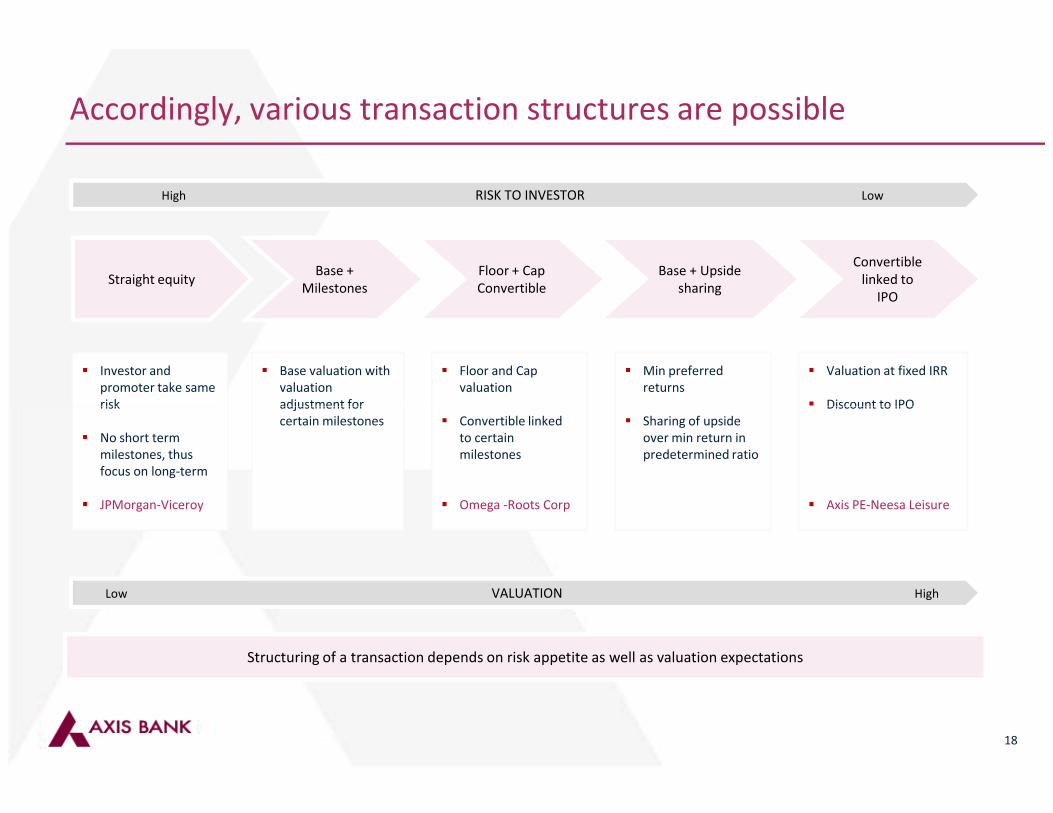
Accordingly, various transaction structures are possible
Straight equityBase +
Milestones
Floor + Cap
Convertible
Convertible
linked to
IPO
� Investor and
promoter take same
risk
Base + Upside
sharing
� Base valuation with
valuation
adjustment for
� Floor and Cap
valuation
� Min preferred
returns
� Valuation at fixed IRR
� Discount to IPO
High RISK TO INVESTOR Low
18
risk
� No short term
milestones, thus
focus on long-term
� JPMorgan-Viceroy
adjustment for
certain milestones � Convertible linked
to certain
milestones
� Omega -Roots Corp
� Sharing of upside
over min return in
predetermined ratio
� Discount to IPO
� Axis PE-Neesa Leisure
Low VALUATION High
Structuring of a transaction depends on risk appetite as well as valuation expectations

Section – V: Emerging Financing Opportunities in Hospitality
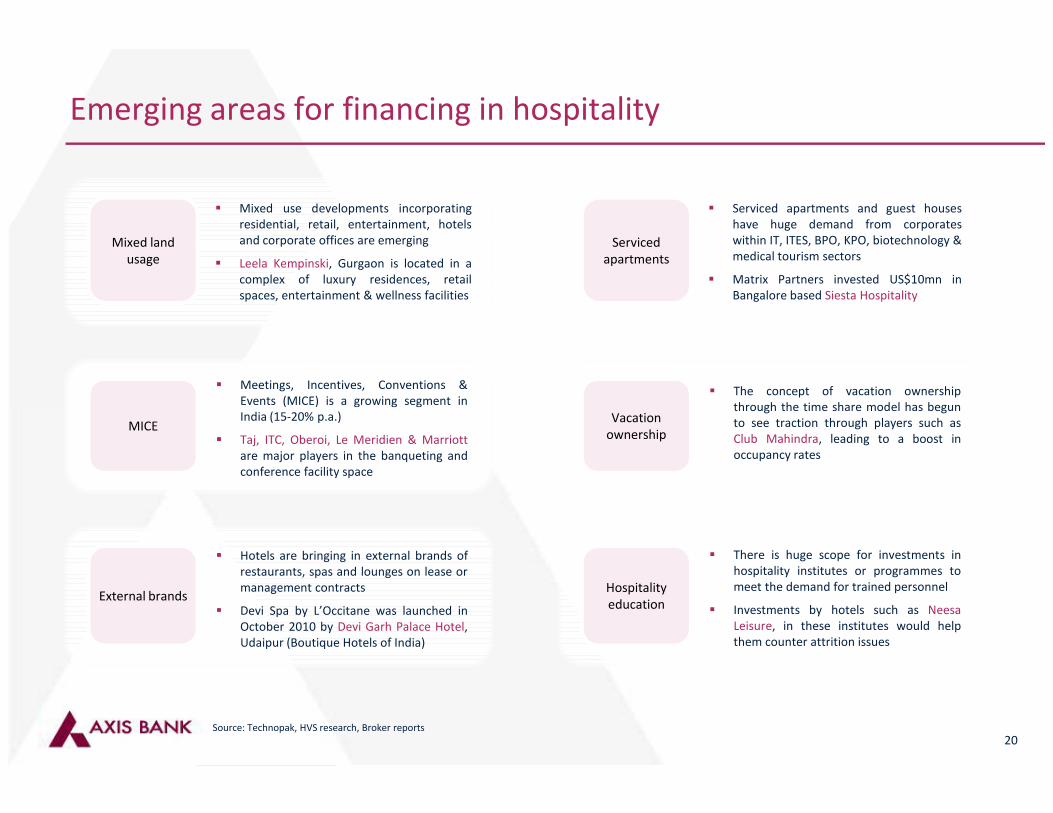
Emerging areas for financing in hospitality
Mixed land
usage
� Mixed use developments incorporating
residential, retail, entertainment, hotels
and corporate offices are emerging
� Leela Kempinski, Gurgaon is located in a
complex of luxury residences, retail
spaces, entertainment & wellness facilities
� Meetings, Incentives, Conventions &
Events (MICE) is a growing segment in
Serviced
apartments
� Serviced apartments and guest houses
have huge demand from corporates
within IT, ITES, BPO, KPO, biotechnology &
medical tourism sectors
� Matrix Partners invested US$10mn in
Bangalore based Siesta Hospitality
� The concept of vacation ownership
through the time share model has begun
20
MICE
Events (MICE) is a growing segment in
India (15-20% p.a.)
� Taj, ITC, Oberoi, Le Meridien & Marriott
are major players in the banqueting and
conference facility space
External brands
� Hotels are bringing in external brands of
restaurants, spas and lounges on lease or
management contracts
� Devi Spa by L’Occitane was launched in
October 2010 by Devi Garh Palace Hotel,
Udaipur (Boutique Hotels of India)
Vacation
ownership
through the time share model has begun
to see traction through players such as
Club Mahindra, leading to a boost in
occupancy rates
Hospitality
education
� There is huge scope for investments in
hospitality institutes or programmes to
meet the demand for trained personnel
� Investments by hotels such as Neesa
Leisure, in these institutes would help
them counter attrition issues
Source: Technopak, HVS research, Broker reports
Section – VI: Case Studies
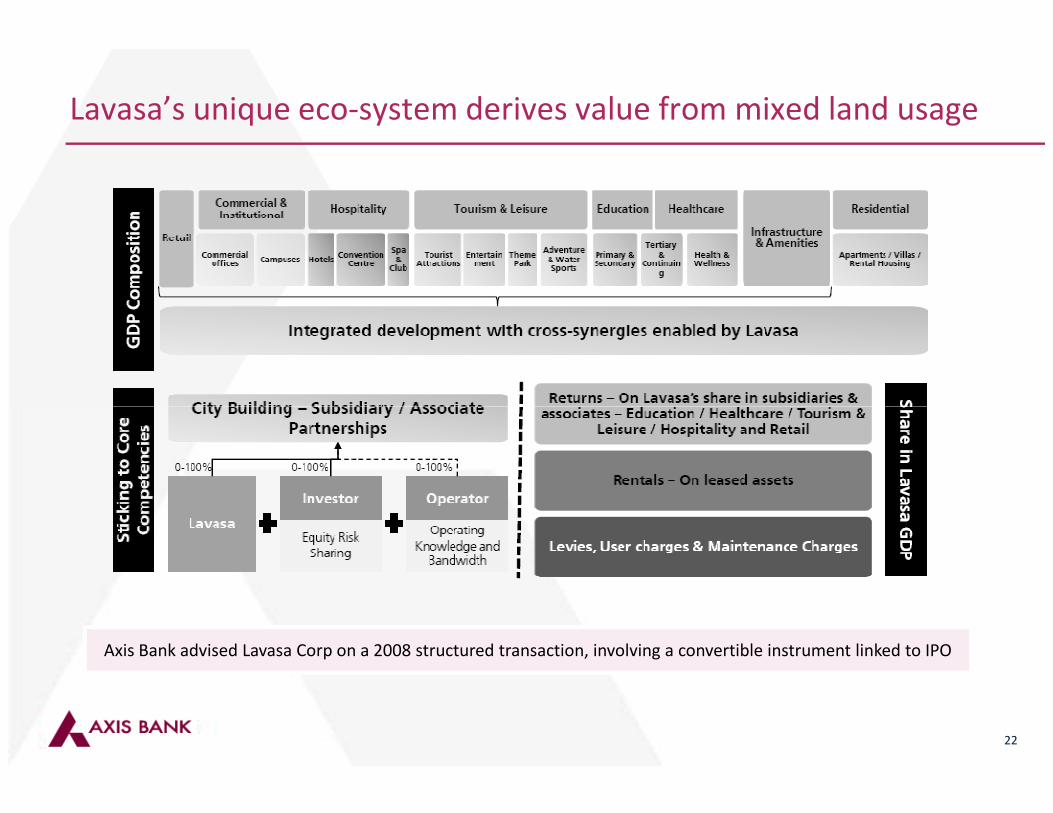
Lavasa’s unique eco-system derives value from mixed land usage
22
Axis Bank advised Lavasa Corp on a 2008 structured transaction, involving a convertible instrument linked to IPO
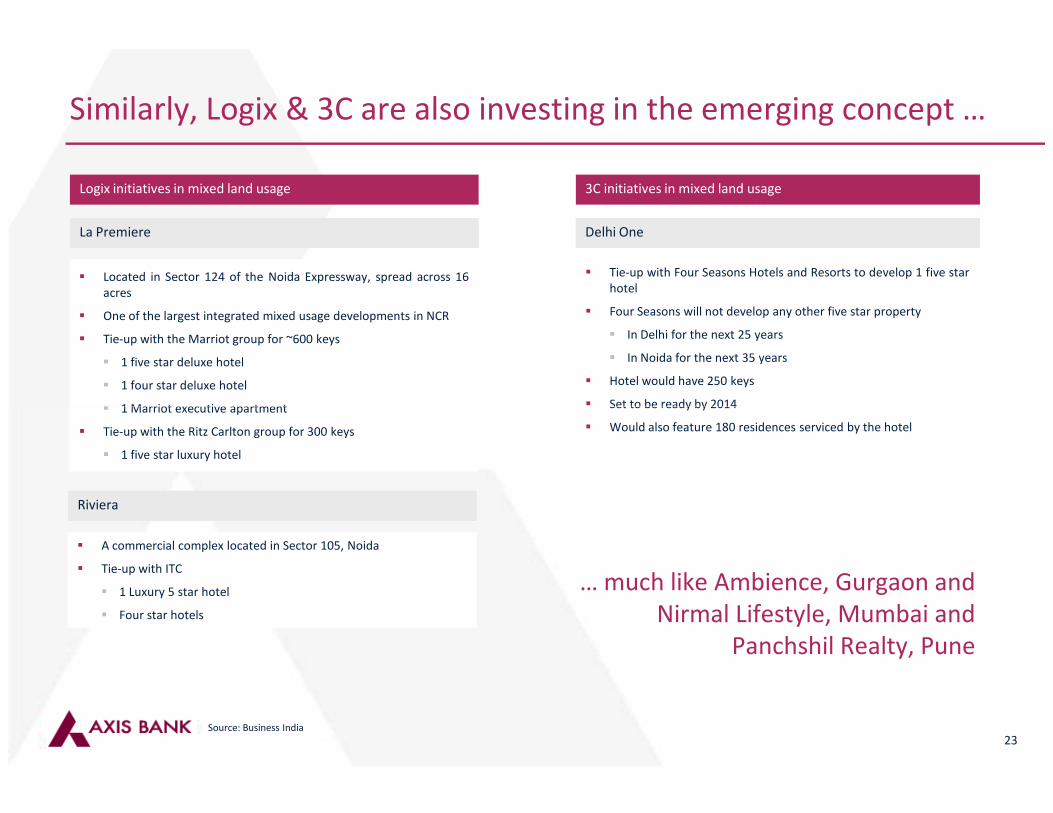
Similarly, Logix & 3C are also investing in the emerging concept …
Logix initiatives in mixed land usage 3C initiatives in mixed land usage
� Located in Sector 124 of the Noida Expressway, spread across 16
acres
� One of the largest integrated mixed usage developments in NCR
� Tie-up with the Marriot group for ~600 keys
� 1 five star deluxe hotel
� 1 four star deluxe hotel
� 1 Marriot executive apartment
La PremiereLa Premiere Delhi OneDelhi One
� Tie-up with Four Seasons Hotels and Resorts to develop 1 five star
hotel
� Four Seasons will not develop any other five star property
� In Delhi for the next 25 years
� In Noida for the next 35 years
� Hotel would have 250 keys
� Set to be ready by 2014
23
� 1 Marriot executive apartment
� Tie-up with the Ritz Carlton group for 300 keys
� 1 five star luxury hotel
� Set to be ready by 2014
� Would also feature 180 residences serviced by the hotel
� A commercial complex located in Sector 105, Noida
� Tie-up with ITC
� 1 Luxury 5 star hotel
� Four star hotels
RivieraRiviera
… much like Ambience, Gurgaon and
Nirmal Lifestyle, Mumbai and
Panchshil Realty, Pune
Source: Business India
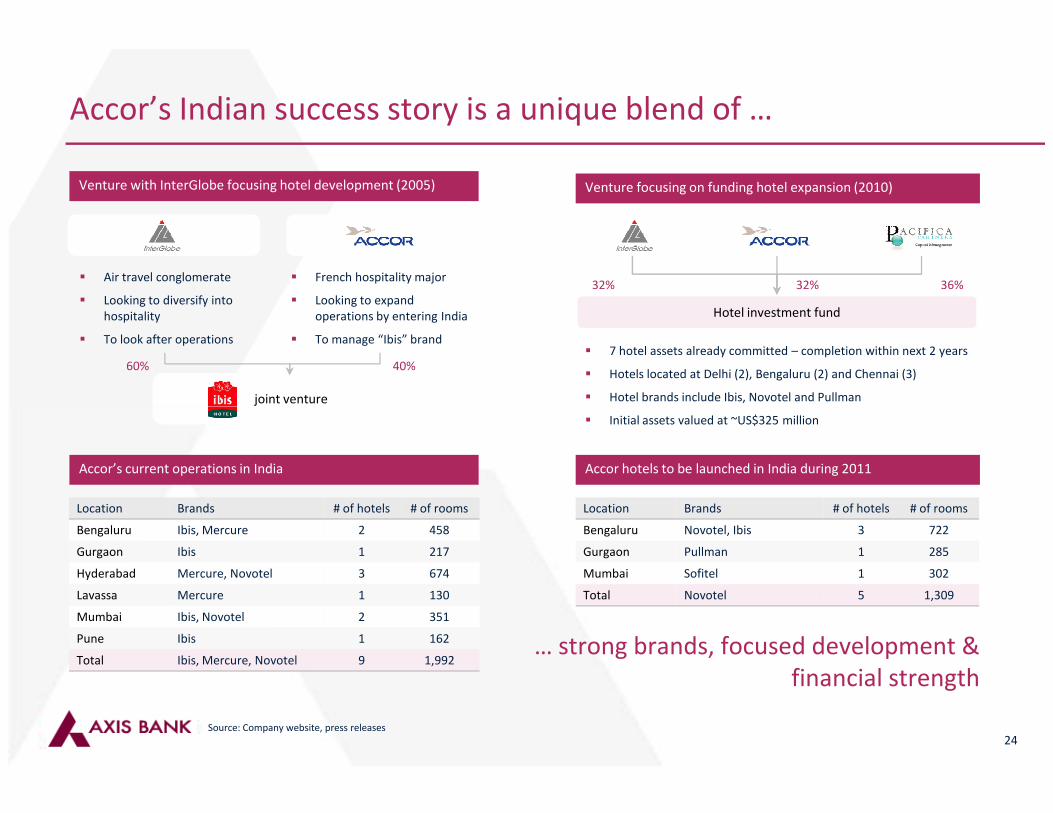
Accor’s Indian success story is a unique blend of …
� Air travel conglomerate
� Looking to diversify into
hospitality
� To look after operations
� French hospitality major
� Looking to expand
operations by entering India
� To manage “Ibis” brand
joint venture
Venture with InterGlobe focusing hotel development (2005) Venture focusing on funding hotel expansion (2010)
60% 40%
Hotel investment fund
� 7 hotel assets already committed – completion within next 2 years
� Hotels located at Delhi (2), Bengaluru (2) and Chennai (3)
� Hotel brands include Ibis, Novotel and Pullman
32% 36%32%
24
Accor’s current operations in India
Location Brands # of hotels # of rooms
Bengaluru Ibis, Mercure 2 458
Gurgaon Ibis 1 217
Hyderabad Mercure, Novotel 3 674
Lavassa Mercure 1 130
Mumbai Ibis, Novotel 2 351
Pune Ibis 1 162
Total Ibis, Mercure, Novotel 9 1,992
Accor hotels to be launched in India during 2011
Location Brands # of hotels # of rooms
Bengaluru Novotel, Ibis 3 722
Gurgaon Pullman 1 285
Mumbai Sofitel 1 302
Total Novotel 5 1,309
� Initial assets valued at ~US$325 million
Source: Company website, press releases
… strong brands, focused development &
financial strength
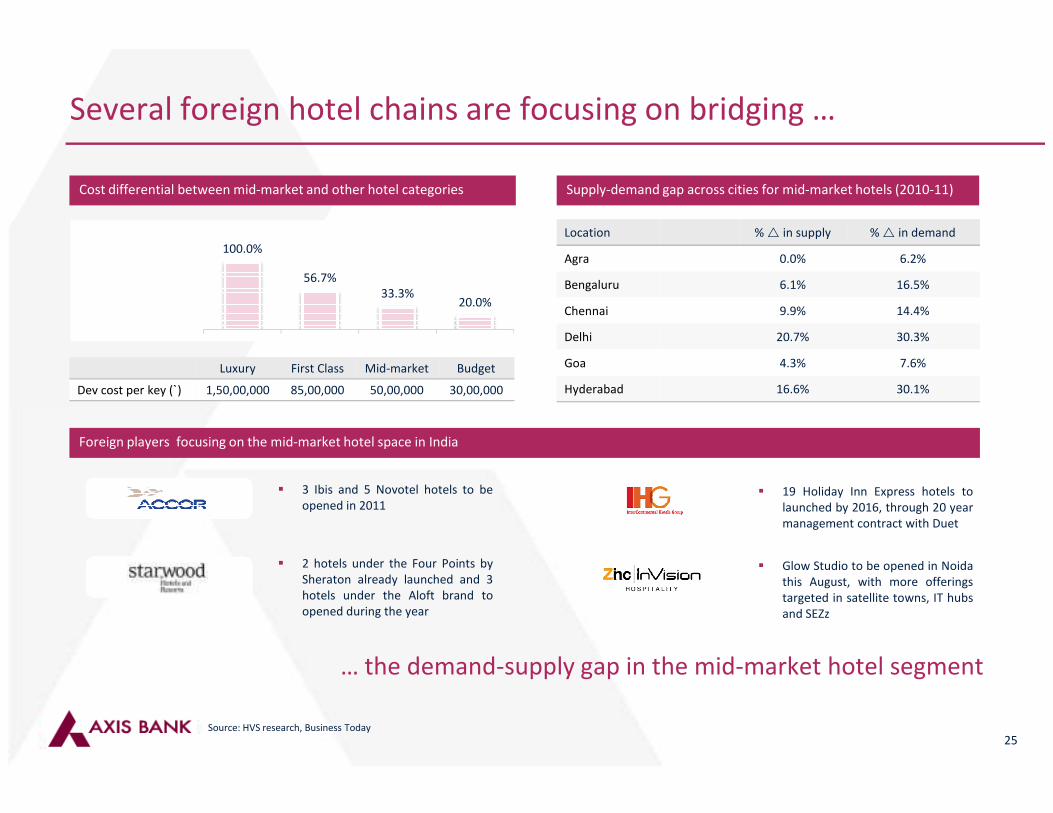
100.0%
56.7%
33.3%20.0%
Several foreign hotel chains are focusing on bridging …
Supply-demand gap across cities for mid-market hotels (2010-11)
Location % � in supply % � in demand
Agra 0.0% 6.2%
Bengaluru 6.1% 16.5%
Chennai 9.9% 14.4%
Delhi 20.7% 30.3%
Goa 4.3% 7.6%
Hyderabad 16.6% 30.1%
Cost differential between mid-market and other hotel categories
Luxury First Class Mid-market Budget
Dev cost per key (`) 1,50,00,000 85,00,000 50,00,000 30,00,000
25
… the demand-supply gap in the mid-market hotel segment
Source: HVS research, Business Today
� 3 Ibis and 5 Novotel hotels to be
opened in 2011
� 2 hotels under the Four Points by
Sheraton already launched and 3
hotels under the Aloft brand to
opened during the year
� 19 Holiday Inn Express hotels to
launched by 2016, through 20 year
management contract with Duet
� Glow Studio to be opened in Noida
this August, with more offerings
targeted in satellite towns, IT hubs
and SEZz
Foreign players focusing on the mid-market hotel space in India
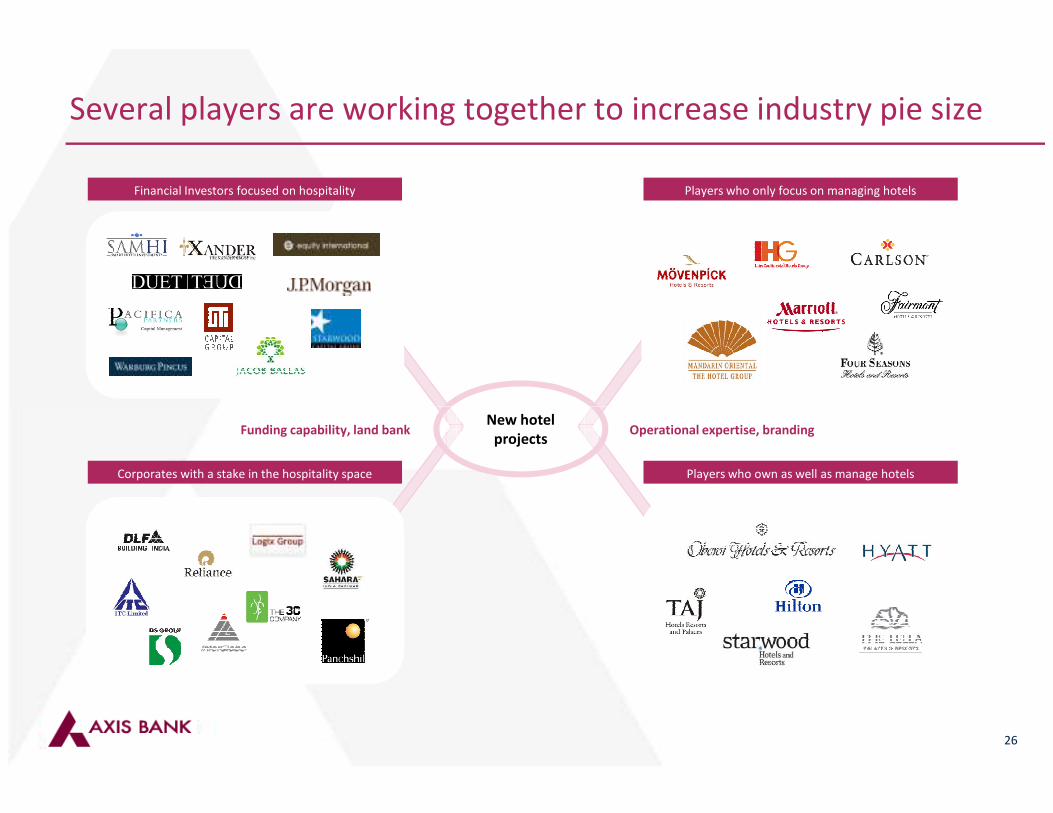
Several players are working together to increase industry pie size
Financial Investors focused on hospitality Players who only focus on managing hotels
26
New hotel
projects
Corporates with a stake in the hospitality space Players who own as well as manage hotels
Funding capability, land bank Operational expertise, branding
Axis Bank Limited, Investment Banking Department, Corporate Office,
Axis House, Wing C - Level 1. Bombay Dyeing Mills Compound,
Pandurang Budhkar Marg, Worli. Mumbai 400 025.
www.axisbank.com
Thank you
Disclaimer
� The presentation is only for restricted circulation to the addressed parties. This presentation does not constitute an engagement or offer for the engagement
from Axis Bank Limited or any of its subsidiaries or affiliates (“Axis”) to any party and the information contained herein will not form the basis of any contract.
� Neither Axis Bank nor any of their respective affiliates, shareholders, directors, employees, agents or representatives makes any warranty or representation as
to the accuracy or completeness of the information contained herein (including statements of opinion and expectation, whether communicated in written,
oral, visual or electronic form) or as to the reasonableness of any assumptions contained herein. In particular, no representation or warranty is given as to the
achievement or reasonableness of, any information.
� Consequently, neither Axis Bank nor any of their respective affiliates, shareholders, directors, employees, agents or advisors shall be liable for any loss or
damage (direct or indirect) suffered as a result of reliance upon any statements contained in, or any omission from this presentation and expressly disclaim any
and all liability relating to or resulting from the use of this presentation.
� This presentation should not be distributed, reproduced, or used without the express consent of Axis Bank.
� Nothing contained in this presentation should be relied upon as a promise or representation as to the future. The pro forma and information contained herein
28
� Nothing contained in this presentation should be relied upon as a promise or representation as to the future. The pro forma and information contained herein
was prepared expressly for use herein and is based on certain assumptions and management's analysis of information available at the time this presentation
was prepared. There is no representation, warranty or other assurance in this regard.