Embed Size (px)
Citation preview
B U I L D I N G O N S U C C E S S
T R A N S I T S Y S T E M P L A N
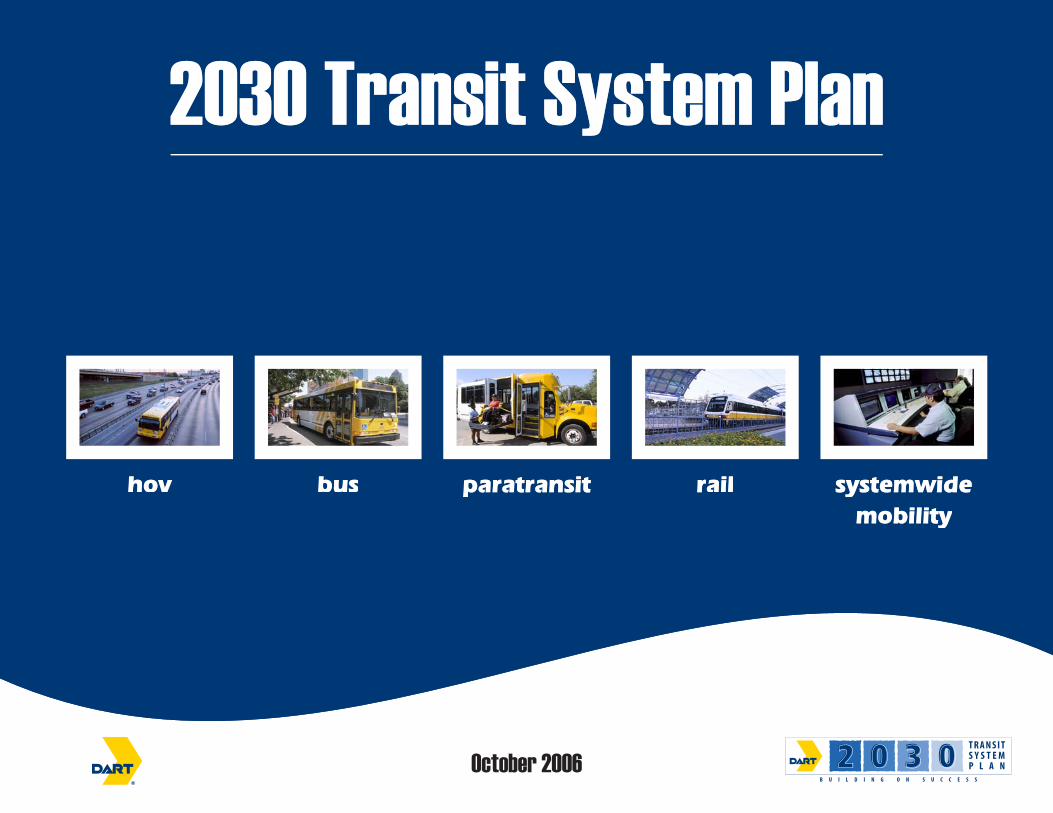
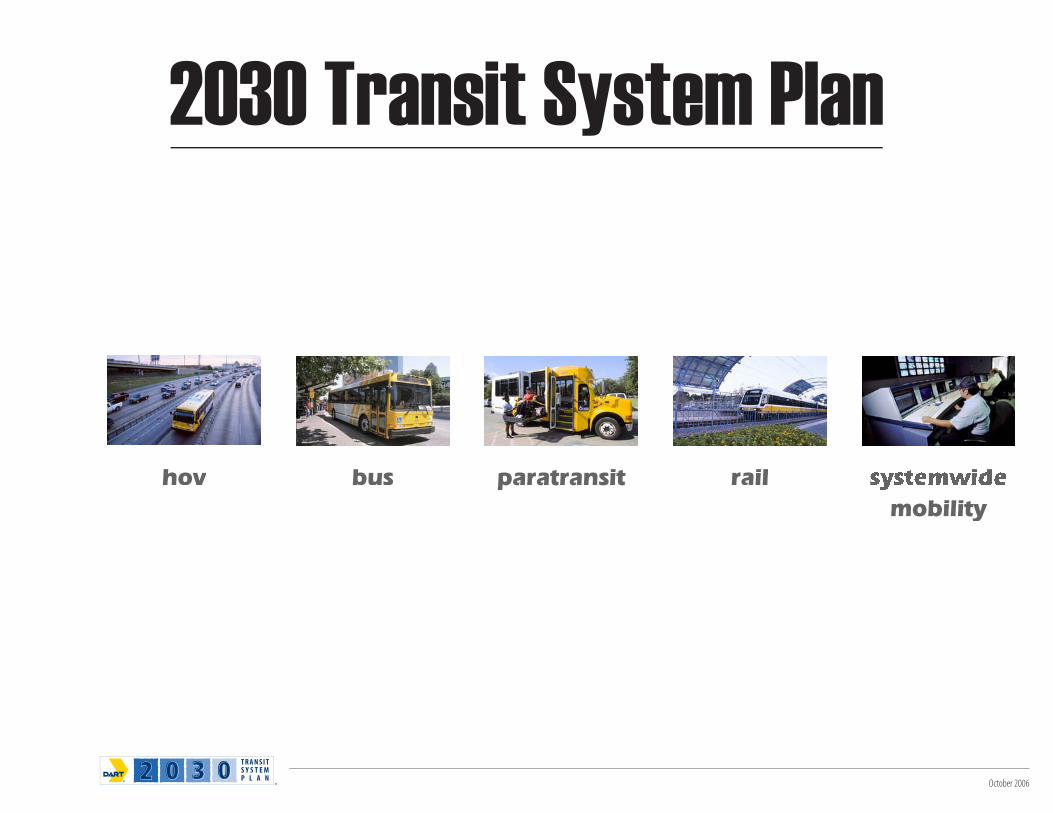
hovhov busbus paratransitparatransit railrail systemwidesystemwidemobilitymobility
October 2006
October 2006
DART MISSION STATEMENT
The Mission of Dallas Area Rapid Transit is to build, establish, and operate a safe, efficient, and effective transportation system that, within the DART Service Area,
provides mobility, improves the quality of life, and stimulates economic development
October 2006
mobilityrailparatransitbushov
October 2006
RowlettGarland
Richardson
Plano
Carrollton Addison
FarmersBranch
Irving
Cockrell Hill
Glenn Heights
Highland Park
Dallas
University Park
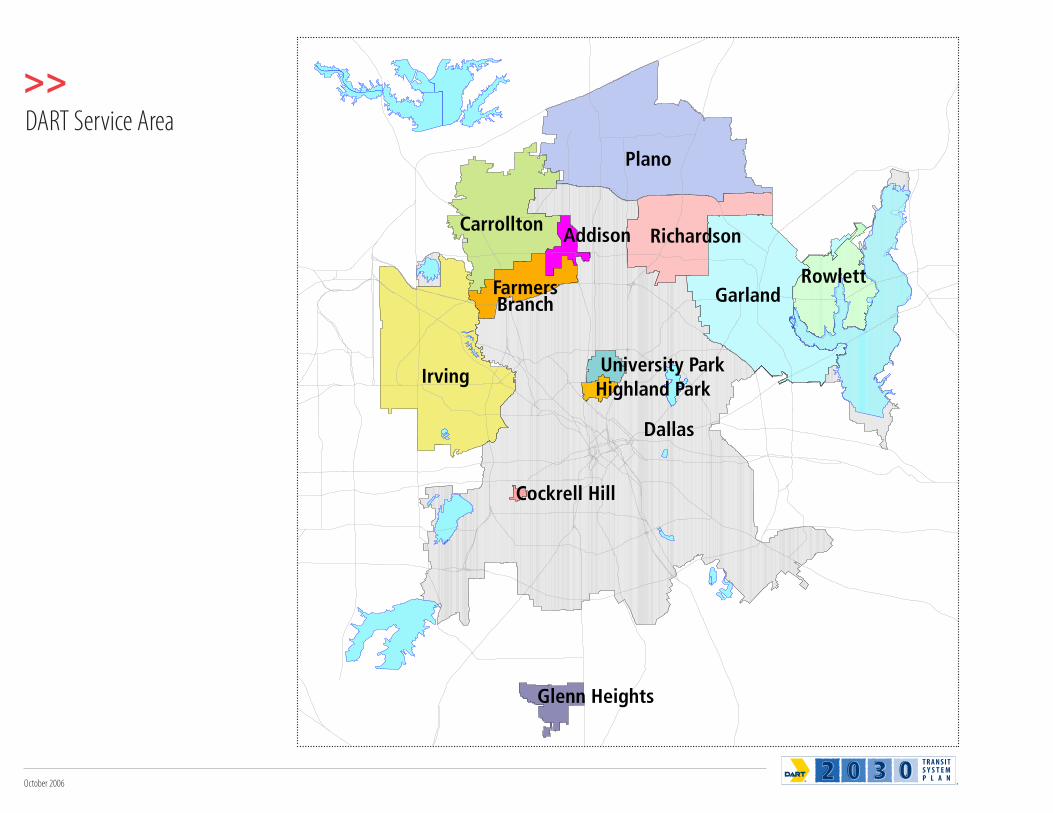
DART Service Area
October 2006
1.0 Introduction . . . . . . . . . . . . . . . . . . . . . . . . . . . . . . . . . . . . . . . . . . . . . . . . . . . . . . . . . . . . . . . . . . . . . . . . . . . . . . . . . . . . . . . . . . . . . . . . . . . . . . . . . . . . . . . . . . . . . . . . . . . . . . . . . . 11.1 Planning Process . . . . . . . . . . . . . . . . . . . . . . . . . . . . . . . . . . . . . . . . . . . . . . . . . . . . . . . . . . . . . . . . . . . . . . . . . . . . . . . . . . . . . . . . . . . . . . . . . . . . . . . . . . . . . . . . . . . . . . . . . . . . . . . . . . . . . . . . . . . . . . . . . . . . . . . . . . . . . . . . . . . . . . . . . . . . . . . . . . . . . . . . . . . . 21.2 Relationship to Other Plans . . . . . . . . . . . . . . . . . . . . . . . . . . . . . . . . . . . . . . . . . . . . . . . . . . . . . . . . . . . . . . . . . . . . . . . . . . . . . . . . . . . . . . . . . . . . . . . . . . . . . . . . . . . . . . . . . . . . . . . . . . . . . . . . . . . . . . . . . . . . . . . . . . . . . . . . . . . . . . . . . . . . . . . . . . . . . . . . . . . 21.3 Organization of the Plan . . . . . . . . . . . . . . . . . . . . . . . . . . . . . . . . . . . . . . . . . . . . . . . . . . . . . . . . . . . . . . . . . . . . . . . . . . . . . . . . . . . . . . . . . . . . . . . . . . . . . . . . . . . . . . . . . . . . . . . . . . . . . . . . . . . . . . . . . . . . . . . . . . . . . . . . . . . . . . . . . . . . . . . . . . . . . . . . . . . . . . 31.4 Future Updates . . . . . . . . . . . . . . . . . . . . . . . . . . . . . . . . . . . . . . . . . . . . . . . . . . . . . . . . . . . . . . . . . . . . . . . . . . . . . . . . . . . . . . . . . . . . . . . . . . . . . . . . . . . . . . . . . . . . . . . . . . . . . . . . . . . . . . . . . . . . . . . . . . . . . . . . . . . . . . . . . . . . . . . . . . . . . . . . . . . . . . . . . . . . . 3
2.0 Growth Trends and Mobility Issues . . . . . . . . . . . . . . . . . . . . . . . . . . . . . . . . . . . . . . . . . . . . . . . . . . . . . . . . . . . . . . . . . . . . . . . . . . . . . . . . . . . . . . . . . . . . . . . . . . . . . . . . . . . . 42.1 Local and Regional Growth Patterns . . . . . . . . . . . . . . . . . . . . . . . . . . . . . . . . . . . . . . . . . . . . . . . . . . . . . . . . . . . . . . . . . . . . . . . . . . . . . . . . . . . . . . . . . . . . . . . . . . . . . . . . . . . . . . . . . . . . . . . . . . . . . . . . . . . . . . . . . . . . . . . . . . . . . . . . . . . . . . . . . . . . . . . . . . . . 42.2 Changes in Travel Patterns and Congestion . . . . . . . . . . . . . . . . . . . . . . . . . . . . . . . . . . . . . . . . . . . . . . . . . . . . . . . . . . . . . . . . . . . . . . . . . . . . . . . . . . . . . . . . . . . . . . . . . . . . . . . . . . . . . . . . . . . . . . . . . . . . . . . . . . . . . . . . . . . . . . . . . . . . . . . . . . . . . . . . . . . . . . 42.3 Regional Transportation Issues. . . . . . . . . . . . . . . . . . . . . . . . . . . . . . . . . . . . . . . . . . . . . . . . . . . . . . . . . . . . . . . . . . . . . . . . . . . . . . . . . . . . . . . . . . . . . . . . . . . . . . . . . . . . . . . . . . . . . . . . . . . . . . . . . . . . . . . . . . . . . . . . . . . . . . . . . . . . . . . . . . . . . . . . . . . . . . . . . 5
3.0 Focus Areas . . . . . . . . . . . . . . . . . . . . . . . . . . . . . . . . . . . . . . . . . . . . . . . . . . . . . . . . . . . . . . . . . . . . . . . . . . . . . . . . . . . . . . . . . . . . . . . . . . . . . . . . . . . . . . . . . . . . . . . . . . . . . . . . . . . 73.1 Downtown Dallas and Surrounding Urban Areas . . . . . . . . . . . . . . . . . . . . . . . . . . . . . . . . . . . . . . . . . . . . . . . . . . . . . . . . . . . . . . . . . . . . . . . . . . . . . . . . . . . . . . . . . . . . . . . . . . . . . . . . . . . . . . . . . . . . . . . . . . . . . . . . . . . . . . . . . . . . . . . . . . . . . . . . . . . . . . . . . 73.1.1 Transportation Needs and Opportunities . . . . . . . . . . . . . . . . . . . . . . . . . . . . . . . . . . . . . . . . . . . . . . . . . . . . . . . . . . . . . . . . . . . . . . . . . . . . . . . . . . . . . . . . . . . . . . . . . . . . . . . . . . . . . . . . . . . . . . . . . . . . . . . . . . . . . . . . . . . . . . . . . . . . . . . . . . . . . . . . . . . . . . . . 73.1.2 DART’s Role . . . . . . . . . . . . . . . . . . . . . . . . . . . . . . . . . . . . . . . . . . . . . . . . . . . . . . . . . . . . . . . . . . . . . . . . . . . . . . . . . . . . . . . . . . . . . . . . . . . . . . . . . . . . . . . . . . . . . . . . . . . . . . . . . . . . . . . . . . . . . . . . . . . . . . . . . . . . . . . . . . . . . . . . . . . . . . . . . . . . . . . . . . . . . . . . 93.2 North Crosstown Corridor . . . . . . . . . . . . . . . . . . . . . . . . . . . . . . . . . . . . . . . . . . . . . . . . . . . . . . . . . . . . . . . . . . . . . . . . . . . . . . . . . . . . . . . . . . . . . . . . . . . . . . . . . . . . . . . . . . . . . . . . . . . . . . . . . . . . . . . . . . . . . . . . . . . . . . . . . . . . . . . . . . . . . . . . . . . . . . . . . . . . . 93.2.1 Corridor Needs . . . . . . . . . . . . . . . . . . . . . . . . . . . . . . . . . . . . . . . . . . . . . . . . . . . . . . . . . . . . . . . . . . . . . . . . . . . . . . . . . . . . . . . . . . . . . . . . . . . . . . . . . . . . . . . . . . . . . . . . . . . . . . . . . . . . . . . . . . . . . . . . . . . . . . . . . . . . . . . . . . . . . . . . . . . . . . . . . . . . . . . . . . . . . . 93.2.2 Alternatives Considered . . . . . . . . . . . . . . . . . . . . . . . . . . . . . . . . . . . . . . . . . . . . . . . . . . . . . . . . . . . . . . . . . . . . . . . . . . . . . . . . . . . . . . . . . . . . . . . . . . . . . . . . . . . . . . . . . . . . . . . . . . . . . . . . . . . . . . . . . . . . . . . . . . . . . . . . . . . . . . . . . . . . . . . . . . . . . . . . . . . . . 103.2.3 North Crosstown Recommendations . . . . . . . . . . . . . . . . . . . . . . . . . . . . . . . . . . . . . . . . . . . . . . . . . . . . . . . . . . . . . . . . . . . . . . . . . . . . . . . . . . . . . . . . . . . . . . . . . . . . . . . . . . . . . . . . . . . . . . . . . . . . . . . . . . . . . . . . . . . . . . . . . . . . . . . . . . . . . . . . . . . . . . . . . . 103.2.4 Remaining Issues . . . . . . . . . . . . . . . . . . . . . . . . . . . . . . . . . . . . . . . . . . . . . . . . . . . . . . . . . . . . . . . . . . . . . . . . . . . . . . . . . . . . . . . . . . . . . . . . . . . . . . . . . . . . . . . . . . . . . . . . . . . . . . . . . . . . . . . . . . . . . . . . . . . . . . . . . . . . . . . . . . . . . . . . . . . . . . . . . . . . . . . . . . 103.3 Airport Access . . . . . . . . . . . . . . . . . . . . . . . . . . . . . . . . . . . . . . . . . . . . . . . . . . . . . . . . . . . . . . . . . . . . . . . . . . . . . . . . . . . . . . . . . . . . . . . . . . . . . . . . . . . . . . . . . . . . . . . . . . . . . . . . . . . . . . . . . . . . . . . . . . . . . . . . . . . . . . . . . . . . . . . . . . . . . . . . . . . . . . . . . . . . . 113.3.1 Dallas Love Field . . . . . . . . . . . . . . . . . . . . . . . . . . . . . . . . . . . . . . . . . . . . . . . . . . . . . . . . . . . . . . . . . . . . . . . . . . . . . . . . . . . . . . . . . . . . . . . . . . . . . . . . . . . . . . . . . . . . . . . . . . . . . . . . . . . . . . . . . . . . . . . . . . . . . . . . . . . . . . . . . . . . . . . . . . . . . . . . . . . . . . . . . . . 113.3.2 DFW International Airport . . . . . . . . . . . . . . . . . . . . . . . . . . . . . . . . . . . . . . . . . . . . . . . . . . . . . . . . . . . . . . . . . . . . . . . . . . . . . . . . . . . . . . . . . . . . . . . . . . . . . . . . . . . . . . . . . . . . . . . . . . . . . . . . . . . . . . . . . . . . . . . . . . . . . . . . . . . . . . . . . . . . . . . . . . . . . . . . . . . 123.4 Southern Sector Growth . . . . . . . . . . . . . . . . . . . . . . . . . . . . . . . . . . . . . . . . . . . . . . . . . . . . . . . . . . . . . . . . . . . . . . . . . . . . . . . . . . . . . . . . . . . . . . . . . . . . . . . . . . . . . . . . . . . . . . . . . . . . . . . . . . . . . . . . . . . . . . . . . . . . . . . . . . . . . . . . . . . . . . . . . . . . . . . . . . . . . 133.4.1 Southern Sector Demographics . . . . . . . . . . . . . . . . . . . . . . . . . . . . . . . . . . . . . . . . . . . . . . . . . . . . . . . . . . . . . . . . . . . . . . . . . . . . . . . . . . . . . . . . . . . . . . . . . . . . . . . . . . . . . . . . . . . . . . . . . . . . . . . . . . . . . . . . . . . . . . . . . . . . . . . . . . . . . . . . . . . . . . . . . . . . . . . 133.4.2 forwardDallas! Comprehensive Plan . . . . . . . . . . . . . . . . . . . . . . . . . . . . . . . . . . . . . . . . . . . . . . . . . . . . . . . . . . . . . . . . . . . . . . . . . . . . . . . . . . . . . . . . . . . . . . . . . . . . . . . . . . . . . . . . . . . . . . . . . . . . . . . . . . . . . . . . . . . . . . . . . . . . . . . . . . . . . . . . . . . . . . 133.4.3 Southern Sector Recommendations . . . . . . . . . . . . . . . . . . . . . . . . . . . . . . . . . . . . . . . . . . . . . . . . . . . . . . . . . . . . . . . . . . . . . . . . . . . . . . . . . . . . . . . . . . . . . . . . . . . . . . . . . . . . . . . . . . . . . . . . . . . . . . . . . . . . . . . . . . . . . . . . . . . . . . . . . . . . . . . . . . . . . . . . . . . 14
4.0 Land Use and Economic Development . . . . . . . . . . . . . . . . . . . . . . . . . . . . . . . . . . . . . . . . . . . . . . . . . . . . . . . . . . . . . . . . . . . . . . . . . . . . . . . . . . . . . . . . . . . . . . . . . . . . . . . 164.1 DART Initiatives . . . . . . . . . . . . . . . . . . . . . . . . . . . . . . . . . . . . . . . . . . . . . . . . . . . . . . . . . . . . . . . . . . . . . . . . . . . . . . . . . . . . . . . . . . . . . . . . . . . . . . . . . . . . . . . . . . . . . . . . . . . . . . . . . . . . . . . . . . . . . . . . . . . . . . . . . . . . . . . . . . . . . . . . . . . . . . . . . . . . . . . . . . . . 164.1.1 Education . . . . . . . . . . . . . . . . . . . . . . . . . . . . . . . . . . . . . . . . . . . . . . . . . . . . . . . . . . . . . . . . . . . . . . . . . . . . . . . . . . . . . . . . . . . . . . . . . . . . . . . . . . . . . . . . . . . . . . . . . . . . . . . . . . . . . . . . . . . . . . . . . . . . . . . . . . . . . . . . . . . . . . . . . . . . . . . . . . . . . . . . . . . . . . . . . 164.1.2 Facilitation . . . . . . . . . . . . . . . . . . . . . . . . . . . . . . . . . . . . . . . . . . . . . . . . . . . . . . . . . . . . . . . . . . . . . . . . . . . . . . . . . . . . . . . . . . . . . . . . . . . . . . . . . . . . . . . . . . . . . . . . . . . . . . . . . . . . . . . . . . . . . . . . . . . . . . . . . . . . . . . . . . . . . . . . . . . . . . . . . . . . . . . . . . . . . . . . 164.1.3 Coordination . . . . . . . . . . . . . . . . . . . . . . . . . . . . . . . . . . . . . . . . . . . . . . . . . . . . . . . . . . . . . . . . . . . . . . . . . . . . . . . . . . . . . . . . . . . . . . . . . . . . . . . . . . . . . . . . . . . . . . . . . . . . . . . . . . . . . . . . . . . . . . . . . . . . . . . . . . . . . . . . . . . . . . . . . . . . . . . . . . . . . . . . . . . . . . 174.2 Member City Initiatives . . . . . . . . . . . . . . . . . . . . . . . . . . . . . . . . . . . . . . . . . . . . . . . . . . . . . . . . . . . . . . . . . . . . . . . . . . . . . . . . . . . . . . . . . . . . . . . . . . . . . . . . . . . . . . . . . . . . . . . . . . . . . . . . . . . . . . . . . . . . . . . . . . . . . . . . . . . . . . . . . . . . . . . . . . . . . . . . . . . . . . 174.2.1 Transit-Oriented Development . . . . . . . . . . . . . . . . . . . . . . . . . . . . . . . . . . . . . . . . . . . . . . . . . . . . . . . . . . . . . . . . . . . . . . . . . . . . . . . . . . . . . . . . . . . . . . . . . . . . . . . . . . . . . . . . . . . . . . . . . . . . . . . . . . . . . . . . . . . . . . . . . . . . . . . . . . . . . . . . . . . . . . . . . . . . . . . 174.3 Regional Planning Initiatives . . . . . . . . . . . . . . . . . . . . . . . . . . . . . . . . . . . . . . . . . . . . . . . . . . . . . . . . . . . . . . . . . . . . . . . . . . . . . . . . . . . . . . . . . . . . . . . . . . . . . . . . . . . . . . . . . . . . . . . . . . . . . . . . . . . . . . . . . . . . . . . . . . . . . . . . . . . . . . . . . . . . . . . . . . . . . . . . . 194.3.1 Vision North Texas . . . . . . . . . . . . . . . . . . . . . . . . . . . . . . . . . . . . . . . . . . . . . . . . . . . . . . . . . . . . . . . . . . . . . . . . . . . . . . . . . . . . . . . . . . . . . . . . . . . . . . . . . . . . . . . . . . . . . . . . . . . . . . . . . . . . . . . . . . . . . . . . . . . . . . . . . . . . . . . . . . . . . . . . . . . . . . . . . . . . . . . . . . 194.3.2 Alternative Future Sensitivity Tests . . . . . . . . . . . . . . . . . . . . . . . . . . . . . . . . . . . . . . . . . . . . . . . . . . . . . . . . . . . . . . . . . . . . . . . . . . . . . . . . . . . . . . . . . . . . . . . . . . . . . . . . . . . . . . . . . . . . . . . . . . . . . . . . . . . . . . . . . . . . . . . . . . . . . . . . . . . . . . . . . . . . . . . . . . . . 194.4 Cooperative Planning . . . . . . . . . . . . . . . . . . . . . . . . . . . . . . . . . . . . . . . . . . . . . . . . . . . . . . . . . . . . . . . . . . . . . . . . . . . . . . . . . . . . . . . . . . . . . . . . . . . . . . . . . . . . . . . . . . . . . . . . . . . . . . . . . . . . . . . . . . . . . . . . . . . . . . . . . . . . . . . . . . . . . . . . . . . . . . . . . . . . . . . 20
5.0 Financial Considerations . . . . . . . . . . . . . . . . . . . . . . . . . . . . . . . . . . . . . . . . . . . . . . . . . . . . . . . . . . . . . . . . . . . . . . . . . . . . . . . . . . . . . . . . . . . . . . . . . . . . . . . . . . . . . . . . . . . . . 215.1 Key Revenue Sources . . . . . . . . . . . . . . . . . . . . . . . . . . . . . . . . . . . . . . . . . . . . . . . . . . . . . . . . . . . . . . . . . . . . . . . . . . . . . . . . . . . . . . . . . . . . . . . . . . . . . . . . . . . . . . . . . . . . . . . . . . . . . . . . . . . . . . . . . . . . . . . . . . . . . . . . . . . . . . . . . . . . . . . . . . . . . . . . . . . . . . . 215.2 Capital Expenditures . . . . . . . . . . . . . . . . . . . . . . . . . . . . . . . . . . . . . . . . . . . . . . . . . . . . . . . . . . . . . . . . . . . . . . . . . . . . . . . . . . . . . . . . . . . . . . . . . . . . . . . . . . . . . . . . . . . . . . . . . . . . . . . . . . . . . . . . . . . . . . . . . . . . . . . . . . . . . . . . . . . . . . . . . . . . . . . . . . . . . . . . 215.3 Transit Operating Expenses . . . . . . . . . . . . . . . . . . . . . . . . . . . . . . . . . . . . . . . . . . . . . . . . . . . . . . . . . . . . . . . . . . . . . . . . . . . . . . . . . . . . . . . . . . . . . . . . . . . . . . . . . . . . . . . . . . . . . . . . . . . . . . . . . . . . . . . . . . . . . . . . . . . . . . . . . . . . . . . . . . . . . . . . . . . . . . . . . . 225.4 Financial Profile . . . . . . . . . . . . . . . . . . . . . . . . . . . . . . . . . . . . . . . . . . . . . . . . . . . . . . . . . . . . . . . . . . . . . . . . . . . . . . . . . . . . . . . . . . . . . . . . . . . . . . . . . . . . . . . . . . . . . . . . . . . . . . . . . . . . . . . . . . . . . . . . . . . . . . . . . . . . . . . . . . . . . . . . . . . . . . . . . . . . . . . . . . . . 225.4.1 Risks and Opportunities . . . . . . . . . . . . . . . . . . . . . . . . . . . . . . . . . . . . . . . . . . . . . . . . . . . . . . . . . . . . . . . . . . . . . . . . . . . . . . . . . . . . . . . . . . . . . . . . . . . . . . . . . . . . . . . . . . . . . . . . . . . . . . . . . . . . . . . . . . . . . . . . . . . . . . . . . . . . . . . . . . . . . . . . . . . . . . . . . . . . . 235.4.2 Year 2030 Financial Capacity . . . . . . . . . . . . . . . . . . . . . . . . . . . . . . . . . . . . . . . . . . . . . . . . . . . . . . . . . . . . . . . . . . . . . . . . . . . . . . . . . . . . . . . . . . . . . . . . . . . . . . . . . . . . . . . . . . . . . . . . . . . . . . . . . . . . . . . . . . . . . . . . . . . . . . . . . . . . . . . . . . . . . . . . . . . . . . . . . 24
2030 Transit System Plan - Table of Contents
October 2006
6.0 Recommendations and Strategies . . . . . . . . . . . . . . . . . . . . . . . . . . . . . . . . . . . . . . . . . . . . . . . . . . . . . . . . . . . . . . . . . . . . . . . . . . . . . . . . . . . . . . . . . . . . . . . . . . . . . . . . . . . . 266.1 2030 Transit System Plan . . . . . . . . . . . . . . . . . . . . . . . . . . . . . . . . . . . . . . . . . . . . . . . . . . . . . . . . . . . . . . . . . . . . . . . . . . . . . . . . . . . . . . . . . . . . . . . . . . . . . . . . . . . . . . . . . . . . . . . . . . . . . . . . . . . . . . . . . . . . . . . . . . . . . . . . . . . . . . . . . . . . . . . . . . . . . . . . . . . . 266.2 Managed HOV Lanes. . . . . . . . . . . . . . . . . . . . . . . . . . . . . . . . . . . . . . . . . . . . . . . . . . . . . . . . . . . . . . . . . . . . . . . . . . . . . . . . . . . . . . . . . . . . . . . . . . . . . . . . . . . . . . . . . . . . . . . . . . . . . . . . . . . . . . . . . . . . . . . . . . . . . . . . . . . . . . . . . . . . . . . . . . . . . . . . . . . . . . . . 286.2.1 Regional Managed HOV Plan . . . . . . . . . . . . . . . . . . . . . . . . . . . . . . . . . . . . . . . . . . . . . . . . . . . . . . . . . . . . . . . . . . . . . . . . . . . . . . . . . . . . . . . . . . . . . . . . . . . . . . . . . . . . . . . . . . . . . . . . . . . . . . . . . . . . . . . . . . . . . . . . . . . . . . . . . . . . . . . . . . . . . . . . . . . . . . . . . 286.2.2 DART Role . . . . . . . . . . . . . . . . . . . . . . . . . . . . . . . . . . . . . . . . . . . . . . . . . . . . . . . . . . . . . . . . . . . . . . . . . . . . . . . . . . . . . . . . . . . . . . . . . . . . . . . . . . . . . . . . . . . . . . . . . . . . . . . . . . . . . . . . . . . . . . . . . . . . . . . . . . . . . . . . . . . . . . . . . . . . . . . . . . . . . . . . . . . . . . . . . 306.2.3 Managed HOV Lane Recommendations . . . . . . . . . . . . . . . . . . . . . . . . . . . . . . . . . . . . . . . . . . . . . . . . . . . . . . . . . . . . . . . . . . . . . . . . . . . . . . . . . . . . . . . . . . . . . . . . . . . . . . . . . . . . . . . . . . . . . . . . . . . . . . . . . . . . . . . . . . . . . . . . . . . . . . . . . . . . . . . . . . . . . . . . 306.2.4 Transit Considerations . . . . . . . . . . . . . . . . . . . . . . . . . . . . . . . . . . . . . . . . . . . . . . . . . . . . . . . . . . . . . . . . . . . . . . . . . . . . . . . . . . . . . . . . . . . . . . . . . . . . . . . . . . . . . . . . . . . . . . . . . . . . . . . . . . . . . . . . . . . . . . . . . . . . . . . . . . . . . . . . . . . . . . . . . . . . . . . . . . . . . . . 316.2.5 Cost Summary . . . . . . . . . . . . . . . . . . . . . . . . . . . . . . . . . . . . . . . . . . . . . . . . . . . . . . . . . . . . . . . . . . . . . . . . . . . . . . . . . . . . . . . . . . . . . . . . . . . . . . . . . . . . . . . . . . . . . . . . . . . . . . . . . . . . . . . . . . . . . . . . . . . . . . . . . . . . . . . . . . . . . . . . . . . . . . . . . . . . . . . . . . . . . 316.3 Bus . . . . . . . . . . . . . . . . . . . . . . . . . . . . . . . . . . . . . . . . . . . . . . . . . . . . . . . . . . . . . . . . . . . . . . . . . . . . . . . . . . . . . . . . . . . . . . . . . . . . . . . . . . . . . . . . . . . . . . . . . . . . . . . . . . . . . . . . . . . . . . . . . . . . . . . . . . . . . . . . . . . . . . . . . . . . . . . . . . . . . . . . . . . . . . . . . . . . . . 326.3.1 The Changing Role of Bus Service . . . . . . . . . . . . . . . . . . . . . . . . . . . . . . . . . . . . . . . . . . . . . . . . . . . . . . . . . . . . . . . . . . . . . . . . . . . . . . . . . . . . . . . . . . . . . . . . . . . . . . . . . . . . . . . . . . . . . . . . . . . . . . . . . . . . . . . . . . . . . . . . . . . . . . . . . . . . . . . . . . . . . . . . . . . . . 326.3.2 Bus Recommendations . . . . . . . . . . . . . . . . . . . . . . . . . . . . . . . . . . . . . . . . . . . . . . . . . . . . . . . . . . . . . . . . . . . . . . . . . . . . . . . . . . . . . . . . . . . . . . . . . . . . . . . . . . . . . . . . . . . . . . . . . . . . . . . . . . . . . . . . . . . . . . . . . . . . . . . . . . . . . . . . . . . . . . . . . . . . . . . . . . . . . . 326.3.3 Express Bus Corridors . . . . . . . . . . . . . . . . . . . . . . . . . . . . . . . . . . . . . . . . . . . . . . . . . . . . . . . . . . . . . . . . . . . . . . . . . . . . . . . . . . . . . . . . . . . . . . . . . . . . . . . . . . . . . . . . . . . . . . . . . . . . . . . . . . . . . . . . . . . . . . . . . . . . . . . . . . . . . . . . . . . . . . . . . . . . . . . . . . . . . . . 346.3.4 Enhanced Bus Corridors . . . . . . . . . . . . . . . . . . . . . . . . . . . . . . . . . . . . . . . . . . . . . . . . . . . . . . . . . . . . . . . . . . . . . . . . . . . . . . . . . . . . . . . . . . . . . . . . . . . . . . . . . . . . . . . . . . . . . . . . . . . . . . . . . . . . . . . . . . . . . . . . . . . . . . . . . . . . . . . . . . . . . . . . . . . . . . . . . . . . . 346.3.5 Rapid Bus Corridors . . . . . . . . . . . . . . . . . . . . . . . . . . . . . . . . . . . . . . . . . . . . . . . . . . . . . . . . . . . . . . . . . . . . . . . . . . . . . . . . . . . . . . . . . . . . . . . . . . . . . . . . . . . . . . . . . . . . . . . . . . . . . . . . . . . . . . . . . . . . . . . . . . . . . . . . . . . . . . . . . . . . . . . . . . . . . . . . . . . . . . . . . 356.3.6 Operating Facility Needs . . . . . . . . . . . . . . . . . . . . . . . . . . . . . . . . . . . . . . . . . . . . . . . . . . . . . . . . . . . . . . . . . . . . . . . . . . . . . . . . . . . . . . . . . . . . . . . . . . . . . . . . . . . . . . . . . . . . . . . . . . . . . . . . . . . . . . . . . . . . . . . . . . . . . . . . . . . . . . . . . . . . . . . . . . . . . . . . . . . . . 366.3.7 Cost Summary . . . . . . . . . . . . . . . . . . . . . . . . . . . . . . . . . . . . . . . . . . . . . . . . . . . . . . . . . . . . . . . . . . . . . . . . . . . . . . . . . . . . . . . . . . . . . . . . . . . . . . . . . . . . . . . . . . . . . . . . . . . . . . . . . . . . . . . . . . . . . . . . . . . . . . . . . . . . . . . . . . . . . . . . . . . . . . . . . . . . . . . . . . . . . 366.4 Rail . . . . . . . . . . . . . . . . . . . . . . . . . . . . . . . . . . . . . . . . . . . . . . . . . . . . . . . . . . . . . . . . . . . . . . . . . . . . . . . . . . . . . . . . . . . . . . . . . . . . . . . . . . . . . . . . . . . . . . . . . . . . . . . . . . . . . . . . . . . . . . . . . . . . . . . . . . . . . . . . . . . . . . . . . . . . . . . . . . . . . . . . . . . . . . . . . . . . . . 386.4.1 Rail Recommendations . . . . . . . . . . . . . . . . . . . . . . . . . . . . . . . . . . . . . . . . . . . . . . . . . . . . . . . . . . . . . . . . . . . . . . . . . . . . . . . . . . . . . . . . . . . . . . . . . . . . . . . . . . . . . . . . . . . . . . . . . . . . . . . . . . . . . . . . . . . . . . . . . . . . . . . . . . . . . . . . . . . . . . . . . . . . . . . . . . . . . . 386.4.2 Vehicle Technology . . . . . . . . . . . . . . . . . . . . . . . . . . . . . . . . . . . . . . . . . . . . . . . . . . . . . . . . . . . . . . . . . . . . . . . . . . . . . . . . . . . . . . . . . . . . . . . . . . . . . . . . . . . . . . . . . . . . . . . . . . . . . . . . . . . . . . . . . . . . . . . . . . . . . . . . . . . . . . . . . . . . . . . . . . . . . . . . . . . . . . . . . 416.4.3 Streetcars . . . . . . . . . . . . . . . . . . . . . . . . . . . . . . . . . . . . . . . . . . . . . . . . . . . . . . . . . . . . . . . . . . . . . . . . . . . . . . . . . . . . . . . . . . . . . . . . . . . . . . . . . . . . . . . . . . . . . . . . . . . . . . . . . . . . . . . . . . . . . . . . . . . . . . . . . . . . . . . . . . . . . . . . . . . . . . . . . . . . . . . . . . . . . . . . . 416.4.4 Rail Stations . . . . . . . . . . . . . . . . . . . . . . . . . . . . . . . . . . . . . . . . . . . . . . . . . . . . . . . . . . . . . . . . . . . . . . . . . . . . . . . . . . . . . . . . . . . . . . . . . . . . . . . . . . . . . . . . . . . . . . . . . . . . . . . . . . . . . . . . . . . . . . . . . . . . . . . . . . . . . . . . . . . . . . . . . . . . . . . . . . . . . . . . . . . . . . . 416.4.5 Operating Facility Needs . . . . . . . . . . . . . . . . . . . . . . . . . . . . . . . . . . . . . . . . . . . . . . . . . . . . . . . . . . . . . . . . . . . . . . . . . . . . . . . . . . . . . . . . . . . . . . . . . . . . . . . . . . . . . . . . . . . . . . . . . . . . . . . . . . . . . . . . . . . . . . . . . . . . . . . . . . . . . . . . . . . . . . . . . . . . . . . . . . . . . 416.4.6 Cost Summary . . . . . . . . . . . . . . . . . . . . . . . . . . . . . . . . . . . . . . . . . . . . . . . . . . . . . . . . . . . . . . . . . . . . . . . . . . . . . . . . . . . . . . . . . . . . . . . . . . . . . . . . . . . . . . . . . . . . . . . . . . . . . . . . . . . . . . . . . . . . . . . . . . . . . . . . . . . . . . . . . . . . . . . . . . . . . . . . . . . . . . . . . . . . . 426.4.7 Vision Corridors . . . . . . . . . . . . . . . . . . . . . . . . . . . . . . . . . . . . . . . . . . . . . . . . . . . . . . . . . . . . . . . . . . . . . . . . . . . . . . . . . . . . . . . . . . . . . . . . . . . . . . . . . . . . . . . . . . . . . . . . . . . . . . . . . . . . . . . . . . . . . . . . . . . . . . . . . . . . . . . . . . . . . . . . . . . . . . . . . . . . . . . . . . . . 426.4.8 Expansion Opportunities . . . . . . . . . . . . . . . . . . . . . . . . . . . . . . . . . . . . . . . . . . . . . . . . . . . . . . . . . . . . . . . . . . . . . . . . . . . . . . . . . . . . . . . . . . . . . . . . . . . . . . . . . . . . . . . . . . . . . . . . . . . . . . . . . . . . . . . . . . . . . . . . . . . . . . . . . . . . . . . . . . . . . . . . . . . . . . . . . . . . 446.5 Paratransit . . . . . . . . . . . . . . . . . . . . . . . . . . . . . . . . . . . . . . . . . . . . . . . . . . . . . . . . . . . . . . . . . . . . . . . . . . . . . . . . . . . . . . . . . . . . . . . . . . . . . . . . . . . . . . . . . . . . . . . . . . . . . . . . . . . . . . . . . . . . . . . . . . . . . . . . . . . . . . . . . . . . . . . . . . . . . . . . . . . . . . . . . . . . . . . . 486.5.1 Recent Changes and Trends . . . . . . . . . . . . . . . . . . . . . . . . . . . . . . . . . . . . . . . . . . . . . . . . . . . . . . . . . . . . . . . . . . . . . . . . . . . . . . . . . . . . . . . . . . . . . . . . . . . . . . . . . . . . . . . . . . . . . . . . . . . . . . . . . . . . . . . . . . . . . . . . . . . . . . . . . . . . . . . . . . . . . . . . . . . . . . . . . . 486.5.2 Efforts to Manage Costs and Demand . . . . . . . . . . . . . . . . . . . . . . . . . . . . . . . . . . . . . . . . . . . . . . . . . . . . . . . . . . . . . . . . . . . . . . . . . . . . . . . . . . . . . . . . . . . . . . . . . . . . . . . . . . . . . . . . . . . . . . . . . . . . . . . . . . . . . . . . . . . . . . . . . . . . . . . . . . . . . . . . . . . . . . . . . . 486.6 Systemwide Mobility . . . . . . . . . . . . . . . . . . . . . . . . . . . . . . . . . . . . . . . . . . . . . . . . . . . . . . . . . . . . . . . . . . . . . . . . . . . . . . . . . . . . . . . . . . . . . . . . . . . . . . . . . . . . . . . . . . . . . . . . . . . . . . . . . . . . . . . . . . . . . . . . . . . . . . . . . . . . . . . . . . . . . . . . . . . . . . . . . . . . . . . 506.6.1 Intelligent Transportation Systems . . . . . . . . . . . . . . . . . . . . . . . . . . . . . . . . . . . . . . . . . . . . . . . . . . . . . . . . . . . . . . . . . . . . . . . . . . . . . . . . . . . . . . . . . . . . . . . . . . . . . . . . . . . . . . . . . . . . . . . . . . . . . . . . . . . . . . . . . . . . . . . . . . . . . . . . . . . . . . . . . . . . . . . . . . . . 506.6.2 Transportation System Management . . . . . . . . . . . . . . . . . . . . . . . . . . . . . . . . . . . . . . . . . . . . . . . . . . . . . . . . . . . . . . . . . . . . . . . . . . . . . . . . . . . . . . . . . . . . . . . . . . . . . . . . . . . . . . . . . . . . . . . . . . . . . . . . . . . . . . . . . . . . . . . . . . . . . . . . . . . . . . . . . . . . . . . . . . 546.6.3 Passenger Facilities . . . . . . . . . . . . . . . . . . . . . . . . . . . . . . . . . . . . . . . . . . . . . . . . . . . . . . . . . . . . . . . . . . . . . . . . . . . . . . . . . . . . . . . . . . . . . . . . . . . . . . . . . . . . . . . . . . . . . . . . . . . . . . . . . . . . . . . . . . . . . . . . . . . . . . . . . . . . . . . . . . . . . . . . . . . . . . . . . . . . . . . . . 566.6.4 Travel Demand Management. . . . . . . . . . . . . . . . . . . . . . . . . . . . . . . . . . . . . . . . . . . . . . . . . . . . . . . . . . . . . . . . . . . . . . . . . . . . . . . . . . . . . . . . . . . . . . . . . . . . . . . . . . . . . . . . . . . . . . . . . . . . . . . . . . . . . . . . . . . . . . . . . . . . . . . . . . . . . . . . . . . . . . . . . . . . . . . . . 586.6.5 Bicycle/Pedestrian Integration . . . . . . . . . . . . . . . . . . . . . . . . . . . . . . . . . . . . . . . . . . . . . . . . . . . . . . . . . . . . . . . . . . . . . . . . . . . . . . . . . . . . . . . . . . . . . . . . . . . . . . . . . . . . . . . . . . . . . . . . . . . . . . . . . . . . . . . . . . . . . . . . . . . . . . . . . . . . . . . . . . . . . . . . . . . . . . . . 606.6.6 Safety and Security . . . . . . . . . . . . . . . . . . . . . . . . . . . . . . . . . . . . . . . . . . . . . . . . . . . . . . . . . . . . . . . . . . . . . . . . . . . . . . . . . . . . . . . . . . . . . . . . . . . . . . . . . . . . . . . . . . . . . . . . . . . . . . . . . . . . . . . . . . . . . . . . . . . . . . . . . . . . . . . . . . . . . . . . . . . . . . . . . . . . . . . . . 626.6.7 System Accessibility . . . . . . . . . . . . . . . . . . . . . . . . . . . . . . . . . . . . . . . . . . . . . . . . . . . . . . . . . . . . . . . . . . . . . . . . . . . . . . . . . . . . . . . . . . . . . . . . . . . . . . . . . . . . . . . . . . . . . . . . . . . . . . . . . . . . . . . . . . . . . . . . . . . . . . . . . . . . . . . . . . . . . . . . . . . . . . . . . . . . . . . . 64
7.0 Implementation and Phasing. . . . . . . . . . . . . . . . . . . . . . . . . . . . . . . . . . . . . . . . . . . . . . . . . . . . . . . . . . . . . . . . . . . . . . . . . . . . . . . . . . . . . . . . . . . . . . . . . . . . . . . . . . . . . . . . . 667.1 Existing Commitments . . . . . . . . . . . . . . . . . . . . . . . . . . . . . . . . . . . . . . . . . . . . . . . . . . . . . . . . . . . . . . . . . . . . . . . . . . . . . . . . . . . . . . . . . . . . . . . . . . . . . . . . . . . . . . . . . . . . . . . . . . . . . . . . . . . . . . . . . . . . . . . . . . . . . . . . . . . . . . . . . . . . . . . . . . . . . . . . . . . . . . 667.2 Service Enhancements . . . . . . . . . . . . . . . . . . . . . . . . . . . . . . . . . . . . . . . . . . . . . . . . . . . . . . . . . . . . . . . . . . . . . . . . . . . . . . . . . . . . . . . . . . . . . . . . . . . . . . . . . . . . . . . . . . . . . . . . . . . . . . . . . . . . . . . . . . . . . . . . . . . . . . . . . . . . . . . . . . . . . . . . . . . . . . . . . . . . . . 667.3 Project Phasing Through 2030 . . . . . . . . . . . . . . . . . . . . . . . . . . . . . . . . . . . . . . . . . . . . . . . . . . . . . . . . . . . . . . . . . . . . . . . . . . . . . . . . . . . . . . . . . . . . . . . . . . . . . . . . . . . . . . . . . . . . . . . . . . . . . . . . . . . . . . . . . . . . . . . . . . . . . . . . . . . . . . . . . . . . . . . . . . . . . . . . 677.3.1 Project Phasing without Long Term Debt . . . . . . . . . . . . . . . . . . . . . . . . . . . . . . . . . . . . . . . . . . . . . . . . . . . . . . . . . . . . . . . . . . . . . . . . . . . . . . . . . . . . . . . . . . . . . . . . . . . . . . . . . . . . . . . . . . . . . . . . . . . . . . . . . . . . . . . . . . . . . . . . . . . . . . . . . . . . . . . . . . . . . . . 677.4 Project Development Strategy . . . . . . . . . . . . . . . . . . . . . . . . . . . . . . . . . . . . . . . . . . . . . . . . . . . . . . . . . . . . . . . . . . . . . . . . . . . . . . . . . . . . . . . . . . . . . . . . . . . . . . . . . . . . . . . . . . . . . . . . . . . . . . . . . . . . . . . . . . . . . . . . . . . . . . . . . . . . . . . . . . . . . . . . . . . . . . . . 677.4.1 Managed HOV Lanes. . . . . . . . . . . . . . . . . . . . . . . . . . . . . . . . . . . . . . . . . . . . . . . . . . . . . . . . . . . . . . . . . . . . . . . . . . . . . . . . . . . . . . . . . . . . . . . . . . . . . . . . . . . . . . . . . . . . . . . . . . . . . . . . . . . . . . . . . . . . . . . . . . . . . . . . . . . . . . . . . . . . . . . . . . . . . . . . . . . . . . . . 677.4.2 Bus . . . . . . . . . . . . . . . . . . . . . . . . . . . . . . . . . . . . . . . . . . . . . . . . . . . . . . . . . . . . . . . . . . . . . . . . . . . . . . . . . . . . . . . . . . . . . . . . . . . . . . . . . . . . . . . . . . . . . . . . . . . . . . . . . . . . . . . . . . . . . . . . . . . . . . . . . . . . . . . . . . . . . . . . . . . . . . . . . . . . . . . . . . . . . . . . . . . . . . 687.4.3 Rail . . . . . . . . . . . . . . . . . . . . . . . . . . . . . . . . . . . . . . . . . . . . . . . . . . . . . . . . . . . . . . . . . . . . . . . . . . . . . . . . . . . . . . . . . . . . . . . . . . . . . . . . . . . . . . . . . . . . . . . . . . . . . . . . . . . . . . . . . . . . . . . . . . . . . . . . . . . . . . . . . . . . . . . . . . . . . . . . . . . . . . . . . . . . . . . . . . . . . . 697.4.4 Paratransit . . . . . . . . . . . . . . . . . . . . . . . . . . . . . . . . . . . . . . . . . . . . . . . . . . . . . . . . . . . . . . . . . . . . . . . . . . . . . . . . . . . . . . . . . . . . . . . . . . . . . . . . . . . . . . . . . . . . . . . . . . . . . . . . . . . . . . . . . . . . . . . . . . . . . . . . . . . . . . . . . . . . . . . . . . . . . . . . . . . . . . . . . . . . . . . . 70
2030 Transit System Plan - Table of Contents
7.4.5 Systemwide Mobility . . . . . . . . . . . . . . . . . . . . . . . . . . . . . . . . . . . . . . . . . . . . . . . . . . . . . . . . . . . . . . . . . . . . . . . . . . . . . . . . . . . . . . . . . . . . . . . . . . . . . . . . . . . . . . . . . . . . . . . . . . . . . . . . . . . . . . . . . . . . . . . . . . . . . . . . . . . . . . . . . . . . . . . . . . . . . . . . . . . . . . . 717.5 Coordination . . . . . . . . . . . . . . . . . . . . . . . . . . . . . . . . . . . . . . . . . . . . . . . . . . . . . . . . . . . . . . . . . . . . . . . . . . . . . . . . . . . . . . . . . . . . . . . . . . . . . . . . . . . . . . . . . . . . . . . . . . . . . . . . . . . . . . . . . . . . . . . . . . . . . . . . . . . . . . . . . . . . . . . . . . . . . . . . . . . . . . . . . . . . . . 717.6 Public Involvement . . . . . . . . . . . . . . . . . . . . . . . . . . . . . . . . . . . . . . . . . . . . . . . . . . . . . . . . . . . . . . . . . . . . . . . . . . . . . . . . . . . . . . . . . . . . . . . . . . . . . . . . . . . . . . . . . . . . . . . . . . . . . . . . . . . . . . . . . . . . . . . . . . . . . . . . . . . . . . . . . . . . . . . . . . . . . . . . . . . . . . . . . 71
8.0 Local and Regional Benefits . . . . . . . . . . . . . . . . . . . . . . . . . . . . . . . . . . . . . . . . . . . . . . . . . . . . . . . . . . . . . . . . . . . . . . . . . . . . . . . . . . . . . . . . . . . . . . . . . . . . . . . . . . . . . . . . . . 728.1 Mobility . . . . . . . . . . . . . . . . . . . . . . . . . . . . . . . . . . . . . . . . . . . . . . . . . . . . . . . . . . . . . . . . . . . . . . . . . . . . . . . . . . . . . . . . . . . . . . . . . . . . . . . . . . . . . . . . . . . . . . . . . . . . . . . . . . . . . . . . . . . . . . . . . . . . . . . . . . . . . . . . . . . . . . . . . . . . . . . . . . . . . . . . . . . . . . . . . . 728.2 Fiscal Responsibility . . . . . . . . . . . . . . . . . . . . . . . . . . . . . . . . . . . . . . . . . . . . . . . . . . . . . . . . . . . . . . . . . . . . . . . . . . . . . . . . . . . . . . . . . . . . . . . . . . . . . . . . . . . . . . . . . . . . . . . . . . . . . . . . . . . . . . . . . . . . . . . . . . . . . . . . . . . . . . . . . . . . . . . . . . . . . . . . . . . . . . . . 748.3 Land Use and Economic Development . . . . . . . . . . . . . . . . . . . . . . . . . . . . . . . . . . . . . . . . . . . . . . . . . . . . . . . . . . . . . . . . . . . . . . . . . . . . . . . . . . . . . . . . . . . . . . . . . . . . . . . . . . . . . . . . . . . . . . . . . . . . . . . . . . . . . . . . . . . . . . . . . . . . . . . . . . . . . . . . . . . . . . . . . 758.4 Planning Process . . . . . . . . . . . . . . . . . . . . . . . . . . . . . . . . . . . . . . . . . . . . . . . . . . . . . . . . . . . . . . . . . . . . . . . . . . . . . . . . . . . . . . . . . . . . . . . . . . . . . . . . . . . . . . . . . . . . . . . . . . . . . . . . . . . . . . . . . . . . . . . . . . . . . . . . . . . . . . . . . . . . . . . . . . . . . . . . . . . . . . . . . . . 758.5 Summary . . . . . . . . . . . . . . . . . . . . . . . . . . . . . . . . . . . . . . . . . . . . . . . . . . . . . . . . . . . . . . . . . . . . . . . . . . . . . . . . . . . . . . . . . . . . . . . . . . . . . . . . . . . . . . . . . . . . . . . . . . . . . . . . . . . . . . . . . . . . . . . . . . . . . . . . . . . . . . . . . . . . . . . . . . . . . . . . . . . . . . . . . . . . . . . . . 76
List of Figures6-1 2030 Transit System Plan . . . . . . . . . . . . . . . . . . . . . . . . . . . . . . . . . . . . . . . . . . . . . . . . . . . . . . . . . . . . . . . . . . . . . . . . . . . . . . . . . . . . . . . . . . . . . . . . . . . . . . . . . . . . . . . . . . . . . . . . . . . . . . . . . . . . . . . . . . . . . . . . . . . . . . . . . . . . . . . . . . . . . . . . . . . . . . . . . . . . 276-2 HOV Element . . . . . . . . . . . . . . . . . . . . . . . . . . . . . . . . . . . . . . . . . . . . . . . . . . . . . . . . . . . . . . . . . . . . . . . . . . . . . . . . . . . . . . . . . . . . . . . . . . . . . . . . . . . . . . . . . . . . . . . . . . . . . . . . . . . . . . . . . . . . . . . . . . . . . . . . . . . . . . . . . . . . . . . . . . . . . . . . . . . . . . . . . . . . . . 296-3 Bus Element . . . . . . . . . . . . . . . . . . . . . . . . . . . . . . . . . . . . . . . . . . . . . . . . . . . . . . . . . . . . . . . . . . . . . . . . . . . . . . . . . . . . . . . . . . . . . . . . . . . . . . . . . . . . . . . . . . . . . . . . . . . . . . . . . . . . . . . . . . . . . . . . . . . . . . . . . . . . . . . . . . . . . . . . . . . . . . . . . . . . . . . . . . . . . . . 336-4 Rail Element . . . . . . . . . . . . . . . . . . . . . . . . . . . . . . . . . . . . . . . . . . . . . . . . . . . . . . . . . . . . . . . . . . . . . . . . . . . . . . . . . . . . . . . . . . . . . . . . . . . . . . . . . . . . . . . . . . . . . . . . . . . . . . . . . . . . . . . . . . . . . . . . . . . . . . . . . . . . . . . . . . . . . . . . . . . . . . . . . . . . . . . . . . . . . . . 396-5 Vision Element . . . . . . . . . . . . . . . . . . . . . . . . . . . . . . . . . . . . . . . . . . . . . . . . . . . . . . . . . . . . . . . . . . . . . . . . . . . . . . . . . . . . . . . . . . . . . . . . . . . . . . . . . . . . . . . . . . . . . . . . . . . . . . . . . . . . . . . . . . . . . . . . . . . . . . . . . . . . . . . . . . . . . . . . . . . . . . . . . . . . . . . . . . . . . 43
List of Tables6.1 Summary of 2030 Managed HOV Lane Recommendations . . . . . . . . . . . . . . . . . . . . . . . . . . . . . . . . . . . . . . . . . . . . . . . . . . . . . . . . . . . . . . . . . . . . . . . . . . . . . . . . . . . . . . . . . . . . . . . . . . . . . . . . . . . . . . . . . . . . . . . . . . . . . . . . . . . . . . . . . . . . . . . . . . . . . . . . 316.2 Summary of 2030 Bus Corridor Recommendations and Capital Costs . . . . . . . . . . . . . . . . . . . . . . . . . . . . . . . . . . . . . . . . . . . . . . . . . . . . . . . . . . . . . . . . . . . . . . . . . . . . . . . . . . . . . . . . . . . . . . . . . . . . . . . . . . . . . . . . . . . . . . . . . . . . . . . . . . . . . . . . . . . . . . . 376.3 Summary of 2030 Rail Corridor Recommendations and Capital Costs . . . . . . . . . . . . . . . . . . . . . . . . . . . . . . . . . . . . . . . . . . . . . . . . . . . . . . . . . . . . . . . . . . . . . . . . . . . . . . . . . . . . . . . . . . . . . . . . . . . . . . . . . . . . . . . . . . . . . . . . . . . . . . . . . . . . . . . . . . . . . . . 427.1 Existing Commitments through Year 2018 . . . . . . . . . . . . . . . . . . . . . . . . . . . . . . . . . . . . . . . . . . . . . . . . . . . . . . . . . . . . . . . . . . . . . . . . . . . . . . . . . . . . . . . . . . . . . . . . . . . . . . . . . . . . . . . . . . . . . . . . . . . . . . . . . . . . . . . . . . . . . . . . . . . . . . . . . . . . . . . . . . . . . . 667.2 2030 Transit System Plan – Bus and Rail Project Phasing . . . . . . . . . . . . . . . . . . . . . . . . . . . . . . . . . . . . . . . . . . . . . . . . . . . . . . . . . . . . . . . . . . . . . . . . . . . . . . . . . . . . . . . . . . . . . . . . . . . . . . . . . . . . . . . . . . . . . . . . . . . . . . . . . . . . . . . . . . . . . . . . . . . . . . . . . 687.3 Summary of Rail Project Development Approach . . . . . . . . . . . . . . . . . . . . . . . . . . . . . . . . . . . . . . . . . . . . . . . . . . . . . . . . . . . . . . . . . . . . . . . . . . . . . . . . . . . . . . . . . . . . . . . . . . . . . . . . . . . . . . . . . . . . . . . . . . . . . . . . . . . . . . . . . . . . . . . . . . . . . . . . . . . . . . . . 70
AppendicesA Summary of Member City Input . . . . . . . . . . . . . . . . . . . . . . . . . . . . . . . . . . . . . . . . . . . . . . . . . . . . . . . . . . . . . . . . . . . . . . . . . . . . . . . . . . . . . . . . . . . . . . . . . . . . . . . . . . . . . . . . . . . . . . . . . . . . . . . . . . . . . . . . . . . . . . . . . . . . . . . . . . . . . . . . . . . . . . . . . . . . . A-1B Summary of Public Comments . . . . . . . . . . . . . . . . . . . . . . . . . . . . . . . . . . . . . . . . . . . . . . . . . . . . . . . . . . . . . . . . . . . . . . . . . . . . . . . . . . . . . . . . . . . . . . . . . . . . . . . . . . . . . . . . . . . . . . . . . . . . . . . . . . . . . . . . . . . . . . . . . . . . . . . . . . . . . . . . . . . . . . . . . . . . . . A-7
October 2006
2030 Transit System Plan - Table of Contents

October 2006
This page intentionally left blank.
1 October 2006
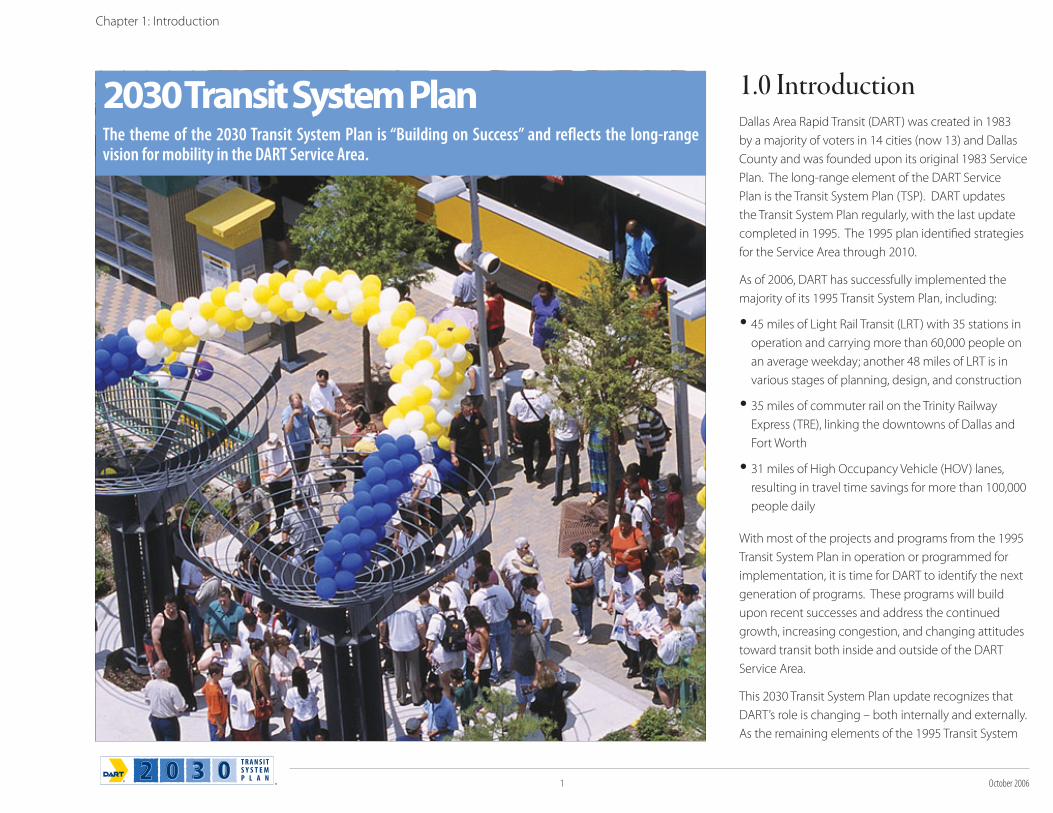
1.0 IntroductionDallas Area Rapid Transit (DART) was created in 1983
by a majority of voters in 14 cities (now 13) and Dallas
County and was founded upon its original 1983 Service
Plan. The long-range element of the DART Service
Plan is the Transit System Plan (TSP). DART updates
the Transit System Plan regularly, with the last update
completed in 1995. The 1995 plan identified strategies
for the Service Area through 2010.
As of 2006, DART has successfully implemented the
majority of its 1995 Transit System Plan, including:
45 miles of Light Rail Transit (LRT) with 35 stations in
operation and carrying more than 60,000 people on
an average weekday; another 48 miles of LRT is in
various stages of planning, design, and construction
35 miles of commuter rail on the Trinity Railway
Express (TRE), linking the downtowns of Dallas and
Fort Worth
31 miles of High Occupancy Vehicle (HOV) lanes,
resulting in travel time savings for more than 100,000
people daily
With most of the projects and programs from the 1995
Transit System Plan in operation or programmed for
implementation, it is time for DART to identify the next
generation of programs. These programs will build
upon recent successes and address the continued
growth, increasing congestion, and changing attitudes
toward transit both inside and outside of the DART
Service Area.
This 2030 Transit System Plan update recognizes that
DART’s role is changing – both internally and externally.
As the remaining elements of the 1995 Transit System
2030 Transit System PlanThe theme of the 2030 Transit System Plan is “Building on Success” and reflects the long-range vision for mobility in the DART Service Area.
Chapter 1: Introduction
October 2006 2
Chapter 1: Introduction
GUIDING PRINCIPLESAs adopted by the DART Board of Directors (Resolution 010151)
Mobility
Identify future market needs and new market opportunities.
Provide a system that attracts new customers, particularly single occupant vehicle users, while serving transit- dependent customers.
Provide an integrated transportation system with the appropriate level of capacity, accessibility, and performance to meet customer needs.
Consider opportunities to preserve right of-way options for future transit use.
Fiscal Responsibility
Provide a system that is efficient, cost-effective, and affordable.
Land Use and Economic Development
Promote a region that is transit-oriented and places priority on transit.
Support transportation and land use planning that helps achieve a better quality of life within the North Texas region.
Provide a system that is compatible with the community it serves and minimizes environmental impacts.
Support member cities’ economic development objectives by coordinating improved transit services.
Encourage initiatives to invest at or near transit facilities.
Planning Process
Establish a common vision for transportation that is regionally accepted, progressively implemented through a comprehensive system plan, and periodically revisited.
Develop and enhance coalitions with all organizations that have a vested interest in regional transportation issues.
Develop a system plan that provides a sound basis for subsequent, more detailed planning studies.
Plan are constructed, DART will make the transition to
primarily an operating agency. This places renewed
importance on maintaining and enhancing the existing
system to accommodate additional service as well as
expansion projects over time. Additionally, DART has
demonstrated its ability to build and operate rail transit,
giving the agency an opportunity to be at the forefront
of regional transit opportunities in North Texas.
DART is proud to be a partner in regional mobility and
is excited about the continuing prospects that transit
brings to help shape our communities and enhance
economic development. For this reason, the 2030
TSP goes beyond simply identifying a set of projects
and instead focuses on the role of each plan element,
discussing how the existing, planned, and future transit
elements can be cost-effectively integrated into the
communities they serve.
1.1 Planning ProcessThe 2030 TSP was developed using a three-step
planning process supported by public and agency
involvement. The process began with an assessment
of mobility needs in the DART Service Area and a
larger regional study area, including changes in
demographics, travel patterns, and congestion. The
second step defined corridor opportunities and various
service strategies to meet the identified mobility needs.
The last step focused on the evaluation of alternatives,
including a trade-off analysis within financial
constraints through 2030.
The 2030 TSP has gained broad-based support for
the plan in accordance with the Guiding Principles
(see sidebar) established by the DART Board. This
was accomplished through public meetings at key
milestones, meetings with member cities’ staffs and
elected officials, and briefings to a range of interested
organizations and stakeholders. This broad-based
support, as well as an understanding of specific areas
of community concern, will help set the stage for more
detailed, project specific studies.
1.2 Relationship to Other PlansWhile the Transit System Plan provides the overall
vision and direction for DART’s future capital and
operating programs, it provides input for, and is
affected by, several other plans, including:
DART Service Plan – required under DART’s enabling
legislation, this plan states commitments to member
cities and identifies the specific location of fixed
guideway and major transit facilities
DART Strategic Plan – identifies the key initiatives
that must be completed to achieve Board goals and
meet DART’s vision of success
DART Business Plan – defines how the Strategic Plan
will be achieved with performance indicators to
measure success
DART Twenty-Year Financial Plan – compiles
anticipated revenues and expenditures over a
20-year period to budget resources for operations,
maintenance, and growth of DART programs and
services, thus providing an estimate of available
resources for Transit System Plan elements
DART Five-Year Action Plan – provides detailed
information to increase bus and rail ridership
through service changes over a five-year period
North Central Texas Council of Governments
(NCTCOG) Regional Metropolitan Transportation
Plan – the Transit System Plan provides input to the
regional plan. DART projects must be included in
3 October 2006
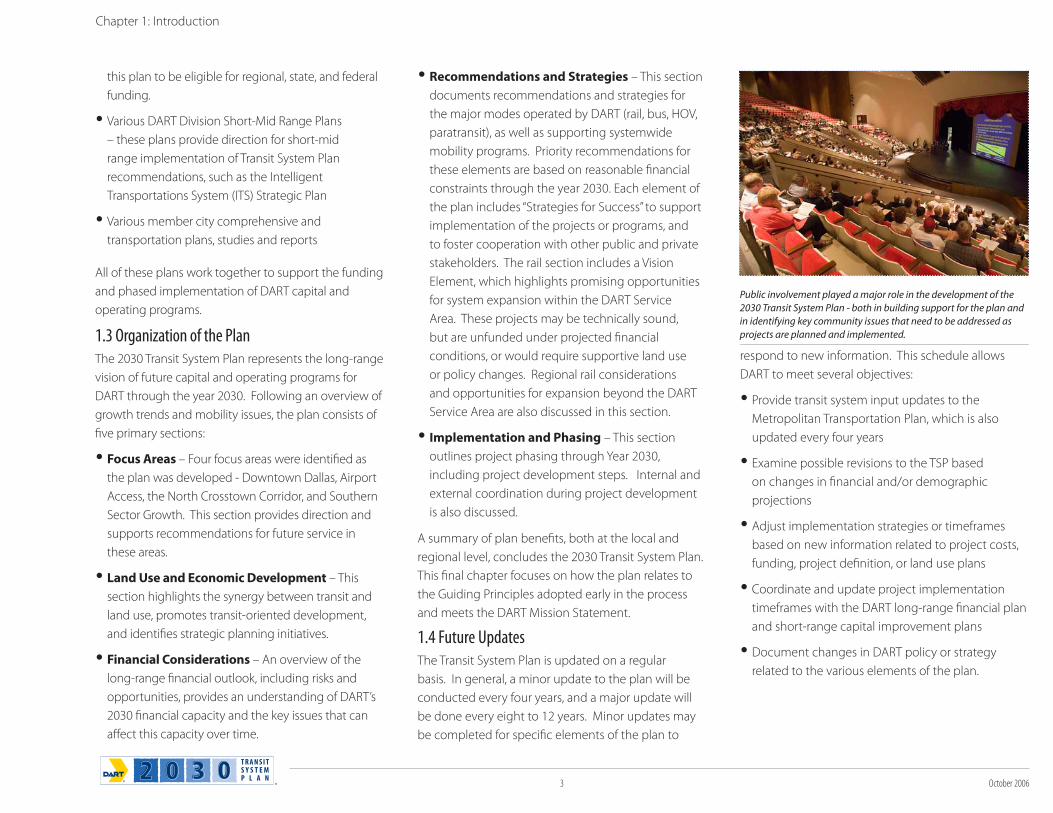
Public involvement played a major role in the development of the
2030 Transit System Plan - both in building support for the plan and
in identifying key community issues that need to be addressed as
projects are planned and implemented.
Chapter 1: Introduction
this plan to be eligible for regional, state, and federal
funding.
Various DART Division Short-Mid Range Plans
– these plans provide direction for short-mid
range implementation of Transit System Plan
recommendations, such as the Intelligent
Transportations System (ITS) Strategic Plan
Various member city comprehensive and
transportation plans, studies and reports
All of these plans work together to support the funding
and phased implementation of DART capital and
operating programs.
1.3 Organization of the PlanThe 2030 Transit System Plan represents the long-range
vision of future capital and operating programs for
DART through the year 2030. Following an overview of
growth trends and mobility issues, the plan consists of
five primary sections:
Focus Areas – Four focus areas were identified as
the plan was developed - Downtown Dallas, Airport
Access, the North Crosstown Corridor, and Southern
Sector Growth. This section provides direction and
supports recommendations for future service in
these areas.
Land Use and Economic Development – This
section highlights the synergy between transit and
land use, promotes transit-oriented development,
and identifies strategic planning initiatives.
Financial Considerations – An overview of the
long-range financial outlook, including risks and
opportunities, provides an understanding of DART’s
2030 financial capacity and the key issues that can
affect this capacity over time.
Recommendations and Strategies – This section
documents recommendations and strategies for
the major modes operated by DART (rail, bus, HOV,
paratransit), as well as supporting systemwide
mobility programs. Priority recommendations for
these elements are based on reasonable financial
constraints through the year 2030. Each element of
the plan includes “Strategies for Success” to support
implementation of the projects or programs, and
to foster cooperation with other public and private
stakeholders. The rail section includes a Vision
Element, which highlights promising opportunities
for system expansion within the DART Service
Area. These projects may be technically sound,
but are unfunded under projected financial
conditions, or would require supportive land use
or policy changes. Regional rail considerations
and opportunities for expansion beyond the DART
Service Area are also discussed in this section.
Implementation and Phasing – This section
outlines project phasing through Year 2030,
including project development steps. Internal and
external coordination during project development
is also discussed.
A summary of plan benefits, both at the local and
regional level, concludes the 2030 Transit System Plan.
This final chapter focuses on how the plan relates to
the Guiding Principles adopted early in the process
and meets the DART Mission Statement.
1.4 Future UpdatesThe Transit System Plan is updated on a regular
basis. In general, a minor update to the plan will be
conducted every four years, and a major update will
be done every eight to 12 years. Minor updates may
be completed for specific elements of the plan to
respond to new information. This schedule allows
DART to meet several objectives:
Provide transit system input updates to the
Metropolitan Transportation Plan, which is also
updated every four years
Examine possible revisions to the TSP based
on changes in financial and/or demographic
projections
Adjust implementation strategies or timeframes
based on new information related to project costs,
funding, project definition, or land use plans
Coordinate and update project implementation
timeframes with the DART long-range financial plan
and short-range capital improvement plans
Document changes in DART policy or strategy
related to the various elements of the plan.
October 2006 4
Chapter 2: Growth Trends and Mobility Issues
2.0 Growth Trends and Mobility IssuesThe DART Service Area is made up of 13 member cities
encompassing 700 square miles. Meeting the mobility
needs of such a large metropolitan area in a cost-
effective manner can be challenging, especially when
growth and development patterns are not always
oriented toward transit. These past growth trends
appear to be changing based on recent legislative
actions and policy changes and are further supported
by member cities’ efforts to focus development
around transit (see Chapter 4). The following sections
highlight growth trends and mobility issues affecting
both the DART Service Area and the larger Dallas-Fort
Worth (DFW) region through the Year 2030.
2.1 Local and Regional Growth PatternsThe Dallas-Fort Worth region has been one of the
fastest growing areas of the country during the
last 20 years and is expected to continue this trend
through the year 2030. NCTCOG regularly updates
its demographic projections to predict local and
regional growth patterns. The Transit System Plan used
approved Year 2030 demographic projections as the
basis for plan development and analysis. Sensitivity
tests were also conducted using an alternative set of
demographics that recognize the recent City of Dallas
forwardDallas! comprehensive plan vision, which
is not reflected in the approved regional forecasts.
The results of these sensitivity tests are discussed in
Chapter 4, Land Use and Economic Development.
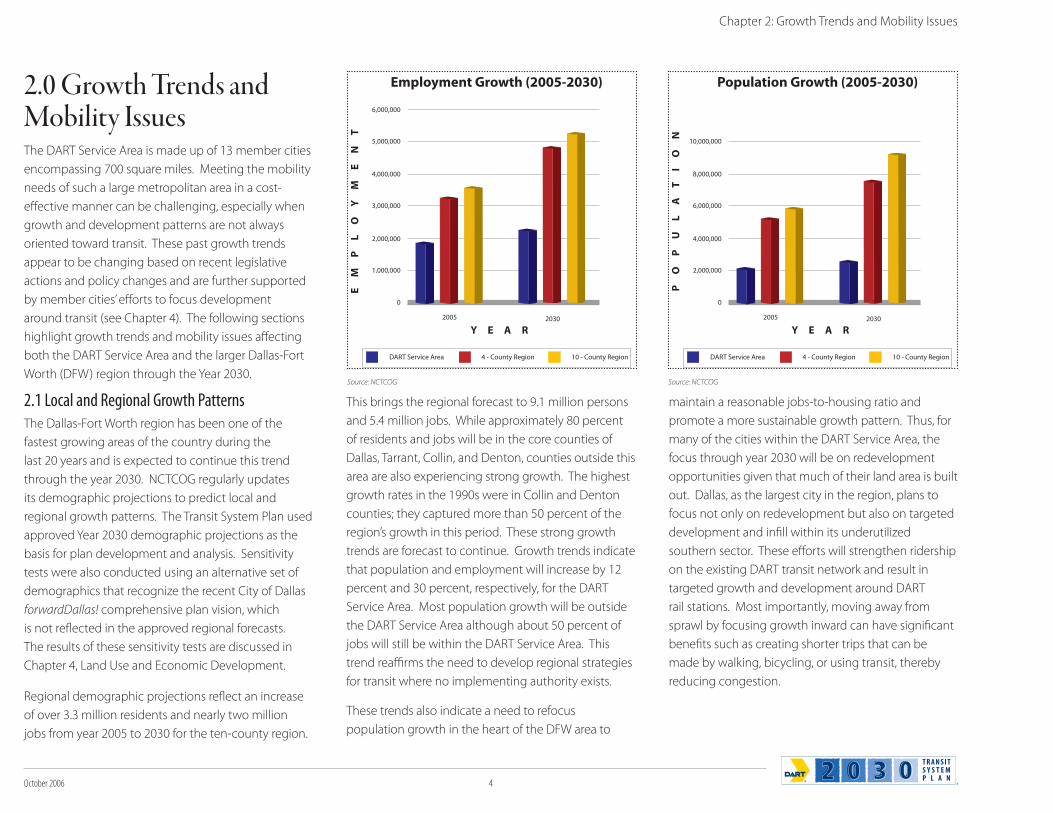
Regional demographic projections reflect an increase
of over 3.3 million residents and nearly two million
jobs from year 2005 to 2030 for the ten-county region.
This brings the regional forecast to 9.1 million persons
and 5.4 million jobs. While approximately 80 percent
of residents and jobs will be in the core counties of
Dallas, Tarrant, Collin, and Denton, counties outside this
area are also experiencing strong growth. The highest
growth rates in the 1990s were in Collin and Denton
counties; they captured more than 50 percent of the
region’s growth in this period. These strong growth
trends are forecast to continue. Growth trends indicate
that population and employment will increase by 12
percent and 30 percent, respectively, for the DART
Service Area. Most population growth will be outside
the DART Service Area although about 50 percent of
jobs will still be within the DART Service Area. This
trend reaffirms the need to develop regional strategies
for transit where no implementing authority exists.
These trends also indicate a need to refocus
population growth in the heart of the DFW area to
maintain a reasonable jobs-to-housing ratio and
promote a more sustainable growth pattern. Thus, for
many of the cities within the DART Service Area, the
focus through year 2030 will be on redevelopment
opportunities given that much of their land area is built
out. Dallas, as the largest city in the region, plans to
focus not only on redevelopment but also on targeted
development and infill within its underutilized
southern sector. These efforts will strengthen ridership
on the existing DART transit network and result in
targeted growth and development around DART
rail stations. Most importantly, moving away from
sprawl by focusing growth inward can have significant
benefits such as creating shorter trips that can be
made by walking, bicycling, or using transit, thereby
reducing congestion.
Source: NCTCOG
6,000,000
5,000,000
4,000,000
3,000,000
2,000,000
1,000,000
2005
Y E A R
Employment Growth (2005-2030)
EM
PL
OY
ME
NT
2030
0
DART Service Area 4 - County Region 10 - County Region
10,000,000
8,000,000
6,000,000
4,000,000
2,000,000
2005
Y E A R
Population Growth (2005-2030)
PO
PU
LA
TI
ON
2030
0
DART Service Area 4 - County Region 10 - County Region
Source: NCTCOG
5 October 2006
Chapter 2: Growth Trends and Mobility Issues
2.2 Changes in Travel Patterns and CongestionIn terms of changing travel patterns, the region
will continue to see a strong demand toward key
regional activity centers/employment areas in the
DART Service Area, such as downtown Dallas, the
Southwestern Medical District, Stemmons Corridor,
Las Colinas, Galleria/Tollway Corridor, DFW Airport,
the Telecom Corridor, and Legacy. As the population
increases, trip patterns to these areas are becoming
more dispersed and crosstown demand is becoming
stronger.
Nearly doubling the region’s population and
employment translates into a comparable increase
in vehicle miles of travel and fuel consumption.
Although these factors increase by a factor of nearly
two, congestion delay – the amount of time people
are stuck in traffic – is expected to increase by a factor
of five. This means that transportation improvements
in the region cannot keep pace with population
growth. As indicated by NCTCOG forecasts, the areas
with the highest levels of congestion will continue to
be seen in the northern part of the DART Service Area.
DART is committed to being a key part of the solution
that keeps residents and employees moving. DART
will work to sustain and promote transit-oriented
land use planning and economic development, while
working toward improving the quality of life in our
region. In congested corridors, especially during
peak periods, transit is increasingly a key part of the
mobility solution (see Spotlight on Success next
page).
2.3 Regional Transportation IssuesAt a regional and state level, there are several
initiatives and policy discussions that can affect
the region’s growth patterns, the development of
the transportation system, and DART’s role as a
transportation provider. A brief discussion of these
key issues and how they may shape the future of
transportation in the region is provided below.
Sustainable DevelopmentRegional growth trends through 2030 indicate that
only one-third of the projected growth might occur
within the existing Dallas-Fort Worth urbanized area,
while the other two-thirds might occur in current rural
areas on the fringes of the Metroplex. This growth
pattern brings into question the sustainability of
the region and the ability of resources such as the
transportation network in the fringe area to handle
the growth. These concerns created the Vision
North Texas effort and have led NCTCOG to establish
sustainable development as the region’s new strategic
approach to transportation planning.
As part of this new approach, NCTCOG is testing
alternative land use scenarios to better understand
the implications of growth options. Alternative land
use scenarios that focus development around rail or
infill areas have been found to significantly reduce
the amount of miles traveled, congestion delay, and
the cost and amount of new highways needed to
meet demand. This also means a much higher use
of the transit system. DART member cities are also
embracing this approach. Overall, this creates policy
implications at a regional level to shape the region’s
future and supports the need to expand the role of
transit, particularly rail, in the future.
Regional Transit InitiativeThe Metropolitan Transportation Plan includes
numerous regional rail corridors, most of which
are in areas that are not served by DART or another
transit authority. To respond to future transit needs,
NCTCOG completed a Regional Rail Corridor Study in
2004, which provided recommendations addressing
regional rail needs.
A parallel and ongoing effort was the Regional Transit
Initiative (RTI). The RTI has focused on developing
solutions related to institutional, funding, and
legislative issues. The general consensus of the RTI
is to establish a Regional Rail Authority that would
partner with existing transit authorities to provide
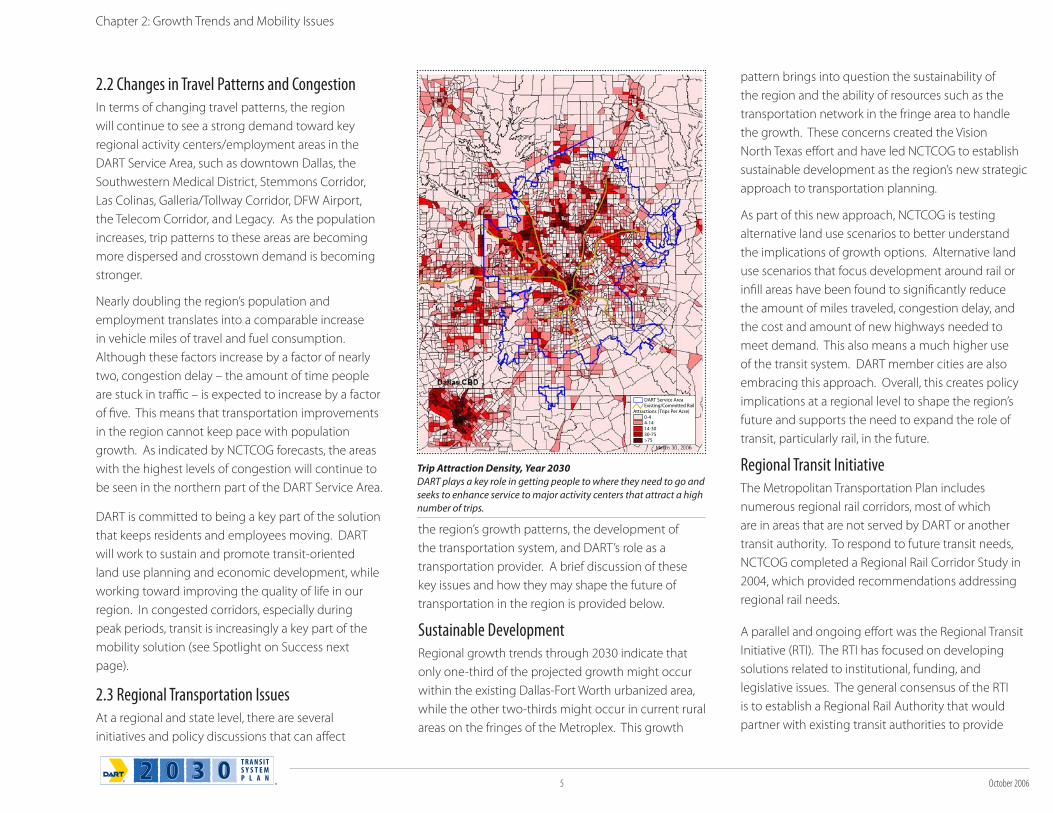
DART Service AreaExisting/Committed Rail
Attractions (Trips Per Acre)0-44-1414-3030-75>75
Trip Attraction Density, Year 2030DART plays a key role in getting people to where they need to go and
seeks to enhance service to major activity centers that attract a high
number of trips.
October 2006 6
Chapter 2: Growth Trends and Mobility Issues
seamless transit in the region. The RTI recommended
that the state sales tax be used to fund the Regional
Rail Authority by raising the sales tax cap by one-half
of one-cent. DART supports an option of exempting
transit from the sales tax cap. Thus, DART member
cities would retain the one-cent sales tax for transit,
but could vote to raise the sales tax for economic
development or other purposes.
As of 2006, the RTI focus has shifted to working with
state legislators to achieve enabling legislation that
would implement its recommendations. Given
DART’s proven track record in planning, building,
and operating a successful transit system, DART is
well-positioned to be a leader in regional transit and
continues to be a key partner in the RTI discussions.
Tollroads and Managed HOV LanesIn the future, there will be insufficient public
financial resources to expand the roadway system
to accommodate the increasing traffic demand. The
inability to keep up with growth can add to projected
traffic congestion and air pollution in the region. In
response, state and regional transportation leaders are
proposing to fund more roads through tolls. These
tollroads could be built by a public-private partnership
through the use of Comprehensive Development
Agreements between the State of Texas and private
partners.
Moving people from single occupancy vehicles to
HOVs will continue to be a key part of the regional
mobility solution. The expansion of the HOV lane
system is a high priority in the region. Some of the
HOV accommodation will be via Managed Lanes in
freeway corridors that allow HOV for a reduced toll
and single-occupant vehicles (SOV) for a higher toll
if excess capacity is available. Several policy-level
discussions have taken place and will continue to
take place to solidify the framework for moving
toward managed HOV lanes that incorporate a toll
component and the roles that agencies such as DART
have in their planning, design, and operation.
Trans-Texas CorridorThe Trans-Texas Corridor (TTC) is a proposed network
of multi-use corridors including:
Separate lanes for passenger cars and trucks
Freight railways
High-speed commuter rail
Infrastructure for utilities
One of the high priority corridors is TTC-35, which
generally parallels IH-35. One of the key regional
issues is the potential routing of this corridor and
how it will interconnect with regional transportation
systems, including DART facilities. The Texas
Department of Transportation recently announced a
preferred route that would bypass the Dallas area to
the east. DART continues to monitor the Trans-Texas
Corridor and how its development will influence the
transit system.
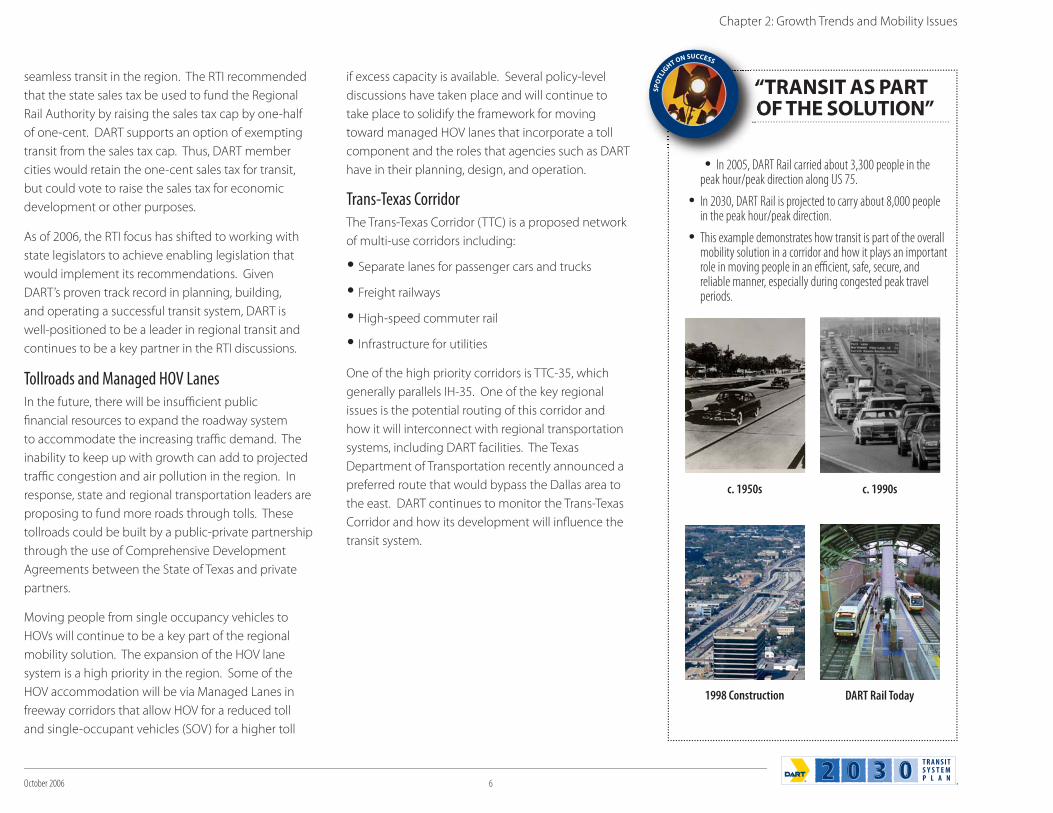
“TRANSIT AS PARTOF THE SOLUTION”
In 2005, DART Rail carried about 3,300 people in the peak hour/peak direction along US 75.
In 2030, DART Rail is projected to carry about 8,000 people in the peak hour/peak direction.
This example demonstrates how transit is part of the overall mobility solution in a corridor and how it plays an important role in moving people in an efficient, safe, secure, and reliable manner, especially during congested peak travel periods.
SP
OT
LIG
HT ON SUCCESS
7 October 2006
Chapter 3: Focus Areas
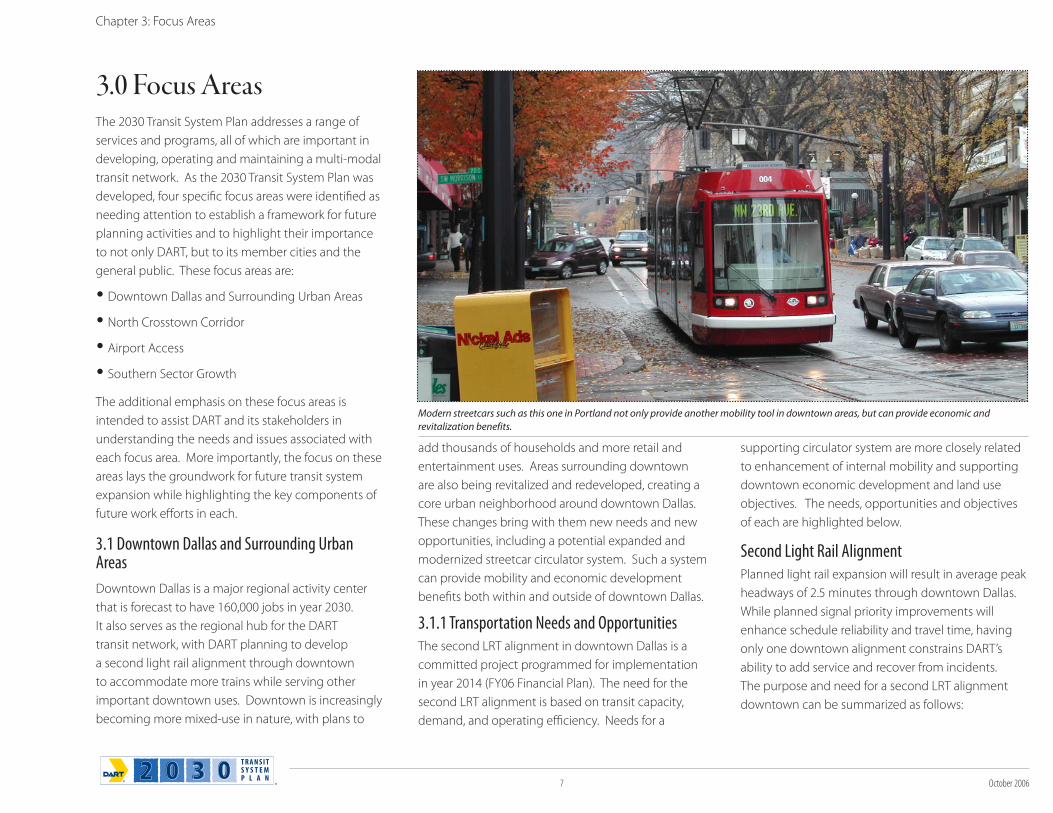
Modern streetcars such as this one in Portland not only provide another mobility tool in downtown areas, but can provide economic and
revitalization benefits.
3.0 Focus AreasThe 2030 Transit System Plan addresses a range of
services and programs, all of which are important in
developing, operating and maintaining a multi-modal
transit network. As the 2030 Transit System Plan was
developed, four specific focus areas were identified as
needing attention to establish a framework for future
planning activities and to highlight their importance
to not only DART, but to its member cities and the
general public. These focus areas are:
Downtown Dallas and Surrounding Urban Areas
North Crosstown Corridor
Airport Access
Southern Sector Growth
The additional emphasis on these focus areas is
intended to assist DART and its stakeholders in
understanding the needs and issues associated with
each focus area. More importantly, the focus on these
areas lays the groundwork for future transit system
expansion while highlighting the key components of
future work efforts in each.
3.1 Downtown Dallas and Surrounding Urban Areas
Downtown Dallas is a major regional activity center
that is forecast to have 160,000 jobs in year 2030.
It also serves as the regional hub for the DART
transit network, with DART planning to develop
a second light rail alignment through downtown
to accommodate more trains while serving other
important downtown uses. Downtown is increasingly
becoming more mixed-use in nature, with plans to
add thousands of households and more retail and
entertainment uses. Areas surrounding downtown
are also being revitalized and redeveloped, creating a
core urban neighborhood around downtown Dallas.
These changes bring with them new needs and new
opportunities, including a potential expanded and
modernized streetcar circulator system. Such a system
can provide mobility and economic development
benefits both within and outside of downtown Dallas.
3.1.1 Transportation Needs and OpportunitiesThe second LRT alignment in downtown Dallas is a
committed project programmed for implementation
in year 2014 (FY06 Financial Plan). The need for the
second LRT alignment is based on transit capacity,
demand, and operating efficiency. Needs for a
supporting circulator system are more closely related
to enhancement of internal mobility and supporting
downtown economic development and land use
objectives. The needs, opportunities and objectives
of each are highlighted below.
Second Light Rail AlignmentPlanned light rail expansion will result in average peak
headways of 2.5 minutes through downtown Dallas.
While planned signal priority improvements will
enhance schedule reliability and travel time, having
only one downtown alignment constrains DART’s
ability to add service and recover from incidents.
The purpose and need for a second LRT alignment
downtown can be summarized as follows:
October 2006 8
Increase capacity
Maximize operating flexibility
Increase service coverage
Provide system redundancy through downtown
core
Enhance transit-oriented and economic
development opportunity
Prior studies by DART and the City of Dallas have
examined potential locations for the second light
rail alignment. In 2006, the DART Central Business
District (CBD) Alternatives Analysis (AA) was officially
initiated under the Federal project development
process to develop and evaluate alignment options.
The AA effort will culminate with a Locally Preferred
Alternative, which will include the recommended
alignment as well as support future actions related to
supporting elements such as streetcar and bus.
The City of Dallas Comprehensive Transportation Plan
for the Dallas Central Business District (June 2005)
outlines a vision for downtown land uses as well as
a transportation network that balances pedestrians,
transit, bicycles, and automobiles to ensure safe and
efficient movement of employees, residents and
visitors. The plan includes recommendations for each
mode, including a broad corridor identified for the
future second light rail alignment (see map). This
corridor generally follows Lamar-Field (north-south)
and Commerce-Young (east-west), and includes a
below-grade recommendation between Ross and
Commerce. This option will be one of the potential
alignment alternatives considered during the AA
study.
Circulator System NeedsThe two downtown light rail alignments will serve
some short intra-CBD trips, but primarily will be
used to bring people to and through downtown. A
comprehensive circulator system can strengthen the
light rail network by increasing connectivity between
rail and other key uses and activity centers beyond a
comfortable walk distance. While a range of services
can meet these needs, streetcars can be the most
effective in supporting revitalization efforts or tourism
objectives. Buses will continue to play a key role in
bringing people to downtown Dallas – both as a
destination and as a transfer point to other services.
Streetcars can be successfully integrated into areas
that are mixed use and pedestrian-oriented. With
downtown Dallas and many of its surrounding urban
neighborhoods taking on such characteristics, there
Chapter 3: Focus Areas
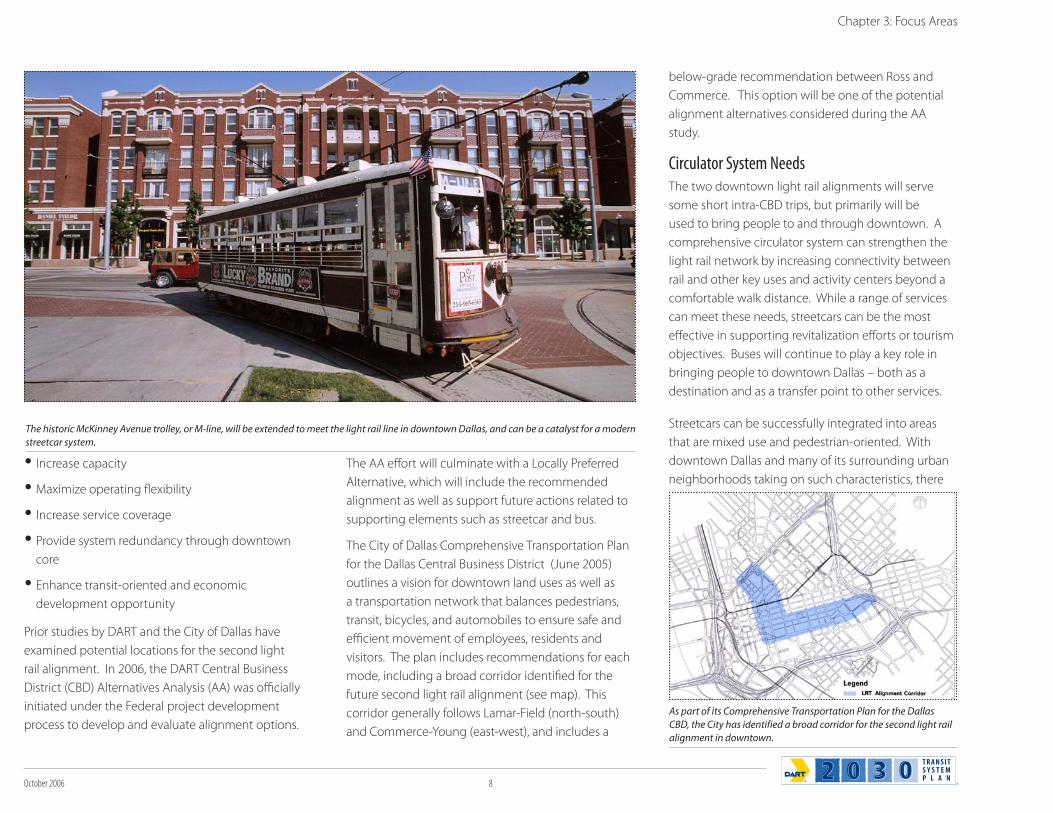
The historic McKinney Avenue trolley, or M-line, will be extended to meet the light rail line in downtown Dallas, and can be a catalyst for a modern
streetcar system.
As part of its Comprehensive Transportation Plan for the Dallas
CBD, the City has identified a broad corridor for the second light rail
alignment in downtown.
9 October 2006
will be a need for a system to serve these shorter trips.
This system will link distinct activity centers or districts
to the greater regional transit network and to each
other.
The City of Dallas comprehensive plan includes a
Downtown Streetcar Action Plan. This effort would
explore the benefits, costs and implementation of
a Downtown Dallas Streetcar and would be closely
coordinated with the DART CBD AA effort.
Opportunities in Surrounding Urban Neighborhoods
Although the inner loop of downtown will be
the focus of future studies, there are additional
opportunities for streetcar service surrounding
downtown that should be considered in developing
a possible system downtown. These areas include
east Dallas, the Design District, south Dallas/Farmers
Market, and Oak Cliff. The McKinney Avenue Streetcar
serves Uptown, with its high-density mix of uses.
With a planned extension from Ross to Bryan Street,
interface with the light rail system will be greatly
enhanced. There is also a desire to integrate the
historic McKinney Avenue trolley service with a
modern streetcar. This modernization effort could
be the first step towards creating a modern streetcar
system within and surrounding Dallas. In the future,
there may also be other locations within the DART
Service Area that have land use characteristics to
support a streetcar application.
3.1.2 DART’s RoleDART will continue to play a lead role in the
development of the second downtown light
rail alignment. Part of this effort will be to
cooperatively work with the City of Dallas to explore
opportunities for a modern streetcar system that
would complement light rail. Streetcars provide
an opportunity to partner with the private sector
to jointly build and operate such a system. DART is
committed to exploring the potential for streetcars as
part of future planning efforts. During future planning
the role of DART, the City of Dallas, and the private
sector will be defined in more detail so that specific
corridors and implementation framework can be
pursued.
3.2 North Crosstown CorridorThe original 1983 Service Plan upon which DART was
founded identified the Cotton Belt railroad corridor
as a future passenger rail corridor. While the Cotton
Belt remains in the DART Service Plan, subsequent
Transit System Plan documents (1988, 1995) did not
prioritize this corridor for implementation. Although
the draft 1995 plan recommended commuter rail on
the Cotton Belt, public concerns resulted in the 1995
plan identifying a range of alternatives for further
study to serve the east-west North Crosstown corridor
movement. Subsequent studies examined a range
of alternatives; however, no resolution was reached
and all alternatives remained within both the DART
plan and the NCTCOG Metropolitan Transportation
Plan. This important east-west travel corridor was
re-examined as part of the 2030 Transit System Plan
effort in order to evaluate the alternatives with the
latest information.
3.2.1 Corridor NeedsThe northern part of the DART Service Area is one
of the most congested areas in the DART Service
Area. Employment centers along LBJ Freeway, the
President George Bush Turnpike and the Dallas North
Tollway attract a significant number of trips each
day. While DART provides bus service to these areas,
there is a significant need for higher-capacity transit
connections that link the existing and planned radial
rail system to these areas. Based on future Year 2030
projections, there will be a nearly 25,000-peak hour,
person trip capacity shortfall on east-west travel
corridors (freeways and major streets) in this area.
This shortfall translates into traffic congestion and
increasing traffic on arterial roadways as freeway
congestion increases. The focus of the 2030 Transit
System Plan effort was to find a transit solution(s) that
could address some of this future need while also
enhancing economic development opportunities (by
maintaining its regional competitiveness), and quality
of life in this broad corridor. These linkages will not
only benefit the North Crosstown Corridor residents
and employers, but also will enhance mobility and job
Chapter 3: Focus Areas
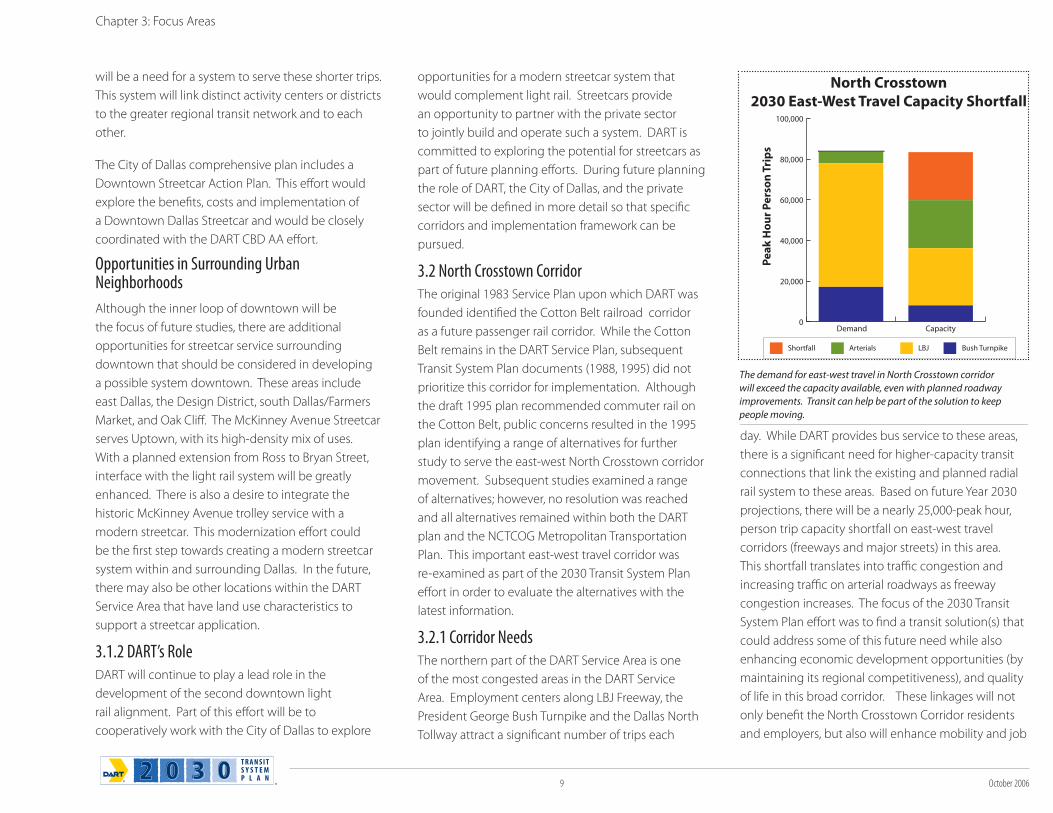
North Crosstown
2030 East-West Travel Capacity Shortfall
Pe
ak
Ho
ur
Pe
rso
n T
rip
s
Shortfall Arterials LBJ Bush Turnpike
0
20,000
40,000
60,000
80,000
100,000
Capacity Demand
The demand for east-west travel in North Crosstown corridor
will exceed the capacity available, even with planned roadway
improvements. Transit can help be part of the solution to keep
people moving.
October 2006 10
opportunities for people throughout the remainder of
the Service Area.
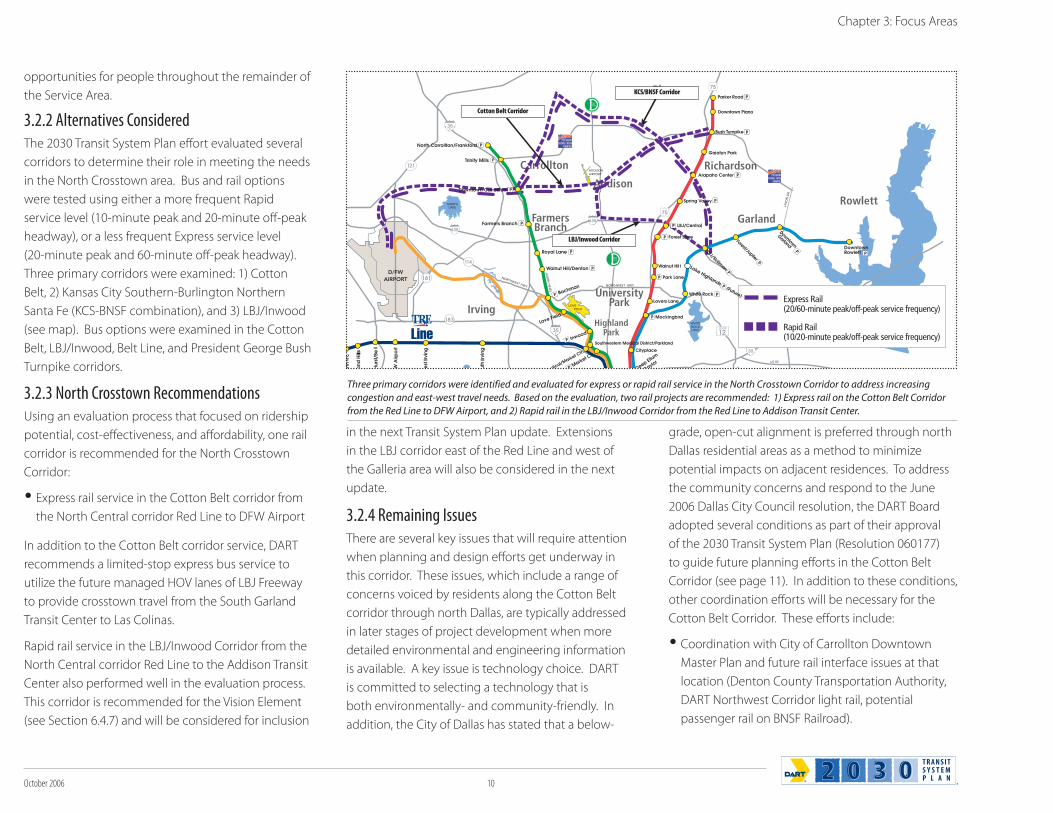
3.2.2 Alternatives ConsideredThe 2030 Transit System Plan effort evaluated several
corridors to determine their role in meeting the needs
in the North Crosstown area. Bus and rail options
were tested using either a more frequent Rapid
service level (10-minute peak and 20-minute off-peak
headway), or a less frequent Express service level
(20-minute peak and 60-minute off-peak headway).
Three primary corridors were examined: 1) Cotton
Belt, 2) Kansas City Southern-Burlington Northern
Santa Fe (KCS-BNSF combination), and 3) LBJ/Inwood
(see map). Bus options were examined in the Cotton
Belt, LBJ/Inwood, Belt Line, and President George Bush
Turnpike corridors.
3.2.3 North Crosstown RecommendationsUsing an evaluation process that focused on ridership
potential, cost-effectiveness, and affordability, one rail
corridor is recommended for the North Crosstown
Corridor:
Express rail service in the Cotton Belt corridor from
the North Central corridor Red Line to DFW Airport
In addition to the Cotton Belt corridor service, DART
recommends a limited-stop express bus service to
utilize the future managed HOV lanes of LBJ Freeway
to provide crosstown travel from the South Garland
Transit Center to Las Colinas.
Rapid rail service in the LBJ/Inwood Corridor from the
North Central corridor Red Line to the Addison Transit
Center also performed well in the evaluation process.
This corridor is recommended for the Vision Element
(see Section 6.4.7) and will be considered for inclusion
in the next Transit System Plan update. Extensions
in the LBJ corridor east of the Red Line and west of
the Galleria area will also be considered in the next
update.
3.2.4 Remaining IssuesThere are several key issues that will require attention
when planning and design efforts get underway in
this corridor. These issues, which include a range of
concerns voiced by residents along the Cotton Belt
corridor through north Dallas, are typically addressed
in later stages of project development when more
detailed environmental and engineering information
is available. A key issue is technology choice. DART
is committed to selecting a technology that is
both environmentally- and community-friendly. In
addition, the City of Dallas has stated that a below-
grade, open-cut alignment is preferred through north
Dallas residential areas as a method to minimize
potential impacts on adjacent residences. To address
the community concerns and respond to the June
2006 Dallas City Council resolution, the DART Board
adopted several conditions as part of their approval
of the 2030 Transit System Plan (Resolution 060177)
to guide future planning efforts in the Cotton Belt
Corridor (see page 11). In addition to these conditions,
other coordination efforts will be necessary for the
Cotton Belt Corridor. These efforts include:
Coordination with City of Carrollton Downtown
Master Plan and future rail interface issues at that
location (Denton County Transportation Authority,
DART Northwest Corridor light rail, potential
passenger rail on BNSF Railroad).
Chapter 3: Focus Areas
D.
US 80
NORTHWEST HWY.
LAVO
N D
R.
ADDISONAIRPORT
HA
RRY H
INES
WHITEROCKLAKE
NORTHLAKE
LAKERAY
HUBBARD
LOVEFIELD
D/FWAIRPORT
NORTHWEST HWY.
DENTONDR.
Rowlett
Plano
Garland
RichardsonCarrollton
Addison
FarmersBranch
IrvingHighland
Park
UniversityPark
KCS/BNSF Corridor
Cotton Belt Corridor
LBJ/Inwood Corridor
Express Rail(20/60-minute peak/off-peak service frequency)
Rapid Rail(10/20-minute peak/off-peak service frequency)
DowntownRowlett
Farmers Branch
Downtown Carrollton
Trinity Mills
North Carrollton/Frankford
Royal Lane
Walnut Hill/Denton
Bachman
Love Field
Inwood
Market Ctr.
Deep Ellum
Baylor
Southwestern Medical District/Parkland
Lake Highlands (Future)
Three primary corridors were identified and evaluated for express or rapid rail service in the North Crosstown Corridor to address increasing
congestion and east-west travel needs. Based on the evaluation, two rail projects are recommended: 1) Express rail on the Cotton Belt Corridor
from the Red Line to DFW Airport, and 2) Rapid rail in the LBJ/Inwood Corridor from the Red Line to Addison Transit Center.
11 October 2006
Coordination with DFW International Airport and
the Fort Worth Transportation Authority (The T)
regarding airport access (see also Section 3.3).
Coordination with the City of Dallas to preserve
right-of-way to incorporate a trail consistent with
the City of Dallas Trail Master Plan and consistent
with DART policy.
Pursuit of quiet zones where feasible to minimize
noise.
Exploration of funding and cost-sharing
opportunities for portions of the Cotton Belt that
are outside the DART Service area.
Although the LBJ/Inwood Corridor is included in
the Vision Element of the 2030 Transit System Plan,
DART will coordinate with the Texas Department of
Transportation on the final design and reconstruction
of LBJ to not preclude light rail, and to maximize
opportunities and access for express bus service.
Further information on these key issues and their role
in the Project Development Strategy is included in
Chapter 7, Implementation and Phasing.
3.3 Airport AccessTransit access to DFW International Airport and
Dallas Love Field is a priority for future DART system
expansion. Airport access can help to create a more
seamless transportation system and improve the
image of Dallas-Fort Worth as a world-class region.
The proposed approach for transit access to each
airport, including any outstanding issues, is discussed
below.
3.3.1 Dallas Love FieldDallas Love Field airport is located adjacent to the
Northwest Corridor light rail line, which initiated
construction in 2006. Annual passenger activity at
Dallas Love Field is approximately 7 million passengers,
ten percent of which is connecting passengers. Direct
light rail access to Dallas Love Field was evaluated in
detail as part of the Northwest Corridor Preliminary
Engineering/ Environmental Impact Statement (PE/EIS)
phase. During that effort, several concepts were
developed to serve Love Field. One concept, a tunnel
option with a station at the Love Field terminal area,
was refined through the PE/EIS process. This Love
Field Tunnel Option would have added a $160 million
incremental cost to the project.
The DART Board of Directors and the City of Dallas
executed an Interlocal Agreement (ILA) in February
2004, which included key conditions to be met in
order for DART to include the tunnel option as part
of the Northwest Corridor project. Since DART was
pursuing a $700 million Full Funding Grant Agreement
(FFGA) from the Federal Transit Administration (FTA),
maintaining a “Recommended” New Starts rating
on the Northwest/Southeast Minimum Operating
Segment (NW/SE MOS) project with the Love
Field Tunnel option was a key condition. Funding
commitments were also a condition, in which DART
made a $20 million contribution. Other funding
partners included the North Central Texas Council of
Governments (NCTCOG), the City of Dallas, and Dallas
County. The primary funding source from the City of
Dallas was assumed to be proceeds from a Passenger
Facility Charge (PFC) at Dallas Love Field.
On November 23, 2004, DART was notified by FTA that
the NW/SE MOS Federal Project with the Love Field
tunnel would receive a “Not Recommended” rating due
to “low” cost-effectiveness, thereby making the project
ineligible to proceed to final design or obtain federal
Chapter 3: Focus Areas
COTTON BELT
Corridor Development ConditionsThe following conditions are contained within DART Board Resolution 060177 (approved October 24, 2006) to guide future planning efforts in this corridor:
Actively pursue discussions with current users and rights holders regarding removal of freight from corridor.
DART will consider all mitigation alternatives in working with cities on environmental concerns. Evaluate potential impacts (noise, vibration, visual, traffic, safety, etc.) consistent with measures used in other DART projects. The City of Dallas preference is a trench. (Per the resolution, up to $50 million is allocated for these purposes)
Noise/vibration impacts will be mitigated to a level consistent with DART light rail.
Locomotive-hauled passenger rail will not be considered.
The size (length, height and width) of a rail car would generally be the same as the current DART light rail vehicle, within 8% measured in bulk as cubic feet.*
Emissions will meet or beat Environmental Protection Agency (EPA) standards of Tier IV (2011-2014)
City of Dallas has a preference for stations at Knoll Trail, Preston Road and west of Coit Road.
City of Dallas preference is to minimize number of tracks.
*Note: Discussions between DART and City of Dallas also focused on providing an equivalent number of passenger seats.
a)
b)
c)
d)
e)
f)
g)
h)
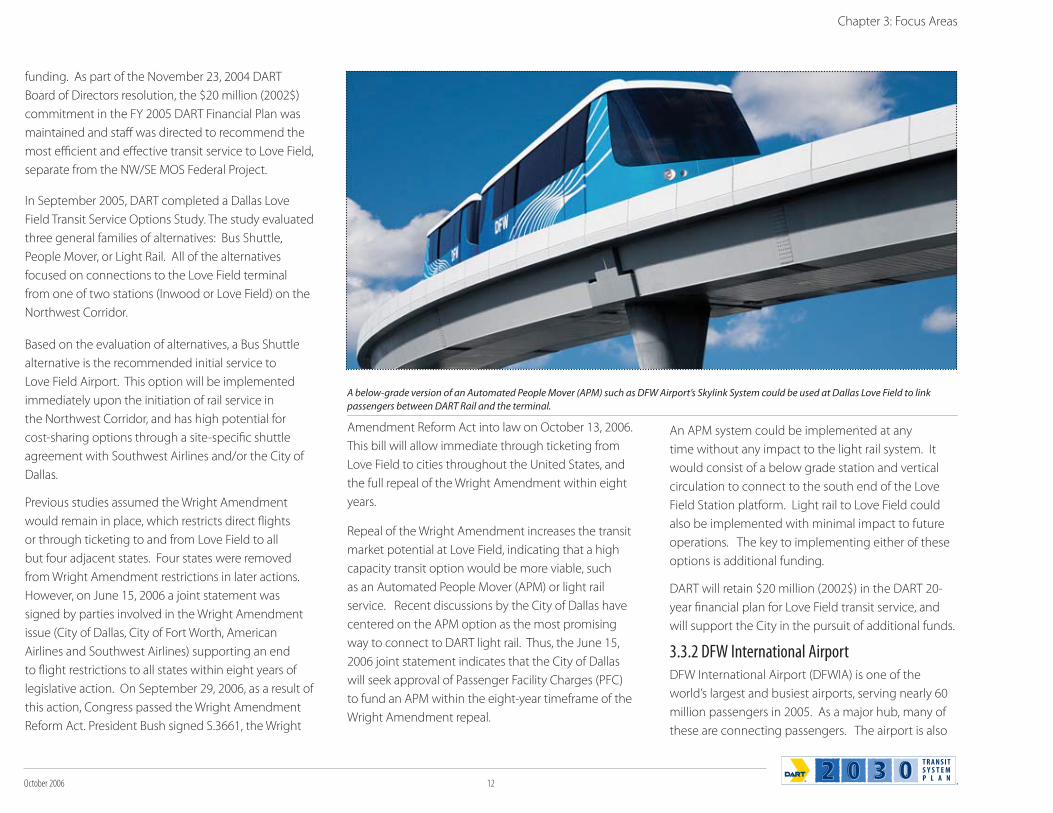
October 2006 12
funding. As part of the November 23, 2004 DART
Board of Directors resolution, the $20 million (2002$)
commitment in the FY 2005 DART Financial Plan was
maintained and staff was directed to recommend the
most efficient and effective transit service to Love Field,
separate from the NW/SE MOS Federal Project.
In September 2005, DART completed a Dallas Love
Field Transit Service Options Study. The study evaluated
three general families of alternatives: Bus Shuttle,
People Mover, or Light Rail. All of the alternatives
focused on connections to the Love Field terminal
from one of two stations (Inwood or Love Field) on the
Northwest Corridor.
Based on the evaluation of alternatives, a Bus Shuttle
alternative is the recommended initial service to
Love Field Airport. This option will be implemented
immediately upon the initiation of rail service in
the Northwest Corridor, and has high potential for
cost-sharing options through a site-specific shuttle
agreement with Southwest Airlines and/or the City of
Dallas.
Previous studies assumed the Wright Amendment
would remain in place, which restricts direct flights
or through ticketing to and from Love Field to all
but four adjacent states. Four states were removed
from Wright Amendment restrictions in later actions.
However, on June 15, 2006 a joint statement was
signed by parties involved in the Wright Amendment
issue (City of Dallas, City of Fort Worth, American
Airlines and Southwest Airlines) supporting an end
to flight restrictions to all states within eight years of
legislative action. On September 29, 2006, as a result of
this action, Congress passed the Wright Amendment
Reform Act. President Bush signed S.3661, the Wright
Amendment Reform Act into law on October 13, 2006.
This bill will allow immediate through ticketing from
Love Field to cities throughout the United States, and
the full repeal of the Wright Amendment within eight
years.
Repeal of the Wright Amendment increases the transit
market potential at Love Field, indicating that a high
capacity transit option would be more viable, such
as an Automated People Mover (APM) or light rail
service. Recent discussions by the City of Dallas have
centered on the APM option as the most promising
way to connect to DART light rail. Thus, the June 15,
2006 joint statement indicates that the City of Dallas
will seek approval of Passenger Facility Charges (PFC)
to fund an APM within the eight-year timeframe of the
Wright Amendment repeal.
An APM system could be implemented at any
time without any impact to the light rail system. It
would consist of a below grade station and vertical
circulation to connect to the south end of the Love
Field Station platform. Light rail to Love Field could
also be implemented with minimal impact to future
operations. The key to implementing either of these
options is additional funding.
DART will retain $20 million (2002$) in the DART 20-
year financial plan for Love Field transit service, and
will support the City in the pursuit of additional funds.
3.3.2 DFW International AirportDFW International Airport (DFWIA) is one of the
world’s largest and busiest airports, serving nearly 60
million passengers in 2005. As a major hub, many of
these are connecting passengers. The airport is also
Chapter 3: Focus Areas
A below-grade version of an Automated People Mover (APM) such as DFW Airport’s Skylink System could be used at Dallas Love Field to link
passengers between DART Rail and the terminal.
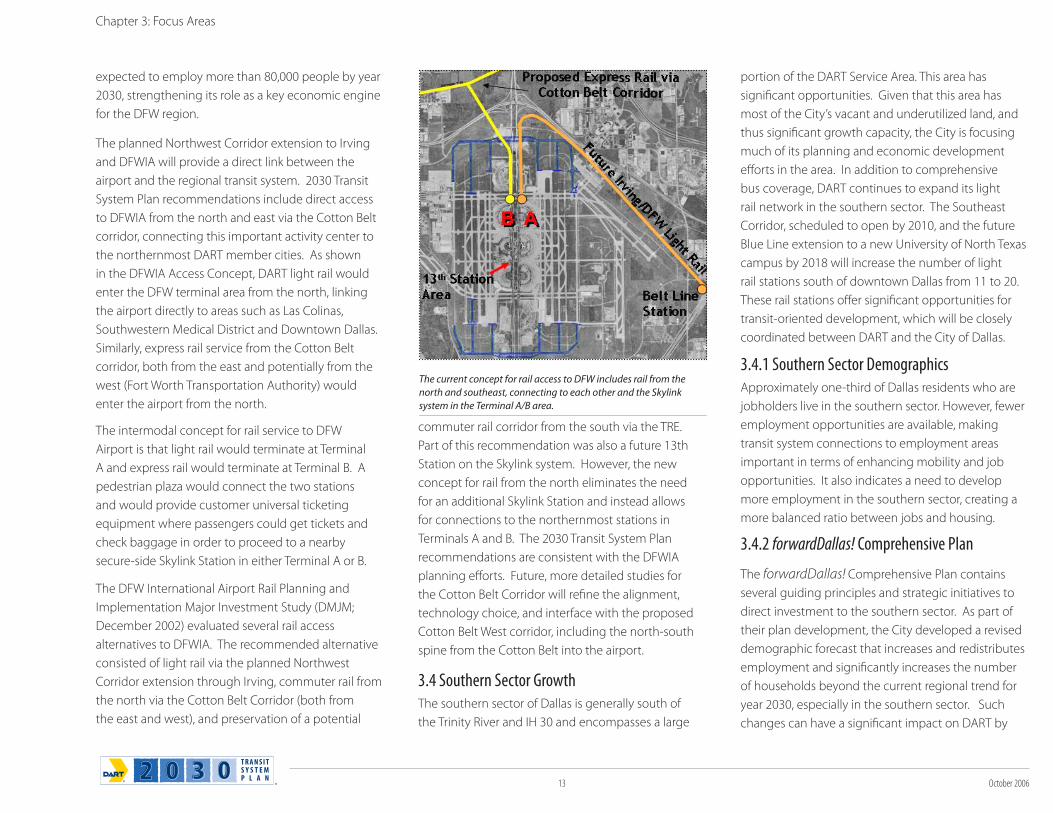
13 October 2006
expected to employ more than 80,000 people by year
2030, strengthening its role as a key economic engine
for the DFW region.
The planned Northwest Corridor extension to Irving
and DFWIA will provide a direct link between the
airport and the regional transit system. 2030 Transit
System Plan recommendations include direct access
to DFWIA from the north and east via the Cotton Belt
corridor, connecting this important activity center to
the northernmost DART member cities. As shown
in the DFWIA Access Concept, DART light rail would
enter the DFW terminal area from the north, linking
the airport directly to areas such as Las Colinas,
Southwestern Medical District and Downtown Dallas.
Similarly, express rail service from the Cotton Belt
corridor, both from the east and potentially from the
west (Fort Worth Transportation Authority) would
enter the airport from the north.
The intermodal concept for rail service to DFW
Airport is that light rail would terminate at Terminal
A and express rail would terminate at Terminal B. A
pedestrian plaza would connect the two stations
and would provide customer universal ticketing
equipment where passengers could get tickets and
check baggage in order to proceed to a nearby
secure-side Skylink Station in either Terminal A or B.
The DFW International Airport Rail Planning and
Implementation Major Investment Study (DMJM;
December 2002) evaluated several rail access
alternatives to DFWIA. The recommended alternative
consisted of light rail via the planned Northwest
Corridor extension through Irving, commuter rail from
the north via the Cotton Belt Corridor (both from
the east and west), and preservation of a potential
commuter rail corridor from the south via the TRE.
Part of this recommendation was also a future 13th
Station on the Skylink system. However, the new
concept for rail from the north eliminates the need
for an additional Skylink Station and instead allows
for connections to the northernmost stations in
Terminals A and B. The 2030 Transit System Plan
recommendations are consistent with the DFWIA
planning efforts. Future, more detailed studies for
the Cotton Belt Corridor will refine the alignment,
technology choice, and interface with the proposed
Cotton Belt West corridor, including the north-south
spine from the Cotton Belt into the airport.
3.4 Southern Sector GrowthThe southern sector of Dallas is generally south of
the Trinity River and IH 30 and encompasses a large
portion of the DART Service Area. This area has
significant opportunities. Given that this area has
most of the City’s vacant and underutilized land, and
thus significant growth capacity, the City is focusing
much of its planning and economic development
efforts in the area. In addition to comprehensive
bus coverage, DART continues to expand its light
rail network in the southern sector. The Southeast
Corridor, scheduled to open by 2010, and the future
Blue Line extension to a new University of North Texas
campus by 2018 will increase the number of light
rail stations south of downtown Dallas from 11 to 20.
These rail stations offer significant opportunities for
transit-oriented development, which will be closely
coordinated between DART and the City of Dallas.
3.4.1 Southern Sector DemographicsApproximately one-third of Dallas residents who are
jobholders live in the southern sector. However, fewer
employment opportunities are available, making
transit system connections to employment areas
important in terms of enhancing mobility and job
opportunities. It also indicates a need to develop
more employment in the southern sector, creating a
more balanced ratio between jobs and housing.
3.4.2 forwardDallas! Comprehensive Plan
The forwardDallas! Comprehensive Plan contains
several guiding principles and strategic initiatives to
direct investment to the southern sector. As part of
their plan development, the City developed a revised
demographic forecast that increases and redistributes
employment and significantly increases the number
of households beyond the current regional trend for
year 2030, especially in the southern sector. Such
changes can have a significant impact on DART by
Chapter 3: Focus Areas
The current concept for rail access to DFW includes rail from the
north and southeast, connecting to each other and the Skylink
system in the Terminal A/B area.
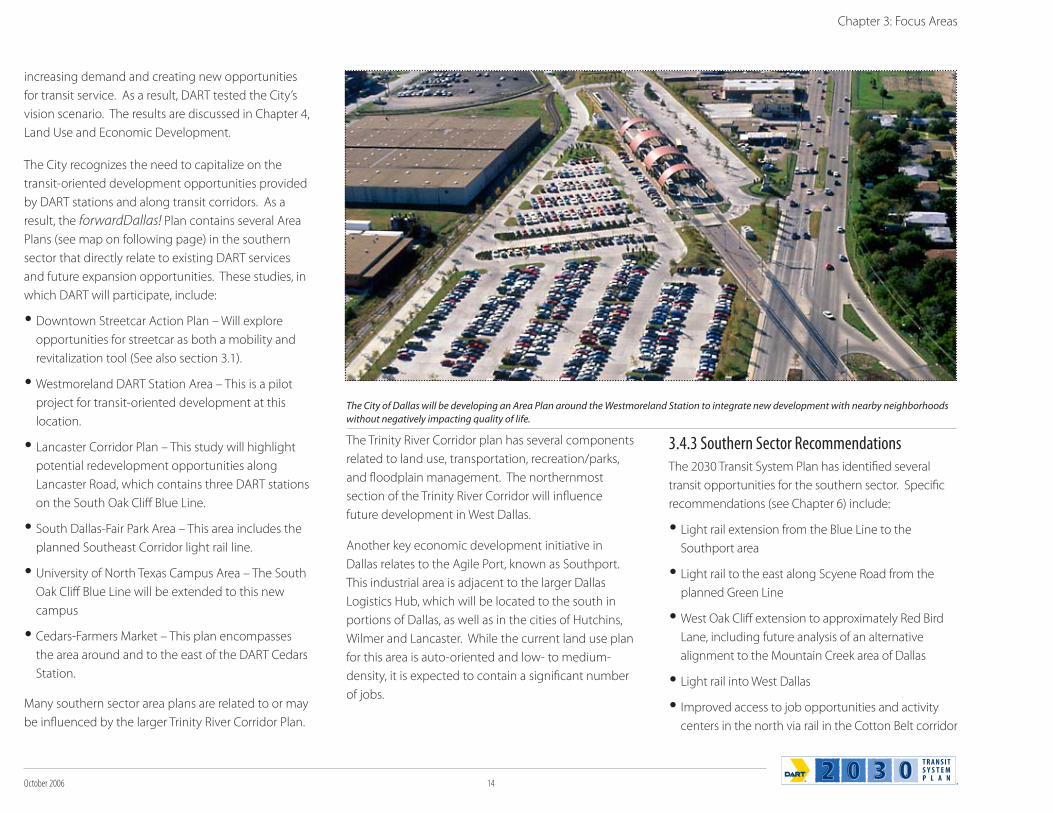
October 2006 14
increasing demand and creating new opportunities
for transit service. As a result, DART tested the City’s
vision scenario. The results are discussed in Chapter 4,
Land Use and Economic Development.
The City recognizes the need to capitalize on the
transit-oriented development opportunities provided
by DART stations and along transit corridors. As a
result, the forwardDallas! Plan contains several Area
Plans (see map on following page) in the southern
sector that directly relate to existing DART services
and future expansion opportunities. These studies, in
which DART will participate, include:
Downtown Streetcar Action Plan – Will explore
opportunities for streetcar as both a mobility and
revitalization tool (See also section 3.1).
Westmoreland DART Station Area – This is a pilot
project for transit-oriented development at this
location.
Lancaster Corridor Plan – This study will highlight
potential redevelopment opportunities along
Lancaster Road, which contains three DART stations
on the South Oak Cliff Blue Line.
South Dallas-Fair Park Area – This area includes the
planned Southeast Corridor light rail line.
University of North Texas Campus Area – The South
Oak Cliff Blue Line will be extended to this new
campus
Cedars-Farmers Market – This plan encompasses
the area around and to the east of the DART Cedars
Station.
Many southern sector area plans are related to or may
be influenced by the larger Trinity River Corridor Plan.
The Trinity River Corridor plan has several components
related to land use, transportation, recreation/parks,
and floodplain management. The northernmost
section of the Trinity River Corridor will influence
future development in West Dallas.
Another key economic development initiative in
Dallas relates to the Agile Port, known as Southport.
This industrial area is adjacent to the larger Dallas
Logistics Hub, which will be located to the south in
portions of Dallas, as well as in the cities of Hutchins,
Wilmer and Lancaster. While the current land use plan
for this area is auto-oriented and low- to medium-
density, it is expected to contain a significant number
of jobs.
3.4.3 Southern Sector RecommendationsThe 2030 Transit System Plan has identified several
transit opportunities for the southern sector. Specific
recommendations (see Chapter 6) include:
Light rail extension from the Blue Line to the
Southport area
Light rail to the east along Scyene Road from the
planned Green Line
West Oak Cliff extension to approximately Red Bird
Lane, including future analysis of an alternative
alignment to the Mountain Creek area of Dallas
Light rail into West Dallas
Improved access to job opportunities and activity
centers in the north via rail in the Cotton Belt corridor
Chapter 3: Focus Areas
The City of Dallas will be developing an Area Plan around the Westmoreland Station to integrate new development with nearby neighborhoods
without negatively impacting quality of life.
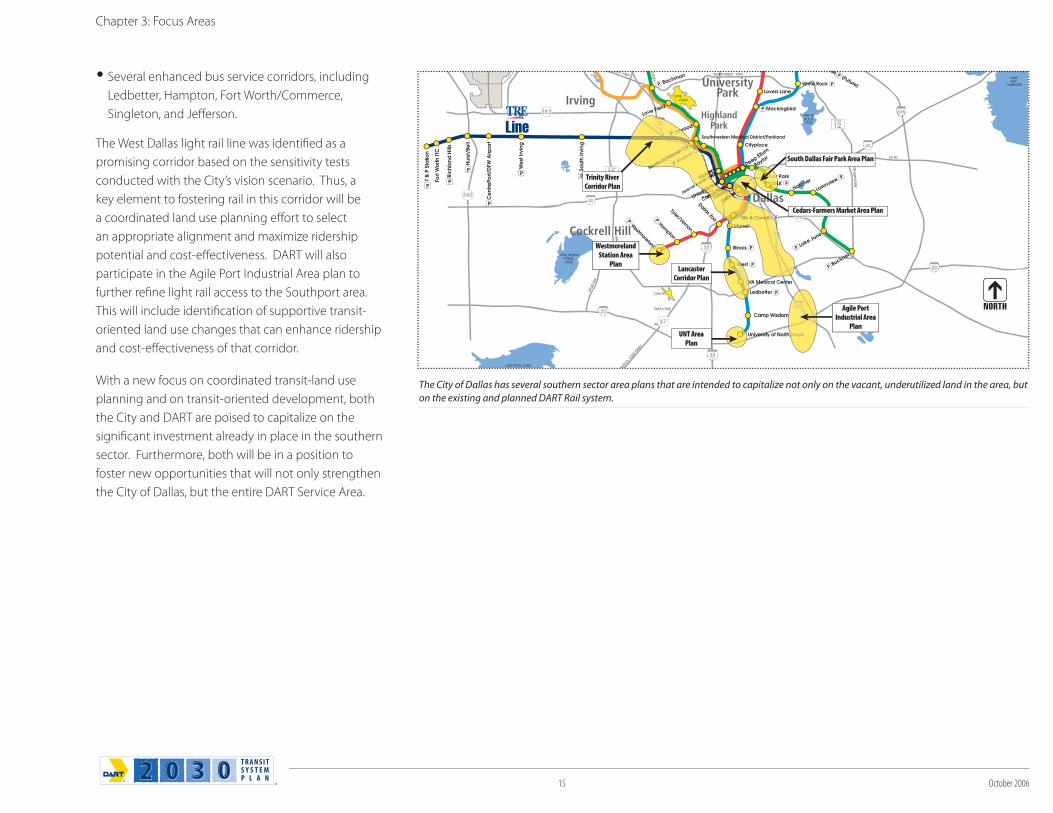
15 October 2006
Several enhanced bus service corridors, including
Ledbetter, Hampton, Fort Worth/Commerce,
Singleton, and Jefferson.
The West Dallas light rail line was identified as a
promising corridor based on the sensitivity tests
conducted with the City’s vision scenario. Thus, a
key element to fostering rail in this corridor will be
a coordinated land use planning effort to select
an appropriate alignment and maximize ridership
potential and cost-effectiveness. DART will also
participate in the Agile Port Industrial Area plan to
further refine light rail access to the Southport area.
This will include identification of supportive transit-
oriented land use changes that can enhance ridership
and cost-effectiveness of that corridor.
With a new focus on coordinated transit-land use
planning and on transit-oriented development, both
the City and DART are poised to capitalize on the
significant investment already in place in the southern
sector. Furthermore, both will be in a position to
foster new opportunities that will not only strengthen
the City of Dallas, but the entire DART Service Area.
Chapter 3: Focus Areas
ARVIN
D. L
OVE
FRW
Y.
BU
CK
NE
R B
LVD
.
WA
LTON
LAN
CA
STER
US 80
WEST HWY.
SPU
R 40
8
WA
LKER
Y HIN
ES
WHITEROCKLAKE
JOE POOL LAKE
MOUNTAINCREEKLAKE
LAKERAY
HUBBARD
LOVEFIELD
NORTHWEST HWY.
DALLAS
EXECUTIVE
AIRPORT
MLKFair Park
DENTONDR.
Bachman
Love Field
Inwood
Market Ctr.
Buckner
Lake June
LawnviewHatcher
Deep Ellum
Baylor
University of North Texas
Camp Wisdom
Southwestern Medical District/Parkland
nds (Future)
Irving
Cockrell Hill
HighlandPark
Dallas
UniversityPark
Texas T
mLA
NC
ASTER
MLFair
Lir
Inw
MaMarket CtrCtr
nw
Ctr
Trinity RiverCorridor Plan
Westmoreland Station Area
Plan
Cedars-Farmers Market Area Plan
South Dallas Fair Park Area Plan
Agile Port Industrial Area
Plan
Lancaster Corridor Plan
UNT Area Plan
The City of Dallas has several southern sector area plans that are intended to capitalize not only on the vacant, underutilized land in the area, but
on the existing and planned DART Rail system.
October 2006 16
4.0 Land Use and Economic DevelopmentThe DART mission is not only mobility-focused
but also emphasizes quality of life and economic
development. Transit, particularly the more frequent
service and permanence associated with light
rail, is known to have the ability to influence land
use development patterns and create sustainable
communities that drive less, use transit, and walk
more. Overall, this development pattern can minimize
environmental effects of sprawl and reduce energy
consumption and vehicle miles of travel. This means
less time in traffic congestion, a better environment
for residents throughout the region, and enhanced
sales tax and property tax benefits to DART and its
member cities.
4.1 DART InitiativesDART’s role in land use and economic development is
threefold: to educate, facilitate, and coordinate. These
efforts are done with both the public and private
sectors to create transit-oriented development (TOD)
and promote a more sustainable growth pattern.
DART initiatives and activities are described below.
4.1.1 EducationTransit-oriented development is generally defined as
development within one-half mile of a transit station
that is dense, diverse, and livable – emphasizing
pedestrians and transit, yet accommodating the
automobile. The result is a compact growth pattern
that improves livability, is efficient and cost-effective
for individuals, communities and the region, and
improves the environment.
DART has a Transit-Oriented Development Program
designed to promote this type of land use. The
DART Transit-Oriented Development Guidelines are
intended to educate both the public and private
sector on the benefits and characteristics of TOD and
provide guidelines on how such development can be
integrated with the DART transit system.
DART, including its member cities and project
developers, has been recognized nationally and
is increasingly involved in national-level tours and
workshops to showcase local success stories and
lessons learned. Many of these same events are held
at a local and regional level to promote TOD and
highlight economic development opportunities in
areas such as the Dallas southern sector.
4.1.2 FacilitationDART has been very active in facilitating transit-
oriented development since the advent of light rail.
This facilitation can take the form of accommodating
direct connections from rail stations to adjacent
developments to seeking out development proposals
on DART-owned property. Strategically pursuing TOD
opportunities achieves a higher and better use of land
that can benefit DART in terms of increased ridership
and revenue and benefit the developer in terms of
higher property value due to enhanced transit access.
One of the first development proposals facilitated on
DART property is to redevelop surface parking lots at
Mockingbird Station into a higher density, mixed use
development that incorporates a parking structure for
DART park-and-ride customers. In the future, DART
will design stations at the outset to accommodate
future development.
Chapter 3: Focus Areas
LAND USE AND ECONOMIC DEVELOPMENT1. Promote and facilitate transit-oriented development
around DART transit facilities:
Encourage initiatives to invest at or near transit facilities
Provide information and technical assistance to member cities and the development community
2. Coordinate and promote integrated land use and
transportation plans that maximize the use of transit:
Encourage member city adoption of transit-oriented development policies and regulations
3. Provide improved transit access where warranted to
promote economic development
4. Consider transit-oriented development potential in
system expansion planning
5. Integrate transit service within transit-oriented
developments:
Facilitate enhanced linkages between developments and transit service
Design stations with ability to accommodate transit-oriented development
6. Work cooperatively with member cities and NCTCOG to
coordinate land use and transportation planning work
programs and activities
STRATEGIES FOR SUCCESS
T R A N S I TS Y S T E MP L A N
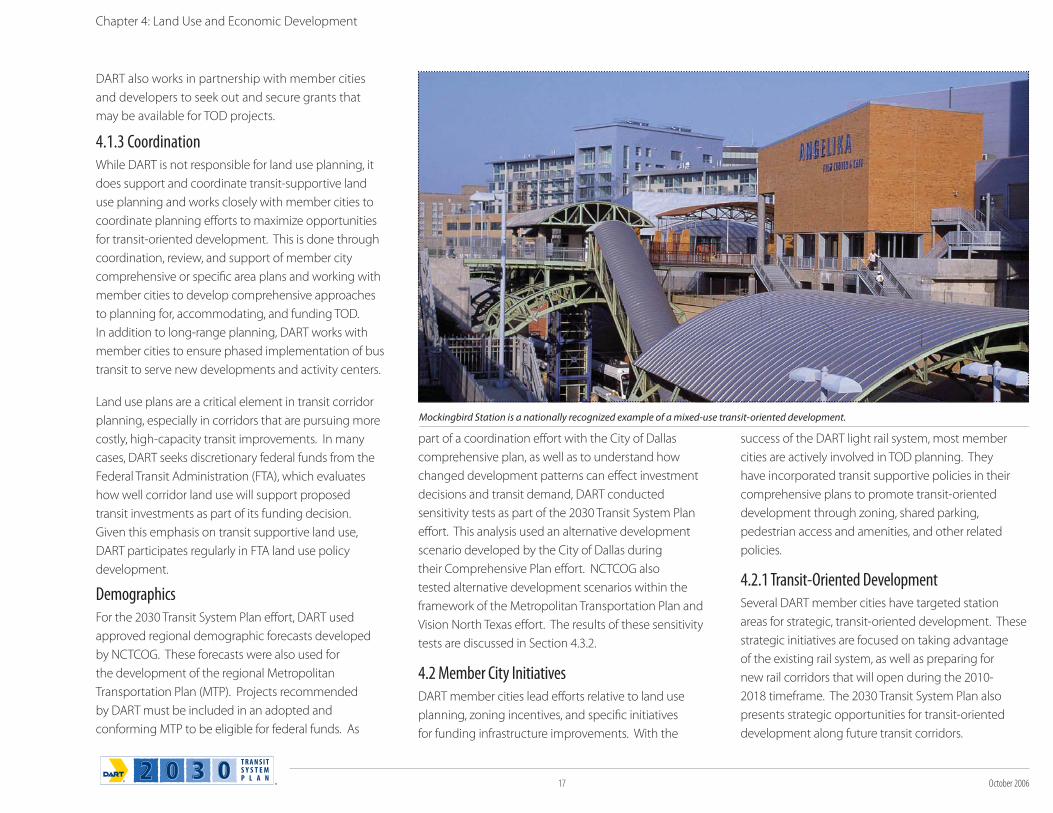
17 October 2006
DART also works in partnership with member cities
and developers to seek out and secure grants that
may be available for TOD projects.
4.1.3 CoordinationWhile DART is not responsible for land use planning, it
does support and coordinate transit-supportive land
use planning and works closely with member cities to
coordinate planning efforts to maximize opportunities
for transit-oriented development. This is done through
coordination, review, and support of member city
comprehensive or specific area plans and working with
member cities to develop comprehensive approaches
to planning for, accommodating, and funding TOD.
In addition to long-range planning, DART works with
member cities to ensure phased implementation of bus
transit to serve new developments and activity centers.
Land use plans are a critical element in transit corridor
planning, especially in corridors that are pursuing more
costly, high-capacity transit improvements. In many
cases, DART seeks discretionary federal funds from the
Federal Transit Administration (FTA), which evaluates
how well corridor land use will support proposed
transit investments as part of its funding decision.
Given this emphasis on transit supportive land use,
DART participates regularly in FTA land use policy
development.
DemographicsFor the 2030 Transit System Plan effort, DART used
approved regional demographic forecasts developed
by NCTCOG. These forecasts were also used for
the development of the regional Metropolitan
Transportation Plan (MTP). Projects recommended
by DART must be included in an adopted and
conforming MTP to be eligible for federal funds. As
part of a coordination effort with the City of Dallas
comprehensive plan, as well as to understand how
changed development patterns can effect investment
decisions and transit demand, DART conducted
sensitivity tests as part of the 2030 Transit System Plan
effort. This analysis used an alternative development
scenario developed by the City of Dallas during
their Comprehensive Plan effort. NCTCOG also
tested alternative development scenarios within the
framework of the Metropolitan Transportation Plan and
Vision North Texas effort. The results of these sensitivity
tests are discussed in Section 4.3.2.
4.2 Member City InitiativesDART member cities lead efforts relative to land use
planning, zoning incentives, and specific initiatives
for funding infrastructure improvements. With the
success of the DART light rail system, most member
cities are actively involved in TOD planning. They
have incorporated transit supportive policies in their
comprehensive plans to promote transit-oriented
development through zoning, shared parking,
pedestrian access and amenities, and other related
policies.
4.2.1 Transit-Oriented DevelopmentSeveral DART member cities have targeted station
areas for strategic, transit-oriented development. These
strategic initiatives are focused on taking advantage
of the existing rail system, as well as preparing for
new rail corridors that will open during the 2010-
2018 timeframe. The 2030 Transit System Plan also
presents strategic opportunities for transit-oriented
development along future transit corridors.
Chapter 4: Land Use and Economic Development
Mockingbird Station is a nationally recognized example of a mixed-use transit-oriented development.
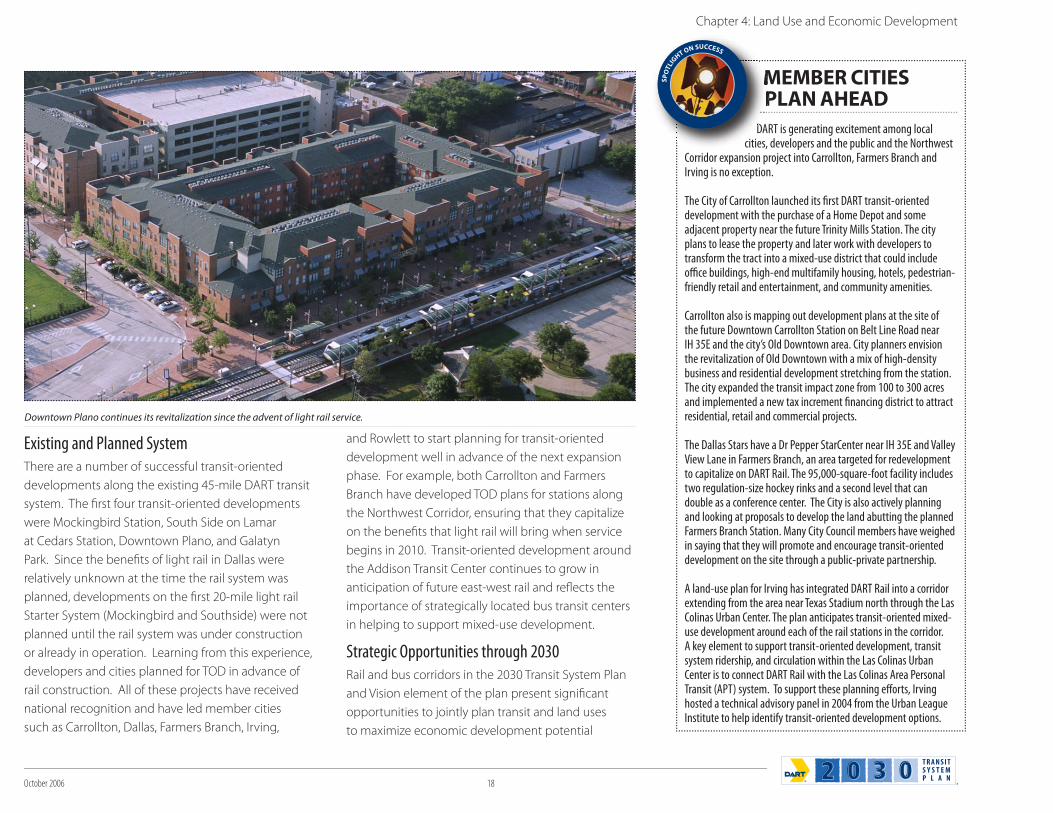
October 2006 18
Existing and Planned SystemThere are a number of successful transit-oriented
developments along the existing 45-mile DART transit
system. The first four transit-oriented developments
were Mockingbird Station, South Side on Lamar
at Cedars Station, Downtown Plano, and Galatyn
Park. Since the benefits of light rail in Dallas were
relatively unknown at the time the rail system was
planned, developments on the first 20-mile light rail
Starter System (Mockingbird and Southside) were not
planned until the rail system was under construction
or already in operation. Learning from this experience,
developers and cities planned for TOD in advance of
rail construction. All of these projects have received
national recognition and have led member cities
such as Carrollton, Dallas, Farmers Branch, Irving,
and Rowlett to start planning for transit-oriented
development well in advance of the next expansion
phase. For example, both Carrollton and Farmers
Branch have developed TOD plans for stations along
the Northwest Corridor, ensuring that they capitalize
on the benefits that light rail will bring when service
begins in 2010. Transit-oriented development around
the Addison Transit Center continues to grow in
anticipation of future east-west rail and reflects the
importance of strategically located bus transit centers
in helping to support mixed-use development.
Strategic Opportunities through 2030Rail and bus corridors in the 2030 Transit System Plan
and Vision element of the plan present significant
opportunities to jointly plan transit and land uses
to maximize economic development potential
Chapter 4: Land Use and Economic Development
Downtown Plano continues its revitalization since the advent of light rail service.
MEMBER CITIESPLAN AHEAD
DART is generating excitement among local cities, developers and the public and the Northwest
Corridor expansion project into Carrollton, Farmers Branch and Irving is no exception.
The City of Carrollton launched its first DART transit-oriented development with the purchase of a Home Depot and some adjacent property near the future Trinity Mills Station. The city plans to lease the property and later work with developers to transform the tract into a mixed-use district that could include office buildings, high-end multifamily housing, hotels, pedestrian-friendly retail and entertainment, and community amenities.
Carrollton also is mapping out development plans at the site of the future Downtown Carrollton Station on Belt Line Road near IH 35E and the city’s Old Downtown area. City planners envision the revitalization of Old Downtown with a mix of high-density business and residential development stretching from the station. The city expanded the transit impact zone from 100 to 300 acres and implemented a new tax increment financing district to attract residential, retail and commercial projects.
The Dallas Stars have a Dr Pepper StarCenter near IH 35E and Valley View Lane in Farmers Branch, an area targeted for redevelopment to capitalize on DART Rail. The 95,000-square-foot facility includes two regulation-size hockey rinks and a second level that can double as a conference center. The City is also actively planning and looking at proposals to develop the land abutting the planned Farmers Branch Station. Many City Council members have weighed in saying that they will promote and encourage transit-oriented development on the site through a public-private partnership.
A land-use plan for Irving has integrated DART Rail into a corridor extending from the area near Texas Stadium north through the Las Colinas Urban Center. The plan anticipates transit-oriented mixed-use development around each of the rail stations in the corridor. A key element to support transit-oriented development, transit system ridership, and circulation within the Las Colinas Urban Center is to connect DART Rail with the Las Colinas Area Personal Transit (APT) system. To support these planning efforts, Irving hosted a technical advisory panel in 2004 from the Urban League Institute to help identify transit-oriented development options.
SP
OT
LIG
HT ON SUCCESS
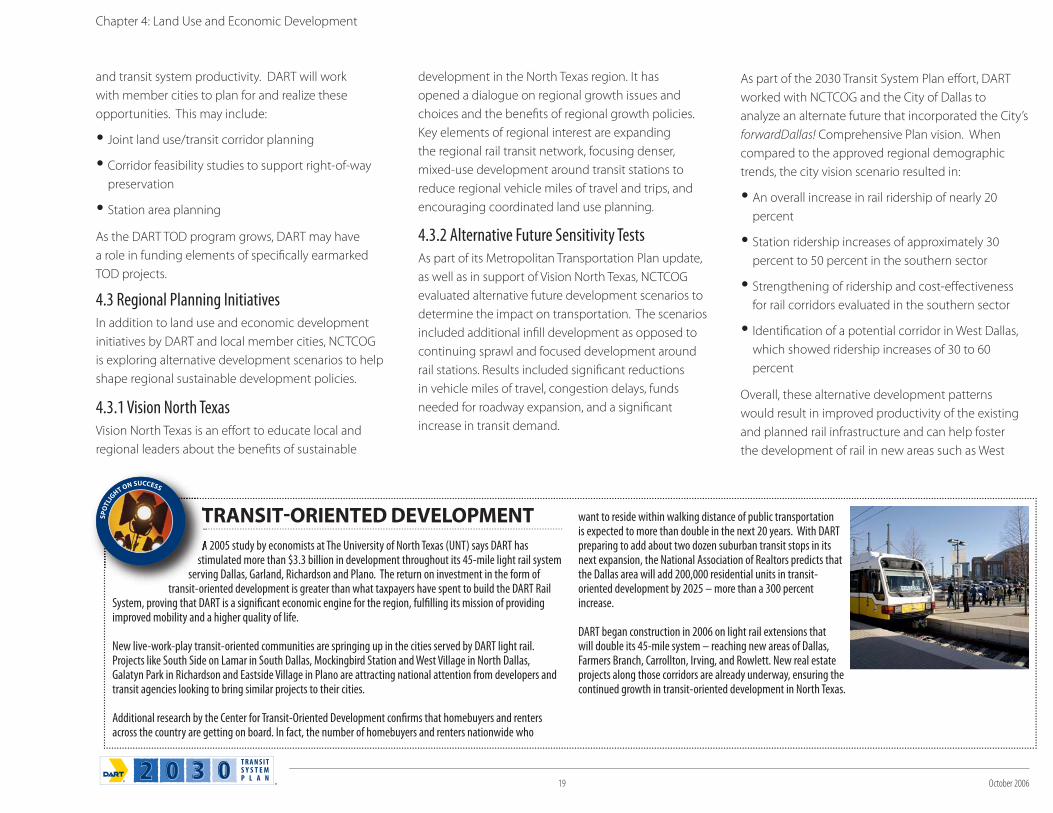
19 October 2006
and transit system productivity. DART will work
with member cities to plan for and realize these
opportunities. This may include:
Joint land use/transit corridor planning
Corridor feasibility studies to support right-of-way
preservation
Station area planning
As the DART TOD program grows, DART may have
a role in funding elements of specifically earmarked
TOD projects.
4.3 Regional Planning InitiativesIn addition to land use and economic development
initiatives by DART and local member cities, NCTCOG
is exploring alternative development scenarios to help
shape regional sustainable development policies.
4.3.1 Vision North Texas Vision North Texas is an effort to educate local and
regional leaders about the benefits of sustainable
development in the North Texas region. It has
opened a dialogue on regional growth issues and
choices and the benefits of regional growth policies.
Key elements of regional interest are expanding
the regional rail transit network, focusing denser,
mixed-use development around transit stations to
reduce regional vehicle miles of travel and trips, and
encouraging coordinated land use planning.
4.3.2 Alternative Future Sensitivity TestsAs part of its Metropolitan Transportation Plan update,
as well as in support of Vision North Texas, NCTCOG
evaluated alternative future development scenarios to
determine the impact on transportation. The scenarios
included additional infill development as opposed to
continuing sprawl and focused development around
rail stations. Results included significant reductions
in vehicle miles of travel, congestion delays, funds
needed for roadway expansion, and a significant
increase in transit demand.
As part of the 2030 Transit System Plan effort, DART
worked with NCTCOG and the City of Dallas to
analyze an alternate future that incorporated the City’s
forwardDallas! Comprehensive Plan vision. When
compared to the approved regional demographic
trends, the city vision scenario resulted in:
An overall increase in rail ridership of nearly 20
percent
Station ridership increases of approximately 30
percent to 50 percent in the southern sector
Strengthening of ridership and cost-effectiveness
for rail corridors evaluated in the southern sector
Identification of a potential corridor in West Dallas,
which showed ridership increases of 30 to 60
percent
Overall, these alternative development patterns
would result in improved productivity of the existing
and planned rail infrastructure and can help foster
the development of rail in new areas such as West
Chapter 4: Land Use and Economic Development
TRANSIT-ORIENTED DEVELOPMENT
A 2005 study by economists at The University of North Texas (UNT) says DART has stimulated more than $3.3 billion in development throughout its 45-mile light rail system
serving Dallas, Garland, Richardson and Plano. The return on investment in the form of transit-oriented development is greater than what taxpayers have spent to build the DART Rail
System, proving that DART is a significant economic engine for the region, fulfilling its mission of providing improved mobility and a higher quality of life.
New live-work-play transit-oriented communities are springing up in the cities served by DART light rail. Projects like South Side on Lamar in South Dallas, Mockingbird Station and West Village in North Dallas, Galatyn Park in Richardson and Eastside Village in Plano are attracting national attention from developers and transit agencies looking to bring similar projects to their cities.
Additional research by the Center for Transit-Oriented Development confirms that homebuyers and renters across the country are getting on board. In fact, the number of homebuyers and renters nationwide who
want to reside within walking distance of public transportation is expected to more than double in the next 20 years. With DART preparing to add about two dozen suburban transit stops in its next expansion, the National Association of Realtors predicts that the Dallas area will add 200,000 residential units in transit-oriented development by 2025 – more than a 300 percent increase.
DART began construction in 2006 on light rail extensions that will double its 45-mile system – reaching new areas of Dallas, Farmers Branch, Carrollton, Irving, and Rowlett. New real estate projects along those corridors are already underway, ensuring the continued growth in transit-oriented development in North Texas.
SP
OT
LIG
HT ON SUCCESS
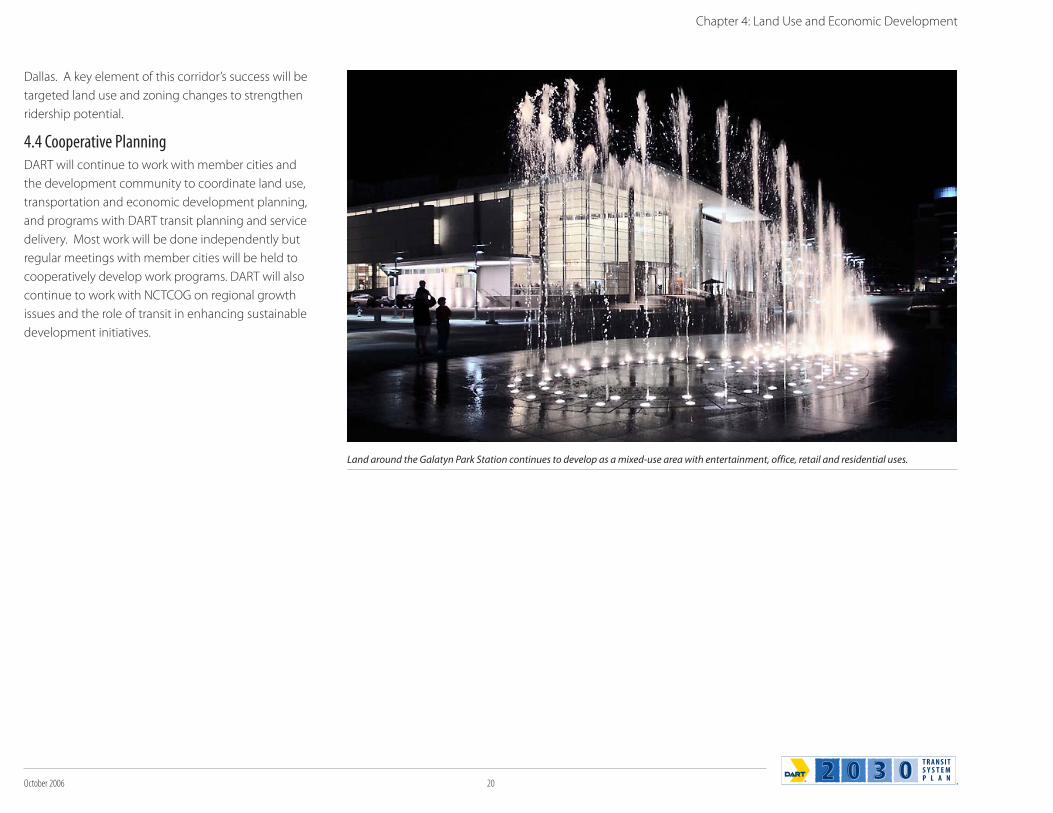
October 2006 20
Dallas. A key element of this corridor’s success will be
targeted land use and zoning changes to strengthen
ridership potential.
4.4 Cooperative PlanningDART will continue to work with member cities and
the development community to coordinate land use,
transportation and economic development planning,
and programs with DART transit planning and service
delivery. Most work will be done independently but
regular meetings with member cities will be held to
cooperatively develop work programs. DART will also
continue to work with NCTCOG on regional growth
issues and the role of transit in enhancing sustainable
development initiatives.
Chapter 4: Land Use and Economic Development
Land around the Galatyn Park Station continues to develop as a mixed-use area with entertainment, office, retail and residential uses.
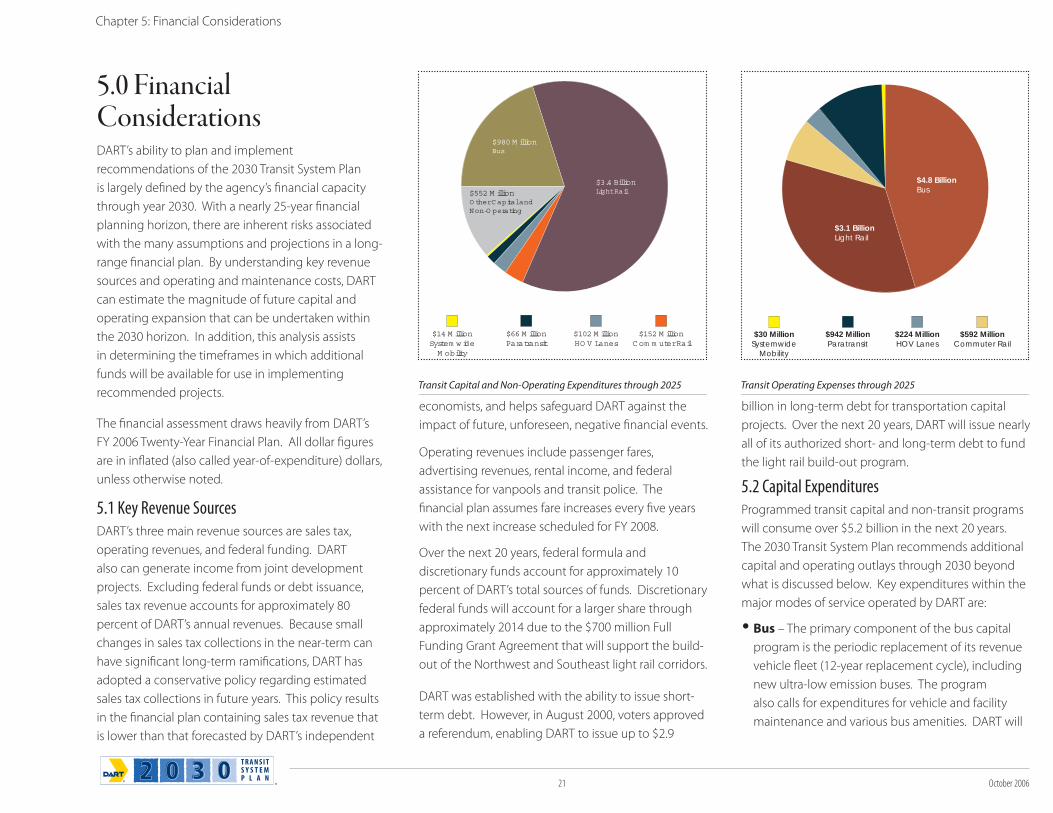
21 October 2006
5.0 Financial ConsiderationsDART’s ability to plan and implement
recommendations of the 2030 Transit System Plan
is largely defined by the agency’s financial capacity
through year 2030. With a nearly 25-year financial
planning horizon, there are inherent risks associated
with the many assumptions and projections in a long-
range financial plan. By understanding key revenue
sources and operating and maintenance costs, DART
can estimate the magnitude of future capital and
operating expansion that can be undertaken within
the 2030 horizon. In addition, this analysis assists
in determining the timeframes in which additional
funds will be available for use in implementing
recommended projects.
The financial assessment draws heavily from DART’s
FY 2006 Twenty-Year Financial Plan. All dollar figures
are in inflated (also called year-of-expenditure) dollars,
unless otherwise noted.
5.1 Key Revenue SourcesDART’s three main revenue sources are sales tax,
operating revenues, and federal funding. DART
also can generate income from joint development
projects. Excluding federal funds or debt issuance,
sales tax revenue accounts for approximately 80
percent of DART’s annual revenues. Because small
changes in sales tax collections in the near-term can
have significant long-term ramifications, DART has
adopted a conservative policy regarding estimated
sales tax collections in future years. This policy results
in the financial plan containing sales tax revenue that
is lower than that forecasted by DART’s independent
economists, and helps safeguard DART against the
impact of future, unforeseen, negative financial events.
Operating revenues include passenger fares,
advertising revenues, rental income, and federal
assistance for vanpools and transit police. The
financial plan assumes fare increases every five years
with the next increase scheduled for FY 2008.
Over the next 20 years, federal formula and
discretionary funds account for approximately 10
percent of DART’s total sources of funds. Discretionary
federal funds will account for a larger share through
approximately 2014 due to the $700 million Full
Funding Grant Agreement that will support the build-
out of the Northwest and Southeast light rail corridors.
DART was established with the ability to issue short-
term debt. However, in August 2000, voters approved
a referendum, enabling DART to issue up to $2.9
billion in long-term debt for transportation capital
projects. Over the next 20 years, DART will issue nearly
all of its authorized short- and long-term debt to fund
the light rail build-out program.
5.2 Capital ExpendituresProgrammed transit capital and non-transit programs
will consume over $5.2 billion in the next 20 years.
The 2030 Transit System Plan recommends additional
capital and operating outlays through 2030 beyond
what is discussed below. Key expenditures within the
major modes of service operated by DART are:
Bus – The primary component of the bus capital
program is the periodic replacement of its revenue
vehicle fleet (12-year replacement cycle), including
new ultra-low emission buses. The program
also calls for expenditures for vehicle and facility
maintenance and various bus amenities. DART will
Chapter 5: Financial Considerations
$3.1 BillionLight Rail
$4.8 BillionBus
$30 MillionSystemwide
Mobility
$942 MillionParatransit
$224 MillionHOV Lanes
$592 MillionCommuter Rail
Transit Operating Expenses through 2025
$3.4 BillionLight Rail
$980 M illionBus
$552 M illionO ther C apital and Non-O perating
$14 M illionSystem w ideM obility
$66 M illionParatransit
$102 M illionHO V Lanes
$152 M illionC om m uter Rail
Transit Capital and Non-Operating Expenditures through 2025
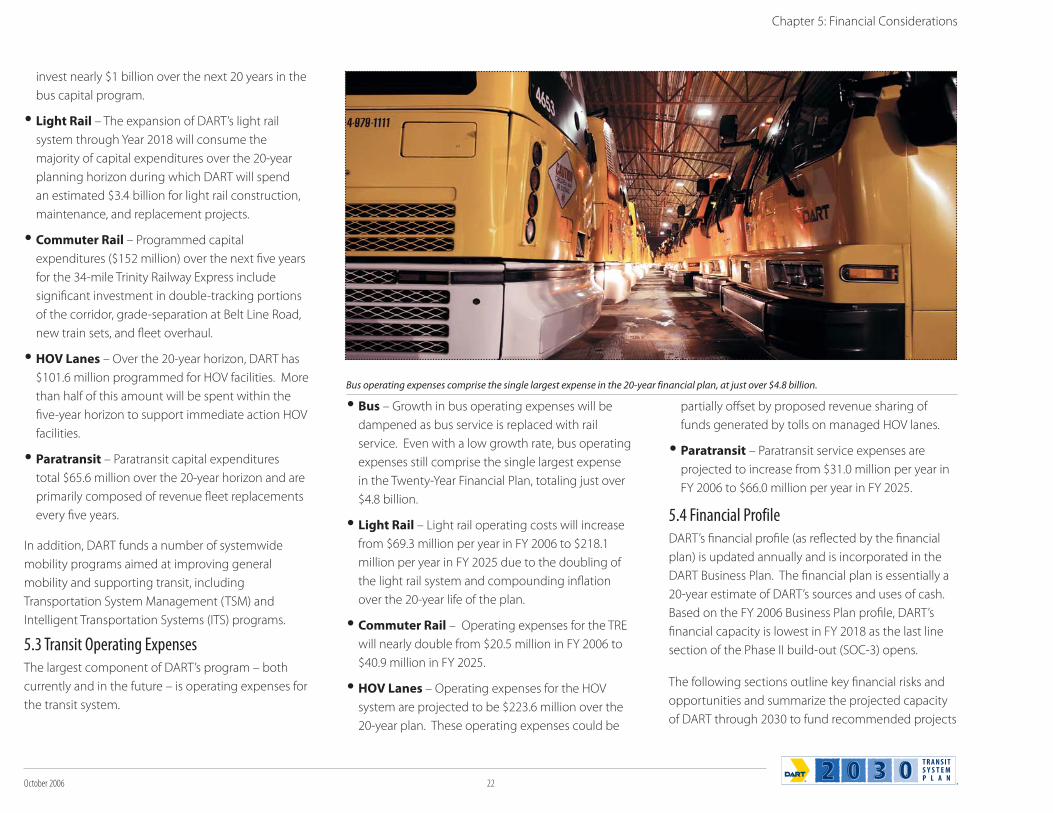
October 2006 22
invest nearly $1 billion over the next 20 years in the
bus capital program.
Light Rail – The expansion of DART’s light rail
system through Year 2018 will consume the
majority of capital expenditures over the 20-year
planning horizon during which DART will spend
an estimated $3.4 billion for light rail construction,
maintenance, and replacement projects.
Commuter Rail – Programmed capital
expenditures ($152 million) over the next five years
for the 34-mile Trinity Railway Express include
significant investment in double-tracking portions
of the corridor, grade-separation at Belt Line Road,
new train sets, and fleet overhaul.
HOV Lanes – Over the 20-year horizon, DART has
$101.6 million programmed for HOV facilities. More
than half of this amount will be spent within the
five-year horizon to support immediate action HOV
facilities.
Paratransit – Paratransit capital expenditures
total $65.6 million over the 20-year horizon and are
primarily composed of revenue fleet replacements
every five years.
In addition, DART funds a number of systemwide
mobility programs aimed at improving general
mobility and supporting transit, including
Transportation System Management (TSM) and
Intelligent Transportation Systems (ITS) programs.
5.3 Transit Operating ExpensesThe largest component of DART’s program – both
currently and in the future – is operating expenses for
the transit system.
Bus – Growth in bus operating expenses will be
dampened as bus service is replaced with rail
service. Even with a low growth rate, bus operating
expenses still comprise the single largest expense
in the Twenty-Year Financial Plan, totaling just over
$4.8 billion.
Light Rail – Light rail operating costs will increase
from $69.3 million per year in FY 2006 to $218.1
million per year in FY 2025 due to the doubling of
the light rail system and compounding inflation
over the 20-year life of the plan.
Commuter Rail – Operating expenses for the TRE
will nearly double from $20.5 million in FY 2006 to
$40.9 million in FY 2025.
HOV Lanes – Operating expenses for the HOV
system are projected to be $223.6 million over the
20-year plan. These operating expenses could be
partially offset by proposed revenue sharing of
funds generated by tolls on managed HOV lanes.
Paratransit – Paratransit service expenses are
projected to increase from $31.0 million per year in
FY 2006 to $66.0 million per year in FY 2025.
5.4 Financial ProfileDART’s financial profile (as reflected by the financial
plan) is updated annually and is incorporated in the
DART Business Plan. The financial plan is essentially a
20-year estimate of DART’s sources and uses of cash.
Based on the FY 2006 Business Plan profile, DART’s
financial capacity is lowest in FY 2018 as the last line
section of the Phase II build-out (SOC-3) opens.
The following sections outline key financial risks and
opportunities and summarize the projected capacity
of DART through 2030 to fund recommended projects
Chapter 5: Financial Considerations
Bus operating expenses comprise the single largest expense in the 20-year financial plan, at just over $4.8 billion.
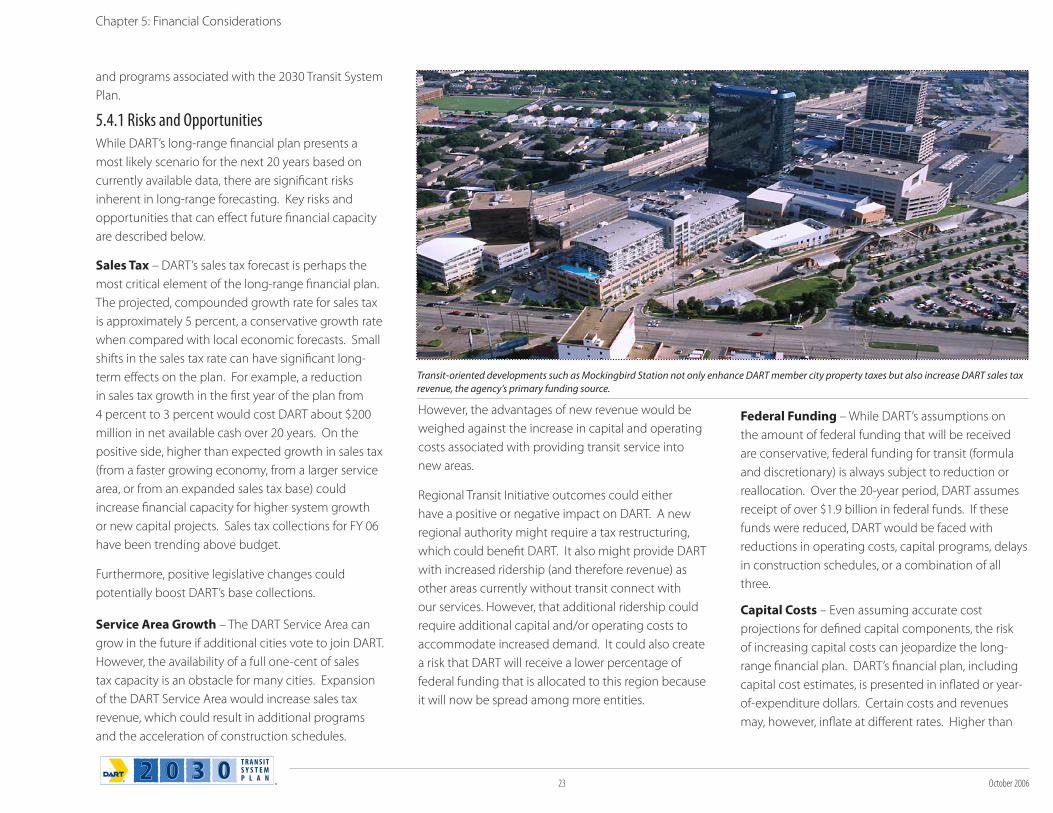
23 October 2006
and programs associated with the 2030 Transit System
Plan.
5.4.1 Risks and OpportunitiesWhile DART’s long-range financial plan presents a
most likely scenario for the next 20 years based on
currently available data, there are significant risks
inherent in long-range forecasting. Key risks and
opportunities that can effect future financial capacity
are described below.
Sales Tax – DART’s sales tax forecast is perhaps the
most critical element of the long-range financial plan.
The projected, compounded growth rate for sales tax
is approximately 5 percent, a conservative growth rate
when compared with local economic forecasts. Small
shifts in the sales tax rate can have significant long-
term effects on the plan. For example, a reduction
in sales tax growth in the first year of the plan from
4 percent to 3 percent would cost DART about $200
million in net available cash over 20 years. On the
positive side, higher than expected growth in sales tax
(from a faster growing economy, from a larger service
area, or from an expanded sales tax base) could
increase financial capacity for higher system growth
or new capital projects. Sales tax collections for FY 06
have been trending above budget.
Furthermore, positive legislative changes could
potentially boost DART’s base collections.
Service Area Growth – The DART Service Area can
grow in the future if additional cities vote to join DART.
However, the availability of a full one-cent of sales
tax capacity is an obstacle for many cities. Expansion
of the DART Service Area would increase sales tax
revenue, which could result in additional programs
and the acceleration of construction schedules.
However, the advantages of new revenue would be
weighed against the increase in capital and operating
costs associated with providing transit service into
new areas.
Regional Transit Initiative outcomes could either
have a positive or negative impact on DART. A new
regional authority might require a tax restructuring,
which could benefit DART. It also might provide DART
with increased ridership (and therefore revenue) as
other areas currently without transit connect with
our services. However, that additional ridership could
require additional capital and/or operating costs to
accommodate increased demand. It could also create
a risk that DART will receive a lower percentage of
federal funding that is allocated to this region because
it will now be spread among more entities.
Federal Funding – While DART’s assumptions on
the amount of federal funding that will be received
are conservative, federal funding for transit (formula
and discretionary) is always subject to reduction or
reallocation. Over the 20-year period, DART assumes
receipt of over $1.9 billion in federal funds. If these
funds were reduced, DART would be faced with
reductions in operating costs, capital programs, delays
in construction schedules, or a combination of all
three.
Capital Costs – Even assuming accurate cost
projections for defined capital components, the risk
of increasing capital costs can jeopardize the long-
range financial plan. DART’s financial plan, including
capital cost estimates, is presented in inflated or year-
of-expenditure dollars. Certain costs and revenues
may, however, inflate at different rates. Higher than
Chapter 5: Financial Considerations
Transit-oriented developments such as Mockingbird Station not only enhance DART member city property taxes but also increase DART sales tax
revenue, the agency’s primary funding source.
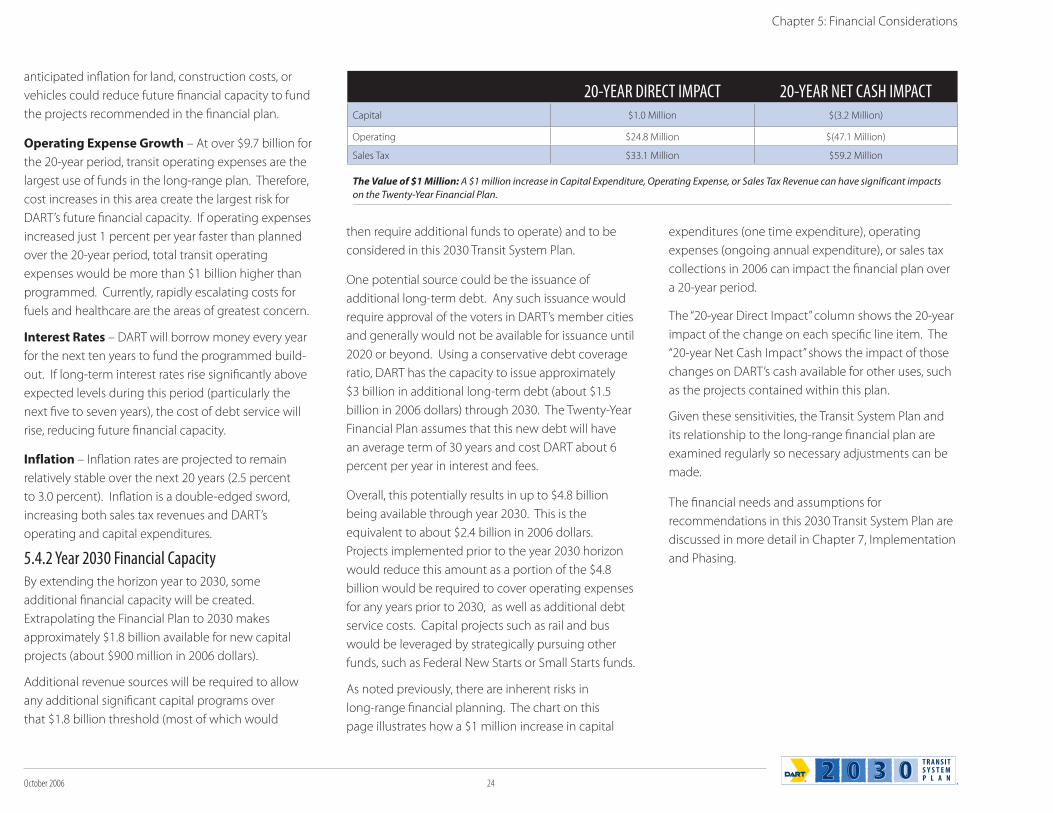
October 2006 24
anticipated inflation for land, construction costs, or
vehicles could reduce future financial capacity to fund
the projects recommended in the financial plan.
Operating Expense Growth – At over $9.7 billion for
the 20-year period, transit operating expenses are the
largest use of funds in the long-range plan. Therefore,
cost increases in this area create the largest risk for
DART’s future financial capacity. If operating expenses
increased just 1 percent per year faster than planned
over the 20-year period, total transit operating
expenses would be more than $1 billion higher than
programmed. Currently, rapidly escalating costs for
fuels and healthcare are the areas of greatest concern.
Interest Rates – DART will borrow money every year
for the next ten years to fund the programmed build-
out. If long-term interest rates rise significantly above
expected levels during this period (particularly the
next five to seven years), the cost of debt service will
rise, reducing future financial capacity.
Inflation – Inflation rates are projected to remain
relatively stable over the next 20 years (2.5 percent
to 3.0 percent). Inflation is a double-edged sword,
increasing both sales tax revenues and DART’s
operating and capital expenditures.
5.4.2 Year 2030 Financial CapacityBy extending the horizon year to 2030, some
additional financial capacity will be created.
Extrapolating the Financial Plan to 2030 makes
approximately $1.8 billion available for new capital
projects (about $900 million in 2006 dollars).
Additional revenue sources will be required to allow
any additional significant capital programs over
that $1.8 billion threshold (most of which would
then require additional funds to operate) and to be
considered in this 2030 Transit System Plan.
One potential source could be the issuance of
additional long-term debt. Any such issuance would
require approval of the voters in DART’s member cities
and generally would not be available for issuance until
2020 or beyond. Using a conservative debt coverage
ratio, DART has the capacity to issue approximately
$3 billion in additional long-term debt (about $1.5
billion in 2006 dollars) through 2030. The Twenty-Year
Financial Plan assumes that this new debt will have
an average term of 30 years and cost DART about 6
percent per year in interest and fees.
Overall, this potentially results in up to $4.8 billion
being available through year 2030. This is the
equivalent to about $2.4 billion in 2006 dollars.
Projects implemented prior to the year 2030 horizon
would reduce this amount as a portion of the $4.8
billion would be required to cover operating expenses
for any years prior to 2030, as well as additional debt
service costs. Capital projects such as rail and bus
would be leveraged by strategically pursuing other
funds, such as Federal New Starts or Small Starts funds.
As noted previously, there are inherent risks in
long-range financial planning. The chart on this
page illustrates how a $1 million increase in capital
expenditures (one time expenditure), operating
expenses (ongoing annual expenditure), or sales tax
collections in 2006 can impact the financial plan over
a 20-year period.
The “20-year Direct Impact” column shows the 20-year
impact of the change on each specific line item. The
“20-year Net Cash Impact” shows the impact of those
changes on DART’s cash available for other uses, such
as the projects contained within this plan.
Given these sensitivities, the Transit System Plan and
its relationship to the long-range financial plan are
examined regularly so necessary adjustments can be
made.
The financial needs and assumptions for
recommendations in this 2030 Transit System Plan are
discussed in more detail in Chapter 7, Implementation
and Phasing.
Chapter 5: Financial Considerations
20-YEAR DIRECT IMPACT 20-YEAR NET CASH IMPACTCapital $1.0 Million $(3.2 Million)
Operating $24.8 Million $(47.1 Million)
Sales Tax $33.1 Million $59.2 Million
The Value of $1 Million: A $1 million increase in Capital Expenditure, Operating Expense, or Sales Tax Revenue can have significant impacts
on the Twenty-Year Financial Plan.
25 October 2006
This page intentionally left blank.
Chapter 5: Financial Considerations
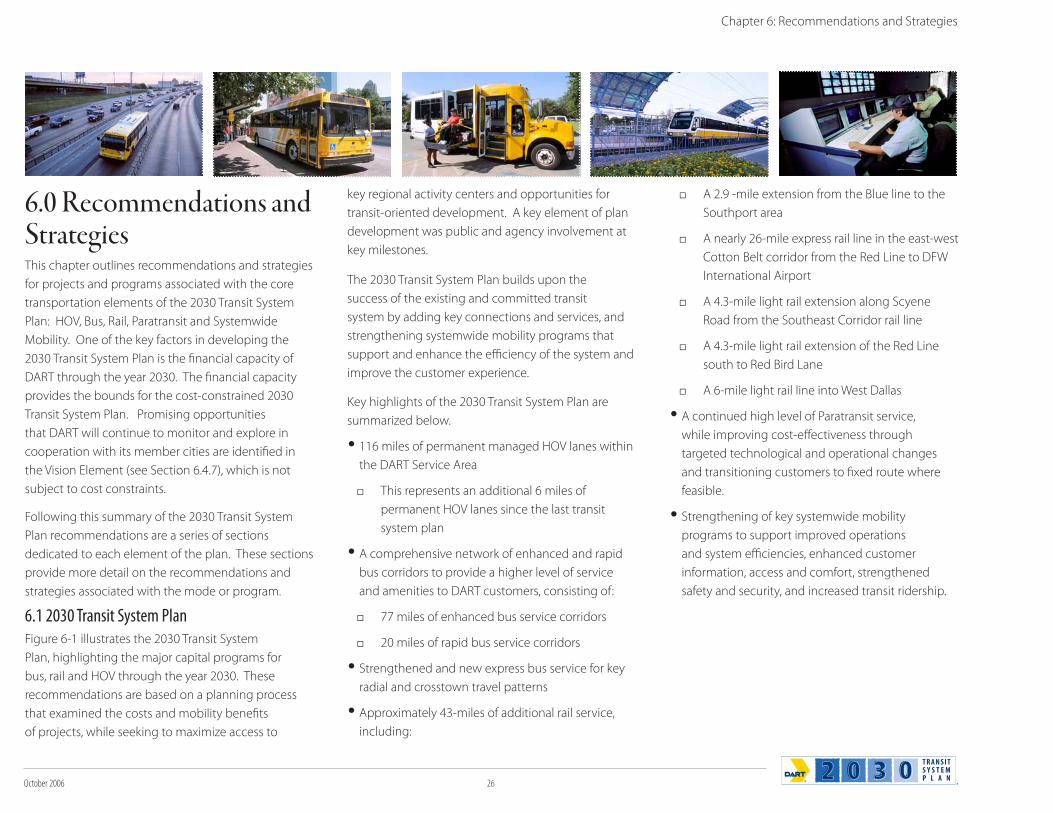
October 2006 26
6.0 Recommendations and StrategiesThis chapter outlines recommendations and strategies
for projects and programs associated with the core
transportation elements of the 2030 Transit System
Plan: HOV, Bus, Rail, Paratransit and Systemwide
Mobility. One of the key factors in developing the
2030 Transit System Plan is the financial capacity of
DART through the year 2030. The financial capacity
provides the bounds for the cost-constrained 2030
Transit System Plan. Promising opportunities
that DART will continue to monitor and explore in
cooperation with its member cities are identified in
the Vision Element (see Section 6.4.7), which is not
subject to cost constraints.
Following this summary of the 2030 Transit System
Plan recommendations are a series of sections
dedicated to each element of the plan. These sections
provide more detail on the recommendations and
strategies associated with the mode or program.
6.1 2030 Transit System PlanFigure 6-1 illustrates the 2030 Transit System
Plan, highlighting the major capital programs for
bus, rail and HOV through the year 2030. These
recommendations are based on a planning process
that examined the costs and mobility benefits
of projects, while seeking to maximize access to
key regional activity centers and opportunities for
transit-oriented development. A key element of plan
development was public and agency involvement at
key milestones.
The 2030 Transit System Plan builds upon the
success of the existing and committed transit
system by adding key connections and services, and
strengthening systemwide mobility programs that
support and enhance the efficiency of the system and
improve the customer experience.
Key highlights of the 2030 Transit System Plan are
summarized below.
116 miles of permanent managed HOV lanes within
the DART Service Area
This represents an additional 6 miles of
permanent HOV lanes since the last transit
system plan
A comprehensive network of enhanced and rapid
bus corridors to provide a higher level of service
and amenities to DART customers, consisting of:
77 miles of enhanced bus service corridors
20 miles of rapid bus service corridors
Strengthened and new express bus service for key
radial and crosstown travel patterns
Approximately 43-miles of additional rail service,
including:
A 2.9 -mile extension from the Blue line to the
Southport area
A nearly 26-mile express rail line in the east-west
Cotton Belt corridor from the Red Line to DFW
International Airport
A 4.3-mile light rail extension along Scyene
Road from the Southeast Corridor rail line
A 4.3-mile light rail extension of the Red Line
south to Red Bird Lane
A 6-mile light rail line into West Dallas
A continued high level of Paratransit service,
while improving cost-effectiveness through
targeted technological and operational changes
and transitioning customers to fixed route where
feasible.
Strengthening of key systemwide mobility
programs to support improved operations
and system efficiencies, enhanced customer
information, access and comfort, strengthened
safety and security, and increased transit ridership.
Chapter 6: Recommendations and Strategies
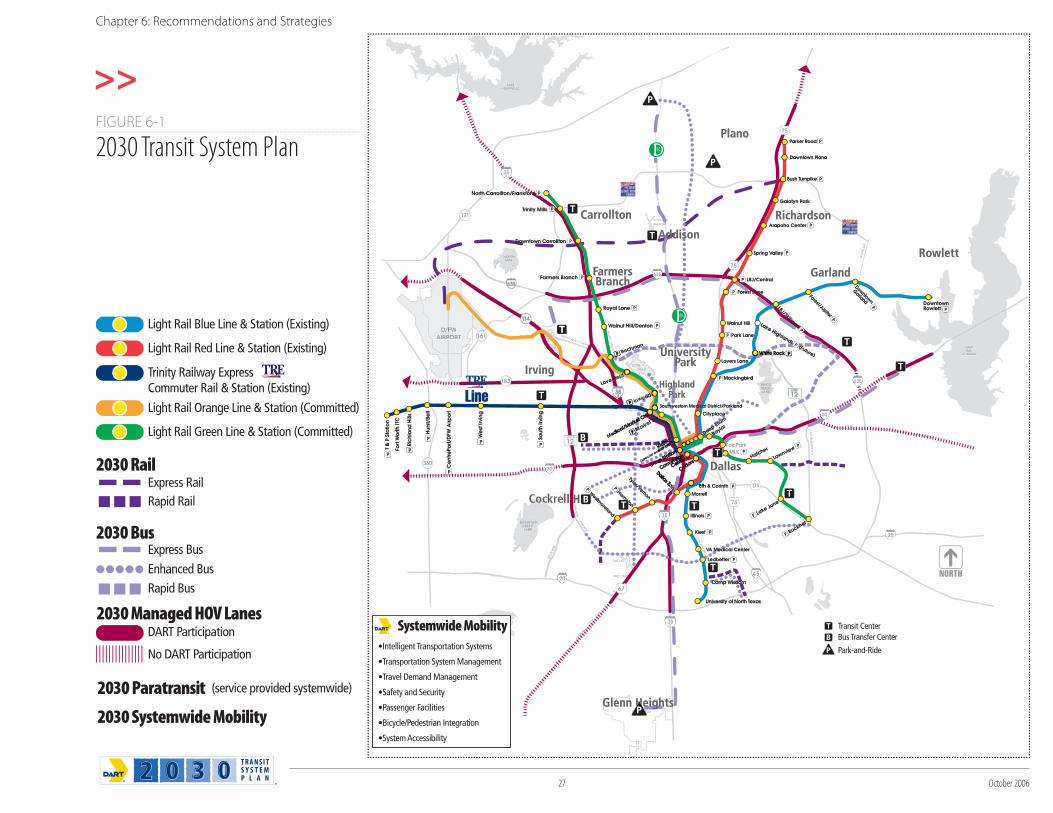
27 October 2006
Chapter 6: Recommendations and Strategies
MARV
IN D
. LO
VE F
RWY.
BU
CK
NE
R B
LVD
.
WA
LTON
LAN
CA
STER
US 80
ORTHWEST HWY.
WA
LKER
LAV
ON
DR
.
RWY.
ADDISONONAIRPORTT
HA
RRY H
INES
BEAR CREEK
JOE POOL LAKE
NORTHLAKE
LAKERAY
HUBBARD
LAKELEWISVILLE
D/FW/FFAIRPORTPP
NORTHWEST HWY.R
DALLASSS
EXECUTIVE
AIR
MLKFair Park
DowntowownRowletRo tt
Farmers Brancher
Downtown Carrolltonto
Trinity Mills
North Carrollton/Frankfordh Ca ord
Royal Lane
Walnut Hill/Denton
Bachman
Love
r.r.
knerer
Bucknekne
Lake June
LawnviewHatcher
atch
Deep Ellum
D BaylorB
University of North Texasniversity
Camp Wisdom
Southwestern Medical District/Parklandw caicdicic
RPORTPORPORTPOOOR
Rowlett
Plano
Garland
RichardsonnCarrollton
AddisonAd
FarmersBranchh
Irving
l Hill
Glenn HeightssGlenn Heightss
HighlandhParkPa
DallasDDaD
UniversityivU i iParkP
Lake Highlands (Future)
s (s (
DowntownRowlett
Farmers Branch
Downtown Carrollton
Trinity Mills
North Carrollton/Frankford
Royal Lane
Walnut Hill/Denton
Bachman
Love Field
Inwood
Market Ctr.
Buckner
Lake June
LawnviewHatcher
Deep Ellum
Baylor
University of North Texas
Camp Wisdom
Southwestern Medical District/Parkland
Lake Highlands (Future)
Rowlett
Plano
Garland
RichardsonCarrollton
Addison
FarmersBranch
Irving
Cockrell Hill
Glenn Heights
HighlandPark
Dallas
UniversityPark
Transit CenterBus Transfer Center
Park-and-Ride•Intelligent Transportation Systems
•Transportation System Management
•Travel Demand Management
•Safety and Security
•Passenger Facilities
•Bicycle/Pedestrian Integration
•System Accessibility
Systemwide Mobility
FIGURE 6-1
2030 Transit System Plan
2030 Rail
2030 Bus
Light Rail Blue Line & Station (Existing)
Light Rail Orange Line & Station (Committed)
Light Rail Green Line & Station (Committed)
Express RailRapid Rail
Express Bus
Enhanced BusRapid Bus
DART Participation
No DART Participation
(service provided systemwide)
Light Rail Red Line & Station (Existing)
Trinity Railway ExpressCommuter Rail & Station (Existing)
2030 Managed HOV Lanes
2030 Paratransit
2030 Systemwide Mobility
October 2006 28
6.2 Managed HOV LanesThe Transit System Plan includes a program for
continuing DART involvement in the planning,
design, construction, operations, enforcement and
maintenance of Managed High Occupancy Vehicle
(HOV) lanes throughout the region. Managed
HOV lanes are an evolution of HOV lanes to include
managing by price in addition to vehicle occupancy
and access locations. The Managed HOV program is
consistent with the Board approved HOV Transitway
Policy that establishes the framework for DART
funding commitments and DART participation in
project development.
The HOV element of the Transit System Plan is
important for several reasons:
HOV lanes provide an air quality benefit to the
region and assist in meeting increasingly stringent
air quality conformity standards;
HOV lanes provide time savings for buses, and
other eligible vehicles, resulting in a competitive
advantage over main lanes in the same corridor,
and providing a faster, reliable transitway for DART
buses;
HOV lanes provide another means for DART
customers to obtain mobility; and,
HOV lanes are a cost-effective way for DART
to move people effectively and contribute to
enhanced regional mobility given its typical subsidy
of less than $0.20 per passenger.
Managed HOV lane recommendations are illustrated
in Figure 6-2 and discussed in the following sections.
6.2.1 Regional Managed HOV PlanThe NCTCOG Metropolitan Transportation Plan
documents the regional plan for HOV facilities in the
region, and also sets forth regional policies related to
managed HOV lanes.
In addition to the benefits of traditional HOV lanes,
managed HOV lanes offer additional benefits by
introducing pricing as a tool to manage the demand
on the facility. Additional benefits of managed HOV
lanes are:
Increase person and vehicle throughput in the
corridor
Preserve travel time savings and trip reliability
Generate revenue to pay for operation and
maintenance costs
Provide an alternate route around major incidents
Managed HOV lanes also provide a public safety
benefit to the region by providing unobstructed
lanes for emergency response vehicles to bypass
congestion.
Regional Policy IssuesThe Managed HOV Lanes element of the Transit
System Plan is consistent with the regional managed
lane policies set forth by the Regional Transportation
Council. The DART Service Area is in an air quality
non-attainment area; thus, the managed HOV lanes
are a critical component of accommodating growth
and managing congestion. All managed HOV lanes
must provide carpoolers with a cost savings as well as
the time savings to encourage carpooling.
MANAGED HOV LANES1. Maintain strong DART role in the development of the
managed HOV lane system
2. Incorporate design, operational, and pricing elements
that support transit
Encourage direct access to HOV facilities from major transit facilities
Promote no tolls for transit and vanpools, and reduced tolls for other high occupancy vehicles
Support time-of-day pricing to manage facility use
3. Promote use of revenues to offset operating and
maintenance costs
Encourage use of excess revenue for transit-related projects that maximize person carrying capacity of the network
4. Support “park-and-pool” projects where warranted to
increase HOV facility usage
5. Strengthen regional partnerships to promote seamless
travel among facilities
Lead ITS and technology efforts
6. Support expedited construction of facilities to enhance
mobility and air quality
7. Support conversion of HOV lanes to managed HOV lanes
where appropriate
Chapter 6: Recommendations and Strategies
STRATEGIES FOR SUCCESS
T R A N S I TS Y S T E MP L A N
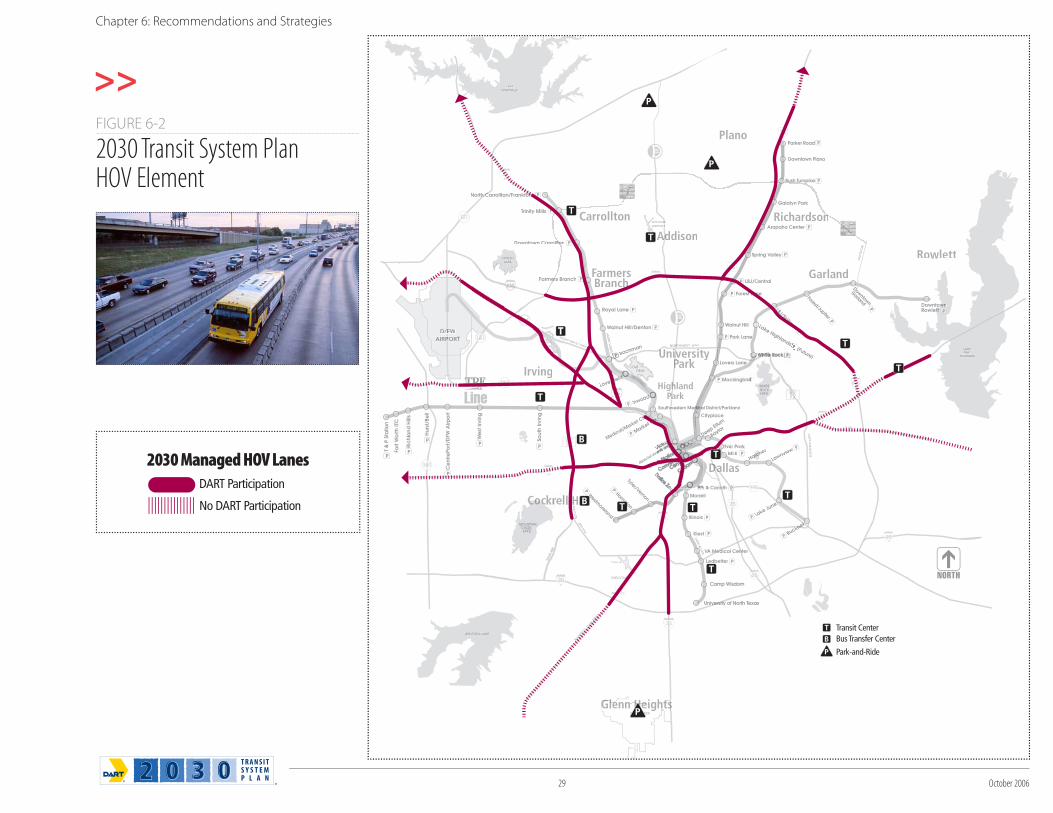
29 October 2006
MARV
IN D
. LO
VE F
RWY.
BU
CK
NE
R B
LVD
.
WA
LTON
LAN
CA
STER
US 80
ORTHWEST HWY.
WA
LKER
LAV
ON
DR
.
RWY.
ADDISONONAIRPORTT
HA
RRY H
INES
BEAR CREEK
JOE POOL LAKE
NORTHLAKE
LAKERAY
HUBBARD
LAKELEWISVILLE
D/FW/FFAIRPORTPP
NORTHWEST HWY.R
DALLASSS
EXECUTIVE
AIR
MLKFair Park
DowntowownRowletRo tt
Farmers Brancher
Downtown Carrolltonto
Trinity Mills
North Carrollton/Frankfordh Ca ord
Royal Lane
Walnut Hill/Denton
Bachman
Love
Inwood
MaMarket CtrCtrCtr.Ctrtr.
knerer
Bucknekne
Lake June
LawnviewHatcher
atch
Deep Ellum
D BaylorB
University of North Texasniversity
Camp Wisdom
Southwestern Medical District/Parklandw caicdicic
RPORTPORPORTPOOOR
Rowlett
Plano
Garland
RichardsonnCarrollton
AddisonAd
FarmersBranchh
Irving
l Hill
Glenn HeightssGlenn Heightss
HighlandhParkPa
DallasDDaD
UniversityivU i iParkP
Lake Highlands (Future)
s (s (
Transit CenterBus Transfer Center
Park-and-Ride
DART Participation
No DART Participation
2030 Managed HOV Lanes
FIGURE 6-2
2030 Transit System PlanHOV Element
Chapter 6: Recommendations and Strategies
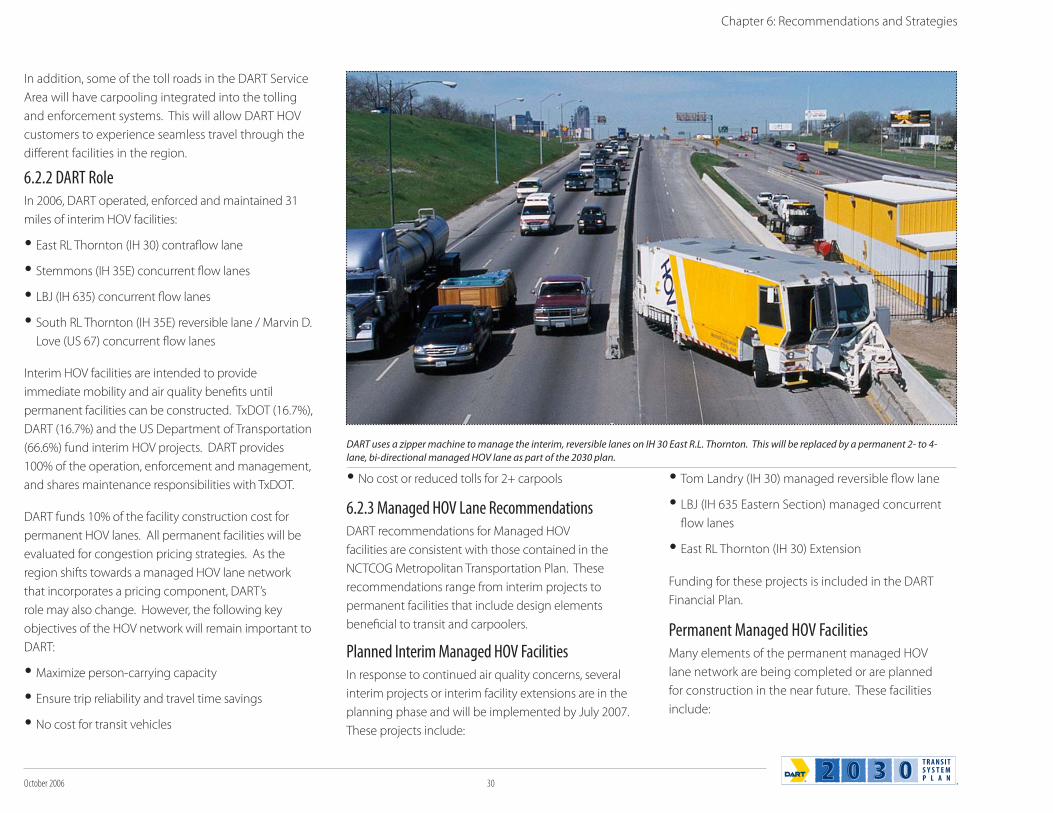
October 2006 30
Chapter 6: Recommendations and Strategies
In addition, some of the toll roads in the DART Service
Area will have carpooling integrated into the tolling
and enforcement systems. This will allow DART HOV
customers to experience seamless travel through the
different facilities in the region.
6.2.2 DART RoleIn 2006, DART operated, enforced and maintained 31
miles of interim HOV facilities:
East RL Thornton (IH 30) contraflow lane
Stemmons (IH 35E) concurrent flow lanes
LBJ (IH 635) concurrent flow lanes
South RL Thornton (IH 35E) reversible lane / Marvin D.
Love (US 67) concurrent flow lanes
Interim HOV facilities are intended to provide
immediate mobility and air quality benefits until
permanent facilities can be constructed. TxDOT (16.7%),
DART (16.7%) and the US Department of Transportation
(66.6%) fund interim HOV projects. DART provides
100% of the operation, enforcement and management,
and shares maintenance responsibilities with TxDOT.
DART funds 10% of the facility construction cost for
permanent HOV lanes. All permanent facilities will be
evaluated for congestion pricing strategies. As the
region shifts towards a managed HOV lane network
that incorporates a pricing component, DART’s
role may also change. However, the following key
objectives of the HOV network will remain important to
DART:
Maximize person-carrying capacity
Ensure trip reliability and travel time savings
No cost for transit vehicles
No cost or reduced tolls for 2+ carpools
6.2.3 Managed HOV Lane RecommendationsDART recommendations for Managed HOV
facilities are consistent with those contained in the
NCTCOG Metropolitan Transportation Plan. These
recommendations range from interim projects to
permanent facilities that include design elements
beneficial to transit and carpoolers.
Planned Interim Managed HOV FacilitiesIn response to continued air quality concerns, several
interim projects or interim facility extensions are in the
planning phase and will be implemented by July 2007.
These projects include:
Tom Landry (IH 30) managed reversible flow lane
LBJ (IH 635 Eastern Section) managed concurrent
flow lanes
East RL Thornton (IH 30) Extension
Funding for these projects is included in the DART
Financial Plan.
Permanent Managed HOV FacilitiesMany elements of the permanent managed HOV
lane network are being completed or are planned
for construction in the near future. These facilities
include:
DART uses a zipper machine to manage the interim, reversible lanes on IH 30 East R.L. Thornton. This will be replaced by a permanent 2- to 4-
lane, bi-directional managed HOV lane as part of the 2030 plan.
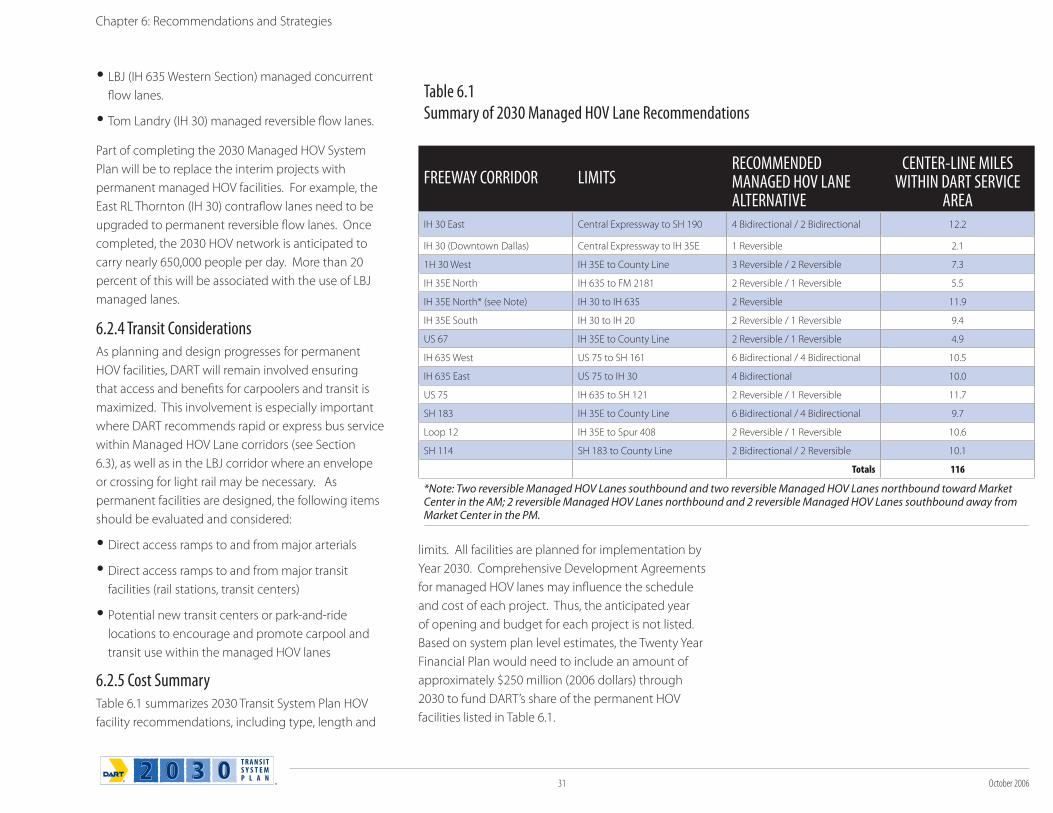
31 October 2006
LBJ (IH 635 Western Section) managed concurrent
flow lanes.
Tom Landry (IH 30) managed reversible flow lanes.
Part of completing the 2030 Managed HOV System
Plan will be to replace the interim projects with
permanent managed HOV facilities. For example, the
East RL Thornton (IH 30) contraflow lanes need to be
upgraded to permanent reversible flow lanes. Once
completed, the 2030 HOV network is anticipated to
carry nearly 650,000 people per day. More than 20
percent of this will be associated with the use of LBJ
managed lanes.
6.2.4 Transit ConsiderationsAs planning and design progresses for permanent
HOV facilities, DART will remain involved ensuring
that access and benefits for carpoolers and transit is
maximized. This involvement is especially important
where DART recommends rapid or express bus service
within Managed HOV Lane corridors (see Section
6.3), as well as in the LBJ corridor where an envelope
or crossing for light rail may be necessary. As
permanent facilities are designed, the following items
should be evaluated and considered:
Direct access ramps to and from major arterials
Direct access ramps to and from major transit
facilities (rail stations, transit centers)
Potential new transit centers or park-and-ride
locations to encourage and promote carpool and
transit use within the managed HOV lanes
6.2.5 Cost SummaryTable 6.1 summarizes 2030 Transit System Plan HOV
facility recommendations, including type, length and
limits. All facilities are planned for implementation by
Year 2030. Comprehensive Development Agreements
for managed HOV lanes may influence the schedule
and cost of each project. Thus, the anticipated year
of opening and budget for each project is not listed.
Based on system plan level estimates, the Twenty Year
Financial Plan would need to include an amount of
approximately $250 million (2006 dollars) through
2030 to fund DART’s share of the permanent HOV
facilities listed in Table 6.1.
Chapter 6: Recommendations and Strategies
Table 6.1Summary of 2030 Managed HOV Lane Recommendations
FREEWAY CORRIDOR LIMITSRECOMMENDED MANAGED HOV LANE ALTERNATIVE
CENTER-LINE MILES WITHIN DART SERVICE
AREAIH 30 East Central Expressway to SH 190 4 Bidirectional / 2 Bidirectional 12.2
IH 30 (Downtown Dallas) Central Expressway to IH 35E 1 Reversible 2.1
1H 30 West IH 35E to County Line 3 Reversible / 2 Reversible 7.3
IH 35E North IH 635 to FM 2181 2 Reversible / 1 Reversible 5.5
IH 35E North* (see Note) IH 30 to IH 635 2 Reversible 11.9
IH 35E South IH 30 to IH 20 2 Reversible / 1 Reversible 9.4
US 67 IH 35E to County Line 2 Reversible / 1 Reversible 4.9
IH 635 West US 75 to SH 161 6 Bidirectional / 4 Bidirectional 10.5
IH 635 East US 75 to IH 30 4 Bidirectional 10.0
US 75 IH 635 to SH 121 2 Reversible / 1 Reversible 11.7
SH 183 IH 35E to County Line 6 Bidirectional / 4 Bidirectional 9.7
Loop 12 IH 35E to Spur 408 2 Reversible / 1 Reversible 10.6
SH 114 SH 183 to County Line 2 Bidirectional / 2 Reversible 10.1
Totals 116
*Note: Two reversible Managed HOV Lanes southbound and two reversible Managed HOV Lanes northbound toward Market Center in the AM; 2 reversible Managed HOV Lanes northbound and 2 reversible Managed HOV Lanes southbound away from Market Center in the PM.
October 2006 32
6.3 BusThe DART bus network carries more than 40 million
people annually, providing expansive coverage
throughout the Service Area. There are several
short-term objectives for improving bus service to
retain existing customers, attract new customers, and
better match service with demands. These short-term
plans and programs are documented in the DART
Five Year Action Plan, which is updated regularly,
and focus on reallocation of resources to maximize
ridership and enhance cost-effectiveness of the bus
system. The 2030 Transit System Plan builds upon
these short-range plans and targets specific corridors
in which an enhanced level of service and associated
capital investment is warranted. Future Action Plan
updates will refine the 2030 Transit System Plan
recommendations to support service implementation.
The following sections discuss how the role of the
greater transit network is changing and outlines key
recommendations and strategies for bus services.
6.3.1 The Changing Role of Bus ServiceDART bus routes perform a variety of functions,
including:
Local Routes – distribute passengers to various
locations throughout a neighborhood
Express Bus Routes – provide nonstop
connections between an outlying transit facility and
downtown Dallas or other key employment centers
Feeder Routes – collect passengers in a local area
and connect them to a transit center or rail station
Crosstown Routes – provide a regional level of
travel, with local trips tied in to a travel pattern that
crosses the Service Area
Circulator Routes – pulse frequently between
transit facilities and high-density employment or
retail centers
The DART 2006-2010 Five Year Action Plan analyzes
current service design, changing needs, and market
conditions to identify shorter-term challenges that
can be addressed with new service strategies. Key
strategies that will expand and change the role of bus
service over time are:
Enhanced bus service in key corridors, with
more attractive passenger amenities and ITS
improvements
Redesigned rail feeder service, concentrating
fixed route resources on rush hour frequency and
providing flexible, more responsive van-based
midday and evening service
Crosstown express service to improve linkages for
non-radial travel patterns
Flexible services to provide cost-effective solutions
in less dense areas or areas difficult to serve with
traditional transit
The DART 2030 Transit System Plan goes beyond
the Five Year Action Plan, identifying long-range bus
corridor opportunities and providing a framework to
guide implementation.
6.3.2 Bus RecommendationsThe 2030 Transit System Plan Bus Element is shown
in Figure 6-3. Three general service strategies are
recommended in specific corridors:
Express – radial and crosstown in key freeway, HOV,
and Managed Lane/Toll corridors with associated
improvements
BUS1. Increase transit ridership
Enhance passenger amenities throughout the system
Utilize TSM and ITS elements to improve travel time
Improve customer information at bus stops and facilities
Develop branding for key services to improve customer recognition
2. Improve service in core bus corridors
Pursue enhanced and rapid bus service in identified corridors, including TSM and ITS improvements
Reallocate service to strengthen and feed core routes
Coordinate HOV facility development to ensure access and connectivity for DART bus service
Strengthen express bus service in key corridors
Monitor and actively seek other funding sources for capital improvements in enhanced and rapid corridors
3. Strengthen cost-effectiveness of the bus network
Focus on reallocation of resources where appropriate
Implement innovative, demand-based services where fixed route service is not effective
4. Enhance crosstown service
Implement crosstown service to address key regional trip patterns
5. Monitor market conditions and development
Conduct surveys to understand customer needs
Monitor new developments and implement new bus service as appropriate
STRATEGIES FOR SUCCESS
T R A N S I TS Y S T E MP L A N
Chapter 6: Recommendations and Strategies
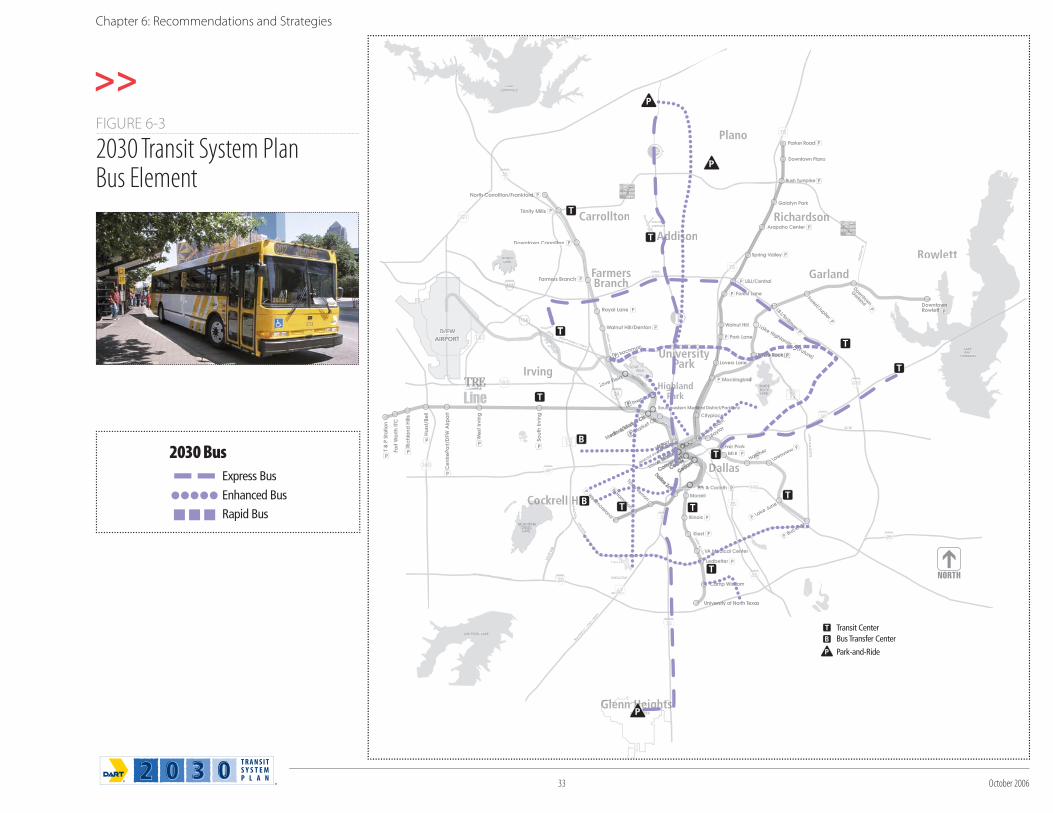
33 October 2006
MARV
IN D
. LO
VE F
RWY.
BU
CK
NE
R B
LVD
.
WA
LTON
LAN
CA
STER
US 80
ORTHWEST HWY.
WA
LKER
LAV
ON
DR
.
RWY.
ADDISONONAIRPORTT
HA
RRY H
INES
BEAR CREEK
JOE POOL LAKE
NORTHLAKE
LAKERAY
HUBBARD
LAKELEWISVILLE
D/FW/FFAIRPORTPP
NORTHWEST HWY.R
DALLASSS
EXECUTIVE
AIR
MLKFair Park
DowntowownRowletRo tt
Farmers Brancher
Downtown Carrolltonto
Trinity Mills
North Carrollton/Frankfordh Ca ord
Royal Lane
Walnut Hill/Denton
Bachman
Love
r.r.
knerer
Bucknekne
Lake June
LawnviewHatcher
atch
Deep Ellum
D BaylorB
University of North Texasniversity
Camp Wisdom
Southwestern Medical District/Parklandw caicdicic
RPORTPORPORTPOOOR
Rowlett
Plano
Garland
RichardsonnCarrollton
AddisonAd
FarmersBranchh
Irving
l Hill
Glenn HeightssGlenn Heightss
HighlandhParkPa
DallasDDaD
UniversityivU i iParkP
Lake Highlands (Future)
s (s (
Transit CenterBus Transfer Center
Park-and-Ride
FIGURE 6-3
2030 Transit System PlanBus Element
Chapter 6: Recommendations and Strategies
2030 Bus
Express Bus
Enhanced BusRapid Bus
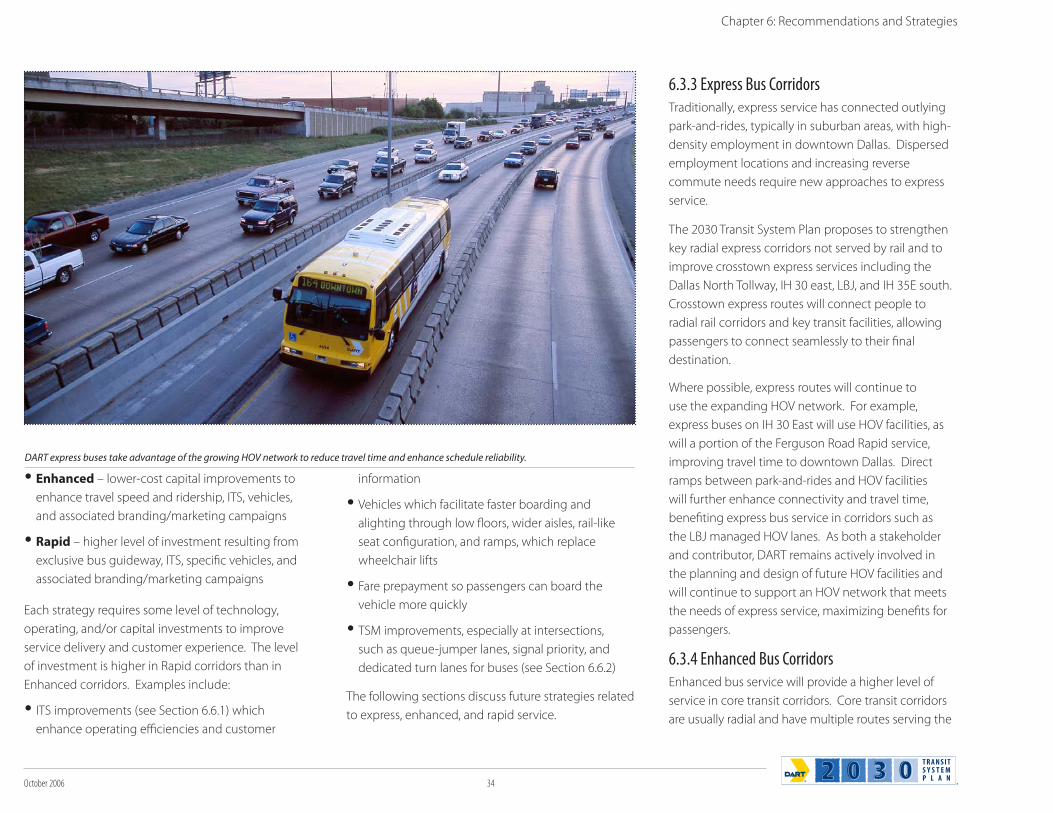
October 2006 34
Enhanced – lower-cost capital improvements to
enhance travel speed and ridership, ITS, vehicles,
and associated branding/marketing campaigns
Rapid – higher level of investment resulting from
exclusive bus guideway, ITS, specific vehicles, and
associated branding/marketing campaigns
Each strategy requires some level of technology,
operating, and/or capital investments to improve
service delivery and customer experience. The level
of investment is higher in Rapid corridors than in
Enhanced corridors. Examples include:
ITS improvements (see Section 6.6.1) which
enhance operating efficiencies and customer
information
Vehicles which facilitate faster boarding and
alighting through low floors, wider aisles, rail-like
seat configuration, and ramps, which replace
wheelchair lifts
Fare prepayment so passengers can board the
vehicle more quickly
TSM improvements, especially at intersections,
such as queue-jumper lanes, signal priority, and
dedicated turn lanes for buses (see Section 6.6.2)
The following sections discuss future strategies related
to express, enhanced, and rapid service.
6.3.3 Express Bus Corridors Traditionally, express service has connected outlying
park-and-rides, typically in suburban areas, with high-
density employment in downtown Dallas. Dispersed
employment locations and increasing reverse
commute needs require new approaches to express
service.
The 2030 Transit System Plan proposes to strengthen
key radial express corridors not served by rail and to
improve crosstown express services including the
Dallas North Tollway, IH 30 east, LBJ, and IH 35E south.
Crosstown express routes will connect people to
radial rail corridors and key transit facilities, allowing
passengers to connect seamlessly to their final
destination.
Where possible, express routes will continue to
use the expanding HOV network. For example,
express buses on IH 30 East will use HOV facilities, as
will a portion of the Ferguson Road Rapid service,
improving travel time to downtown Dallas. Direct
ramps between park-and-rides and HOV facilities
will further enhance connectivity and travel time,
benefiting express bus service in corridors such as
the LBJ managed HOV lanes. As both a stakeholder
and contributor, DART remains actively involved in
the planning and design of future HOV facilities and
will continue to support an HOV network that meets
the needs of express service, maximizing benefits for
passengers.
6.3.4 Enhanced Bus CorridorsEnhanced bus service will provide a higher level of
service in core transit corridors. Core transit corridors
are usually radial and have multiple routes serving the
Chapter 6: Recommendations and Strategies
DART express buses take advantage of the growing HOV network to reduce travel time and enhance schedule reliability.
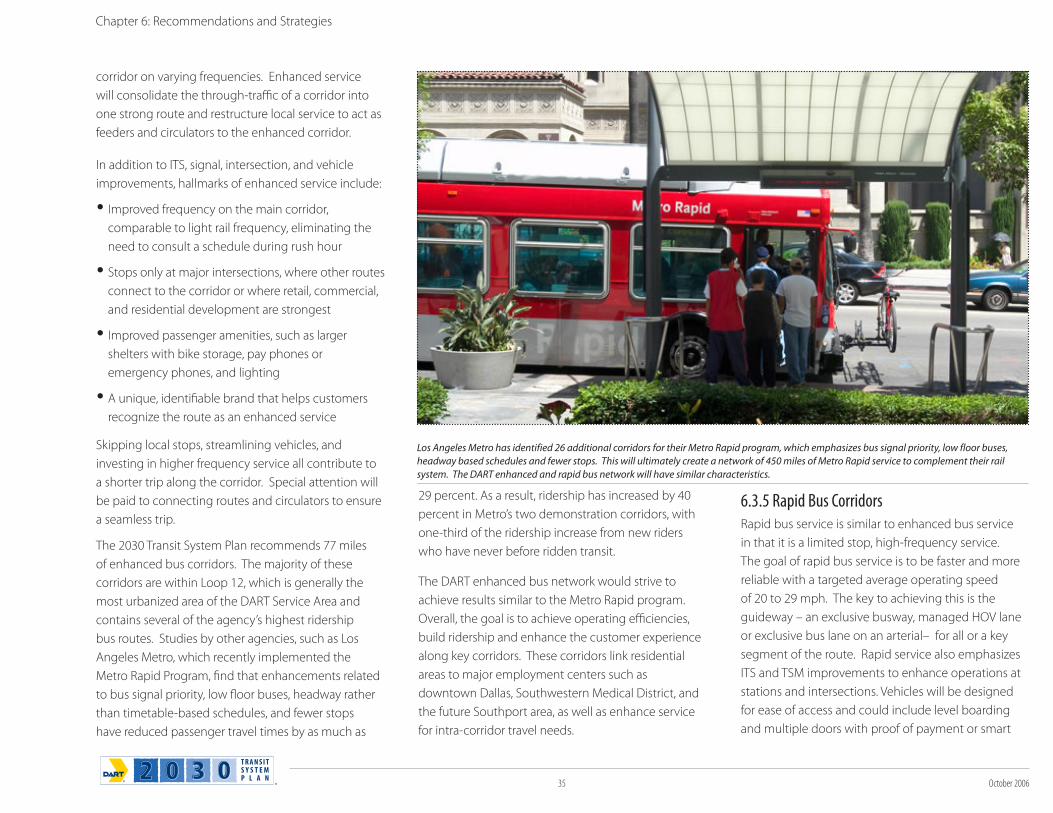
35 October 2006
corridor on varying frequencies. Enhanced service
will consolidate the through-traffic of a corridor into
one strong route and restructure local service to act as
feeders and circulators to the enhanced corridor.
In addition to ITS, signal, intersection, and vehicle
improvements, hallmarks of enhanced service include:
Improved frequency on the main corridor,
comparable to light rail frequency, eliminating the
need to consult a schedule during rush hour
Stops only at major intersections, where other routes
connect to the corridor or where retail, commercial,
and residential development are strongest
Improved passenger amenities, such as larger
shelters with bike storage, pay phones or
emergency phones, and lighting
A unique, identifiable brand that helps customers
recognize the route as an enhanced service
Skipping local stops, streamlining vehicles, and
investing in higher frequency service all contribute to
a shorter trip along the corridor. Special attention will
be paid to connecting routes and circulators to ensure
a seamless trip.
The 2030 Transit System Plan recommends 77 miles
of enhanced bus corridors. The majority of these
corridors are within Loop 12, which is generally the
most urbanized area of the DART Service Area and
contains several of the agency’s highest ridership
bus routes. Studies by other agencies, such as Los
Angeles Metro, which recently implemented the
Metro Rapid Program, find that enhancements related
to bus signal priority, low floor buses, headway rather
than timetable-based schedules, and fewer stops
have reduced passenger travel times by as much as
29 percent. As a result, ridership has increased by 40
percent in Metro’s two demonstration corridors, with
one-third of the ridership increase from new riders
who have never before ridden transit.
The DART enhanced bus network would strive to
achieve results similar to the Metro Rapid program.
Overall, the goal is to achieve operating efficiencies,
build ridership and enhance the customer experience
along key corridors. These corridors link residential
areas to major employment centers such as
downtown Dallas, Southwestern Medical District, and
the future Southport area, as well as enhance service
for intra-corridor travel needs.
6.3.5 Rapid Bus CorridorsRapid bus service is similar to enhanced bus service
in that it is a limited stop, high-frequency service.
The goal of rapid bus service is to be faster and more
reliable with a targeted average operating speed
of 20 to 29 mph. The key to achieving this is the
guideway – an exclusive busway, managed HOV lane
or exclusive bus lane on an arterial– for all or a key
segment of the route. Rapid service also emphasizes
ITS and TSM improvements to enhance operations at
stations and intersections. Vehicles will be designed
for ease of access and could include level boarding
and multiple doors with proof of payment or smart
Chapter 6: Recommendations and Strategies
Los Angeles Metro has identified 26 additional corridors for their Metro Rapid program, which emphasizes bus signal priority, low floor buses,
headway based schedules and fewer stops. This will ultimately create a network of 450 miles of Metro Rapid service to complement their rail
system. The DART enhanced and rapid bus network will have similar characteristics.
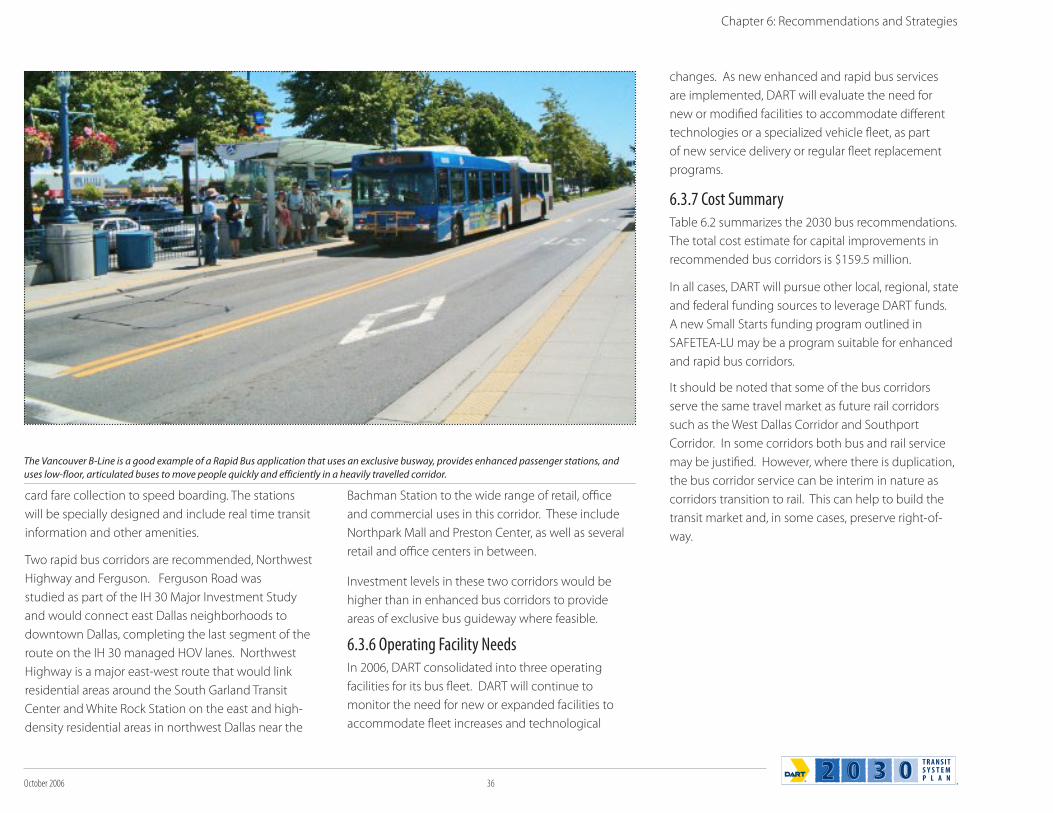
October 2006 36
card fare collection to speed boarding. The stations
will be specially designed and include real time transit
information and other amenities.
Two rapid bus corridors are recommended, Northwest
Highway and Ferguson. Ferguson Road was
studied as part of the IH 30 Major Investment Study
and would connect east Dallas neighborhoods to
downtown Dallas, completing the last segment of the
route on the IH 30 managed HOV lanes. Northwest
Highway is a major east-west route that would link
residential areas around the South Garland Transit
Center and White Rock Station on the east and high-
density residential areas in northwest Dallas near the
Bachman Station to the wide range of retail, office
and commercial uses in this corridor. These include
Northpark Mall and Preston Center, as well as several
retail and office centers in between.
Investment levels in these two corridors would be
higher than in enhanced bus corridors to provide
areas of exclusive bus guideway where feasible.
6.3.6 Operating Facility NeedsIn 2006, DART consolidated into three operating
facilities for its bus fleet. DART will continue to
monitor the need for new or expanded facilities to
accommodate fleet increases and technological
changes. As new enhanced and rapid bus services
are implemented, DART will evaluate the need for
new or modified facilities to accommodate different
technologies or a specialized vehicle fleet, as part
of new service delivery or regular fleet replacement
programs.
6.3.7 Cost SummaryTable 6.2 summarizes the 2030 bus recommendations.
The total cost estimate for capital improvements in
recommended bus corridors is $159.5 million.
In all cases, DART will pursue other local, regional, state
and federal funding sources to leverage DART funds.
A new Small Starts funding program outlined in
SAFETEA-LU may be a program suitable for enhanced
and rapid bus corridors.
It should be noted that some of the bus corridors
serve the same travel market as future rail corridors
such as the West Dallas Corridor and Southport
Corridor. In some corridors both bus and rail service
may be justified. However, where there is duplication,
the bus corridor service can be interim in nature as
corridors transition to rail. This can help to build the
transit market and, in some cases, preserve right-of-
way.
Chapter 6: Recommendations and Strategies
The Vancouver B-Line is a good example of a Rapid Bus application that uses an exclusive busway, provides enhanced passenger stations, and
uses low-floor, articulated buses to move people quickly and efficiently in a heavily travelled corridor.
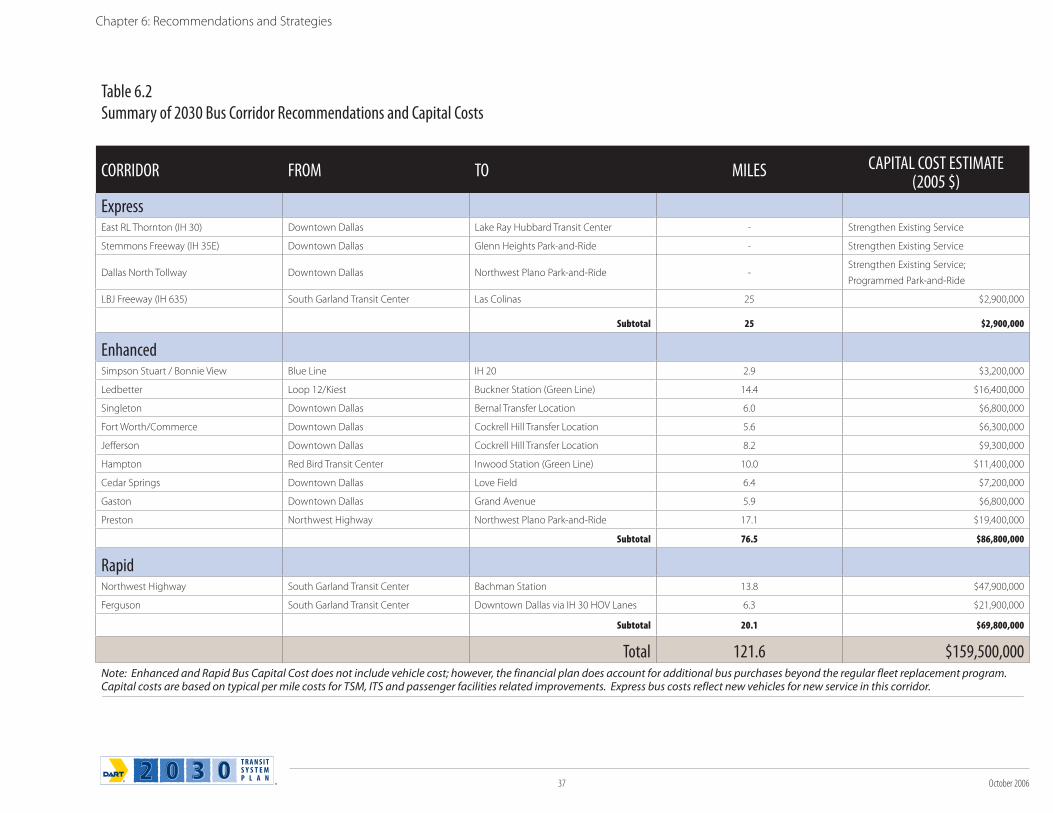
37 October 2006
Chapter 6: Recommendations and Strategies
Table 6.2Summary of 2030 Bus Corridor Recommendations and Capital Costs
CORRIDOR FROM TO MILES CAPITAL COST ESTIMATE(2005 $)
ExpressEast RL Thornton (IH 30) Downtown Dallas Lake Ray Hubbard Transit Center - Strengthen Existing Service
Stemmons Freeway (IH 35E) Downtown Dallas Glenn Heights Park-and-Ride - Strengthen Existing Service
Dallas North Tollway Downtown Dallas Northwest Plano Park-and-Ride -Strengthen Existing Service;
Programmed Park-and-Ride
LBJ Freeway (IH 635) South Garland Transit Center Las Colinas 25 $2,900,000
Subtotal 25 $2,900,000
EnhancedSimpson Stuart / Bonnie View Blue Line IH 20 2.9 $3,200,000
Ledbetter Loop 12/Kiest Buckner Station (Green Line) 14.4 $16,400,000
Singleton Downtown Dallas Bernal Transfer Location 6.0 $6,800,000
Fort Worth/Commerce Downtown Dallas Cockrell Hill Transfer Location 5.6 $6,300,000
Jefferson Downtown Dallas Cockrell Hill Transfer Location 8.2 $9,300,000
Hampton Red Bird Transit Center Inwood Station (Green Line) 10.0 $11,400,000
Cedar Springs Downtown Dallas Love Field 6.4 $7,200,000
Gaston Downtown Dallas Grand Avenue 5.9 $6,800,000
Preston Northwest Highway Northwest Plano Park-and-Ride 17.1 $19,400,000
Subtotal 76.5 $86,800,000
RapidNorthwest Highway South Garland Transit Center Bachman Station 13.8 $47,900,000
Ferguson South Garland Transit Center Downtown Dallas via IH 30 HOV Lanes 6.3 $21,900,000
Subtotal 20.1 $69,800,000
Total 121.6 $159,500,000Note: Enhanced and Rapid Bus Capital Cost does not include vehicle cost; however, the financial plan does account for additional bus purchases beyond the regular fleet replacement program. Capital costs are based on typical per mile costs for TSM, ITS and passenger facilities related improvements. Express bus costs reflect new vehicles for new service in this corridor.
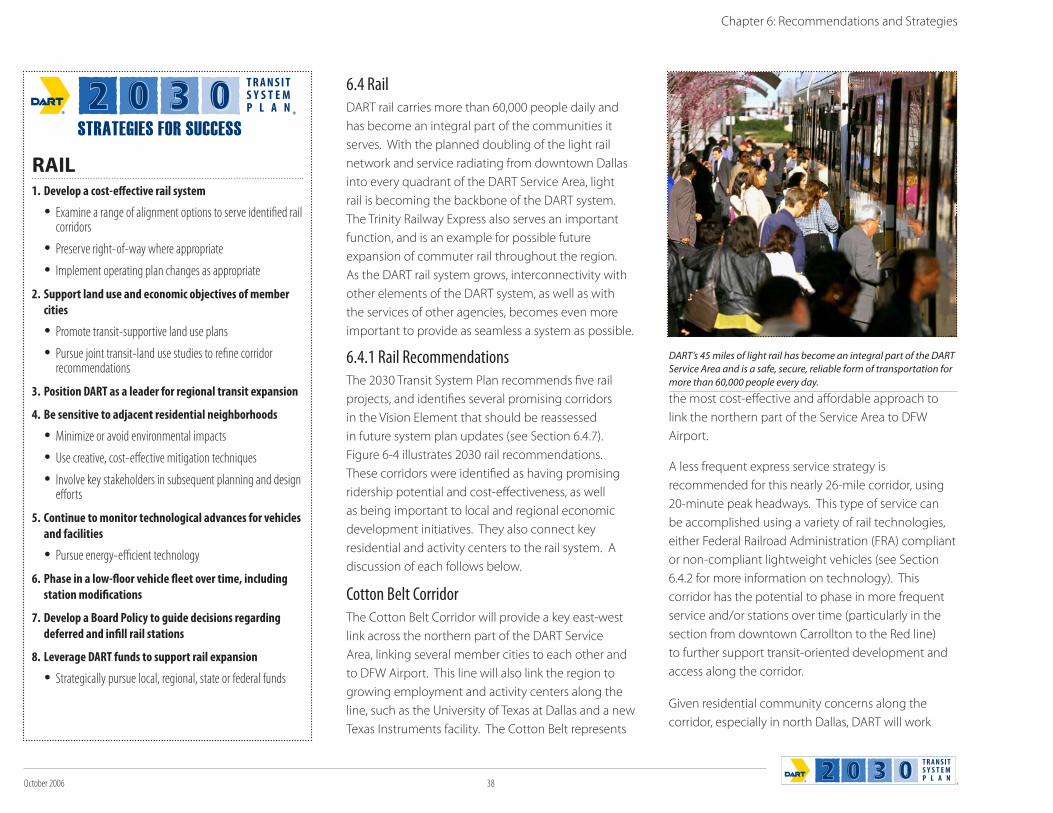
October 2006 38
6.4 RailDART rail carries more than 60,000 people daily and
has become an integral part of the communities it
serves. With the planned doubling of the light rail
network and service radiating from downtown Dallas
into every quadrant of the DART Service Area, light
rail is becoming the backbone of the DART system.
The Trinity Railway Express also serves an important
function, and is an example for possible future
expansion of commuter rail throughout the region.
As the DART rail system grows, interconnectivity with
other elements of the DART system, as well as with
the services of other agencies, becomes even more
important to provide as seamless a system as possible.
6.4.1 Rail RecommendationsThe 2030 Transit System Plan recommends five rail
projects, and identifies several promising corridors
in the Vision Element that should be reassessed
in future system plan updates (see Section 6.4.7).
Figure 6-4 illustrates 2030 rail recommendations.
These corridors were identified as having promising
ridership potential and cost-effectiveness, as well
as being important to local and regional economic
development initiatives. They also connect key
residential and activity centers to the rail system. A
discussion of each follows below.
Cotton Belt CorridorThe Cotton Belt Corridor will provide a key east-west
link across the northern part of the DART Service
Area, linking several member cities to each other and
to DFW Airport. This line will also link the region to
growing employment and activity centers along the
line, such as the University of Texas at Dallas and a new
Texas Instruments facility. The Cotton Belt represents
the most cost-effective and affordable approach to
link the northern part of the Service Area to DFW
Airport.
A less frequent express service strategy is
recommended for this nearly 26-mile corridor, using
20-minute peak headways. This type of service can
be accomplished using a variety of rail technologies,
either Federal Railroad Administration (FRA) compliant
or non-compliant lightweight vehicles (see Section
6.4.2 for more information on technology). This
corridor has the potential to phase in more frequent
service and/or stations over time (particularly in the
section from downtown Carrollton to the Red line)
to further support transit-oriented development and
access along the corridor.
Given residential community concerns along the
corridor, especially in north Dallas, DART will work
RAIL1. Develop a cost-effective rail system
Examine a range of alignment options to serve identified rail corridors
Preserve right-of-way where appropriate
Implement operating plan changes as appropriate
2. Support land use and economic objectives of member
cities
Promote transit-supportive land use plans
Pursue joint transit-land use studies to refine corridor recommendations
3. Position DART as a leader for regional transit expansion
4. Be sensitive to adjacent residential neighborhoods
Minimize or avoid environmental impacts
Use creative, cost-effective mitigation techniques
Involve key stakeholders in subsequent planning and design efforts
5. Continue to monitor technological advances for vehicles
and facilities
Pursue energy-efficient technology
6. Phase in a low-floor vehicle fleet over time, including
station modifications
7. Develop a Board Policy to guide decisions regarding
deferred and infill rail stations
8. Leverage DART funds to support rail expansion
Strategically pursue local, regional, state or federal funds
STRATEGIES FOR SUCCESS
T R A N S I TS Y S T E MP L A N
DART’s 45 miles of light rail has become an integral part of the DART
Service Area and is a safe, secure, reliable form of transportation for
more than 60,000 people every day.
Chapter 6: Recommendations and Strategies
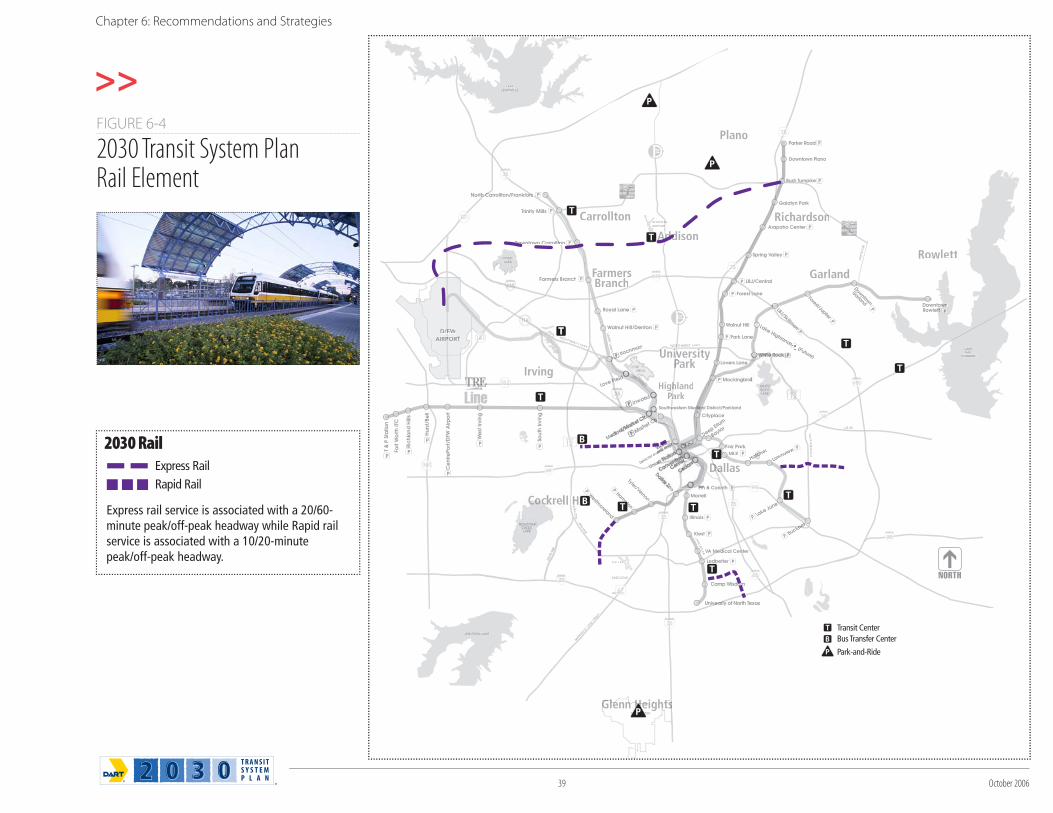
39 October 2006
MARV
IN D
. LO
VE F
RWY.
BU
CK
NE
R B
LVD
.
WA
LTON
LAN
CA
STER
US 80
ORTHWEST HWY.
WA
LKER
LAV
ON
DR
.
RWY.
ADDISONONAIRPORTT
HA
RRY H
INES
BEAR CREEK
JOE POOL LAKE
NORTHLAKE
LAKERAY
HUBBARD
LAKELEWISVILLE
D/FW/FFAIRPORTPP
NORTHWEST HWY.R
DALLASSS
EXECUTIVE
AIR
MLKFair Park
DowntowownRowletRo tt
Farmers Brancher
Downtown Carrolltonto
Trinity Mills
North Carrollton/Frankfordh Ca ord
Royal Lane
Walnut Hill/Denton
Bachman
Love
r.r.
knerer
Bucknekne
Lake June
LawnviewHatcher
atch
Deep Ellum
D BaylorB
University of North Texasniversity
Camp Wisdom
Southwestern Medical District/Parklandw caicdicic
RPORTPORPORTPOOOR
Rowlett
Plano
Garland
RichardsonnCarrollton
AddisonAd
FarmersBranchh
Irving
l Hill
Glenn HeightssGlenn Heightss
HighlandhParkPa
DallasDDaD
UniversityivU i iParkP
Lake Highlands (Future)
s (s (
Transit CenterBus Transfer Center
Park-and-Ride
Express rail service is associated with a 20/60-minute peak/off-peak headway while Rapid rail service is associated with a 10/20-minute peak/off-peak headway.
2030 RailExpress RailRapid Rail
FIGURE 6-4
2030 Transit System PlanRail Element
Chapter 6: Recommendations and Strategies
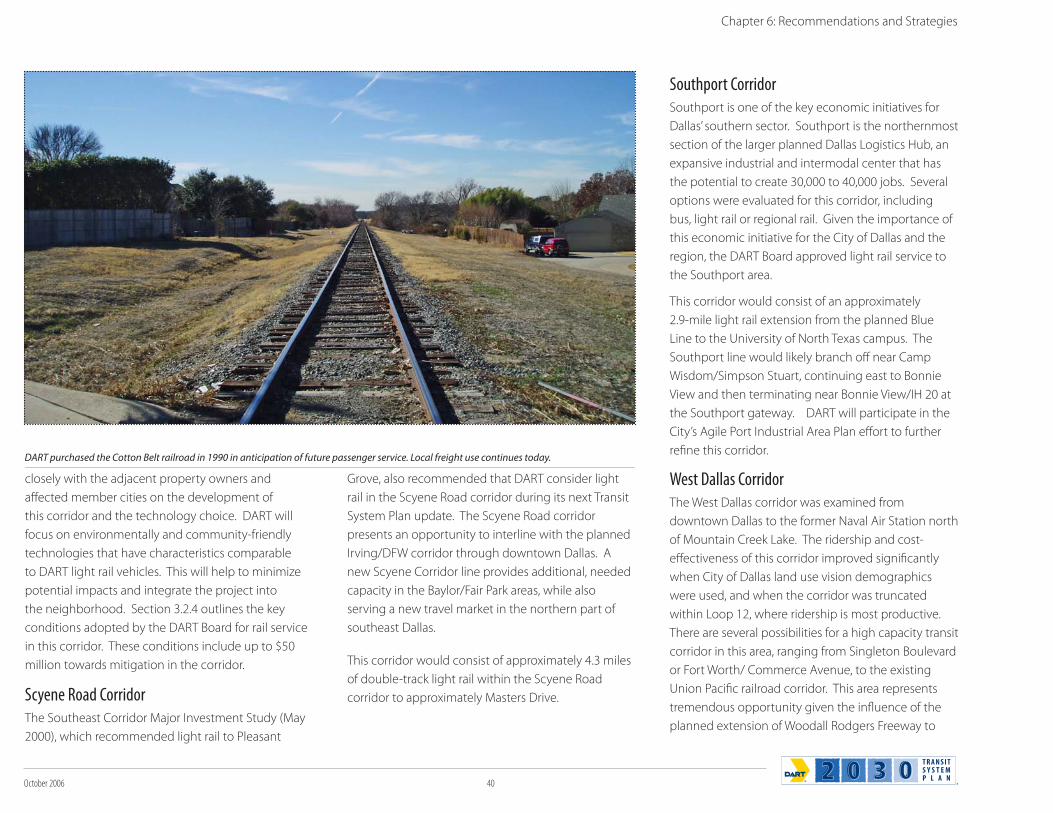
October 2006 40
closely with the adjacent property owners and
affected member cities on the development of
this corridor and the technology choice. DART will
focus on environmentally and community-friendly
technologies that have characteristics comparable
to DART light rail vehicles. This will help to minimize
potential impacts and integrate the project into
the neighborhood. Section 3.2.4 outlines the key
conditions adopted by the DART Board for rail service
in this corridor. These conditions include up to $50
million towards mitigation in the corridor.
Scyene Road CorridorThe Southeast Corridor Major Investment Study (May
2000), which recommended light rail to Pleasant
Grove, also recommended that DART consider light
rail in the Scyene Road corridor during its next Transit
System Plan update. The Scyene Road corridor
presents an opportunity to interline with the planned
Irving/DFW corridor through downtown Dallas. A
new Scyene Corridor line provides additional, needed
capacity in the Baylor/Fair Park areas, while also
serving a new travel market in the northern part of
southeast Dallas.
This corridor would consist of approximately 4.3 miles
of double-track light rail within the Scyene Road
corridor to approximately Masters Drive.
Southport CorridorSouthport is one of the key economic initiatives for
Dallas’ southern sector. Southport is the northernmost
section of the larger planned Dallas Logistics Hub, an
expansive industrial and intermodal center that has
the potential to create 30,000 to 40,000 jobs. Several
options were evaluated for this corridor, including
bus, light rail or regional rail. Given the importance of
this economic initiative for the City of Dallas and the
region, the DART Board approved light rail service to
the Southport area.
This corridor would consist of an approximately
2.9-mile light rail extension from the planned Blue
Line to the University of North Texas campus. The
Southport line would likely branch off near Camp
Wisdom/Simpson Stuart, continuing east to Bonnie
View and then terminating near Bonnie View/IH 20 at
the Southport gateway. DART will participate in the
City’s Agile Port Industrial Area Plan effort to further
refine this corridor.
West Dallas CorridorThe West Dallas corridor was examined from
downtown Dallas to the former Naval Air Station north
of Mountain Creek Lake. The ridership and cost-
effectiveness of this corridor improved significantly
when City of Dallas land use vision demographics
were used, and when the corridor was truncated
within Loop 12, where ridership is most productive.
There are several possibilities for a high capacity transit
corridor in this area, ranging from Singleton Boulevard
or Fort Worth/ Commerce Avenue, to the existing
Union Pacific railroad corridor. This area represents
tremendous opportunity given the influence of the
planned extension of Woodall Rodgers Freeway to
Chapter 6: Recommendations and Strategies
DART purchased the Cotton Belt railroad in 1990 in anticipation of future passenger service. Local freight use continues today.
41 October 2006
Singleton Boulevard, the first Santiago Calatrava
bridge, and the Trinity River Corridor project. Coupled
with the forwardDallas! Plan designation as a mixed-
use, urban core land use area, all of these efforts will
help to transform this corridor into an area more
supportive of a rail transit investment.
This corridor would be an approximately 6-mile light
rail line from downtown Dallas to the Loop 12 area.
DART will work closely with the City of Dallas to select
an appropriate transit corridor and refine transit-
supportive land use plans.
West Oak Cliff Red Line ExtensionThe existing Red Line currently terminates at
Westmoreland Station. An extension to Red Bird
Lane near the Dallas City limits has been identified in
prior Transit System Plans as potential expansion, and
would serve residential and growing employment
areas in this part of Southwest Dallas.
This extension would consist of approximately 4.3
miles of double-track light rail within existing DART-
owned railroad right-of-way. During subsequent
studies, alternative alignments and terminus points
will be examined, including an alternative alignment
to the Mountain Creek area as identified in the
forwardDallas! Plan. Interface with potential regional
rail or expansion of light rail further to the southwest
should new member cities join DART will be key
considerations in the selection of a terminus and final
alignment.
Love Field ConnectionTransit access to Dallas Love Field airport is discussed
in Chapter 3 as a focus area of the 2030 Transit System
Plan. DART will retain its $20 million commitment
towards a Love Field connection. As part of the joint
statement agreed to by key parties involved in the
Wright Amendment issue (signed June 15, 2006),
Love Field flight restrictions would expire 8 years after
legislation to repeal the Wright Amendment is passed.
President Bush signed the Wright Amendment Reform
Act into law on October 13, 2006. The City of Dallas
will seek approval to use Passenger Facility Charges
(PFC) to fund DART access to Love Field via a people
mover within this timeframe to connect DART rail to
the Love Field terminal. The 2030 Transit System Plan
assumes that the City will take the lead to fund, build,
and operate this project, with DART cooperation,
financial support, and technical assistance.
6.4.2 Vehicle TechnologyElectric-powered LRT is the logical vehicle choice for
most corridors given that they will be extensions of or
interlined with the existing LRT system. The Cotton
Belt corridor has the best potential for alternative
technology, whether it is a FRA compliant vehicle, or
non-compliant self-propelled light rail vehicle. Use
of one common technology or vehicle types can
create efficiencies for maintenance facilities and create
purchasing power benefits. Thus, as the Denton
County Transportation Authority (rail from Denton
to Carrollton) and the T (Cotton Belt west of DFW
Airport) evaluate technologies for their planned rail
lines, there may be opportunities to create a second
common vehicle technology with one or both of
these corridors.
A key consideration for the Cotton Belt corridor, as in
other corridors, is the desire for an environmentally-
and community-friendly vehicle that has
characteristics comparable to DART light rail. DART
will continue to monitor technological advances that
can be applied not only to this corridor but to the
entire rail fleet in order to maximize environmental
and cost benefits and support future vehicle
technology decisions. Key conditions relative to the
Cotton Belt corridor vehicle are contained in Section
3.2.4.
6.4.3 Streetcars Streetcars are another form of rail that can be used to
enhance mobility in mixed-use, pedestrian-oriented
areas. Streetcars have also been known to strengthen
revitalization efforts in the areas it serves. Section
3.1 discusses streetcar opportunities and their role in
supporting the transit system.
6.4.4 Rail StationsThe most important element of the DART rail system
is the stations. Stations not only serve as the gateway
to the entire rail network, but often are a catalyst for
creating denser, more transit- and pedestrian-friendly
areas. While general locations may be identified at
the system plan level, the target location and function
of stations are usually defined during the Alternatives
Analysis phase. Subsequent preliminary engineering
and environmental studies further refine the locations,
and may include “deferred” stations. Stations can be
deferred for reasons such as insufficient demand,
future transit-oriented development opportunities or
waiting until additional transit linkages come on line.
Deferred stations are committed, but are not funded
by DART until warranted.
The Lake Highlands Station on the Blue Line was
previously deferred due to insufficient demand
and community opposition, but transit-oriented
development opportunities and renewed support
warrant its construction. Funding of up to $10 million
Chapter 6: Recommendations and Strategies
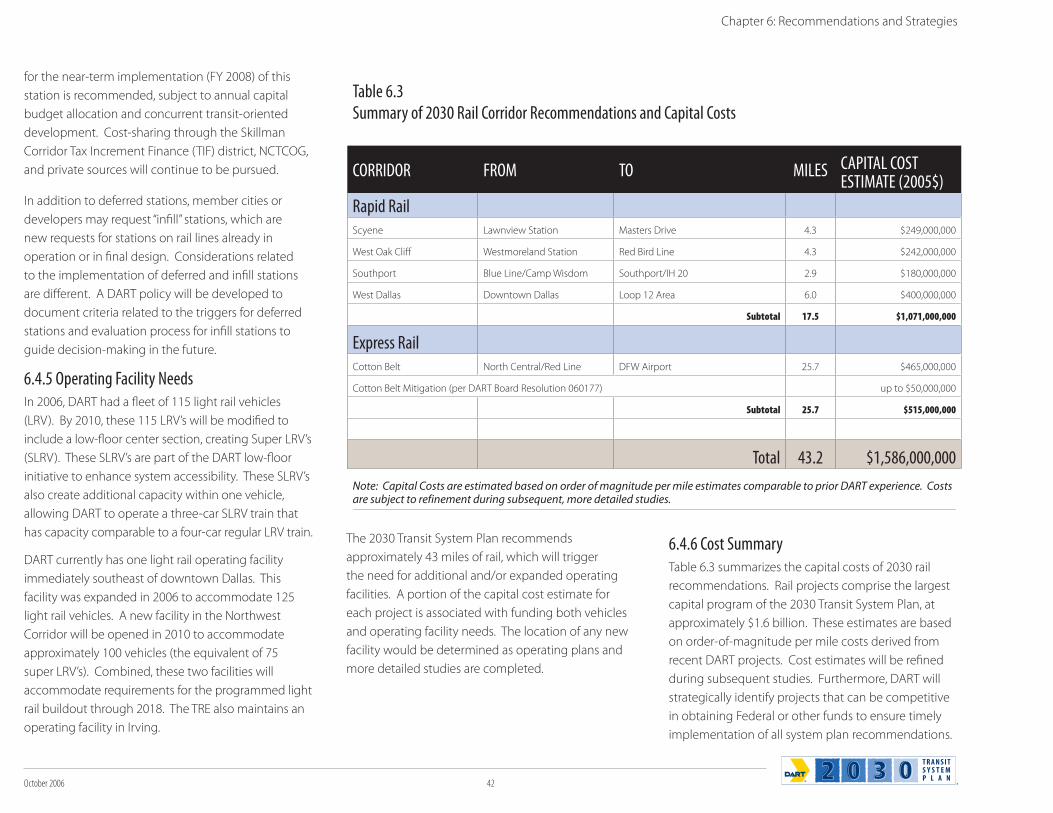
October 2006 42
Chapter 6: Recommendations and Strategies
for the near-term implementation (FY 2008) of this
station is recommended, subject to annual capital
budget allocation and concurrent transit-oriented
development. Cost-sharing through the Skillman
Corridor Tax Increment Finance (TIF) district, NCTCOG,
and private sources will continue to be pursued.
In addition to deferred stations, member cities or
developers may request “infill” stations, which are
new requests for stations on rail lines already in
operation or in final design. Considerations related
to the implementation of deferred and infill stations
are different. A DART policy will be developed to
document criteria related to the triggers for deferred
stations and evaluation process for infill stations to
guide decision-making in the future.
6.4.5 Operating Facility NeedsIn 2006, DART had a fleet of 115 light rail vehicles
(LRV). By 2010, these 115 LRV’s will be modified to
include a low-floor center section, creating Super LRV’s
(SLRV). These SLRV’s are part of the DART low-floor
initiative to enhance system accessibility. These SLRV’s
also create additional capacity within one vehicle,
allowing DART to operate a three-car SLRV train that
has capacity comparable to a four-car regular LRV train.
DART currently has one light rail operating facility
immediately southeast of downtown Dallas. This
facility was expanded in 2006 to accommodate 125
light rail vehicles. A new facility in the Northwest
Corridor will be opened in 2010 to accommodate
approximately 100 vehicles (the equivalent of 75
super LRV’s). Combined, these two facilities will
accommodate requirements for the programmed light
rail buildout through 2018. The TRE also maintains an
operating facility in Irving.
The 2030 Transit System Plan recommends
approximately 43 miles of rail, which will trigger
the need for additional and/or expanded operating
facilities. A portion of the capital cost estimate for
each project is associated with funding both vehicles
and operating facility needs. The location of any new
facility would be determined as operating plans and
more detailed studies are completed.
6.4.6 Cost SummaryTable 6.3 summarizes the capital costs of 2030 rail
recommendations. Rail projects comprise the largest
capital program of the 2030 Transit System Plan, at
approximately $1.6 billion. These estimates are based
on order-of-magnitude per mile costs derived from
recent DART projects. Cost estimates will be refined
during subsequent studies. Furthermore, DART will
strategically identify projects that can be competitive
in obtaining Federal or other funds to ensure timely
implementation of all system plan recommendations.
Table 6.3Summary of 2030 Rail Corridor Recommendations and Capital Costs
CORRIDOR FROM TO MILES CAPITAL COST ESTIMATE (2005$)
Rapid RailScyene Lawnview Station Masters Drive 4.3 $249,000,000
West Oak Cliff Westmoreland Station Red Bird Line 4.3 $242,000,000
Southport Blue Line/Camp Wisdom Southport/IH 20 2.9 $180,000,000
West Dallas Downtown Dallas Loop 12 Area 6.0 $400,000,000
Subtotal 17.5 $1,071,000,000
Express RailCotton Belt North Central/Red Line DFW Airport 25.7 $465,000,000
Cotton Belt Mitigation (per DART Board Resolution 060177) up to $50,000,000
Subtotal 25.7 $515,000,000
Total 43.2 $1,586,000,000
Note: Capital Costs are estimated based on order of magnitude per mile estimates comparable to prior DART experience. Costs are subject to refinement during subsequent, more detailed studies.
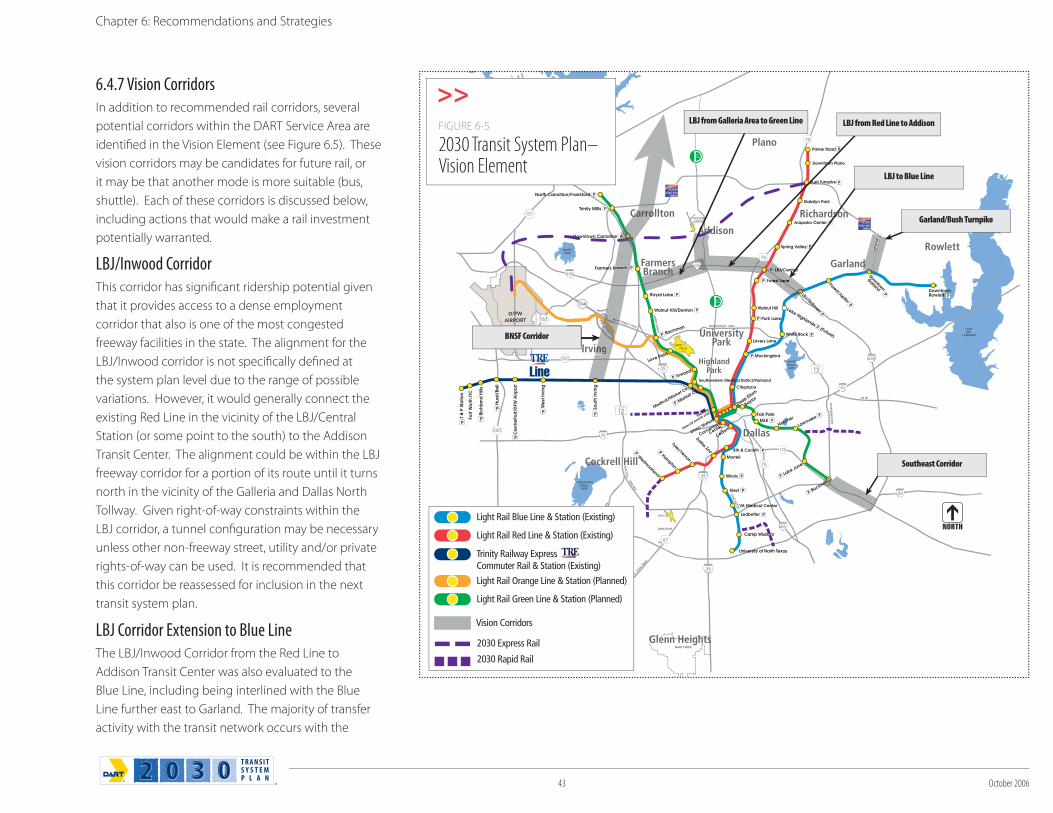
43 October 2006
6.4.7 Vision CorridorsIn addition to recommended rail corridors, several
potential corridors within the DART Service Area are
identified in the Vision Element (see Figure 6.5). These
vision corridors may be candidates for future rail, or
it may be that another mode is more suitable (bus,
shuttle). Each of these corridors is discussed below,
including actions that would make a rail investment
potentially warranted.
LBJ/Inwood CorridorThis corridor has significant ridership potential given
that it provides access to a dense employment
corridor that also is one of the most congested
freeway facilities in the state. The alignment for the
LBJ/Inwood corridor is not specifically defined at
the system plan level due to the range of possible
variations. However, it would generally connect the
existing Red Line in the vicinity of the LBJ/Central
Station (or some point to the south) to the Addison
Transit Center. The alignment could be within the LBJ
freeway corridor for a portion of its route until it turns
north in the vicinity of the Galleria and Dallas North
Tollway. Given right-of-way constraints within the
LBJ corridor, a tunnel configuration may be necessary
unless other non-freeway street, utility and/or private
rights-of-way can be used. It is recommended that
this corridor be reassessed for inclusion in the next
transit system plan.
LBJ Corridor Extension to Blue LineThe LBJ/Inwood Corridor from the Red Line to
Addison Transit Center was also evaluated to the
Blue Line, including being interlined with the Blue
Line further east to Garland. The majority of transfer
activity with the transit network occurs with the
Chapter 6: Recommendations and Strategies
MARV
IN D
. LO
VE F
RWY.
BU
CK
NE
R B
LVD
.
WA
LTON
LAN
CA
STER
US 80
NORTHWEST HWY.
SPU
R 40
8
WA
LKER
LAV
ON
DR
.
ADDISONAIRPORT
HA
RRY H
INES
BEAR CREEK
WHITEROCKLAKE
JOE POOL LAKE
MOUNTAINCREEKLAKE
NORTHLAKE
LAKERAY
HUBBARD
LAKELEWISVILLE
LOVEFIELD
D/FWAIRPORT
NORTHWEST HWY.
DALLAS
EXECUTIVE
AIRPORT
MLKFair Park
DENTONDR.
DowntownRowlett
Farmers Branch
Downtown Carrollton
Trinity Mills
North Carrollton/Frankford
Royal Lane
Walnut Hill/Denton
Bachman
Love Field
Inwood
Market Ctr.
Buckner
Lake June
LawnviewHatcher
Deep Ellum
Baylor
University of North Texas
Camp Wisdom
Southwestern Medical District/Parkland
Lake Highlands (Future)
Rowlett
Plano
Garland
RichardsonCarrollton
Addison
FarmersBranch
Irving
Cockrell Hill
Glenn Heights
HighlandPark
Dallas
UniversityPark
erere
LAV
ON
DR
.
d
LBJ to Blue Line
Garland/Bush Turnpike
Southeast Corridor
Light Rail Orange Line & Station (Planned)
Light Rail Green Line & Station (Planned)
Vision Corridors
Light Rail Blue Line & Station (Existing)
Light Rail Red Line & Station (Existing)
Trinity Railway ExpressCommuter Rail & Station (Existing)
2030 Express Rail
2030 Rapid Rail
BNSF Corridor
arroCar
Branch
NORT
ing
LBJ from Red Line to AddisonLBJ from Galleria Area to Green Line
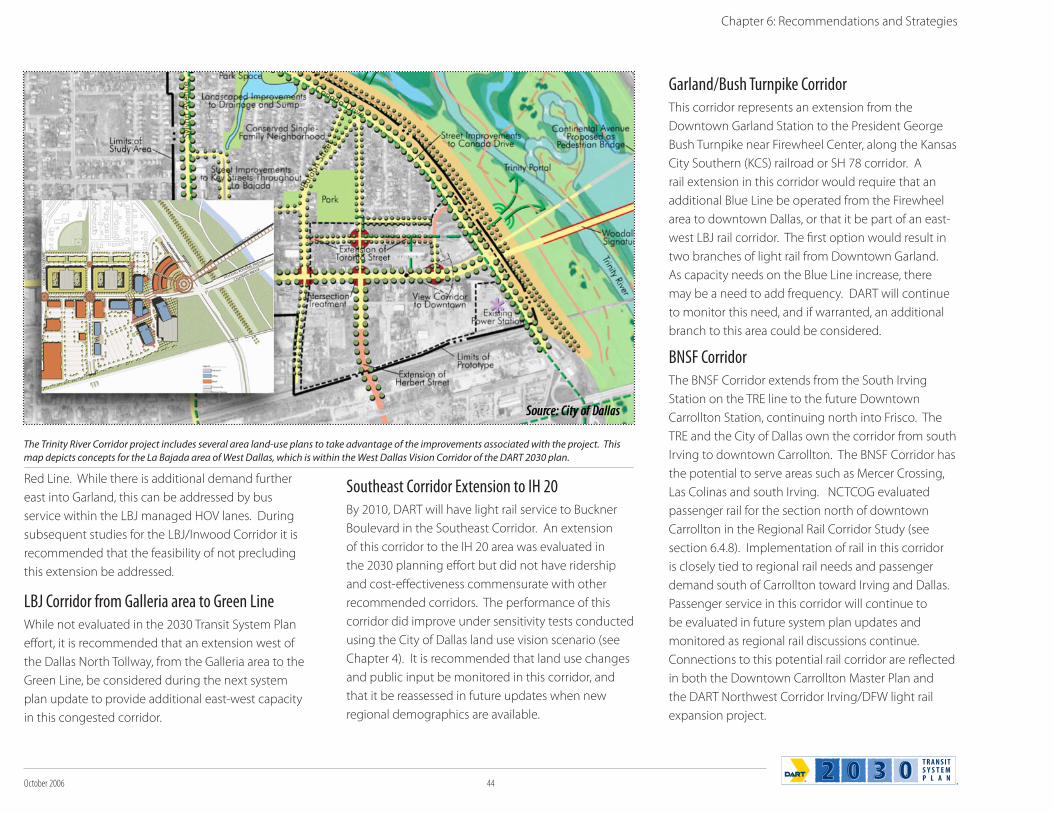
October 2006 44
Red Line. While there is additional demand further
east into Garland, this can be addressed by bus
service within the LBJ managed HOV lanes. During
subsequent studies for the LBJ/Inwood Corridor it is
recommended that the feasibility of not precluding
this extension be addressed.
LBJ Corridor from Galleria area to Green LineWhile not evaluated in the 2030 Transit System Plan
effort, it is recommended that an extension west of
the Dallas North Tollway, from the Galleria area to the
Green Line, be considered during the next system
plan update to provide additional east-west capacity
in this congested corridor.
Southeast Corridor Extension to IH 20By 2010, DART will have light rail service to Buckner
Boulevard in the Southeast Corridor. An extension
of this corridor to the IH 20 area was evaluated in
the 2030 planning effort but did not have ridership
and cost-effectiveness commensurate with other
recommended corridors. The performance of this
corridor did improve under sensitivity tests conducted
using the City of Dallas land use vision scenario (see
Chapter 4). It is recommended that land use changes
and public input be monitored in this corridor, and
that it be reassessed in future updates when new
regional demographics are available.
Garland/Bush Turnpike CorridorThis corridor represents an extension from the
Downtown Garland Station to the President George
Bush Turnpike near Firewheel Center, along the Kansas
City Southern (KCS) railroad or SH 78 corridor. A
rail extension in this corridor would require that an
additional Blue Line be operated from the Firewheel
area to downtown Dallas, or that it be part of an east-
west LBJ rail corridor. The first option would result in
two branches of light rail from Downtown Garland.
As capacity needs on the Blue Line increase, there
may be a need to add frequency. DART will continue
to monitor this need, and if warranted, an additional
branch to this area could be considered.
BNSF CorridorThe BNSF Corridor extends from the South Irving
Station on the TRE line to the future Downtown
Carrollton Station, continuing north into Frisco. The
TRE and the City of Dallas own the corridor from south
Irving to downtown Carrollton. The BNSF Corridor has
the potential to serve areas such as Mercer Crossing,
Las Colinas and south Irving. NCTCOG evaluated
passenger rail for the section north of downtown
Carrollton in the Regional Rail Corridor Study (see
section 6.4.8). Implementation of rail in this corridor
is closely tied to regional rail needs and passenger
demand south of Carrollton toward Irving and Dallas.
Passenger service in this corridor will continue to
be evaluated in future system plan updates and
monitored as regional rail discussions continue.
Connections to this potential rail corridor are reflected
in both the Downtown Carrollton Master Plan and
the DART Northwest Corridor Irving/DFW light rail
expansion project.
Chapter 6: Recommendations and Strategies
The Trinity River Corridor project includes several area land-use plans to take advantage of the improvements associated with the project. This
map depicts concepts for the La Bajada area of West Dallas, which is within the West Dallas Vision Corridor of the DART 2030 plan.
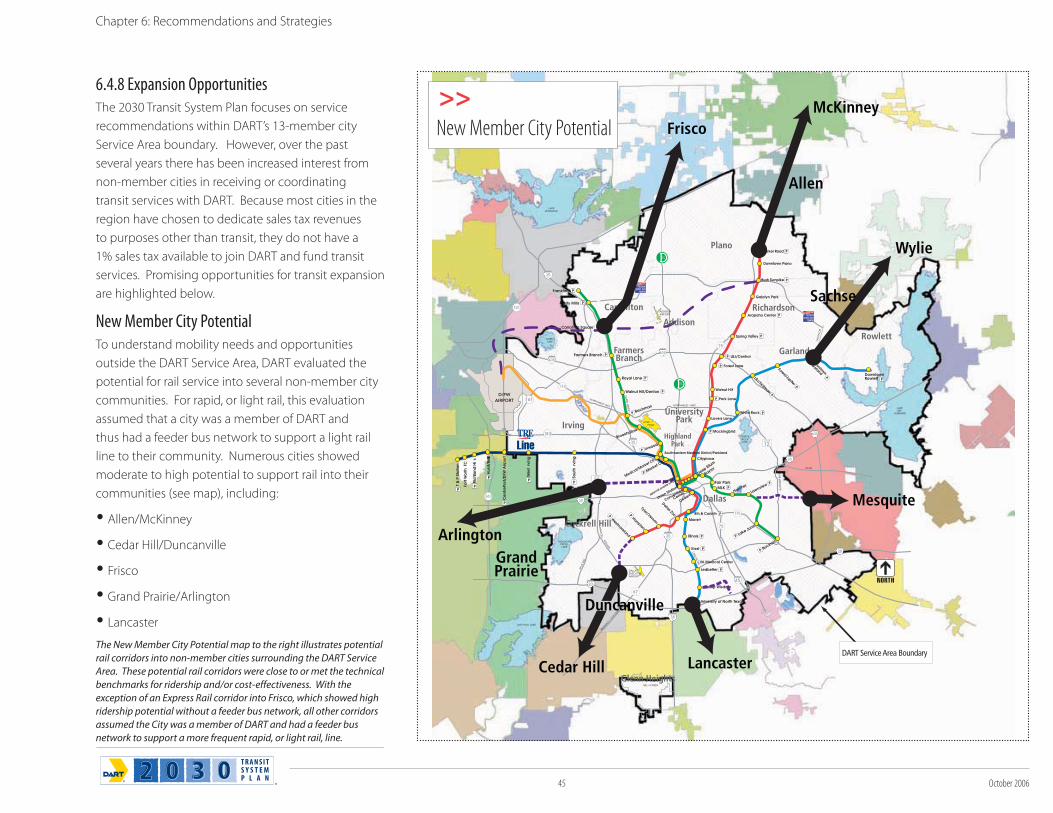
45 October 2006
6.4.8 Expansion OpportunitiesThe 2030 Transit System Plan focuses on service
recommendations within DART’s 13-member city
Service Area boundary. However, over the past
several years there has been increased interest from
non-member cities in receiving or coordinating
transit services with DART. Because most cities in the
region have chosen to dedicate sales tax revenues
to purposes other than transit, they do not have a
1% sales tax available to join DART and fund transit
services. Promising opportunities for transit expansion
are highlighted below.
New Member City PotentialTo understand mobility needs and opportunities
outside the DART Service Area, DART evaluated the
potential for rail service into several non-member city
communities. For rapid, or light rail, this evaluation
assumed that a city was a member of DART and
thus had a feeder bus network to support a light rail
line to their community. Numerous cities showed
moderate to high potential to support rail into their
communities (see map), including:
Allen/McKinney
Cedar Hill/Duncanville
Frisco
Grand Prairie/Arlington
Lancaster
Chapter 6: Recommendations and Strategies
MARV
IN D
. LO
VE F
RWY.
BU
CK
NE
R B
LVD
.
WA
LTON
LAN
CA
STER
US 80
NORTHWEST HWY.
SPU
R 40
8
WA
LKER
LAV
ON
DR
.
ADDISONAIRPORT
HA
RRY H
INES
BEAR CREEK
WHITEROCKLAKE
JOE POOL LAKE
MOUNTAINCREEKLAKE
NORTHLAKE
LAKERAY
HUBBARD
LAKELEWISVILLE
LOVEFIELD
D/FWAIRPORT
NORTHWEST HWY.
DALLASEXECUTIVEAIRPORT
MLKFair Park
DENTONDR.
DowntownRowlett
Farmers Branch
Carrollton Square
Trinity Mills
Frankford
Royal Lane
Walnut Hill/Denton
Bachman
Brookhollow
Inwood
Market Ctr.
Buckner
Lake June
LawnviewHatcher
Deep Ellum
Baylor
University of North Texas
Camp Wisdom
Southwestern Medical District/Parkland
Rowlett
Plano
Garland
RichardsonCarrollton
Addison
FarmersBranch
Irving
Cockrell Hill
Glenn Heights
HighlandPark
Dallas
UniversityPark
McKinney
Allen
Wylie
Mesquite
LancasterCedar Hill
Arlington
Frisco
Sachse
GrandPrairie
Duncanville
DART Service Area BoundaryThe New Member City Potential map to the right illustrates potential
rail corridors into non-member cities surrounding the DART Service
Area. These potential rail corridors were close to or met the technical
benchmarks for ridership and/or cost-effectiveness. With the
exception of an Express Rail corridor into Frisco, which showed high
ridership potential without a feeder bus network, all other corridors
assumed the City was a member of DART and had a feeder bus
network to support a more frequent rapid, or light rail, line.
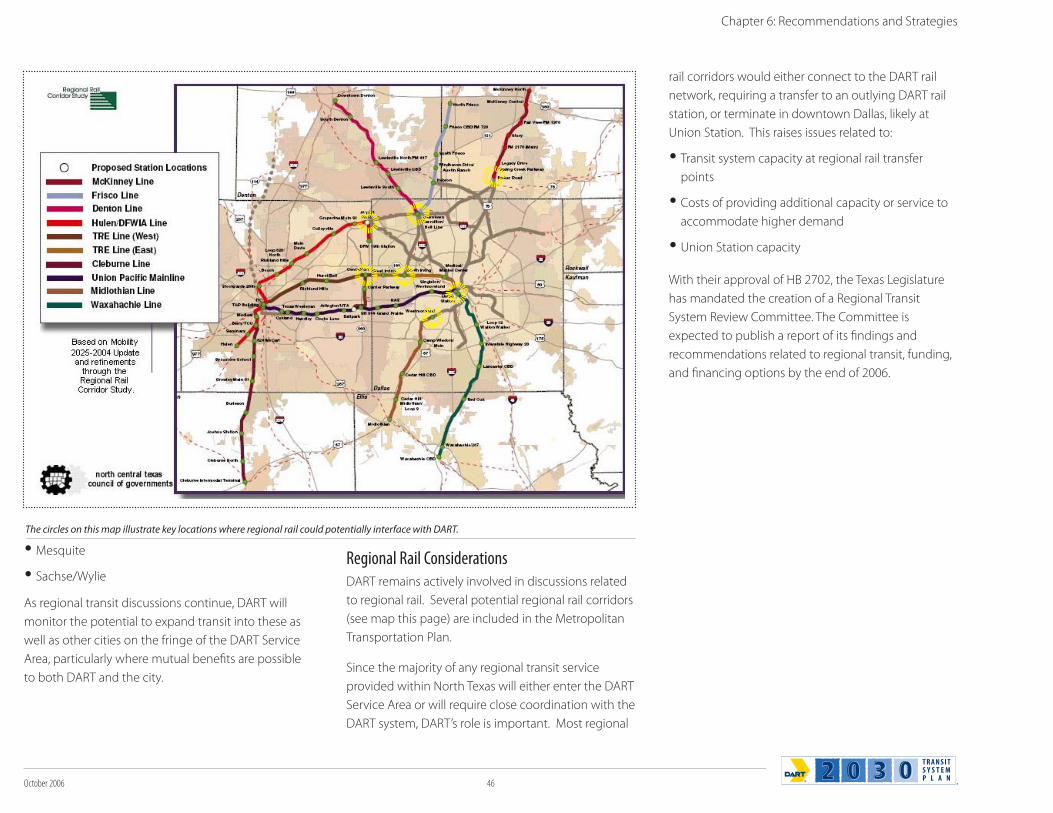
October 2006 46
Mesquite
Sachse/Wylie
As regional transit discussions continue, DART will
monitor the potential to expand transit into these as
well as other cities on the fringe of the DART Service
Area, particularly where mutual benefits are possible
to both DART and the city.
Regional Rail ConsiderationsDART remains actively involved in discussions related
to regional rail. Several potential regional rail corridors
(see map this page) are included in the Metropolitan
Transportation Plan.
Since the majority of any regional transit service
provided within North Texas will either enter the DART
Service Area or will require close coordination with the
DART system, DART’s role is important. Most regional
rail corridors would either connect to the DART rail
network, requiring a transfer to an outlying DART rail
station, or terminate in downtown Dallas, likely at
Union Station. This raises issues related to:
Transit system capacity at regional rail transfer
points
Costs of providing additional capacity or service to
accommodate higher demand
Union Station capacity
With their approval of HB 2702, the Texas Legislature
has mandated the creation of a Regional Transit
System Review Committee. The Committee is
expected to publish a report of its findings and
recommendations related to regional transit, funding,
and financing options by the end of 2006.
The circles on this map illustrate key locations where regional rail could potentially interface with DART.
Chapter 6: Recommendations and Strategies

47 October 2006
This page intentionally left blank.
Chapter 6: Recommendations and Strategies
October 2006 48
Paratransit 6.5DART Paratransit Service provides accessible,
curb-to-curb public transportation to people with
disabilities who are unable to use DART buses or
trains. This service is provided in accordance with
Board policy and in compliance with the Americans
with Disabilities Act (ADA) of 1990. The overall goal
of paratransit service is to achieve an optimal balance
of service quality and service cost. With a goal of
accommodating 100 percent of paratransit trip
requests, achieving this balance is difficult. In 2005,
DART had approximately 8,700 eligible patrons in
its database and an average of 1,950 weekday trips.
The 2030 Transit System Plan outlines strategies that
will help control operating costs while maintaining a
reasonable level of service for these customers.
6.5.1 Recent Changes and TrendsIn 2005, DART provided nearly 600,000 annual trips
at an operating cost of $23 million. This represents a
slight increase in paratransit ridership from year 2000,
partially due to the practice of zero trip denials, which
was implemented in 2001. Like DART’s experience,
national paratransit ridership is also on the rise. With
continuing increases in life expectancy, it is highly
likely that DART’s paratransit demands will continue
to increase. DART paratransit service generally costs
several times more per passenger trip than fixed
route transit. Thus, controlling operating costs is a
paramount concern.
To maintain a high level of customer service and
improve overall operating and administrative
efficiency, DART implemented several changes over
the last several years. These changes include
Technology/communications improvements, such
as implementation of Trapeze automated routing
and scheduling software and an Interactive Voice
Response (IVR) system
New vehicle technology systems (Automated
Vehicle Locator and Vehicle Business System that
include Global Positioning Satellite and wireless
communication)
Operational changes such as reduction of the
window for reservations
New paratransit eligibility determination processes
Enforced suspension for paratransit no shows and
cancellations.
6.5.2 Efforts to Manage Costs and DemandIn the long-term, DART’s paratransit operating
expenses will continue to be controlled through
enhanced internal and external coordination, as
well as operations, technology, and administrative
initiatives. However, it is anticipated that future
paratransit costs will increase due to higher demand
and higher costs for labor, fuel, contracts, and related
expenses. Key efforts in the future will be to continue
integration of paratransit into the overall DART system,
focusing on programs that enhance accessibility
and allow some customers to switch to more cost-
effective, fixed route service.
Fixed Route Access and Innovative ServicesAll of DART’s fixed route transit vehicles are currently
accessible to customers with disabilities. Low
floor buses and low floor rail vehicles will improve
accessibility. In addition, bus stop and pedestrian
access improvements can enhance access to fixed
Chapter 6: Recommendations and Strategies
PARATRANSIT1. Meet ADA requirements
Budget for Zero Trip Denial
Consistent and more thorough evaluation of ADA Eligibility
2. Implement Cost-Effective Measures
Reevaluate, strengthen, and enforce No Show and Cancellation policies
Reassess fare policy for ADA eligible passengers
New and different payment method for new contract
3. Improve Operations Efficiencies
Conduct periodic peer review assessments of the paratransit market
Develop strategic goals for improving productivity
4. Create a More User-Friendly System
Identify appropriate goals, objectives, and measures to improve travel training program
Develop performance measures to evaluate customer service and satisfaction
5. Improve Access to Fixed-Route Services
Work with Service Planning towards the integration of paratransit and fixed route services
Continue to improve access to fixed-route facilities
Encourage and promote use of innovative transit services
STRATEGIES FOR SUCCESS
T R A N S I TS Y S T E MP L A N
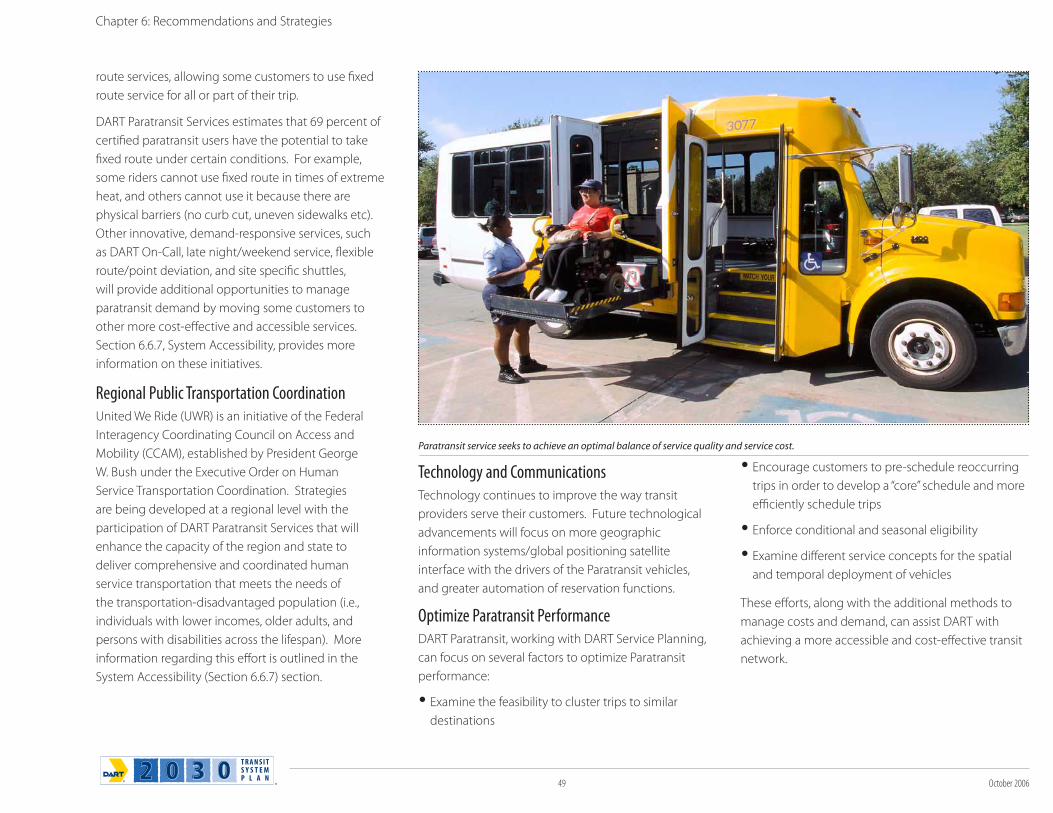
49 October 2006
Chapter 6: Recommendations and Strategies
route services, allowing some customers to use fixed
route service for all or part of their trip.
DART Paratransit Services estimates that 69 percent of
certified paratransit users have the potential to take
fixed route under certain conditions. For example,
some riders cannot use fixed route in times of extreme
heat, and others cannot use it because there are
physical barriers (no curb cut, uneven sidewalks etc).
Other innovative, demand-responsive services, such
as DART On-Call, late night/weekend service, flexible
route/point deviation, and site specific shuttles,
will provide additional opportunities to manage
paratransit demand by moving some customers to
other more cost-effective and accessible services.
Section 6.6.7, System Accessibility, provides more
information on these initiatives.
Regional Public Transportation CoordinationUnited We Ride (UWR) is an initiative of the Federal
Interagency Coordinating Council on Access and
Mobility (CCAM), established by President George
W. Bush under the Executive Order on Human
Service Transportation Coordination. Strategies
are being developed at a regional level with the
participation of DART Paratransit Services that will
enhance the capacity of the region and state to
deliver comprehensive and coordinated human
service transportation that meets the needs of
the transportation-disadvantaged population (i.e.,
individuals with lower incomes, older adults, and
persons with disabilities across the lifespan). More
information regarding this effort is outlined in the
System Accessibility (Section 6.6.7) section.
Technology and CommunicationsTechnology continues to improve the way transit
providers serve their customers. Future technological
advancements will focus on more geographic
information systems/global positioning satellite
interface with the drivers of the Paratransit vehicles,
and greater automation of reservation functions.
Optimize Paratransit PerformanceDART Paratransit, working with DART Service Planning,
can focus on several factors to optimize Paratransit
performance:
Examine the feasibility to cluster trips to similar
destinations
Encourage customers to pre-schedule reoccurring
trips in order to develop a “core” schedule and more
efficiently schedule trips
Enforce conditional and seasonal eligibility
Examine different service concepts for the spatial
and temporal deployment of vehicles
These efforts, along with the additional methods to
manage costs and demand, can assist DART with
achieving a more accessible and cost-effective transit
network.
Paratransit service seeks to achieve an optimal balance of service quality and service cost.
October 2006 50
6.6 Systemwide MobilitySupporting the core services of DART and enhancing
DART’s ability to meet its mission are a series of
Systemwide Mobility strategies. These strategies
support all of DART’s services and range from key
initiatives such as Intelligent Transportation System
(ITS) improvements, transit priority projects under
the Transportation System Management (TSM)
program, to programs related to Safety and Security
and enhanced system accessibility. They also include
strategies for passenger facilities, programs to manage
travel demand, and initiatives to integrate bicycle
and pedestrians into the system through facility
and access enhancements. All of these supporting
elements work toward improving the efficiency of and
access to the DART system.
6.6.1 Intelligent Transportation SystemsIntelligent Transportation Systems (ITS) are
performance-enhancing technologies used
nationwide in surface transportation, including
transit operations. The appeal of ITS technologies
to transit agencies such as DART lies in the ability
of the technologies to help improve operations,
enabling customers to be served more effectively and
efficiently. In past years, DART has experimented with,
and sometimes deployed, ITS technologies. DART has
also developed an ITS Strategic Plan within the last
several years.
ITS are common sets of applied technologies being
deployed nationwide in surface transportation.
The National ITS Program (conducted by the U.S.
Department of Transportation) acknowledges that
the nation’s roadway and public transit infrastructure
cannot continue expanding indefinitely. Rather, the
emphasis in the 21st century must be on ensuring
that the infrastructure performs consistently at peak
efficiency. ITS technologies can promote this efficient
performance.
2030 VisionBroadly, DART’s vision for 2030 is to use ITS to improve
customer experience, increase operator and system
effectiveness and efficiency, and to provide other
tangible and intangible benefits to the region’s
broader stakeholder community. A summary of the
vision for these key stakeholder groups is provided
below:
Customers will have access to real-time information
available from a wide range of dissemination
technologies and can feel safe, secure, and at
ease on the system through universal “smart” fare
cards, next-stop annunciators, and surveillance,
monitoring, and alarm systems. These systems are
designed and implemented to be fully accessible.
DART operators will have broad situational
awareness of the current status of the system to
detect and respond to incidents, as well as track,
locate, and monitor the condition of HOV lanes
and bus, light rail, TRE, and paratransit vehicles.
Operators will also be able to closely coordinate
with other modal agencies to share, exchange, and
manage relevant data and information.
Other Stakeholders, including employers, taxpayers,
and other agencies, will benefit from enhanced
mobility of the transportation network, solidifying
the Dallas-Fort Worth region as a good place to
work and live.
Chapter 6: Recommendations and Strategies
INTELLIGENT TRANSPORTATION SYSTEMS (ITS)1. Provide seamless “connections” both internally and to
the region
Continue to play a key role in regional ITS planning and deployment
Improve coordination and information sharing among other modal agencies
Increase the support of regional stakeholders
2. Enhance the customer experience both pre-trip and
enroute
Provide customers with a range of traveler information through use of items such as personal communication devices, kiosks, dynamic message systems, public address systems, and next stop annunciators
3. Improve vehicle capabilities
Use vehicle information to enhance planning and scheduling activities as well as customer safety and security
Pursue smart-card based technology for fare collection and vehicle log-in
Monitor and evaluate technology advancements
4. Improve the situational awareness of operators
Enhance DART’s ability to detect and respond to incidents and manage system capacity and demand
5. Explore funding opportunities for ITS applications and
deployment
Use ITS National Architecture and approved standards where applicable to comply with Federal, State and regional requirements for funding
STRATEGIES FOR SUCCESS
T R A N S I TS Y S T E MP L A N
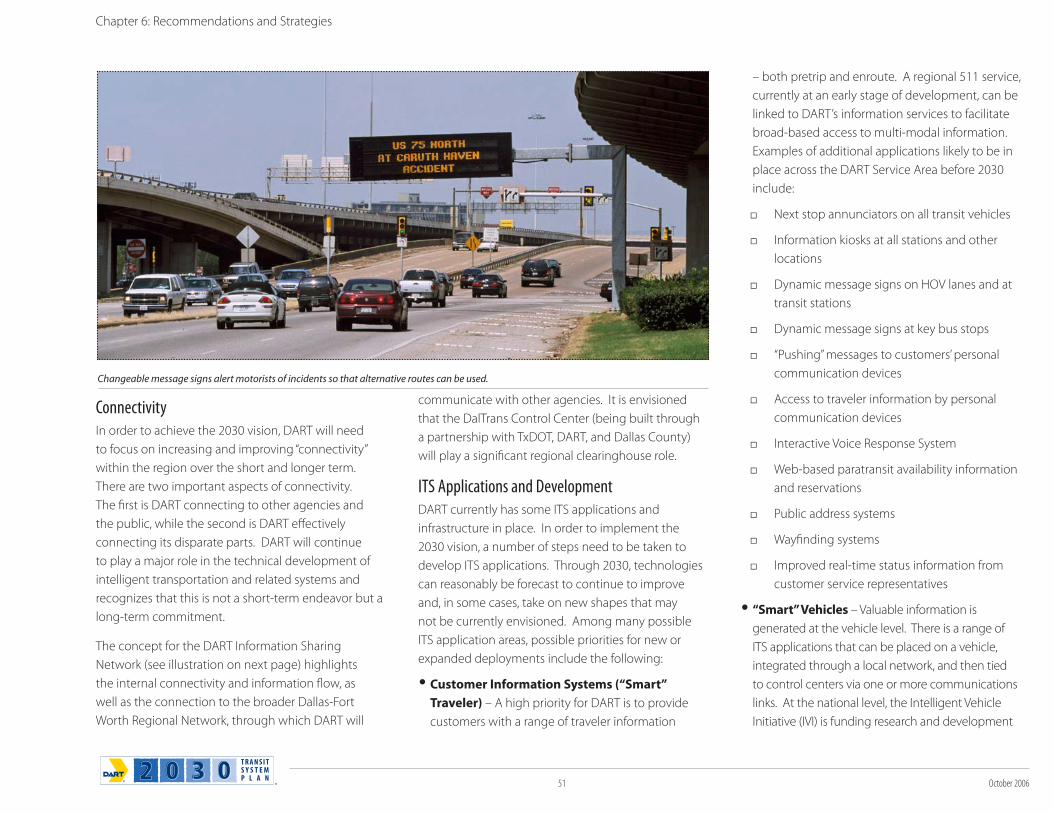
51 October 2006
Chapter 6: Recommendations and Strategies
ConnectivityIn order to achieve the 2030 vision, DART will need
to focus on increasing and improving “connectivity”
within the region over the short and longer term.
There are two important aspects of connectivity.
The first is DART connecting to other agencies and
the public, while the second is DART effectively
connecting its disparate parts. DART will continue
to play a major role in the technical development of
intelligent transportation and related systems and
recognizes that this is not a short-term endeavor but a
long-term commitment.
The concept for the DART Information Sharing
Network (see illustration on next page) highlights
the internal connectivity and information flow, as
well as the connection to the broader Dallas-Fort
Worth Regional Network, through which DART will
communicate with other agencies. It is envisioned
that the DalTrans Control Center (being built through
a partnership with TxDOT, DART, and Dallas County)
will play a significant regional clearinghouse role.
ITS Applications and DevelopmentDART currently has some ITS applications and
infrastructure in place. In order to implement the
2030 vision, a number of steps need to be taken to
develop ITS applications. Through 2030, technologies
can reasonably be forecast to continue to improve
and, in some cases, take on new shapes that may
not be currently envisioned. Among many possible
ITS application areas, possible priorities for new or
expanded deployments include the following:
Customer Information Systems (“Smart”
Traveler) – A high priority for DART is to provide
customers with a range of traveler information
– both pretrip and enroute. A regional 511 service,
currently at an early stage of development, can be
linked to DART’s information services to facilitate
broad-based access to multi-modal information.
Examples of additional applications likely to be in
place across the DART Service Area before 2030
include:
Next stop annunciators on all transit vehicles
Information kiosks at all stations and other
locations
Dynamic message signs on HOV lanes and at
transit stations
Dynamic message signs at key bus stops
“Pushing” messages to customers’ personal
communication devices
Access to traveler information by personal
communication devices
Interactive Voice Response System
Web-based paratransit availability information
and reservations
Public address systems
Wayfinding systems
Improved real-time status information from
customer service representatives
“Smart” Vehicles – Valuable information is
generated at the vehicle level. There is a range of
ITS applications that can be placed on a vehicle,
integrated through a local network, and then tied
to control centers via one or more communications
links. At the national level, the Intelligent Vehicle
Initiative (IVI) is funding research and development
Changeable message signs alert motorists of incidents so that alternative routes can be used.
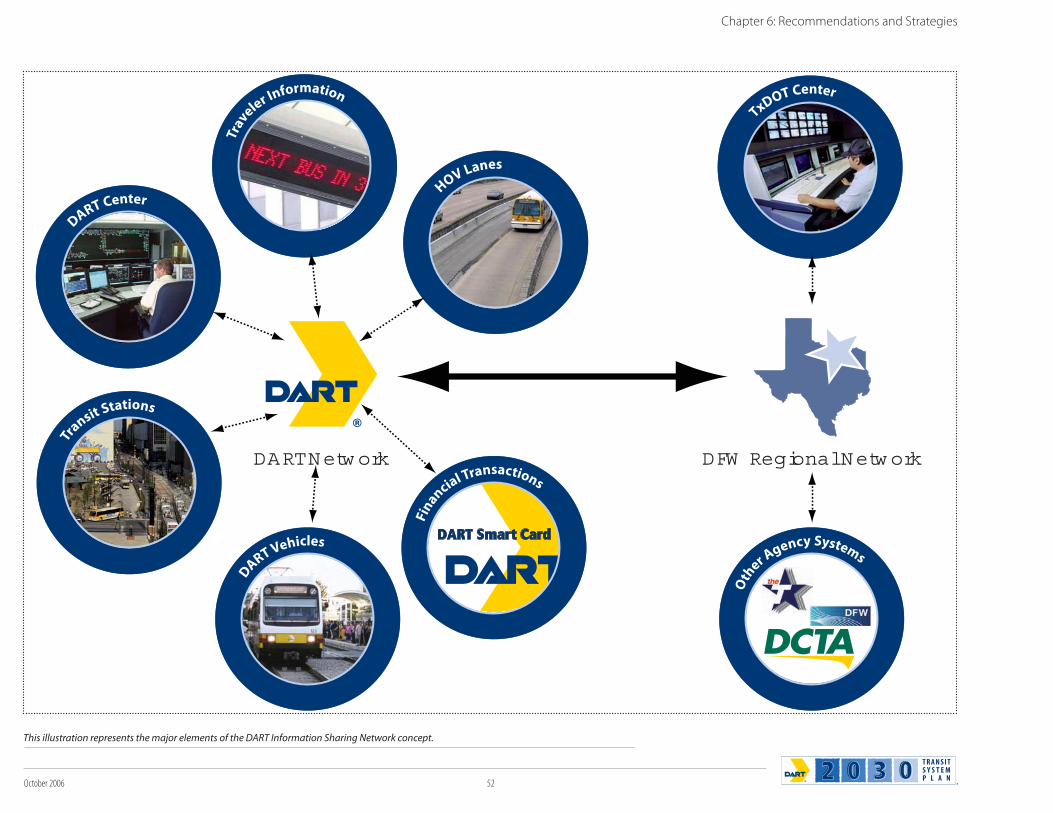
October 2006 52
This illustration represents the major elements of the DART Information Sharing Network concept.
Trav
eler Information
Tr
ansit Stations
DART Vehicles
Fin
ancial Transactions
DART Smart Card
DART Center
TxDOT Center
Oth
er Agency Systems
HOV Lanes
DART Netw ork DFW Regional Netw ork
Chapter 6: Recommendations and Strategies
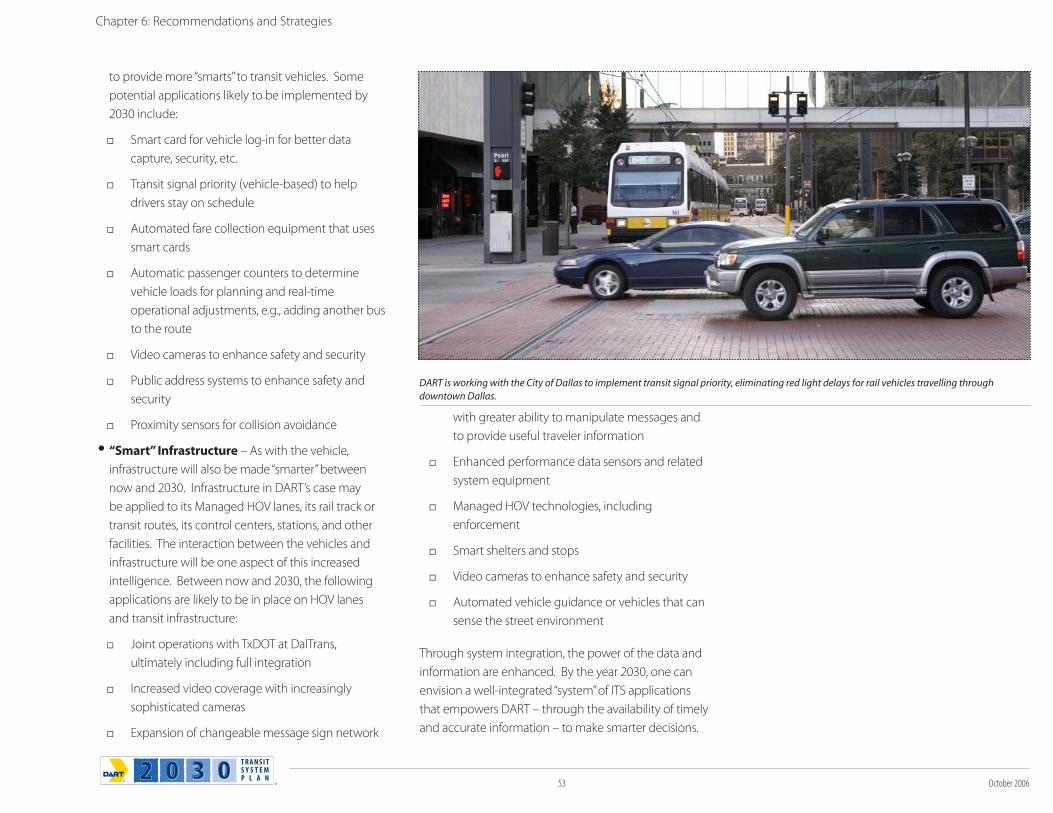
53 October 2006
to provide more “smarts” to transit vehicles. Some
potential applications likely to be implemented by
2030 include:
Smart card for vehicle log-in for better data
capture, security, etc.
Transit signal priority (vehicle-based) to help
drivers stay on schedule
Automated fare collection equipment that uses
smart cards
Automatic passenger counters to determine
vehicle loads for planning and real-time
operational adjustments, e.g., adding another bus
to the route
Video cameras to enhance safety and security
Public address systems to enhance safety and
security
Proximity sensors for collision avoidance
“Smart” Infrastructure – As with the vehicle,
infrastructure will also be made “smarter” between
now and 2030. Infrastructure in DART’s case may
be applied to its Managed HOV lanes, its rail track or
transit routes, its control centers, stations, and other
facilities. The interaction between the vehicles and
infrastructure will be one aspect of this increased
intelligence. Between now and 2030, the following
applications are likely to be in place on HOV lanes
and transit infrastructure:
Joint operations with TxDOT at DalTrans,
ultimately including full integration
Increased video coverage with increasingly
sophisticated cameras
Expansion of changeable message sign network
with greater ability to manipulate messages and
to provide useful traveler information
Enhanced performance data sensors and related
system equipment
Managed HOV technologies, including
enforcement
Smart shelters and stops
Video cameras to enhance safety and security
Automated vehicle guidance or vehicles that can
sense the street environment
Through system integration, the power of the data and
information are enhanced. By the year 2030, one can
envision a well-integrated “system” of ITS applications
that empowers DART – through the availability of timely
and accurate information – to make smarter decisions.
Chapter 6: Recommendations and Strategies
DART is working with the City of Dallas to implement transit signal priority, eliminating red light delays for rail vehicles travelling through
downtown Dallas.
October 2006 54
6.6.2 Transportation System ManagementDART has a Transportation System Management
(TSM) program that is primarily designed to cover
small scale capital improvements on arterial streets in
an effort to maintain and enhance the infrastructure
which DART uses for its services. These improvements
help to maintain transit travel times and on-time
performance for DART transit services in light of
growing congestion. The TSM program also includes
transit priority improvements focused on improving
transit travel times and transit reliability to make transit
more competitive with automobile travel. While
maintaining the transportation system is important,
the TSM program should place renewed focus on
incorporating transit priority treatments for existing
and future transit street corridors, both bus and rail.
Transportation System Management (TSM) Programs
The DART TSM program historically has been focused
on small-scale improvements related to street repair
and maintenance and signal improvements. The
major elements of the DART TSM program include:
Street Improvements
Signal Improvements
Transit Priority Improvements
Transit Operations/Safety Improvements
In the past, much of the funding for this program
came from the Local Assistance Program (LAP)
from which funding was directed to projects that
supported transit and/or initiation of new transit
services in DART member cities. With the LAP
program being phased out, funding for TSM projects
is included in the budget as appropriate, subject to
annual budget considerations and Board approval.
Regional, state, and federal funding often supplement
many of the TSM programs.
Street ImprovementsStreet improvements generally fall into two categories.
First, improvements to upgrade principal streets that
are used by DART services and second, improvements
developed in response to damage caused by DART
buses. The latter falls under the DART Street Repair
Program, which was established through DART Policy
(Resolution 940335). Maintaining streets used by
DART buses has many benefits, including reduced
wear and tear on buses and autos, a smoother ride for
the customer, and better schedule adherence, while
also maintaining good relations with DART member
cities and the public. Given these benefits and in
accordance with DART Policy, DART will continue to
fund such street improvement programs. Selection of
projects in the future should give priority to corridors
identified for enhanced and rapid bus services.
Signal ImprovementsThe TSM program also includes signal improvements.
Delay at traffic signals can cause nearly 50 percent
of the delay experienced by transit vehicles. Thus,
focused signal improvements can provide benefits
for DART services, whether bus or rail. Traffic signal
preemption interrupts the normal traffic signal
cycle to provide a green light. Traffic signal priority
modifies the normal signal operation cycle to better
accommodate transit vehicles. Most DART signal
improvement projects are done in cooperation with
local member cities and are often completed in
conjunction with a roadway, intersection, or signal
coordination/timing project. In the future, DART
TRANSPORTATION SYSTEM MANAGEMENT (TSM)1. Strengthen the DART TSM Program, focusing on
transit priority projects to enhance transit ridership,
operations, safety and security.
2. Work with member cities and other agencies to identify,
plan, and implement operational and physical transit
priority treatments for identified rapid and enhanced
bus service corridors.
3. Encourage member cities and other agencies to
establish transit priority policies and regulations.
4. Continue to pursue additional funding sources through
local, regional, state, and federal agencies for all TSM
programs, providing local match as appropriate.
STRATEGIES FOR SUCCESS
T R A N S I TS Y S T E MP L A N
Chapter 6: Recommendations and Strategies
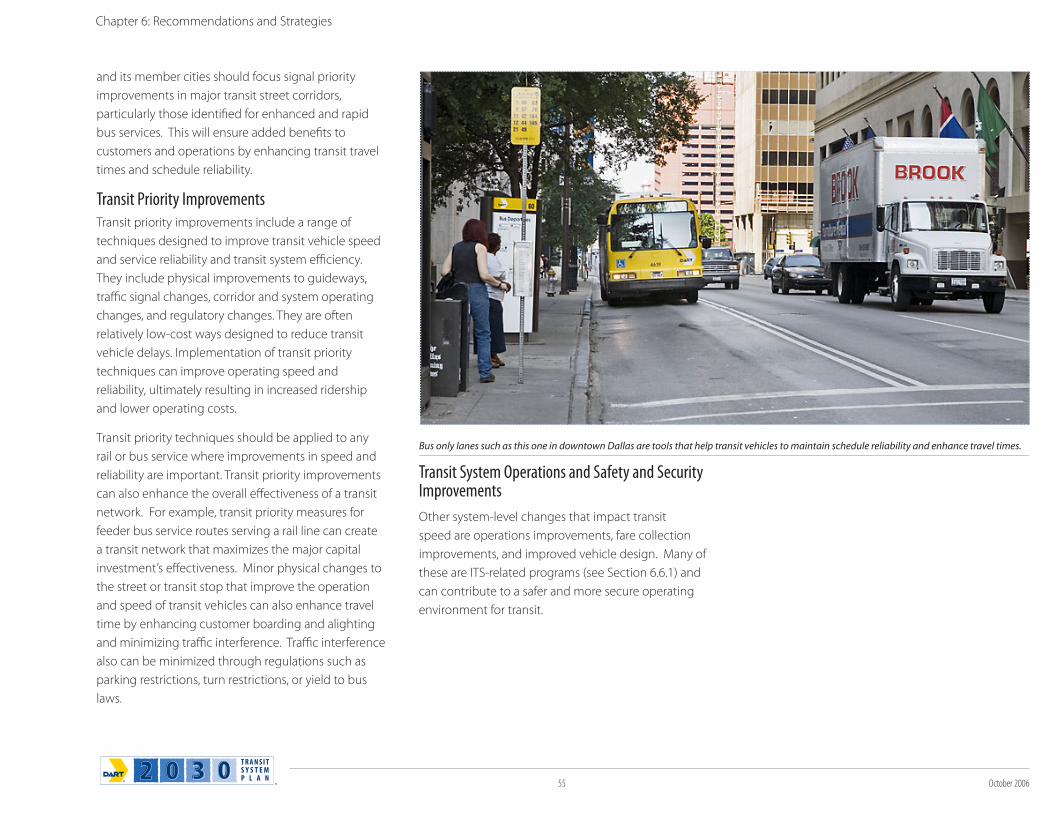
55 October 2006
and its member cities should focus signal priority
improvements in major transit street corridors,
particularly those identified for enhanced and rapid
bus services. This will ensure added benefits to
customers and operations by enhancing transit travel
times and schedule reliability.
Transit Priority ImprovementsTransit priority improvements include a range of
techniques designed to improve transit vehicle speed
and service reliability and transit system efficiency.
They include physical improvements to guideways,
traffic signal changes, corridor and system operating
changes, and regulatory changes. They are often
relatively low-cost ways designed to reduce transit
vehicle delays. Implementation of transit priority
techniques can improve operating speed and
reliability, ultimately resulting in increased ridership
and lower operating costs.
Transit priority techniques should be applied to any
rail or bus service where improvements in speed and
reliability are important. Transit priority improvements
can also enhance the overall effectiveness of a transit
network. For example, transit priority measures for
feeder bus service routes serving a rail line can create
a transit network that maximizes the major capital
investment’s effectiveness. Minor physical changes to
the street or transit stop that improve the operation
and speed of transit vehicles can also enhance travel
time by enhancing customer boarding and alighting
and minimizing traffic interference. Traffic interference
also can be minimized through regulations such as
parking restrictions, turn restrictions, or yield to bus
laws.
Transit System Operations and Safety and Security Improvements
Other system-level changes that impact transit
speed are operations improvements, fare collection
improvements, and improved vehicle design. Many of
these are ITS-related programs (see Section 6.6.1) and
can contribute to a safer and more secure operating
environment for transit.
Bus only lanes such as this one in downtown Dallas are tools that help transit vehicles to maintain schedule reliability and enhance travel times.
Chapter 6: Recommendations and Strategies
October 2006 56
6.6.3 Passenger FacilitiesPassenger facilities are very important to the customer
and can influence retention of existing riders and
attraction of new ones. As such, it is important
that DART continues to improve and build upon its
current inventory of facilities to meet the demands
of the current system, as well as to respond to future
2030 Transit System Plan recommendations. DART
passenger facilities fall into two general categories:
on-street and off-street. Both play an important role
in supporting the overall transit system.
Off-Street Passenger FacilitiesOff-street passenger facilities include transit centers,
transfer facilities, and park-and-ride facilities. These
larger facilities typically serve locations where several
routes converge and transfer activity occurs between
two or more travel modes, such as rail, bus, vanpool,
carpool, pedestrian, bicycle, paratransit, and single
occupant vehicle. Amenities at these facilities may
include garage or ground level parking, lighting,
security surveillance, kiss-and-ride lanes, bicycle
parking racks and lockers, bathrooms, water fountains,
vending machines, soft and hard landscape, and
shelter. Amenities not only increase the facility’s
effectiveness but also promote transit use and patron
comfort.
The size and elements of off-street facilities, including
the amount of land required, is based on short-term
and long-term forecasts of trip activity by mode.
During the project development process for HOV,
bus, and rail corridors, DART develops such forecasts
and examines the need for off-street facilities, making
recommendations as appropriate. Since parking
is a key element of many off-street facilities, DART
monitors these facilities and develops strategies to
address identified issues or concerns on a regular
basis. Parking issues, especially where demand
exceeds capacity, are addressed on a case-by-case
basis to determine expansion needs or identify
parking management strategies.
On-Street Passenger FacilitiesThe DART On-Street Bus Facilities Program provides
bus benches, shelters, and various improvements in
the public right-of-way. On-street facilities increase
the safety, efficiency, and effectiveness of the transit
system, while enhancing the customer experience by
providing information, seating, and shelter. The major
elements of the DART On-Street Bus Facilities Program
include benches, standard shelters, double /modular
shelters, and enhanced shelters. Along with other
capital and ITS elements, on-street passenger facilities
will play a key role in serving customer needs in
identified enhanced and rapid bus corridors. Potential
streetcar corridors can also benefit from this program.
At the end of 2005, the DART On-Street Bus Facilities
Program accounted for 1,757 of the total nearly 12,000
bus stop locations throughout the DART Service Area.
The facility breakdown is as follows:
Benches – 1,149
Standard Shelters – 572
Double /Modular Shelters –14
Enhanced Shelters – 19
Special Design Shelters – 3
It is assumed that the current number of bus stops
will not decrease by the year 2030. The number of
bus stops may increase as new developments occur,
PASSENGER FACILITIES1. Ensure the appropriate level of on-street amenities for
transit customers based on activity levels and service
standards.
Periodically reevaluate on-street facility standards in an effort to improve ridership and the customer waiting experience.
Coordinate on-street amenities with adjacent property owners and member cities to maximize access, safety, and security.
2. Provide the appropriate level of information at each
facility
3. Focus on-street facilities and amenities in identified
enhanced and rapid bus corridors
4. Evaluate the need for off-street passenger facilities
along identified transit and HOV corridors
Promote shared parking where feasible
5. Pursue energy-efficient, low-maintenance, and cost-
effective amenities.
6. Continue to pursue other funding sources to leverage
DART funds.
STRATEGIES FOR SUCCESS
T R A N S I TS Y S T E MP L A N
Chapter 6: Recommendations and Strategies
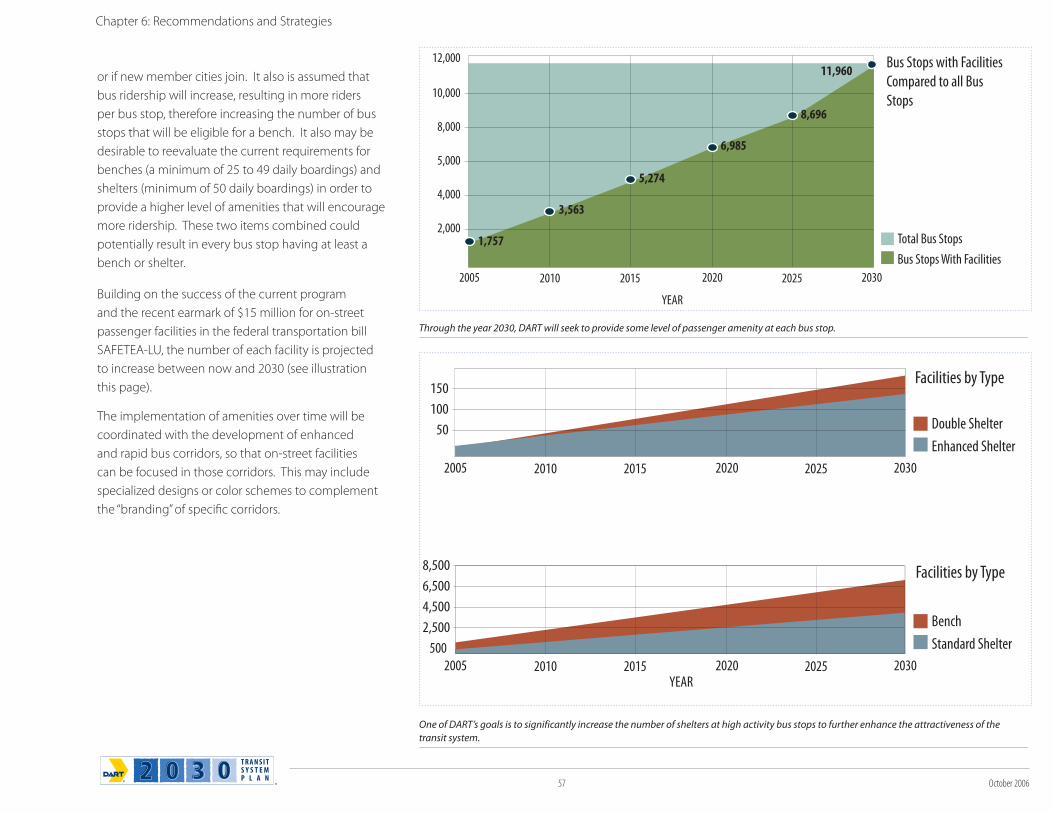
57 October 2006
or if new member cities join. It also is assumed that
bus ridership will increase, resulting in more riders
per bus stop, therefore increasing the number of bus
stops that will be eligible for a bench. It also may be
desirable to reevaluate the current requirements for
benches (a minimum of 25 to 49 daily boardings) and
shelters (minimum of 50 daily boardings) in order to
provide a higher level of amenities that will encourage
more ridership. These two items combined could
potentially result in every bus stop having at least a
bench or shelter.
Building on the success of the current program
and the recent earmark of $15 million for on-street
passenger facilities in the federal transportation bill
SAFETEA-LU, the number of each facility is projected
to increase between now and 2030 (see illustration
this page).
The implementation of amenities over time will be
coordinated with the development of enhanced
and rapid bus corridors, so that on-street facilities
can be focused in those corridors. This may include
specialized designs or color schemes to complement
the “branding” of specific corridors.
Standard Shelter
Bench
Enhanced Shelter
Double Shelter
Facilities by Type
Facilities by Type
150
100
50
2005 2010 2015 2020 2025 2030
500
6,500
8,500
4,500
2,500
2005 2010 2015YEAR
2020 2025 2030
YEAR
12,000
10,000
8,000
5,000
4,000
2,000
2005 2010 2015 2020 2025 2030
1,757
3,563
5,274
8,696
6,985
11,960
Bus Stops With Facilities
Total Bus Stops
Bus Stops with Facilities
Compared to all Bus
Stops
Through the year 2030, DART will seek to provide some level of passenger amenity at each bus stop.
Chapter 6: Recommendations and Strategies
One of DART’s goals is to significantly increase the number of shelters at high activity bus stops to further enhance the attractiveness of the
transit system.
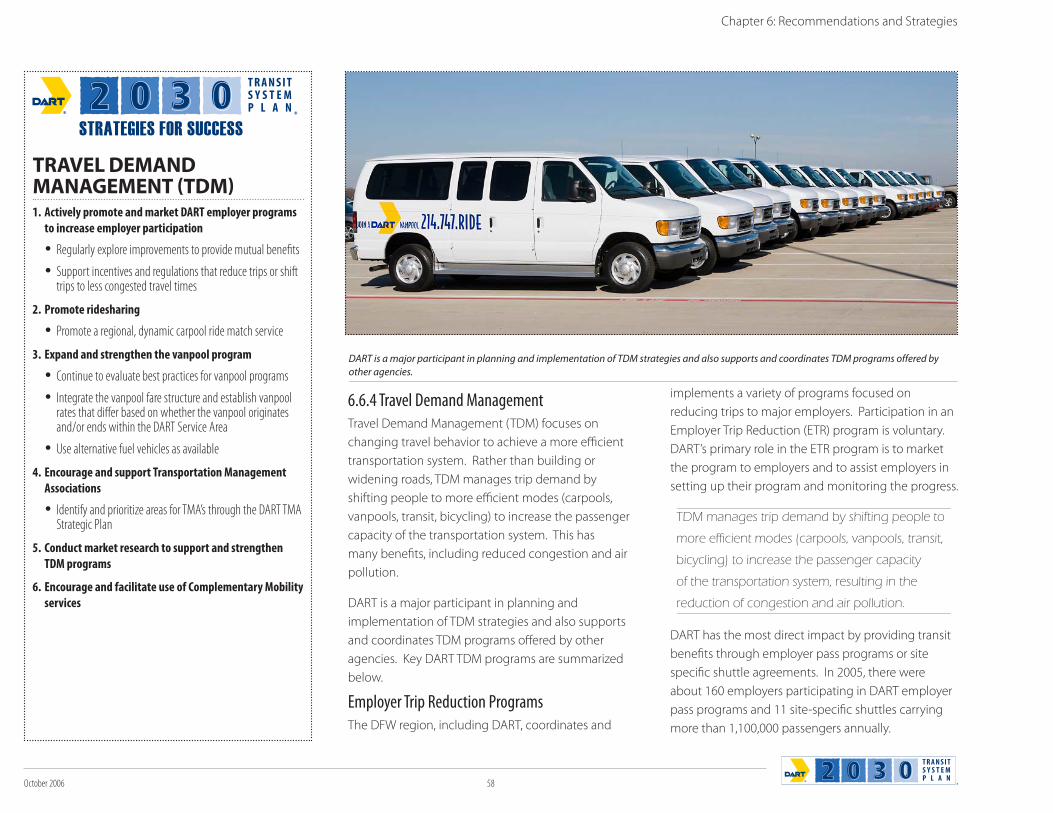
October 2006 58
6.6.4 Travel Demand ManagementTravel Demand Management (TDM) focuses on
changing travel behavior to achieve a more efficient
transportation system. Rather than building or
widening roads, TDM manages trip demand by
shifting people to more efficient modes (carpools,
vanpools, transit, bicycling) to increase the passenger
capacity of the transportation system. This has
many benefits, including reduced congestion and air
pollution.
DART is a major participant in planning and
implementation of TDM strategies and also supports
and coordinates TDM programs offered by other
agencies. Key DART TDM programs are summarized
below.
Employer Trip Reduction ProgramsThe DFW region, including DART, coordinates and
implements a variety of programs focused on
reducing trips to major employers. Participation in an
Employer Trip Reduction (ETR) program is voluntary.
DART’s primary role in the ETR program is to market
the program to employers and to assist employers in
setting up their program and monitoring the progress.
DART has the most direct impact by providing transit
benefits through employer pass programs or site
specific shuttle agreements. In 2005, there were
about 160 employers participating in DART employer
pass programs and 11 site-specific shuttles carrying
more than 1,100,000 passengers annually.
TRAVEL DEMAND MANAGEMENT (TDM)1. Actively promote and market DART employer programs
to increase employer participation
Regularly explore improvements to provide mutual benefits
Support incentives and regulations that reduce trips or shift trips to less congested travel times
2. Promote ridesharing
Promote a regional, dynamic carpool ride match service
3. Expand and strengthen the vanpool program
Continue to evaluate best practices for vanpool programs
Integrate the vanpool fare structure and establish vanpool rates that differ based on whether the vanpool originates and/or ends within the DART Service Area
Use alternative fuel vehicles as available
4. Encourage and support Transportation Management
Associations
Identify and prioritize areas for TMA’s through the DART TMA Strategic Plan
5. Conduct market research to support and strengthen
TDM programs
6. Encourage and facilitate use of Complementary Mobility
services
STRATEGIES FOR SUCCESS
T R A N S I TS Y S T E MP L A N
TDM manages trip demand by shifting people to
more efficient modes (carpools, vanpools, transit,
bicycling) to increase the passenger capacity
of the transportation system, resulting in the
reduction of congestion and air pollution.
Chapter 6: Recommendations and Strategies
DART is a major participant in planning and implementation of TDM strategies and also supports and coordinates TDM programs offered by
other agencies.
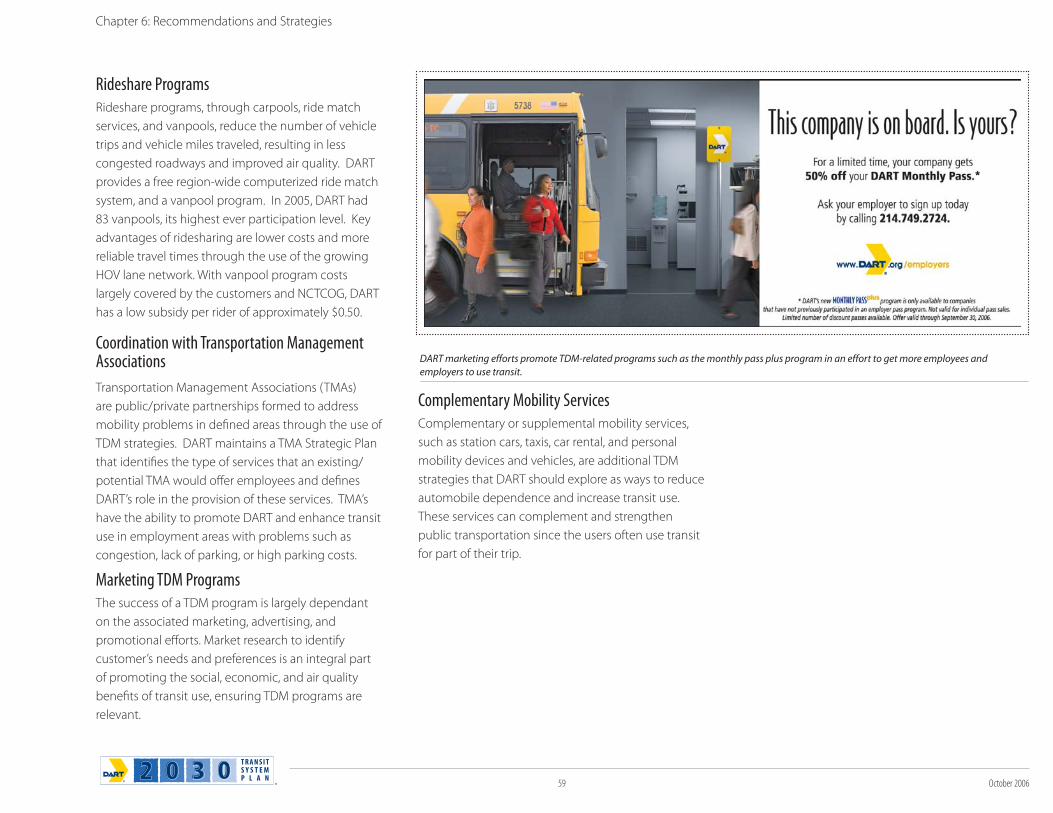
59 October 2006
Chapter 6: Recommendations and Strategies
Rideshare ProgramsRideshare programs, through carpools, ride match
services, and vanpools, reduce the number of vehicle
trips and vehicle miles traveled, resulting in less
congested roadways and improved air quality. DART
provides a free region-wide computerized ride match
system, and a vanpool program. In 2005, DART had
83 vanpools, its highest ever participation level. Key
advantages of ridesharing are lower costs and more
reliable travel times through the use of the growing
HOV lane network. With vanpool program costs
largely covered by the customers and NCTCOG, DART
has a low subsidy per rider of approximately $0.50.
Coordination with Transportation Management Associations
Transportation Management Associations (TMAs)
are public/private partnerships formed to address
mobility problems in defined areas through the use of
TDM strategies. DART maintains a TMA Strategic Plan
that identifies the type of services that an existing/
potential TMA would offer employees and defines
DART’s role in the provision of these services. TMA’s
have the ability to promote DART and enhance transit
use in employment areas with problems such as
congestion, lack of parking, or high parking costs.
Marketing TDM ProgramsThe success of a TDM program is largely dependant
on the associated marketing, advertising, and
promotional efforts. Market research to identify
customer’s needs and preferences is an integral part
of promoting the social, economic, and air quality
benefits of transit use, ensuring TDM programs are
relevant.
Complementary Mobility ServicesComplementary or supplemental mobility services,
such as station cars, taxis, car rental, and personal
mobility devices and vehicles, are additional TDM
strategies that DART should explore as ways to reduce
automobile dependence and increase transit use.
These services can complement and strengthen
public transportation since the users often use transit
for part of their trip.
DART marketing efforts promote TDM-related programs such as the monthly pass plus program in an effort to get more employees and
employers to use transit.
October 2006 60
Chapter 6: Recommendations and Strategies
6.6.5 Bicycle/Pedestrian IntegrationIntegrating bicycles and pedestrians within the transit
system results in a more accessible and user-friendly
system. More importantly, such efforts can benefit
DART and the region in terms of higher ridership,
reduced parking demand, and reduced congestion
that can contribute to improved air quality by shifting
trips from automobiles to walking or bicycle.
Bicycle IntegrationDART promotes the use of bicycles as part of the Bike-
and-Ride Policy and provides storage spaces at most
of its facilities (racks or lockers). The DART Bike-and-
Ride Policy was amended on April 11, 2006 to further
promote and encourage multi-modal commuting.
Bicycle AccessDART promotes Bike-and-Ride by designing easy and
safe bicycle access within transit centers and stations.
Bicycle access within transit facilities generally shares
pathways with pedestrians. During design of facilities
both pedestrian and bicycle access are considered
and incorporated as appropriate. Access from off-site
areas to the facility is the responsibility of member
cities and typically follows either street right-of-way or
bicycle paths/trails. DART recommends that member
cities place a priority on improving bicycle, as well as
pedestrian, access to all transit facilities, including bus
stops, as part of their ongoing comprehensive or area
planning efforts.
Bicycle paths can be provided on DART right-of-way.
The DART Hike-and-Bike Trail Use on DART Right-of-
Way policy states the DART-owned rights-of-way may
be made available to other governmental entities for
utilization as hike, bike transportation, or recreation
use under certain conditions related to DART’s current
or future transit use of the right-of-way.
Bicycle Parking and AmenitiesDART provides bicycle parking at most transit centers
and rail stations. Bicycle racks are typically placed near
the station platform close to activity. Bicycle lockers
are also provided at some stations and can be rented
for a nominal fee for a three-, six- or 12-month period.
The recently amended Bike-and-Ride Policy gives
priority and a reduced rental rate to DART transit pass
holders.
The availability of bicycle parking facilities is publicized
on the DART website to encourage multimodal
commuting. In the long-term, bicycle amenities
should be examined and modified as necessary to
match demand and to ensure at least one rack at
every major transit facility. There should also be a
consistent approach for placement of amenities
to keep racks out of the elements (such as under
canopies) or to utilize “signature canopies” at bicycle
parking locations to increase visibility, protection, and
recognition.
Bicycles on Transit VehiclesA key change to the amended Bike-and-Ride Policy is
the removal of time restrictions that previously limited
the ability of commuters or bicyclists to take bicycles
on buses or rail vehicles. This new policy is facilitated
by low-floor rail vehicle sections and the planned
addition of exterior bicycle racks to buses. As part of
the amended policy, DART will provide information
to the public to identify which routes or trips may not
readily accommodate bicycles.
BICYCLE/PEDESTRIANINTEGRATION1. Maximize bicycle and pedestrian connectivity to transit
facilities, including bus stops:
Encourage and assist member cities with the identification, prioritization, and planning of improvements
Coordinate and facilitate connections with adjacent developments
Pursue a variety of funding options
2. Provide bicycle amenities at transit facilities
commensurate with demand;
Periodically review the need for improvements
Ensure at least one bike rack at every major transit facility
3. Locate bicycle amenities to maximize visibility, safety,
and security
4. Maintain a clear and “customer-friendly” policy for
bicyclists
STRATEGIES FOR SUCCESS
T R A N S I TS Y S T E MP L A N
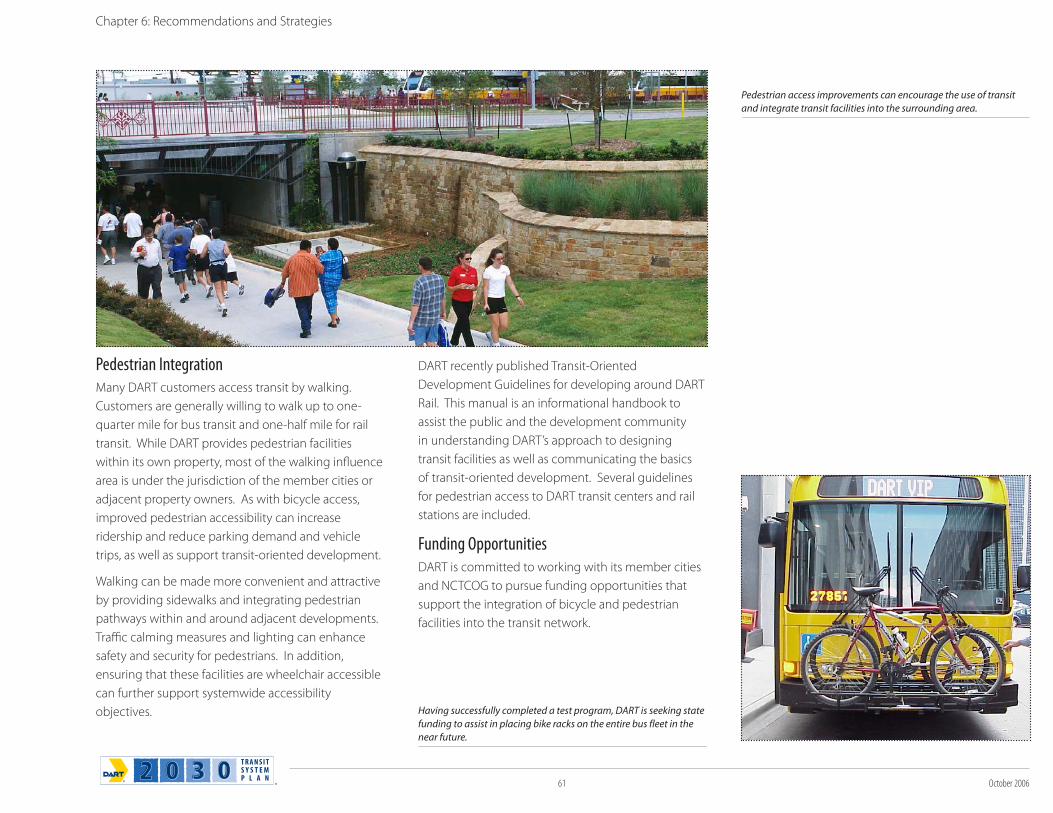
61 October 2006
Chapter 6: Recommendations and Strategies
Pedestrian IntegrationMany DART customers access transit by walking.
Customers are generally willing to walk up to one-
quarter mile for bus transit and one-half mile for rail
transit. While DART provides pedestrian facilities
within its own property, most of the walking influence
area is under the jurisdiction of the member cities or
adjacent property owners. As with bicycle access,
improved pedestrian accessibility can increase
ridership and reduce parking demand and vehicle
trips, as well as support transit-oriented development.
Walking can be made more convenient and attractive
by providing sidewalks and integrating pedestrian
pathways within and around adjacent developments.
Traffic calming measures and lighting can enhance
safety and security for pedestrians. In addition,
ensuring that these facilities are wheelchair accessible
can further support systemwide accessibility
objectives.
DART recently published Transit-Oriented
Development Guidelines for developing around DART
Rail. This manual is an informational handbook to
assist the public and the development community
in understanding DART’s approach to designing
transit facilities as well as communicating the basics
of transit-oriented development. Several guidelines
for pedestrian access to DART transit centers and rail
stations are included.
Funding OpportunitiesDART is committed to working with its member cities
and NCTCOG to pursue funding opportunities that
support the integration of bicycle and pedestrian
facilities into the transit network.
Having successfully completed a test program, DART is seeking state
funding to assist in placing bike racks on the entire bus fleet in the
near future.
Pedestrian access improvements can encourage the use of transit
and integrate transit facilities into the surrounding area.
October 2006 62
6.6.6 Safety and SecurityThe strategic direction for public safety and
infrastructure protection comes from the DART
Strategic Plan (provide safe/secure service) and the
DART Mission Statement (“to build, establish, and
operate a safe, efficient, and effective transportation
system”). DART has a comprehensive Safety and
Security Program to address these directives. While
security and safety have always been important
considerations in planning and design, they take on
increasing importance in the post-9/11 environment.
For this reason, the 2030 Transit System Plan highlights
important safety and security considerations in the
planning, design, and operation of the existing and
future transit system.
Transit safety and transit security are different in
that transit safety deals primarily with programs
and procedures to avoid unintentional harm during
normal operations, while transit security focuses
on avoiding and responding to intentional system
threats. The overall goal of transit safety and security
is to reduce risk whether intentional or unintentional,
and provide strategic emergency response in the
event of an unforeseen incident. As a provider of
mobility services, DART has a broader role in regional
emergency preparedness and response, including
mass evacuation.
Existing DART Programs and PlansThe Transportation Equity Act for the 21st Century
(TEA-21) required safety and security to be included
as a priority factor in transportation planning. DART
maintains several programs and practices related to
safety and security, including:
DART System Safety Program Plan – This plan
represents DART safety policy, defining safety goals
and objectives, tasks, responsibilities, schedule of
activities, and programs.
Incorporation of Safety and Security in Design
– All facilities and systems designs are reviewed for
safety and security exposures and formally certified
through the Safety and Security Certification Plan
(see below). DART Systems Safety Design Criteria
are part of the DART Design Criteria Manual.
DART Safety and Security Certification Plan
– Certification verifies satisfactory compliance
with safety and security requirements and seeks
to achieve a state of acceptable risk that parallels
the systems security goal of reducing threats and
vulnerabilities to the most practical levels through
the effective use of available resources.
Chapter 6: Recommendations and Strategies
SAFETY AND SECURITY1. Integrate safety and security elements into the
transit system to reduce risk and enhance emergency
preparedness:
Employ safety and security conscious planning in all planning studies
Apply safety-oriented design to eliminate or reduce safety hazards
Apply security-oriented design to protect major agency assets
2. Deter and detect criminal and terrorist activity
Incorporate physical design features such as access management and surveillance that discourage crime
Employ Crime and Prevention Through Environmental Design strategies
3. Design a resilient system to minimize the effect of crime
and facilitate rapid evacuation and easy repairs
4. Coordinate system and safety/security planning,
including technological, policing, and community
outreach strategies
STRATEGIES FOR SUCCESS
T R A N S I TS Y S T E MP L A N
DART participates in readiness drills to ensure agency preparedness
during emergencies and other safety or security-related incidents.
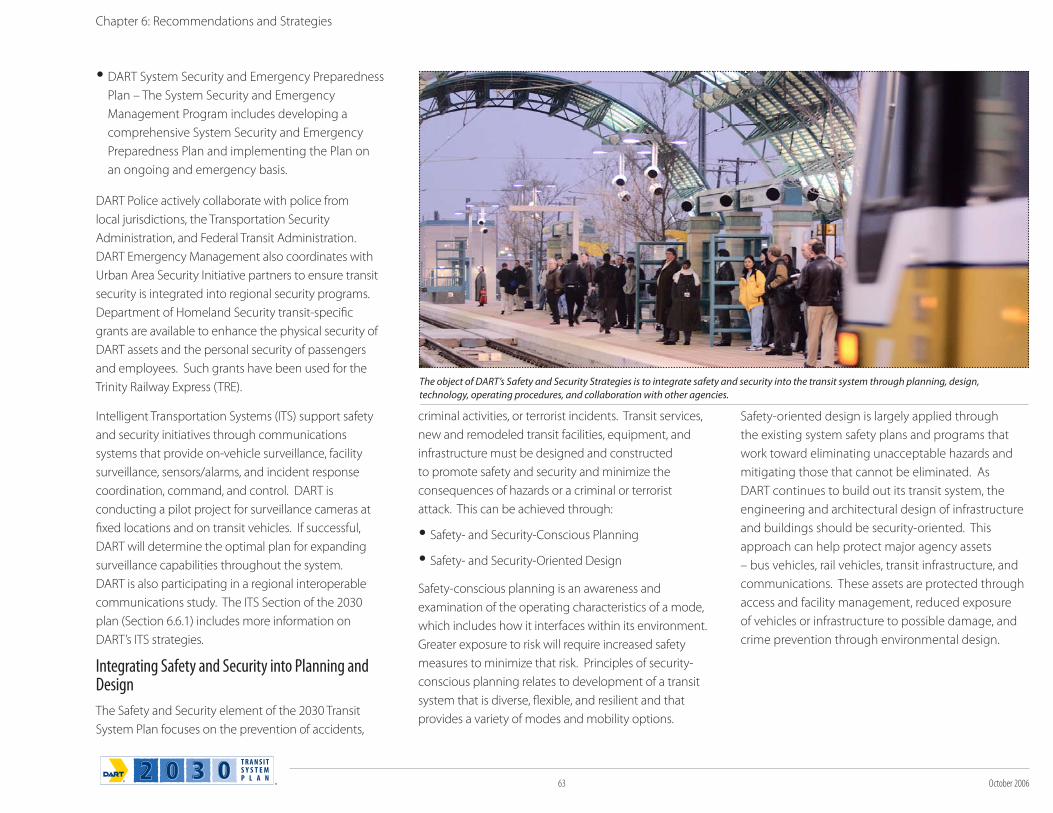
63 October 2006
Chapter 6: Recommendations and Strategies
DART System Security and Emergency Preparedness
Plan – The System Security and Emergency
Management Program includes developing a
comprehensive System Security and Emergency
Preparedness Plan and implementing the Plan on
an ongoing and emergency basis.
DART Police actively collaborate with police from
local jurisdictions, the Transportation Security
Administration, and Federal Transit Administration.
DART Emergency Management also coordinates with
Urban Area Security Initiative partners to ensure transit
security is integrated into regional security programs.
Department of Homeland Security transit-specific
grants are available to enhance the physical security of
DART assets and the personal security of passengers
and employees. Such grants have been used for the
Trinity Railway Express (TRE).
Intelligent Transportation Systems (ITS) support safety
and security initiatives through communications
systems that provide on-vehicle surveillance, facility
surveillance, sensors/alarms, and incident response
coordination, command, and control. DART is
conducting a pilot project for surveillance cameras at
fixed locations and on transit vehicles. If successful,
DART will determine the optimal plan for expanding
surveillance capabilities throughout the system.
DART is also participating in a regional interoperable
communications study. The ITS Section of the 2030
plan (Section 6.6.1) includes more information on
DART’s ITS strategies.
Integrating Safety and Security into Planning and Design
The Safety and Security element of the 2030 Transit
System Plan focuses on the prevention of accidents,
criminal activities, or terrorist incidents. Transit services,
new and remodeled transit facilities, equipment, and
infrastructure must be designed and constructed
to promote safety and security and minimize the
consequences of hazards or a criminal or terrorist
attack. This can be achieved through:
Safety- and Security-Conscious Planning
Safety- and Security-Oriented Design
Safety-conscious planning is an awareness and
examination of the operating characteristics of a mode,
which includes how it interfaces within its environment.
Greater exposure to risk will require increased safety
measures to minimize that risk. Principles of security-
conscious planning relates to development of a transit
system that is diverse, flexible, and resilient and that
provides a variety of modes and mobility options.
Safety-oriented design is largely applied through
the existing system safety plans and programs that
work toward eliminating unacceptable hazards and
mitigating those that cannot be eliminated. As
DART continues to build out its transit system, the
engineering and architectural design of infrastructure
and buildings should be security-oriented. This
approach can help protect major agency assets
– bus vehicles, rail vehicles, transit infrastructure, and
communications. These assets are protected through
access and facility management, reduced exposure
of vehicles or infrastructure to possible damage, and
crime prevention through environmental design.
The object of DART’s Safety and Security Strategies is to integrate safety and security into the transit system through planning, design,
technology, operating procedures, and collaboration with other agencies.
October 2006 64
6.6.7 System AccessibilityAccessible transit is provided to persons with
disabilities. It includes accessible fixed-route transit
services and associated transit facilities, flexible route
transit services, and Americans with Disabilities Act
(ADA) complementary paratransit services. DART
ADA paratransit service provides curb-to-curb
transportation to people with disabilities who are
unable to use regular fixed-route buses or trains
(see Paratransit Section). DART actively encourages
persons with disabilities to use the same vehicles
and facilities used by the general riding public when
possible.
The 2030 Transit System Plan highlights system
accessibility as a method to integrate traditional
paratransit users into the broader transit system.
This enhances the mobility choices of persons with
disabilities while improving the cost-effectiveness of
the overall DART system.
Enhancing systemwide accessibility and making
accessible transit an integral part of the DART system
can benefit the aging population and people with
disabilities that find it difficult to use transit services,
but are not eligible for ADA Paratransit service. A
more accessible system also makes transit easier to
use and often enables faster boarding and alighting of
vehicles.
Federal InitiativesAlthough DART is a primary provider of accessible
public transportation in its service area, there are also
human service agencies that provide transportation to
people with disabilities, older Americans, low income,
and other clients. Two key federal initiatives will
influence the provision and coordination of accessible
transit in the future. These programs are the New
Freedom Program and United We Ride.
The New Freedom Program (a program in SAFETEA-
LU) directs funding specifically to assist with the
transportation of persons with disabilities. It provides
funding for public transportation alternatives beyond
those required by ADA to assist individuals with
disabilities, including transportation to and from job
and employment support services. United We Ride is
an initiative of the Federal Interagency Coordinating
Council on Access and Mobility (CCAM) and is the
impetus behind the Regional Public Transportation
Coordination effort. In 2003, the Government
Accountability Office (GAO) issued a report on
“Transportation Disadvantaged Populations,” which
identified 62 different federal programs across eight
federal agencies that provide funding for community
transportation services. Based on the GAO report, the
CCAM outlined interim, coordination-based solutions
that the CCAM believes will strengthen existing
transportation services, making them more cost-
effective and accountable. This will help providers
become more responsive to consumers.
In 2003, the Texas Transportation Code was amended
to add Chapter 461, “Statewide Coordination of Public
Transportation.” The focus of Chapter 461 is the
coordination of transportation funding and resources
among the Health and Human Services Commission,
the Texas Workforce Commission, and the Texas
Department of Transportation. The state plan is
being developed at a regional level by NCTCOG and
is expected to be complete in fall 2006. The plan will
include short- and long-term coordination strategies,
some of which could effect DART. As a participant,
Chapter 6: Recommendations and Strategies
SYSTEM ACCESSIBILITY1. Continue to improve access to fixed-route services
Introduce more flexible route services and integrate with ADA paratransit service
2. Enhance vehicle accessibility for persons with
disabilities and the general public
Continue to acquire low floor transit vehicles and implement level boarding where feasible.
3. Ensure that all new transit facilities are accessible to
persons with disabilities
4. Ensure that clear and simple information is available in
both visual and audio forms to persons with disabilities.
5. Enhance access to transit stops and facilities for all
persons
Encourage member cities to place a high priority on access improvements
6. Take advantage of technology to improve accessibility
to all transit services
7. Coordinate DART accessible transit services with other
public transit and human services transportation
providers
STRATEGIES FOR SUCCESS
T R A N S I TS Y S T E MP L A N
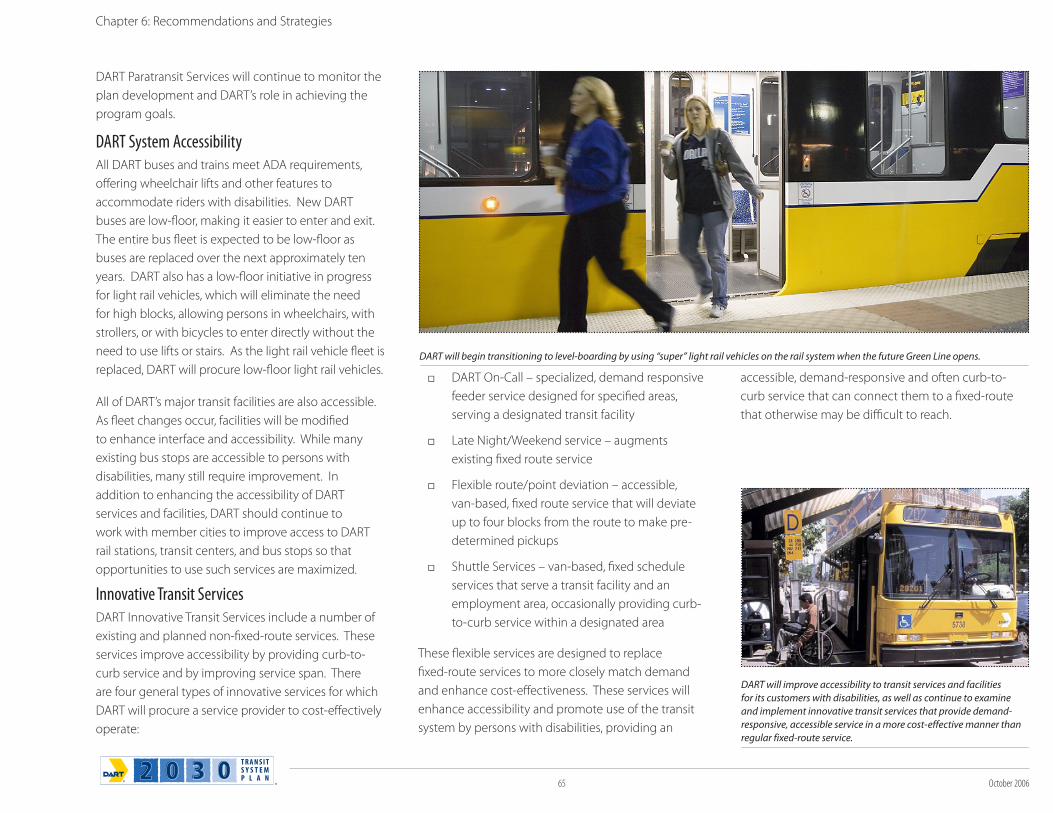
65 October 2006
Chapter 6: Recommendations and Strategies
DART Paratransit Services will continue to monitor the
plan development and DART’s role in achieving the
program goals.
DART System AccessibilityAll DART buses and trains meet ADA requirements,
offering wheelchair lifts and other features to
accommodate riders with disabilities. New DART
buses are low-floor, making it easier to enter and exit.
The entire bus fleet is expected to be low-floor as
buses are replaced over the next approximately ten
years. DART also has a low-floor initiative in progress
for light rail vehicles, which will eliminate the need
for high blocks, allowing persons in wheelchairs, with
strollers, or with bicycles to enter directly without the
need to use lifts or stairs. As the light rail vehicle fleet is
replaced, DART will procure low-floor light rail vehicles.
All of DART’s major transit facilities are also accessible.
As fleet changes occur, facilities will be modified
to enhance interface and accessibility. While many
existing bus stops are accessible to persons with
disabilities, many still require improvement. In
addition to enhancing the accessibility of DART
services and facilities, DART should continue to
work with member cities to improve access to DART
rail stations, transit centers, and bus stops so that
opportunities to use such services are maximized.
Innovative Transit ServicesDART Innovative Transit Services include a number of
existing and planned non-fixed-route services. These
services improve accessibility by providing curb-to-
curb service and by improving service span. There
are four general types of innovative services for which
DART will procure a service provider to cost-effectively
operate:
DART On-Call – specialized, demand responsive
feeder service designed for specified areas,
serving a designated transit facility
Late Night/Weekend service – augments
existing fixed route service
Flexible route/point deviation – accessible,
van-based, fixed route service that will deviate
up to four blocks from the route to make pre-
determined pickups
Shuttle Services – van-based, fixed schedule
services that serve a transit facility and an
employment area, occasionally providing curb-
to-curb service within a designated area
These flexible services are designed to replace
fixed-route services to more closely match demand
and enhance cost-effectiveness. These services will
enhance accessibility and promote use of the transit
system by persons with disabilities, providing an
accessible, demand-responsive and often curb-to-
curb service that can connect them to a fixed-route
that otherwise may be difficult to reach.
DART will improve accessibility to transit services and facilities
for its customers with disabilities, as well as continue to examine
and implement innovative transit services that provide demand-
responsive, accessible service in a more cost-effective manner than
regular fixed-route service.
DART will begin transitioning to level-boarding by using “super” light rail vehicles on the rail system when the future Green Line opens.
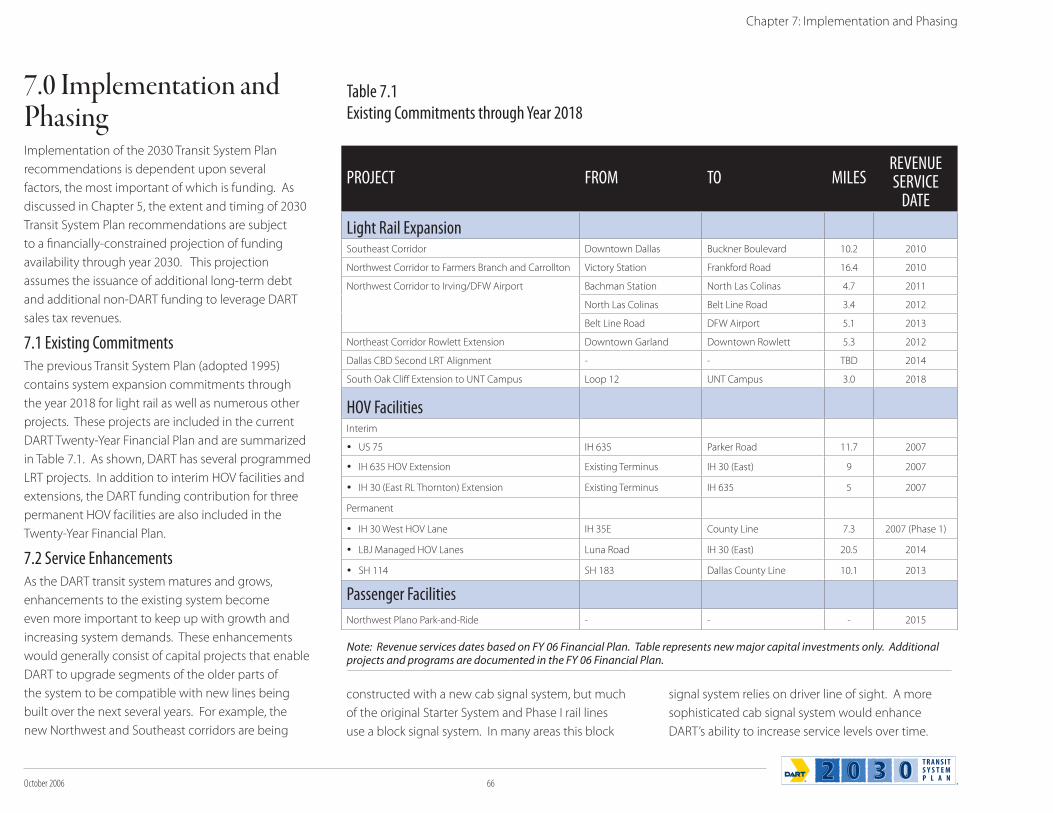
October 2006 66
7.0 Implementation and PhasingImplementation of the 2030 Transit System Plan
recommendations is dependent upon several
factors, the most important of which is funding. As
discussed in Chapter 5, the extent and timing of 2030
Transit System Plan recommendations are subject
to a financially-constrained projection of funding
availability through year 2030. This projection
assumes the issuance of additional long-term debt
and additional non-DART funding to leverage DART
sales tax revenues.
7.1 Existing CommitmentsThe previous Transit System Plan (adopted 1995)
contains system expansion commitments through
the year 2018 for light rail as well as numerous other
projects. These projects are included in the current
DART Twenty-Year Financial Plan and are summarized
in Table 7.1. As shown, DART has several programmed
LRT projects. In addition to interim HOV facilities and
extensions, the DART funding contribution for three
permanent HOV facilities are also included in the
Twenty-Year Financial Plan.
7.2 Service EnhancementsAs the DART transit system matures and grows,
enhancements to the existing system become
even more important to keep up with growth and
increasing system demands. These enhancements
would generally consist of capital projects that enable
DART to upgrade segments of the older parts of
the system to be compatible with new lines being
built over the next several years. For example, the
new Northwest and Southeast corridors are being
constructed with a new cab signal system, but much
of the original Starter System and Phase I rail lines
use a block signal system. In many areas this block
signal system relies on driver line of sight. A more
sophisticated cab signal system would enhance
DART’s ability to increase service levels over time.
Chapter 7: Implementation and Phasing
Table 7.1Existing Commitments through Year 2018
PROJECT FROM TO MILESREVENUE SERVICE
DATE
Light Rail ExpansionSoutheast Corridor Downtown Dallas Buckner Boulevard 10.2 2010
Northwest Corridor to Farmers Branch and Carrollton Victory Station Frankford Road 16.4 2010
Northwest Corridor to Irving/DFW Airport Bachman Station North Las Colinas 4.7 2011
North Las Colinas Belt Line Road 3.4 2012
Belt Line Road DFW Airport 5.1 2013
Northeast Corridor Rowlett Extension Downtown Garland Downtown Rowlett 5.3 2012
Dallas CBD Second LRT Alignment - - TBD 2014
South Oak Cliff Extension to UNT Campus Loop 12 UNT Campus 3.0 2018
HOV FacilitiesInterim
US 75 IH 635 Parker Road 11.7 2007
IH 635 HOV Extension Existing Terminus IH 30 (East) 9 2007
IH 30 (East RL Thornton) Extension Existing Terminus IH 635 5 2007
Permanent
IH 30 West HOV Lane IH 35E County Line 7.3 2007 (Phase 1)
LBJ Managed HOV Lanes Luna Road IH 30 (East) 20.5 2014
SH 114 SH 183 Dallas County Line 10.1 2013
Passenger Facilities
Northwest Plano Park-and-Ride - - - 2015
Note: Revenue services dates based on FY 06 Financial Plan. Table represents new major capital investments only. Additional projects and programs are documented in the FY 06 Financial Plan.
67 October 2006
Chapter 7: Implementation and Phasing
These enhancements could also include corridor
or station enhancements such as additional track
or power to accommodate express trains or more
frequent service, or funding contributions toward
previously deferred or new infill stations. These
improvements are not specifically identified, but
future funds are allocated through 2030 (up to
$50,000,000) for this purpose as needs arise. It is
recommended that DART regularly assess the need
for capital enhancements, particularly where they can
create cost-efficiencies and increase ridership. Where
available, DART would seek supplemental funding
sources for such projects.
7.3 Project Phasing Through 2030The 2030 Transit System Plan identifies additional
projects and programs to be implemented through
the year 2030. Implementation timeframes are
estimated and will be reevaluated regularly as the
annual budget and associated Twenty-Year Financial
Plan are updated. Changing agency needs, changed
financial conditions, and any associated amendments
to the Service Plan or Financial Plan could impact
these timeframes. As outlined in Chapter 5, the
Twenty-Year Financial Plan has been extrapolated to
year 2030, and assumes that capacity for additional
long-term debt is available to help fund 2030
recommendations. The Financial Plan incorporates
estimated costs for recommended system plan
elements, identifies funding sources, and makes
reasonable non-DART funding assumptions.
2030 Transit System Plan recommendations are
phased in project groupings for implementation by
year 2030. As projects proceed through the project
development process, more refined implementation
dates that reflect this phasing approach will be
incorporated into the Twenty Year Financial Plan and
subsequent Transit System Plan updates. These future
updates will provide additional details regarding the
approach and timeframe for any required long-term
debt issuance, which will require voter approval (see
Chapter 5.0 for more information).
Table 7.2 outlines proposed project phasing and
project costs for bus and rail elements of the 2030
Transit System Plan. Project phasing for HOV facilities
is primarily developed by TxDOT and is incorporated
by reference to the NCTCOG Metropolitan
Transportation Plan.
7.3.1 Project Phasing without Long-Term DebtIn the case that DART does not pursue long-term
debt in the future, or if voters do not approve such
a referendum, project phasing would be limited.
Without long-term debt, there is approximately $900
million (2006$) available for new capital and operating
programs through year 2030. This estimate is based
on projecting the FY 06 Financial Plan to year 2030.
This amount of financial capacity would result in the
following project phasing strategy above and beyond
committed projects and the set-aside for capital
service enhancement projects:
Phase 1 rail projects – Cotton Belt and Southport
Phase 1 bus projects
DART financial contribution for all managed HOV
lane facilities
Based on current financial projections, DART would
need to obtain additional non-DART funds (regional,
state, Federal) to construct both Phase 1 rail projects
by 2030. Thus, DART will pursue all avenues of
available funding and cooperative funding to
maintain and/or accelerate construction of proposed
projects. Positive trends in sales tax revenue and/or
new member cities can also positively affect DART’s
ability to implement projects without long-term debt.
Because of this, DART will regularly reconcile the 2030
recommendations with updated Twenty-Year Financial
Plans.
7.4 Project Development StrategyA key element of project phasing relates to the interim
steps of project development that must be taken to
ensure timely and successful project implementation.
Project development steps can consist of feasibility
studies, coordinated land use/transit studies,
Alternatives Analyses, environmental documentation,
engineering and design. All of the steps include an
appropriate level of community and stakeholder
involvement.
The following sections outline project development
strategies for each transit system plan element
to guide work programs over the next several
years. Specific elements of the work plans will be
incorporated into division-level programs specific to
each program or mode.
7.4.1 Managed HOV LanesDART will continue to participate in the design,
construction and operation of both interim and
permanent HOV facilities in the DART Service Area.
HOV facilities may be built by traditional TxDOT design
and construction, Comprehensive Development
Agreements (CDA) or Tollway Authorities. The extent
of DART participation in the HOV facilities identified
in this Plan will be determined by specific corridor
agreements.
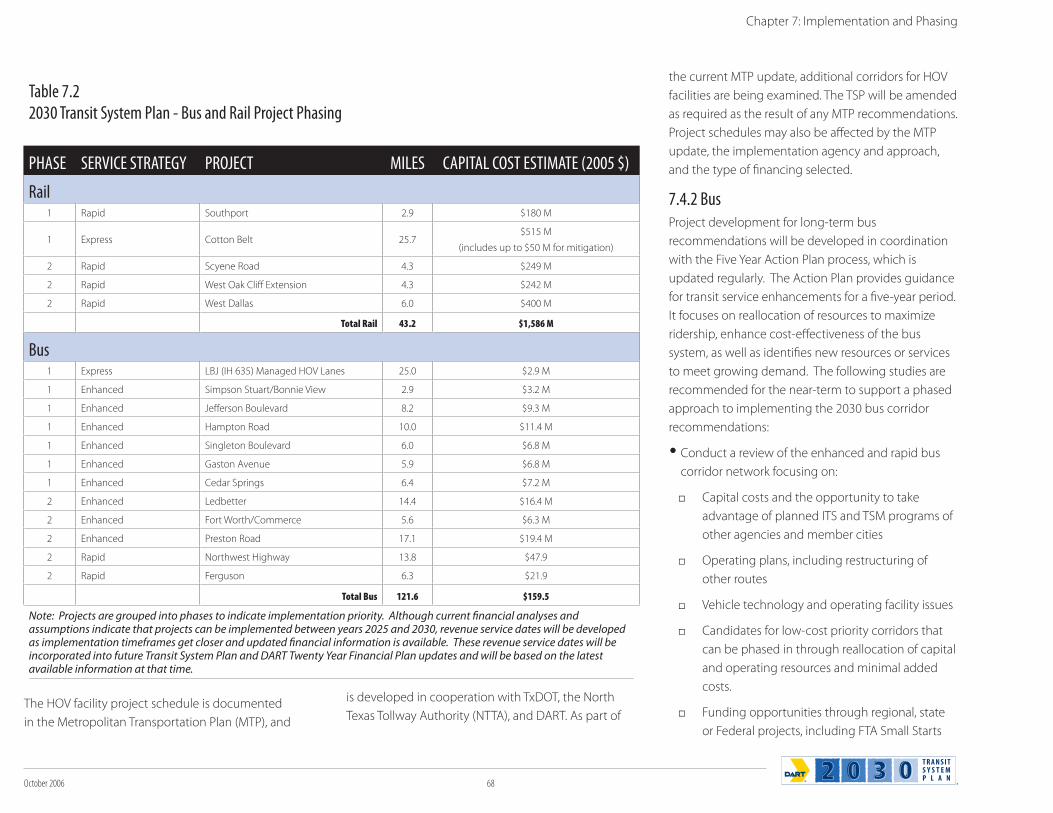
October 2006 68
The HOV facility project schedule is documented
in the Metropolitan Transportation Plan (MTP), and
is developed in cooperation with TxDOT, the North
Texas Tollway Authority (NTTA), and DART. As part of
the current MTP update, additional corridors for HOV
facilities are being examined. The TSP will be amended
as required as the result of any MTP recommendations.
Project schedules may also be affected by the MTP
update, the implementation agency and approach,
and the type of financing selected.
7.4.2 BusProject development for long-term bus
recommendations will be developed in coordination
with the Five Year Action Plan process, which is
updated regularly. The Action Plan provides guidance
for transit service enhancements for a five-year period.
It focuses on reallocation of resources to maximize
ridership, enhance cost-effectiveness of the bus
system, as well as identifies new resources or services
to meet growing demand. The following studies are
recommended for the near-term to support a phased
approach to implementing the 2030 bus corridor
recommendations:
Conduct a review of the enhanced and rapid bus
corridor network focusing on:
Capital costs and the opportunity to take
advantage of planned ITS and TSM programs of
other agencies and member cities
Operating plans, including restructuring of
other routes
Vehicle technology and operating facility issues
Candidates for low-cost priority corridors that
can be phased in through reallocation of capital
and operating resources and minimal added
costs.
Funding opportunities through regional, state
or Federal projects, including FTA Small Starts
Chapter 7: Implementation and Phasing
Table 7.22030 Transit System Plan - Bus and Rail Project Phasing
PHASE SERVICE STRATEGY PROJECT MILES CAPITAL COST ESTIMATE (2005 $)
Rail1 Rapid Southport 2.9 $180 M
1 Express Cotton Belt 25.7$515 M
(includes up to $50 M for mitigation)
2 Rapid Scyene Road 4.3 $249 M
2 Rapid West Oak Cliff Extension 4.3 $242 M
2 Rapid West Dallas 6.0 $400 M
Total Rail 43.2 $1,586 M
Bus1 Express LBJ (IH 635) Managed HOV Lanes 25.0 $2.9 M
1 Enhanced Simpson Stuart/Bonnie View 2.9 $3.2 M
1 Enhanced Jefferson Boulevard 8.2 $9.3 M
1 Enhanced Hampton Road 10.0 $11.4 M
1 Enhanced Singleton Boulevard 6.0 $6.8 M
1 Enhanced Gaston Avenue 5.9 $6.8 M
1 Enhanced Cedar Springs 6.4 $7.2 M
2 Enhanced Ledbetter 14.4 $16.4 M
2 Enhanced Fort Worth/Commerce 5.6 $6.3 M
2 Enhanced Preston Road 17.1 $19.4 M
2 Rapid Northwest Highway 13.8 $47.9
2 Rapid Ferguson 6.3 $21.9
Total Bus 121.6 $159.5
Note: Projects are grouped into phases to indicate implementation priority. Although current financial analyses and assumptions indicate that projects can be implemented between years 2025 and 2030, revenue service dates will be developed as implementation timeframes get closer and updated financial information is available. These revenue service dates will be incorporated into future Transit System Plan and DART Twenty Year Financial Plan updates and will be based on the latest available information at that time.
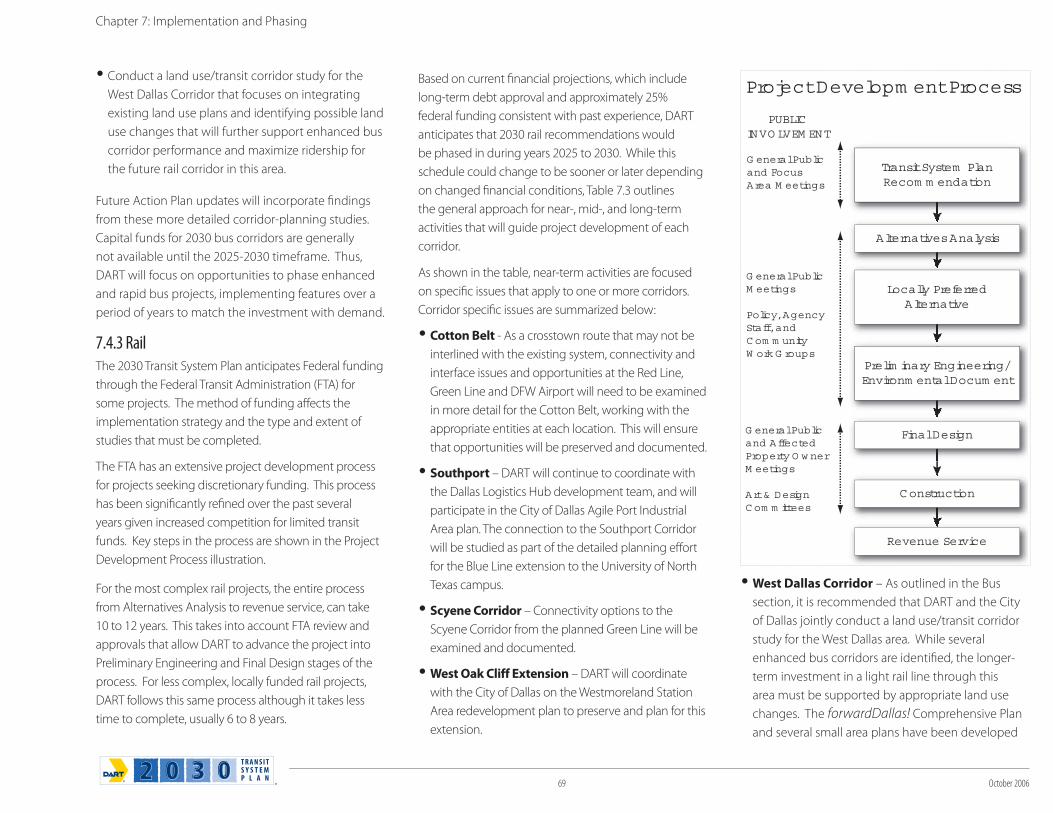
69 October 2006
Chapter 7: Implementation and Phasing
Conduct a land use/transit corridor study for the
West Dallas Corridor that focuses on integrating
existing land use plans and identifying possible land
use changes that will further support enhanced bus
corridor performance and maximize ridership for
the future rail corridor in this area.
Future Action Plan updates will incorporate findings
from these more detailed corridor-planning studies.
Capital funds for 2030 bus corridors are generally
not available until the 2025-2030 timeframe. Thus,
DART will focus on opportunities to phase enhanced
and rapid bus projects, implementing features over a
period of years to match the investment with demand.
7.4.3 RailThe 2030 Transit System Plan anticipates Federal funding
through the Federal Transit Administration (FTA) for
some projects. The method of funding affects the
implementation strategy and the type and extent of
studies that must be completed.
The FTA has an extensive project development process
for projects seeking discretionary funding. This process
has been significantly refined over the past several
years given increased competition for limited transit
funds. Key steps in the process are shown in the Project
Development Process illustration.
For the most complex rail projects, the entire process
from Alternatives Analysis to revenue service, can take
10 to 12 years. This takes into account FTA review and
approvals that allow DART to advance the project into
Preliminary Engineering and Final Design stages of the
process. For less complex, locally funded rail projects,
DART follows this same process although it takes less
time to complete, usually 6 to 8 years.
Based on current financial projections, which include
long-term debt approval and approximately 25%
federal funding consistent with past experience, DART
anticipates that 2030 rail recommendations would
be phased in during years 2025 to 2030. While this
schedule could change to be sooner or later depending
on changed financial conditions, Table 7.3 outlines
the general approach for near-, mid-, and long-term
activities that will guide project development of each
corridor.
As shown in the table, near-term activities are focused
on specific issues that apply to one or more corridors.
Corridor specific issues are summarized below:
Cotton Belt - As a crosstown route that may not be
interlined with the existing system, connectivity and
interface issues and opportunities at the Red Line,
Green Line and DFW Airport will need to be examined
in more detail for the Cotton Belt, working with the
appropriate entities at each location. This will ensure
that opportunities will be preserved and documented.
Southport – DART will continue to coordinate with
the Dallas Logistics Hub development team, and will
participate in the City of Dallas Agile Port Industrial
Area plan. The connection to the Southport Corridor
will be studied as part of the detailed planning effort
for the Blue Line extension to the University of North
Texas campus.
Scyene Corridor – Connectivity options to the
Scyene Corridor from the planned Green Line will be
examined and documented.
West Oak Cliff Extension – DART will coordinate
with the City of Dallas on the Westmoreland Station
Area redevelopment plan to preserve and plan for this
extension.
West Dallas Corridor – As outlined in the Bus
section, it is recommended that DART and the City
of Dallas jointly conduct a land use/transit corridor
study for the West Dallas area. While several
enhanced bus corridors are identified, the longer-
term investment in a light rail line through this
area must be supported by appropriate land use
changes. The forwardDallas! Comprehensive Plan
and several small area plans have been developed
PUBLICINVO LVEM ENT
Project Developm ent Process
Transit System PlanRecom m endation
Locally PreferredAlternative
Prelim inary Engineering/Environm ental Docum ent
Alternatives Analysis
Final Design
Construction
Revenue Service
G eneral Public and Focus Area M eetings
G eneral Public M eetings
Policy, Agency Staff, and C om m unityW ork G roups
G eneral Public and Affected Property O w ner M eetings
Art & Design C om m ittees
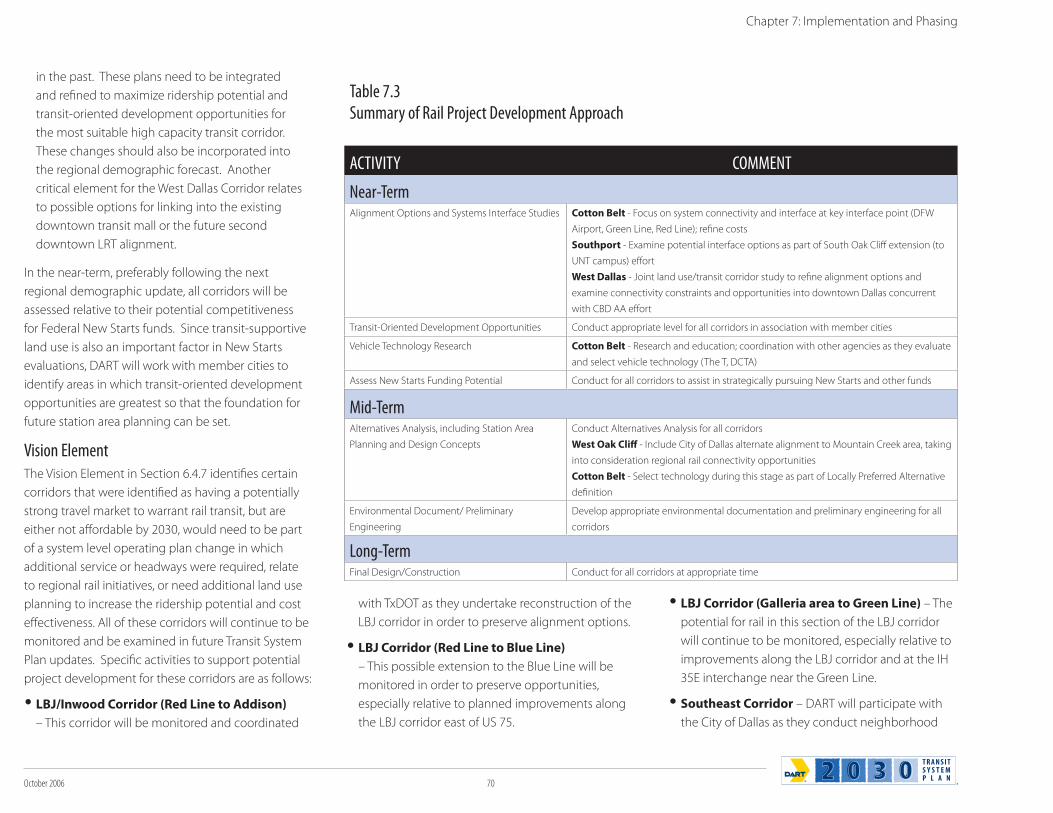
October 2006 70
in the past. These plans need to be integrated
and refined to maximize ridership potential and
transit-oriented development opportunities for
the most suitable high capacity transit corridor.
These changes should also be incorporated into
the regional demographic forecast. Another
critical element for the West Dallas Corridor relates
to possible options for linking into the existing
downtown transit mall or the future second
downtown LRT alignment.
In the near-term, preferably following the next
regional demographic update, all corridors will be
assessed relative to their potential competitiveness
for Federal New Starts funds. Since transit-supportive
land use is also an important factor in New Starts
evaluations, DART will work with member cities to
identify areas in which transit-oriented development
opportunities are greatest so that the foundation for
future station area planning can be set.
Vision ElementThe Vision Element in Section 6.4.7 identifies certain
corridors that were identified as having a potentially
strong travel market to warrant rail transit, but are
either not affordable by 2030, would need to be part
of a system level operating plan change in which
additional service or headways were required, relate
to regional rail initiatives, or need additional land use
planning to increase the ridership potential and cost
effectiveness. All of these corridors will continue to be
monitored and be examined in future Transit System
Plan updates. Specific activities to support potential
project development for these corridors are as follows:
LBJ/Inwood Corridor (Red Line to Addison)
– This corridor will be monitored and coordinated
with TxDOT as they undertake reconstruction of the
LBJ corridor in order to preserve alignment options.
LBJ Corridor (Red Line to Blue Line)
– This possible extension to the Blue Line will be
monitored in order to preserve opportunities,
especially relative to planned improvements along
the LBJ corridor east of US 75.
LBJ Corridor (Galleria area to Green Line) – The
potential for rail in this section of the LBJ corridor
will continue to be monitored, especially relative to
improvements along the LBJ corridor and at the IH
35E interchange near the Green Line.
Southeast Corridor – DART will participate with
the City of Dallas as they conduct neighborhood
Chapter 7: Implementation and Phasing
Table 7.3Summary of Rail Project Development Approach
ACTIVITY COMMENT
Near-TermAlignment Options and Systems Interface Studies Cotton Belt - Focus on system connectivity and interface at key interface point (DFW
Airport, Green Line, Red Line); refine costs
Southport - Examine potential interface options as part of South Oak Cliff extension (to
UNT campus) effort
West Dallas - Joint land use/transit corridor study to refine alignment options and
examine connectivity constraints and opportunities into downtown Dallas concurrent
with CBD AA effort
Transit-Oriented Development Opportunities Conduct appropriate level for all corridors in association with member cities
Vehicle Technology Research Cotton Belt - Research and education; coordination with other agencies as they evaluate
and select vehicle technology (The T, DCTA)
Assess New Starts Funding Potential Conduct for all corridors to assist in strategically pursuing New Starts and other funds
Mid-TermAlternatives Analysis, including Station Area
Planning and Design Concepts
Conduct Alternatives Analysis for all corridors
West Oak Cliff - Include City of Dallas alternate alignment to Mountain Creek area, taking
into consideration regional rail connectivity opportunities
Cotton Belt - Select technology during this stage as part of Locally Preferred Alternative
definition
Environmental Document/ Preliminary
Engineering
Develop appropriate environmental documentation and preliminary engineering for all
corridors
Long-TermFinal Design/Construction Conduct for all corridors at appropriate time
71 October 2006
Chapter 7: Implementation and Phasing
and area planning in this corridor in order to
monitor land use plans and public support for
potential future rail expansion.
Garland/Bush Turnpike Corridor – Potential
service in this corridor will be examined as an
operating scenario with the LBJ/Inwood Corridor,
and will also be monitored as a potential branch
of the Blue Line if passenger demand south of
downtown Garland warrants additional capacity in
the future.
BNSF Corridor – Connectivity with a potential
passenger rail service in this corridor will continue
to be part of planning efforts at key interface
points along the corridor. DART will also continue
to monitor the potential for regional rail north of
Carrollton.
7.4.4 ParatransitParatransit is an ongoing service that DART will
provide to eligible customers and does not consist
of any major capital projects. Through 2030, DART
will focus on those strategies outlined in Section 6.5
to enhance cost-effectiveness, improve operations
efficiencies, enhance user-friendliness, and increase
coordination with DART fixed route and new
innovative, flexible transit services.
DART will also continue to monitor the Regional
Public Transportation Coordination effort. If necessary,
the Paratransit Strategies of the 2030 TSP may be
amended in the future to support implementation of
any DART projects or programs recommended as part
of the regional effort.
7.4.5 Systemwide MobilitySystemwide Mobility elements support the core
modes operated by DART to enhance the overall
efficiency, operation, safety, security and access to
the system. They also serve to increase ridership and
enhance customer information and comfort. While
many of these elements are integrated into larger
projects and are considered as part of the planning
and design process, some are stand-alone programs
that will continue to be operated by DART through
2030. The strategies outlined for each specific element
in Section 6.6 will guide their implementation and
growth over time.
7.5 CoordinationAs the 2030 Transit System Plan is implemented,
coordination, both internally and externally, will
continue to be critical to the success of programs and
projects.
The participation and commitment of staff
across many levels – from executive leadership to
construction management and designers to day-to-
day operators and customer service representatives –
is necessary to continue building on DART’s successes.
Internal coordination among DART departments
and divisions for the various plan elements will occur
through regular coordination meetings. Specific
coordination efforts for some projects and programs
will be necessary.
External coordination with the 13 member cities
and other agencies, ranging from the Federal Transit
Administration and local, regional, state and Federal
resource agencies to other transportation authorities
such as TxDOT, DCTA, the T, and NTTA will also be
important to plan implementation. As appropriate,
policy and technical work groups will be defined for
specific projects to involve key representatives and
staff throughout project development.
7.6 Public InvolvementThe public is one of the key stakeholders of the 2030
Transit System Plan. While many members of the
public currently use the transit system, many more will
have an opportunity to use the system in the future
as its reach extends further across the Service Area,
connecting their neighborhoods to major activity
and employment centers through new rail corridors,
HOV lanes, and enhanced bus services. It will also
improve their ability to travel across the region with
new connections to services of other agencies such
as the T and DCTA, while setting the stage for possible
expansion into areas not currently within an agency
boundary.
The public is not only a customer of the system,
they are also in many cases a neighbor. Whether
a stakeholder is a commercial property owner or
an adjacent homeowner, DART is committed to
implementing projects that fit within the context of
the community that they will serve. Just as member
city staff and elected officials will be involved in project
development, specific community and stakeholder
work groups will also be formed to address key
community issues along the various project corridors.
Public involvement not only ensures that a good
project will be implemented, but can provide the
support necessary for a vote that gives DART authority
to issue long-term debt or the cooperation and
backing critical to successfully obtaining regional, state
or Federal funds.
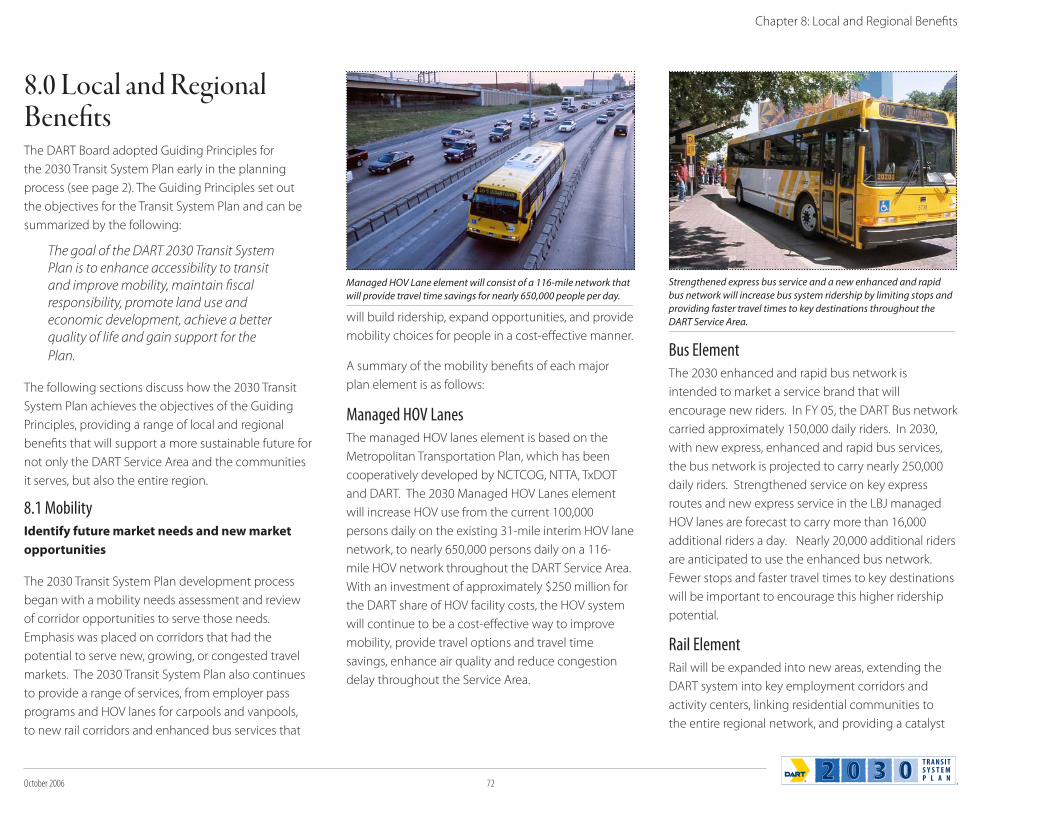
October 2006 72
8.0 Local and Regional BenefitsThe DART Board adopted Guiding Principles for
the 2030 Transit System Plan early in the planning
process (see page 2). The Guiding Principles set out
the objectives for the Transit System Plan and can be
summarized by the following:
The goal of the DART 2030 Transit System Plan is to enhance accessibility to transit and improve mobility, maintain fiscal responsibility, promote land use and economic development, achieve a better quality of life and gain support for the
Plan.
The following sections discuss how the 2030 Transit
System Plan achieves the objectives of the Guiding
Principles, providing a range of local and regional
benefits that will support a more sustainable future for
not only the DART Service Area and the communities
it serves, but also the entire region.
8.1 MobilityIdentify future market needs and new market
opportunities
The 2030 Transit System Plan development process
began with a mobility needs assessment and review
of corridor opportunities to serve those needs.
Emphasis was placed on corridors that had the
potential to serve new, growing, or congested travel
markets. The 2030 Transit System Plan also continues
to provide a range of services, from employer pass
programs and HOV lanes for carpools and vanpools,
to new rail corridors and enhanced bus services that
will build ridership, expand opportunities, and provide
mobility choices for people in a cost-effective manner.
A summary of the mobility benefits of each major
plan element is as follows:
Managed HOV LanesThe managed HOV lanes element is based on the
Metropolitan Transportation Plan, which has been
cooperatively developed by NCTCOG, NTTA, TxDOT
and DART. The 2030 Managed HOV Lanes element
will increase HOV use from the current 100,000
persons daily on the existing 31-mile interim HOV lane
network, to nearly 650,000 persons daily on a 116-
mile HOV network throughout the DART Service Area.
With an investment of approximately $250 million for
the DART share of HOV facility costs, the HOV system
will continue to be a cost-effective way to improve
mobility, provide travel options and travel time
savings, enhance air quality and reduce congestion
delay throughout the Service Area.
Bus ElementThe 2030 enhanced and rapid bus network is
intended to market a service brand that will
encourage new riders. In FY 05, the DART Bus network
carried approximately 150,000 daily riders. In 2030,
with new express, enhanced and rapid bus services,
the bus network is projected to carry nearly 250,000
daily riders. Strengthened service on key express
routes and new express service in the LBJ managed
HOV lanes are forecast to carry more than 16,000
additional riders a day. Nearly 20,000 additional riders
are anticipated to use the enhanced bus network.
Fewer stops and faster travel times to key destinations
will be important to encourage this higher ridership
potential.
Rail ElementRail will be expanded into new areas, extending the
DART system into key employment corridors and
activity centers, linking residential communities to
the entire regional network, and providing a catalyst
Chapter 8: Local and Regional Benefits
Managed HOV Lane element will consist of a 116-mile network that
will provide travel time savings for nearly 650,000 people per day.
Strengthened express bus service and a new enhanced and rapid
bus network will increase bus system ridership by limiting stops and
providing faster travel times to key destinations throughout the
DART Service Area.
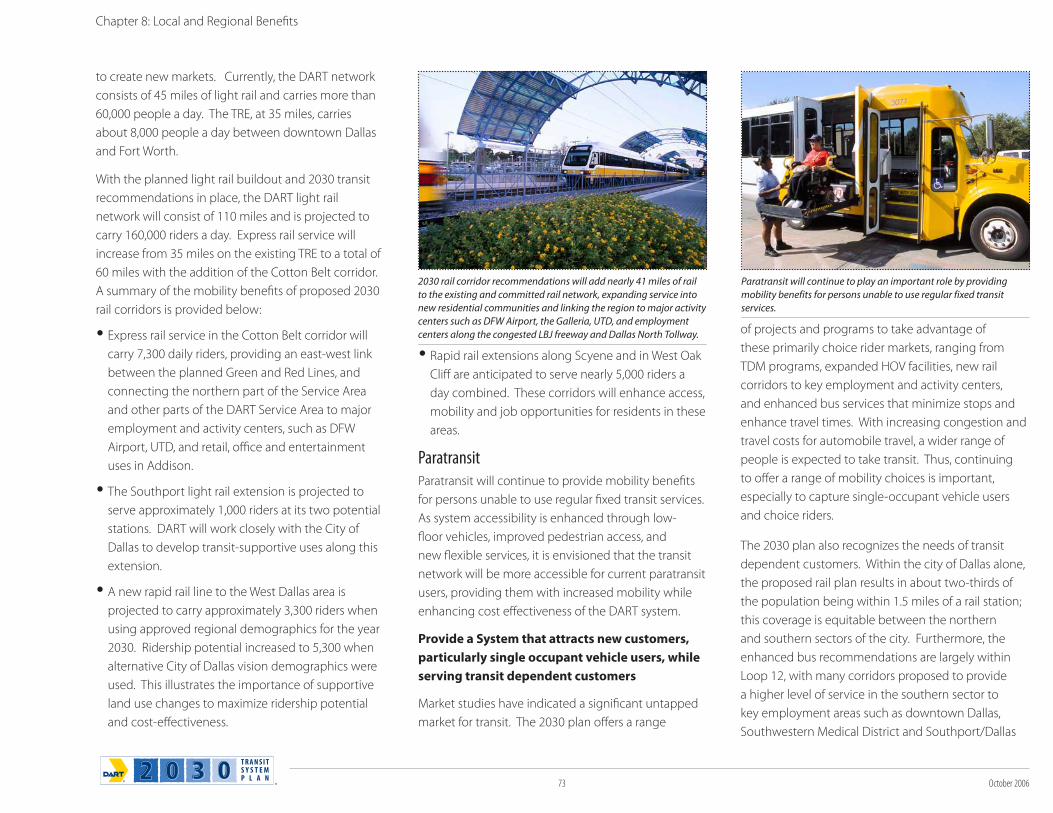
73 October 2006
Chapter 8: Local and Regional Benefits
to create new markets. Currently, the DART network
consists of 45 miles of light rail and carries more than
60,000 people a day. The TRE, at 35 miles, carries
about 8,000 people a day between downtown Dallas
and Fort Worth.
With the planned light rail buildout and 2030 transit
recommendations in place, the DART light rail
network will consist of 110 miles and is projected to
carry 160,000 riders a day. Express rail service will
increase from 35 miles on the existing TRE to a total of
60 miles with the addition of the Cotton Belt corridor.
A summary of the mobility benefits of proposed 2030
rail corridors is provided below:
Express rail service in the Cotton Belt corridor will
carry 7,300 daily riders, providing an east-west link
between the planned Green and Red Lines, and
connecting the northern part of the Service Area
and other parts of the DART Service Area to major
employment and activity centers, such as DFW
Airport, UTD, and retail, office and entertainment
uses in Addison.
The Southport light rail extension is projected to
serve approximately 1,000 riders at its two potential
stations. DART will work closely with the City of
Dallas to develop transit-supportive uses along this
extension.
A new rapid rail line to the West Dallas area is
projected to carry approximately 3,300 riders when
using approved regional demographics for the year
2030. Ridership potential increased to 5,300 when
alternative City of Dallas vision demographics were
used. This illustrates the importance of supportive
land use changes to maximize ridership potential
and cost-effectiveness.
Rapid rail extensions along Scyene and in West Oak
Cliff are anticipated to serve nearly 5,000 riders a
day combined. These corridors will enhance access,
mobility and job opportunities for residents in these
areas.
ParatransitParatransit will continue to provide mobility benefits
for persons unable to use regular fixed transit services.
As system accessibility is enhanced through low-
floor vehicles, improved pedestrian access, and
new flexible services, it is envisioned that the transit
network will be more accessible for current paratransit
users, providing them with increased mobility while
enhancing cost effectiveness of the DART system.
Provide a System that attracts new customers,
particularly single occupant vehicle users, while
serving transit dependent customers
Market studies have indicated a significant untapped
market for transit. The 2030 plan offers a range
of projects and programs to take advantage of
these primarily choice rider markets, ranging from
TDM programs, expanded HOV facilities, new rail
corridors to key employment and activity centers,
and enhanced bus services that minimize stops and
enhance travel times. With increasing congestion and
travel costs for automobile travel, a wider range of
people is expected to take transit. Thus, continuing
to offer a range of mobility choices is important,
especially to capture single-occupant vehicle users
and choice riders.
The 2030 plan also recognizes the needs of transit
dependent customers. Within the city of Dallas alone,
the proposed rail plan results in about two-thirds of
the population being within 1.5 miles of a rail station;
this coverage is equitable between the northern
and southern sectors of the city. Furthermore, the
enhanced bus recommendations are largely within
Loop 12, with many corridors proposed to provide
a higher level of service in the southern sector to
key employment areas such as downtown Dallas,
Southwestern Medical District and Southport/Dallas
Paratransit will continue to play an important role by providing
mobility benefits for persons unable to use regular fixed transit
services.
2030 rail corridor recommendations will add nearly 41 miles of rail
to the existing and committed rail network, expanding service into
new residential communities and linking the region to major activity
centers such as DFW Airport, the Galleria, UTD, and employment
centers along the congested LBJ freeway and Dallas North Tollway.
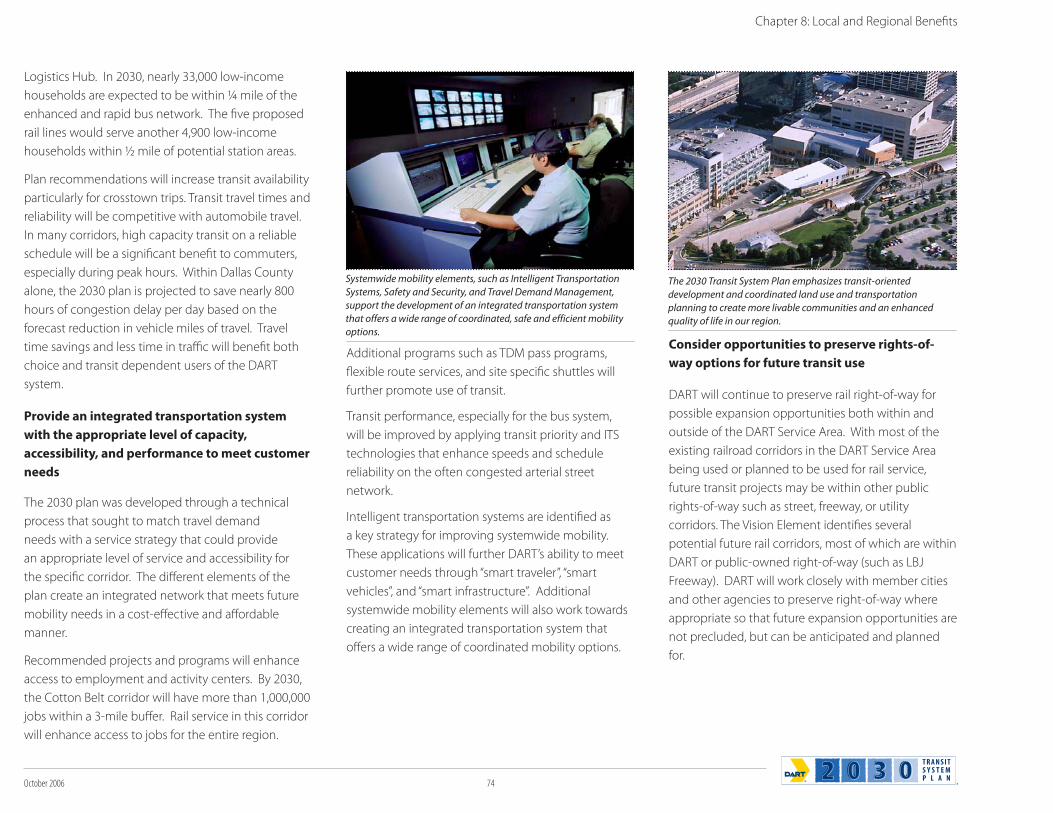
October 2006 74
Chapter 8: Local and Regional Benefits
Logistics Hub. In 2030, nearly 33,000 low-income
households are expected to be within ¼ mile of the
enhanced and rapid bus network. The five proposed
rail lines would serve another 4,900 low-income
households within ½ mile of potential station areas.
Plan recommendations will increase transit availability
particularly for crosstown trips. Transit travel times and
reliability will be competitive with automobile travel.
In many corridors, high capacity transit on a reliable
schedule will be a significant benefit to commuters,
especially during peak hours. Within Dallas County
alone, the 2030 plan is projected to save nearly 800
hours of congestion delay per day based on the
forecast reduction in vehicle miles of travel. Travel
time savings and less time in traffic will benefit both
choice and transit dependent users of the DART
system.
Provide an integrated transportation system
with the appropriate level of capacity,
accessibility, and performance to meet customer
needs
The 2030 plan was developed through a technical
process that sought to match travel demand
needs with a service strategy that could provide
an appropriate level of service and accessibility for
the specific corridor. The different elements of the
plan create an integrated network that meets future
mobility needs in a cost-effective and affordable
manner.
Recommended projects and programs will enhance
access to employment and activity centers. By 2030,
the Cotton Belt corridor will have more than 1,000,000
jobs within a 3-mile buffer. Rail service in this corridor
will enhance access to jobs for the entire region.
Additional programs such as TDM pass programs,
flexible route services, and site specific shuttles will
further promote use of transit.
Transit performance, especially for the bus system,
will be improved by applying transit priority and ITS
technologies that enhance speeds and schedule
reliability on the often congested arterial street
network.
Intelligent transportation systems are identified as
a key strategy for improving systemwide mobility.
These applications will further DART’s ability to meet
customer needs through “smart traveler”, “smart
vehicles”, and “smart infrastructure”. Additional
systemwide mobility elements will also work towards
creating an integrated transportation system that
offers a wide range of coordinated mobility options.
Consider opportunities to preserve rights-of-
way options for future transit use
DART will continue to preserve rail right-of-way for
possible expansion opportunities both within and
outside of the DART Service Area. With most of the
existing railroad corridors in the DART Service Area
being used or planned to be used for rail service,
future transit projects may be within other public
rights-of-way such as street, freeway, or utility
corridors. The Vision Element identifies several
potential future rail corridors, most of which are within
DART or public-owned right-of-way (such as LBJ
Freeway). DART will work closely with member cities
and other agencies to preserve right-of-way where
appropriate so that future expansion opportunities are
not precluded, but can be anticipated and planned
for.
The 2030 Transit System Plan emphasizes transit-oriented
development and coordinated land use and transportation
planning to create more livable communities and an enhanced
quality of life in our region.
Systemwide mobility elements, such as Intelligent Transportation
Systems, Safety and Security, and Travel Demand Management,
support the development of an integrated transportation system
that offers a wide range of coordinated, safe and efficient mobility
options.
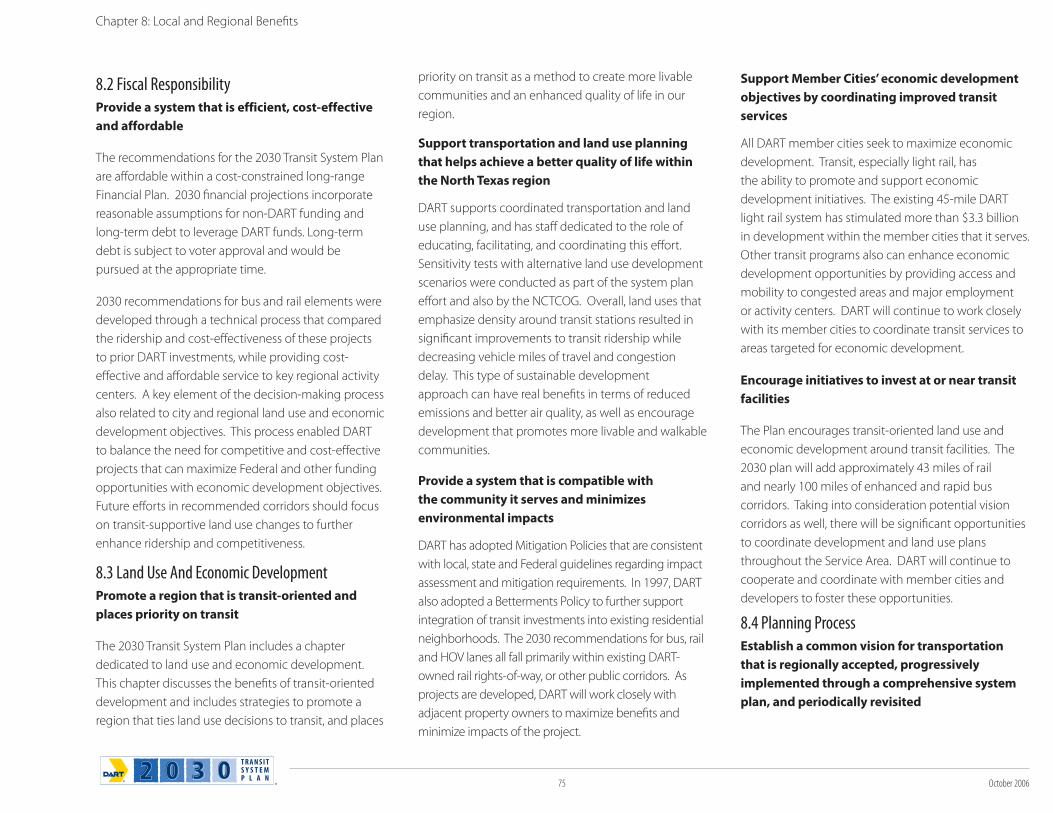
75 October 2006
8.2 Fiscal ResponsibilityProvide a system that is efficient, cost-effective
and affordable
The recommendations for the 2030 Transit System Plan
are affordable within a cost-constrained long-range
Financial Plan. 2030 financial projections incorporate
reasonable assumptions for non-DART funding and
long-term debt to leverage DART funds. Long-term
debt is subject to voter approval and would be
pursued at the appropriate time.
2030 recommendations for bus and rail elements were
developed through a technical process that compared
the ridership and cost-effectiveness of these projects
to prior DART investments, while providing cost-
effective and affordable service to key regional activity
centers. A key element of the decision-making process
also related to city and regional land use and economic
development objectives. This process enabled DART
to balance the need for competitive and cost-effective
projects that can maximize Federal and other funding
opportunities with economic development objectives.
Future efforts in recommended corridors should focus
on transit-supportive land use changes to further
enhance ridership and competitiveness.
8.3 Land Use And Economic DevelopmentPromote a region that is transit-oriented and
places priority on transit
The 2030 Transit System Plan includes a chapter
dedicated to land use and economic development.
This chapter discusses the benefits of transit-oriented
development and includes strategies to promote a
region that ties land use decisions to transit, and places
priority on transit as a method to create more livable
communities and an enhanced quality of life in our
region.
Support transportation and land use planning
that helps achieve a better quality of life within
the North Texas region
DART supports coordinated transportation and land
use planning, and has staff dedicated to the role of
educating, facilitating, and coordinating this effort.
Sensitivity tests with alternative land use development
scenarios were conducted as part of the system plan
effort and also by the NCTCOG. Overall, land uses that
emphasize density around transit stations resulted in
significant improvements to transit ridership while
decreasing vehicle miles of travel and congestion
delay. This type of sustainable development
approach can have real benefits in terms of reduced
emissions and better air quality, as well as encourage
development that promotes more livable and walkable
communities.
Provide a system that is compatible with
the community it serves and minimizes
environmental impacts
DART has adopted Mitigation Policies that are consistent
with local, state and Federal guidelines regarding impact
assessment and mitigation requirements. In 1997, DART
also adopted a Betterments Policy to further support
integration of transit investments into existing residential
neighborhoods. The 2030 recommendations for bus, rail
and HOV lanes all fall primarily within existing DART-
owned rail rights-of-way, or other public corridors. As
projects are developed, DART will work closely with
adjacent property owners to maximize benefits and
minimize impacts of the project.
Support Member Cities’ economic development
objectives by coordinating improved transit
services
All DART member cities seek to maximize economic
development. Transit, especially light rail, has
the ability to promote and support economic
development initiatives. The existing 45-mile DART
light rail system has stimulated more than $3.3 billion
in development within the member cities that it serves.
Other transit programs also can enhance economic
development opportunities by providing access and
mobility to congested areas and major employment
or activity centers. DART will continue to work closely
with its member cities to coordinate transit services to
areas targeted for economic development.
Encourage initiatives to invest at or near transit
facilities
The Plan encourages transit-oriented land use and
economic development around transit facilities. The
2030 plan will add approximately 43 miles of rail
and nearly 100 miles of enhanced and rapid bus
corridors. Taking into consideration potential vision
corridors as well, there will be significant opportunities
to coordinate development and land use plans
throughout the Service Area. DART will continue to
cooperate and coordinate with member cities and
developers to foster these opportunities.
8.4 Planning ProcessEstablish a common vision for transportation
that is regionally accepted, progressively
implemented through a comprehensive system
plan, and periodically revisited
Chapter 8: Local and Regional Benefits
October 2006 76
The 2030 Transit System Plan includes a range
of projects and programs that will enhance the
overall regional transportation system. Chapter 7,
Implementation and Phasing, documents how the
recommendations will be progressively implemented
over time. As stated in Chapter 1, the Transit System
Plan will be updated on a regular basis to respond to
new information that may influence implementation
timeframes.
Develop and enhance coalitions with all
organizations that have a vested interest in
regional transportation issues
Within the member cities and the entire region are
numerous organizations that may be affected by the
plan. Throughout the public involvement process,
DART has sought to strengthen relationships and
coordinate with these organizations so that plan
recommendations are consistent with their vision
and responsive to their issues and concerns. These
organizations range from other transit agencies to
neighborhood groups. As the plan is refined and
implemented, these relationships will be become
even more important.
Develop a System Plan that provides a sound
basis for subsequent, more detailed planning
studies.
The 2030 Transit System Plan was developed through
a sound technical process that provides a solid basis
for future, more detailed work efforts. The plan
recognizes the importance of balancing the need
to identify competitive projects that can maximize
Federal and other non-DART funds with local and
regional economic development initiatives.
Furthermore, the plan is founded on a transparent
public involvement process. Public meetings, focus
area meetings, focus groups, member city meetings
and numerous briefings were held to explain the
process and findings and gather input. Public
meetings on the 2030 Transit System Plan sought to
strengthen the broad-based support for the plan. This
plan also recognizes the concerns that were voiced
by residents of the Cotton Belt corridor through north
Dallas. These issues and the framework by which
they will be addressed are discussed throughout the
plan. In this corridor, as well as all others, DART is
committed to developing a transit investment that
can be successfully integrated into the communities
that it serves by addressing potential impacts with
appropriate mitigation measures.
8.5 SummaryThe 2030 plan has mobility benefits related to
enhanced access to and through the DART Service
Area, reduced vehicle miles of travel and less
congestion delay. These mobility benefits translate
into fewer air quality emissions and an improved
quality of life. Coupled with targeted transit-oriented
development along the system, transit is helping to
change the nature of growth in the DART Service Area
to support a more sustainable future. Cost-effective
and affordable 2030 plan recommendations seek to
expand services in congested travel corridors and
connect to major activity centers and employment
corridors, while linking new communities to the
network.
In summary, the 2030 plan meets the objectives
of the guiding principles and presents a plan for
continuing to build on the successes established by
DART over the last two decades. This plan will enable
DART to continue to meet our mission of providing
mobility, improving the quality of life, and stimulating
economic development. More importantly, the 2030
Transit System Plan includes a range of projects and
programs to increase transit use, promote coordinated
land use and transit planning, and encourage a more
sustainable growth pattern.
DART is proud to be a partner in regional mobility and
excited about the prospects that this 2030 plan as
well as regional transit expansion into the entire DFW
region brings. These investments and services will
bring real benefits to our communities and improve
quality of life for generations to come.
Chapter 8: Local and Regional Benefits
A-1 October 2006
Appendix A - Related Resolutions
Appendix A - Summary of Member City Input
October 2006
October 2006 A-2
This page intentionally left blank.
Appendix A - Summary of Member City Input
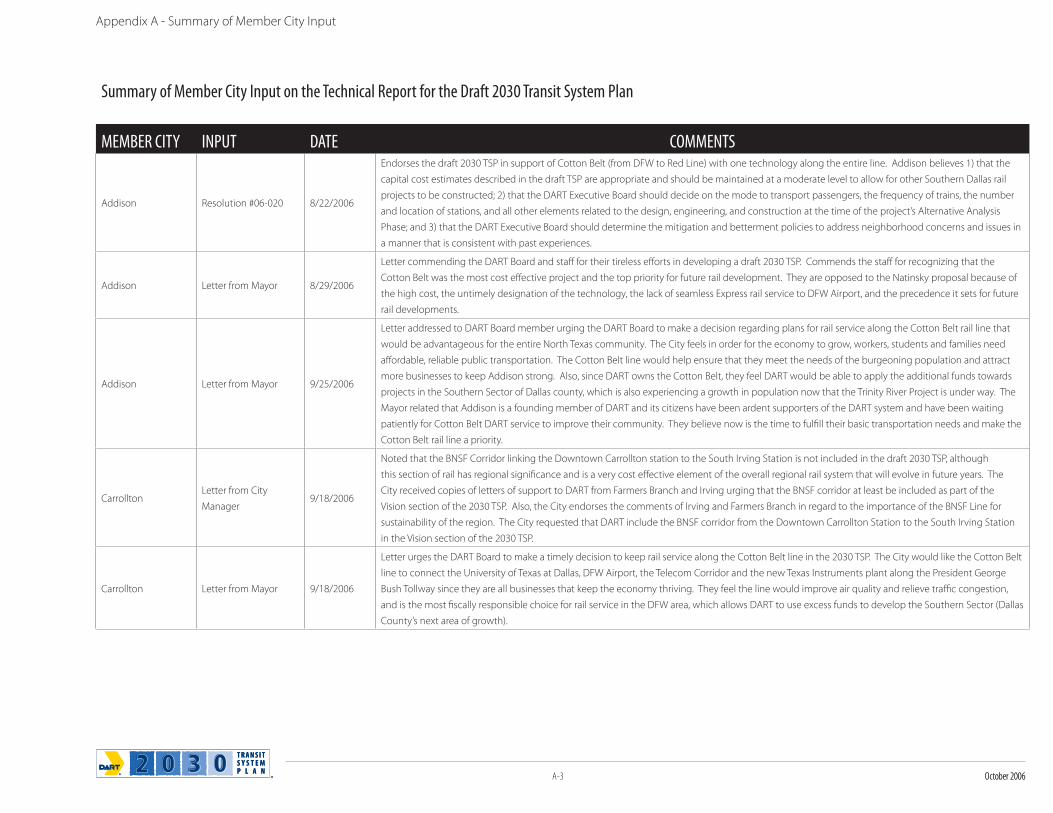
A-3 October 2006
Appendix A - Summary of Member City Input
Summary of Member City Input on the Technical Report for the Draft 2030 Transit System Plan
MEMBER CITY INPUT DATE COMMENTS
Addison Resolution #06-020 8/22/2006
Endorses the draft 2030 TSP in support of Cotton Belt (from DFW to Red Line) with one technology along the entire line. Addison believes 1) that the
capital cost estimates described in the draft TSP are appropriate and should be maintained at a moderate level to allow for other Southern Dallas rail
projects to be constructed; 2) that the DART Executive Board should decide on the mode to transport passengers, the frequency of trains, the number
and location of stations, and all other elements related to the design, engineering, and construction at the time of the project’s Alternative Analysis
Phase; and 3) that the DART Executive Board should determine the mitigation and betterment policies to address neighborhood concerns and issues in
a manner that is consistent with past experiences.
Addison Letter from Mayor 8/29/2006
Letter commending the DART Board and staff for their tireless efforts in developing a draft 2030 TSP. Commends the staff for recognizing that the
Cotton Belt was the most cost effective project and the top priority for future rail development. They are opposed to the Natinsky proposal because of
the high cost, the untimely designation of the technology, the lack of seamless Express rail service to DFW Airport, and the precedence it sets for future
rail developments.
Addison Letter from Mayor 9/25/2006
Letter addressed to DART Board member urging the DART Board to make a decision regarding plans for rail service along the Cotton Belt rail line that
would be advantageous for the entire North Texas community. The City feels in order for the economy to grow, workers, students and families need
affordable, reliable public transportation. The Cotton Belt line would help ensure that they meet the needs of the burgeoning population and attract
more businesses to keep Addison strong. Also, since DART owns the Cotton Belt, they feel DART would be able to apply the additional funds towards
projects in the Southern Sector of Dallas county, which is also experiencing a growth in population now that the Trinity River Project is under way. The
Mayor related that Addison is a founding member of DART and its citizens have been ardent supporters of the DART system and have been waiting
patiently for Cotton Belt DART service to improve their community. They believe now is the time to fulfill their basic transportation needs and make the
Cotton Belt rail line a priority.
CarrolltonLetter from City
Manager9/18/2006
Noted that the BNSF Corridor linking the Downtown Carrollton station to the South Irving Station is not included in the draft 2030 TSP, although
this section of rail has regional significance and is a very cost effective element of the overall regional rail system that will evolve in future years. The
City received copies of letters of support to DART from Farmers Branch and Irving urging that the BNSF corridor at least be included as part of the
Vision section of the 2030 TSP. Also, the City endorses the comments of Irving and Farmers Branch in regard to the importance of the BNSF Line for
sustainability of the region. The City requested that DART include the BNSF corridor from the Downtown Carrollton Station to the South Irving Station
in the Vision section of the 2030 TSP.
Carrollton Letter from Mayor 9/18/2006
Letter urges the DART Board to make a timely decision to keep rail service along the Cotton Belt line in the 2030 TSP. The City would like the Cotton Belt
line to connect the University of Texas at Dallas, DFW Airport, the Telecom Corridor and the new Texas Instruments plant along the President George
Bush Tollway since they are all businesses that keep the economy thriving. They feel the line would improve air quality and relieve traffic congestion,
and is the most fiscally responsible choice for rail service in the DFW area, which allows DART to use excess funds to develop the Southern Sector (Dallas
County’s next area of growth).
October 2006
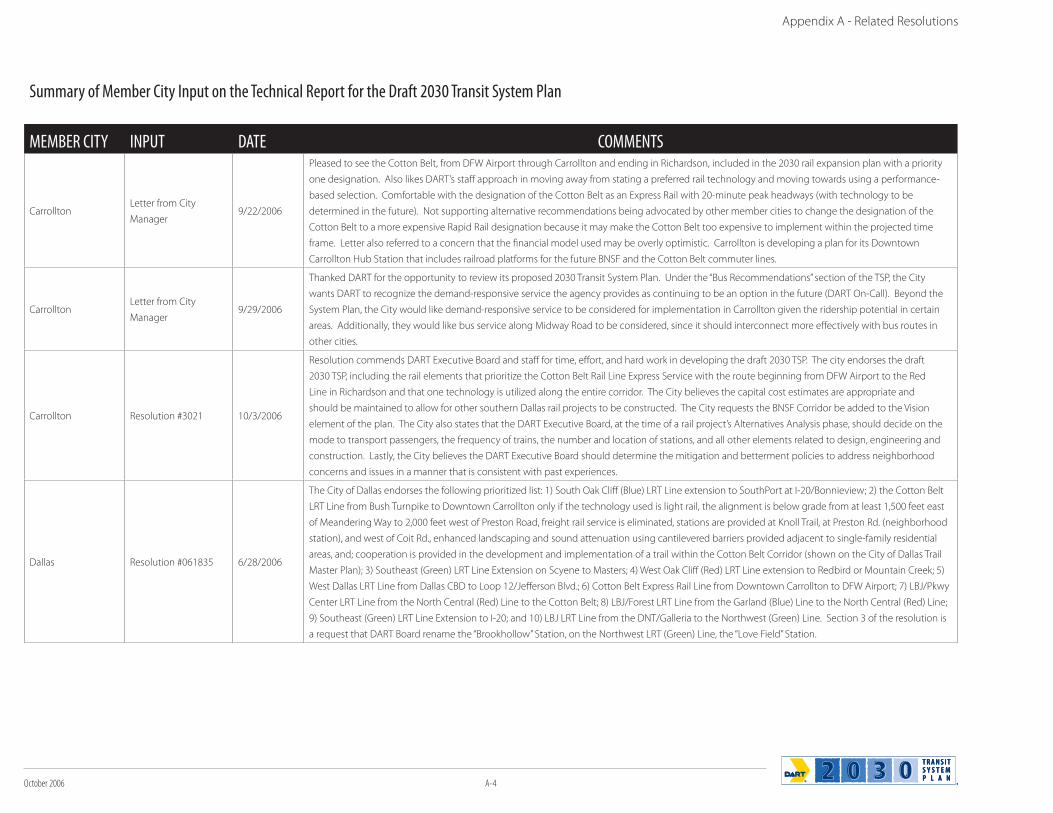
October 2006 A-4
Appendix A - Related Resolutions
Summary of Member City Input on the Technical Report for the Draft 2030 Transit System Plan
MEMBER CITY INPUT DATE COMMENTS
CarrolltonLetter from City
Manager9/22/2006
Pleased to see the Cotton Belt, from DFW Airport through Carrollton and ending in Richardson, included in the 2030 rail expansion plan with a priority
one designation. Also likes DART’s staff approach in moving away from stating a preferred rail technology and moving towards using a performance-
based selection. Comfortable with the designation of the Cotton Belt as an Express Rail with 20-minute peak headways (with technology to be
determined in the future). Not supporting alternative recommendations being advocated by other member cities to change the designation of the
Cotton Belt to a more expensive Rapid Rail designation because it may make the Cotton Belt too expensive to implement within the projected time
frame. Letter also referred to a concern that the financial model used may be overly optimistic. Carrollton is developing a plan for its Downtown
Carrollton Hub Station that includes railroad platforms for the future BNSF and the Cotton Belt commuter lines.
CarrolltonLetter from City
Manager9/29/2006
Thanked DART for the opportunity to review its proposed 2030 Transit System Plan. Under the “Bus Recommendations” section of the TSP, the City
wants DART to recognize the demand-responsive service the agency provides as continuing to be an option in the future (DART On-Call). Beyond the
System Plan, the City would like demand-responsive service to be considered for implementation in Carrollton given the ridership potential in certain
areas. Additionally, they would like bus service along Midway Road to be considered, since it should interconnect more effectively with bus routes in
other cities.
Carrollton Resolution #3021 10/3/2006
Resolution commends DART Executive Board and staff for time, effort, and hard work in developing the draft 2030 TSP. The city endorses the draft
2030 TSP, including the rail elements that prioritize the Cotton Belt Rail Line Express Service with the route beginning from DFW Airport to the Red
Line in Richardson and that one technology is utilized along the entire corridor. The City believes the capital cost estimates are appropriate and
should be maintained to allow for other southern Dallas rail projects to be constructed. The City requests the BNSF Corridor be added to the Vision
element of the plan. The City also states that the DART Executive Board, at the time of a rail project’s Alternatives Analysis phase, should decide on the
mode to transport passengers, the frequency of trains, the number and location of stations, and all other elements related to design, engineering and
construction. Lastly, the City believes the DART Executive Board should determine the mitigation and betterment policies to address neighborhood
concerns and issues in a manner that is consistent with past experiences.
Dallas Resolution #061835 6/28/2006
The City of Dallas endorses the following prioritized list: 1) South Oak Cliff (Blue) LRT Line extension to SouthPort at I-20/Bonnieview; 2) the Cotton Belt
LRT Line from Bush Turnpike to Downtown Carrollton only if the technology used is light rail, the alignment is below grade from at least 1,500 feet east
of Meandering Way to 2,000 feet west of Preston Road, freight rail service is eliminated, stations are provided at Knoll Trail, at Preston Rd. (neighborhood
station), and west of Coit Rd., enhanced landscaping and sound attenuation using cantilevered barriers provided adjacent to single-family residential
areas, and; cooperation is provided in the development and implementation of a trail within the Cotton Belt Corridor (shown on the City of Dallas Trail
Master Plan); 3) Southeast (Green) LRT Line Extension on Scyene to Masters; 4) West Oak Cliff (Red) LRT Line extension to Redbird or Mountain Creek; 5)
West Dallas LRT Line from Dallas CBD to Loop 12/Jefferson Blvd.; 6) Cotton Belt Express Rail Line from Downtown Carrollton to DFW Airport; 7) LBJ/Pkwy
Center LRT Line from the North Central (Red) Line to the Cotton Belt; 8) LBJ/Forest LRT Line from the Garland (Blue) Line to the North Central (Red) Line;
9) Southeast (Green) LRT Line Extension to I-20; and 10) LBJ LRT Line from the DNT/Galleria to the Northwest (Green) Line. Section 3 of the resolution is
a request that DART Board rename the “Brookhollow” Station, on the Northwest LRT (Green) Line, the “Love Field” Station.
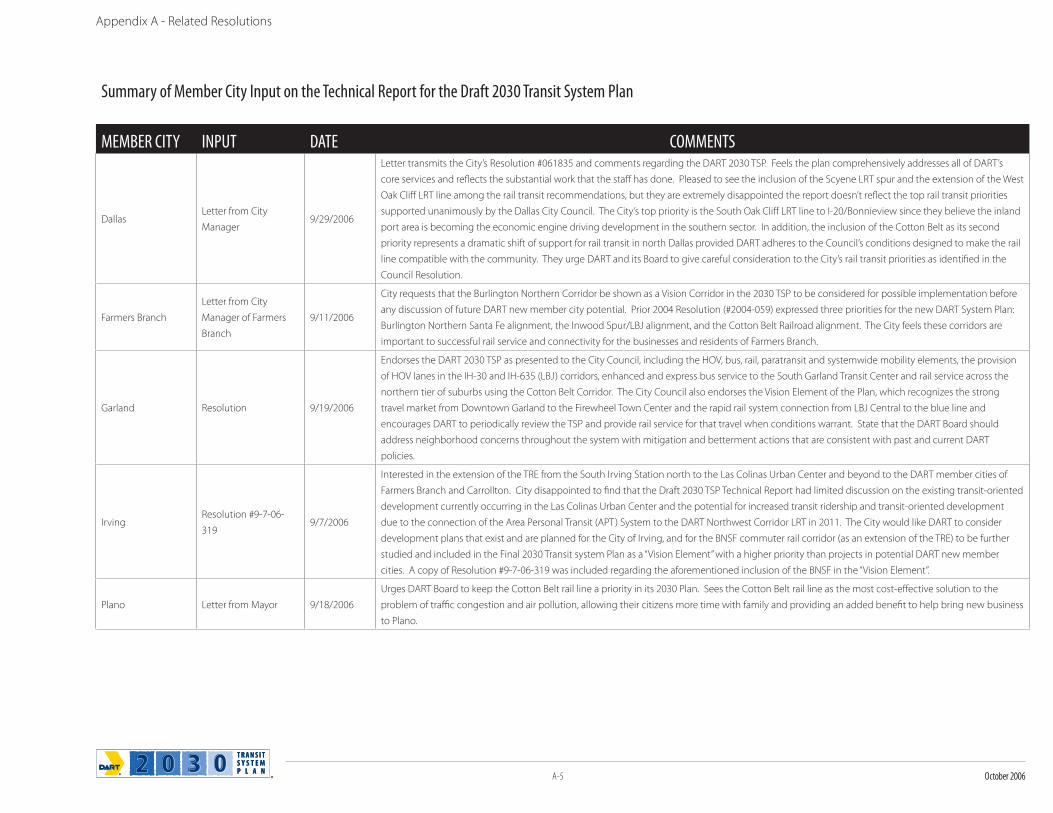
A-5 October 2006
Appendix A - Related Resolutions
Summary of Member City Input on the Technical Report for the Draft 2030 Transit System Plan
MEMBER CITY INPUT DATE COMMENTS
DallasLetter from City
Manager9/29/2006
Letter transmits the City’s Resolution #061835 and comments regarding the DART 2030 TSP. Feels the plan comprehensively addresses all of DART’s
core services and reflects the substantial work that the staff has done. Pleased to see the inclusion of the Scyene LRT spur and the extension of the West
Oak Cliff LRT line among the rail transit recommendations, but they are extremely disappointed the report doesn’t reflect the top rail transit priorities
supported unanimously by the Dallas City Council. The City’s top priority is the South Oak Cliff LRT line to I-20/Bonnieview since they believe the inland
port area is becoming the economic engine driving development in the southern sector. In addition, the inclusion of the Cotton Belt as its second
priority represents a dramatic shift of support for rail transit in north Dallas provided DART adheres to the Council’s conditions designed to make the rail
line compatible with the community. They urge DART and its Board to give careful consideration to the City’s rail transit priorities as identified in the
Council Resolution.
Farmers Branch
Letter from City
Manager of Farmers
Branch
9/11/2006
City requests that the Burlington Northern Corridor be shown as a Vision Corridor in the 2030 TSP to be considered for possible implementation before
any discussion of future DART new member city potential. Prior 2004 Resolution (#2004-059) expressed three priorities for the new DART System Plan:
Burlington Northern Santa Fe alignment, the Inwood Spur/LBJ alignment, and the Cotton Belt Railroad alignment. The City feels these corridors are
important to successful rail service and connectivity for the businesses and residents of Farmers Branch.
Garland Resolution 9/19/2006
Endorses the DART 2030 TSP as presented to the City Council, including the HOV, bus, rail, paratransit and systemwide mobility elements, the provision
of HOV lanes in the IH-30 and IH-635 (LBJ) corridors, enhanced and express bus service to the South Garland Transit Center and rail service across the
northern tier of suburbs using the Cotton Belt Corridor. The City Council also endorses the Vision Element of the Plan, which recognizes the strong
travel market from Downtown Garland to the Firewheel Town Center and the rapid rail system connection from LBJ Central to the blue line and
encourages DART to periodically review the TSP and provide rail service for that travel when conditions warrant. State that the DART Board should
address neighborhood concerns throughout the system with mitigation and betterment actions that are consistent with past and current DART
policies.
IrvingResolution #9-7-06-
3199/7/2006
Interested in the extension of the TRE from the South Irving Station north to the Las Colinas Urban Center and beyond to the DART member cities of
Farmers Branch and Carrollton. City disappointed to find that the Draft 2030 TSP Technical Report had limited discussion on the existing transit-oriented
development currently occurring in the Las Colinas Urban Center and the potential for increased transit ridership and transit-oriented development
due to the connection of the Area Personal Transit (APT) System to the DART Northwest Corridor LRT in 2011. The City would like DART to consider
development plans that exist and are planned for the City of Irving, and for the BNSF commuter rail corridor (as an extension of the TRE) to be further
studied and included in the Final 2030 Transit system Plan as a “Vision Element” with a higher priority than projects in potential DART new member
cities. A copy of Resolution #9-7-06-319 was included regarding the aforementioned inclusion of the BNSF in the “Vision Element”.
Plano Letter from Mayor 9/18/2006
Urges DART Board to keep the Cotton Belt rail line a priority in its 2030 Plan. Sees the Cotton Belt rail line as the most cost-effective solution to the
problem of traffic congestion and air pollution, allowing their citizens more time with family and providing an added benefit to help bring new business
to Plano.
October 2006
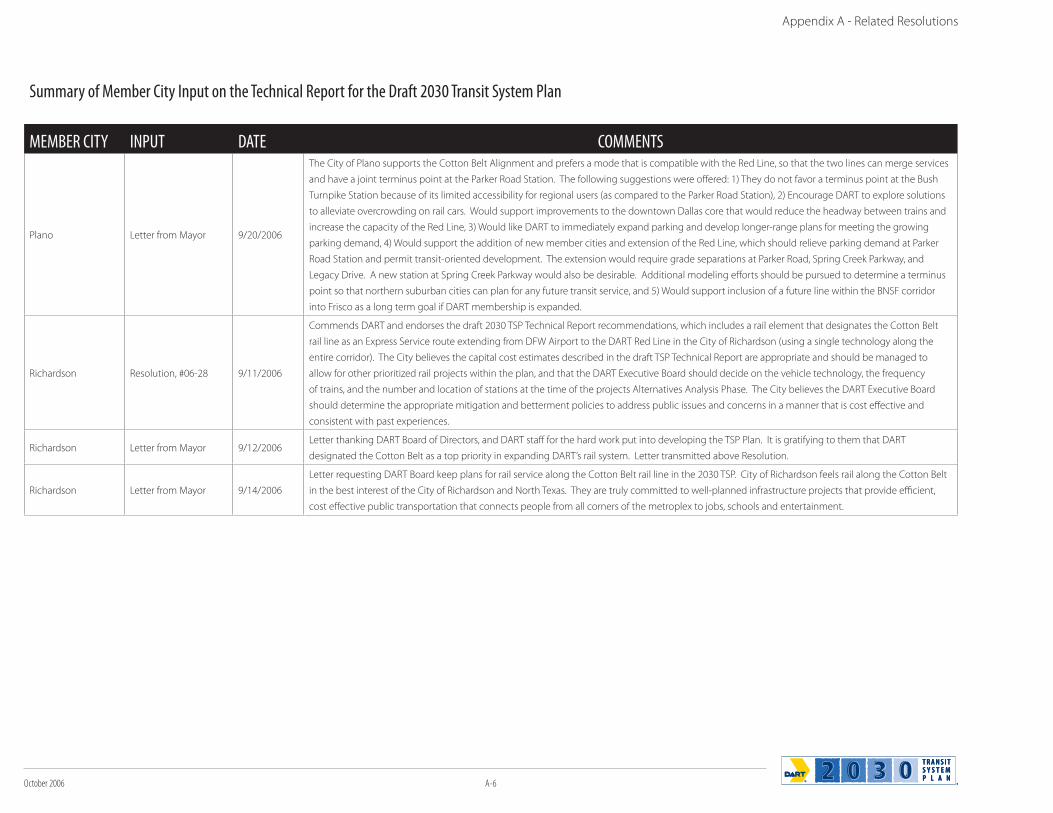
October 2006 A-6
Summary of Member City Input on the Technical Report for the Draft 2030 Transit System Plan
MEMBER CITY INPUT DATE COMMENTS
Plano Letter from Mayor 9/20/2006
The City of Plano supports the Cotton Belt Alignment and prefers a mode that is compatible with the Red Line, so that the two lines can merge services
and have a joint terminus point at the Parker Road Station. The following suggestions were offered: 1) They do not favor a terminus point at the Bush
Turnpike Station because of its limited accessibility for regional users (as compared to the Parker Road Station), 2) Encourage DART to explore solutions
to alleviate overcrowding on rail cars. Would support improvements to the downtown Dallas core that would reduce the headway between trains and
increase the capacity of the Red Line, 3) Would like DART to immediately expand parking and develop longer-range plans for meeting the growing
parking demand, 4) Would support the addition of new member cities and extension of the Red Line, which should relieve parking demand at Parker
Road Station and permit transit-oriented development. The extension would require grade separations at Parker Road, Spring Creek Parkway, and
Legacy Drive. A new station at Spring Creek Parkway would also be desirable. Additional modeling efforts should be pursued to determine a terminus
point so that northern suburban cities can plan for any future transit service, and 5) Would support inclusion of a future line within the BNSF corridor
into Frisco as a long term goal if DART membership is expanded.
Richardson Resolution, #06-28 9/11/2006
Commends DART and endorses the draft 2030 TSP Technical Report recommendations, which includes a rail element that designates the Cotton Belt
rail line as an Express Service route extending from DFW Airport to the DART Red Line in the City of Richardson (using a single technology along the
entire corridor). The City believes the capital cost estimates described in the draft TSP Technical Report are appropriate and should be managed to
allow for other prioritized rail projects within the plan, and that the DART Executive Board should decide on the vehicle technology, the frequency
of trains, and the number and location of stations at the time of the projects Alternatives Analysis Phase. The City believes the DART Executive Board
should determine the appropriate mitigation and betterment policies to address public issues and concerns in a manner that is cost effective and
consistent with past experiences.
Richardson Letter from Mayor 9/12/2006Letter thanking DART Board of Directors, and DART staff for the hard work put into developing the TSP Plan. It is gratifying to them that DART
designated the Cotton Belt as a top priority in expanding DART’s rail system. Letter transmitted above Resolution.
Richardson Letter from Mayor 9/14/2006
Letter requesting DART Board keep plans for rail service along the Cotton Belt rail line in the 2030 TSP. City of Richardson feels rail along the Cotton Belt
in the best interest of the City of Richardson and North Texas. They are truly committed to well-planned infrastructure projects that provide efficient,
cost effective public transportation that connects people from all corners of the metroplex to jobs, schools and entertainment.
Appendix A - Related Resolutions

A-7 October 2006
Appendix B - Summary of Public Comments
Appendix B - Summary of Public Comments
October 2006
October 2006 A-8
This page intentionally left blank.
Appendix B - Summary of Public Comments
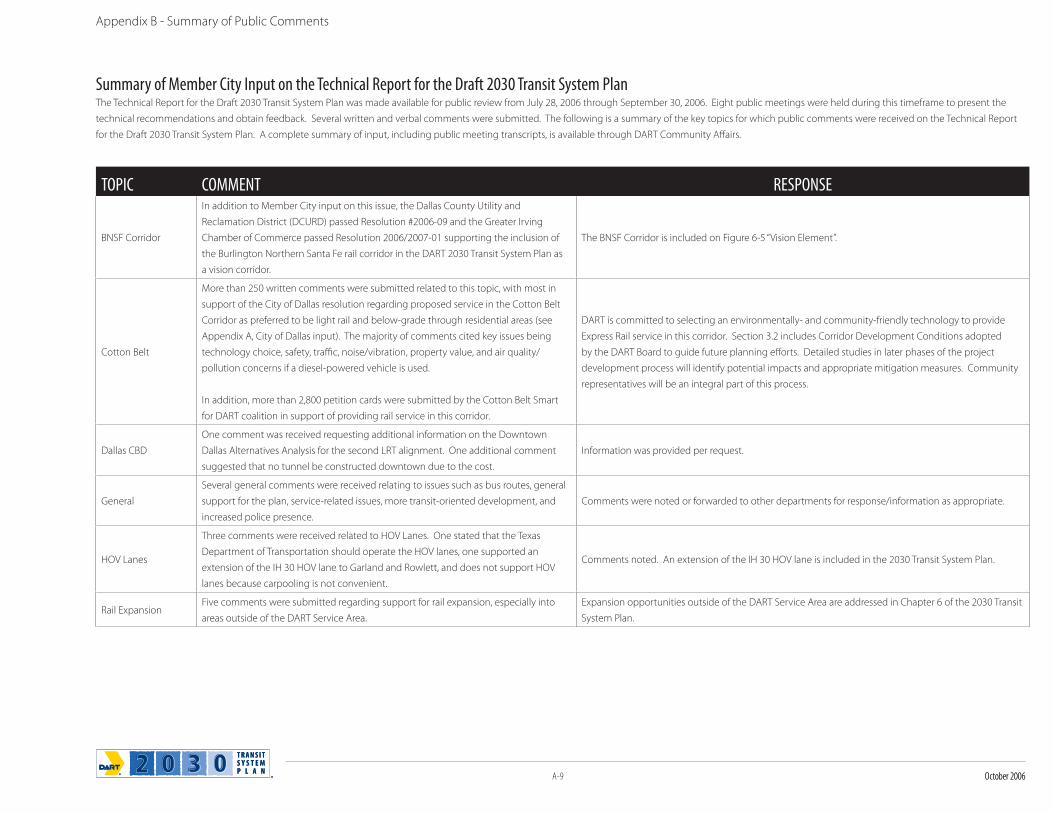
A-9 October 2006
TOPIC COMMENT RESPONSE
BNSF Corridor
In addition to Member City input on this issue, the Dallas County Utility and
Reclamation District (DCURD) passed Resolution #2006-09 and the Greater Irving
Chamber of Commerce passed Resolution 2006/2007-01 supporting the inclusion of
the Burlington Northern Santa Fe rail corridor in the DART 2030 Transit System Plan as
a vision corridor.
The BNSF Corridor is included on Figure 6-5 “Vision Element”.
Cotton Belt
More than 250 written comments were submitted related to this topic, with most in
support of the City of Dallas resolution regarding proposed service in the Cotton Belt
Corridor as preferred to be light rail and below-grade through residential areas (see
Appendix A, City of Dallas input). The majority of comments cited key issues being
technology choice, safety, traffic, noise/vibration, property value, and air quality/
pollution concerns if a diesel-powered vehicle is used.
In addition, more than 2,800 petition cards were submitted by the Cotton Belt Smart
for DART coalition in support of providing rail service in this corridor.
DART is committed to selecting an environmentally- and community-friendly technology to provide
Express Rail service in this corridor. Section 3.2 includes Corridor Development Conditions adopted
by the DART Board to guide future planning efforts. Detailed studies in later phases of the project
development process will identify potential impacts and appropriate mitigation measures. Community
representatives will be an integral part of this process.
Dallas CBD
One comment was received requesting additional information on the Downtown
Dallas Alternatives Analysis for the second LRT alignment. One additional comment
suggested that no tunnel be constructed downtown due to the cost.
Information was provided per request.
General
Several general comments were received relating to issues such as bus routes, general
support for the plan, service-related issues, more transit-oriented development, and
increased police presence.
Comments were noted or forwarded to other departments for response/information as appropriate.
HOV Lanes
Three comments were received related to HOV Lanes. One stated that the Texas
Department of Transportation should operate the HOV lanes, one supported an
extension of the IH 30 HOV lane to Garland and Rowlett, and does not support HOV
lanes because carpooling is not convenient.
Comments noted. An extension of the IH 30 HOV lane is included in the 2030 Transit System Plan.
Rail ExpansionFive comments were submitted regarding support for rail expansion, especially into
areas outside of the DART Service Area.
Expansion opportunities outside of the DART Service Area are addressed in Chapter 6 of the 2030 Transit
System Plan.
Appendix B - Summary of Public Comments
Summary of Member City Input on the Technical Report for the Draft 2030 Transit System PlanThe Technical Report for the Draft 2030 Transit System Plan was made available for public review from July 28, 2006 through September 30, 2006. Eight public meetings were held during this timeframe to present the
technical recommendations and obtain feedback. Several written and verbal comments were submitted. The following is a summary of the key topics for which public comments were received on the Technical Report
for the Draft 2030 Transit System Plan. A complete summary of input, including public meeting transcripts, is available through DART Community Affairs.
October 2006
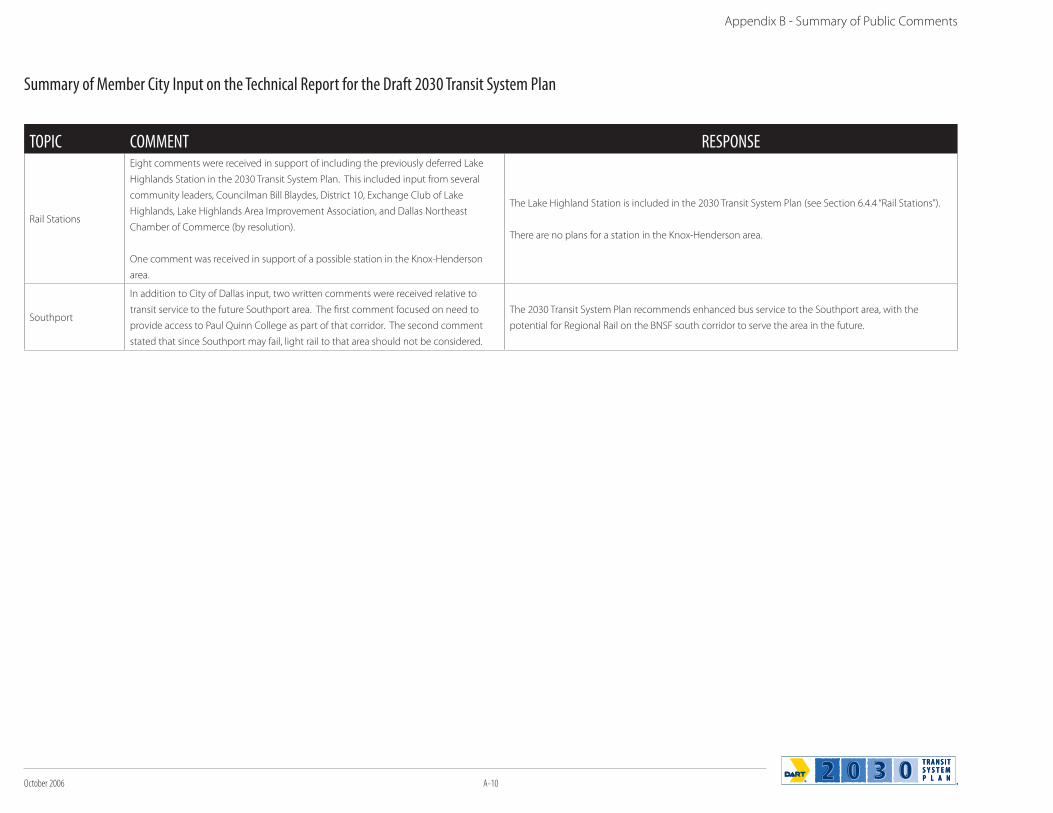
October 2006 A-10
TOPIC COMMENT RESPONSE
Rail Stations
Eight comments were received in support of including the previously deferred Lake
Highlands Station in the 2030 Transit System Plan. This included input from several
community leaders, Councilman Bill Blaydes, District 10, Exchange Club of Lake
Highlands, Lake Highlands Area Improvement Association, and Dallas Northeast
Chamber of Commerce (by resolution).
One comment was received in support of a possible station in the Knox-Henderson
area.
The Lake Highland Station is included in the 2030 Transit System Plan (see Section 6.4.4 “Rail Stations”).
There are no plans for a station in the Knox-Henderson area.
Southport
In addition to City of Dallas input, two written comments were received relative to
transit service to the future Southport area. The first comment focused on need to
provide access to Paul Quinn College as part of that corridor. The second comment
stated that since Southport may fail, light rail to that area should not be considered.
The 2030 Transit System Plan recommends enhanced bus service to the Southport area, with the
potential for Regional Rail on the BNSF south corridor to serve the area in the future.
Appendix B - Summary of Public Comments
Summary of Member City Input on the Technical Report for the Draft 2030 Transit System Plan