Embed Size (px)
Citation preview
NORGES TEKNISK-NATURVITENSKAPELIGE UNIVERSITET
FAKULTET FOR INFORMASJONSTEKNOLOGI, MATEMATIKK OG ELEKTROTEKNIKK
HOVEDOPPGAVE Kandidatens navn: Coralie Albareil Fag: Elektronikk Oppgavens tittel (norsk): Oppgavens tittel (engelsk): Optimization of the transmission network North East -Bouygues
Telecom Oppgavens tittel (fransk): Optimisation du réseau de transmission Bouygues Telecom Nord Est Oppgavens tekst: The transmission network of a mobile operator is composed of several transmission sites, such as BTS, BSC and MSC. It is necessary to continually assure the connectivity between the different sites; that is the job of the transmission engineer in charge of the network optimization. Some events, such as the leaving of an existing site, a forest disturbing an electromagnetic wave or the increase of the capacity, can cut the connectivity between the different sites and consequently isolate some BTS from the network. This thesis should describe the process used when we are going to change the architecture of the transmission network. It shall give guidelines when to add or delete a new link: how to find the right choice of new architecture, how to configure the link (choice of the material, modulation, bit rate, frequency, antennas’ diameter...). Some special guidelines about the evolution of a site from a BTS to a nodal site shall also be defined. Moreover this thesis should also explain some other challenges a transmission engineer has to face.
Oppgaven gitt: 05.09.2006 Besvarelsen leveres innen: 13.03.2006 Besvarelsen levert: Utført ved: Institutt for elektronikk og telekommunikasjon NTNU, og
Bouygues Telecom, Signals and Images Laboratory Veiledere: Jocelyn Chanussot
Trondheim, 2006
Ralf Müller faglærer
Coralie Albareil – February 2006 Optimization of the transmission network
2
Contents Thanks ....................................................................................................................................... 4 Introduction .............................................................................................................................. 5 1 PART ONE: THE TRANSMISSION NETWORK........................................................... 6
1.1 Technical background ................................................................................................ 6 1.1.1 The GSM network.............................................................................................. 6
1.1.1.1 Architecture of a GSM network ..................................................................... 6 1.1.1.2 The transmission part of a GSM network ...................................................... 9
1.1.2 Electromagnetic waves....................................................................................... 9 1.1.2.1 Fresnel’s area.................................................................................................. 9 1.1.2.2 Modulation ................................................................................................... 12 1.1.2.3 The link budget............................................................................................. 14 1.1.2.4 The Effective Margin ................................................................................... 17
1.2 The transmission network of Bouygues Telecom .................................................... 17 1.2.1 The several kind of equipments ....................................................................... 17
1.2.1.1 Wireless systems – radio beams................................................................... 17 1.2.1.2 Wired lines ................................................................................................... 18 1.2.1.3 Coaxial lines or ultra high frequencies cable ............................................... 18 1.2.1.4 Optical fiber.................................................................................................. 18
1.2.2 The concept of site ........................................................................................... 18 1.2.3 Frequency bandwidth for Bouygues Telecom radio beams ............................. 19
1.2.3.1 Priority channels........................................................................................... 19 1.2.3.2 Preferential channels .................................................................................... 19
2 PART TWO: OPTIMIZATION OF THE TRANSMISSION NETWORK .................... 20 2.1 Introduction about optimization ............................................................................... 20 2.2 The external reasons................................................................................................. 20
2.2.1 Leaving of a site because of renter’s issues ..................................................... 20 2.2.2 Other renters’ issues ......................................................................................... 21 2.2.3 Some problems in an existing link ................................................................... 21 2.2.4 The replacement of an existing material .......................................................... 22 2.2.5 The increase of the traffic................................................................................. 22
2.3 The process to make the architecture evolve ........................................................... 22 2.3.1 Determination of the distant site ...................................................................... 24 2.3.2 The check of the real line of sight .................................................................... 25 2.3.3 The dimensioning of the radio beam................................................................ 26
2.3.3.1 Choice of the material .................................................................................. 27 2.3.3.2 Determination of the rain attenuation........................................................... 27 2.3.3.3 Determination of the frequency, the antennas.............................................. 28
2.3.4 The writing of the Expression de Besoin (EB) ................................................ 29 2.3.5 The update of the maps (IDU + MIC connectors) ........................................... 30 2.3.6 The configuration of the link and the order of the equipment ......................... 30
2.4 A practical example: the case Bréhain bibond ......................................................... 31 2.4.1 Request: ............................................................................................................ 31 2.4.2 Analyze of the problem:................................................................................... 31 2.4.3 Analyze of the different solutions: ................................................................... 32
2.4.3.1 First possible solution: a link to a nodal site, such as a DN or a BSC: ........ 32
Coralie Albareil – February 2006 Optimization of the transmission network
3
2.4.3.2 Second possible solution: the connection to another BTS ........................... 32 2.4.3.3 Third solution: a new organization of the area............................................. 32
2.4.4 Choice of the solution: ..................................................................................... 33 2.5 The problems we can meet during the optimization process ................................... 33
2.5.1 The conformity between a theoretical work and the reality............................. 34 2.5.2 The first dimensioning of equipment with tables............................................. 34 2.5.3 The coordination between several projects in the same area ........................... 35
3 PART THREE: OTHER PROJECTS AND WORKS ..................................................... 36 3.1 Evolution of the transmission network in the case of nodal sites DN...................... 36
3.1.1 Distribution Node DN ...................................................................................... 36 3.1.1.1 Why do we need some DN?......................................................................... 36 3.1.1.2 The different categories of DN according to Bouygues Telecom................ 37
3.1.2 Need of new DN............................................................................................... 38 3.1.2.1 Problem with renters >> leaving of a site .................................................... 38 3.1.2.2 Increase of the 2G traffic.............................................................................. 38 3.1.2.3 Introduction of new technologies such as EDGE or UMTS ........................ 38 3.1.2.4 The coverage of a white area........................................................................ 38
3.1.3 My actions and objectives ................................................................................ 39 3.1.4 Special steps when dealing with a new DN ..................................................... 39
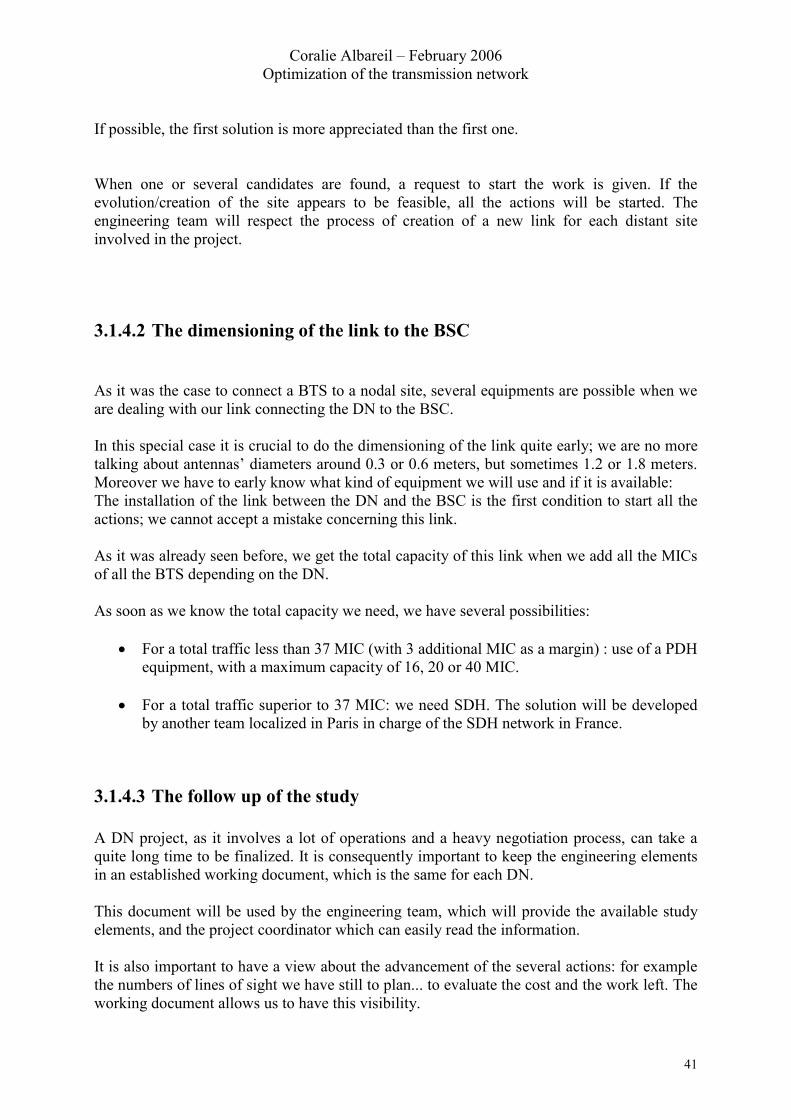
3.1.4.1 The choice of a – or several - candidates ..................................................... 39 3.1.4.2 The dimensioning of the link to the BSC..................................................... 41 3.1.4.3 The follow up of the study ........................................................................... 41
3.1.5 Practical example: Roubaix Ypres 2 ................................................................ 42 3.1.5.1 Request ......................................................................................................... 42 3.1.5.2 Analyze of the problem ................................................................................ 42 3.1.5.3 Analyze of the different solutions ................................................................ 43 3.1.5.4 Choice of the solution: ................................................................................. 49 3.1.5.5 The follow up of the study ........................................................................... 50
3.2 Update of the maps (IDU + MIC connectors).......................................................... 53 3.2.1 Composition of a link....................................................................................... 53 3.2.2 The representation of the shelters..................................................................... 54
3.2.2.1 Representation of the IDU............................................................................ 54 3.2.2.2 Representation of the MIC connectors......................................................... 54
3.2.3 Example: DN T49616, Villeneuve d’Ascq ...................................................... 54 3.2.3.1 Request ......................................................................................................... 55 3.2.3.2 Solution ........................................................................................................ 55
3.3 The anticipation of problems in the transmission network ...................................... 58 3.3.1 The building of wind turbines .......................................................................... 58 3.3.2 The use of a site by several operators .............................................................. 58
4 PART FOUR: ASSESSMENT OF MY MASTER THESIS ........................................... 59 4.1 Assessment of the accomplished work..................................................................... 59
4.1.1 Every times some new objectives to deal with ................................................ 59 4.1.2 Results get during my training period .............................................................. 59
4.1.2.1 Regular tasks ................................................................................................ 59 4.1.2.2 Involvement in special projects.................................................................... 60
4.1.3 Assessment of my work ................................................................................... 60 4.2 Teamwork in a company.......................................................................................... 61
Conclusion............................................................................................................................... 62 Annexes ................................................................................................................................... 64
Coralie Albareil – February 2006 Optimization of the transmission network
4
Thanks I really would like to thank all the people I had to work with for these 7 months:
� Denis CLEMENT, responsible for the engineer team Bouygues Telecom North East, and supervisor of my master thesis, who allowed me to do my master thesis in this team and who trusted me for 7 months.
� Norbert RAYMOND, which was the supervisor of the first part of my master thesis
and who welcomed me in the company.
� The transmitter team : André DEBRINCAT, Claude RITZ, Christian CHRASTEK, Sébastien TIERCE, Bruno BEHR, Eric WEIBEL, who gave a lot of their time to advise me.
� All the other people I worked with or who helped me.
Coralie Albareil – February 2006 Optimization of the transmission network
5
Introduction
My studies in the Department of Telecommunications at Institut National Polytechnique de Grenoble (INPG) in France and my 4th year as a student at NTNU in Norway give me the desire to be more specialized in mobile network domain. Moreover, as the writing of a master thesis is the last step before getting a job, it was important for me to do a practical work at the end of my study period.
That’s why I did not hesitate when I got the opportunity to do my master thesis at the French mobile operator Bouygues Telecom, from the 5th of September 2005 to the 7th of April 2006. For 7 months I was a part of the North East engineer team, and was more precisely in charge of Bouygues Telecom’s transmission network (North East area).
This paper describes the different activities I had to deal with during my master
thesis. In order to define the context of my master thesis, the first part gives some technical background and introduces Bouygues Telecom’s transmission network. Afterwards, the process of optimization, that I had continually to follow, will be described. The following part will explain some additional projects and works I had to deal with. As much as possible some practical examples are going to be explained. To sum up an assessment of my master thesis will be developed.
Coralie Albareil – February 2006 Optimization of the transmission network
6
1 PART ONE: THE TRANSMISSION NETWORK
1.1 Technical background
1.1.1 The GSM network
1.1.1.1 Architecture of a GSM network
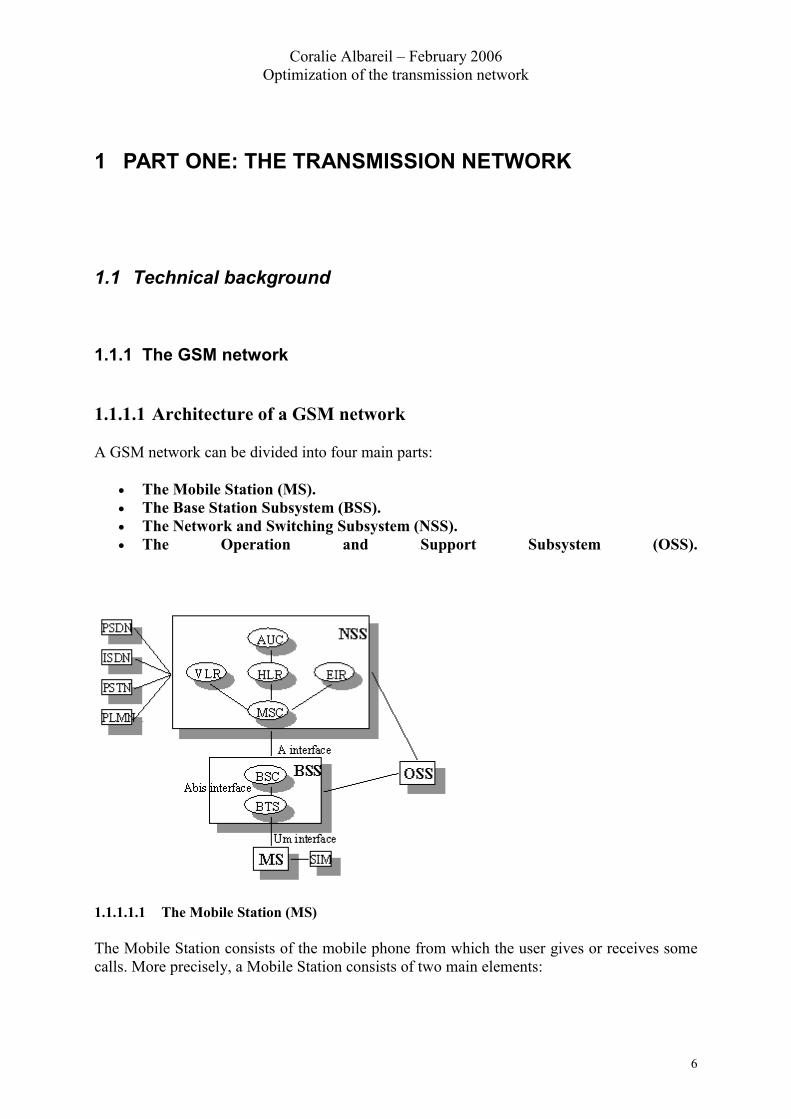
A GSM network can be divided into four main parts:
� The Mobile Station (MS). � The Base Station Subsystem (BSS). � The Network and Switching Subsystem (NSS). � The Operation and Support Subsystem (OSS).
1.1.1.1.1 The Mobile Station (MS)
The Mobile Station consists of the mobile phone from which the user gives or receives some calls. More precisely, a Mobile Station consists of two main elements:
Coralie Albareil – February 2006 Optimization of the transmission network
7
� Subscriber Identity Module (SIM) which is protected by a four-digit Personal Identification Number (PIN). In order to identify the subscriber to the system, the SIM card contains amongst others a unique International Mobile Subscriber Identity (IMSI). User mobility is provided through mapping the subscriber to the SIM card rather than the terminal as we done in past cellular systems.
� Mobile equipment/terminal (ME)
1.1.1.1.2 The Base Station Subsystem (BSS)
The BSS provides the interface between the ME and the NSS. It is in charge of the transmission and reception. It may be divided into two parts:
� Base Transceiver Station (BTS) or Base Station: it maps to transceivers and antennas used in each cell of the network. It is usually placed in the center of a cell. Its transmitting power defines the size of a cell. Each BTS has between 1-16 transceivers depending on the density of users in the cell.
� Base Station Controller (BSC): It controls a group of BTSs and manages their radio resources. A BSC is principally in charge of handoffs, frequency hopping, exchange functions and power control over each managed BTSs.
1.1.1.1.3 The Network and Switching Subsystem (NSS)
Its main role is to manage the communications between the mobile users and other users, such as mobile users, ISDN users, fixed telephony users, etc. It also includes data bases needed in order to store information about the subscribers and to manage their mobility. The different components of the NSS are described below:
� MSC: the central component of the NSS. The MSC performs the switching functions of the network. It also provides connection to other networks.
Coralie Albareil – February 2006 Optimization of the transmission network
8
� GMSC: A gateway that interconnects two networks: the cellular network and the PSTN. It is in charge of routing calls from the fixed network towards a GSM user. The GMSC is often implemented in the same machines as the MSC.
� HLR: The HLR stores information of the subscribers belonging to the coverage area of a MSC; it also stores the current location of these subscribers and the services to which they have access.
� VLR: contains information from a subscriber's HLR necessary to provide the subscribed services to visiting users. When a subscriber enters the covering area of a new MSC, the VLR associated to this MSC will request information about the new subscriber to its corresponding HLR. The VLR will then have enough data to assure the subscribed services without needing to ask the HLR each time a communication is established. The VLR is always implemented together with a MSC; thus, the area under control of the MSC is also the area under control of the VLR.
� Authentication Center (AuC): It serves security purposes; it provides the parameters needed for authentication and encryption functions. These parameters allow verification of the subscriber's identity.
� Equipment Identity Register (EIR): EIR stores security-sensitive information about the mobile equipments. It maintains a list of all valid terminals as identified by their International Mobile Equipment Identity (IMEI). The EIR allows then to forbid calls from stolen or unauthorized terminals (e.g, a terminal which does not respect the specifications concerning the output RF power)
� GSM Interworking Unit (GIWU): The GIWU provides an interface to various networks for data communications. During these communications, the transmission of speech and data can be alternated.
1.1.1.1.4 The Operation and Support Subsystem (OSS)
It is connected to components of the NSS and the BSC, in order to control and monitor the GSM system. It is also in charge of controlling the traffic load of the BSS. It must be noted that as the number of BSS increases with the scaling of the subscriber population some of the maintenance tasks are transferred to the BTS, allowing savings in the cost of ownership of the system.
Coralie Albareil – February 2006 Optimization of the transmission network
9
1.1.1.2 The transmission part of a GSM network 1.1.1.2.1 The distinction between radio and transmission engineering The transmission part of a GSM network deals with the connectivity between the different elements of the network. It means 2 kinds of links:
� the Abis link between the BSC and the BTS � the A link between the BSC and the MSC.
We must not confuse transmission engineering with radio engineering which deals with the links between the MS and the assigned BTS. 1.1.1.2.2 The capillary and the backbone networks In transmission terms, we distinguish the capillary and the backbone transmission networks. The backbone network typically refers to the high capacity communication facilities that connect primary nodes; it means in the GSM case the connection between the BSS and the NSS parts. The capillary network is composed of all the A bis links.
1.1.2 Electromagnetic waves As we will see, most of the transmission sites are linked by the way of an electromagnetic wave. The 2 most important points we have to be aware when dealing with such link are the need to have a good visibility between the 2 sites to not be disturbed by any obstacles and the need to receive an adequate power. In addition to these points, the concept of modulation will also be introduced.
1.1.2.1 Fresnel’s area 1.1.2.1.1 K coefficient The real radio electric ray does not follow a straight line from the transmitter to the receiver. The real way of the ray is dependent on the refractive index of the earth. This phenomenon is taken into account by the k coefficient, which is the ratio between the apparent ray and the real ray. When using the apparent ray, we can draw it as a line from the transmitter to the receiver.
Coralie Albareil – February 2006 Optimization of the transmission network
10
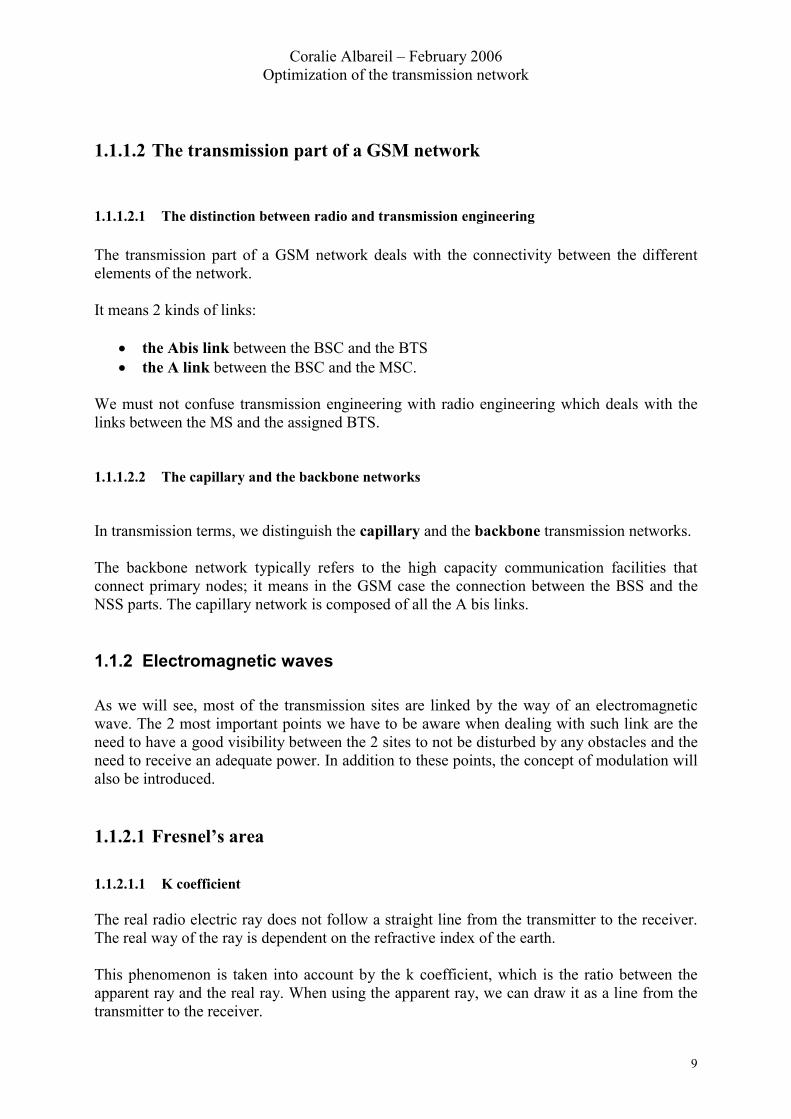
In the worst case, i.e. k>1 the real way is rounded downwards. The following figure shows the real rays in function of K:
d 1 d 2d
Terre vraie (k =1)
k = 2/3
k = 1
k = 4/3
Trajets radioélectriques vrais
Em
Réc
Translation: Terre vraie = real Earth Trajets radioélectriques vrais: real radio electric ways
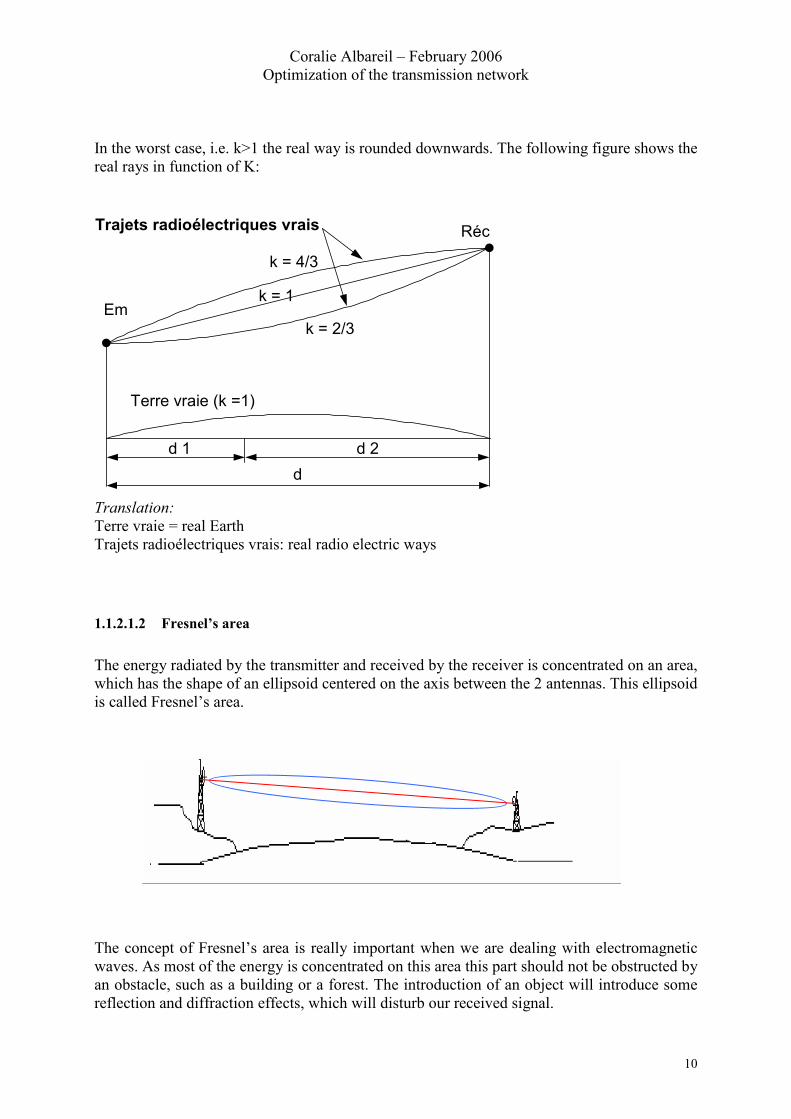
1.1.2.1.2 Fresnel’s area The energy radiated by the transmitter and received by the receiver is concentrated on an area, which has the shape of an ellipsoid centered on the axis between the 2 antennas. This ellipsoid is called Fresnel’s area.
The concept of Fresnel’s area is really important when we are dealing with electromagnetic waves. As most of the energy is concentrated on this area this part should not be obstructed by an obstacle, such as a building or a forest. The introduction of an object will introduce some reflection and diffraction effects, which will disturb our received signal.
Coralie Albareil – February 2006 Optimization of the transmission network
11
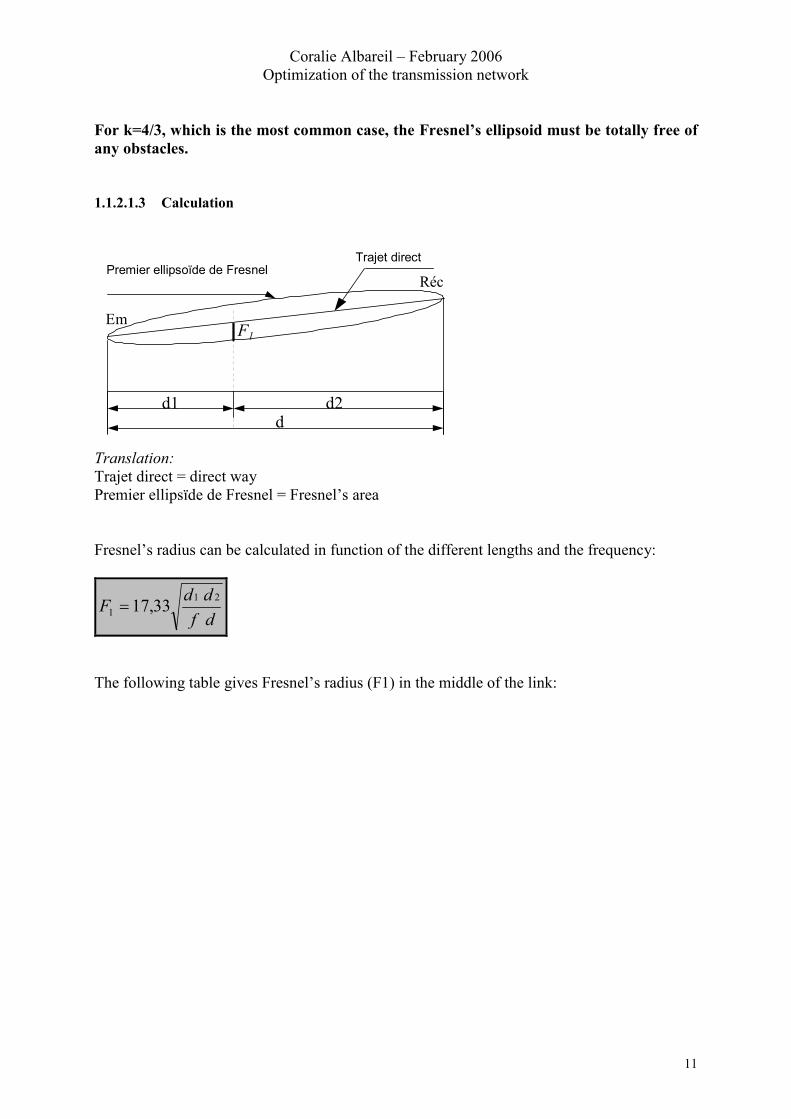
For k=4/3, which is the most common case, the Fresnel’s ellipsoid must be totally free of any obstacles. 1.1.2.1.3 Calculation
Réc
Em
d1 d2d
F1
Premier ellipsoïde de FresnelTrajet direct
Translation: Trajet direct = direct way Premier ellipsïde de Fresnel = Fresnel’s area Fresnel’s radius can be calculated in function of the different lengths and the frequency:
dfddF 21
1 33,17�
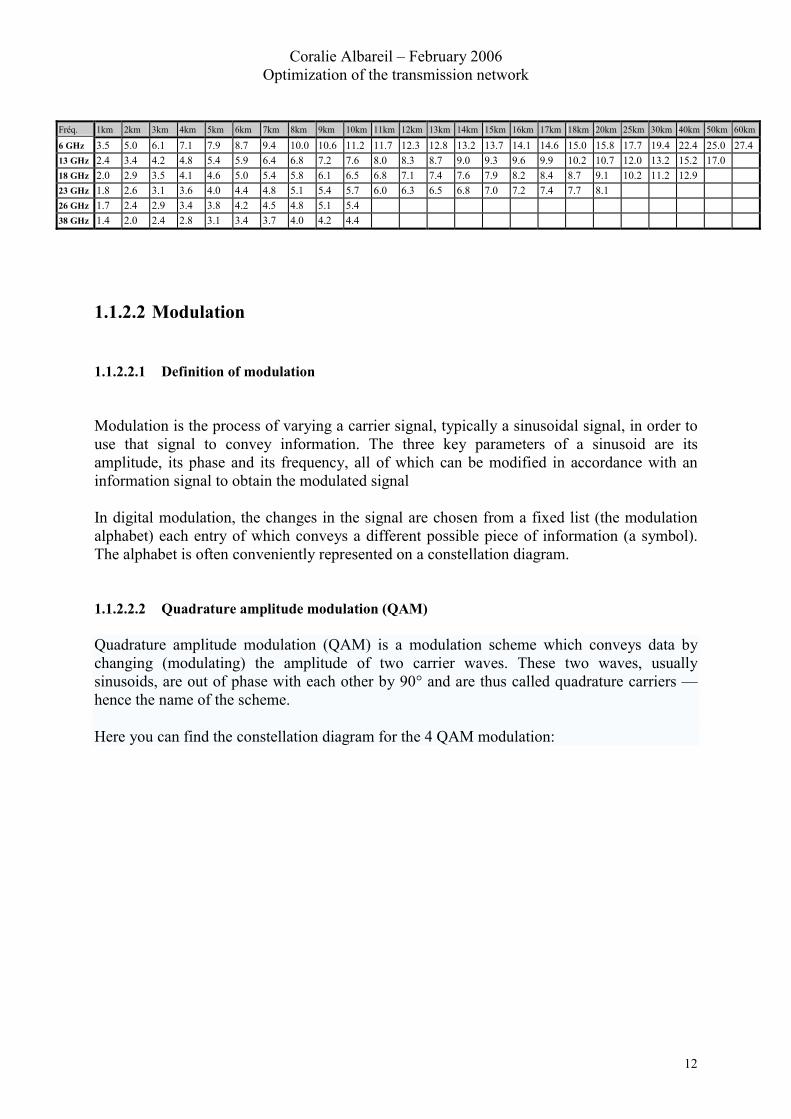
The following table gives Fresnel’s radius (F1) in the middle of the link:
Coralie Albareil – February 2006 Optimization of the transmission network
12
Fréq. 1km 2km 3km 4km 5km 6km 7km 8km 9km 10km 11km 12km 13km 14km 15km 16km 17km 18km 20km 25km 30km 40km 50km 60km
6 GHz 3.5 5.0 6.1 7.1 7.9 8.7 9.4 10.0 10.6 11.2 11.7 12.3 12.8 13.2 13.7 14.1 14.6 15.0 15.8 17.7 19.4 22.4 25.0 27.4 13 GHz 2.4 3.4 4.2 4.8 5.4 5.9 6.4 6.8 7.2 7.6 8.0 8.3 8.7 9.0 9.3 9.6 9.9 10.2 10.7 12.0 13.2 15.2 17.0 18 GHz 2.0 2.9 3.5 4.1 4.6 5.0 5.4 5.8 6.1 6.5 6.8 7.1 7.4 7.6 7.9 8.2 8.4 8.7 9.1 10.2 11.2 12.9 23 GHz 1.8 2.6 3.1 3.6 4.0 4.4 4.8 5.1 5.4 5.7 6.0 6.3 6.5 6.8 7.0 7.2 7.4 7.7 8.1 26 GHz 1.7 2.4 2.9 3.4 3.8 4.2 4.5 4.8 5.1 5.4 38 GHz 1.4 2.0 2.4 2.8 3.1 3.4 3.7 4.0 4.2 4.4
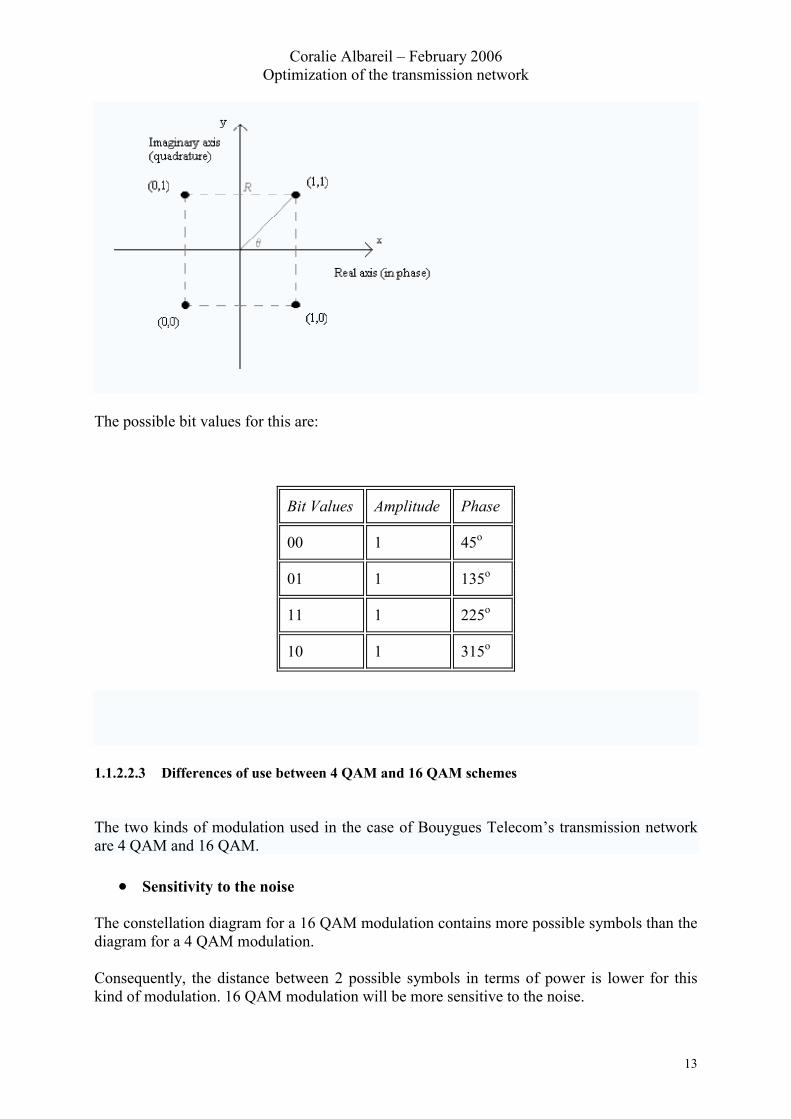
1.1.2.2 Modulation 1.1.2.2.1 Definition of modulation Modulation is the process of varying a carrier signal, typically a sinusoidal signal, in order to use that signal to convey information. The three key parameters of a sinusoid are its amplitude, its phase and its frequency, all of which can be modified in accordance with an information signal to obtain the modulated signal In digital modulation, the changes in the signal are chosen from a fixed list (the modulation alphabet) each entry of which conveys a different possible piece of information (a symbol). The alphabet is often conveniently represented on a constellation diagram. 1.1.2.2.2 Quadrature amplitude modulation (QAM)
Quadrature amplitude modulation (QAM) is a modulation scheme which conveys data by changing (modulating) the amplitude of two carrier waves. These two waves, usually sinusoids, are out of phase with each other by 90° and are thus called quadrature carriers — hence the name of the scheme.
Here you can find the constellation diagram for the 4 QAM modulation:
Coralie Albareil – February 2006 Optimization of the transmission network
13
The possible bit values for this are:
Bit Values Amplitude Phase
00 1 45o
01 1 135o
11 1 225o
10 1 315o
1.1.2.2.3 Differences of use between 4 QAM and 16 QAM schemes
The two kinds of modulation used in the case of Bouygues Telecom’s transmission network are 4 QAM and 16 QAM.
� Sensitivity to the noise The constellation diagram for a 16 QAM modulation contains more possible symbols than the diagram for a 4 QAM modulation. Consequently, the distance between 2 possible symbols in terms of power is lower for this kind of modulation. 16 QAM modulation will be more sensitive to the noise.
Coralie Albareil – February 2006 Optimization of the transmission network
14
� Bandwidth’s efficiency
In the case of a 4QAM modulation, a symbol is composed of 2 bits, in comparison with 4 bits for a 16QAM modulation. When we transmit a symbol, we transmit 2 much more information. The bandwidth’s efficiency is better.
1.1.2.3 The link budget The following section describes the way of calculating our link budget, when we are dealing with an electromagnetic wave. We assume in this part that we have no interferences with the other electromagnetic waves. 1.1.2.3.1 The Equivalent Isotropically Radiated Power (EIRP) In the transmitter’s side, some gains and losses can be added to the initial power sent by the transmitter antenna. That’s why we introduce the concept of Equivalent Isotropically Power (EIRP). This power can be calculated by the following calculation:
EIRP = Ptransmitter + G – Lcable – Ltransmitter with:
Ptransmitter: transmitted power by the transmitter antenna A (before any kind of amplification)
G : gain of the transmitter antenna Lcables: Cables losses
Ltransmitter : Transmitter attenuator
The EIRP is not the power which will be received by the receiver antenna; we have to take into account the path losses. 1.1.2.3.2 Path losses
� Free space losses This kind of losses increases with the distance and the wavelength.
Coralie Albareil – February 2006 Optimization of the transmission network
15
FSL(dB) = 20.log(4�d/�)
� Atmospheric fading (Al) Two phenomena lead to atmospheric fading: the first one is due to dry water and the second one to water vapor. Studies have shown that this fading can be approximated by the following calculations:
- Frequency around 23 GHz Al = 0,19.d(km) - Frequency around 38 GHz Al = 0,12.d(km)
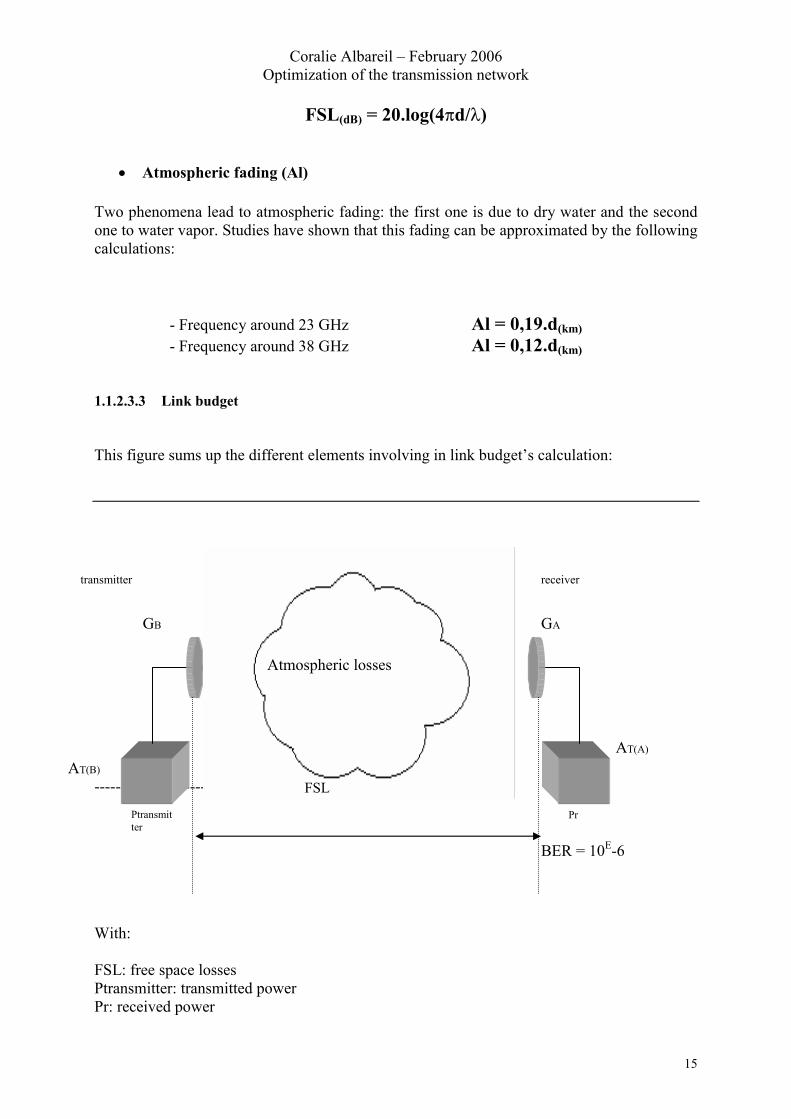
1.1.2.3.3 Link budget This figure sums up the different elements involving in link budget’s calculation: ---------------------------- With: FSL: free space losses Ptransmitter: transmitted power Pr: received power
Atmospheric losses
FSL
GB GA
AT(B)
AT(A)
Ptransmitter
Pr
BER = 10E-6
transmitter receiver
Coralie Albareil – February 2006 Optimization of the transmission network
16
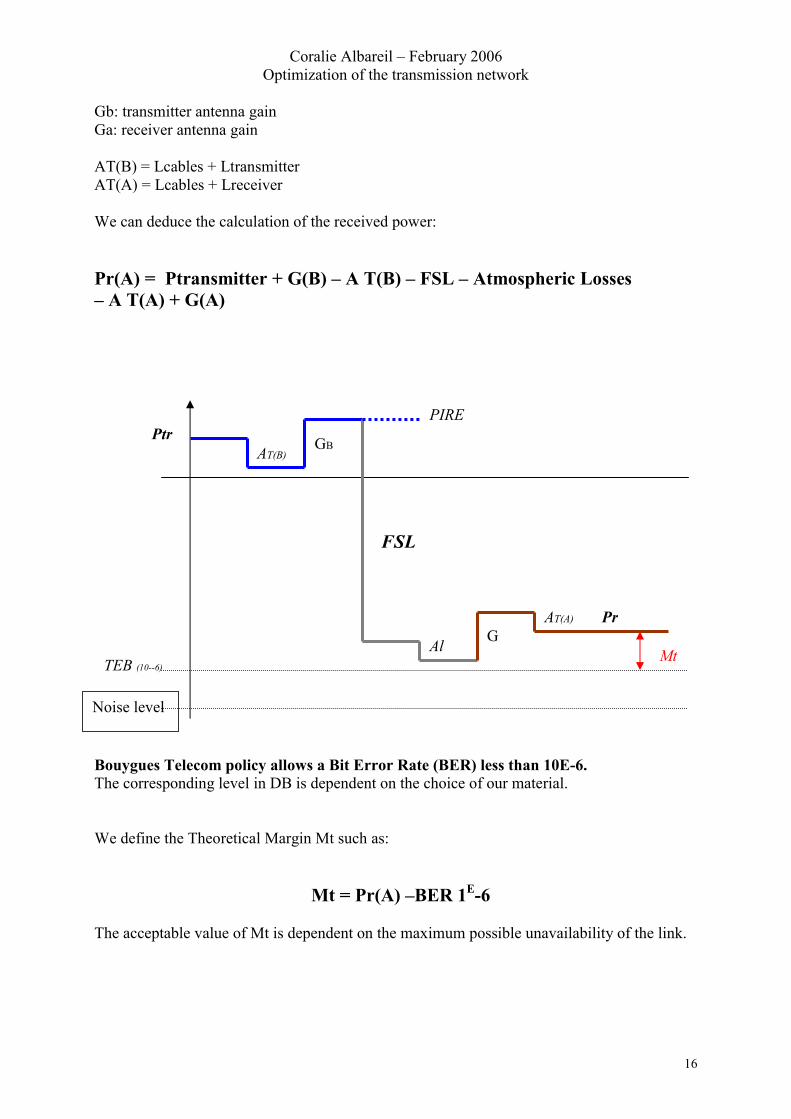
Gb: transmitter antenna gain Ga: receiver antenna gain AT(B) = Lcables + Ltransmitter AT(A) = Lcables + Lreceiver We can deduce the calculation of the received power:
Pr(A) = Ptransmitter + G(B) – A T(B) – FSL – Atmospheric Losses – A T(A) + G(A)
Bouygues Telecom policy allows a Bit Error Rate (BER) less than 10E-6. The corresponding level in DB is dependent on the choice of our material.
We define the Theoretical Margin Mt such as:
Mt = Pr(A) –BER 1E-6
The acceptable value of Mt is dependent on the maximum possible unavailability of the link.
Ptr AT(B)
AT(A) Pr
GB
PIRE
FSL
AlTEB (10--6)
GMt
Noise level
Coralie Albareil – February 2006 Optimization of the transmission network
17
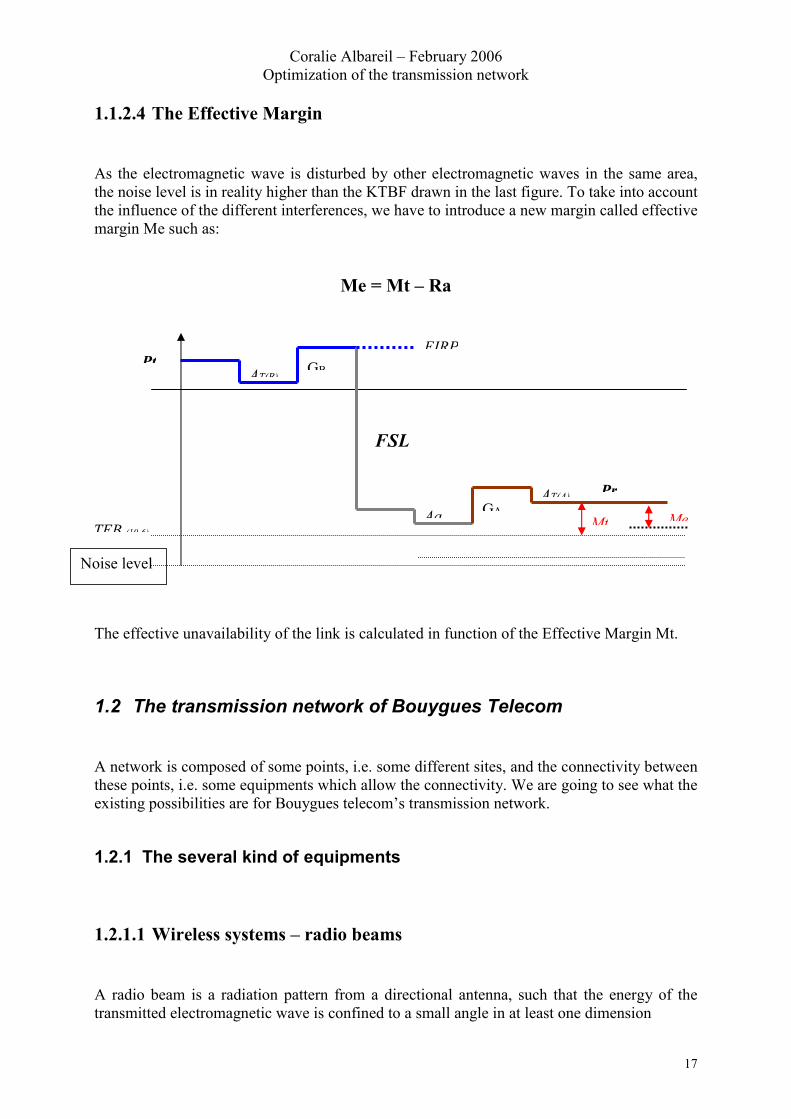
1.1.2.4 The Effective Margin As the electromagnetic wave is disturbed by other electromagnetic waves in the same area, the noise level is in reality higher than the KTBF drawn in the last figure. To take into account the influence of the different interferences, we have to introduce a new margin called effective margin Me such as:
Me = Mt – Ra
The effective unavailability of the link is calculated in function of the Effective Margin Mt.
1.2 The transmission network of Bouygues Telecom A network is composed of some points, i.e. some different sites, and the connectivity between these points, i.e. some equipments which allow the connectivity. We are going to see what the existing possibilities are for Bouygues telecom’s transmission network.
1.2.1 The several kind of equipments
1.2.1.1 Wireless systems – radio beams A radio beam is a radiation pattern from a directional antenna, such that the energy of the transmitted electromagnetic wave is confined to a small angle in at least one dimension
PtAT(B)
AT(A) Pr
GB
EIRP
FSL
AaTEB (10 6)
GAMt Me
Noise level
Coralie Albareil – February 2006 Optimization of the transmission network
18
Because of its autonomy and its low cost in comparison with other equipments, this wireless system is the most common used equipment to build Bouygues Telecom’s transmission network. According to the frequency, the possible bit rate can vary from 2*2 to 63*2 Mbits/s.
1.2.1.2 Wired lines With a maximum bit rate of 2 Mbits/s, this equipment is the one which can support the less traffic. Moreover as Bouygues Telecom is the owner of any of these wired lines, the company has to rent them to other firms; it leads to an extra cost for the company. The use of a wired line is avoided as much as possible.
1.2.1.3 Coaxial lines or ultra high frequencies cable When a BTS is localized in the same place than a nodal site such as a BSC, it is not useful to use a radio-relay system because of the short distance between the two identities. In this case a coaxial line is used to link the BTS to the transmission network.
1.2.1.4 Optical fiber This equipment can allow the maximum possible bit rate, 650 Mbits/s. Consequently this solution is only used to build some loops of the national backbone network.
1.2.2 The concept of site When we are talking about a site, we area talking about each structure which is used for our GSM network, it means a structure with some antennas and/or wired lines. As Bouygues Telecom transmission network is essentially composed of radio beams, the different sites are some high structures such as:
� Pylons specially built for communication purposes � Or some existing structures where we have installed some antennas (buildings,
churches, water towers…)
There are some sites called Ucell, which, because of their height, can only contain some radio patterns and no radio beams. It is for example the case of shop stores. In this case, the site is linked to the transmission network by a wired line.
Coralie Albareil – February 2006 Optimization of the transmission network
19
1.2.3 Frequency bandwidth for Bouygues Telecom radio beams
ART (Autorité de Réglementation des Télécommunications in french), the organization in charge of frequencies regulation in France, has given the right to Bouygues Telecom to use a number of frequency bandwidths around 6, 13, 18, 23 and 38 GHz to realize its capillary and backbone transmission network. We can distinguish 2 kinds of channels that Bouygues Telecom can use:
1.2.3.1 Priority channels Priority channels are channels where Bouygues Telecom is the only one allowed to create a new link. Nevertheless, when an engineer is going to choose a priority channel, it is possible that this channel is already used by another operator.
1.2.3.2 Preferential channels Preferential channels are channels where Bouygues Telecom is the only one allowed to create a new link. When the engineer is going to choose a channel, this channel is not already occupied by another operator. Only in some exceptional cases and after Bouygues Telecom’s agreement, ART can allow another operator to use one of these channels.
Coralie Albareil – February 2006 Optimization of the transmission network
20
2 PART TWO: OPTIMIZATION OF THE TRANSMISSION NETWORK
2.1 Introduction about optimization During my training period I was in charge of the optimization of the transmission network, and more especially the optimization due to external issues. The optimization deals with the existing network: people in charge of the optimization network will take care of the existing sites, which must be, whatever the events which can appear, connected to the transmission network with a link with an appropriate capacity. In this paper, we will focus on the capillary network, as it was my working area during my internship. The evolution of the backbone network will not be treated here.
2.2 The external reasons Several reasons can explain the change of the existing architecture. The external reasons are the following ones:
2.2.1 Leaving of a site because of renter’s issues In most of the cases, Bouygues Telecom is not the site’s owner; the transmission and the radio parts are installed in an already existing structure, such as a building or a water tower. In this case, Bouygues Telecom pays a rent. For several reasons, the owner can decide to no more accept any antennas at the end of the contract. Consequently Bouygues Telecom has to leave the existing site. The leaving of a site will lead to two different problems, in terms of a transmission point of view:
- In order to assume the coverage of the area, the radio team will introduce a new site which will replace the former one. This new site will have to be connected to the transmission network >> we are not talking about optimization
- Sometimes, the BTS is not directly connected to a nodal site such as a BSC or a DN. It
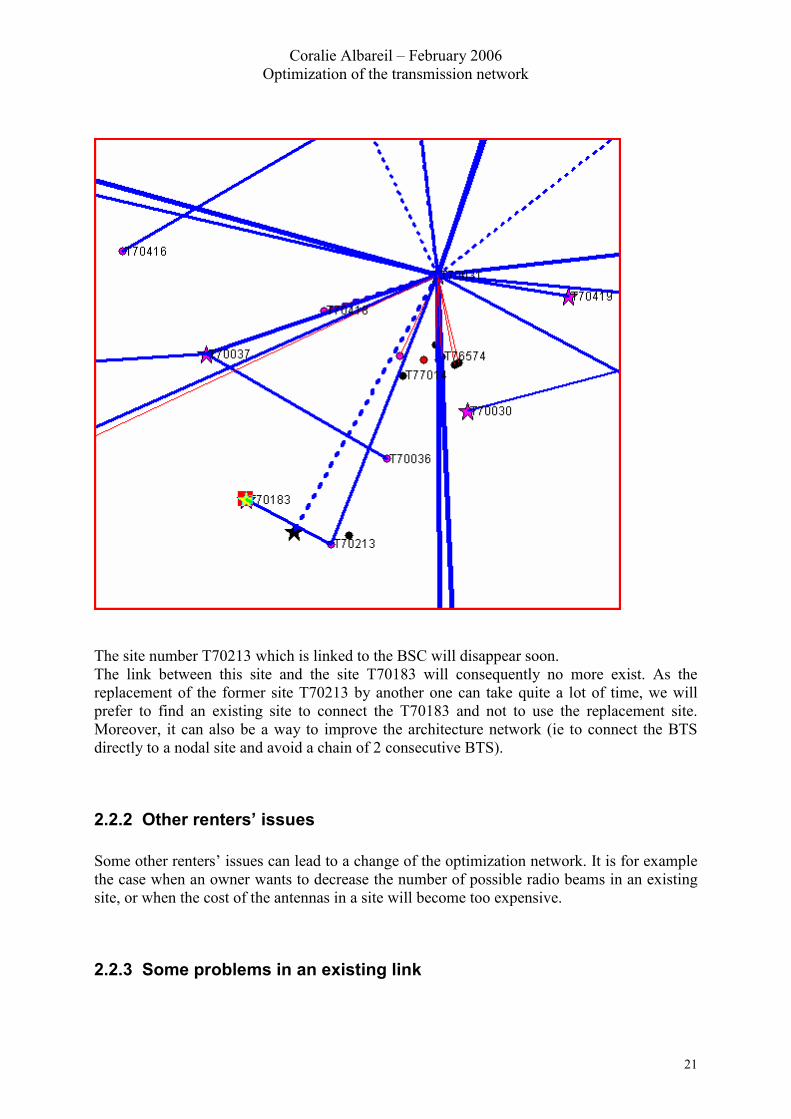
can happen that another BTS is connected to the site which is going to be left. In this case, we have to find a new way of connecting this BTS, which will be no more connected to the transmission network :
Here you can find an example:
Coralie Albareil – February 2006 Optimization of the transmission network
21
The site number T70213 which is linked to the BSC will disappear soon. The link between this site and the site T70183 will consequently no more exist. As the replacement of the former site T70213 by another one can take quite a lot of time, we will prefer to find an existing site to connect the T70183 and not to use the replacement site. Moreover, it can also be a way to improve the architecture network (ie to connect the BTS directly to a nodal site and avoid a chain of 2 consecutive BTS).
2.2.2 Other renters’ issues Some other renters’ issues can lead to a change of the optimization network. It is for example the case when an owner wants to decrease the number of possible radio beams in an existing site, or when the cost of the antennas in a site will become too expensive.
2.2.3 Some problems in an existing link
Coralie Albareil – February 2006 Optimization of the transmission network
22
Sometimes the measures made to control the signal between 2 sites indicate that the received power is not enough. Most of the time, this problem is due to an obstructed line of sight, due for example to a new building or the growing of an existing forest. If it is not possible to increase the height of the antennas, another way of connecting our site must be found.
2.2.4 The replacement of an existing material Sometimes some equipment has to be changed. The existing link has consequently to be created with new equipment. In this case, the two different sites of the link will be kept.
2.2.5 The increase of the traffic Sometimes, as the traffic is increasing, the capacity of the existing link is no more enough to support the whole traffic. Several solutions can be used to solve the problem:
� addition of a new link in parallel of the existing one � replacement of the existing link by another one with a bigger capacity � change of the distant site when we have a chain of several BTS
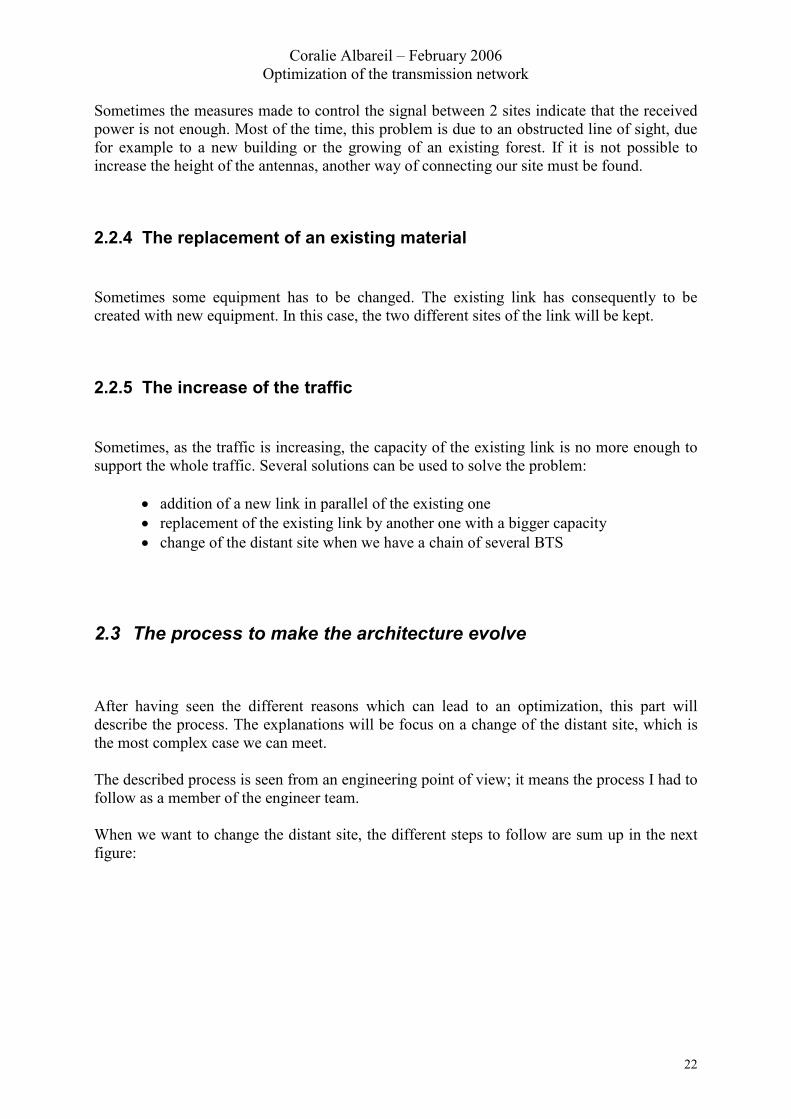
2.3 The process to make the architecture evolve After having seen the different reasons which can lead to an optimization, this part will describe the process. The explanations will be focus on a change of the distant site, which is the most complex case we can meet. The described process is seen from an engineering point of view; it means the process I had to follow as a member of the engineer team. When we want to change the distant site, the different steps to follow are sum up in the next figure:
Coralie Albareil – February 2006 Optimization of the transmission network
23
Need to find a new distant site for our site
Simulation of the line of sight >>> Determination of the distant site
Planning of the real line of sight
Expression de Besoin EB
Choice of the material Link budget
If no visibility >>> wired line
If OK If NOK
Coralie Albareil – February 2006 Optimization of the transmission network
24
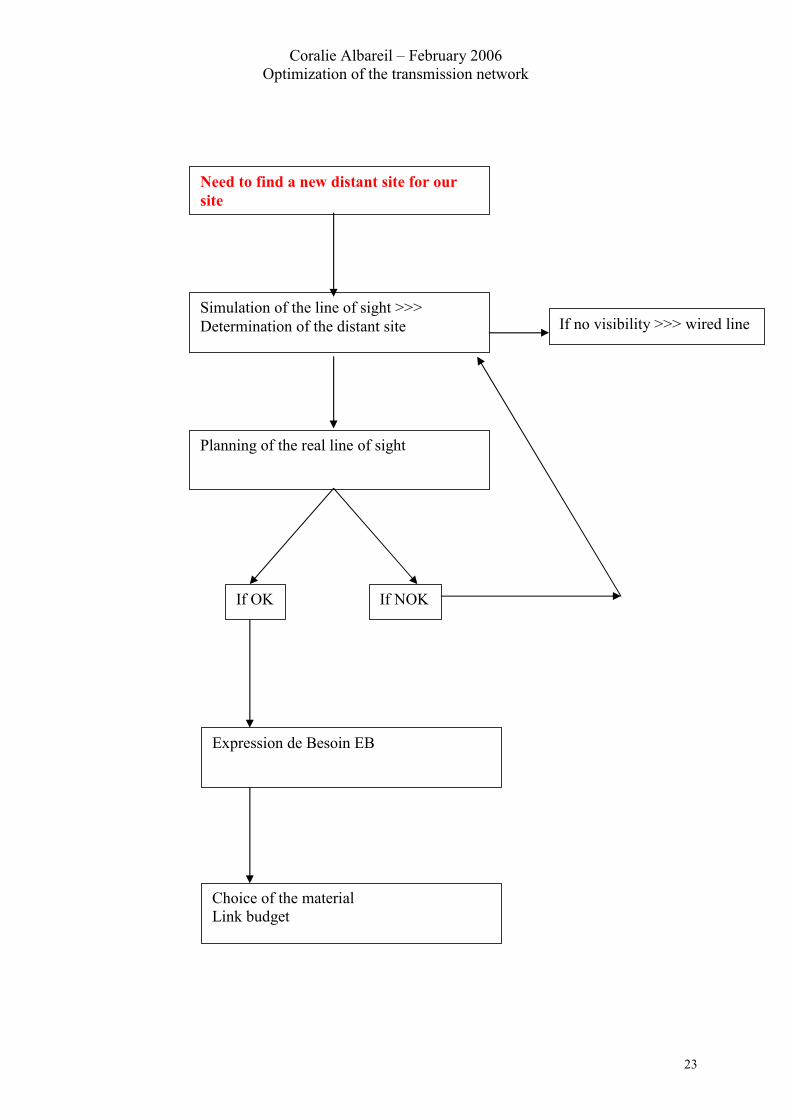
2.3.1 Determination of the distant site When the actual transmission link of a BTS can no more be maintained the first step is to find another distant site to connect our site to the transmission network. As mentioned before, the favorite way of connecting a site to another one is the use of an electromagnetic wave; we should avoid as much as possible a wired line. But the use of an electromagnetic wave is restricted by the line of sight: as seen before, the Fresnel’s area must not be obstructed. The different lines of sites between our site and the sites around will be simulated with the help of Microwave Tool:
Our workstation Planet contains a geographical view of our network: all the sites and links are represented. The theoretical profile of the ground is already stored in the database.
Coralie Albareil – February 2006 Optimization of the transmission network
25
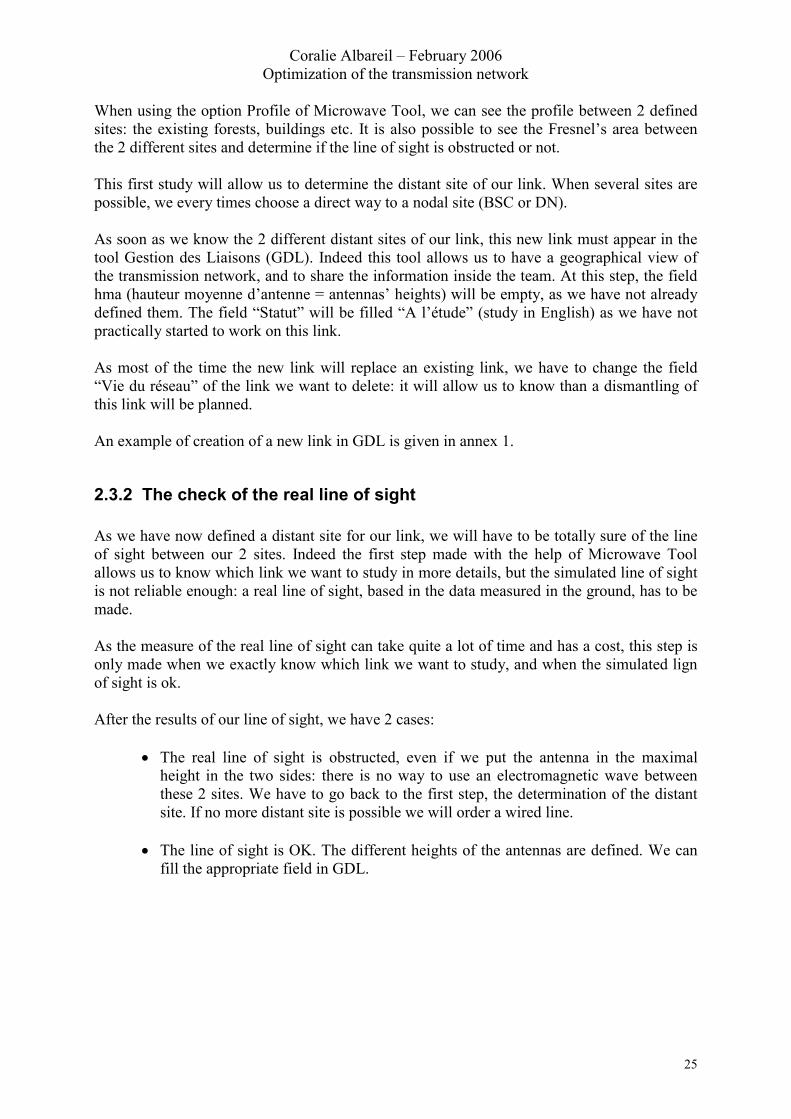
When using the option Profile of Microwave Tool, we can see the profile between 2 defined sites: the existing forests, buildings etc. It is also possible to see the Fresnel’s area between the 2 different sites and determine if the line of sight is obstructed or not. This first study will allow us to determine the distant site of our link. When several sites are possible, we every times choose a direct way to a nodal site (BSC or DN). As soon as we know the 2 different distant sites of our link, this new link must appear in the tool Gestion des Liaisons (GDL). Indeed this tool allows us to have a geographical view of the transmission network, and to share the information inside the team. At this step, the field hma (hauteur moyenne d’antenne = antennas’ heights) will be empty, as we have not already defined them. The field “Statut” will be filled “A l’étude” (study in English) as we have not practically started to work on this link. As most of the time the new link will replace an existing link, we have to change the field “Vie du réseau” of the link we want to delete: it will allow us to know than a dismantling of this link will be planned. An example of creation of a new link in GDL is given in annex 1.
2.3.2 The check of the real line of sight As we have now defined a distant site for our link, we will have to be totally sure of the line of sight between our 2 sites. Indeed the first step made with the help of Microwave Tool allows us to know which link we want to study in more details, but the simulated line of sight is not reliable enough: a real line of sight, based in the data measured in the ground, has to be made. As the measure of the real line of sight can take quite a lot of time and has a cost, this step is only made when we exactly know which link we want to study, and when the simulated lign of sight is ok. After the results of our line of sight, we have 2 cases:
� The real line of sight is obstructed, even if we put the antenna in the maximal height in the two sides: there is no way to use an electromagnetic wave between these 2 sites. We have to go back to the first step, the determination of the distant site. If no more distant site is possible we will order a wired line.
� The line of sight is OK. The different heights of the antennas are defined. We can
fill the appropriate field in GDL.
Coralie Albareil – February 2006 Optimization of the transmission network
26
The previous figure shows an extract of the study made between the sites T73565 and T73545. We see than for a height of 29m in the T73565 side, the height of the antenna in the other side must be at least 26.56m. The heights should be as much as possible closer to the heights which will be practically implemented. That’s why it is important to check the maps of the 2 sites to determinate what will be possible.
2.3.3 The dimensioning of the radio beam
The engineering team is in charge of the dimensioning of the radio beam which will be used for our new link. It is essential to determinate the antenna and the frequency we will need, as these features will be requested to start the work on the new link. The choice of the frequency and the diameter depends on:
� the choice of the material : manufacturer of the equipment � the modulation :
Lower the number of symbols will be, further the signal will be able to go (see part 1 technical background)
� the bit rate Higher the bit rate will be, more the signal will be attenuated.
� The pluviometry
Coralie Albareil – February 2006 Optimization of the transmission network
27
� the distance between the 2 sites
2.3.3.1 Choice of the material We can meet 2 different cases concerning the choice of our equipment:
� The purchase of new equipment. In this case the equipment will be a NEC MX. The optimal configuration of a NEC MX is a 16 QAM modulation scheme and a bit rate of 10*2 Mbits/s. When we will configure a link made with a NEC MX, we will choose our modulation scheme and data rate for this optimal use.
� The use of former equipment: it can be several kinds of equipments, from different
manufacturers. The rate of these equipments is 4*2 Mbits/s with a 4 QAM modulation scheme.
At this step of the process, it is quite difficult to precisely determine which category of equipments we are going to use: indeed we don’t know if some former equipment will be available when we will order our material. Nevertheless, as it is requested to know the frequency and the antenna’s diameter quite early, some engineering rules are defined when we are dimensioning a new link:
� For rural areas, we don’t have a big traffic; we will configure our link with former equipment.
� For urban areas, as there will be a big traffic, we will consider than we will use new
equipment.
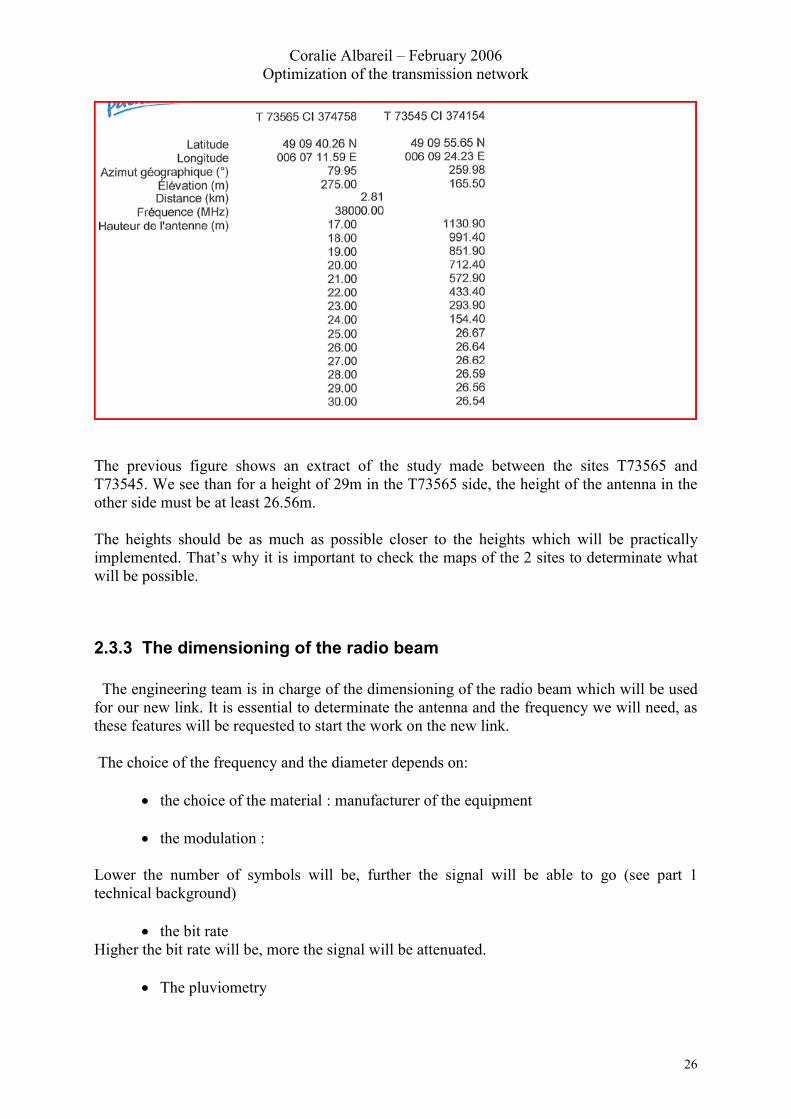
2.3.3.2 Determination of the rain attenuation
Coralie Albareil – February 2006 Optimization of the transmission network
28
To represent the attenuation due to the rain, the country has been divided in different categories, according to the pluviometry of the area, and more precisely the quantity of rain per hour for the 53 worst minutes in the year. Pluviometry for the worst 53 mn/year :
Area 1 26 mm/h Area 2 33 mm/h Area 3 38 mm/h Area 4 43 mm/h Area 5 48 mm/h
2.3.3.3 Determination of the frequency, the antennas 2.3.3.3.1 23 and 38 GHz The determination of the frequency and the antennas are made with the help of some tables. Practically 2 kinds of tables are used:
� When we use a new equipment : the table of the equipment NEC MX 10*2 16 QAM
� When we use a former equipment : the table of the equipment UX Flat 4*2 4
QAM. It is not every times the equipment we will use afterwards, but it is the one with the maximum attenuation.
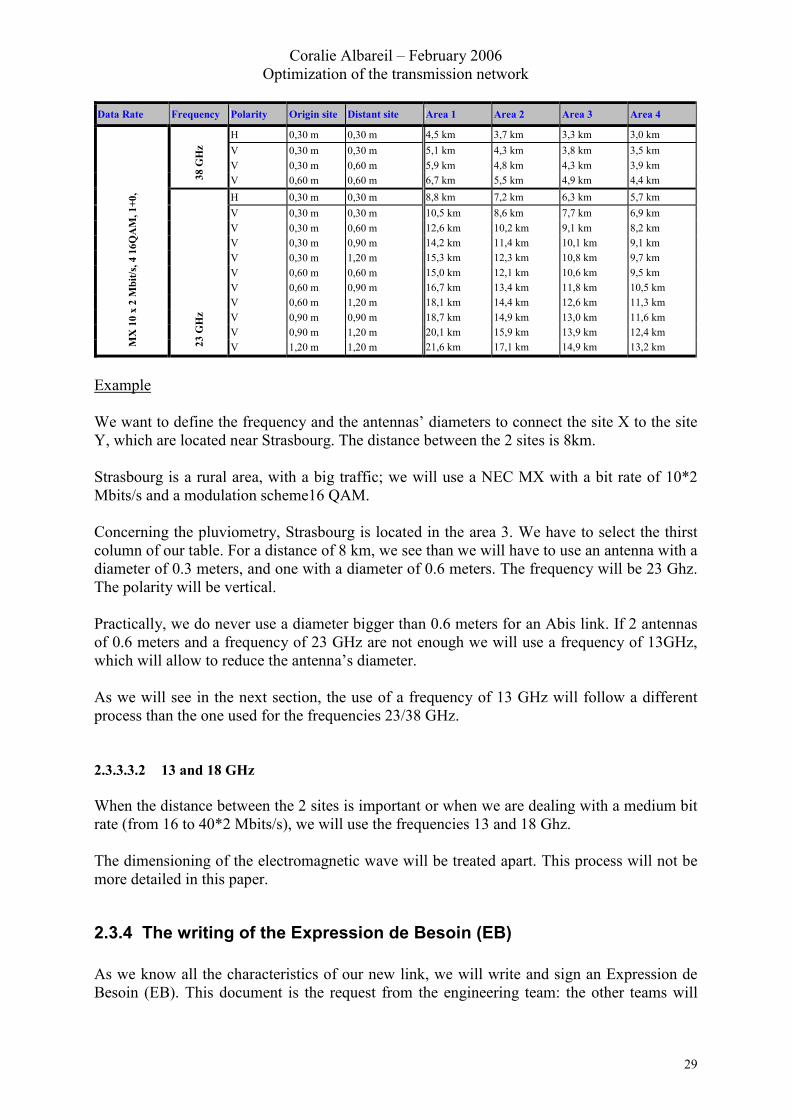
Here you can find the appropriate table for a NEC MX 10*2 16 QAM: The data in meters which appear in this table indicate the maximum distance we can do in function of the antennas’ diameters, the frequency, the polarity and the pluviometry.
Coralie Albareil – February 2006 Optimization of the transmission network
29
Data Rate Frequency Polarity Origin site Distant site Area 1 Area 2 Area 3 Area 4
H 0,30 m 0,30 m 4,5 km 3,7 km 3,3 km 3,0 km V 0,30 m 0,30 m 5,1 km 4,3 km 3,8 km 3,5 km V 0,30 m 0,60 m 5,9 km 4,8 km 4,3 km 3,9 km
38 G
Hz
V 0,60 m 0,60 m 6,7 km 5,5 km 4,9 km 4,4 km H 0,30 m 0,30 m 8,8 km 7,2 km 6,3 km 5,7 km V 0,30 m 0,30 m 10,5 km 8,6 km 7,7 km 6,9 km V 0,30 m 0,60 m 12,6 km 10,2 km 9,1 km 8,2 km V 0,30 m 0,90 m 14,2 km 11,4 km 10,1 km 9,1 km V 0,30 m 1,20 m 15,3 km 12,3 km 10,8 km 9,7 km V 0,60 m 0,60 m 15,0 km 12,1 km 10,6 km 9,5 km V 0,60 m 0,90 m 16,7 km 13,4 km 11,8 km 10,5 km V 0,60 m 1,20 m 18,1 km 14,4 km 12,6 km 11,3 km V 0,90 m 0,90 m 18,7 km 14,9 km 13,0 km 11,6 km V 0,90 m 1,20 m 20,1 km 15,9 km 13,9 km 12,4 km
MX
10
x 2
Mbi
t/s, 4
16Q
AM
, 1+0
,
23 G
Hz
V 1,20 m 1,20 m 21,6 km 17,1 km 14,9 km 13,2 km
Example We want to define the frequency and the antennas’ diameters to connect the site X to the site Y, which are located near Strasbourg. The distance between the 2 sites is 8km. Strasbourg is a rural area, with a big traffic; we will use a NEC MX with a bit rate of 10*2 Mbits/s and a modulation scheme16 QAM. Concerning the pluviometry, Strasbourg is located in the area 3. We have to select the thirst column of our table. For a distance of 8 km, we see than we will have to use an antenna with a diameter of 0.3 meters, and one with a diameter of 0.6 meters. The frequency will be 23 Ghz. The polarity will be vertical. Practically, we do never use a diameter bigger than 0.6 meters for an Abis link. If 2 antennas of 0.6 meters and a frequency of 23 GHz are not enough we will use a frequency of 13GHz, which will allow to reduce the antenna’s diameter. As we will see in the next section, the use of a frequency of 13 GHz will follow a different process than the one used for the frequencies 23/38 GHz. 2.3.3.3.2 13 and 18 GHz When the distance between the 2 sites is important or when we are dealing with a medium bit rate (from 16 to 40*2 Mbits/s), we will use the frequencies 13 and 18 Ghz. The dimensioning of the electromagnetic wave will be treated apart. This process will not be more detailed in this paper.
2.3.4 The writing of the Expression de Besoin (EB) As we know all the characteristics of our new link, we will write and sign an Expression de Besoin (EB). This document is the request from the engineering team: the other teams will
Coralie Albareil – February 2006 Optimization of the transmission network
30
start the work on the new link (negotiation, planning of the installation...) after the reception of this request. The field “A l’étude” in GDL will become “en prévision”(projected in English) At this step we have to fill our database SDL where all the projected, existing and cancelled links are mentioned. An example of Expression de Besoin is given in annex 2. An example of window SDL is given in annex 3.
2.3.5 The update of the maps (IDU + MIC connectors) As this activity is quite complex, it will be treated in the part three.
2.3.6 The configuration of the link and the order of the equipment At this step of the process, we have already made a first dimensioning of the equipment but we have not already made any link budget and chosen the channel we want to use. Now we really know what kind of equipment we are going to use, so we are able to do a precise link budget. The different elements we have to define are the following ones: First, with the help of the link budget, without taking into account any interference:
� The checking of our previous choice (antennas’ diameter, frequency). The unavailability must be less than 30 min per year
� the choice of the polarity : vertical or horizontal � If the unavailability is really low, we can transmit with a lower power and less disturb
the other electromagnetic waves: we will use an attenuator. Afterwards, we have to take into account the possible interferences. After the choice of the channel we will use, we must respect 2 things:
� The value of the unavailability is still less than 30 minutes per year. � The unavailability of the other electromagnetic waves around is still less than 30 min
per year. An example of a calculated link budget after taking into account the interferences is given in annex 4: We see than the effective unavailability is less than 30 minutes per year, as it is asked.
Coralie Albareil – February 2006 Optimization of the transmission network
31
After this step, we have totally defined the features of our link: we can order the equipment. An example of such order is given in annex 5.
2.4 A practical example: the case Bréhain bibond
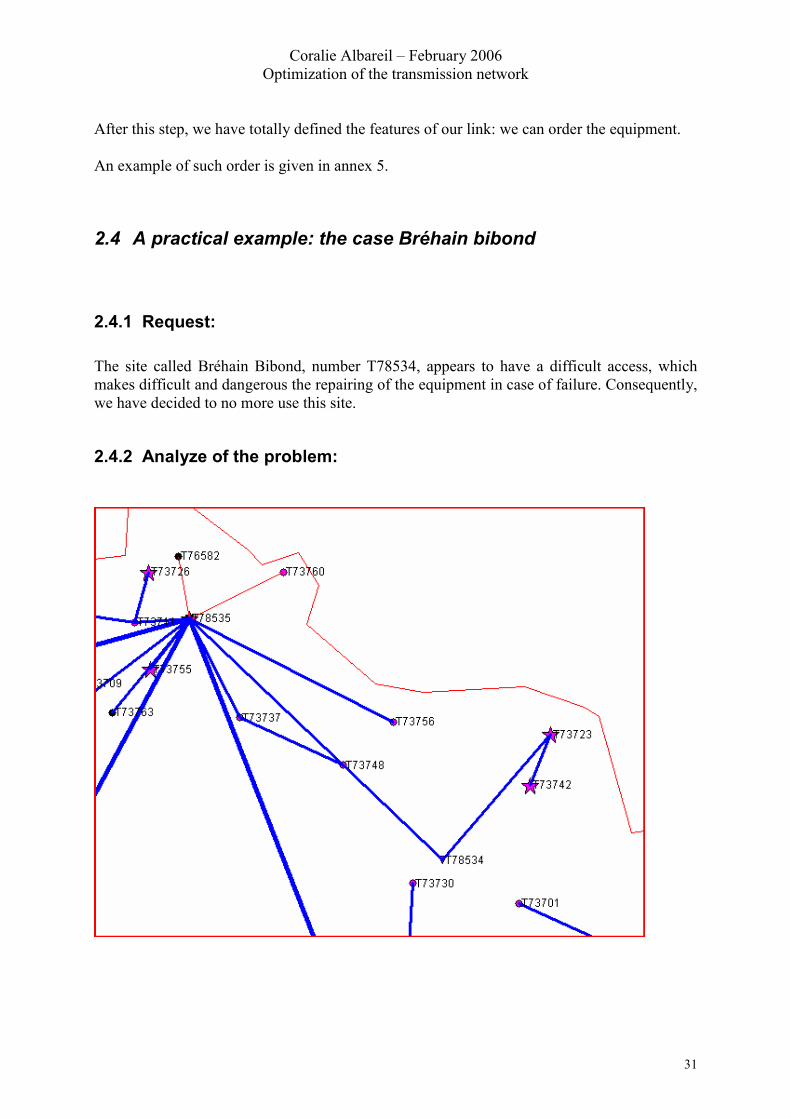
2.4.1 Request: The site called Bréhain Bibond, number T78534, appears to have a difficult access, which makes difficult and dangerous the repairing of the equipment in case of failure. Consequently, we have decided to no more use this site.
2.4.2 Analyze of the problem:
Coralie Albareil – February 2006 Optimization of the transmission network
32
When we study the area, we see than after the leaving of the T78534, 2 sites will no more be connected to the transmission network: the sites number T73742 and T73723. We have to find a new distant site for these 2 sites.
2.4.3 Analyze of the different solutions:
2.4.3.1 First possible solution: a link to a nodal site, such as a DN or a BSC: To avoid as much as possible a chain of several BTS, the best way of connecting a site is every times a new link to a nodal site. Unfortunately in this case the study of the lines of sight reveals than it is impossible to connect these sites to a nodal site by an electromagnetic wave.
2.4.3.2 Second possible solution: the connection to another BTS After a more accurate analyze of our lines of sights, we find the following results:
� The site T73723 can only be linked to the site T73742 (existing link) � The site T73742 can be linked to the sites T73742 (existing link), T73730 and T73748
We are obliged to keep the existing link T73723-T73742. As for the T73742, if we connect it to the T73740 or the T73748 without doing other actions, we will have a problem of capacity: indeed we will create in the two cases a chain of more than 2 BTS. Several solutions can be analyzed:
� The use of a wired line to avoid a chain of more than 2 BTS. It will cost an extra price (wired line rent to an other company)
� The addition of extra equipment in parallel to solve the problem of limited capacity in terms of traffic. It will cost an extra price (need of extra equipment). As the solution will not solve the problem of unavailability, it will never be retained.
� A new organization of the area
2.4.3.3 Third solution: a new organization of the area When we study in more details our area we see that the site T73737 is not a very practical site; to reduce the number of equipments in this site is a good idea.
Coralie Albareil – February 2006 Optimization of the transmission network
33
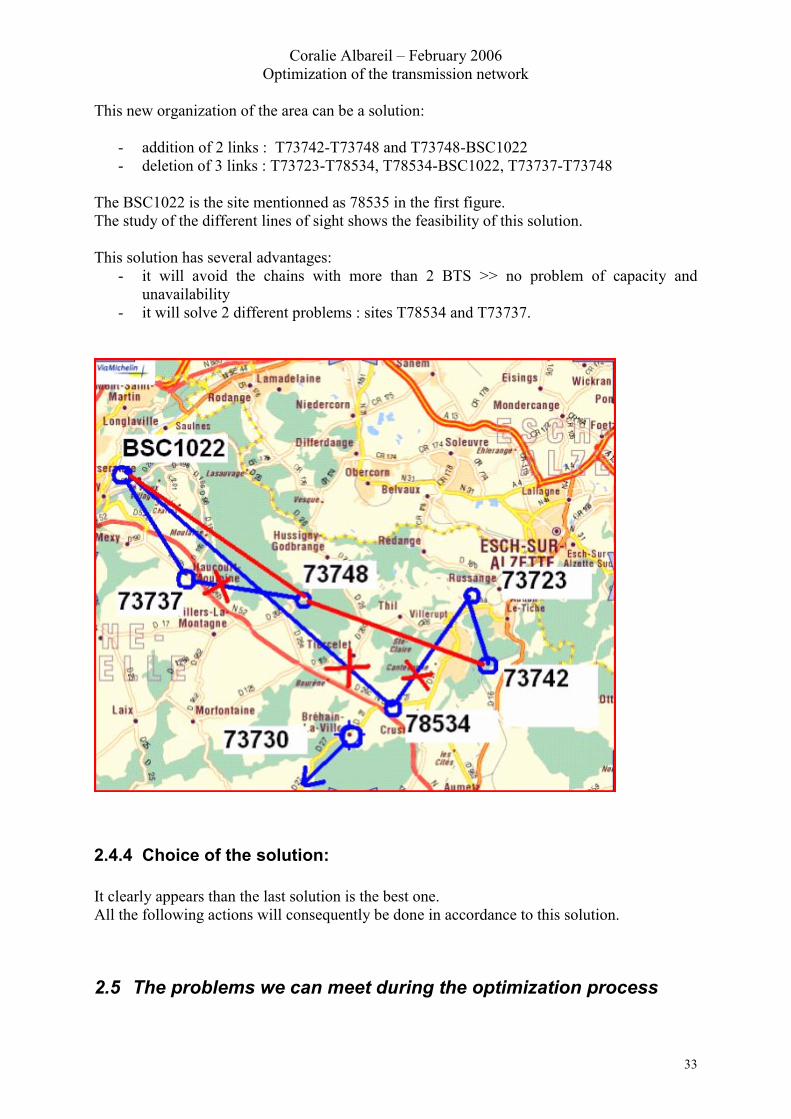
This new organization of the area can be a solution:
- addition of 2 links : T73742-T73748 and T73748-BSC1022 - deletion of 3 links : T73723-T78534, T78534-BSC1022, T73737-T73748
The BSC1022 is the site mentionned as 78535 in the first figure. The study of the different lines of sight shows the feasibility of this solution. This solution has several advantages:
- it will avoid the chains with more than 2 BTS >> no problem of capacity and unavailability
- it will solve 2 different problems : sites T78534 and T73737.
2.4.4 Choice of the solution: It clearly appears than the last solution is the best one. All the following actions will consequently be done in accordance to this solution.
2.5 The problems we can meet during the optimization process
Coralie Albareil – February 2006 Optimization of the transmission network
34
2.5.1 The conformity between a theoretical work and the reality We decide in our office on some elements which will have a real impact on reality. It is sometimes quite difficult to respect the conformity between the figures we have (theoretical point of view) and what will really happen. For example, after the reception of the line of sight, the engineer will define the minimum possible heights. He will use the maps of the 2 distant sites to define them. Even if the maps are quite precise, the engineer is not sure that the heights he will order will be exactly respected: he can not be aware of some practical problems which can appear during the installation.
� Solution: Feedback from the technician, good communication between the technician and the engineer.
In one side, we have the engineer, who has a good knowledge about the global process and need; in the other side we have the technician who knows how the site is made and its practical constraints. The communication between the 2 parts is essential. For example, if the technician realizes than it is not manageable to respect one antenna’s height asked by the engineer, he will contact him to explain what is possible. If the possible height is lower than the one defined, the engineer will check if the new value is possible in terms of line of sight. Sometimes, it is practically not possible to install a radio beam in a site. After getting this information, the engineer will decide to use a wired line or will choose another distant site.
2.5.2 The first dimensioning of equipment with tables As mentioned, when the decision is made concerning the diameters of the antennas and the frequency, we don’t know exactly which equipment we will use. If the radio beam was defined such as a new equipment, a NEC MX 10*2 16 QAM and we will use in fact a radio beam with features 4*2 4QAM, the effective margin will be higher than expected. The solution is not really optimized, but we have no problem in terms of unavailability. In the opposite case, already used equipment with features 4*2 Mbits/s 4QAM was planned. Unfortunately, when we have to order the equipment, it appears than no more such equipment is available. In this case we will use a NEC MX 10*2 16 QAM. The frequency and antennas’ diameters can no more be adequate. For the frequency it does not put a lot of problems to change it. It is not the case for the antennas: if the negotiation has been made and accepted with a diameter of 0.3m, it is not sure than an antenna of diameter 0.6m will be accepted.
Coralie Albareil – February 2006 Optimization of the transmission network
35
� Solution :
In the last case we talked about, several solutions are possible to avoid a change of antennas:
- To do the configuration of the NEC MX such as a 5*2 4QAM. Indeed the frequency and the modulation scheme can be defined by the user for this kind of equipment. The equipment will be no more optimized, but at least the unavailability can become acceptable.
- To make a change of the frequency from 38Ghz to 23Ghz.
If these 2 solutions are not enough, we have no more choice and have to change the antennas’ diameters. Why do not dimension all the equipments with NEC MX 10*2 16QAM tables to avoid such problems? As the ratio of problematic cases is quite weak in comparison to the different treated cases, it is smarter to distinguish the 2 different cases. If we use an inadequate solution, we will choice a too big antenna. If we use a higher frequency, we will pollute the 23 Ghz spectrum.
2.5.3 The coordination between several projects in the same area Sometimes, we plan to do an action in a special link. But because of the evolution of the architecture of the area, the action that we want to do is no more relevant. For example, the connection of our site to another one which will be left soon is irrelevant.
� Solution: a way of sharing the information inside the team + a good knowledge of the network.
As seen before, the transmission team uses a common tool called GDL (Gestion des Liaisons in French). This tool allows us to see the whole transmission network, with the actual and projected links. As soon someone projects to do a change he has to update this tool. Nevertheless, a tool as GDL cannot give all the information about the network. For example it cannot shows than we have no more space to install some additional antennas in a site. It is only a good knowledge of the network, get by a personal experience and a good communication between the team, than we will get the information.
Coralie Albareil – February 2006 Optimization of the transmission network
36
3 PART THREE: OTHER PROJECTS AND WORKS
3.1 Evolution of the transmission network in the case of nodal sites DN
3.1.1 Distribution Node DN
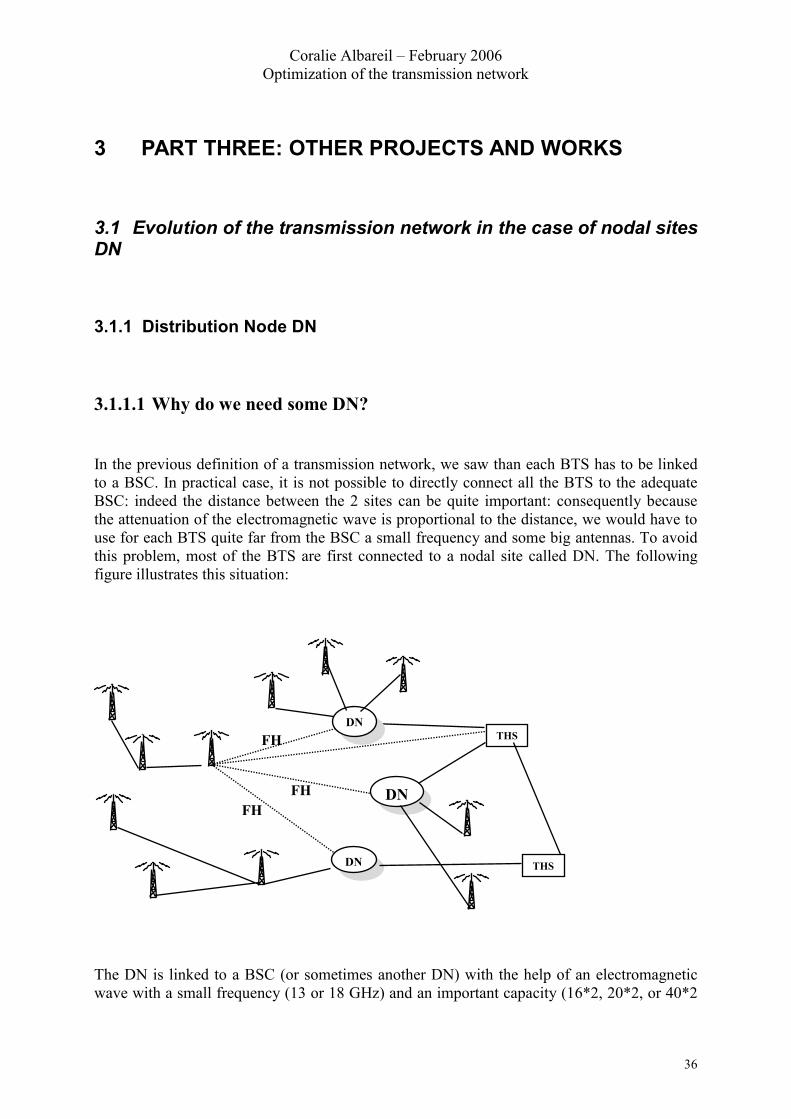
3.1.1.1 Why do we need some DN? In the previous definition of a transmission network, we saw than each BTS has to be linked to a BSC. In practical case, it is not possible to directly connect all the BTS to the adequate BSC: indeed the distance between the 2 sites can be quite important: consequently because the attenuation of the electromagnetic wave is proportional to the distance, we would have to use for each BTS quite far from the BSC a small frequency and some big antennas. To avoid this problem, most of the BTS are first connected to a nodal site called DN. The following figure illustrates this situation:
The DN is linked to a BSC (or sometimes another DN) with the help of an electromagnetic wave with a small frequency (13 or 18 GHz) and an important capacity (16*2, 20*2, or 40*2
THS
THSDN
DN
DN
FH FH
FH
Coralie Albareil – February 2006 Optimization of the transmission network
37
Mbit/s) dependent on the total numbers of Mbits the DN has to transmit. In some special cases, a capacity of 40*2 Mbits/s is not enough: we will not use PDH but SDH technology.
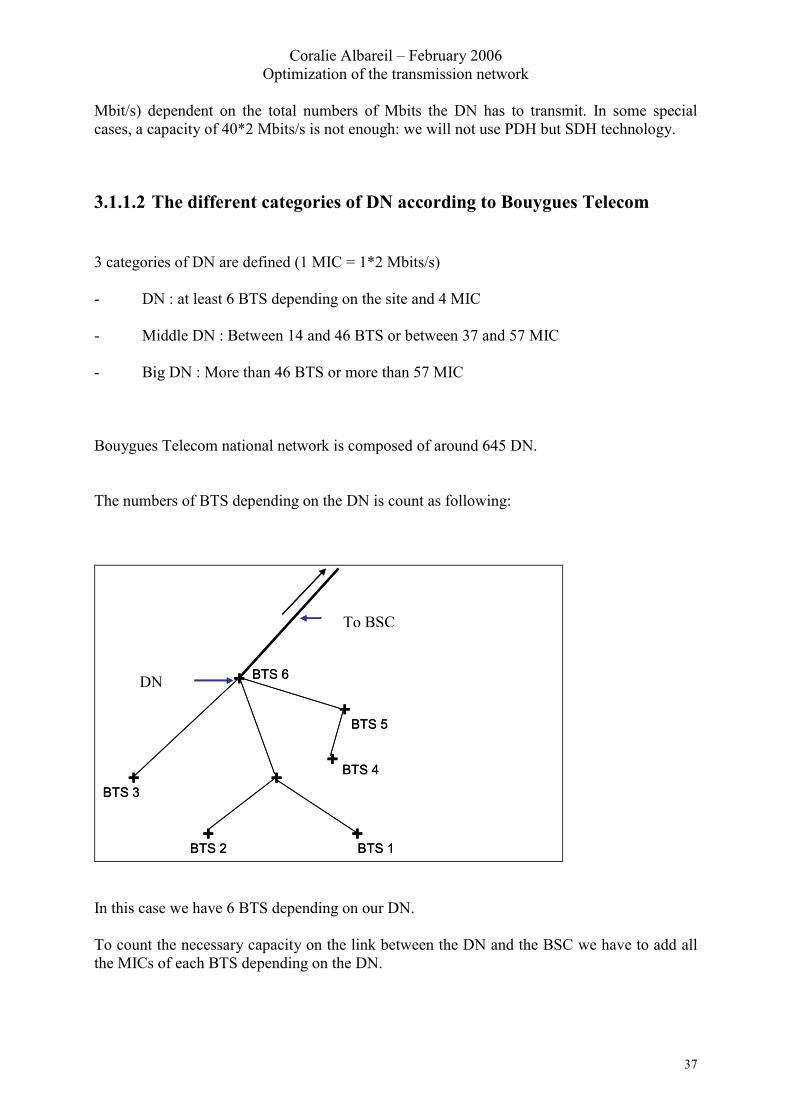
3.1.1.2 The different categories of DN according to Bouygues Telecom 3 categories of DN are defined (1 MIC = 1*2 Mbits/s) - DN : at least 6 BTS depending on the site and 4 MIC - Middle DN : Between 14 and 46 BTS or between 37 and 57 MIC - Big DN : More than 46 BTS or more than 57 MIC Bouygues Telecom national network is composed of around 645 DN. The numbers of BTS depending on the DN is count as following:
+
+
+
+
++
BTS 1
BTS 4
BTS 6
BTS 3
BTS 5
BTS 2
+
Vers BSC
Site analysé
Liaison « sortante » (ex : 16*2)X MIC utilisés (ex : 9 MIC)
+
+
+
+
++
BTS 1
BTS 4
BTS 6
BTS 3
BTS 5
BTS 2
+
Vers BSC
Site analysé
Liaison « sortante » (ex : 16*2)X MIC utilisés (ex : 9 MIC)
In this case we have 6 BTS depending on our DN. To count the necessary capacity on the link between the DN and the BSC we have to add all the MICs of each BTS depending on the DN.
To BSC
DN
Coralie Albareil – February 2006 Optimization of the transmission network
38
3.1.2 Need of new DN As we have already talked about, the architecture of the transmission network is continually involving. In the case of a BTS, the modifications are quite reduced, as it will concern a single link or maybe 2 in the case of a chain of 2 BTS. As a DN is a nodal site the leaving or the addition of a DN in an area will have a quite big impact on the area and will modify its whole architecture.
� Why do we need new DN?
3.1.2.1 Problem with renters >> leaving of a site The first and most common reason to introduce a new DN is the leaving of an existing DN. As it was the case for the BTS (see last section) it is most of the time due to a problem with renters (end of a rent, no more possible evolution in an existing DN …)
3.1.2.2 Increase of the 2G traffic Sometimes the traffic in an area is too much increasing than the existing nodal sites are no more enough to bring back to the BSC the whole traffic. We will consequently need a new DN in the area.
3.1.2.3 Introduction of new technologies such as EDGE or UMTS Because of the introduction of new technologies with data in addition to voice such as EDGE or UMTS the traffic will considerably increase. This will require the disappearance of the chains of several BTS and sometimes the replacement of the existing link by a link with higher capacity. This can lead to the introduction of a new DN, or the need to do a lot of operations in an existing DN.
3.1.2.4 The coverage of a white area From the radio engineering point of view, a white area is an area where, because of the limited number of existing BTS, the whole area is not totally covered. To face this problem, several new sites (called DI) are built. From the transmission point of view, we have then to study how to connect this new site to a nodal transmission site.
Coralie Albareil – February 2006 Optimization of the transmission network
39
When a lot of new sites appear in an area, the existing DN, because of their localization far from the new BTS or their limited capacity, can not be enough.
3.1.3 My actions and objectives During my training period, a need of 15 new DN in the North East area has been defined, which stands for a lot of changes in the network and a lot of operations to plan. Before getting my position as a trainee, several studies have been already made for some of these 15 DN. My work was to collect the previous studies, to update them if necessary. As for the new need which appeared during my stay, I had to take in charge the study from the beginning. After that, I had to create a model of working file to sum up the characteristics of each DN. This document must have been the same for each site, to allow a better follow up of the several studies. After the realization of this document and its filling for each DN, the practical work on the new DN had to be made. It was coordinated by a project coordinator in the company. Nevertheless, my actions after this step were not over: indeed, I had to regularly communicate with the project coordinator, as I had to do the several engineering actions (planning of the lines of sight, EB, dimensioning etc…) In addition to the common problems linked to the addition of a single link, other problems have to be solved when dealing with a new DN. The constraints of cost, negotiation, coordination and follow up of the actions, already present for a single link are more important in the case of a new DN. Moreover, some new problems such as the choice of the new DN are emerging. These problems and the solutions will be treated.
3.1.4 Special steps when dealing with a new DN
3.1.4.1 The choice of a – or several - candidates 3.1.4.1.1 Request for a candidate We are looking for a new site than will become our new DN. A candidate has to follow the following criteria:
Coralie Albareil – February 2006 Optimization of the transmission network
40
� a good localization
� a good visibility of the BTS all around : To be chosen as a candidate, the site must have a good visibility of the sites around. It is essential that the maximum of sites for which the introduction of this new DN is mandatory can be seen. If the new DN has a good visibility which allows the optimization of the area – by breaking of the existing chains of several BTS – it is an additional advantage. The visibility from the DN to the other sites is practically evaluated with the help of Microwave Tool, as seen in the last section. � the possibility to be connected to another nodal site It is essential to connect the new site by an electromagnetic wave to another DN or a BSC. If the site cannot be linked, it can not become a nodal node. That’s why when a site appears to be interesting; the real line of sight is early done. The only exception which does not need this condition is a site which is involved in a loop of optical fibers. � a good situation with renters At this first step of the study, any team is yet working on the negotiation concerning the new site, as they are waiting for the official request of creation to start the work. Even if the role of the transmitter engineer is not to follow up the evolution of the relationships with the renters, it is important to check some global information in terms of renters issues when selecting a candidate. For example, when a site appears to have a quite hard rent or has a structure difficult to evolve such as a water tower; it will not be retained as a candidate. 3.1.4.1.2 The 2 possible alternatives for a new candidate Two different alternatives can be used when we are looking for a new candidate: � Evolution of an existing site. It means the evolution of an existing BTS. � Looking for a new site (to build a new pylon or to choose an existing structure not used before by Bouygues Telecom). In this case, the transmitter team will have to define an area where we will have to search, and the minimal height of the new site.
Coralie Albareil – February 2006 Optimization of the transmission network
41
If possible, the first solution is more appreciated than the first one. When one or several candidates are found, a request to start the work is given. If the evolution/creation of the site appears to be feasible, all the actions will be started. The engineering team will respect the process of creation of a new link for each distant site involved in the project.
3.1.4.2 The dimensioning of the link to the BSC As it was the case to connect a BTS to a nodal site, several equipments are possible when we are dealing with our link connecting the DN to the BSC. In this special case it is crucial to do the dimensioning of the link quite early; we are no more talking about antennas’ diameters around 0.3 or 0.6 meters, but sometimes 1.2 or 1.8 meters. Moreover we have to early know what kind of equipment we will use and if it is available: The installation of the link between the DN and the BSC is the first condition to start all the actions; we cannot accept a mistake concerning this link. As it was already seen before, we get the total capacity of this link when we add all the MICs of all the BTS depending on the DN. As soon as we know the total capacity we need, we have several possibilities:
� For a total traffic less than 37 MIC (with 3 additional MIC as a margin) : use of a PDH equipment, with a maximum capacity of 16, 20 or 40 MIC.
� For a total traffic superior to 37 MIC: we need SDH. The solution will be developed
by another team localized in Paris in charge of the SDH network in France.
3.1.4.3 The follow up of the study A DN project, as it involves a lot of operations and a heavy negotiation process, can take a quite long time to be finalized. It is consequently important to keep the engineering elements in an established working document, which is the same for each DN. This document will be used by the engineering team, which will provide the available study elements, and the project coordinator which can easily read the information. It is also important to have a view about the advancement of the several actions: for example the numbers of lines of sight we have still to plan... to evaluate the cost and the work left. The working document allows us to have this visibility.
Coralie Albareil – February 2006 Optimization of the transmission network
42
An example of the working document will be seen in the next section with a practical example.
3.1.5 Practical example: Roubaix Ypres 2
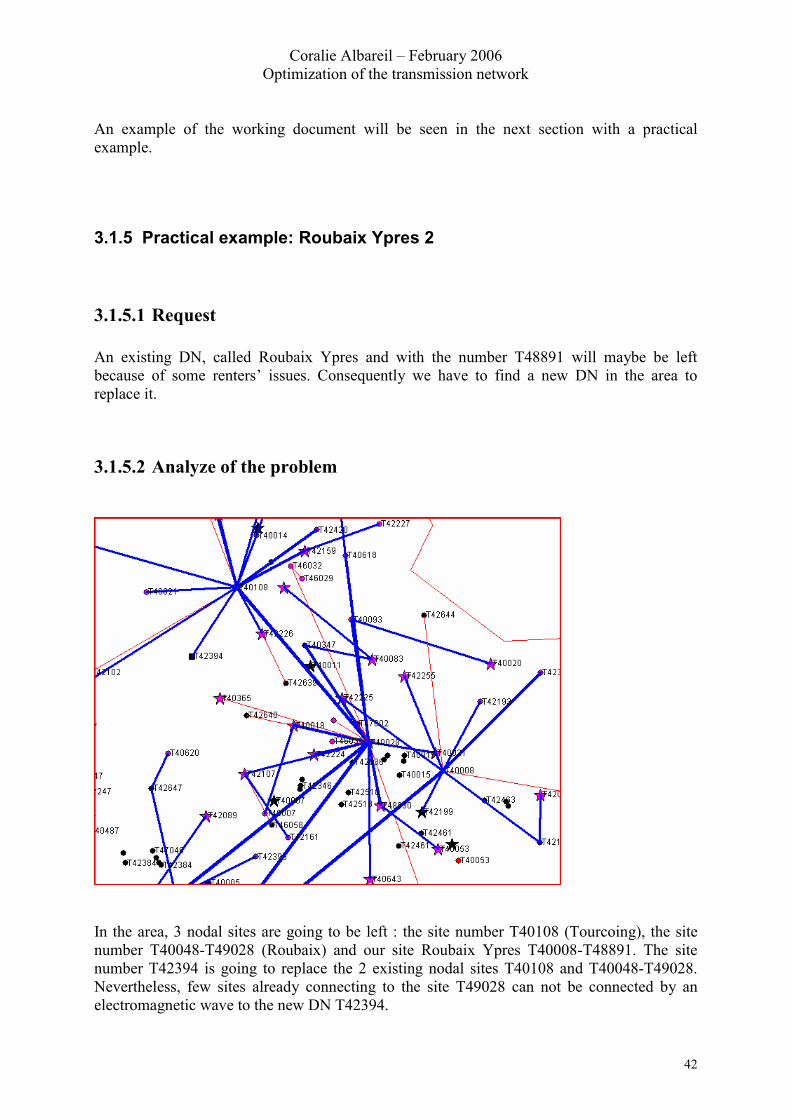
3.1.5.1 Request An existing DN, called Roubaix Ypres and with the number T48891 will maybe be left because of some renters’ issues. Consequently we have to find a new DN in the area to replace it.
3.1.5.2 Analyze of the problem
In the area, 3 nodal sites are going to be left : the site number T40108 (Tourcoing), the site number T40048-T49028 (Roubaix) and our site Roubaix Ypres T40008-T48891. The site number T42394 is going to replace the 2 existing nodal sites T40108 and T40048-T49028. Nevertheless, few sites already connecting to the site T49028 can not be connected by an electromagnetic wave to the new DN T42394.
Coralie Albareil – February 2006 Optimization of the transmission network
43
Consequently, in terms of visibility, the new candidate should be able to see the maximum of the following sites: � Sites today connected to the site T48891 � Sites today connected to the site T49028 but which cannot be seen by the new DN T42394.
3.1.5.3 Analyze of the different solutions After having studied the sites around in terms of localization, height and possible evolution it appears than 3 sites can be relevant: � T42183 - pylon, 30 meters � T40024 – building, 25 meters � T40083 – building, 47 meters 3.1.5.3.1 First candidate: T42183
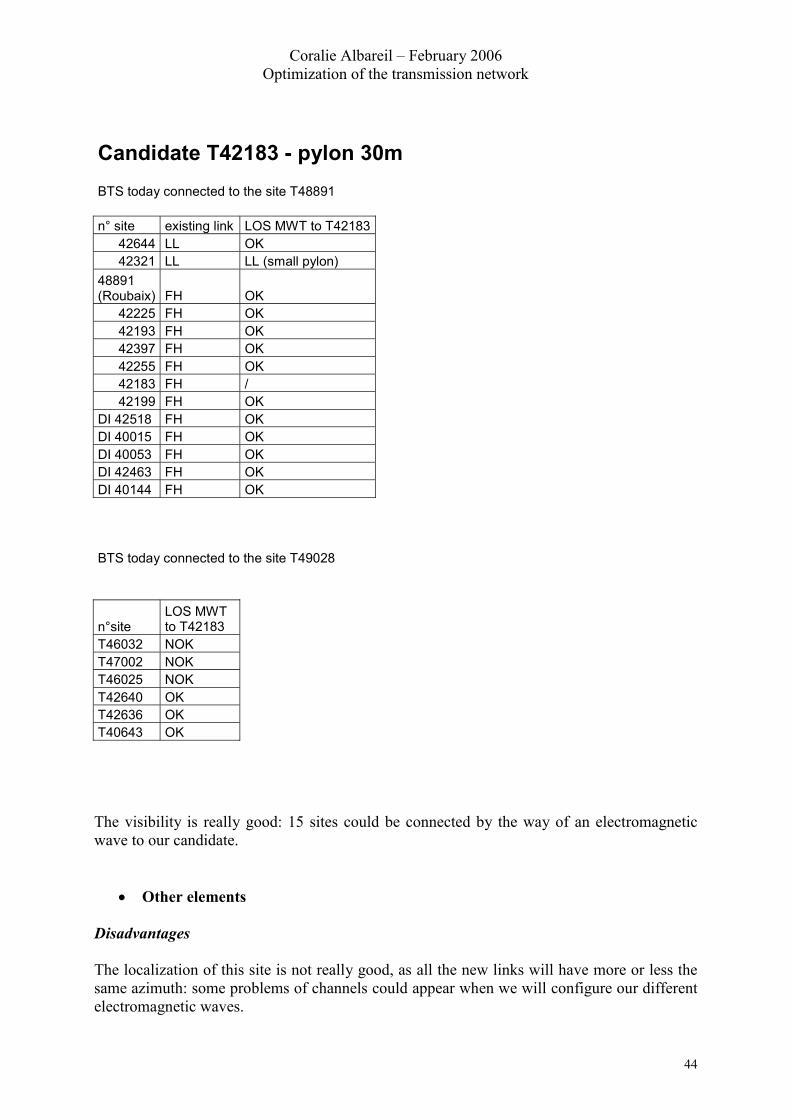
� Visibility in terms of lines of sight A simulation with Microwave Tool (MWT) shows than this site could be connected to another nodal site. The study about the other lines of sight is the following one: The first table indicates the visibility to the BTS today connected to the site T48891 and the second one the visibility to the BTS today connected to the site T49028 and which cannot be connected to the new DN T42394. The mention LL in the second column indicates that the BTS is today connected by a wired line, FH by an electromagnetic wave (FH means Faisceau Hertzien in French). The last column gives the result of the line of sight (OK or LL). DI means than we are talking about a site which is going to be created.
Coralie Albareil – February 2006 Optimization of the transmission network
44
Candidate T42183 - pylon 30m BTS today connected to the site T48891 n° site existing link LOS MWT to T42183
42644 LL OK 42321 LL LL (small pylon)
48891 (Roubaix) FH OK
42225 FH OK 42193 FH OK 42397 FH OK 42255 FH OK 42183 FH / 42199 FH OK
DI 42518 FH OK DI 40015 FH OK DI 40053 FH OK DI 42463 FH OK DI 40144 FH OK BTS today connected to the site T49028
n°site LOS MWT to T42183
T46032 NOK T47002 NOK T46025 NOK T42640 OK T42636 OK T40643 OK The visibility is really good: 15 sites could be connected by the way of an electromagnetic wave to our candidate.
� Other elements Disadvantages The localization of this site is not really good, as all the new links will have more or less the same azimuth: some problems of channels could appear when we will configure our different electromagnetic waves.
Coralie Albareil – February 2006 Optimization of the transmission network
45
Moreover the pylon will need a strengthening to be able to support the whole number of antennas; this element is not really a problem because this operation is quite common. Advantages The cost of the rent is quite cheap for this pylon. 3.1.5.3.2 Second candidate: T40024
� Visibility in terms of lines of sight
Coralie Albareil – February 2006 Optimization of the transmission network
46
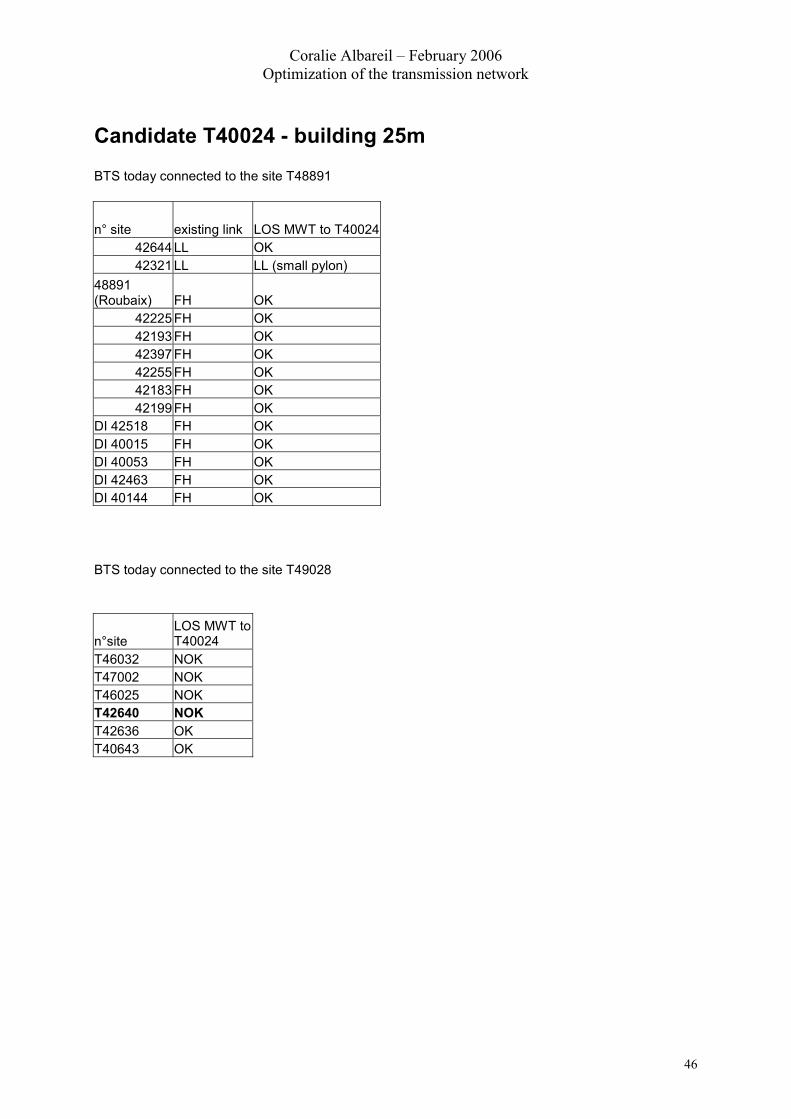
Candidate T40024 - building 25m BTS today connected to the site T48891
n° site existing link LOS MWT to T40024 42644 LL OK 42321 LL LL (small pylon)
48891 (Roubaix) FH OK
42225 FH OK 42193 FH OK 42397 FH OK 42255 FH OK 42183 FH OK 42199 FH OK
DI 42518 FH OK DI 40015 FH OK DI 40053 FH OK DI 42463 FH OK DI 40144 FH OK BTS today connected to the site T49028
n°site LOS MWT to T40024
T46032 NOK T47002 NOK T46025 NOK T42640 NOK T42636 OK T40643 OK
Coralie Albareil – February 2006 Optimization of the transmission network
47
The visibility is really good: 15 sites could be connected by the way of an electromagnetic wave to our candidate.
� Other elements Disadvantages This site is not really high Advantages The localization of this site, quite close to the DN which will disappear, is really good. 3.1.5.3.3 Third candidate: T40083
� Visibility in term of lines of sight
Coralie Albareil – February 2006 Optimization of the transmission network
48
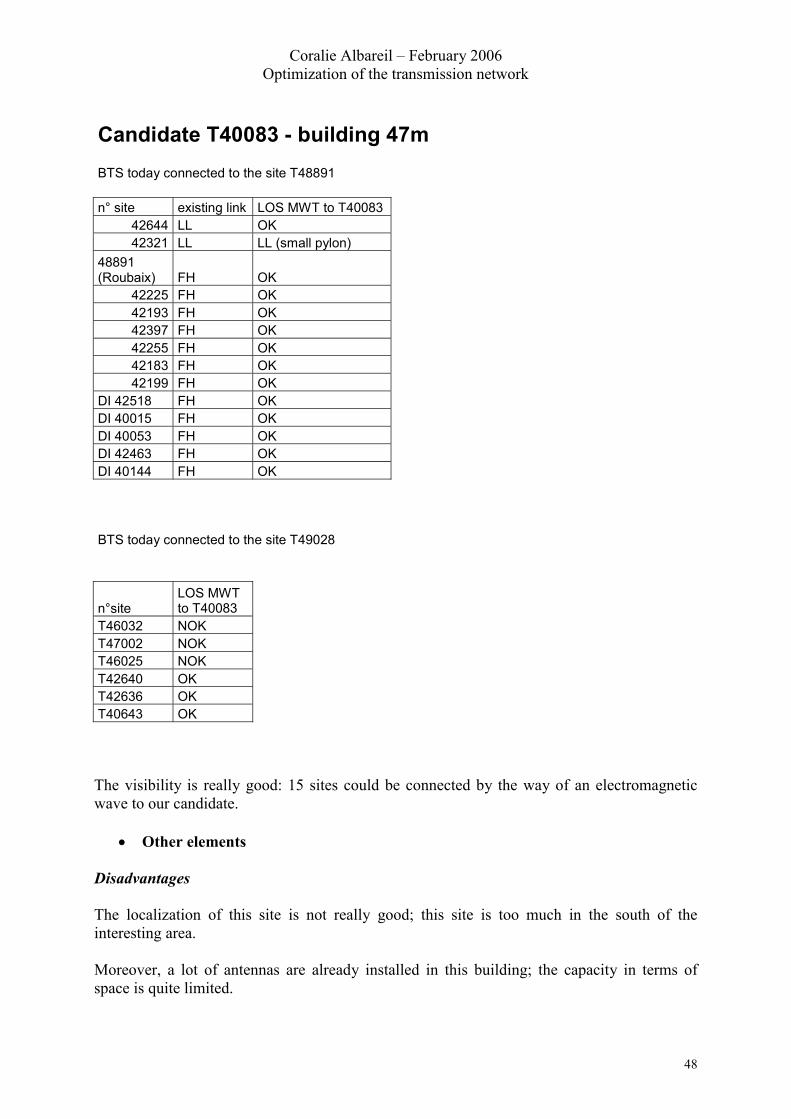
Candidate T40083 - building 47m BTS today connected to the site T48891 n° site existing link LOS MWT to T40083
42644 LL OK 42321 LL LL (small pylon)
48891 (Roubaix) FH OK
42225 FH OK 42193 FH OK 42397 FH OK 42255 FH OK 42183 FH OK 42199 FH OK
DI 42518 FH OK DI 40015 FH OK DI 40053 FH OK DI 42463 FH OK DI 40144 FH OK BTS today connected to the site T49028
n°site LOS MWT to T40083
T46032 NOK T47002 NOK T46025 NOK T42640 OK T42636 OK T40643 OK The visibility is really good: 15 sites could be connected by the way of an electromagnetic wave to our candidate.
� Other elements Disadvantages The localization of this site is not really good; this site is too much in the south of the interesting area. Moreover, a lot of antennas are already installed in this building; the capacity in terms of space is quite limited.
Coralie Albareil – February 2006 Optimization of the transmission network
49
Advantages This site is really high.
3.1.5.4 Choice of the solution:
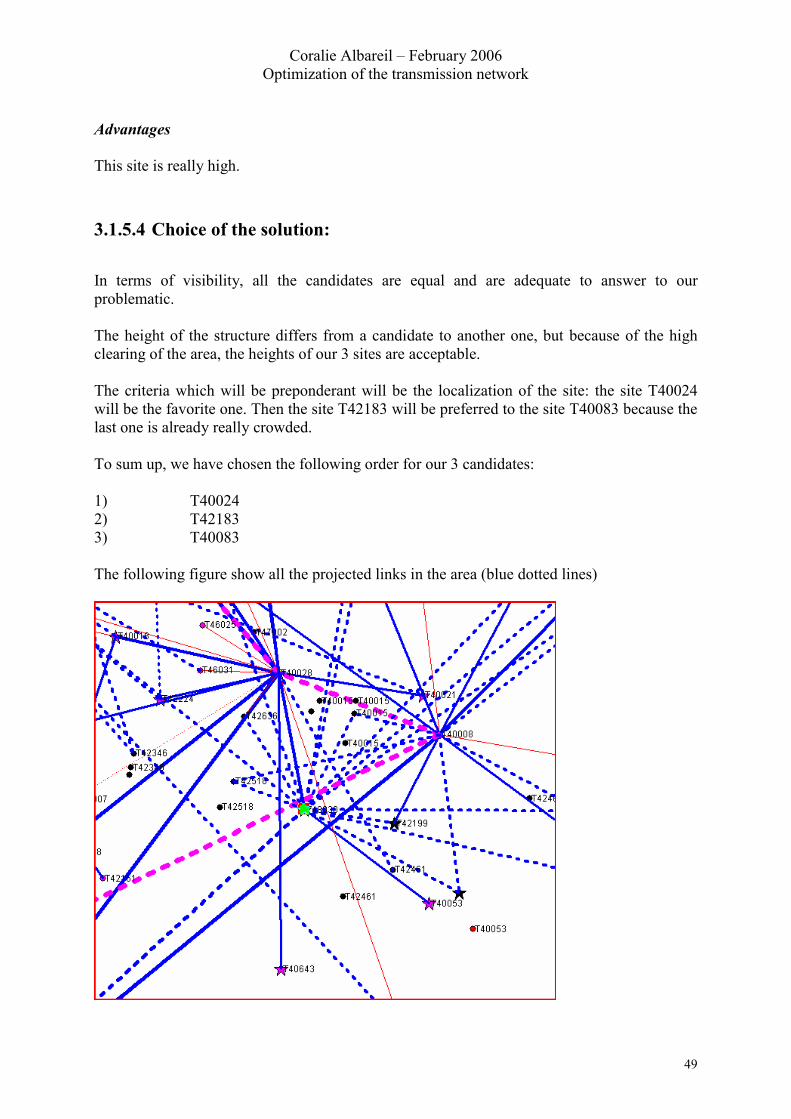
In terms of visibility, all the candidates are equal and are adequate to answer to our problematic. The height of the structure differs from a candidate to another one, but because of the high clearing of the area, the heights of our 3 sites are acceptable. The criteria which will be preponderant will be the localization of the site: the site T40024 will be the favorite one. Then the site T42183 will be preferred to the site T40083 because the last one is already really crowded. To sum up, we have chosen the following order for our 3 candidates: 1) T40024 2) T42183 3) T40083 The following figure show all the projected links in the area (blue dotted lines)
Coralie Albareil – February 2006 Optimization of the transmission network
50
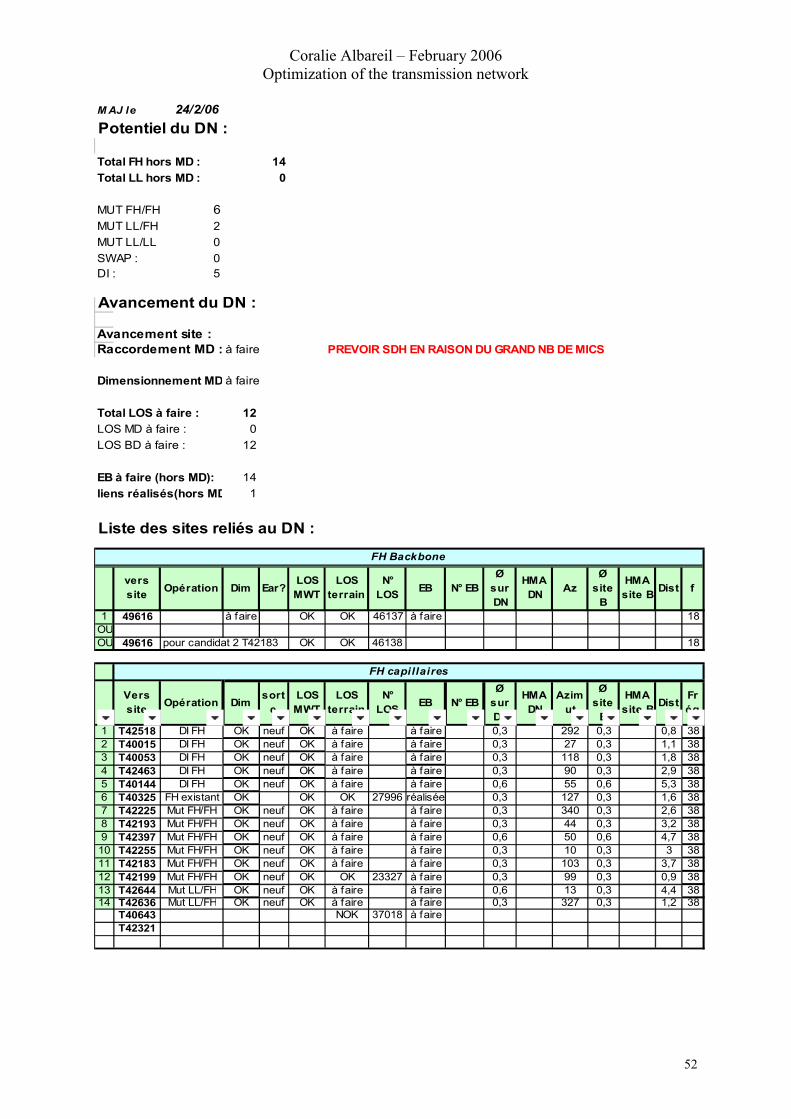
3.1.5.5 The follow up of the study The following document is the working paper which sums up the study for this new DN. The study has been made for our first candidate the site number T40024. The table is filled and has to be updated as soon as we have some new elements: Vers site : this column indicates all the sites which will be connected to our DN. This list can be changed: � A site can be added : for example in the case of the creation of a new site � A site can be deleted : for example if the real line of sight is NOK Operation: indicates the operation than we plan: � MUT FH/FH : The site is today connected by an electromagnetic wave to another site than our DN. It will be connected to our DN by the way of an electromagnetic wave. � MUT LL/FH : The site is today connected by a wired line to another site than our DN. It will be connected to our DN by the way of an electromagnetic wave. � MUT LL/LL : The site is today connected by a wired line to another site than our DN. It will be connected to our DN by the way of a wired line. � FH existant : The site is today connected to our new DN by the way of an electromagnetic wave � LL existante : The site is today connected to our new DN by the way of a wired line � SWAP The site is today connected to our new DN by the way of an electromagnetic wave. We will change the features of this electromagnetic wave (for example the use of an equipment with a different capacity) � DI FH : New site which will be connected by the way of an electromagnetic wave � DI LL : New site which will be connected by the way of a wired line Dimensioning: Indicates if the dimensioning has already been made
Coralie Albareil – February 2006 Optimization of the transmission network
51
Ear/sorte: Indicates if we will use a new equipment or not LOS MWT: Indicates if the simulated LOS is OK or not LOS terrain: Indicates if the real LOS is OK, NOK or if we have still to do it (a faire). As soon as the field LOS terrain is OK, we can fill the field hma. EB: indicates if the creation of the link has already been asked When the user will fill these fields, the first lines will be automatically filled and will give some practical information such as: the number of connected sites, the LOS we have still to do...
Coralie Albareil – February 2006 Optimization of the transmission network
52
M AJ le 24/2/06Potentiel du DN :
Total FH hors MD : 14Total LL hors MD : 0
MUT FH/FH 6MUT LL/FH 2MUT LL/LL 0SWAP : 0DI : 5
Avancement du DN :
Avancement site :Raccordement MD : à faire PREVOIR SDH EN RAISON DU GRAND NB DE MICS
Dimensionnement MD à faire
Total LOS à faire : 12LOS MD à faire : 0LOS BD à faire : 12
EB à faire (hors MD): 14liens réalisés(hors MD 1
Liste des sites reliés au DN :
vers site Opération Dim Ear?
LOS MWT
LOS terrain
N° LOS EB N° EB
Ø sur DN
HMA DN Az
Ø site
B
HMA site B Dist f
1 49616 à faire OK OK 46137 à faire 18OUOU 49616 pour candidat 2 T42183 OK OK 46138 18
Vers site Opération Dim
sorte
LOS MWT
LOS terrain
N° LOS EB N° EB
Ø sur DN
HMA DN
Azimut
Ø site
B
HMA site B Dist
Fréq
1 T42518 DI FH OK neuf OK à faire à faire 0,3 292 0,3 0,8 382 T40015 DI FH OK neuf OK à faire à faire 0,3 27 0,3 1,1 383 T40053 DI FH OK neuf OK à faire à faire 0,3 118 0,3 1,8 384 T42463 DI FH OK neuf OK à faire à faire 0,3 90 0,3 2,9 385 T40144 DI FH OK neuf OK à faire à faire 0,6 55 0,6 5,3 386 T40325 FH existant OK OK OK 27996 réalisée 0,3 127 0,3 1,6 387 T42225 Mut FH/FH OK neuf OK à faire à faire 0,3 340 0,3 2,6 388 T42193 Mut FH/FH OK neuf OK à faire à faire 0,3 44 0,3 3,2 389 T42397 Mut FH/FH OK neuf OK à faire à faire 0,6 50 0,6 4,7 3810 T42255 Mut FH/FH OK neuf OK à faire à faire 0,3 10 0,3 3 3811 T42183 Mut FH/FH OK neuf OK à faire à faire 0,3 103 0,3 3,7 3812 T42199 Mut FH/FH OK neuf OK OK 23327 à faire 0,3 99 0,3 0,9 3813 T42644 Mut LL/FH OK neuf OK à faire à faire 0,6 13 0,3 4,4 3814 T42636 Mut LL/FH OK neuf OK à faire à faire 0,3 327 0,3 1,2 38
T40643 NOK 37018 à faireT42321
FH Backbone
FH capillaires
Coralie Albareil – February 2006 Optimization of the transmission network
53
3.2 Update of the maps (IDU + MIC connectors)
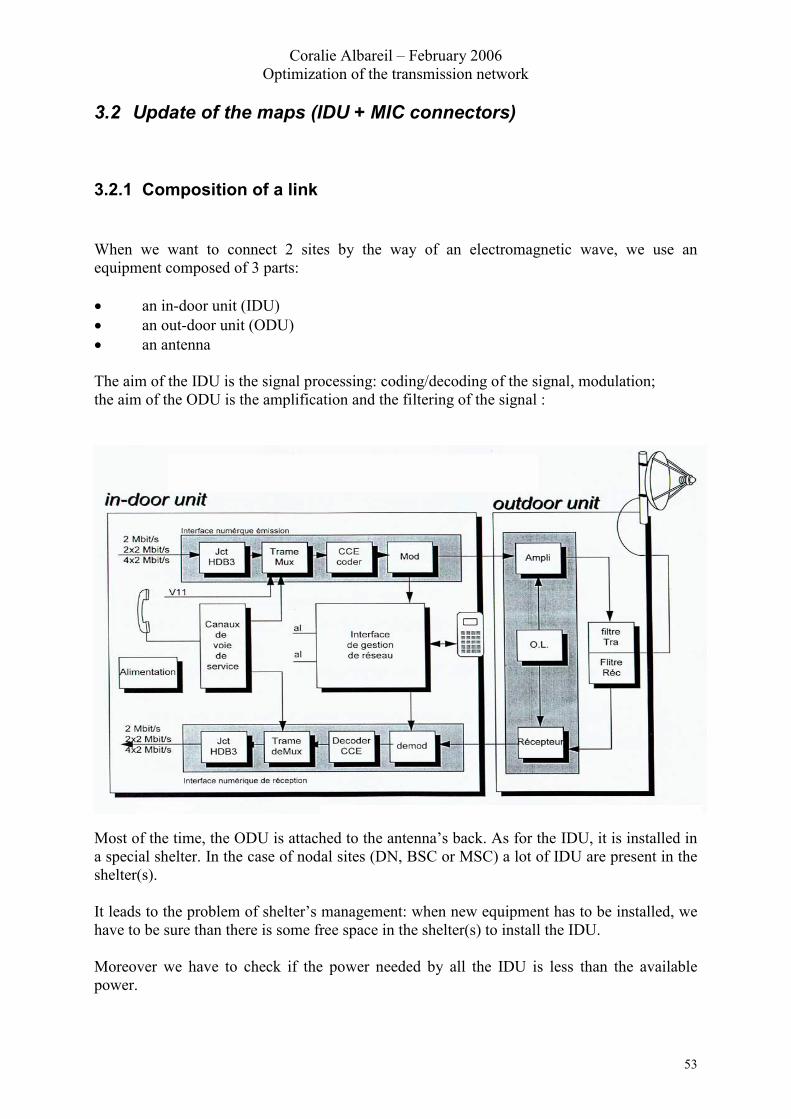
3.2.1 Composition of a link When we want to connect 2 sites by the way of an electromagnetic wave, we use an equipment composed of 3 parts: � an in-door unit (IDU) � an out-door unit (ODU) � an antenna The aim of the IDU is the signal processing: coding/decoding of the signal, modulation; the aim of the ODU is the amplification and the filtering of the signal :
Most of the time, the ODU is attached to the antenna’s back. As for the IDU, it is installed in a special shelter. In the case of nodal sites (DN, BSC or MSC) a lot of IDU are present in the shelter(s). It leads to the problem of shelter’s management: when new equipment has to be installed, we have to be sure than there is some free space in the shelter(s) to install the IDU. Moreover we have to check if the power needed by all the IDU is less than the available power.
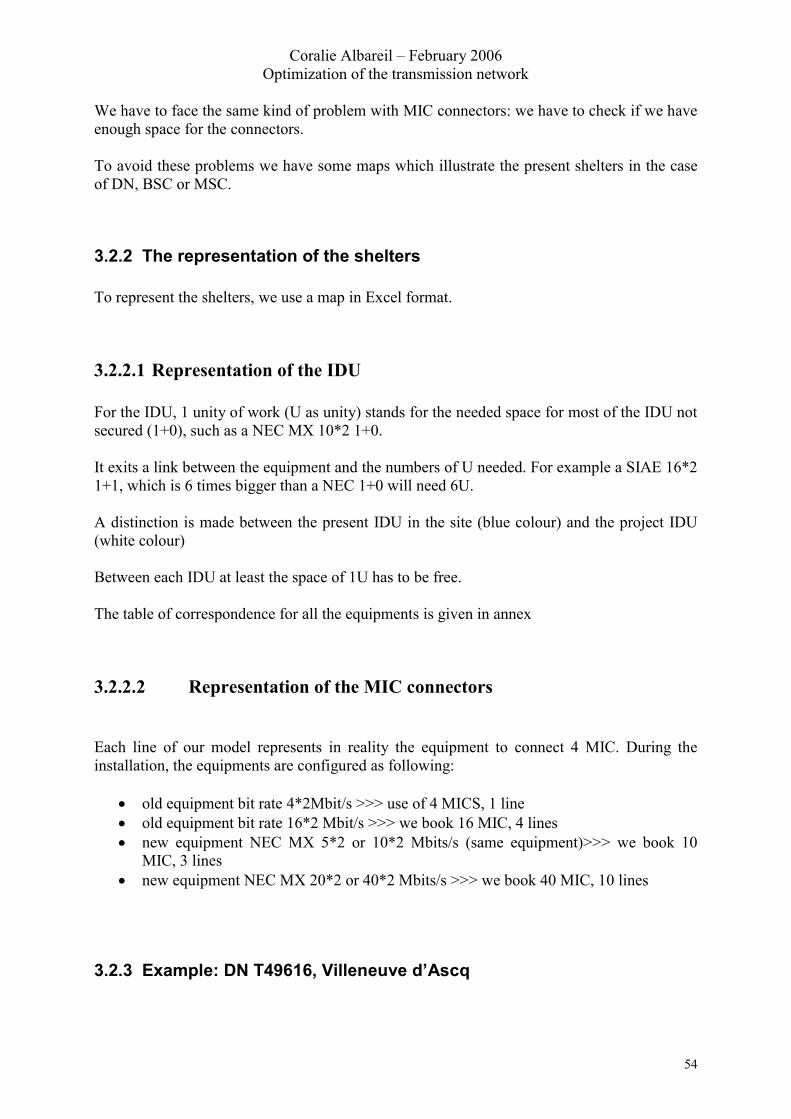
Coralie Albareil – February 2006 Optimization of the transmission network
54
We have to face the same kind of problem with MIC connectors: we have to check if we have enough space for the connectors.
To avoid these problems we have some maps which illustrate the present shelters in the case of DN, BSC or MSC.
3.2.2 The representation of the shelters To represent the shelters, we use a map in Excel format.
3.2.2.1 Representation of the IDU For the IDU, 1 unity of work (U as unity) stands for the needed space for most of the IDU not secured (1+0), such as a NEC MX 10*2 1+0. It exits a link between the equipment and the numbers of U needed. For example a SIAE 16*2 1+1, which is 6 times bigger than a NEC 1+0 will need 6U. A distinction is made between the present IDU in the site (blue colour) and the project IDU (white colour) Between each IDU at least the space of 1U has to be free. The table of correspondence for all the equipments is given in annex
3.2.2.2 Representation of the MIC connectors Each line of our model represents in reality the equipment to connect 4 MIC. During the installation, the equipments are configured as following:
� old equipment bit rate 4*2Mbit/s >>> use of 4 MICS, 1 line � old equipment bit rate 16*2 Mbit/s >>> we book 16 MIC, 4 lines � new equipment NEC MX 5*2 or 10*2 Mbits/s (same equipment)>>> we book 10
MIC, 3 lines � new equipment NEC MX 20*2 or 40*2 Mbits/s >>> we book 40 MIC, 10 lines
3.2.3 Example: DN T49616, Villeneuve d’Ascq
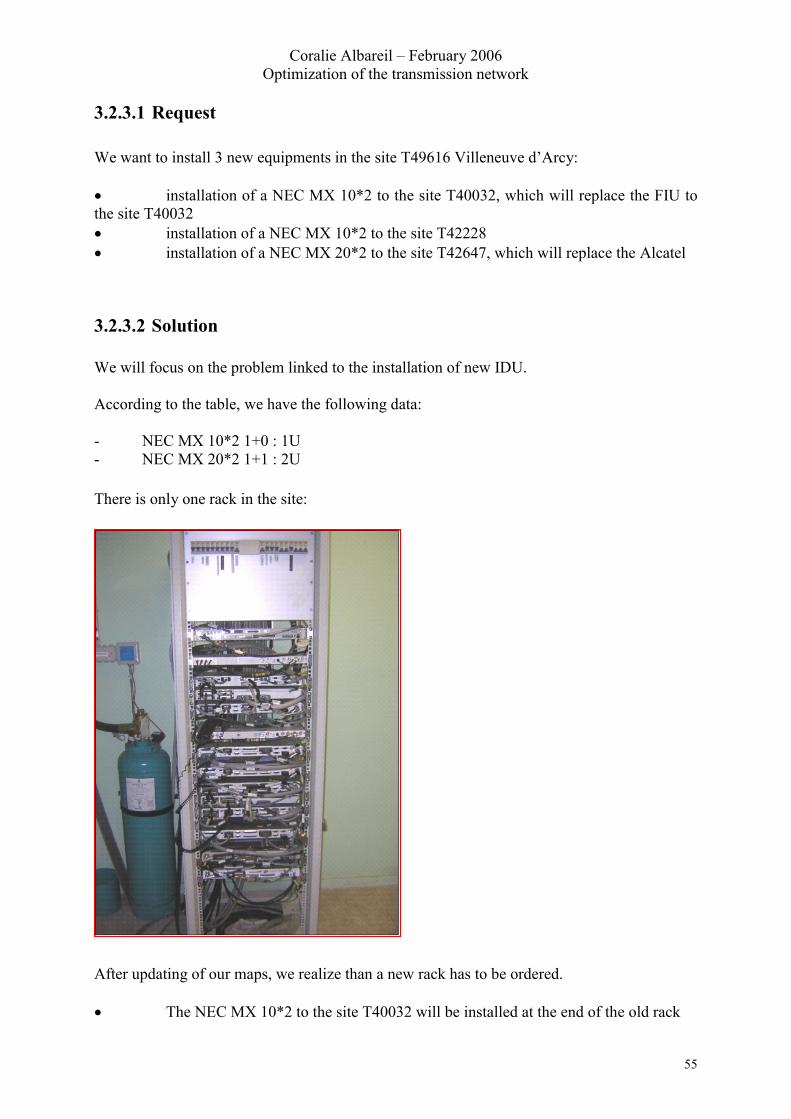
Coralie Albareil – February 2006 Optimization of the transmission network
55
3.2.3.1 Request We want to install 3 new equipments in the site T49616 Villeneuve d’Arcy: � installation of a NEC MX 10*2 to the site T40032, which will replace the FIU to the site T40032 � installation of a NEC MX 10*2 to the site T42228 � installation of a NEC MX 20*2 to the site T42647, which will replace the Alcatel
3.2.3.2 Solution We will focus on the problem linked to the installation of new IDU. According to the table, we have the following data: - NEC MX 10*2 1+0 : 1U - NEC MX 20*2 1+1 : 2U There is only one rack in the site:
After updating of our maps, we realize than a new rack has to be ordered. � The NEC MX 10*2 to the site T40032 will be installed at the end of the old rack
Coralie Albareil – February 2006 Optimization of the transmission network
56
� The NEC MX 10*2 to the site T42228 will take the free space occupied before by the FIU to the site T40032 � The NEC MX 20*2 to the site T42647 will be installed in the new rack.
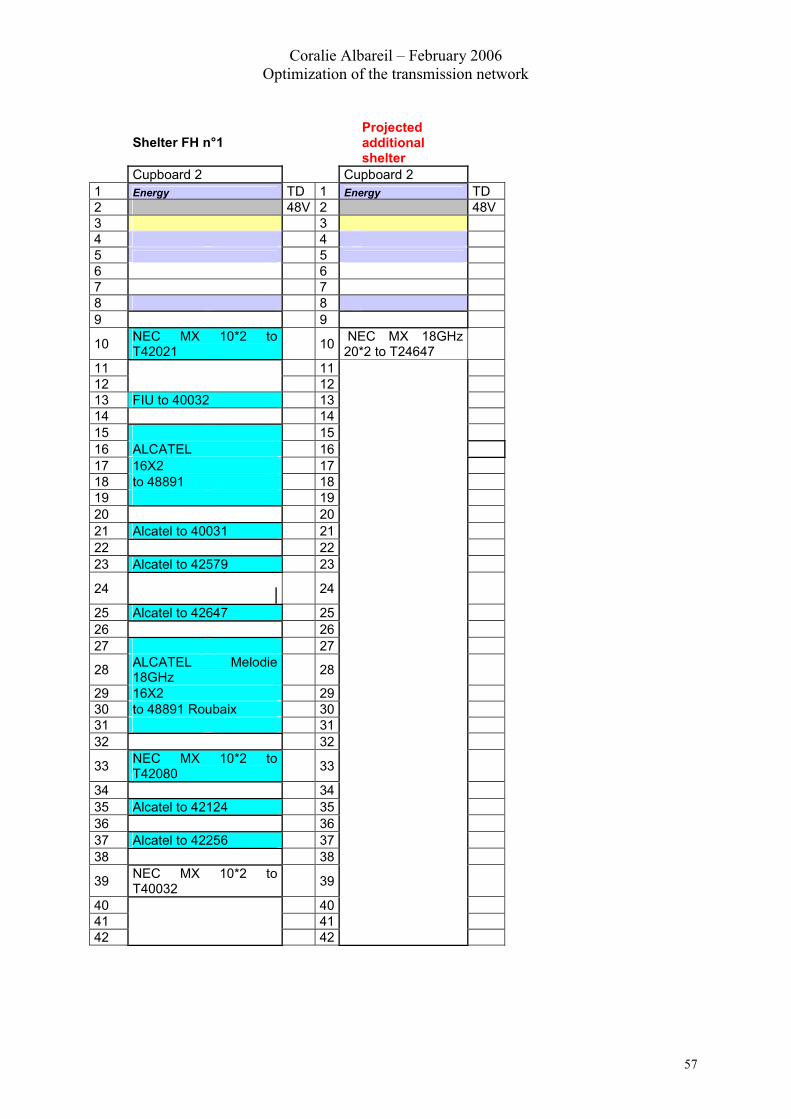
Coralie Albareil – February 2006 Optimization of the transmission network
57
Shelter FH n°1 Projected additional shelter
Cupboard 2 Cupboard 2 1 Energy TD 1 Energy TD 2 48V 2 48V 3 3 4 4 5 5 6 6 7 7 8 8 9 9
10 NEC MX 10*2 to T42021 10 NEC MX 18GHz
20*2 to T24647
11 11 12 12 13 FIU to 40032 13 14 14 15 15 16 ALCATEL 16 17 16X2 17 18 to 48891 18 19 19 20 20 21 Alcatel to 40031 21 22 22 23 Alcatel to 42579 23
24
24
25 Alcatel to 42647 25 26 26 27 27
28 ALCATEL Melodie 18GHz 28
29 16X2 29 30 to 48891 Roubaix 30 31 31 32 32
33 NEC MX 10*2 to T42080 33
34 34 35 Alcatel to 42124 35 36 36 37 Alcatel to 42256 37 38 38
39 NEC MX 10*2 to T40032 39
40 40 41 41 42 42
Coralie Albareil – February 2006 Optimization of the transmission network
58
3.3 The anticipation of problems in the transmission network
3.3.1 The building of wind turbines As we have already talked about, most of the links in Bouygues telecom’s network are done by the way of electromagnetic waves. The building of new wind turbines can consequently disturb our waves, obstructing the Fresnel’s area. When a new wind turbine’s project appears in the area, the positioning of the wind turbines in comparison to our magnetic waves will allow us to detect if they will disturb us. If yes, a feedback from the engineering team will allow the wind turbine’s company to change the localization of the turbines.
3.3.2 The use of a site by several operators It is quite common that another mobile operator wants to use a transmission site where Bouygues telecom is already installed. In this case the operator will provide the description of the project to Bouygues Telecom. There are 2 different cases: � Projects of cohabitation : when the site’s owner is Bouygues Telecom � Projects of coexistence: when the owner is a third identity. In all the cases, it is important to check: � If the project will not disturb our antennas; for example the installation of an element where we are already installed � In the case of projects of cohabitation, if the project will not avoid a projected evolution of our site.

Coralie Albareil – February 2006 Optimization of the transmission network
59
4 PART FOUR: ASSESSMENT OF MY MASTER THESIS
4.1 Assessment of the accomplished work
4.1.1 Every times some new objectives to deal with
When I started my master thesis in the company, the description of my objectives was quite short: to maintain the good work of the transmission network.
In fact, I practically realized than my first objective was to understand how the position of transmitter engineer works. I got this knowledge by dealing with practical cases; indeed I was quickly independent: I received some requests of optimization I had to solve and it was afterwards my responsibility to get informed to find the best way to answer.
That’s why, day by day, I discovered the different steps and tools I had to use to optimize the network; it means the process described in the second part of this paper. After around 1 month I was able to be quite autonomous for the regular problems and tasks I had to deal with.
Afterwards, progressively, as I was more aware of the work, several new objectives were defined during the meetings with my supervisor. These new objectives were dependent on the actual need of the company and the different priorities they had at this time. Most of the time, as these projects lead to a lot of changes in the network; my responsibility was higher, as each mistake could have more consequences.
4.1.2 Results get during my training period The previous parts 2 and 3 of this paper explained the different actions I had to do during my training period. This section sums up precisely when and in which context I played a part and realized these different steps.
4.1.2.1 Regular tasks During my training period, I was responsible for some regular tasks. It means, when a new request was given, I was the only one in charge of giving an answer:
Coralie Albareil – February 2006 Optimization of the transmission network
60
� Studies of all the optimization problems due to external causes � Update of all the maps IDU+connectors for all the new links in the area � Studies of all the wind turbines’ cases in the area � Dealing with all the projects of cohabitation and coexistence – transmission point of
view Additionally, I realized some link budgets. Contrary to the previous tasks mentioned, I was not responsible for the follow up of these actions.
4.1.2.2 Involvement in special projects
� New DN: I took part to the studies about the 15 new DN which are going to be created in the area: involvement in all the parts described in part 3. At this end of these studies, I had to present my results and the different DN to the team. I created the model of working file, filled it for the new DN and wrote the official requests to start the work on the new DN.
� Operational plan 2006: I was in charge of writing most of the “Expression de
Besoin” of the Operational Plan 2006. More practically, I wrote 58 EB, with the update of the study when necessary and the update of the databases.
� Project REAGIR: This project concerned 2 nodal sites MSC. For these 2 MSC, all
the equipment had to be moved to another room, in order to prevent fires. 27 “Expressions de Besoin” had been written.
� Project DMR13: This project involved 15 links, for which we had to change the
equipment. The old equipment called DMR13 had to be removed from the actual transmission network.
4.1.3 Assessment of my work
After the 7 months spent in the company, my view of the technical challenges a transmitter engineer in charge of optimization has to face is quite clear. I really have the feeling to have discovered an example of position we can have in mobile telecommunication domain. This point was one of my objectives and I am satisfied to have accomplished it.
Concerning the tasks and projects I was involved in, I realized than earlier the problematic cases are detected, easier it will be to solve them. I also understood than, even if the steps we have to follow are clear, we have most of the time to deal with some special cases, which need a more accurate analysis than only the application of an existing process. It was for example the case for the area around Bréhain we talked about in part 2, where some additional changes allowed to find a smarter answer. That’s why I tried as much as possible to be critical when applying the process. I think this behavior was beneficial to everyone: in one
Coralie Albareil – February 2006 Optimization of the transmission network
61
side my work was more reliable for the company, and in the second side it was more interesting for me to add my own expertise.
Moreover, I really appreciated to work on some special projects. As these kinds of projects had a higher impact on costs and come from strategic choices from the company, I felt more responsibility; it didn’t afraid me; contrary I think it was a good way to motivate me.
As for the points to be improved, I think I didn’t improve enough the existing working methods. It is also important to be creative and bring new answers to the company, even if it is not asked. For example, the method of updating the maps IDU + MIC connectors is today quite heavy and difficult to follow: the maps have to be updated after each installation: it is practically difficult to follow all the operations and not forget some of them. Moreover, it is difficult to totally trust our plans, which don’t every times correspond to reality. During my training period, I tried as much as possible to reduce the consequences of this weakness, but I didn’t think about a new process.
4.2 Teamwork in a company
As it was mentioned before, I had quickly to be independent and autonomous. I was not considered as a trainee but more as an engineer. More than getting a technical knowledge, to behave as an engineer also means finding quickly a place in a team. In one hand, as I started my position, I had to ask quite a lot of help to my colleagues; but in another hand I had also to be self confident concerning my choices and decisions.
At the beginning, it was sometimes difficult to ask for some information; I felt sorry to disturb people. I thought the best way to be accepted was to provide some good work and, as a trainee, being aware of my weak inexperience.
Progressively, I understood than the best way to find my place was, without of course being arrogant, to behave as a common associate in the company, and not as a “poor young trainee”. It doesn’t mean not to ask sometimes clarifications, but being more self confident with my work; and being able to explain people what I wanted to do, and why. With these new thoughts and knowing more the atmosphere of the company, I felt more and more confident and had more exchanges with people, where everyone had some ideas to share.
Today, I am really pleased with having learnt about teamwork in a company, which is quite different with teamwork at university. Today, I do not consider myself as a student, but more as a young engineer.
Coralie Albareil – February 2006 Optimization of the transmission network
62
Conclusion
Most of the time, when we are talking about a mobile network, people tend to forget the importance of the transmission network and just consider its radio part. Nevertheless, the transmission part of the network is essential; as it allows to bring back the signals to the BSC and MSC. A fail in this transmission network can have an important impact, even if the radio part perfectly works.
As we have seen, a transmission network is evolving, and we have to maintain
the good work of this network, such as each BTS is continually linked to the transmission network. Being in charge of the optimization asks for a good knowledge of the process, the engineering rules, the network and having a critical eye, as the conformity with studies and reality is sometimes difficult to get. But as the engineer also works with other people and teams, we had to trust his choices, that’s why it must be reliable and easily communicates.
Coralie Albareil – February 2006 Optimization of the transmission network
63
Bibliography
� Web sites : http://www.cs.ucl.ac.uk/staff/t.pagtzis/wireless/gsm/arch.html http://en.wikipedia.org/wiki/Modulation http://www.its.bldrdoc.gov/fs-1037/dir-030/_4362.htm http://images.google.fr/imgres?imgurl=http://e99ie.tripod.com/ADSL_Tutorial/4QAM.gif&imgrefurl=http://e99ie.tripod.com/ADSL_Tutorial/Evolution.htm&h=310&w=370&sz=4&tbnid=oRZdToJl-o-HsM:&tbnh=98&tbnw=118&hl=fr&start=1&prev=/images%3Fq%3D4QAM%26svnum%3D10%26hl%3Dfr%26lr%3D%26sa%3DN
� Bouygues Telecom’s specifications Définition des hauteurs libres sous trajet des liaisons hertziennes Mémo Définition DN TRN/TNA Support Transmission Formation OSI Bouygues Telecom
Coralie Albareil – February 2006 Optimization of the transmission network
64
Annexes Annex 1: GDL: Creation of a new link Annex 2: GDL: Example of an Expression de Besoin (EB) Annex 3: SDL: Visualization of a link Annex 4: Link budget with interferences Annex 5: Example of an OSI
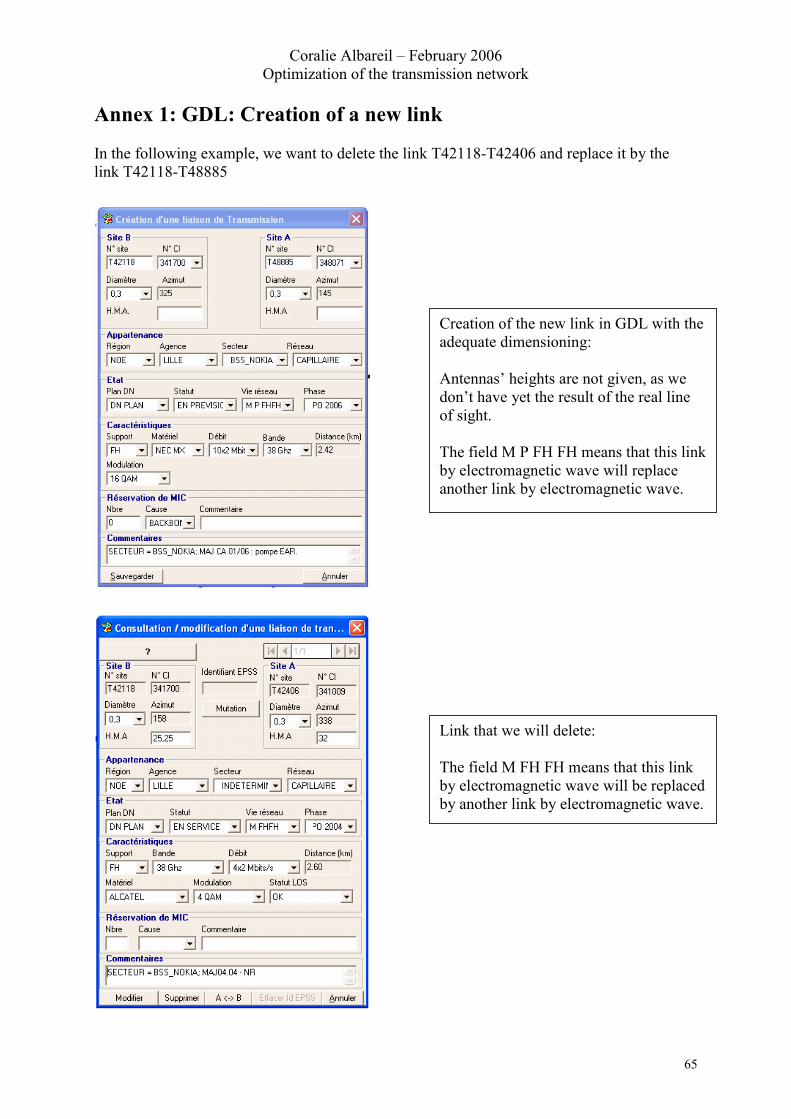
Coralie Albareil – February 2006 Optimization of the transmission network
65
Annex 1: GDL: Creation of a new link In the following example, we want to delete the link T42118-T42406 and replace it by the link T42118-T48885
Creation of the new link in GDL with the adequate dimensioning: Antennas’ heights are not given, as we don’t have yet the result of the real line of sight. The field M P FH FH means that this link by electromagnetic wave will replace another link by electromagnetic wave.
Link that we will delete: The field M FH FH means that this link by electromagnetic wave will be replaced by another link by electromagnetic wave.

Coralie Albareil – February 2006 Optimization of the transmission network
66
Annex 2: GDL: Example of an Expression de Besoin (EB) (1/2) This window sums up the Expression de Besoin (EB) which was written to create the link between the sites T42118 and T48885
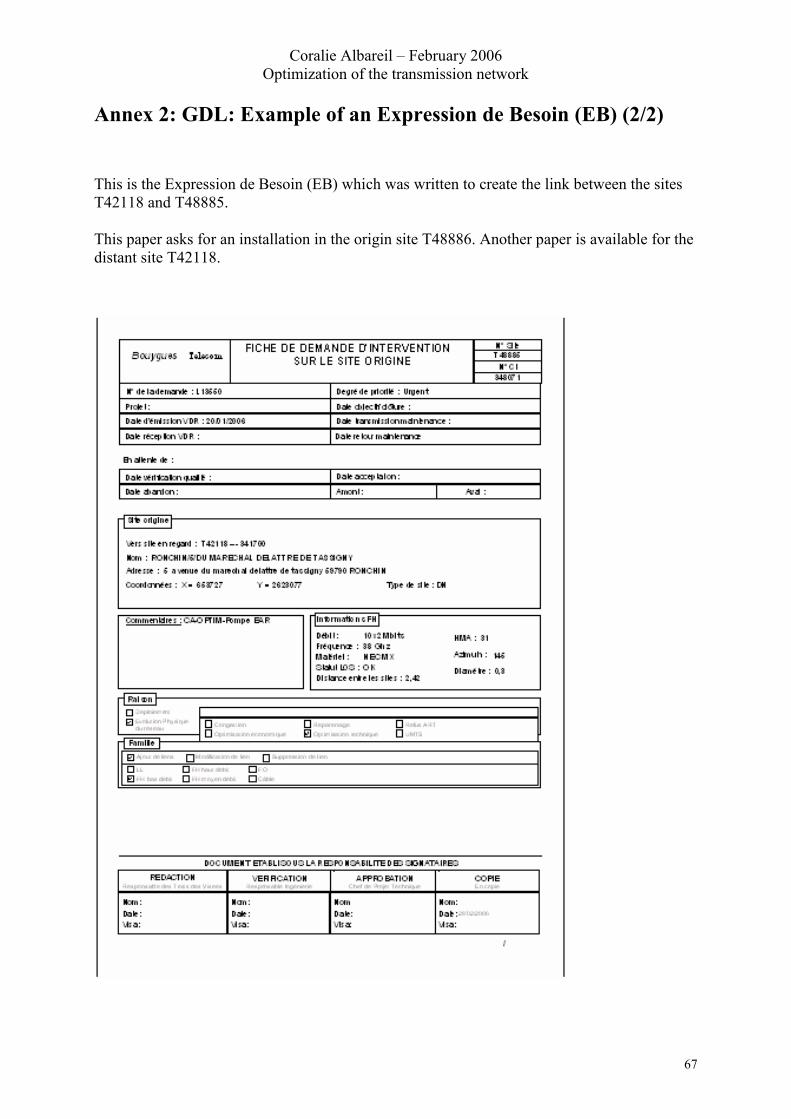
Coralie Albareil – February 2006 Optimization of the transmission network
67
Annex 2: GDL: Example of an Expression de Besoin (EB) (2/2) This is the Expression de Besoin (EB) which was written to create the link between the sites T42118 and T48885. This paper asks for an installation in the origin site T48886. Another paper is available for the distant site T42118.
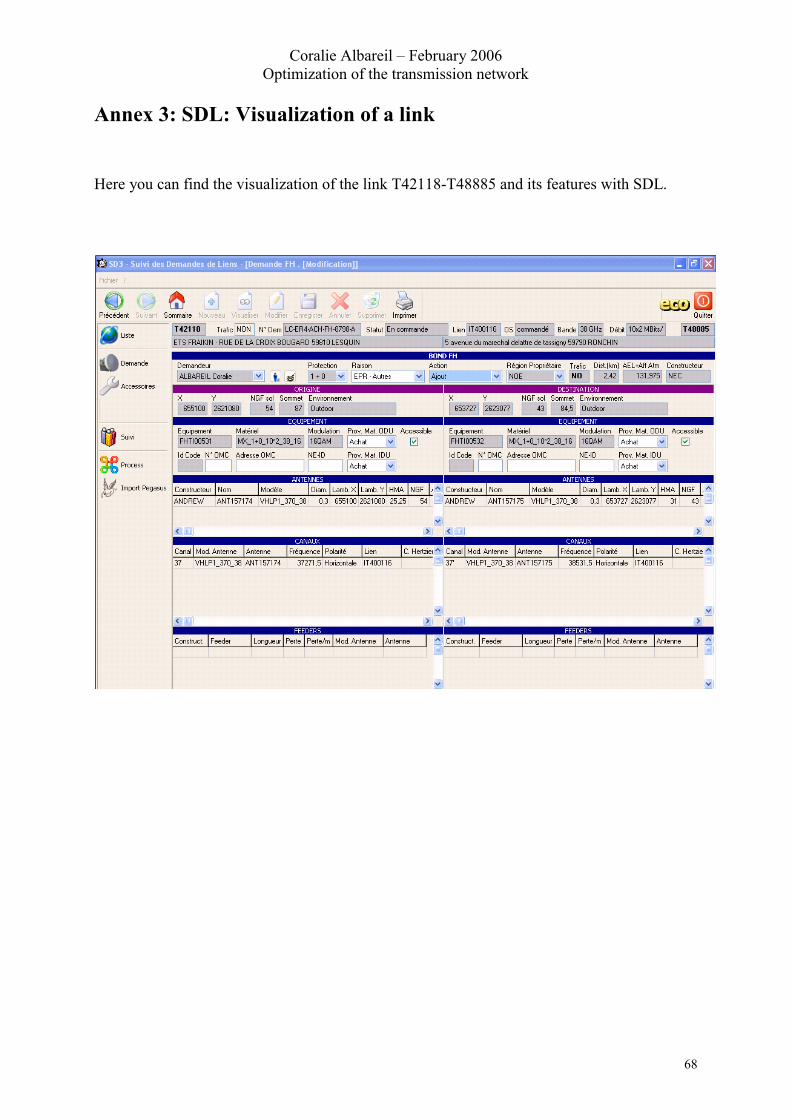
Coralie Albareil – February 2006 Optimization of the transmission network
68
Annex 3: SDL: Visualization of a link Here you can find the visualization of the link T42118-T48885 and its features with SDL.
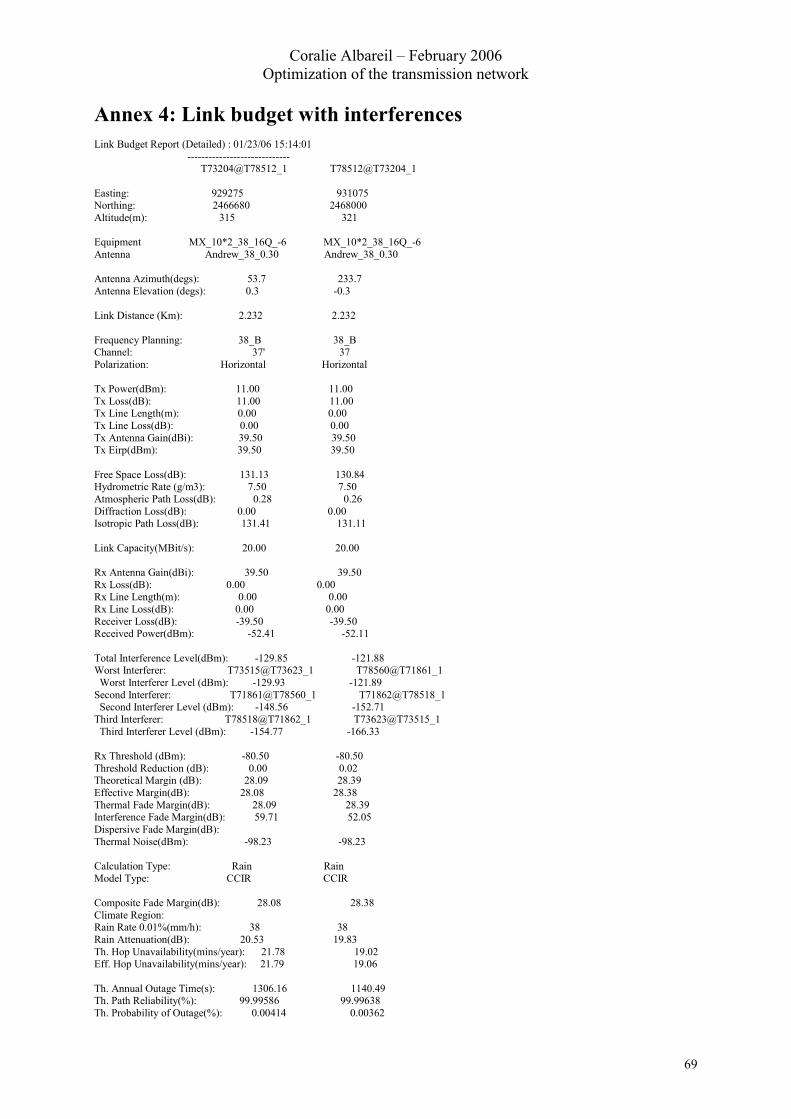
Coralie Albareil – February 2006 Optimization of the transmission network
69
Annex 4: Link budget with interferences Link Budget Report (Detailed) : 01/23/06 15:14:01 ----------------------------- T73204@T78512_1 T78512@T73204_1 Easting: 929275 931075 Northing: 2466680 2468000 Altitude(m): 315 321 Equipment MX_10*2_38_16Q_-6 MX_10*2_38_16Q_-6 Antenna Andrew_38_0.30 Andrew_38_0.30 Antenna Azimuth(degs): 53.7 233.7 Antenna Elevation (degs): 0.3 -0.3 Link Distance (Km): 2.232 2.232 Frequency Planning: 38_B 38_B Channel: 37' 37 Polarization: Horizontal Horizontal Tx Power(dBm): 11.00 11.00 Tx Loss(dB): 11.00 11.00 Tx Line Length(m): 0.00 0.00 Tx Line Loss(dB): 0.00 0.00 Tx Antenna Gain(dBi): 39.50 39.50 Tx Eirp(dBm): 39.50 39.50 Free Space Loss(dB): 131.13 130.84 Hydrometric Rate (g/m3): 7.50 7.50 Atmospheric Path Loss(dB): 0.28 0.26 Diffraction Loss(dB): 0.00 0.00 Isotropic Path Loss(dB): 131.41 131.11 Link Capacity(MBit/s): 20.00 20.00 Rx Antenna Gain(dBi): 39.50 39.50 Rx Loss(dB): 0.00 0.00 Rx Line Length(m): 0.00 0.00 Rx Line Loss(dB): 0.00 0.00 Receiver Loss(dB): -39.50 -39.50 Received Power(dBm): -52.41 -52.11 Total Interference Level(dBm): -129.85 -121.88 Worst Interferer: T73515@T73623_1 T78560@T71861_1 Worst Interferer Level (dBm): -129.93 -121.89 Second Interferer: T71861@T78560_1 T71862@T78518_1 Second Interferer Level (dBm): -148.56 -152.71 Third Interferer: T78518@T71862_1 T73623@T73515_1 Third Interferer Level (dBm): -154.77 -166.33 Rx Threshold (dBm): -80.50 -80.50 Threshold Reduction (dB): 0.00 0.02 Theoretical Margin (dB): 28.09 28.39 Effective Margin(dB): 28.08 28.38 Thermal Fade Margin(dB): 28.09 28.39 Interference Fade Margin(dB): 59.71 52.05 Dispersive Fade Margin(dB): Thermal Noise(dBm): -98.23 -98.23 Calculation Type: Rain Rain Model Type: CCIR CCIR Composite Fade Margin(dB): 28.08 28.38 Climate Region: Rain Rate 0.01%(mm/h): 38 38 Rain Attenuation(dB): 20.53 19.83 Th. Hop Unavailability(mins/year): 21.78 19.02 Eff. Hop Unavailability(mins/year): 21.79 19.06 Th. Annual Outage Time(s): 1306.16 1140.49 Th. Path Reliability(%): 99.99586 99.99638 Th. Probability of Outage(%): 0.00414 0.00362
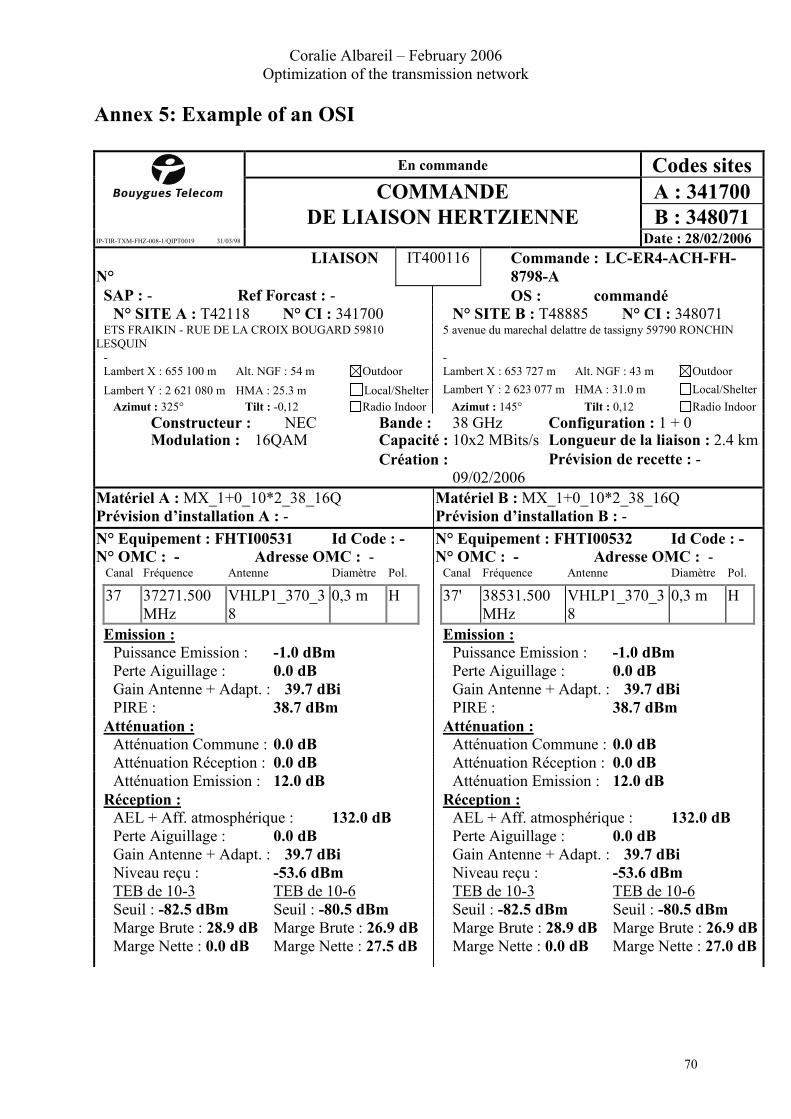
Coralie Albareil – February 2006 Optimization of the transmission network
70
Annex 5: Example of an OSI En commande Codes sites COMMANDE A : 341700 DE LIAISON HERTZIENNE B : 348071 IP-TIR-TXM-FHZ-008-1/QIPT0019 31/03/98 Date : 28/02/2006 LIAISON N°
IT400116 Commande : LC-ER4-ACH-FH-8798-A
SAP : - Ref Forcast : - OS : commandé N° SITE A : T42118 N° CI : 341700 N° SITE B : T48885 N° CI : 348071
ETS FRAIKIN - RUE DE LA CROIX BOUGARD 59810 LESQUIN
5 avenue du marechal delattre de tassigny 59790 RONCHIN
- - Lambert X : 655 100 m Alt. NGF : 54 m Outdoor Lambert X : 653 727 m Alt. NGF : 43 m Outdoor Lambert Y : 2 621 080 m HMA : 25.3 m Local/Shelter Lambert Y : 2 623 077 m HMA : 31.0 m Local/Shelter
Azimut : 325° Tilt : -0,12 Radio Indoor Azimut : 145° Tilt : 0,12 Radio Indoor Constructeur : NEC Bande : 38 GHz Configuration : 1 + 0Modulation : 16QAM Capacité : 10x2 MBits/s Longueur de la liaison : 2.4 km
Création : 09/02/2006
Prévision de recette : -
Matériel A : MX_1+0_10*2_38_16Q Matériel B : MX_1+0_10*2_38_16Q Prévision d’installation A : - Prévision d’installation B : -
N° Equipement : FHTI00531 Id Code : - N° OMC : - Adresse OMC : -
N° Equipement : FHTI00532 Id Code : - N° OMC : - Adresse OMC : -
Canal Fréquence Antenne Diamètre Pol. Canal Fréquence Antenne Diamètre Pol.
37 37271.500 MHz
VHLP1_370_38
0,3 m H 37' 38531.500 MHz
VHLP1_370_38
0,3 m H
Emission : Emission : Puissance Emission : -1.0 dBm Puissance Emission : -1.0 dBm Perte Aiguillage : 0.0 dB Perte Aiguillage : 0.0 dB Gain Antenne + Adapt. : 39.7 dBi Gain Antenne + Adapt. : 39.7 dBi PIRE : 38.7 dBm PIRE : 38.7 dBm
Atténuation : Atténuation : Atténuation Commune : 0.0 dB Atténuation Commune : 0.0 dB Atténuation Réception : 0.0 dB Atténuation Réception : 0.0 dB Atténuation Emission : 12.0 dB Atténuation Emission : 12.0 dB
Réception : Réception : AEL + Aff. atmosphérique : 132.0 dB AEL + Aff. atmosphérique : 132.0 dB Perte Aiguillage : 0.0 dB Perte Aiguillage : 0.0 dB Gain Antenne + Adapt. : 39.7 dBi Gain Antenne + Adapt. : 39.7 dBi Niveau reçu : -53.6 dBm Niveau reçu : -53.6 dBm TEB de 10-3 TEB de 10-6 TEB de 10-3 TEB de 10-6 Seuil : -82.5 dBm Seuil : -80.5 dBm Seuil : -82.5 dBm Seuil : -80.5 dBm Marge Brute : 28.9 dB Marge Brute : 26.9 dB Marge Brute : 28.9 dB Marge Brute : 26.9 dBMarge Nette : 0.0 dB Marge Nette : 27.5 dB Marge Nette : 0.0 dB Marge Nette : 27.0 dB