Embed Size (px)
Citation preview
8/10/2019 How Banks Make Money
http://slidepdf.com/reader/full/how-banks-make-money 1/67
Department of Economics and Business
MSc in Finance and international Business
Author:
Modestas Tomkus [289440]
Academic advisor:
Christian Schmaltz
Identifying Business Models of Banks:
Analysis of Biggest Banks from
Europe and United States of America
Cluster analysis of business model identifying
variables
Aarhus University: Business and Social Sciences
January 2014
8/10/2019 How Banks Make Money
http://slidepdf.com/reader/full/how-banks-make-money 2/67
Modestas Tomkus
[289440]
1 | P a g e
Abstract
The modern banking industry as a whole is often accused of being too volatile, too interdependent,
inflexible and operating under faulty business models (Huang, Lin 2012). It became difficult to
predict, control or even understand how banks conduct their business. These issues and many
others, though complex, can be addressed through a proper approach. Knowing under what
business models banks operate and how business models change in perspective to time or a bank’s
operative approach can provide valuable insight into the whole banking industry.
The thesis aims to determine the bank business models through the use of publicly available
information. The problems faced include the proper determination of business model identifying
variables, analysis for changes in business models, and bank behaviour in time and specific event
perspectives. Additional interests include: a banks’ ability to self -identify their own business model,
and self-identified business model comparability with analysis-derived business models. The sample
consists of 63 banks from Europe and the United States of America. Institutions were observed in
the time period between 2007 and 2012, which comprised the data set of 378 bank-year
observations.
The business model determination procedure included: the observation of the bank’s position in the
real world, a recording of that position by the use of 6 constructed identifiers, and assigning each
observed bank its position (a point) in a confined multidimensional data set. By employing a
hierarchical clustering analysis, the data set was used to group banks according to the shortest
squared Euclidian distances measured between the banks.
The performed clustering analysis findings suggested a 3 cluster solution, thus identifying 3
distinctive business models. The pooled data analysis identified model A (1) with features of a
wholesale-oriented universal banking business model containing 39 mostly European origin banks.
The model B (2) containing 18 mostly banks from USA featured a retail banking business model. The
model C (3) containing 6 banks mostly from USA was identified as the investment banking business
model.
The clustering analysis performed for every year provided the evidence for significant changes in the
business model formation in the years 2008 and 2011, when both the number of banks and the
business model defining variable values fluctuated significantly if compared to results obtained from
the pooled data clustering. The identifier value fluctuation in 2008 was determined to be a result of
the financial crisis of 2008, while the less volatile changes observed in 2011 identified the stock
market fall of August 2011 and its consequences.
8/10/2019 How Banks Make Money
http://slidepdf.com/reader/full/how-banks-make-money 3/67
Modestas Tomkus
[289440]
2 | P a g e
An investigation of bank dependency to a certain business model throughout the observed period
provided evidence that banks do change their business model as a reaction to changing
environments. However, a big part of an observed bank migration between business models is a
consequence of a changed business model structure for the years corresponding to significant
financial market events.
The analysis for self-defined business models proven to be complicated as observed banks in general
do not provide an exact business model definition, often due to terminology misinterpretation or
simply because banks find it unnecessary to provide such information. Consequently, a large part of
acquired data is a result of interpretation of the latest published annual statements or official
websites. The self-defined business models in general were communicated as universal banking
business models, while the retail based models were more than 4 times less popular. In the same
setting the investment oriented models matched exactly to those derived through clustering.
In summary, the performed study proved to be technically capable of identifying business models for
the sampled banks and provided analytical insight in the constructed business models and banks
within the observation period. Nevertheless, the results of the study are highly dependent on
multiple factors that defined the processes and methodology of this study, thus, the results of the
study should be evaluated with care.
Keywords:
Cluster analysis, business models, European banks, USA banks, self-defined business
models, auto-defined business models
8/10/2019 How Banks Make Money
http://slidepdf.com/reader/full/how-banks-make-money 4/67
Modestas Tomkus
[289440]
3 | P a g e
Table of ContentsAbstract ................................................................................................................................................... 1
1. Introduction .................................................................................................................................... 5
1.1 Motivation and problem statement ............................................................................................. 5
1.2 Delimitation .................................................................................................................................. 7
1.3 Structure of the thesis .................................................................................................................. 8
2. Banking Business overview ............................................................................................................. 9
2.1 The impact of deregulation ........................................................................................................... 9
2.2 Financial Crisis of 2008 ................................................................................................................ 11
2.3 The August 2011 stock markets fall ............................................................................................ 13
3. Literature Review on Banking Business Models ........................................................................... 14
3.1 Concept idea and supporting theory .......................................................................................... 14
3.2 How is the banking business model defined? ............................................................................. 19
4. How banks earn money? .............................................................................................................. 20
4.1 Funding ....................................................................................................................................... 21
4.2 Use of Funds ................................................................................................................................ 22
4.3 Risk-taking ................................................................................................................................... 27
4.4 Bank classifications ..................................................................................................................... 28
5. Data ............................................................................................................................................... 30
5.1 Sample selection ......................................................................................................................... 30
5.2 Bank business model defining variables ..................................................................................... 32
5.3 Construction of variable subset for further analysis................................................................... 33
5.4 Descriptive statistics of a variable subset ................................................................................... 34
5.4.1 Customer Deposits over Assets (CDA) ................................................................................. 34
5.4.2 Income from Fees and Commissions over Operating Income (IFO) .................................... 36
5.4.3 Interbank Liabilities over Total Assets (BLA) ........................................................................ 37
5.4.4 Net Interest Income over Operating Income (NIO) ............................................................. 37
5.4.5 Tangible Common Equity over Tangible Assets (TEA) ......................................................... 39

8/10/2019 How Banks Make Money
http://slidepdf.com/reader/full/how-banks-make-money 5/67
Modestas Tomkus
[289440]
4 | P a g e
5.4.6 Trading Assets over Total Assets (TAA) ................................................................................ 40
5.5 Data identifying self-defined business models ........................................................................... 41
6. Identifying Banking business models ............................................................................................ 42
6.1 Business model determination methods and limitations ........................................................... 42
6.2 Results ......................................................................................................................................... 44
6.2.1 Determining the number of clusters .................................................................................... 44
6.2.2 Characterisation of identified business models ................................................................... 45
6.2.3 Business model membership based on banks’ headquarter location ................................. 49
6.2.4 Business models derived for each year in the observation period ...................................... 51
7. Self-defined business models ....................................................................................................... 60
7.1 Data analysis and result .............................................................................................................. 60
8. Conclusions ................................................................................................................................... 62
References ............................................................................................................................................ 64
Appendixes ............................................................................................... Error! Bookmark not defined.
8/10/2019 How Banks Make Money
http://slidepdf.com/reader/full/how-banks-make-money 6/67
Modestas Tomkus
[289440]
5 | P a g e
1. Introduction
1.1 Motivation and problem statement
Background
The modern economy is a complex system of value creation and transformation, where people and
entities play a significant role. The financial markets and institutions took it to new heights of
efficiency and funding accessibility for further value creation. We learned to benefit from financial
system implications, however, at the same time, we became dependant on it.
The closest and most recognisable financial institution for a common person is a bank. With
perspective of added-value and safety, we increasingly entrust funds and personal financial
operations to our banks. At the time of need, we trust these same financial institutions to aid us bylending the required funds. Never the less, the real dependency becomes apparent only when a
failure of financial markets directly affects us.
The increasing number and severity of financial market failures are among major concerns for the
public, industry professionals, and scholars. While specialists argue what is to be blamed, everyone’s
trust in banks gradually decreases. The previous financial market failure investigations provided with
suggestions of what could have been done to prevent disaster (Llewellyn 2010), yet similar
tendencies keep reoccurring in later events.
The modern banking industry as a whole is often accused of being too volatile, too interdependent,
inflexible and operating under faulty business models (Huang, Lin 2012). It became difficult to
predict, control or even understand how banks conduct their business. These issues and many
others, though complex, can be addressed through a proper approach. Knowing under what
business models banks operate and how business models change in perspective to time or a bank’s
operative approach can provide valuable insight into the whole banking industry.
The banking business model identification is a relatively new approach towards the banking industry
analysis. Nevertheless, the banking business model analysis offers a wide range of applications.
Several authors already employed this type of analysis, generating promising results. Ayadi et al.
discusses the effects of the financial crisis by deriving business models from a sample of 26 European
banks (Ayadi, Arbak et al. 2011). A follow-up study of Ayadi et al., that was published in 2012,
employs similar techniques but uses a bigger European bank sample and focuses primarily on the
impact of banking regulations (Ayadi, Arbak et al. 2012). A similar study aimed towards European
banks’ business model identification is published by Robert Ferstl and David Seres, who used a large
bank sample but showed a specific interest towards Austrian banks (Ferstl, Seres 2012).
8/10/2019 How Banks Make Money
http://slidepdf.com/reader/full/how-banks-make-money 7/67
Modestas Tomkus
[289440]
6 | P a g e
All these previous studies show a variety of applications and even variations in the methodologies
used, however, only European banks were analyzed in specific settings, thus allowing for further
studies to be conducted. By building on and further exploring the field-tested methodologies, a
banking business model analysis that includes banks from Europe and the United States of America
could be performed.
With sufficient access to publicly available information regarding European and USA banks and their
activities, a study could be performed to identify what business models banks operate under. Using
the business model as a framework could provide us with the ability to better structure and classify
banks, observe business model characteristics and possible changes. An additional analysis of how
observed banks define their own business model could provide us with valuable insight into
management’s understanding of what their business model is and how it compares to models
derived with statistical tools.
Insights and analysis of structured data of this study could help in building future studies to
understand why market failures affect so many banks. Findings and/or techniques could also be
used to model future bank behaviour, effects on financial or regulative innovations, and for a
number of other research and analytical purposes.
Problem statement
The primary goal of this thesis is to examine if it is possible to analyse the European and USA banking
sector through the use of publicly available data, determine which variables characterize the banking
business models and identify the major business models characteristic to the banking industry.
Additionally, the chosen variable values will be compared in the perspective of time, in order to test
whether the results would be able provide an insight of possible changes undertaken by banks as a
response to recent significant events and the state of economy. Finaly, the paper will seek to analyse
how the sampled banks define their own business models and how it compares to the overall study
findings.
Specifically, the paper will seek to determine:
1. Which variables define a business model of the bank?
2. What type of bank business models can be derived?
3.
Do banks change/alter/evolve their business models as a response to a change in significant
events or economic state?
4.
When business models are identified, do their definition (variable means) change with the
respect to time.
8/10/2019 How Banks Make Money
http://slidepdf.com/reader/full/how-banks-make-money 8/67
Modestas Tomkus
[289440]
7 | P a g e
5.
How banks identify their own business model and how it compares to study findings?
This paper will also consider additional questions:
1.
What method should be use to determine bank business models
2.
Can we derive business model defining variables from publicly accessible information?
3.
How can one identify the auto-defined business models of banks?
Research approach
Firstly, a whole scale literature review will be performed to collect all possible topic-related
information published on reliable websites, academic articles and journals. Tendencies and
abnormalities observed within the topic of interest will be identified and analyzed. Later, the derived
banks’ business models will be interpreted and discussed using this gathered information.
This thesis investigates 63 biggest banks from Europe and the United States of America between the
years 2007 and 2012. Data is acquired from the Banscope database. By relying on literature review
findings, the data posing as variables most likely identifying the banks’ business models are chosen
for cluster analysis. Later on, a hierarchical cluster ing analysis is performed to generalize the banks’
business models with the use of pooled data. Additionally, the same clustering technique is applied
to the data for every year in the sampled period. The findings of both methods are compared,
analyzed and interpreted from the perspective of time, banks and business models.
Accompanying the cluster findings is a study of how banks define their own business model is
performed. The acquired results are compared with findings resulting from the cluster analysis.
1.2 Delimitation
The thesis is focused primarily on deriving the banking business models for the European and United
States of America-centred banking industry: therefore, only banking institutions headquartered in
these regions will be considered in the data sample for the business model determination. Such
geographical selection was employed due to the anticipated similarity in cultures and business
practices. Furthermore, only the largest active banks and banking groups with end-of-year data for
2007 to 2012 were considered. The size of the sampled institutions is chosen to exceed 40,000
million euros in total assets recorded in the year 2012, as it is expected that such a size will be
sufficient to absorb full benefits of economies of scale. To ensure that the sampled banks are not
controlled/influenced by external parties/shareholders, only independent banks were selected. A
Bureau Van Dijk’s independence indicator (Bankscope 2013) was used that characterizes an entity’sindependence from its shareholders. In an attempt to further isolate “self -managing” banks,
8/10/2019 How Banks Make Money
http://slidepdf.com/reader/full/how-banks-make-money 9/67
Modestas Tomkus
[289440]
8 | P a g e
institutions that formed through mergers in the period of interest are eliminated from the final
sample.
The banking business model concept used in this study can be defined as: a representation of a set
of components utilised to outperform the competition and to achieve optimal profit in a financial
market where a similar product strategy is used.
The business model identifying variable definition used in this study is described as: a publicly
available, standardised data which records a tangible, comparable value of an element that
significantly effects and defines a bank’s approach towards its funding, business driving
products/services and/or risk-taking.
The derived business models will be analyzed trough the use of descriptive statistics for the pooled
and annually based data. Business models will be analyzed from three perspectives: identification ofbase business models and their features with the use of pooled data, identification of business
models and their features for every year in the sampled period to assess formation changes of the
models and bank-model membership throughout the sampled period.
The self-defined business model identification will be restricted to the analysis of a bank’s annual
statements (for 2012) and official websites. The acquired data will be interpreted, summarized and
compared to the business models derived through clustering.
All findings of this thesis are unique due to the methodology used as well as the implied limitations,
thus, the results must be interpreted with care.
1.3 Structure of the thesis
The structure of the thesis is as follows: Section 2 will present the banking business overview with
the intention of introducing the essential elements of the banking industry that are necessary to
comprehend how and why banks conduct their business in a certain way. The banking business is
displayed through evolutionary views, where the most significant events and tendencies are
presented. Section 3 will present a short overview of the most influential theories and general
considerations of the business model. In addition, a summarised business model interpretation will
be presented. Section 4 will present an explanatory summary of the banking business logic and
practices. A short explanation of how banks generate funds, assess risk and provide revenue driving
services will be presented. Section 5 will present the database and its construction approach;
additionally, a list of the bank business model-defining variables will be provided together with a
short characteristic analysis performed through the use of descriptive statistics. Section 6 will
present the methodology used to identify the bank business models, justify the choice of algorithms,and present the necessary steps taken to generate credible results. Additionally, the generated
8/10/2019 How Banks Make Money
http://slidepdf.com/reader/full/how-banks-make-money 10/67
8/10/2019 How Banks Make Money
http://slidepdf.com/reader/full/how-banks-make-money 11/67
Modestas Tomkus
[289440]
10 | P a g e
traditional activities by leveraging their core competitive advantages: well-developed distribution
networks, and experience in risk assessment gained through servicing retail and corporate
customers.
Economies of scale and technological advances
Before the deregulation wave in late 20th
century, banks in the United States and in Western Europe
were highly dependent on the region they were operating in. Only high local demand for banking
services could fuel the limited growth of local banks. Adding to that, strict industry regulations
largely prevented profiting through economies of scale.
Only when deregulation acts, which allowed fair competition and geographical expansion, were
implemented, banks became aware of new strategic possibilities. Now, banking companies were
free to enter new markets either by acquiring existing competitor bank franchises or by opening oneof their own. Furthermore, bank holding companies were finally able to create a system of branch
offices by consolidating previously independent affiliates. Waves of acquisitions and takeovers
followed radically, which changed the structure of banks. Newly grown banks learned to exploit their
size and, as a result, decrease marginal costs. Having the ability to reduce service prices offered
them a substantial competitive advantage. Additionally, to expansion in scale, bank holding
companies heavily invested in non-traditional financial services. Insurance and merchant banking
company acquisitions were another logical step towards expanding the scope of business. Bank
holding institutions combined experience and knowledge gained in banking and by using it quickly
adapted to insurance and merchant banking businesses. Risk assessments became more accurate
and available for affiliates, decreasing service costs in newly acquired lines of business.
Following competition encouraged by deregulation, growth in scale and scope a new accelerant
joined the mixture. In the late 20th
century, technological advancement was met with growing
application throughout the industries. The banking industry was no exception. By achieving
economies of scale, which is necessary in order to apply technology efficiently, banks were able to
swiftly adapt and adopt new technology. Technological solutions such as computers, internet, credit
cards, and digital information storage radically changed many core processes in banking industry.
Information accessibility increased rapidly, which, if combined with automated and optimised
information processing, offered faster and more precise decision –making. These decreases in costs,
information processing and customer servicing time summed up in substantial growth of profits.
The Online service, electronic payments, credit cards, and online brokerage are just a few of among
hundreds of products and their versions that became available with advancements in technology
used. Most importantly, the very core of traditional banking – intermediation - undertook a major
8/10/2019 How Banks Make Money
http://slidepdf.com/reader/full/how-banks-make-money 12/67
Modestas Tomkus
[289440]
11 | P a g e
update with this technological wave. By representing a link between parties with excess of liquidity
(depositors) and those that are in need of liquidity (borrowers), banks earn a major share of their
earnings. Furthermore, applied technological solutions accelerated geographical expansion in the
form of increased presence in the home market to nearly unlimited global reach.
2.2 Financial Crisis of 2008
The Gold Rush
With newly-widened horizons of expansion and innovation, banks quickly recognised that only the
front runners will be running the future financial markets and profiting from them; meanwhile,
institutions that lagged behind will fail or be consumed by competition. Fuelled by obsessive
optimisation and innovation, and barely restricted by optimistic regulators, banks entered the
modern equivalent of the gold rush in the turn of the 21st century. Core features of this rush point
to rapid and unsustainable financialisation tendencies. A banks’ role within the financial system
strengthened. An increase in interconnectedness and integration among banks and financial
institutions became evident.
A bank provides liquidity, transforms maturities, manages risk and develops financial innovations.
The performance regarding these operations eventually defines whether a bank acts as a financial
market shock absorber or originator. While the market expects banks to prevent market shocks,
reality offers evidence of the opposite result. The financial crisis of 2008 shook markets to their core,
uncovering major issues that were rooted into banking industry.
While deregulation and technological advances inflicted bank expansion, the competition was its
main driving force. A tendency for excess leverage and under-capitalisation became noticeable
among many banks as a means for increased competitiveness. Banks operated in a way that
undermined their riskiness, which often was highly inflated due to rising proportions of leveraged
assets (Wehinger 2008). A tendency to operate on under-priced riskiness became part of the
business, as no substantial event challenged this approach. Additionally, market trust and high
demand for cheap loans further encouraged banks to disregard any concerns about high levels of
leverage. A supply and demand for cheap loans, provided increased levels of profit to banks as well
as artificially lowered the cost of capital . While financial markets justified lowered capital costs by
increased market efficiency, the actual risks kept accumulating in the banking sector. To make
matters worse, banks with insufficient levels of funds to fill the demand for loans turned to short-
term inter-institutional funding. Such funding offered the banks the ability to operate on more
profitable short-term strategies and maximize the rate of return on equity. In the pursuit of greater
8/10/2019 How Banks Make Money
http://slidepdf.com/reader/full/how-banks-make-money 13/67
Modestas Tomkus
[289440]
12 | P a g e
revenues, banks developed internal reward systems which were structured around the further
preference for short-term business and underestimated risk-taking (Llewellyn 2010).
Risk underestimation was a common sight and was partially overlooked; however, the concept of
risk itself was never ignored. In fact, most of the financial innovation done during the “banking gold
rush” was meant to limit the risk or, preferably, transfer it. Developed financial instruments that
transferred risks from the loan originators (derivatives) to external parties became extremely
popular. These derivative contracts often featured extreme complexity and a combination of
multiple loans, making it difficult to trace back to the risk-baring loans exactly. Despite the fact that
derivatives were rarely fully understood by investors, demand did not fall. High returns and
combined credit ratings were just too good to be ignored and became part of market euphoria.
Ultimately, the lack of understanding and complexity of these securities inflicted doubtfulness anddistrust in the real riskiness of the investments to be made. Cautious tendencies transferred into the
market and exponentially slowed down derivative trade. Soon enough, banks and other financial
institutions holding securities found it impossible to trade derivatives, as the demand simply
disappeared. Similarly, cautiousness was quickly adopted by most financial markets and businesses
in expectation of defaulted investments.
Incapable of liquidising huge holdings of securities, banks quickly realised the need for outside
funding in order to keep operations running. However, by this time market funding was already
nearly frozen. As mentioned earlier, banks which were formerly short-term oriented, were
increasingly dependent on wholesale funding. In fact, bank business models were increasingly
integrating dependence on outside financial institutions, eventually creating vast networks of banks
largely functioning on the expectation that market situation will not change (Thakor, Boot 2010).
Consequently, when tightly interconnected banks encountered funding issues, the effect was quickly
transferred throughout the whole network. This effect became partially responsible for the severity
of the financial crisis itself.
Additional additive to the scale of the market failure was lack of diversity . At the time when banks
developed their strategies, they often diversified their business lines. If evaluated on its own, such a
strategy offers significant operational safety in the event of one of the business lines failure. Never
the less, when major part of market players adopts similar diversification strategies, a general
business similarity is unavoidable and potentially catastrophic in the event of failure.
8/10/2019 How Banks Make Money
http://slidepdf.com/reader/full/how-banks-make-money 14/67
Modestas Tomkus
[289440]
13 | P a g e
The Aftermath
The financial crisis of 2008-2009 is constantly being referred to when economy growth, stability and
future is at question. Events that led to the crisis, the methods used to cope with it, and the harsh
consequences of it now serve as an expensive lesson.
Trillions of euros spent by governments around the world to refinance banks and even countries
added to the huge estimated losses for the global economy. Though the fiscal cost severity of this
crisis is lower in comparison to historic crises (Deutsche Bank AG 2010), the overall effect was and
still is substantial. In the attempt to properly manage and supervise the weakened industry,
regulation was to be toughened up. While regulators are trying to come up with suitable regulatory
instruments, industry players warn about the possibility of over-regulation. Technological and
innovation advancements prevent the industry from being as tamed as it was before. A totally newapproach has to be taken. Among regulatory institutions, the Basel Committee on Banking
Supervision stands out, which in December 2009, suggested regulatory proposals in the form of
“Basel III”. It was taken through the process of optimisation, testing and updating. New standard
regulations were expected by the end of 2012 (currently postponed to January 2014). Suggested
regulations for the banking industry form a long list of tools developed to achieve a balanced
complimentary effect. The list of these tools generally includes: capital requirements to ensure
short- and long-term liquidity, standard stability indicators to assess additional stability features and
totally new security measures covering bank interconnectivity, excessive expansion as well as other
risks (Europe Intelligence Wire 2010).
In regards to the changing environment, banks have no other choice but to adjust to market
“climate”. Business models developed during the “banking gold rush” were no longer performing
because of the crisis, when funding became scarce. Many banks engaged in a survival mode, running
only essential business lines. Further business model developments accrued post initial hit, when
new, safe and steady, more traditional banking practices were adopted. Cautious industry and
increased regulatory pressure does not allow for the rebirth of harmful pre-crisis practices.
Regaining customer and shareholder trust is at its highest level of importance, thus representing the
major tendencies in current banking business models.
2.3 The August 2011 stock markets fall
This event is identified as a sudden drop in stock prices in the August of the year 2011. The stock
markets around the world were a part of the downfall; however the most significant effects were
evident in United States of America and Europe, Asia –Pacific and even Middle East.
8/10/2019 How Banks Make Money
http://slidepdf.com/reader/full/how-banks-make-money 15/67
Modestas Tomkus
[289440]
14 | P a g e
The Investors, concerned about the sovereign debt crisis in Europe (primarily Spain, Italy) and slower
economic growth in United States, became increasingly unwilling to invest funds in activities related
to these regions, eventually causing a mass effect.
Rating agencies started downgrading credit ratings for USA, France... The stock market indexes
around the world quickly followed the downfall. Investment activities transferred to the commodity
markets centred on gold and “safer” currencies (e.g. Swiss Franc and Japanese Yen) trades (BBC
Business news 2011).
These tendencies continued till the end of the year and some effect was transferred event to the
following year 2012. In the end, the 2011 stock market fall marked its presence in the balance sheets
of many banks and financial institutions.
3. Literature Review on Banking Business Models
The following section is dedicated to providing an overview of the business model theory referred to
in this paper. Due to the complexity and inconsistency in academic literature, a short overview of the
most influential general considerations of the business model will be presented in the first part of
the section. Additionally, a summarised business model interpretation will be presented in the
second part of this section.
3.1 Concept idea and supporting theory
A model is a tool used to capture and frame a complex system in a certain grid, which then could be
portrayed in a manner to make it understandable for an observer. Business, structurally being a
complex system, which lacks observable clarity, is a perfect example to which the benefits of a
model could be applied. Business model is an important tool displaying the essence of business
practices that lead to profits. Nevertheless, only well-defined business model provides the
information necessary to identify, compare and possibly enhance a certain trait.
The business models topic is often debated in the latest business literature. The concept is used as
an educative and analytical tool to explain and understand how businesses function. The term
business model is widely applied and capable of including a range of business aspects. Business
objectives, core customers, product management, business strategies, organization infrastructure
and many other strategic and operational business processes fit in business model term. Because of
this capability to explain so much, business model term suffers an “identity crisis”. Independentanalysis undertaken by scholars and their individual approach towards business practices
8/10/2019 How Banks Make Money
http://slidepdf.com/reader/full/how-banks-make-money 16/67
Modestas Tomkus
[289440]
15 | P a g e
investigation resulted in a broad range of diverse interpretations and definitions in existing
literature. While scholars do not agree what a business model is, certain patterns in available
definitions emerge.
A. Osterwalder and Y. Pigneur introduce the concept of business model in their book “Business
Model Generation” through the generalized view of 470 practitioners from a number of different
countries (Osterwalder, Pigneur 2010). Authors define the business model as a representation of
how organisation creates, delivers and captures value. They use business models in an attempt to
better explain how firms do business. Additionally, the book offers down-to-earth explanations and
numerous practical examples aimed at educating new generation entrepreneurs. Identifying
decision making as an essential part of the business model formation, some scholars turned to a
managers’ perspective (George, Bock 2011). In search of a better business model conceptualization,the study analyses existing literature and 151 surveys of practicing managers. Findings point to the
opportunity-centric business model perspective, which is based on resource transference and value
structures. Here, the business model is a design of organisational structure with the purpose of
seizing a commercial opportunity.
Another business model definition tendency, which primarily focuses on the identification of the
actions taken and methods adopted within the business, largely falls under the component
consideration approach. Here, the totality of the components and their interrelations form the
business model. The well-structured definition based on the component consideration is provided by
(Osterwalder, Pigneur et al. 2005: 3): “A business model is a conceptual tool containing a set of
objects, concepts and their relationships with the objective to express the business logic of a specific
firm”. Authors partially treat the business model as an analysis tool. They attempt to conceptualize
business models, to separate associated definitions and to structure the terminology for the purpose
of future topic development.
Value Preposition
Despite such a rich diversity in the business model definition approaches and themes, one major
tendency is commonly observed. No matter which approach is taken to define the business model, it
always builds up to a major consideration – value preposition (Amit, Zott 2011). In their recent
study, C. Zott and R. Amit used a sample of 103 reviewed publications to classify the business model
concepts and derive commonly observed themes. The authors managed to provide a well-
structured version of the business model literature overview and, similar to other scholars, recognise
that value creation, transformation and capture are at the core of every business model. In other
words, the purpose of the business model is seen as value achieved through a firm’s performance
8/10/2019 How Banks Make Money
http://slidepdf.com/reader/full/how-banks-make-money 17/67
Modestas Tomkus
[289440]
16 | P a g e
and competitiveness. David W. Stewart and Qin Zhao support this definition in their study,
concluding that “simply defined, a business model is a statement of how a firm will make money and
sustain its profit stream over time” (RW.ERROR - Unable to find reference:25). The business model
definition considerations through strategic, technological or competitive approaches, all rely on
generated value as an indication of the business model performance. The ability to measure and
compare performance in recognisable units of value (usually money) is the intended benefit of such
reliance.
Value creation, though often interpreted as a simple profit, can refer to different forms of value.
Besides the obvious economic value, some business models can be intended for social value
objectives. For example, non profit organisations and some state- or privately-owned firms develop
their businesses models optimised for social value (e.g. reduction of poverty of famine, increase inliving standards). I. MacMillan and J. Thompson studies social value implications in business models
and suggest a framework for social value optimised business model development (MacMillan,
Thompson 2010). Though not essential, social value consideration became a certain norm in new
business models. As discussions about social inequality are becoming more frequent, society expects
successful firm’s contribution to social wealth. In turn, observable and well-advertised social value
contributions often result in additional benefits for the firm (e.g. an increasing number of customers
and loyalty). Further analysis through value consideration suggests that the previous frameworks are
not capable of recognising the total value generated by business models (Amit, Zott 2001). As a
response to these findings, the authors of the study introduce potential sources of value creation
through business models. They list novelty, lock-in, complementarities and efficiency as main
drivers, and at the same time, implying complimentary properties of individual value drivers. An
additional argument is presented by G. Hamel, who suggest that a substantial share of value
creation as well as absorption occur in the value network, consists of business related parties and
structures (e.g. suppliers, distribution networks) (Hamel 2000).
The business model from the strategic point of view is defined as a collection of business specific
decisions that develop and/or maintain competitive advantage. J. Richardson explains how firm
activities function together under the intended business model, and at the same time, he formulates
strategy as the process of business model implementation (Richardson 2008). The analogue view
towards the business model as a reflection of an entity’s realized strategy is introduced by other
researchers (Shafer, Smith et al. 2005), (Magretta 2002) and (Casadesus-Masanell, Ricart 2010).
Business strategy as a term is often used as a synonym for the business model. Although both terms
in a business environment often share a similar ultimate objective – sustainable profitability - they
8/10/2019 How Banks Make Money
http://slidepdf.com/reader/full/how-banks-make-money 18/67
Modestas Tomkus
[289440]
17 | P a g e
are not the same thing. The business model is a system based on representation of business
elements fitting together in an attempt to grasp a viable financial opportunity. Despite portraying a
business “recipe”, it does not account for a critical performance dimension - competition.
Considering a profitable business in real market conditions, the occurrence of competition is just a
matter of time. It is the strategy’s task to obtain and maintain the frontrunner position (Magretta
2002). In other words, the business strategy represents a custom implementation of the business
model with anticipation towards inevitable competition. On the other hand, a new business model
that introduces radical changes in an industry’s economy and is difficult to replicate can become a
competitive advantage by itself (Magretta 2002, Casadesus-Masanell, Ricart 2010). Beside the
concerns for competition, a strategic point of view towards business models emphasizes generated
value beneficiaries’ satisfaction. A business model, if looked at from this point of view, has to
account for two sides of the business beneficiaries: customers and shareholders. It defines value
sharing and delivery processes, ensuring mutual satisfaction. Never the less, an increasing tendency
for customer focused value creation is observed (Chesbrough, Rosenbloom 2002).
Business models and performance
Economic consideration of business models relies on logic that generated value (profit) in a firm
directly represents the performance of the business model. Here, as well as in strategic
considerations of a business model, competition plays an important role. Scholars embrace the idea
that the performance of a business model is highly affected and depends on its competitiveness. A
conceptual attempt to explain a firm’s performance through the business model in a competitive
environment was suggested by A. Afuah, who identified the business model as a set of components
utilised to achieve profit – a measurement of performance (Afuah 2004). He created a strategic
business model framework of profit determinants, which should be manipulated to reach the best
performance. Seeking a more tangible outcome, a number of scholars conducted an empirical
analysis, which incorporated similar conceptual logic. C. Zott and R. Amit analyzed business models
and their performance within entrepreneurial firms (Zott, Amit 2007). The authors’ analystical
approach towards the relationship of the business models and the firm’s performance rely on two
distinct effects: the value generating potential of an employed business model and a firm’s ability to
absorb generated value. They identify efficiency and novelty as two major axis affecting the
outcome, which results from their definition of business model as a set of boundary-spanning
transactions with external parties. The authors treat the business model as an independent variable,
which translates to performance. Environmental factors take the role of value-effecting dependent
variables.
8/10/2019 How Banks Make Money
http://slidepdf.com/reader/full/how-banks-make-money 19/67
Modestas Tomkus
[289440]
18 | P a g e
A later publication by C. Zott and R. Amit introduced a new study which further focused on business
models and firm performance relation. Questioning the effects of the business model and the
product market strategy interactions impact on a firm’s performance, C. Zott and R. Amit examine a
suspected contingency effect (Zott, Amit 2008). The contingency theory suggests that there is no
optimal strategy for all firms and that the desired choice of strategy variables is altered according to
contingency factors. In this case, a firm’s business model is treated as a contingency factor. Through
the use of a purpose developed formal model and contingency theory, authors investigate a
collected data set. Findings suggest “that novelty-centered business models—coupled with product
market strategies that emphasize differentiation, cost leadership, or early market entry—can
enhance firm performance” (Zott, Amit 2008 :1). The authors formulate that both the business
model design and product market strategy function complimenting each other, not substituting. This
particular interpretation of the business model offers a wide applicability in empirical studies related
to certain market business model analysis.
Innovation in a business model design is yet another factor showing high influence to overall firm
performance. Joan Magretta presents the business model concept through an evolutionary view
(Magretta 2002). His explanation is based on innovativeness developing new business models and
optimal exploitation of the models that already exist, but could bring higher value. In his words, “…,
a successful business model represents a better way than the existing alternatives” (Magretta 2002:
88). In his study, the author introduces well-known companies and their success stories, implying the
value of innovative and unique business models (e.g. American Express traveller checks), as well as
the benefits of better utilised, existing business models (e.g. Wal-Mart perfecting existing business
model of a discount store). Magretta further expands the topic by discussing the adoptability of
existing business models. He urges to question the suitability of the performing business model in a
different environment (e.g. Disney World in Europe). Here, a diversity of external factors are
described as a necessity for consideration before and after business model introduction. In author’s
words - “Business modelling is the managerial equivalent of the scientific method – you start with a
hypothesis, which you then test in action and revise when necessary (Magretta 2002: 90)”. G.
George and A. Bock seconds the evolutionary thinking regarding the business model, and stresses
the fact that organisations adjust and redesign their business models under the effects of changed
operational environment (George, Bock 2011).
8/10/2019 How Banks Make Money
http://slidepdf.com/reader/full/how-banks-make-money 20/67
Modestas Tomkus
[289440]
19 | P a g e
3.2 How is the banking business model defined?
The banking business model could be explained by all previously discussed business model
conceptualisations. However, in order to limit the business model concept into a more manageable
and study-related form, it is necessary to present a simplified banking business model rationale.
The purpose and target of a bank is an optimal financial performance. To achieve this, banks rely on
a set of a few major processes: (1) acquisition of necessary funds for operating activities; (2) loan
service provision as a means to generate revenues; and (3) risk taking. To manage these processes,
banks develop business models – representations of how the organisation (a bank) creates, delivers
and captures value (Osterwalder, Pigneur 2010). As this study is focusing on economic value, the
definition is further narrowed through a performance centric view. To account for competition and
the different components optimal utilisation as the basis for banking business models, a
conceptualisation similar to A. Afuah’s is used. A. Afuah identified the business model as a set of
components utilised to achieve profits (Afuah 2004). For the purpose of a more tangible applicability
and necessary business model comparability, a work by C. Zott and R. Amit is used as a definition
core for the banking business model (Zott, Amit 2008). Applying similar conceptualisation in the
banking business, the acquisition of necessary funds, loan service provisions and implied risk-taking
can be interpreted as a base financial product market strategy, as these are the same
products/services that banks are competing for in the financial market. A bank’s individually realised
form and properties of these core activities combine unique business models (e.g. a bank acquires
funding through retail sources (depositors) and uses it to issue housing loans maintaining relatively
low risk levels). Therefore, a bank’s business model can be determined through the identification of
how it does business; identifying funding strategies, the scope of activities and the nature of
riskiness as determining variables.
The banking business model concept used in this study can be defined as: a representation of a set
of components utilised to outperform the competition and to achieve optimal profit in a financial
market where a similar product strategy is used.
The evolutionary logic of the banking business model is addressed by sympathising with G. Geor ge’s
and A. Bock’s thinking that organisations adjust and redesign their business models under the effects
of a changed operational environment (George, Bock 2011). The ability to adjust or transform the
business model is regarded as one of the major features in the banking business model logic. A
bank’s management is expected to alter their business model as a response to foreseen short- and
long-term future opportunities and threats.
8/10/2019 How Banks Make Money
http://slidepdf.com/reader/full/how-banks-make-money 21/67
Modestas Tomkus
[289440]
20 | P a g e
4. How banks earn money?
This section will present an explanatory summary of the banking business logic and practices. A short
explanation of how banks generate funds, assess risk and provide revenue driving services will be
presented. Additionally, the most popular banking services and products with a short discussion of
their importance to the bank’s performance will be listed.
How do banks earn money? It is a simple question to which there is a short, traditional answer.
Banks earn money by charging interest rates on provided loans. In fact, the very same question
might have brought popularity to a famous “3-6-3 rule”. It humorously states that, bankers pay a 3
percent rate of interest on deposits they receive, charge a 6 percent rate of interest on loans they
provide, and then at 3 o’clock, heads straight to the golf course. Such an expression provides a
simplified and easily understandable version of reality. To this day, a bank’s position as an
intermediary between depositors and borrowers proves to be the prime source of profits.
Nevertheless, it is not the only source of income. Thus, the traditional answer for banks’ revenue
origination question no longer holds as a satisfactory answer.
In addition to profiting from interest-bearing activities, banks receive a substantial amount of
income from noninterest activities which are based on charging fees for provided financial services.
Traditionally, these services include: transaction services (checking, cash management), safe-keeping
services (safety deposit boxes, insured savings accounts), investment services (trust accounts,
Certificates of Deposits (CD’s)) and insurance services (annuity contracts). Following major
deregulations within the US and Western Europe banking industry in the late 20th
century, banks
adopted a number of activities which previously were separated from the banking industry.
Noninterest income share expanded even more with newly introduced non-traditional activities like:
investment banking, insurance agency as well as underwriting, securities brokerage and mutual fund
sales.
Answering the question of bank earning origins adequately requires an insightful approach, which
accounts for the modernisation and versatility within the banking industry. A vast number of services
available, thousands of their variations specifically tailored to certain groups or individual customers,
level of presence in certain markets and scale of operations shape banks as different and unique.
Thus, only relatively generalized analytical approaches allow us to identify bank revenue driving
activities.
Despite a high level of divergence, banks still operate on their core business models. These can be
identified through observations on how banks deal with the core elements of the banking business.
8/10/2019 How Banks Make Money
http://slidepdf.com/reader/full/how-banks-make-money 22/67
Modestas Tomkus
[289440]
21 | P a g e
Three major factors determine a banks’ general approach towards business: Origin and type of the
funding necessary to maintain operations, approach towards risk associated with operations and
source of core revenues.
4.1 Funding
Banks generally earn money by lending money at a certain interest rate. To operate profitably, a
bank must obtain funds which would cost sufficiently less than the issued loan interest rate. The
difference between cost of funds and rate of issued loans is known as the “spread”. In balance
sheets it is referred to as an interest income and sums all interest bearing activities. If interest on
loans and owned debt securities sufficiently outweighs interest paid on deposits and other source of
funds, the bank is operating profitably.
Deposits
In most cases, deposits represent the largest share of bank funding. It is money entrusted to the
bank by its customers for safe keeping and availability for future financial transactions, otherwise
referred to as core deposits. In return, banks offer an interest rate which highly depends on the
customers’ ability to access deposited money. The bank is willing to pay for a long term certainty
regarding available funds. Therefore, savings depositors who are restricted from access to their
funds for a certain period of time, are rewarded with modest interest rates, whereas checking
account owners with full access to use their funds often do not receive any, or very small
compensation in the form of interest.
In the banking industry, customer deposits (in particular longer term deposits) are referred to as
“core deposits”. Investors, shareholders and industry specialists recognise the importance of
customer deposits, and often rely on it as part of a bank’s riskiness assessment. The reasoning is
rather simple; banks with sufficient access to deposit funding avoid additional exposure encountered
when obtaining funds through trading or short term wholesale borrowing. Diversity and a high
number of depositors prevent unstable funding risks and are less sensitive to sudden downfalls in
financial markets.
Wholesale deposits are an alternative funding option for banks which are incapable of attracting a
sufficient level of core deposits. Structurally, wholesale funds are largely similar to certificates of
debt, just on an interbank level. This kind of mostly short-term based funding is widely used
throughout the industry and is accepted as an adequate funding option in the time of need. Some
fast turnover (mostly trading) banks prefer short-term funding as a means to manage their balance
sheets in a pro-cyclical manner (Adrian, Shin 2010). A heavy reliance on wholesale funding implies awarning signal to investors and industry analytics. Competitiveness is first to be judged, as wholesale
8/10/2019 How Banks Make Money
http://slidepdf.com/reader/full/how-banks-make-money 23/67
Modestas Tomkus
[289440]
22 | P a g e
banking is more expensive then core deposit. It means that banks that rely on a more costly funding
either settle for a narrower interest spread which leads to lower profits, or operate on a higher yield
expectance. This in itself transfers to greater risks. Adding to this is a factor of uncertainty risks, as it
is not certain how long and how much funding is available for a price that is acceptable for banks.
Equity capital is far from being a primary funding option for most of the banks. It is largely because
such capital is much more expensive than other means of funding. Nevertheless, shareholder equity
plays a strategic importance as a part of total capital. Many regulatory ratios incorporate
shareholder capital as stability indicators or safety buffers. Common equity is capital raised by
selling shares to an outside investor, thus, the price of capital. Apart from the initial capital rising,
issuing shares usually represent a need for funds, which in turn is used either for acquisitions or
capital position repairs after rough periods of elevated bad loans. Rapid changes in share equity
identify abnormal events and, to some extent, the level of success of adopted business model.
Debt issuance is yet another method to aid in raising capital. As well as many corporations, banks
use debt to stabilize their funding flows. Repurchase agreements are among the core sources of
employing debt-funding on a short term basis. When reported on balance sheets, the debt usually
exceeds equity (normal in the banking sector), however, if compared to the share of total deposits
or loans, the ratio is much lower. Thus, despite performing as a funding stabilizer and often used by
a majority of the banks, debt is not a vital source of bank funding.
4.2 Use of Funds
Lending
As mentioned before, issuing loans is the core business for the biggest majority of the banks. It also
represents a substantial share of used funds, as well as an equivalent part of the net income. Typical
properties of a common loan are designed for fixed terms, which limit implied risks to a minimum.
The loan is required to be backed up by a certain security equivalent to the loan, usually with the
same property the loan will be used for. A fixed rate ensures a steady revenue inflow distributed
throughout the fixed period of time the loan is issued for. In general, banks will avoid allowing
flexible terms or asking for a greater level of compensation if loan flexibility is granted. A bank’s
performance is highly influenced by its ability to match provided loans with proper funding sources.
Another safety mechanism used as a part of lending operations is the credit worthiness assessment .
In the process of loan consideration, the lending institution evaluates potential borrower’s financialprofile. Income stability, owned assets and history of credit from the base of bank help to estimate
8/10/2019 How Banks Make Money
http://slidepdf.com/reader/full/how-banks-make-money 24/67
Modestas Tomkus
[289440]
23 | P a g e
credit worthiness. The purpose of the loan is also incorporated in loan underwriting decision. A bank
will favour real property purposed loans like buildings, matchinery, inventory, etc., as in the event of
non-payment, the bank will be able to reclaim some of the underlying asset value.
Credit worthiness assessment is so crucial that banks invest heavily in the development of extensive
complex formulas to assess potential borrowers as precise as possible, thus limiting expected risk.
High advances in credit worthiness assessment placed banks in a financial judge’s role in modern
economy. Essentially bank loan officers decide which business opportunities or projects deserve the
required capital. There are few interesting studies regarding credit worthiness assessments (credit
scoring) available. A more recent study performed by L. Einavand M. Jenkins analyzes “the adoption
of automated credit scoring at a large auto finance company and the changes it enabled in lending
practices” (Einav, Jenkins 2013: 1). Findings suggest that the implemented automated risk
assessment brought a significant increase in profits, resulting from newly optimized credit scoring
practices.
Consumer loans
Consumer lending describes financing to individuals, which represents a substantial part of the total
number of loans globally. While there are various forms of loans targeted to consumers, few general
classes emerge.
Mortgages represent the largest share of consumer loans, as housing falls among the highest value
of acquisitions. Such a type of loan is considered low risk; the acquired residence itself serves as
collateral. In exchange for a high value low risk loan, a financial institution obtains stable income in
the form of interest usually lasting up to several decades. In many cases, banks and financial
institutions providing mortgage loans, gain a loyal, long-term customer with additional financial
needs. Stable income and possible future earnings form the basis for every bank’s prosperity.
Consequently, many banks construct their strategies around mortgage loans and their accessibility
to the target customers. One of the examples which emphasizes the importance of mortgages and
the mistreatment of this vital part of financing practices is the mortgage crisis of 2008. D. Demyanyk
and O, Van Hemert made a study analysing the quality of the mortgages dated prior to the crisis, and
to discuss the possibility of its early identification and prevention (Demyanyk, Van Hemert 2011).
Credit cards are a modern representation of a personal line of credit. Such types of loans offer
ultimate flexibility in terms of convenient small scale borrowing for day-to-day use. Despite the
attractive upsides, credit cards are amongst the most expensive type of loans (regarding interest
rates charged) in financial markets.
8/10/2019 How Banks Make Money
http://slidepdf.com/reader/full/how-banks-make-money 25/67
8/10/2019 How Banks Make Money
http://slidepdf.com/reader/full/how-banks-make-money 26/67
Modestas Tomkus
[289440]
25 | P a g e
Securities acquisition is yet another form of a bank’s interest based income. Though a sizable share
of capital in banks is locked in securities, it is not amongst the most desirable uses for generated
funds. A few factors effect a bank’s position in respect to securities. A regulatory requirement for
capital reserves in banks around the world is the main force driving securities acquisition and
holding. Debt securities issued by national governments are recognised as a safe equivalent to cash
capital. These securities offer reasonably small interest rates, but on the other hand, these rates are
the only allowed benefit from bank reserves. The absence of profitable investments for an excess
capital is another factor determining the share of capital directed to securities. Banks are willing to
buy and hold securities in a “slow economy” phase, as it could be more reasonable to invest in low
interest rate securities than to issue under-priced (from a particular bank’s perspective) loans.
Consequently, banks became major acquirers of securities around the world. Sufficient safety and
liquidity of government issued debt securities is a reason why the share of capital held in banks as
securities became one of the core bank risk assessment indicators.
Non-Interest income
Throughout the history of banking, interest-based income always took the leading share in total
revenues, up until a few decades ago. A deregulated and modernised banking industry turned to
exploiting opportunities in non-interest based activities. Quickly enough, this part of the banking
business increased in popularity and in some banks, even offset the interest based income. Minimal
risk, limited capital needs, and high returns on capital encountered in non-interest activities, became
a steady line of business for many banks.
Bank customers encounter an increasing number of service fees, which might be charged for nearly
every operation a bank engages into. While being tied to specific operations and minimal in value,
bank imposed fees become a lucrative source of income. Modern banks process a vast number of
operations daily and when a majority of them charge fees, it does sum up to substantial earnings.
Service fees can be charged for simply opening an account, overdrawing a certain limit in account,
transferring money, paying utilities, cashing money at ATMs or using a safety deposit box.
Reasonably higher fees might be encountered when customers are serviced by bank staff instead of
automated self-service options. In many cases, fees can be attached to loans or even deposit
contracts. Though banks tend to justify fees by the need to cover paperwork and other service
expenses, in reality, it often becomes a source of easy profits. The absence of fees or their
separation from advertised services often become essential parts of complex marketing campaigns
engaged by banks in competitive situations.
8/10/2019 How Banks Make Money
http://slidepdf.com/reader/full/how-banks-make-money 27/67
Modestas Tomkus
[289440]
26 | P a g e
Derivative contract trading is a huge and very important part of the investment banking business.
Representing a fair share of the latest financial innovation, these contracts can be derived from
nearly any kind of asset, including mortgages, bonds, equities, commodities and even exchange
rates. The most common forms of derivative are known as options, futures and swaps. The benefit
of using derivatives lays in a few major roles: (a) risk management, (b) price determination, and (c)
liquidity enhancement. Despite benefits implied in derivative trade, one type of these contracts
cause most of debates. Over-the-counter (OTC) derivatives gained their negative reputation due to
their general mistreatment and trade deficiencies, which often resulted in certain asset class
exposures. Due to OTC’s bilateral nature, it is extremely difficult to identify where the exposure is or
what the value of such a contract is. Financial institutions focusing on derivative trading act in their
own interest, thus often gambling on risk versus return tradeoffs. Under-regulation of these
instruments and the self-cantered nature of a trading institutions’ r isk management could result in a
risk “spill-over” effect throughout the trading market (Acharya, Brenner et al. 2009). A similar
situation was observed in the latest financial crisis. Banks engaging in derivative trading often centre
their strategies on the volatile nature of these securities. Excess capacities are managed through
reliance on short-term funding, often resulting in a heavy dependence to wholesale banks.
Additional non banking activities
Nonbanking activities such as insurance or leasing are reasonably recent additions to the banking
business. When deregulation eliminated restrictions for non-banking activities, there was no surprise
that one of the first adopted businesses was insurance. Its strict regulatory background shares
strong similarities with banks. Furthermore, both businesses rely on similar risk evaluation and
pricing practices, as well as a liability backing with a minimal capital approach.
Another popular and similar business to banking is leasing. Banks operating in this business segment
show low- or non-interest in owning underlying assets; however, they are more than interested in
acquiring interest-paying customers. Thus, it is a common practice for banks to form partnerships
with equipment dealerships. Dealers end up being paid by partner banks for every lease agreement
signed, whereas banks receive interests on the lease.
Treasury services are another non-banking activity gaining popularity amongst bank customers.
Banks may offer to take over working capital and payroll management. Many customer businesses
find it convenient and beneficial to pay for such services to their bank instead of hiring personnel
capable of dealing with these tasks.
8/10/2019 How Banks Make Money
http://slidepdf.com/reader/full/how-banks-make-money 28/67
Modestas Tomkus
[289440]
27 | P a g e
Modern banks sometimes also offer payment processing services. Setting up payment systems that
use credit or debit cards, introducing electronic check handling, automated invoicing and supplier
payment, or simply offering automated and efficient equivalents of daily payment related
operations, all are among options offered to business customers. By providing such a service, banks
charge either an implementation or servicing fee, while the customer enjoys additional payment
method options and optimized payment processes.
4.3 Risk-taking
Being an essential part of banking business, risk-taking is one of the major concerns for every bank.
The initial business objective is to operate on the lowest risk possible, while charging the highest risk
premium. Two major risk-taking strategies exist as a means to profit from this risk and the premium
relation.
Traditional banking risk strategy involves internal risk management, when an institution uses a
number of developed competitive advantages to limit and mitigate taken risks within its own
business structure. Employing this strategy, banks accept credit risk when lending to their
customers, holding this asset on its balance sheet and maintaining an appropriate level of capital to
cover unexpected risks, which are estimated through customer credit-worthiness analysis. Banks
minimise unexpected risks, utilising advantages of gathered customer-related information, thus
avoiding asymmetric information dilemma. Additionally, it allows for the mitigation of adverse
selection and moral hazard, further lowering the unexpected risk. Through the summation of faced
risks, the bank decides whether it is economically viable to issue the loan, with the available risk
premium. The greater the spread between calculated risk and available risk premium, the greater
the profits will be generated for the bank. Such an approach towards risk defines the role of a bank
as a financial intermediate and effective financial stress absorber.
This banking strategy by nature, does not permit any form of risk transfer to other parties. All risk
mitigation and elimination advantages accessible for the loan-originating institution are not available
to a possible loan purchaser. As a consequence, interested parties would face a greater unexpected
risk and asymmetric information related threats. The initial loan issuer would be driven to pass on
primarily lower quality, riskier loans. Such behaviour is expected due to the adverse selection and
moral hazard. Reacting to such situations, an external party would be forced to charge higher risk
premium to account for the greater uncertainty. Due to competition in the market, such difference
in prices would not be tolerated, making risk-transfer in a traditional banking risk strategy,
unreasonable.
8/10/2019 How Banks Make Money
http://slidepdf.com/reader/full/how-banks-make-money 29/67
Modestas Tomkus
[289440]
28 | P a g e
Fundamentally, a different approach is offered through risk-transfer strategy . Accordingly, a bank
employing such an approach would seek to transfer risk to an external party. While this was
unreasonable in a traditional banking model, the latest advances in financial instrument
development made it possible. Securitisation and other credit derivatives were purposely developed
to fit the task. Securitisation defines the process when a bank, through financial engineering,
transforms an illiquid asset or a group of assets into a tradable security. It allows the sale of loans
with credit risk transfer and elimination from originators balance sheet. The extent of risk-transfer
highly depends on securitisation procedures and channelling through a bankruptcy-remote special
purpose vehicle. Collateralized debt obligations (COD’s) - a form of derived securities - slightly differ
from others, as the originating banks still hold them in balance sheets. Furthermore, despite the
original intention to shift risk, derivatives were blamed for transforming risk. It became evident in
the early stages of the financial crisis of 2008. Security buyers, through the initial transaction,
acquired the credit risk; however, due to mistrust developed through the driven security market
freeze, credit risk changed to liquidity risk. Transformation developed even further when security
originator banks were no longer able to sell constructed securities at economically viable prices or
refinance maturing debt, liquidity risk turned to funding risk (Llewellyn 2010).
4.4 Bank classifications
Each bank generally operates under certain funding strategies accompanied with specific revenue
sources and risk taking practices. The choice of these elements and a variety of their combinations
makes the bank unique. Never the less, the most distinctive features regarding funding, sources of
revenue and risk taking imply the bank’s general tendency towards certain class of banking.
Universal bank
The Banks that are classified as such provide a variety of financial services, which may include
lending, depositing, investment, securities trade, asset management and many other financial
services expected from any kind of bank. Such type of banking is more common in Europe then in
United States of America, which is a result of USA’s requirements to separate investment and
commercial banking practices.
Retail bank
Similarly to a retail stores representing one big brand, banks that fall under this classification aim to
be as close to their customer as possible and offer a wide variety of retail oriented services.
Households and private customers are offered mortgage, loan, savings services, which are often
accompanied with personal lines of credit (debit and/or credit cards). In some cases retail banksundertake even private investment management services (limited by regulations).
8/10/2019 How Banks Make Money
http://slidepdf.com/reader/full/how-banks-make-money 30/67
Modestas Tomkus
[289440]
29 | P a g e
Investment bank
Banks are classified as such when they concentrate their services on securities (and currencies,
commodities and other instruments) trading or promotion. Additionally, investment banks assist in
mergers and acquisitions, rising capital or issue securities on behalf of their private, institutional
(prime client) or even governments.
Commercial bank
This type of bank can be simply defined as a financial institution targeting businesses. Similarly to
retail banks, the commercial bank also accepts deposits, makes loans and offer basic investment
products, but services are focused on large businesses and corporations.
Wholesale bank
As the term implies, such type of bank provide large scale financial services for other banks, financial
institutions and corporations. These types of banks are also involved in large scale financing,
underwriting, consultancy and other wholesale financial practices.
8/10/2019 How Banks Make Money
http://slidepdf.com/reader/full/how-banks-make-money 31/67
Modestas Tomkus
[289440]
30 | P a g e
5. Data
The following section will explain the construction of the database, present the logic of what is
considered to be a bank business model defining variable, and what features it must contain to serve
as a business model determinant. A final list of these variables will be provided together with a short
characteristic analysis performed with the use of descriptive statistics. Furthermore, data availability
and collection procedures will be introduced.
5.1 Sample selection
The sample selection process is aimed to incorporate the biggest and industry effecting banking
institutions headquartered and operating in the United States of America (USA) and in European
countries. Such geographical selection was employed due to the anticipated similarity in cultures
and business practices. A broader analysis about cultural, linguistic and geographical background
significance in financial markets is presented by R. Stulz and R. Williamson, who performed their
analysis from an investor’s point of view (Stulz, Williamson 2003). The institution size and influential
potential on the industry is determined by the recorded size of banking activity, represented by the
total consolidated assets recorded in the end of year 2012. A preference for big banks also ensures
that effects of optimisation and economies of scale would be accounted for in the final sample.
Smaller institutions, for example, might not be equally capable of serving large (corporate) clients,
achieving lower costs through high-volume production or accumulating sufficient funds for the
desired optimisation solutions.
The final sample under study consists of the 63 largest (exceeding 40,000 million euros in total
consolidated assets in the end of the year 2012) active banks and banking groups with end-of-year
data for 2007 to 2012, comprising of a total of 378 bank-year observations. To ensure that sampled
banks are not controlled/influenced by external parties/shareholders, only independent banks were
selected. A Bureau Van Dijk’s independence indicator (Bankscope 2013) was used, that characterizes
an entity’s independence from its shareholders; “A” indicates the absence of shareholders with
more than 25% shares, “B” indicates the absence of shareholders with more than 50% shares, “C”
and “D” indicates at least one shareholder with more than 50% shares. The sampled banks were
required to be identified with no less then “A” or “B” indicators (appendix 1). In an attempt to
further isolate “self -managing” banks, institutions that formed through mergers in the period of
interest are eliminated from the final sample. Radical changes involved in an institution merger
often resulted in the construction of new strategies and prolonged institution transformation
procedures, thus possibly affecting the value of the chosen sample and further analysis.
8/10/2019 How Banks Make Money
http://slidepdf.com/reader/full/how-banks-make-money 32/67
Modestas Tomkus
[289440]
31 | P a g e
The sampled banks used in the study are listed in appendix 2. Additionally, a set of related
information accompanies the sampled institutions, including: total consolidated assets, country of
registration and type of banking institution. The sample includes: 23 institutions from USA and 40
from Europe (Austria (2); Belgium (1); Switzerland (1); Germany (3); Denmark (1); Spain (5); France
(2); Great Britain (6); Greece (2); Italy (7); Luxembourg (1); Netherlands (1); Norway (1); Poland (1);
Portugal (2); Sweden (4)). More than half (33) of the institutions throughout the list are identified as
bank holding institutions. Bank holding institutions employ similar management techniques as a
bank or banking group – all develop business models for the best performance. Bank holding
institution status also allows a number of benefits, like tax exemptions, eased capital rising and
money borrowing. Having better access to funding and liquidity were among the reasons
encouraging many distressed investment banks to convert to bank holdings in the aftermath of the
2008 credit crisis. The example of such case is presented in the press release of Morgan Stanley
(Morgan Stanley 2008). Never the less, regulatory framework applied to bank holding institutions
are similar and often exceed traditional bank regulations.
Variable data availability, source and delimitations
A large amount of data about banks’ operations are reported publicly either voluntarily or as a
regulatory requirement. While voluntarily published information is limited by the individual bank’s
need to inform investors and customers, information disclosure required by regulatory institutions is
a must. Furthermore, largely unified international accounting practices ensures that a certain
standardisation regarding issued information if followed. Therefore, if summed up and periodically
collected, such data can provide significant insight into the banking industry and individual
institutions.
A lack of resources and limited access to information was a major issue considering the data
collection for this study. Resorting to the available options, a choice was made to rely on ready-
made available databases. Data collected for this study primarily comes from Bankscope – a
comprehensive, well renowned database, containing a wide array of bank-related information. The
database offers financial statements, ratings and other intelligence on 30,000 banks, accounting for
the last 16 years.
Bank selection procedure involved inputting necessary delimitations (presented in “Sample
selection” section) to an automated web based search system and limiting the data set to a
manageable sample size of 100 banks. Afterwards an automatically generated output was manually
screened for same delimitations. An additional elimination was undertaken to exclude institutions
which are headquartered in different locations, but using same name as group they belong to. After
8/10/2019 How Banks Make Money
http://slidepdf.com/reader/full/how-banks-make-money 33/67
Modestas Tomkus
[289440]
32 | P a g e
all screening procedures a sample set of 63 banks was constructed. Expansion of data set was
considered but proved to be unreasonable, as further observed banks suffered high level of
dependency on other institutions and/or ran a much smaller scale of banking operations, which
potentially threatened the comparison of sampled institutions.
Additional information of a less standardised nature was collected through the use of annual
statements issued by the sampled banks. Such information lacks structure, common standardization
practices and might be influenced by the public image developing processes as annual statements
are often developed to address the investor and general public.
5.2 Bank business model defining variables
What is bank business model defining variable?
Banks, while serving as financial intermediates, became an important part of personal and even
institutional wealth management, largely due to the wide range of services, products and customers
served. In an attempt to optimise performance, individual banks became more focused on business
lines and products which they were particularly good at. Because of this divergence and the inability
of outsiders to clearly identify business lines or products the bank is particularly good at, it became
increasingly difficult to determine the business model the banks were operating.
Defining a bank’s business model requires a large collection of data that could identify the
institution’s business model with the highest possible explanatory power. In this study, the approach
to determine a bank business model will be based on core bank process defining variables. As it was
broadly explained in a previous section (“How banks earn money?”), bank business develops around
three major processes: (1) acquisition of funds for operations; (2) service/product provision as a
means to generate revenues; and (3) risk taking. If correctly identified, measured and compared,
these processes can be translated in business models, representing a group of individual entities
with similar business essentials. To achieve higher representation power of banks’ business
processes, a well-defined variable definition must be chosen:
The business model identifying variable is described as: publicly available, standardised data,
which records a tangible, comparable value of an element that significantly effects and defines a
bank’s approach towards its funding, business driving products/services and/or risk-taking.
Applying such a description eases the selection process and lowers the amount of data to begathered. Nevertheless, not all publicly available data can be used as variables immediately. Data
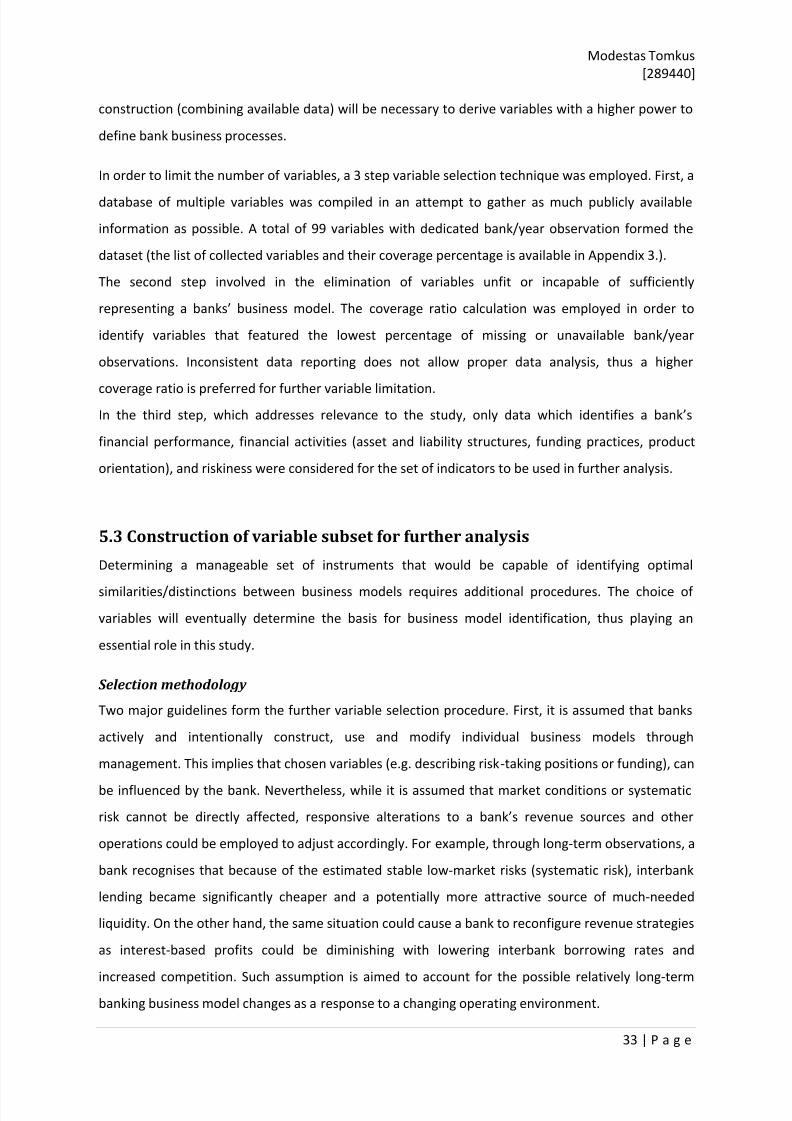
8/10/2019 How Banks Make Money
http://slidepdf.com/reader/full/how-banks-make-money 34/67
Modestas Tomkus
[289440]
33 | P a g e
construction (combining available data) will be necessary to derive variables with a higher power to
define bank business processes.
In order to limit the number of variables, a 3 step variable selection technique was employed. First, a
database of multiple variables was compiled in an attempt to gather as much publicly available
information as possible. A total of 99 variables with dedicated bank/year observation formed the
dataset (the list of collected variables and their coverage percentage is available in Appendix 3.).
The second step involved in the elimination of variables unfit or incapable of sufficiently
representing a banks’ business model. The coverage ratio calculation was employed in order to
identify variables that featured the lowest percentage of missing or unavailable bank/year
observations. Inconsistent data reporting does not allow proper data analysis, thus a higher
coverage ratio is preferred for further variable limitation.In the third step, which addresses relevance to the study, only data which identifies a bank’s
financial performance, financial activities (asset and liability structures, funding practices, product
orientation), and riskiness were considered for the set of indicators to be used in further analysis.
5.3 Construction of variable subset for further analysis
Determining a manageable set of instruments that would be capable of identifying optimal
similarities/distinctions between business models requires additional procedures. The choice of
variables will eventually determine the basis for business model identification, thus playing an
essential role in this study.
Selection methodology
Two major guidelines form the further variable selection procedure. First, it is assumed that banks
actively and intentionally construct, use and modify individual business models through
management. This implies that chosen variables (e.g. describing risk-taking positions or funding), can
be influenced by the bank. Nevertheless, while it is assumed that market conditions or systematic
risk cannot be directly affected, responsive alterations to a bank’s revenue sources and other
operations could be employed to adjust accordingly. For example, through long-term observations, a
bank recognises that because of the estimated stable low-market risks (systematic risk), interbank
lending became significantly cheaper and a potentially more attractive source of much-needed
liquidity. On the other hand, the same situation could cause a bank to reconfigure revenue strategies
as interest-based profits could be diminishing with lowering interbank borrowing rates and
increased competition. Such assumption is aimed to account for the possible relatively long-termbanking business model changes as a response to a changing operating environment.
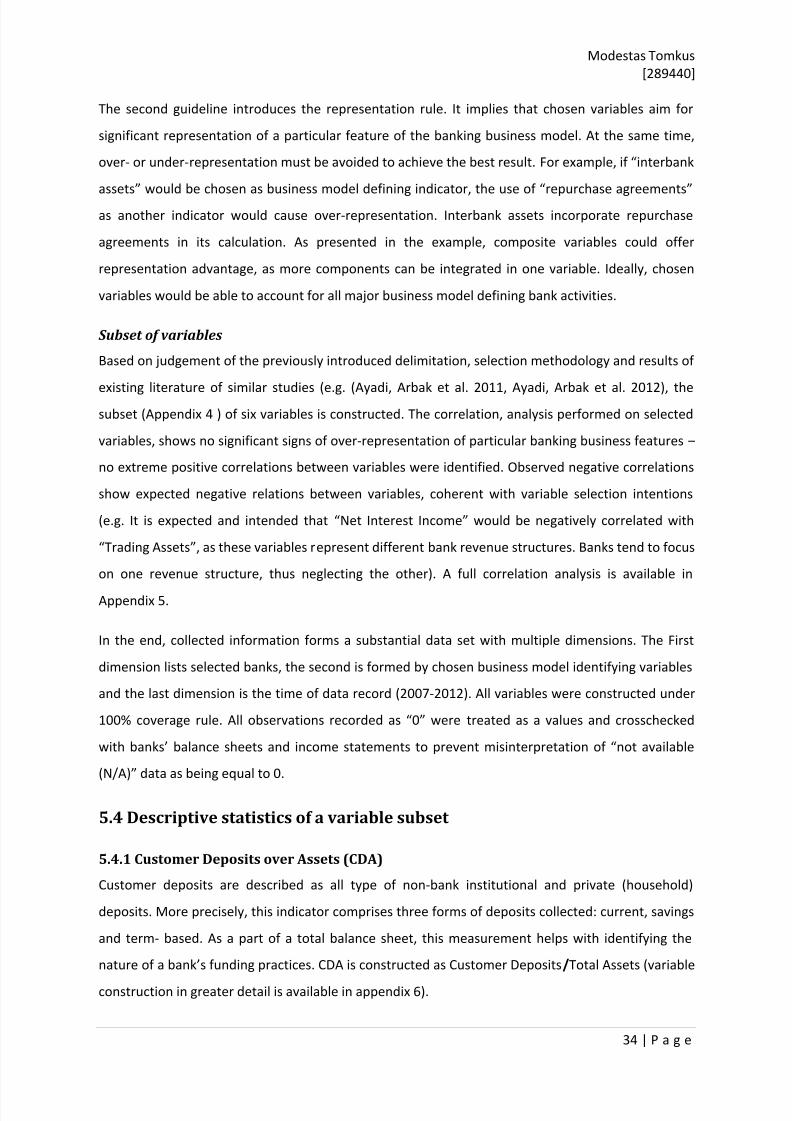
8/10/2019 How Banks Make Money
http://slidepdf.com/reader/full/how-banks-make-money 35/67
Modestas Tomkus
[289440]
34 | P a g e
The second guideline introduces the representation rule. It implies that chosen variables aim for
significant representation of a particular feature of the banking business model. At the same time,
over- or under-representation must be avoided to achieve the best result. For example, if “interbank
assets” would be chosen as business model defining indicator, the use of “repurchase agreements”
as another indicator would cause over-representation. Interbank assets incorporate repurchase
agreements in its calculation. As presented in the example, composite variables could offer
representation advantage, as more components can be integrated in one variable. Ideally, chosen
variables would be able to account for all major business model defining bank activities.
Subset of variables
Based on judgement of the previously introduced delimitation, selection methodology and results of
existing literature of similar studies (e.g. (Ayadi, Arbak et al. 2011, Ayadi, Arbak et al. 2012), thesubset (Appendix 4 ) of six variables is constructed. The correlation, analysis performed on selected
variables, shows no significant signs of over-representation of particular banking business features –
no extreme positive correlations between variables were identified. Observed negative correlations
show expected negative relations between variables, coherent with variable selection intentions
(e.g. It is expected and intended that “Net Interest Income” would be negatively correlated with
“Trading Assets”, as these variables represent different bank revenue structures. Banks tend to focus
on one revenue structure, thus neglecting the other). A full correlation analysis is available in
Appendix 5.
In the end, collected information forms a substantial data set with multiple dimensions. The First
dimension lists selected banks, the second is formed by chosen business model identifying variables
and the last dimension is the time of data record (2007-2012). All variables were constructed under
100% coverage rule. All observations recorded as “0” were treated as a values and crosschecked
with banks’ balance sheets and income statements to prevent misinterpretation of “not available
(N/A)” data as being equal to 0.
5.4 Descriptive statistics of a variable subset
5.4.1 Customer Deposits over Assets (CDA)
Customer deposits are described as all type of non-bank institutional and private (household)
deposits. More precisely, this indicator comprises three forms of deposits collected: current, savings
and term- based. As a part of a total balance sheet, this measurement helps with identifying the
nature of a bank’s funding practices. CDA is constructed as Customer Deposits/Total Assets (variable
construction in greater detail is available in appendix 6).
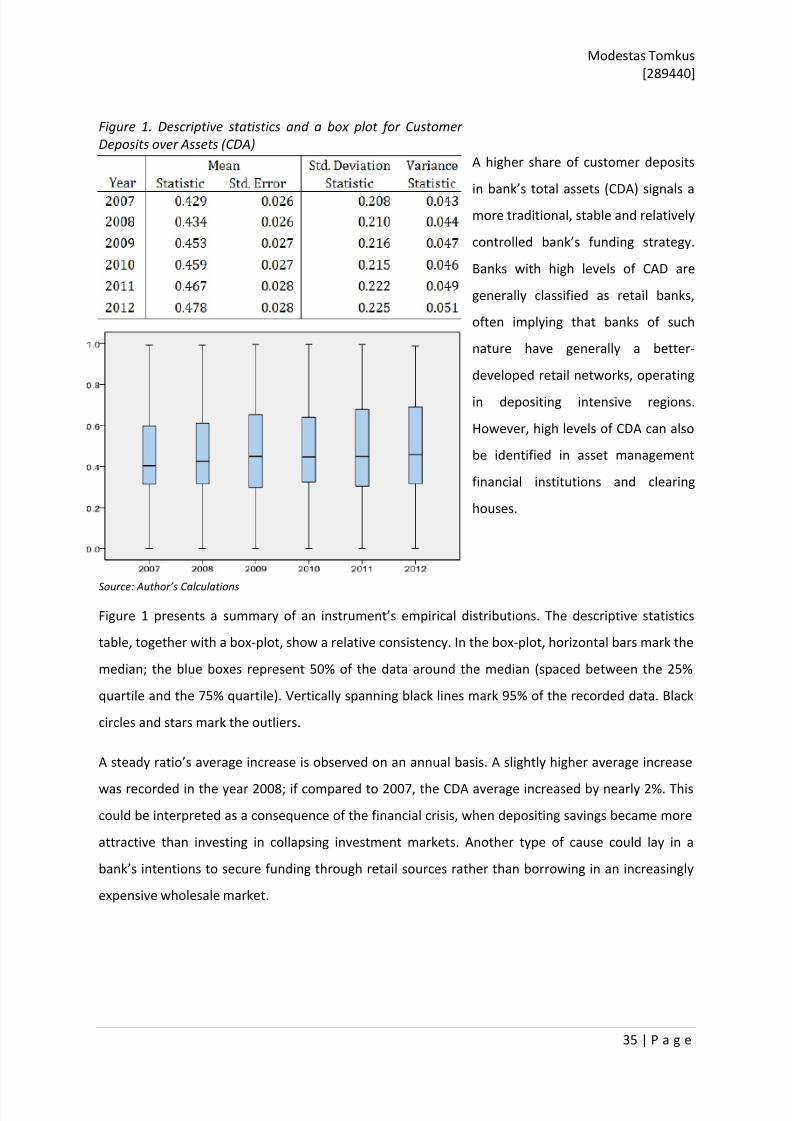
8/10/2019 How Banks Make Money
http://slidepdf.com/reader/full/how-banks-make-money 36/67
Modestas Tomkus
[289440]
35 | P a g e
Figure 1. Descriptive statistics and a box plot for Customer
Deposits over Assets (CDA)
A higher share of customer deposits
in bank’s total assets (CDA) signals a
more traditional, stable and relatively
controlled bank’s funding strategy.
Banks with high levels of CAD are
generally classified as retail banks,
often implying that banks of such
nature have generally a better-
developed retail networks, operating
in depositing intensive regions.
However, high levels of CDA can also
be identified in asset management
financial institutions and clearing
houses.
Source: Author’s Calculations
Figure 1 presents a summary of an instrument’s empirical distributions. The descriptive statistics
table, together with a box-plot, show a relative consistency. In the box-plot, horizontal bars mark the
median; the blue boxes represent 50% of the data around the median (spaced between the 25%
quartile and the 75% quartile). Vertically spanning black lines mark 95% of the recorded data. Black
circles and stars mark the outliers.
A steady ratio’s average increase is observed on an annual basis. A slightly higher average increase
was recorded in the year 2008; if compared to 2007, the CDA average increased by nearly 2%. This
could be interpreted as a consequence of the financial crisis, when depositing savings became more
attractive than investing in collapsing investment markets. Another type of cause could lay in a
bank’s intentions to secure funding through retail sources rather than borrowing in an increasingly
expensive wholesale market.
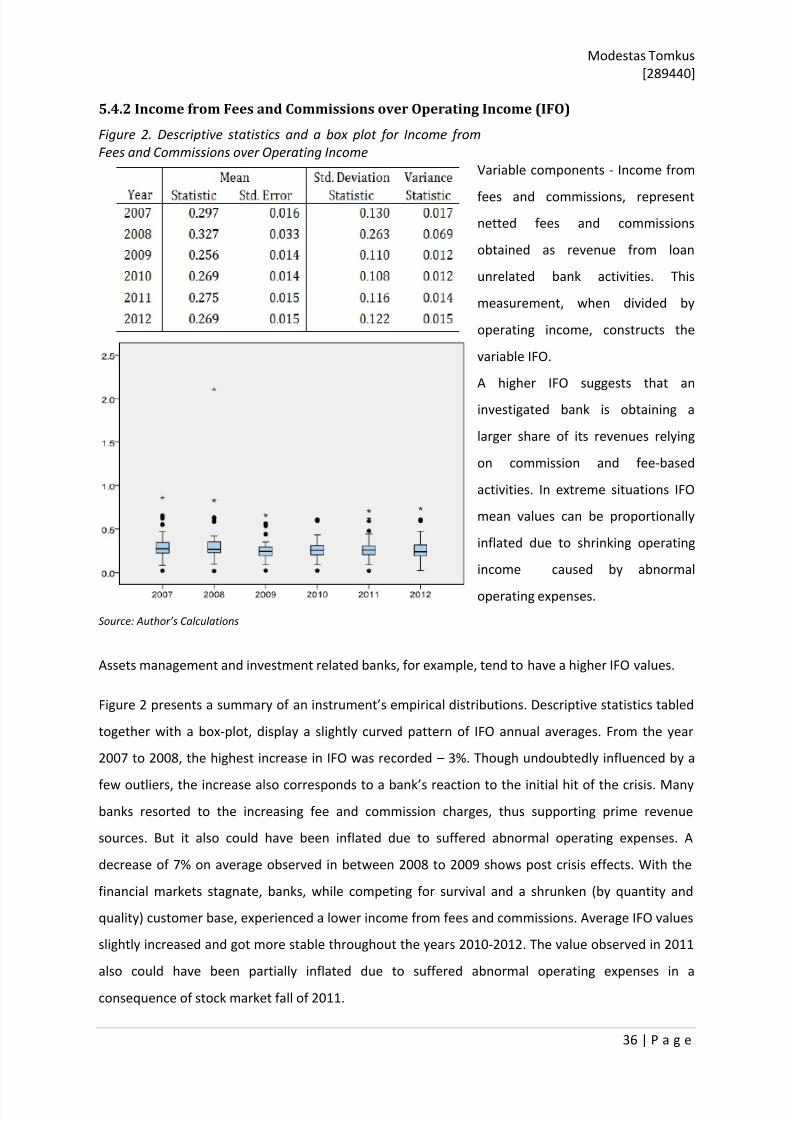
8/10/2019 How Banks Make Money
http://slidepdf.com/reader/full/how-banks-make-money 37/67
Modestas Tomkus
[289440]
36 | P a g e
5.4.2 Income from Fees and Commissions over Operating Income (IFO)
Figure 2. Descriptive statistics and a box plot for Income from
Fees and Commissions over Operating Income
Variable components - Income from
fees and commissions, represent
netted fees and commissions
obtained as revenue from loan
unrelated bank activities. This
measurement, when divided by
operating income, constructs the
variable IFO.
A higher IFO suggests that an
investigated bank is obtaining a
larger share of its revenues relying
on commission and fee-based
activities. In extreme situations IFO
mean values can be proportionally
inflated due to shrinking operating
income caused by abnormal
operating expenses.
Source: Author’s Calculations
Assets management and investment related banks, for example, tend to have a higher IFO values.
Figure 2 presents a summary of an instrument’s empirical distributions. Descriptive statistics tabled
together with a box-plot, display a slightly curved pattern of IFO annual averages. From the year
2007 to 2008, the highest increase in IFO was recorded – 3%. Though undoubtedly influenced by a
few outliers, the increase also corresponds to a bank’s reaction to the initial hit of the crisis. Manybanks resorted to the increasing fee and commission charges, thus supporting prime revenue
sources. But it also could have been inflated due to suffered abnormal operating expenses. A
decrease of 7% on average observed in between 2008 to 2009 shows post crisis effects. With the
financial markets stagnate, banks, while competing for survival and a shrunken (by quantity and
quality) customer base, experienced a lower income from fees and commissions. Average IFO values
slightly increased and got more stable throughout the years 2010-2012. The value observed in 2011
also could have been partially inflated due to suffered abnormal operating expenses in a
consequence of stock market fall of 2011.
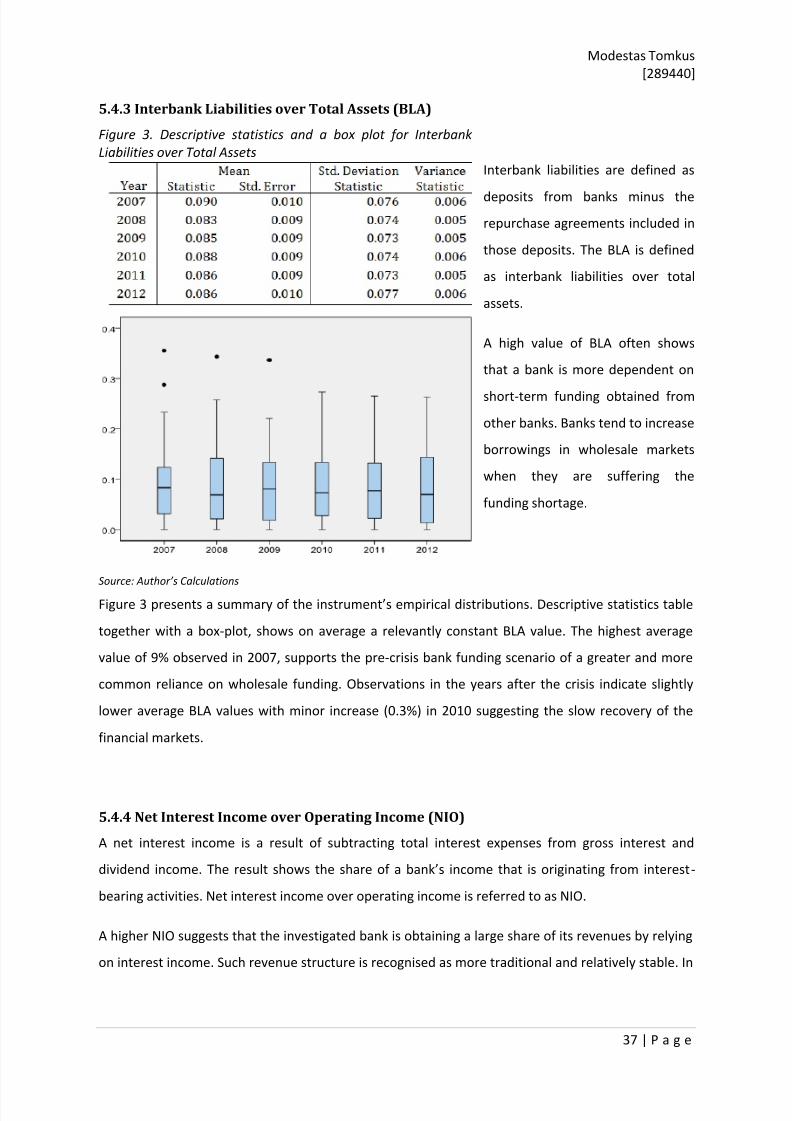
8/10/2019 How Banks Make Money
http://slidepdf.com/reader/full/how-banks-make-money 38/67
Modestas Tomkus
[289440]
37 | P a g e
5.4.3 Interbank Liabilities over Total Assets (BLA)
Figure 3. Descriptive statistics and a box plot for Interbank
Liabilities over Total Assets
Interbank liabilities are defined as
deposits from banks minus the
repurchase agreements included in
those deposits. The BLA is defined
as interbank liabilities over total
assets.
A high value of BLA often shows
that a bank is more dependent on
short-term funding obtained from
other banks. Banks tend to increase
borrowings in wholesale markets
when they are suffering the
funding shortage.
Source: Author’s Calculations
Figure 3 presents a summary of the instrument’s empirical distributions. Descriptive statistics table
together with a box-plot, shows on average a relevantly constant BLA value. The highest average
value of 9% observed in 2007, supports the pre-crisis bank funding scenario of a greater and more
common reliance on wholesale funding. Observations in the years after the crisis indicate slightly
lower average BLA values with minor increase (0.3%) in 2010 suggesting the slow recovery of the
financial markets.
5.4.4 Net Interest Income over Operating Income (NIO)
A net interest income is a result of subtracting total interest expenses from gross interest and
dividend income. The result shows the share of a bank’s income that is originating from interest-
bearing activities. Net interest income over operating income is referred to as NIO.
A higher NIO suggests that the investigated bank is obtaining a large share of its revenues by relying
on interest income. Such revenue structure is recognised as more traditional and relatively stable. In
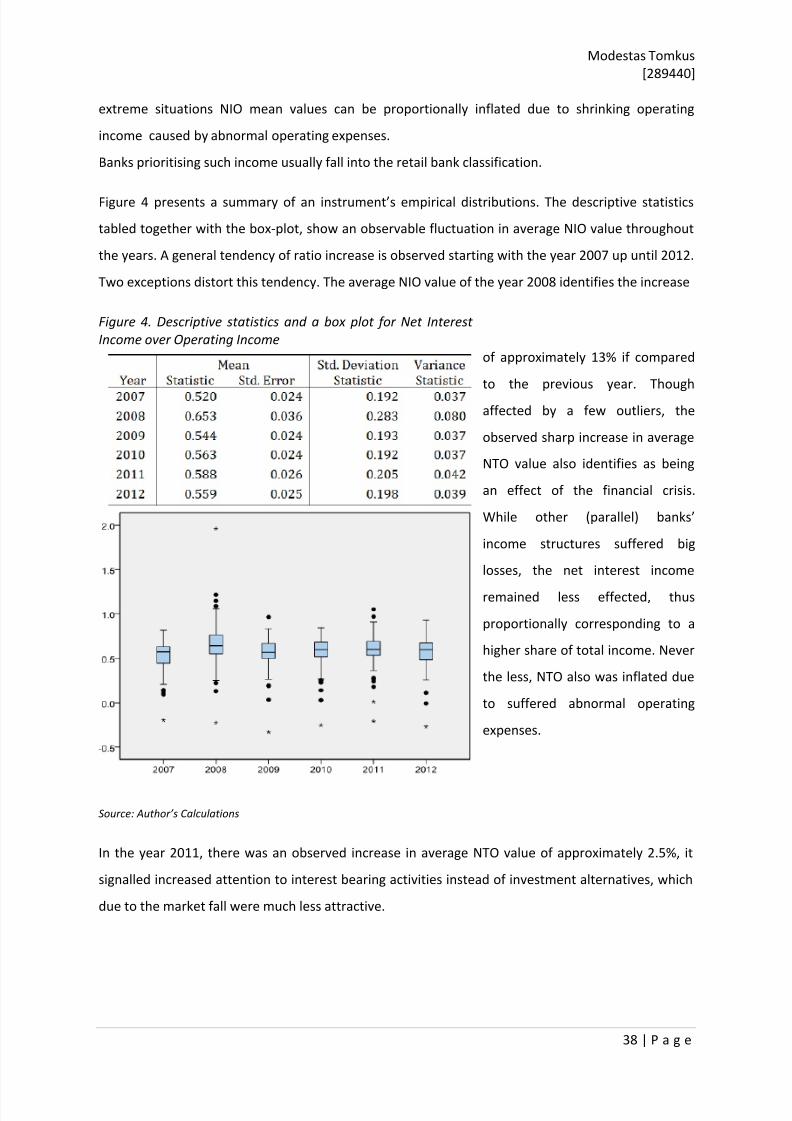
8/10/2019 How Banks Make Money
http://slidepdf.com/reader/full/how-banks-make-money 39/67
Modestas Tomkus
[289440]
38 | P a g e
extreme situations NIO mean values can be proportionally inflated due to shrinking operating
income caused by abnormal operating expenses.
Banks prioritising such income usually fall into the retail bank classification.
Figure 4 presents a summary of an instrument’s empirical distributions. The descriptive statistics
tabled together with the box-plot, show an observable fluctuation in average NIO value throughout
the years. A general tendency of ratio increase is observed starting with the year 2007 up until 2012.
Two exceptions distort this tendency. The average NIO value of the year 2008 identifies the increase
Figure 4. Descriptive statistics and a box plot for Net Interest
Income over Operating Income
of approximately 13% if compared
to the previous year. Though
affected by a few outliers, the
observed sharp increase in average
NTO value also identifies as being
an effect of the financial crisis.
While other (parallel) banks’
income structures suffered big
losses, the net interest income
remained less effected, thus
proportionally corresponding to a
higher share of total income. Never
the less, NTO also was inflated due
to suffered abnormal operating
expenses.
Source: Author’s Calculations
In the year 2011, there was an observed increase in average NTO value of approximately 2.5%, it
signalled increased attention to interest bearing activities instead of investment alternatives, which
due to the market fall were much less attractive.
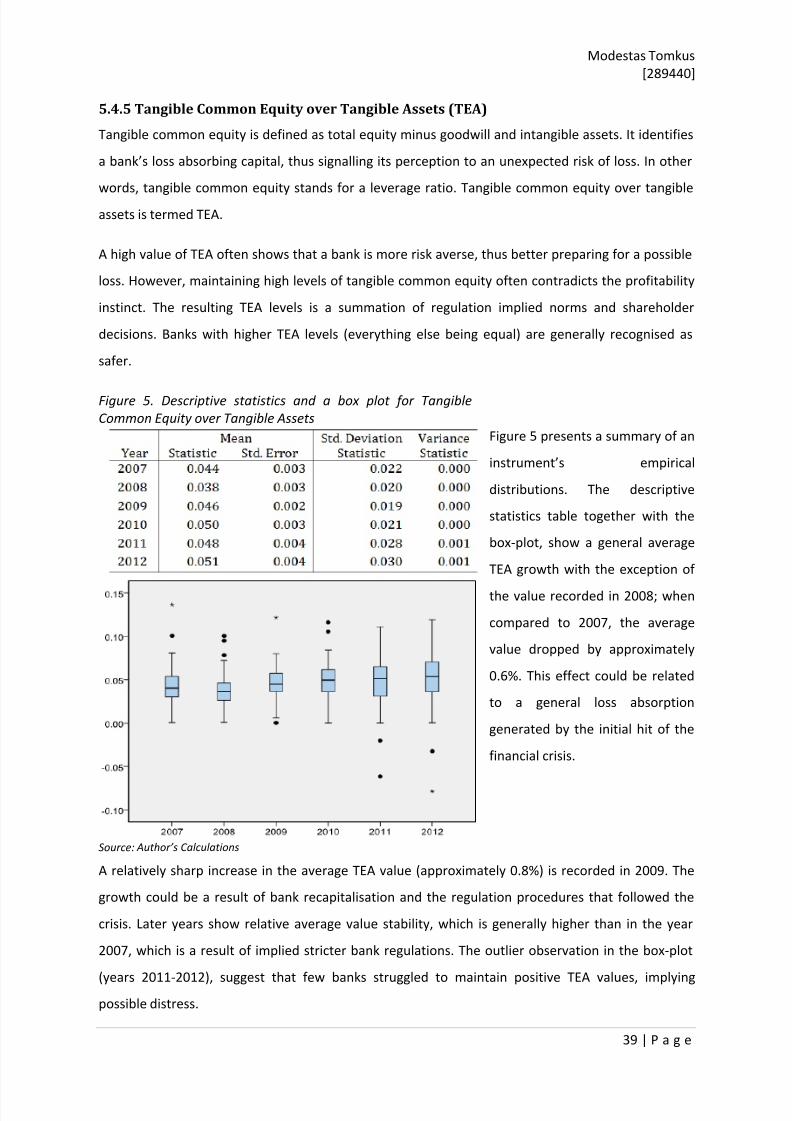
8/10/2019 How Banks Make Money
http://slidepdf.com/reader/full/how-banks-make-money 40/67
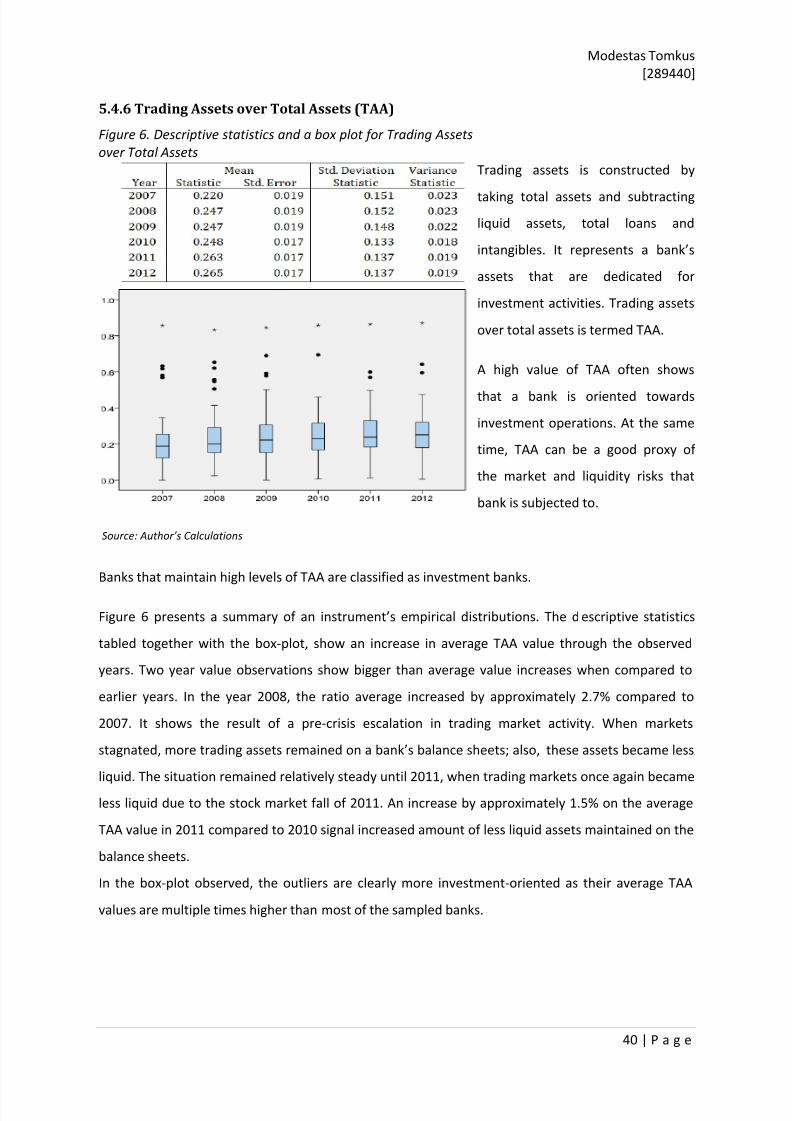
8/10/2019 How Banks Make Money
http://slidepdf.com/reader/full/how-banks-make-money 41/67
Modestas Tomkus
[289440]
40 | P a g e
5.4.6 Trading Assets over Total Assets (TAA)
Figure 6. Descriptive statistics and a box plot for Trading Assets
over Total Assets
Trading assets is constructed by
taking total assets and subtracting
liquid assets, total loans and
intangibles. It represents a bank’s
assets that are dedicated for
investment activities. Trading assets
over total assets is termed TAA.
A high value of TAA often shows
that a bank is oriented towards
investment operations. At the same
time, TAA can be a good proxy of
the market and liquidity risks that
bank is subjected to.
Source: Author’s Calculations
Banks that maintain high levels of TAA are classified as investment banks.
Figure 6 presents a summary of an instrument’s empirical distributions. The descriptive statistics
tabled together with the box-plot, show an increase in average TAA value through the observed
years. Two year value observations show bigger than average value increases when compared to
earlier years. In the year 2008, the ratio average increased by approximately 2.7% compared to
2007. It shows the result of a pre-crisis escalation in trading market activity. When markets
stagnated, more trading assets remained on a bank’s balance sheets; also, these assets became less
liquid. The situation remained relatively steady until 2011, when trading markets once again became
less liquid due to the stock market fall of 2011. An increase by approximately 1.5% on the average
TAA value in 2011 compared to 2010 signal increased amount of less liquid assets maintained on the
balance sheets.
In the box-plot observed, the outliers are clearly more investment-oriented as their average TAA
values are multiple times higher than most of the sampled banks.
8/10/2019 How Banks Make Money
http://slidepdf.com/reader/full/how-banks-make-money 42/67
Modestas Tomkus
[289440]
41 | P a g e
5.5 Data identifying self-defined business models
Self-defined or auto-defined business models are interpreted as business models expressed and/or
communicated by the banks themselves. Data identifying such business model expressions differ
significantly from the data obtained for statistical analysis. As it cannot be expressed by a number
based standardised reported data, obtaining self-defined business model identification data requires
a more qualitative research approach.
After considering all possible information channels, trough which banks are most likely to
communicate their business model and other business related information to the public (publicly
available information approach), a choice was made to rely on banks’ annual statements and official
websites as the most appropriate source.
The first step taken to obtain required data was an acquisition (downloaded copy) of all 63 banks’
latest annual statement for the year 2012, if not available, an annual statement from the year 2011
was chosen as a replacement. Second step involved looking trough the annual statements and
searching for quotes possibly identifying self defined bank’s business model. If such quote was not
available in the annual statement, the same procedure was repeated for the bank’s official website.
In many cases, acquiring a specific quote naming banks business model was impossible, thus a
proficient author’s interpretation, based on analyzed sources, was recorded.
Acquired data was divided into 3 major categories: (1) Target activities; (2) Target markets; (3) target
clients. Collected generalized raw data is available in appendix 7.
8/10/2019 How Banks Make Money
http://slidepdf.com/reader/full/how-banks-make-money 43/67
Modestas Tomkus
[289440]
42 | P a g e
6. Identifying Banking business models
This section will explain what methods were used to identify a bank’s business models, justify the
choice of algorithms, and present necessary steps taken to generate credible results. Additionally,
generated business models will be presented, described and interpreted. The sampled banks will be
grouped according to their business models and observed for changes in respect to the observed
time period.
6.1 Business model determination methods and limitations
Identifying business models with the use of multiple instruments that comprise a multi-dimensional
data set is a complicated task and can’t be done by relying on just human observation. The
possibility for error and multiple biases is simply too great. Therefore, a statistical clustering
technique was employed to identify the business models relying solely on a mathematical algorithm.
A cluster analysis is defined as the gathering of inspected populations based on chosen factors.
Factor-based group (cluster) formation relies on similarities that are shared among population
members. In this particular case, we intend to assign banks (population) into clusters based on
similar observation values observed in a certain factor’s (variable’s) scale. The process of cluster
formation by its nature ensures cluster dissimilarity as each cluster distinguishes itself with different
characteristics.
This technique is commonly used for exploratory statistical data analysis. Its applicability is expanded
by various algorithms and methods governing the identification of similarity properties that
eventually constitute cluster location, size and number.
Considering the gathered data sample size, its features and study objectives, the hierarchical cluster
analysis was chosen as a prime clustering technique. Such an analysis starts with treating each
sampled bank as a separate cluster, and then in later sequences, it lowers required criteria and
combines clusters together, continuously reducing the number of formed groups until only onecluster remains. In the cluster formation procedure, the technique relies on distance dissimilarities
between banks measured in the variables’ scale.
In statistical software programming, the hierarchical clustering technique is often accompanied by a
dendrogram (a tree diagram) as part of the output. It graphically represents the cluster formation
and merger in individual cycles, thus displaying grouping tendencies and hinting at an optimal
number of clusters. The latter feature of the dendrogram will be further discussed in the performed
clustering procedure description.
8/10/2019 How Banks Make Money
http://slidepdf.com/reader/full/how-banks-make-money 44/67
Modestas Tomkus
[289440]
43 | P a g e
Hierarchical clustering techniques require a choice between factor distance evaluation methods. In
this study, Ward’s method was chosen as the best-suiting collected data properties. This method is
based on the analysis of variance approach to evaluate the distances between clusters. Essentially,
Ward’s method forms clusters by minimising the sum of squares of two clusters from the previous
sequence generation. The detail description of this method is explained by J. H. Ward himself in his
paper on hierarchical grouping (Ward 1963).
The technique was chosen for its superior ability to perform better, compared to other methods,
with a relatively small data set featuring few outliers. Additionally, this technique is recognised by
several studies as highly efficient and reliable. G. W. Milligan presents a detailed assessment of
Ward’s method as well as other clustering methods (Milligan 1981).
The last parameter of a used cluster analysis is the distance measurement. The Squared Euclidiandistance was chosen as most suitable for this study. In short, it is a geometric distance in
multidimensional space and can be computed as: distance (x,y) = i (xi - yi)2. Besides being a
common method for distance measurements, the squared Euclidian distances are usually computed
from non-standardised data. Having no restrictions on the standardization prevent a possible data
diluting effect.
The hierarchical clustering procedure by itself does not provide an exact answer of how many
clusters should be formed in order to reach the optimal solution. To determine the “correct”
number of clusters, Calinski and Harabasz’s pseudo-F index was used (Caliński, Harabasz 1974). Its
role as a stopping rule is based on the variance ratio criterion (VRC). For a calculation with N objects
and K segments, the ratio is defined as between-segment variation (SSB) over within-segment
variation (SSW), or simply as: VRCk=(SSB / (K-1)) / (SSW / (N-K)). The criterion is otherwise recognised
as the F-value of a one-way ANOVA with K standing for the number of factor levels. Later , ωk is
computed to determine the optimum number of clusters: ωk= (VRCk+1 – VRCk) – (VRCk - VRCk-1). Here,
the value of K is chosen, so ωk would be minimised. This stopping rule has proven to perform well innumerous cases (Milligan 1985).
Clustering-related procedures were conducted using SPSS Statistics 17.0. The available built-in
functions offered constructive and reliable data processing possibilities, which were more than
sufficient for this study.
Limitations
A data standardization procedure was considered to be used in the study: each indicator
standardised to a mean of zero and a standard deviation of one. Nevertheless, standardised data
8/10/2019 How Banks Make Money
http://slidepdf.com/reader/full/how-banks-make-money 45/67
Modestas Tomkus
[289440]
44 | P a g e
clustering showed no substantial effect on formed clusters. Bank cluster memberships remained
unchanged when compared to “raw” data clustering. Further use of standardisation was dismissed
as specifics of clustering procedures were chosen to better suit non-standardised data.
The presence of outliers in a data set was noted, and their effect in clustering results were
investigated. With the use of the widely recognised “2.2 outlier labelling rule” (Hoaglin, Iglewicz
1987) which is particularly fit for the sample size of this study, maximum and minimum acceptable
values were derived. Observation values exceeding those of derived values were labelled as outliers.
Due to a relatively high number of identified outliers, the elimination of these bank year
observations was not feasible. The data set would no longer be sufficient for further analysis.
Instead, an attempt to replace the outlier values with derived maximum tolerable values was made
(this would allow the data set to remain fit for analysis and still recognise observation values asextremes). The attempted modified data clustering results showed no significant variation from
clusters formed using unaltered observation values. Therefore, further use of modified data in the
study was not considered.
A comparison between the standardised values, modified values and original values cluster
membership (for 3 clusters) is provided in appendix 8.
In the end, the chosen clustering procedure is well-supported by the existing literature, but it is not
necessarily the only or best solution. Every chosen detail, from data set, variable, to clustering
method and stopping rule, sums up to a unique solution. Even a slightest change in a choice of
sampled banks or model-defining variable could present a totally new outcome. Therefore, the
generated results should be treated with care and within the established boundaries of this study.
6.2 Results
6.2.1 Determining the number of clusters
By implementing the techniques and methodology introduced in the previous section, a two-method
procedure was derived in order to properly identify the optimal number of clusters.
In the first method, a clustering analysis was performed using pooled variable data (separate
variable year observations were summed and divided by the number of observed years). The output
dendrogram (provided in appendix 9) can be used as a “hint” for optimal cluster number.
In the software-generated dendrogram sampled banks, represented by their list number, are
grouped in different clusters. With an increasing number of sequences, larger clusters are formed
with increasingly dissimilar elements. The optimal number solution is hinted by a significantdistinction of tree clear groups (identified by horizontal lines, hinting 3 cluster optimal solution.
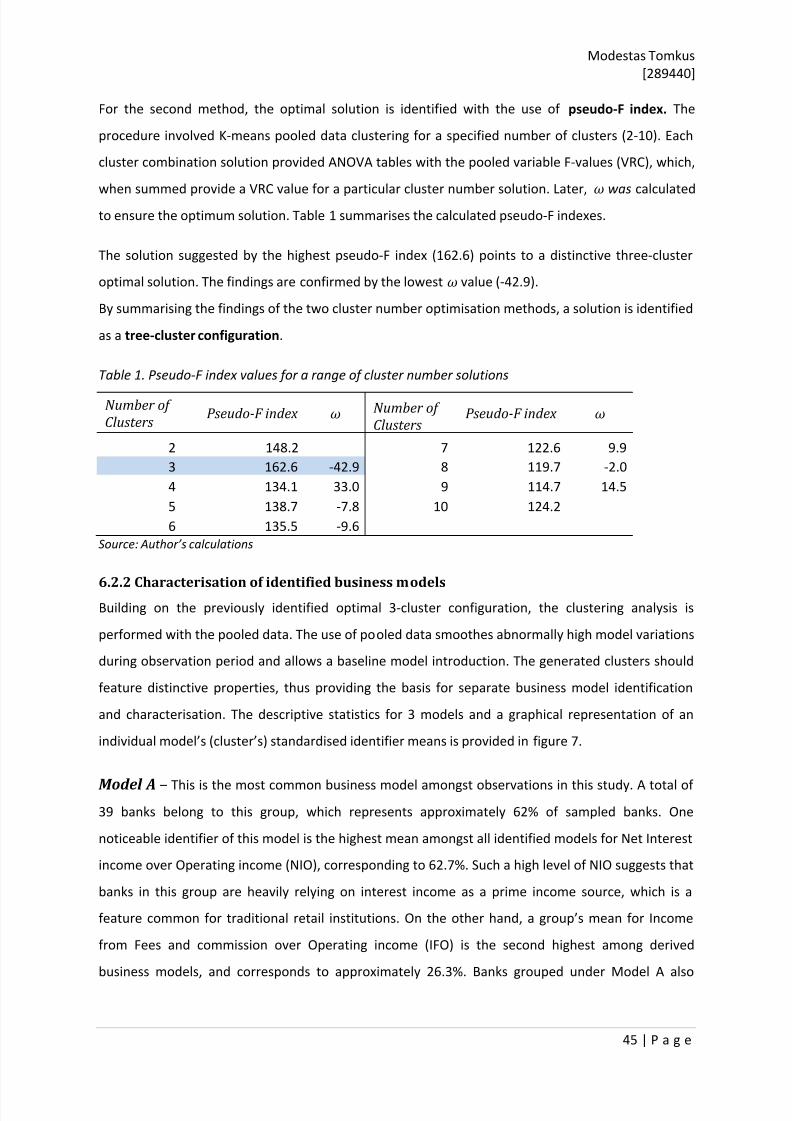
8/10/2019 How Banks Make Money
http://slidepdf.com/reader/full/how-banks-make-money 46/67
Modestas Tomkus
[289440]
45 | P a g e
For the second method, the optimal solution is identified with the use of pseudo-F index. The
procedure involved K-means pooled data clustering for a specified number of clusters (2-10). Each
cluster combination solution provided ANOVA tables with the pooled variable F-values (VRC), which,
when summed provide a VRC value for a particular cluster number solution. Later, ω was calculated
to ensure the optimum solution. Table 1 summarises the calculated pseudo-F indexes.
The solution suggested by the highest pseudo-F index (162.6) points to a distinctive three-cluster
optimal solution. The findings are confirmed by the lowest ω value (-42.9).
By summarising the findings of the two cluster number optimisation methods, a solution is identified
as a tree-cluster configuration.
Table 1. Pseudo-F index values for a range of cluster number solutions
Number of
ClustersPseudo-F index ω Number of
ClustersPseudo-F index ω
2 148.2 7 122.6 9.9
3 162.6 -42.9 8 119.7 -2.0
4 134.1 33.0 9 114.7 14.5
5 138.7 -7.8 10 124.2
6 135.5 -9.6
Source: Author’s calculations
6.2.2 Characterisation of identified business modelsBuilding on the previously identified optimal 3-cluster configuration, the clustering analysis is
performed with the pooled data. The use of pooled data smoothes abnormally high model variations
during observation period and allows a baseline model introduction. The generated clusters should
feature distinctive properties, thus providing the basis for separate business model identification
and characterisation. The descriptive statistics for 3 models and a graphical representation of an
individual model’s (cluster’s) standardised identifier means is provided in figure 7.
Model A – This is the most common business model amongst observations in this study. A total of
39 banks belong to this group, which represents approximately 62% of sampled banks. One
noticeable identifier of this model is the highest mean amongst all identified models for Net Interest
income over Operating income (NIO), corresponding to 62.7%. Such a high level of NIO suggests that
banks in this group are heavily relying on interest income as a prime income source, which is a
feature common for traditional retail institutions. On the other hand, a group’s mean for Income
from Fees and commission over Operating income (IFO) is the second highest among derived
business models, and corresponds to approximately 26.3%. Banks grouped under Model A also
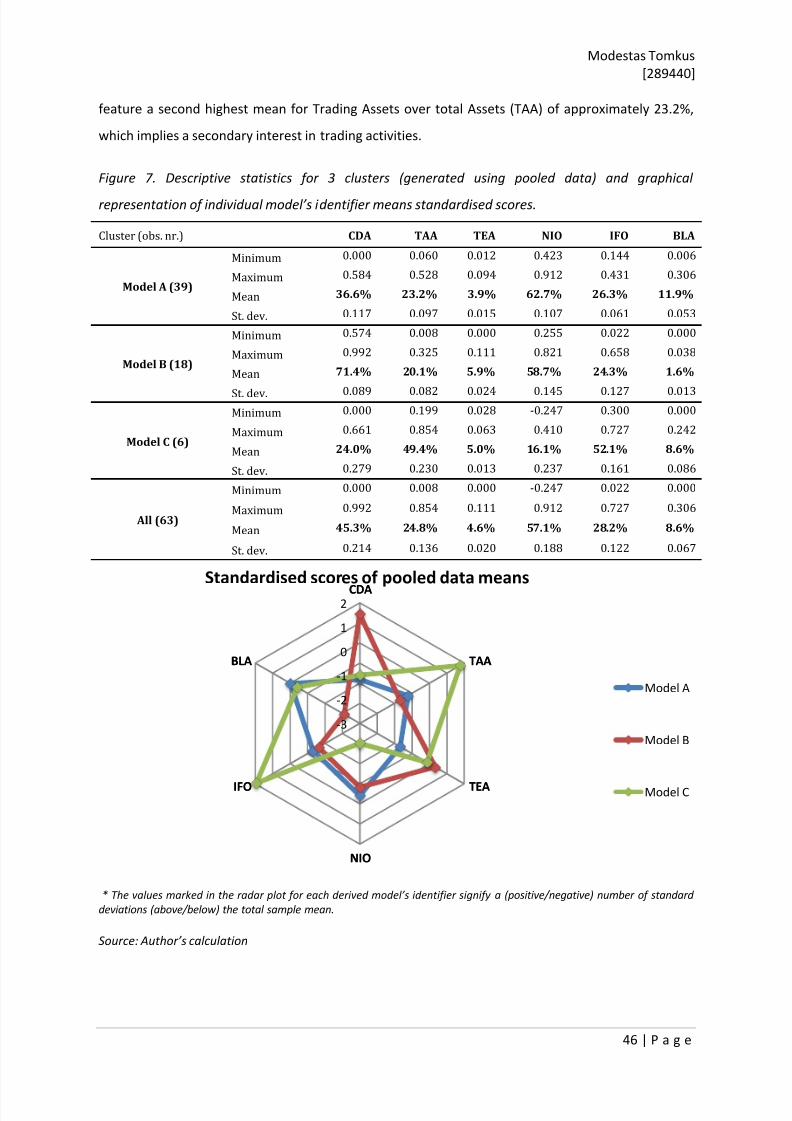
8/10/2019 How Banks Make Money
http://slidepdf.com/reader/full/how-banks-make-money 47/67
Modestas Tomkus
[289440]
46 | P a g e
feature a second highest mean for Trading Assets over total Assets (TAA) of approximately 23.2%,
which implies a secondary interest in trading activities.
Figure 7. Descriptive statistics for 3 clusters (generated using pooled data) and graphical
representation of individual model’s identifier means standardised scores.
Cluster (obs. nr.) CDA TAA TEA NIO IFO BLA
Model A (39)
Minimum 0.000 0.060 0.012 0.423 0.144 0.006
Maximum 0.584 0.528 0.094 0.912 0.431 0.306
Mean 36.6% 23.2% 3.9% 62.7% 26.3% 11.9%
St. dev. 0.117 0.097 0.015 0.107 0.061 0.053
Model B (18)
Minimum 0.574 0.008 0.000 0.255 0.022 0.000
Maximum 0.992 0.325 0.111 0.821 0.658 0.038
Mean 71.4% 20.1% 5.9% 58.7% 24.3% 1.6%
St. dev. 0.089 0.082 0.024 0.145 0.127 0.013
Model C (6)
Minimum 0.000 0.199 0.028 -0.247 0.300 0.000
Maximum 0.661 0.854 0.063 0.410 0.727 0.242
Mean 24.0% 49.4% 5.0% 16.1% 52.1% 8.6%
St. dev. 0.279 0.230 0.013 0.237 0.161 0.086
All (63)
Minimum 0.000 0.008 0.000 -0.247 0.022 0.000
Maximum 0.992 0.854 0.111 0.912 0.727 0.306
Mean 45.3% 24.8% 4.6% 57.1% 28.2% 8.6%
St. dev. 0.214 0.136 0.020 0.188 0.122 0.067
* The values marked in the radar plot for each derived model’s identifier signify a (positive/negative) number of standard
deviations (above/below) the total sample mean.
Source: Author’s calculation
CDA
TAA
TEA
NIO
IFO
BLA
-3
-2
-1
0
1
2CDA
TAA
TEA
NIO
IFO
BLA
Standardised scores of pooled data means
Model A
Model B
Model C
8/10/2019 How Banks Make Money
http://slidepdf.com/reader/full/how-banks-make-money 48/67
Modestas Tomkus
[289440]
47 | P a g e
Another distinctive feature of this model is the highest mean of all 3 models for Interbank Liabilities
over total Assets (BLA), featuring 11.9%. This group shows the highest dependency on interbank
borrowing, thus implying that nearly 12% of their average total funding comes from a pricier source -
wholesale banks. An orientation towards non-traditional funding practices is also implied by a
comparably small share of customer deposit-based funding with a mean of approximately 36.6% of
total assets (CDA). General funding practices of banks forming this model does not allow for the
classification as a purely retail bank model.
The last distinctive feature of this model is that it has the lowest mean of all 3 models for Tangible
common Equity over tangible Assets (TEA), which corresponds to 3.9%. This comparably low mean
value implies that this group is more leveraged then other groups. The higher leverage of this group
could also be partially explained by losses suffered during and after the financial crisis. On the other
hand, some risk is compensated by the diversified business and funding practices.
This banking business model clusters mostly the banking groups, which operating under one name,
tend to have a diverse selection of available services, that might also by divided into different
business model oriented divisions, yet in the end they are consolidated in one balance sheet with
universal banking properties.
Summarising all observations, this group could be classified as wholesale oriented universal banking
model.
Model B – This is the second most common business model amongst sampled banks. A total of 18
banks belong to this group, which corresponds to approximately 28.5% of the total sample. The most
distinctive feature of this cluster is a very high Customer Deposit share in total assets (CDA). The
model mean for CDA is approximately 71.4%, which is nearly a two times greater mean value then
the one observed in Model A, and nearly three times larger than in Model C. The cluster clearly
groups banks that heavily rely on customer deposits as the main source of funding. However, the
maximum value of approximately 99.2% for CDA identifies certain outlier. Under closer inspection,
two institutions were identified to have abnormal levels of CDA: LCH Clearnet Group Limited with
the CDA value of approximately 99.2 % and Northern Trust Corporation with CDA value of
approximately 77.6%. These institutions are not retail oriented, but are from a very distinctive
banking businesses. LCH Clearnet Group Limited is a clearing house, thus such a level of CDA is
normal due to clearing margin requirements. Northern Trust Corporation on the other hand is an
asset management financial institution by nature holding large amounts of CDA. Bothe of these
abnormal institutions could form clusters of their own.
8/10/2019 How Banks Make Money
http://slidepdf.com/reader/full/how-banks-make-money 49/67
Modestas Tomkus
[289440]
48 | P a g e
The group’s recorded mean for Interbank Liabilities over total assets (BLA) of approximately 1.6%,
which is the smallest recorded BLA mean value among all business models, confirms customer
deposit-based funding strategy.
The banks grouped under business Model B obtain a greater share of their income from interest
based revenue sources, which is clearly identified by the mean for Net Interest income over
operating income (NIO) of approximately 58.7%, which is the second highest NIO mean recorded
among all business models. For this group of banks, the non-interest based income is a secondary
revenue line, which is identified by the mean value of approximately 24.3% for Income from Fees
and Commissions over Operating income (IFO). Low trading operation intensity is identified by
Trading Assets share in grouped banks’ balance sheets (TAA) that records a mean of approximately
20.1%, which is the smallest TAA mean value among the derived business models.
Banks grouped under Model B feature the highest mean value recorded among the derived models
for Tangible common Equity over tangible Assets (TEA), which is approximately 5.9%. A high level of
loss-absorbing capital identifies a low level of grouped banks’ leverage and lower overall riskiness.
By summarising all cluster identifier mean values it is possible to conclude, that Model B is a retail
business model.
Model C – This is the least common business model amongst the sampled banks. A total of 6 banks
belong to this group, which represents approximately 9.5% of sampled banks. The model
distinguishes itself with the highest mean among all derived models for Income from Fees and
commissions over Operating income (IFO) of approximately 52.1%. It clearly shows that the group’s
revenue structure is mostly based on non-interest income. A similar conclusion is provided by the
lowest mean recorded for Net Interest income over Operating income (NIO), which is represented by
approximately 16.1%. In addition, the recorded highest mean in the sample for Trading Assets over
total Assets (TAA) of approximately 49.4% points to the overall model’s tendency towards
Investment banking.
Funding practices of banks under Model C show the lowest level of reliance on Customer Deposits
(CDA), corresponding to the mean of less than a quarter (approximately 24%) of total funding. A
groups’ funding acquired through wholesale banks corresponds almost identically to the mean of the
total sample, which is identified by the mean of approximately 8.6% for Interbank Liabilities over
total Assets (BLA).
Banks operating under Model C feature the second largest mean among the derived models for
Tangible common Equity over tangible Assets of approximately 5%. The measured value shows that
banks in this group maintain a slightly higher level of loss-absorbing capital then the mean of thetotal sample.
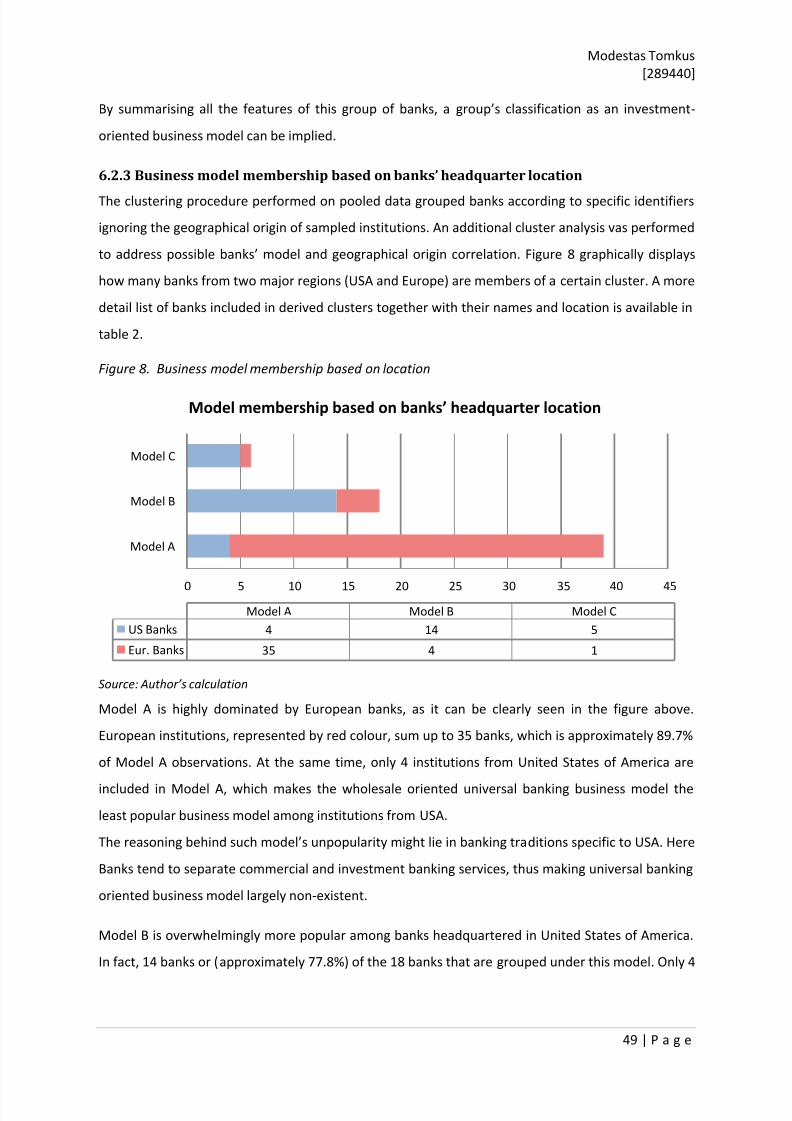
8/10/2019 How Banks Make Money
http://slidepdf.com/reader/full/how-banks-make-money 50/67
Modestas Tomkus
[289440]
49 | P a g e
By summarising all the features of this group of banks, a group’s classification as an investment-
oriented business model can be implied.
6.2.3 Business model membership based on banks’ headquarter location
The clustering procedure performed on pooled data grouped banks according to specific identifiers
ignoring the geographical origin of sampled institutions. An additional cluster analysis vas performed
to address possible banks’ model and geographical origin correlation. Figure 8 graphically displays
how many banks from two major regions (USA and Europe) are members of a certain cluster. A more
detail list of banks included in derived clusters together with their names and location is available in
table 2.
Figure 8. Business model membership based on location
Source: Author’s calculation
Model A is highly dominated by European banks, as it can be clearly seen in the figure above.
European institutions, represented by red colour, sum up to 35 banks, which is approximately 89.7%
of Model A observations. At the same time, only 4 institutions from United States of America are
included in Model A, which makes the wholesale oriented universal banking business model the
least popular business model among institutions from USA.
The reasoning behind such model’s unpopularity might lie in banking traditions specific to USA. Here
Banks tend to separate commercial and investment banking services, thus making universal banking
oriented business model largely non-existent.
Model B is overwhelmingly more popular among banks headquartered in United States of America.
In fact, 14 banks or (approximately 77.8%) of the 18 banks that are grouped under this model. Only 4
0 5 10 15 20 25 30 35 40 45
Model A
Model B
Model C
Model A Model B Model C
US Banks 4 14 5
Eur. Banks 35 4 1
Model membership based on banks’ headquarter location
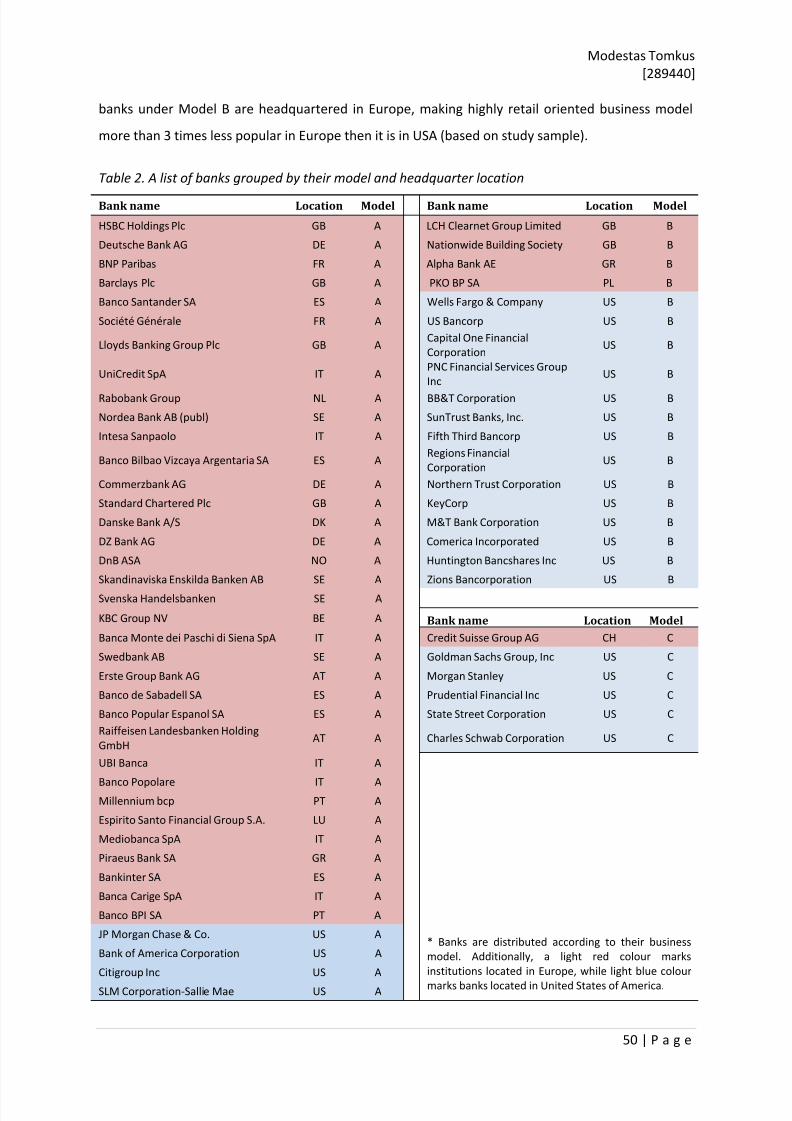
8/10/2019 How Banks Make Money
http://slidepdf.com/reader/full/how-banks-make-money 51/67
8/10/2019 How Banks Make Money
http://slidepdf.com/reader/full/how-banks-make-money 52/67
Modestas Tomkus
[289440]
51 | P a g e
Such situation could be influenced by European geography itself. When compared to states in USA,
European countries are relatively small and very different, making it very difficult to expand
geographically in order to acquire more customers and build a retail network of equivalent size.
Instead, more centralized universal banking practices are preferred to maintain growth. On the
other hand, USA market offers more attractive geographical growth options: states are unified by
same federal laws, same language and culturally very similar customer base.
Model C represents the smallest group of banks when compared to total sample. Only 6 banks are
grouped under Model C. It is also the least geographically balanced model, as 5 banks or
approximately 83.3% of the group are headquartered in United States of America. Only 1 institution
from Europe is grouped in this model.
Such dominance of banks from USA in Model C could be explained by few general observations. USA
financial markets have a long history in investment banking (Adams 1978). Some would even argue
that culturally Americans themselves tend to risk more, thus making investment more popular.
Another type of reasoning relies on banking tradition in US, where commercial and investment
banking activities were separated, thus creating single business line oriented institutions. At the
same time, European banks incorporated multiple business lines by taking the universal approach.
6.2.4 Business models derived for each year in the observation period
The previously introduced business model formation required the use of pooled data to reliably
establish the baseline business models and identify banks that used those models most often.
However, such methodology does not clarify whether business models changed over time or if banks
used different business models in different time periods. To address this shortcoming, a separate
clustering analysis for 3 cluster solutions was performed for each year of the sampled period.
It is important to mention that hierarchical clustering procedure does not maintain previously
derived cluster centres (pooled), thus grouped business models display variation in formed cluster
identifier means. This method allows financial market anomaly identification, which are reflected in
fluctuations of the model identifier means. Furthermore, formed business models will naturally
adjust their identifier requirements to facilitate banks with model specific features. Thus banks will
not be removed from clusters just because their identifier means no longer fit the means derived
with pooled data and at the same tame will be capable to identify only banks that fit the model.
Change of business models over time
The clustering results for each year were summarized by the use of descriptive statistics and
together with accompanying radar plots of standardised identifier means for individual cluster are
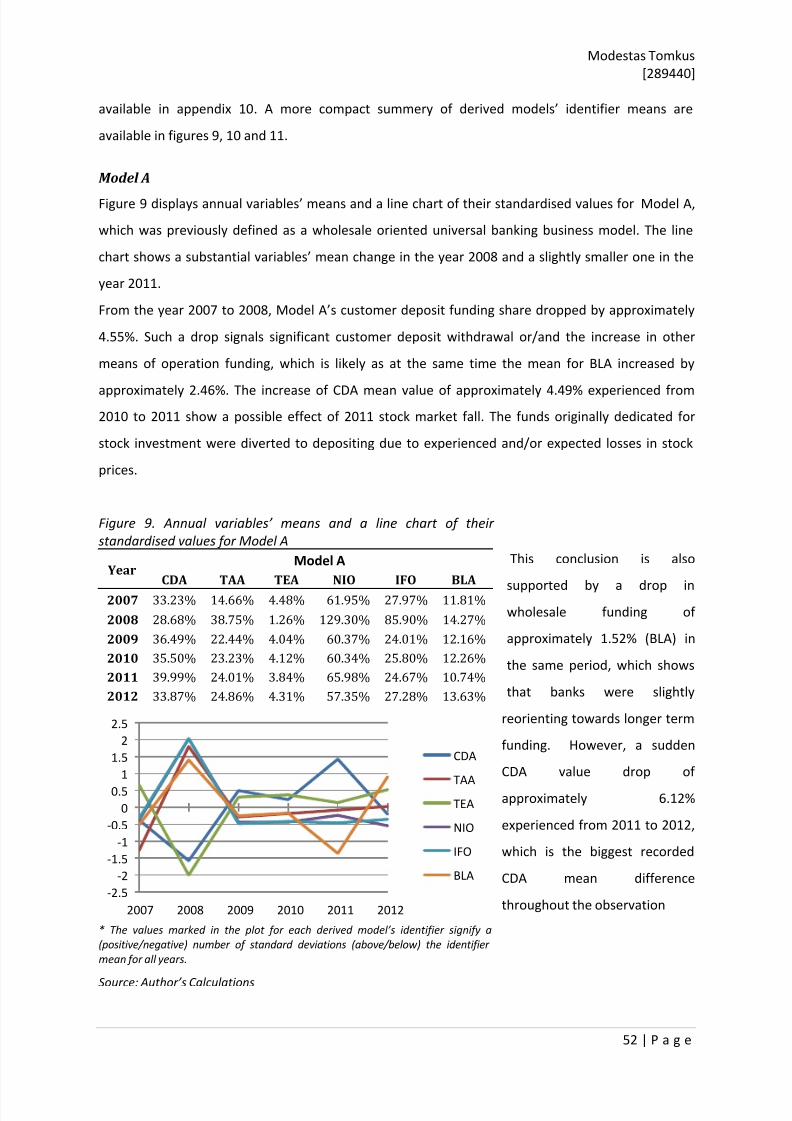
8/10/2019 How Banks Make Money
http://slidepdf.com/reader/full/how-banks-make-money 53/67
Modestas Tomkus
[289440]
52 | P a g e
-2.5
-2
-1.5
-1
-0.5
0
0.5
1
1.5
2
2.5
2007 2008 2009 2010 2011 2012
CDA
TAATEA
NIO
IFO
BLA
available in appendix 10. A more compact summery of derived models’ identifier means are
available in figures 9, 10 and 11.
Model A
Figure 9 displays annual variables’ means and a line chart of their standardised values for Model A,
which was previously defined as a wholesale oriented universal banking business model. The line
chart shows a substantial variables’ mean change in the year 2008 and a slightly smaller one in the
year 2011.
From the year 2007 to 2008, Model A’s customer deposit funding share dropped by approximately
4.55%. Such a drop signals significant customer deposit withdrawal or/and the increase in other
means of operation funding, which is likely as at the same time the mean for BLA increased by
approximately 2.46%. The increase of CDA mean value of approximately 4.49% experienced from
2010 to 2011 show a possible effect of 2011 stock market fall. The funds originally dedicated for
stock investment were diverted to depositing due to experienced and/or expected losses in stock
prices.
Figure 9. Annual variables’ means and a line chart of their
standardised values for Model A
This conclusion is also
supported by a drop in
wholesale funding of
approximately 1.52% (BLA) in
the same period, which shows
that banks were slightly
reorienting towards longer term
funding. However, a sudden
CDA value drop of
approximately 6.12%
experienced from 2011 to 2012,
which is the biggest recorded
CDA mean difference
throughout the observation
* The values marked in the plot for each derived model’s identifier signify a
(positive/negative) number of standard deviations (above/below) the identifier
mean for all years.
Source: Author’s Calculations
YearModel A
CDA TAA TEA NIO IFO BLA
2007 33.23% 14.66% 4.48% 61.95% 27.97% 11.81%
2008 28.68% 38.75% 1.26% 129.30% 85.90% 14.27%
2009 36.49% 22.44% 4.04% 60.37% 24.01% 12.16%
2010 35.50% 23.23% 4.12% 60.34% 25.80% 12.26%
2011 39.99% 24.01% 3.84% 65.98% 24.67% 10.74%
2012 33.87% 24.86% 4.31% 57.35% 27.28% 13.63%
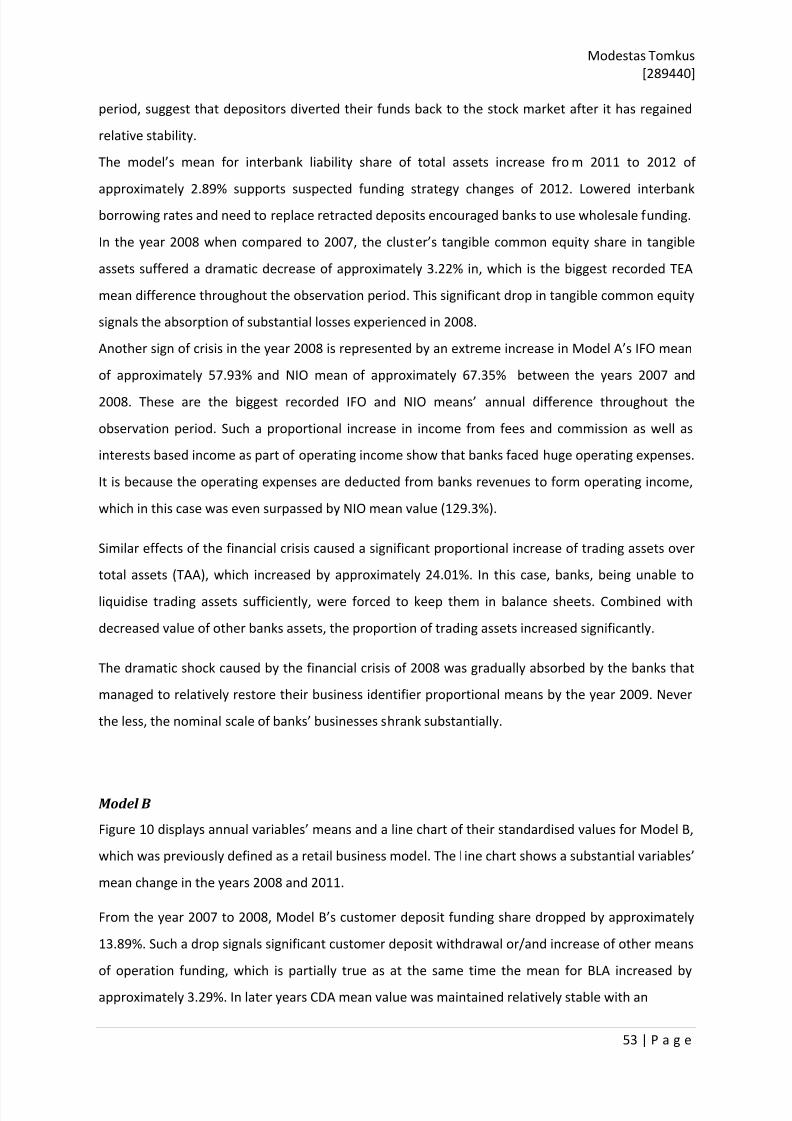
8/10/2019 How Banks Make Money
http://slidepdf.com/reader/full/how-banks-make-money 54/67
Modestas Tomkus
[289440]
53 | P a g e
period, suggest that depositors diverted their funds back to the stock market after it has regained
relative stability.
The model’s mean for interbank liability share of total assets increase fro m 2011 to 2012 of
approximately 2.89% supports suspected funding strategy changes of 2012. Lowered interbank
borrowing rates and need to replace retracted deposits encouraged banks to use wholesale funding.
In the year 2008 when compared to 2007, the cluster’s tangible common equity share in tangible
assets suffered a dramatic decrease of approximately 3.22% in, which is the biggest recorded TEA
mean difference throughout the observation period. This significant drop in tangible common equity
signals the absorption of substantial losses experienced in 2008.
Another sign of crisis in the year 2008 is represented by an extreme increase in Model A’s IFO mean
of approximately 57.93% and NIO mean of approximately 67.35% between the years 2007 and
2008. These are the biggest recorded IFO and NIO means’ annual difference throughout the
observation period. Such a proportional increase in income from fees and commission as well as
interests based income as part of operating income show that banks faced huge operating expenses.
It is because the operating expenses are deducted from banks revenues to form operating income,
which in this case was even surpassed by NIO mean value (129.3%).
Similar effects of the financial crisis caused a significant proportional increase of trading assets over
total assets (TAA), which increased by approximately 24.01%. In this case, banks, being unable to
liquidise trading assets sufficiently, were forced to keep them in balance sheets. Combined with
decreased value of other banks assets, the proportion of trading assets increased significantly.
The dramatic shock caused by the financial crisis of 2008 was gradually absorbed by the banks that
managed to relatively restore their business identifier proportional means by the year 2009. Never
the less, the nominal scale of banks’ businesses shrank substantially.
Model B
Figure 10 displays annual variables’ means and a line chart of their standardised values for Model B,
which was previously defined as a retail business model. The line chart shows a substantial variables’
mean change in the years 2008 and 2011.
From the year 2007 to 2008, Model B’s customer deposit funding share dropped by approximately
13.89%. Such a drop signals significant customer deposit withdrawal or/and increase of other means
of operation funding, which is partially true as at the same time the mean for BLA increased by
approximately 3.29%. In later years CDA mean value was maintained relatively stable with an
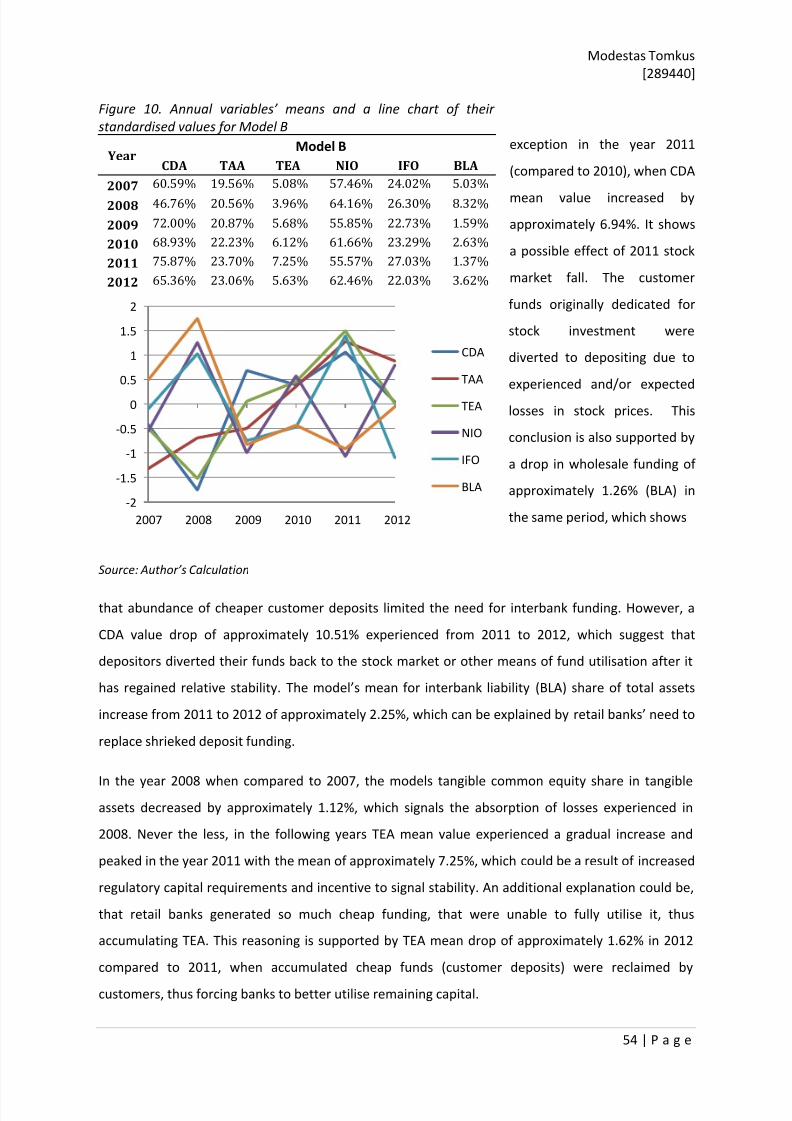
8/10/2019 How Banks Make Money
http://slidepdf.com/reader/full/how-banks-make-money 55/67
Modestas Tomkus
[289440]
54 | P a g e
Figure 10. Annual variables’ means and a line chart of their
standardised values for Model B
exception in the year 2011
(compared to 2010), when CDA
mean value increased by
approximately 6.94%. It shows
a possible effect of 2011 stock
market fall. The customer
funds originally dedicated for
stock investment were
diverted to depositing due to
experienced and/or expected
losses in stock prices. This
conclusion is also supported by
a drop in wholesale funding of
approximately 1.26% (BLA) in
the same period, which shows
Source: Author’s Calculation
that abundance of cheaper customer deposits limited the need for interbank funding. However, a
CDA value drop of approximately 10.51% experienced from 2011 to 2012, which suggest that
depositors diverted their funds back to the stock market or other means of fund utilisation after it
has regained relative stability. The model’s mean for interbank liability (BLA) share of total assets
increase from 2011 to 2012 of approximately 2.25%, which can be explained by retail banks’ need to
replace shrieked deposit funding.
In the year 2008 when compared to 2007, the models tangible common equity share in tangibleassets decreased by approximately 1.12%, which signals the absorption of losses experienced in
2008. Never the less, in the following years TEA mean value experienced a gradual increase and
peaked in the year 2011 with the mean of approximately 7.25%, which could be a result of increased
regulatory capital requirements and incentive to signal stability. An additional explanation could be,
that retail banks generated so much cheap funding, that were unable to fully utilise it, thus
accumulating TEA. This reasoning is supported by TEA mean drop of approximately 1.62% in 2012
compared to 2011, when accumulated cheap funds (customer deposits) were reclaimed by
customers, thus forcing banks to better utilise remaining capital.
YearModel B
CDA TAA TEA NIO IFO BLA
2007 60.59% 19.56% 5.08% 57.46% 24.02% 5.03%
2008 46.76% 20.56% 3.96% 64.16% 26.30% 8.32%
2009 72.00% 20.87% 5.68% 55.85% 22.73% 1.59%
2010 68.93% 22.23% 6.12% 61.66% 23.29% 2.63%
2011 75.87% 23.70% 7.25% 55.57% 27.03% 1.37%
2012 65.36% 23.06% 5.63% 62.46% 22.03% 3.62%
-2
-1.5
-1
-0.5
0
0.5
1
1.5
2
2007 2008 2009 2010 2011 2012
CDA
TAA
TEA
NIO
IFO
BLA
8/10/2019 How Banks Make Money
http://slidepdf.com/reader/full/how-banks-make-money 56/67
Modestas Tomkus
[289440]
55 | P a g e
Considering the fact, that Model B is characterised as retail bank business model, there is no surprise
that banks income share from fees and commission (not the main source of revenues) maintained a
relative stability throughout the observation period. Never the less, the years 2008 and 2011 could
be treated as abnormal due to the higher IFO mean values. The increased IFO mean in 2008 by
approximately 2.28% (compared to 2007) as well as higher IFO mean in 2011 by approximately
3.74% (compared to 2010), both could be explained by the peaked CDA values during same years –
More customer deposits means more customers, more customers means more service fees.
The net interest income, being the main source of revenues for retail banks show a relatively
sensitive reaction to the financial market conditions. Identifier’s (NIO) value increases by
approximately 6.7% in 2008 (compared to 2007), which is a result of suffered great operating
expenses. An immediate drop in NIO mean value by approximately 8.31% in 2009, suggests
somewhat rebalanced banks’ expenses and income. The later increase in NIO mean by
approximately 5.81% experienced in 2010, suggest that bank managed to efficiently generate higher
share of revenue from interest bearing activities. However, NIO mean value dropped by
approximately 6.09% in 2011 (compared to 2010), which was due to abundance of cheap deposit
funding and decrease in lending interest rates. In 2012 the NIO mean value once again increased by
6.89% (compared to 2011), which is a result of a decrease in cheap deposit based funding and banks’
ability to efficiently utilise remaining funds in better priced loan market.
The trading asset share in total assets (TAA) maintained a small but steady growth (approximately
1.04% in average) throughout the observation period with a minor drop (approximately 0.64%) in
2012. Such growth could be a result of generally increased availability for cheap funding and/or
small margins on issued loans encouraging engaging in investment activities instead.
Model C
Figure 11 displays annual variables’ means and a line chart of their standardised values for Model C,
which was previously classified as investment oriented business model. The line chart shows a
substantial drop in investment model’s core identifier means in the year 2008 (compared to 2007)
and proceeding to fall until 2009 (compared to 2008). The core identifier mean values increased
steadily in the rest of the observed period.
The trading assets over total assets, being one of the core investment oriented business model
identifier, show a wave pattern throughout the observation period. The TAA mean value increased
significantly (approximately 14.61%) in the year 2008 when compared to 2007. Such an increase in
TAA mean value suggest that investment banks were unable to liquidise a part of their short-term
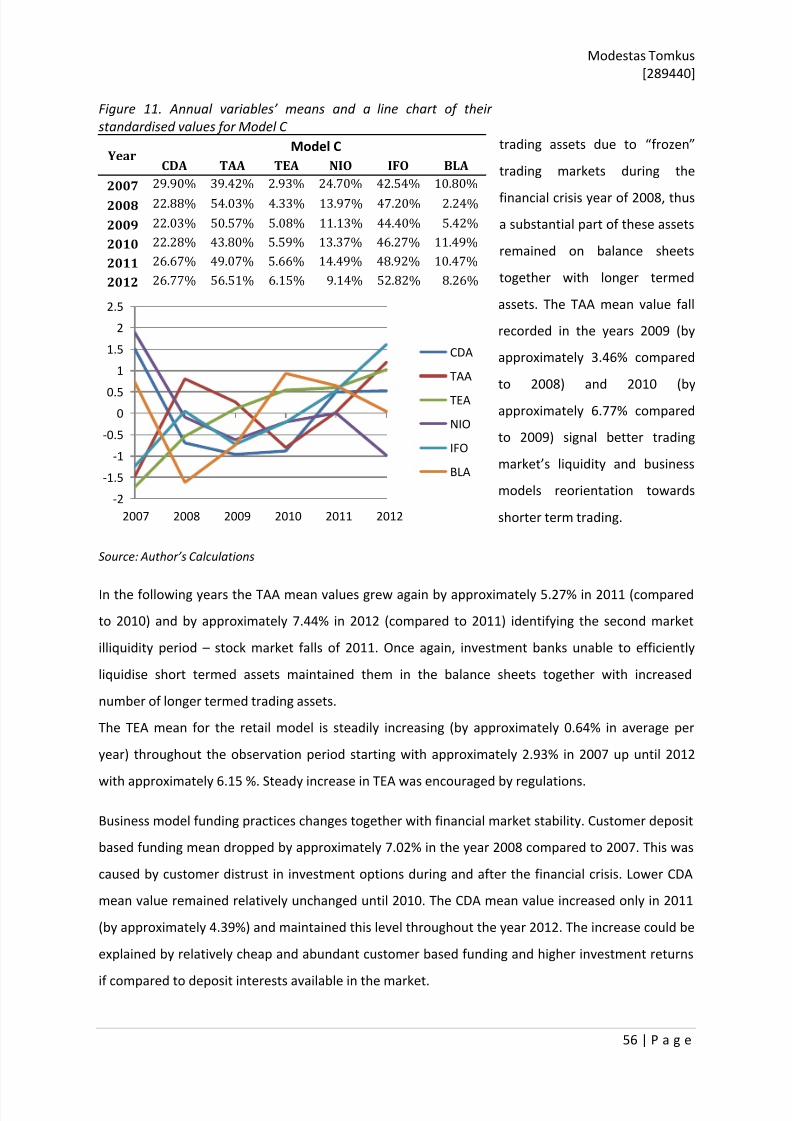
8/10/2019 How Banks Make Money
http://slidepdf.com/reader/full/how-banks-make-money 57/67
Modestas Tomkus
[289440]
56 | P a g e
Figure 11. Annual variables’ means and a line chart of their
standardised values for Model C
trading assets due to “frozen”
trading markets during the
financial crisis year of 2008, thus
a substantial part of these assets
remained on balance sheets
together with longer termed
assets. The TAA mean value fall
recorded in the years 2009 (by
approximately 3.46% compared
to 2008) and 2010 (by
approximately 6.77% compared
to 2009) signal better trading
market’s liquidity and business
models reorientation towards
shorter term trading.
Source: Author’s Calculations
In the following years the TAA mean values grew again by approximately 5.27% in 2011 (compared
to 2010) and by approximately 7.44% in 2012 (compared to 2011) identifying the second market
illiquidity period – stock market falls of 2011. Once again, investment banks unable to efficiently
liquidise short termed assets maintained them in the balance sheets together with increased
number of longer termed trading assets.
The TEA mean for the retail model is steadily increasing (by approximately 0.64% in average per
year) throughout the observation period starting with approximately 2.93% in 2007 up until 2012
with approximately 6.15 %. Steady increase in TEA was encouraged by regulations.
Business model funding practices changes together with financial market stability. Customer deposit
based funding mean dropped by approximately 7.02% in the year 2008 compared to 2007. This was
caused by customer distrust in investment options during and after the financial crisis. Lower CDA
mean value remained relatively unchanged until 2010. The CDA mean value increased only in 2011
(by approximately 4.39%) and maintained this level throughout the year 2012. The increase could be
explained by relatively cheap and abundant customer based funding and higher investment returns
if compared to deposit interests available in the market.
YearModel C
CDA TAA TEA NIO IFO BLA
2007 29.90% 39.42% 2.93% 24.70% 42.54% 10.80%
2008 22.88% 54.03% 4.33% 13.97% 47.20% 2.24%
2009 22.03% 50.57% 5.08% 11.13% 44.40% 5.42%
2010 22.28% 43.80% 5.59% 13.37% 46.27% 11.49%
2011 26.67% 49.07% 5.66% 14.49% 48.92% 10.47%
2012 26.77% 56.51% 6.15% 9.14% 52.82% 8.26%
-2
-1.5
-1
-0.5
0
0.5
1
1.5
2
2.5
2007 2008 2009 2010 2011 2012
CDA
TAA
TEA
NIO
IFO
BLA
8/10/2019 How Banks Make Money
http://slidepdf.com/reader/full/how-banks-make-money 58/67
Modestas Tomkus
[289440]
57 | P a g e
The wholesale funded share (BLA) in this business model maintained high sensitivity to the
wholesale loan interests. In 2008 BLA mean value dropped by approximately 8.56% compared to
2007, this was due to relative unavailability of all types of funding (compared to 2007) and especially
of short termed wholesale funding, which reached extremely high prices during the crisis. The
investment model’s BLA mean value increased steadily in the years 2009 (by approximately 3.18%
compared to 2008) and 2010 (by approximately 6.07% compared to 2009), which was fuelled by
increasingly cheaper wholesale funding and higher investment returns. The BLA mean value dropped
once again in the years 2011 (by approximately 1.02% compared to 2010) and 2012 (by
approximately 2.21% compared to 2011), which was a result of higher wholesale funding prices and
decreased market liquidity for short termed trading assets.
The investment model revenues are primarily fuelled by income from fees and commissions, which,
represented by IFO, show a general growing tendency (by approximately 2.06% annually)
throughout the observation period with exception of the year 2009, when IFO mean value decreased
by approximately 2.8% compared to 2008. The IFO’s growth tendency is parallel to TAA, as
commissions and fees are obtained trough trading activities. Never the less, the increased IFO mean
value by approximately 4.66% in the year 2008 is the abnormal one. The increase in IFO is caused by
effects of financial crisis, when suffered operating expenses immediately inflated the proportional
share accounted for income from fees and commission.
The models interest based income share (NIO) follows parallel curve pattern to CDA, as operations
funded by CDA are usually interest bearing activities. Thus observed NIO means fluctuate similarly by
reacting to external factors as CDA does.
The annually derived bank business models show a sensitive reaction to external factors such as
abnormal events (crises and market falls) and changes in regulative environment. Therefore derived
business model mean fluctuations can be interpreted as a good proxy for financial market’s annual
change evaluations.
8/10/2019 How Banks Make Money
http://slidepdf.com/reader/full/how-banks-make-money 59/67
Modestas Tomkus
[289440]
58 | P a g e
The business model of banks for each observed year
The clustering procedure performed on the data for each observed year not only provided
information on how business models changed , but also identified banks grouped under these
business models.
When a specific bank is grouped under different models in observed years, there could be few
explanations:
The bank might have changed his business model intentionally to focus on different
activities;
The bank might have suffered radical changes in their operations due to external or internal
reasons;
The bank might have simply fallen behind the required means for model identifiers;
Business model identifier means could be severely affected by dramatic market events, thus
making grouping requirements too extreme for some institutions.
The cluster membership data for each year is available in Appendix 11.
After looking trough clustering result for each year, two years stand out with significant differences
in bank-model membership from the rest of observation period.
The year 2008 was earlier identified as abnormal due to the financial crisis experienced that year.
Because of the crisis many banks suffered extreme fluctuations in their revenue sources, severe
funding issues and increased riskiness. Consequently, many banks reported data, which was far from
established original business model norms in a year before (2007) or after. Therefore, the banks
grouped under specific models in the year 2008 differ from banks’ originally intended models.
Similarly, in the year 2012 though much less intensively, many banks changed their models as well.
This year’s changes could be accounted to the stock market fall of the August 2011, which gradually
transferred the effect in the year 2012. Knowing about these events, the results including data from
these years should be treated with caution.
Observations
In the year 2007 model A grouped 25 banks, model B grouped 24 banks and model C grouped 14.
In the year 2008 model A grouped 5 banks, model B grouped 53 banks and model C grouped 5.
In the year 2009 model A grouped 39 banks, model B grouped 18 banks and model C grouped 6.
In the year 2010 model A grouped 35 banks, model B grouped 22 banks and model C grouped 6.
In the year 2011 model A grouped 43 banks, model B grouped 14 banks and model C grouped 6.
In the year 2012 model A grouped 29 banks, model B grouped 29 banks and model C grouped 5.
19 banks or 30.16% of total sample have not changed their business model throughout the
observation period. Of these: 1 bank is in model A (DZ Bank AG); 5 banks are in model C (Goldman
8/10/2019 How Banks Make Money
http://slidepdf.com/reader/full/how-banks-make-money 60/67
Modestas Tomkus
[289440]
59 | P a g e
Sachs Group, Inc; Morgan Stanley; Prudential Financial Inc; State Street Corporation; Charles Schwab
Corporation); and 13 banks are in model B (Wells Fargo & Company; US Bancorp; PNC Financial
Services Group Inc; BB&T Corporation; SunTrust Banks; Fifth Third Bancorp; Regions Financial
Corporation; Northern Trust Corporation; KeyCorp; M&T Bank Corporation; Comerica Incorporated;
PKO BP SA; Huntington Bancshares Inc).
25 banks or 39.68% of total sample have changed their business model only once, 4 of them are
banks headquartered USA. 18 banks that changed business model once, did so in the crisis year of
2008 (all of them changed from model A to model B).
If changes occurred on 2008 were to be ignored, 44 banks or 69.84% would have not changed their
business model in the observed period. Under the same assumption: 19 or 48% of banks under
model A would have maintained their business model; 13 or 72.22% of banks under model B would
have maintained their business model; 5 or 83.33% of banks under model C would have maintained
their business model.
9 banks or 14.29% of total sample changed their model 2 times, but did not maintained new model
for more than 1 year. Of them: 5 banks of 7.94% of total sample changed their business model from
A to B to C (2007-2008-2009) identifying a fundamental change in business model, possibly under
banks’ management decisions.
10 banks or 15.87% of total sample spent 2 years or 33.33% of observed period under different
business model. Of them 3 banks maintained new model in 2 consecutive years suggesting, that
banks operate on the line between two models, or intend to change the model (Bank of America
Corporation; Banco BPI SA; Piraeus Bank SA).
3 banks or 4.8% of the sample maintained 1 different business model for 3 years of 50% of observed
time period (HSBC Holdings Plc; Rabobank Group; Piraeus Bank SA).
6 banks or 9.5% of total sample were a member of all 3 business models throughout the observation
period implying volatile changes within the banks (Barclays Plc; Société Générale; Commerzbank AG;
Skandinaviska Enskilda Banken AB; BNP Paribas; KBC Group NV).
8/10/2019 How Banks Make Money
http://slidepdf.com/reader/full/how-banks-make-money 61/67
Modestas Tomkus
[289440]
60 | P a g e
7. Self-defined business models
This section will investigate how banks identify their own business models and how it compares to
the results from clustering analysis. Additionally, the description of applied methods will be
provided. Generated results will be discussed and re-evaluated. Finally, the results from clustering
analysis and auto-definitions will be compared; conflicting findings will be evaluated and discussed.
7.1 Data analysis and result
Self-defined or auto-defined business models are interpreted as business models expressed and/or
communicated by the banks themselves. In many cases, observed during the data collection process,
the banks do not communicate their business model in a standardised manner, instead a big variety
of approaches identifying their business models are available among sampled banks.
Seeking for a standardised approach, acquired data was divided into 3 major categories: (1) Target
activities; (2) Target markets; (3) target clients. Later, by summarizing observations in these
categories, the final bank’s business model was determined. The Model determination relied on
these guidelines: (1) specific business model is determined as such if the bank clearly specifies the
banks classification in observed data sources; (2) If clear identification is unavailable, banks’ business
models are derived by summarising prioritised target activities, target markets and target clients. In
this case, author’s general impression, after reading annual statements and official websites, is the
decisive factor.
The generalized auto-defined business models are presented in appendix 12.
Identified business models and member banks
42 banks of the total sample were identified as universally oriented banks
11 banks of the total sample were identified as retail oriented banks
6 banks of the total sample were identified as investment oriented banks
4 remaining banks were classified as members of unique business models: LCH Clearnet Group
Limited – a clearing house; SLM Corporation-Sallie Mae – a student loan originating and servicing
financial institution; Northern Trust Corporation – an asset management financial institution; Banco
BPI SA – a commercial bank).
When compared to clustering approach, self-defined business models were more diverse, but
maintained relatively similar proportions of grouped banks under same 3 business models. However,
at the same time 12 banks were allocated in a different business model when compared to
8/10/2019 How Banks Make Money
http://slidepdf.com/reader/full/how-banks-make-money 62/67
Modestas Tomkus
[289440]
61 | P a g e
clustering results. 4 of them were misclassified because of their uniquely different identified
business models.
6 banks auto-defined as universal, were classified as retail banks in clustering derived models (US
Bancorp; Capital One Financial Corporation; PNC Financial Services Group ; BB&T Corporation;
SunTrust Banks; Fifth Third Bancorp). The auto-defined classification of these banks was heavily
influenced by their own emphasis on their universality and diversification.
2 banks auto-defined as retail oriented, were classified as universal banks in clustering derived
models (Banco Bilbao; UBI Banca). The auto-defined classification of these banks was heavily
influenced by their own emphasis on retail segment.
The investment business model was auto-defined with 100% match if compared to clustering
defined business models. 35 or 89.7% banks self-defined as universal, matched universal banksclassified trough clustering. 9 or 50% banks self-defined as retail, matched retail banks classified
trough clustering.
Despite the introduced data categorisation, acquiring relative information proved to be difficult. The
observed banks in general do not provide an exact business model definition, often due to
terminology misinterpretation or simply because banks find it unnecessary to provide such
information.
Additionally, sampled banks, being biggest in the market, rarely operate under one business line.
Instead a diverse operation approach is taken with one or few leading business lines. Even if such a
bank favours specific line of business, it would still try to promote the universality of available
services to the public and its shareholders. Therefore, such a relative overrepresentation of available
but not essential business lines makes the final business model identification les precise.
It is also important to note, that banks operate similarly to most corporations when considering
communicated information, thus making the communicated information to public and shareholders
heavily influenced by their promotional campaigns. As a result, banks might be trying to promote a
certain business line, thus communicating business model that does not match their actual balance
sheets.
In summary, auto-defined business models partly matched to those derived trough clustering with a
reasonable accuracy. However, the used model identification process relies on less tangible data and
methodology making the results sensitive to the degree of interpretations. Therefore, from the
perspective of academics, the derived results could be seen as potentially bias due to high
involvement of author’s interpretations.
8/10/2019 How Banks Make Money
http://slidepdf.com/reader/full/how-banks-make-money 63/67
Modestas Tomkus
[289440]
62 | P a g e
8. Conclusions
The thesis used a sample of 63 biggest banking institutions from Europe and United States of
America with annual observations in the time period between 2007 and 2012 in order to determine
sampled banks’ business models and investigate their structure and behaviour in respect to internal
and external processes using publicly available information. For the purpose of model identification
6 cluster identifiers/variables summarising banks’ funding practices, revenue sources and riskiness
were constructed from gathered data
The observations’ grouping methodology was based on hierarchical clustering analysis, as its
features best suited the studied collected data and study objectives. The Performed preliminary
hierarchical clustering analysis and pseudo- F index pointed to 3 cluster solution. By using pooled
identifiers, hierarchical clustering analysis derived 3 distinctive models, which later were identified
as: model A – the universal banking business model grouping 39 banks; B – the retail banking
business model grouping 18 banks; C- The investment banking business model grouping 6 banks.
With intention to study business models’ evolutionary processes during the observed period, a
separate clustering analysis was performed for every year in the period of 6 years between 2007 and
2012. The investigation identified that business model identifiers’ means differ accordingly to the
changes both in the financial markets and internally within the banks. The Closer analysis of formed
clusters clearly showed the indication of the financial crisis of the year 2008, which was followed by
a lengthy slow growth period. Additionally, the observed abnormal readings in the year 2011 hint
the effect of the stock market fall in August 2011.
The analysis for cluster membership in the same period show abnormal variations in a number of
banks grouped under the models. Substantial bank movements between business models were
identified in the years 2008 and 2012. While the banks’ movement in 2008 was related to the crisis,
the migration between models in 2012 was suspected to be caused by the lasting effect of the
market fall in 2011. The observed model migrations were largely linked to the extreme model
identifier mean fluctuations, never the less some banks performed better than others maintaining
established models.
The secondary approach used to determine banking business models was based on banks’ auto -
definitions. The analysis for self-defined business models has proven to be complicated as some of
the observed banks in general do not provide an exact business model definition, often due to
terminology misinterpretation or simply because banks find it unnecessary to provide suchinformation. Consequently, a large part of acquired data is a result of interpretation of the latest
8/10/2019 How Banks Make Money
http://slidepdf.com/reader/full/how-banks-make-money 64/67
Modestas Tomkus
[289440]
63 | P a g e
published annual statements or official websites. The self-defined business models in general were
communicated as universal banking business models, while the retail based models were more than
4 times less popular. In the same setting the investment oriented models matched exactly to those
derived through clustering.
In summary, the performed study proved to be technically capable of identifying business models
with the use of 6 derived identifiers for the sampled banks and provided analytical insight in the
constructed business models and banks within the observation period. Nevertheless, the results of
the study are highly dependent on multiple factors that defined the processes and methodology of
this study, thus, the findings of the study should be evaluated with care.
Notes:
The data and calculations concerning the study can be found in a digital attachment or requested
from the author.
An additional list of publications, that served as inspirations and provided ideas for the study: (Chen
2009); (Haldane, May 2011); (Mayo, Brown 1999); (Ciarrapico, Cosci 2011); (DeYoung, Rice
2004);(Goisis, Giorgetti et al. 2009); (IONESCU 2012); (Sengupta, Noeth 2012); (Thakor, Boot 2010)
8/10/2019 How Banks Make Money
http://slidepdf.com/reader/full/how-banks-make-money 65/67
Modestas Tomkus
[289440]
64 | P a g e
References
ACHARYA, V.V., BRENNER, M., ENGLE, R., LYNCH, A. and RICHARDSON, M., 2009. Derivatives- The
Ultimate Financial Innovation. Financial markets, institutions & instruments, 18(2), pp. 166.
ADAMS, D.R., 1978. THE BEGINNING OF INVESTMENT BANKING IN THE UNITED STATES.
Pennsylvania History, 45(2), pp. 99.
ADRIAN, T. and SHIN, H.S., 2010. Liquidity and leverage. Journal of Financial Intermediation, 19(3),
pp. 418.
AFUAH, A., 2004. Business models : a strategic management approach. Boston: McGraw-Hill/Irwin.
AMIT, R. and ZOTT, C., 2011. The business model. Journal of management, 37(4), pp. 1019.
AMIT, R. and ZOTT, C., 2001. Value Creation in E-Business. Strategic Management Journal, 22(6/7),
pp. 493.
AYADI, R., ARBAK, E. and DE GROEN, W.P., 2012. REGULATION OF EUROPEAN BANKS AND BUSINESS
MODELS: TOWARDS A NEW PARADIGM? Centre for European Policy Studies: Centre for European
Policy Studies.
AYADI, R., ARBAK, E. and DE GROEN, W.P., 2011. BUSINESS MODELS IN EUROPEAN BANKING: A PRE-
AND POST-CRISIS SCREENING. Centre for European Policy Studies: Centre for European Policy
Studies.
BANKSCOPE, 2013-last update, Bureau Van Dijk’s independence indicator. Available:https://bankscope2.bvdep.com/version-2014115/home.serv?product=scope2006 [11/27, 2013].
BBC BUSINESS NEWS, 2011, 10 August 2011. Stock markets fall again as bank shares tumble.
Available:http://www.bbc.co.uk/news/business-14472079 [11/27, 2013]. BBC Business news.
CALIŃSKI, T. and HARABASZ, J., 1974. A dendrite method for cluster analysis. Communications in
Statistics, 3(1), pp. 1-27.
CASADESUS-MASANELL, R. and RICART, J.E., 2010. From Strategy to Business Models and onto
Tactics. Long range planning, 43(2), pp. 195.
CHEN, T.F., 2009. BUILDING A PLATFORM OF BUSINESS MODEL 2.0 TO CREATING REAL BUSINESS
VALUE WITH WEB 2.0 FOR WEB INFORMATION SERVICES INDUSTRY. International Journal of
Electronic Business Management, 7(3), pp. 168.
CHESBROUGH, H. and ROSENBLOOM, R.S., 2002. The role of the business model in capturing value
from innovation. Industrial and corporate change, 11(3), pp. 529.
CIARRAPICO, A.M. and COSCI, S., 2011. European banks and cross-selling. Applied economics letters,
18(4/6), pp. 555.
8/10/2019 How Banks Make Money
http://slidepdf.com/reader/full/how-banks-make-money 66/67
Modestas Tomkus
[289440]
65 | P a g e
DEMYANYK, Y. and VAN HEMERT, O., 2011. Understanding the Subprime Mortgage Crisis. Review of
Financial Studies, 24(6), pp. 1848.
DEUTSCHE BANK AG, 2010. Direct fiscal cost of the financial crisis. Available:
http://www.dbresearch.com/PROD/DBR_INTERNET_EN-ROD/PROD0000000000257663.PDF; (11/29,
2013).
DEYOUNG, R. and RICE, T., 2004. How do banks make money? The fallacies of fee income. Economic
Perspectives, 28(4), pp. 34.
EINAV, L. and JENKINS, M., 2013. The impact of credit scoring on consumer lending. The Rand journal
of economics, 44(2), pp. 249.
EUROPE INTELLIGENCE WIRE, 2010. Banks After Crisis. Europe Intelligence Wire.
FERSTL, R. and SERES, D., 2012. Clustering Austrian Banks’ Business Models and Peer Groups in the
European Banking Sector. 24. Vienna, Austria: Oesterreichische Nationalbank.
GEORGE, G. and BOCK, A.J., 2011. The Business Model in Practice and its Implications for
Entrepreneurship Research. Entrepreneurship Theory and Practice, 35(1), pp. 83.
GOISIS, G., GIORGETTI, M.L., PARRAVICINI, P., SALSANO, F. and TAGLIABUE, G., 2009. Economies of
scale and scope in the European banking sector. International Review of Economics, 56(3), pp. 227.
HALDANE, A.G. and MAY, R.M., 2011. Systemic risk in banking ecosystems. Nature, 469(7330), pp.
351.
HAMEL, G., 2000. Leading the Revolution. Boston : H B S Press Imprint.
HOAGLIN, D.C. and IGLEWICZ, B., 1987. Fine-Tuning Some Resistant Rules for Outlier Labeling.
Journal of the American Statistical Association, 82(400), pp. 1147.
HUANG, H. and LIN, P., 2012. Banking industry volatility and growth. Journal of macroeconomics,
34(4), pp. 1007.
IONESCU, I.G., 2012. CATEGORIES AND TYPES OF BANKING INSTITUTIONS. Annals of the University of
Petrosani : Economics, (1), pp. 163.
LLEWELLYN, D.T., 2010. The global banking crisis and the post-crisis banking and regulatory scenario.
Amsterdam Center for Corporate Finance - LA English.
MACMILLAN, I.C. and THOMPSON, J.D., 2010. Business models. Long range planning, 43(2/3), pp.
291.
MAGRETTA, J., 2002. Why business models matter. Harvard Business Review - LA English.
MAYO, M.C. and BROWN, G.S., 1999. Building a competitive business model. Ivey Business Journal,
63(3), pp. 18.
8/10/2019 How Banks Make Money
http://slidepdf.com/reader/full/how-banks-make-money 67/67
Modestas Tomkus
[289440]
MILLIGAN, G.W., 1985. An Examination of Procedures for Determining the Number of Clusters in a
Data Set. Psychometrika - LA English, 50(2), pp. 159.
MILLIGAN, G.W., 1981. A Review Of Monte Carlo Tests Of Cluster Analysis. Multivariate Behavioral
Research, 16(3), pp. 379-407.
MORGAN STANLEY, 2008-last update, Morgan Stanley Granted Federal Bank Holding Company
Status By U.S. Federal Reserve Board of Governors (Press Release). Available:
http://www.morganstanley.com/about/press/articles/6933.html [11/27, 2013].
OSTERWALDER, A. and PIGNEUR, Y., 2010. Business model generation. Wiley - LA German.
OSTERWALDER, A., PIGNEUR, Y. and TUCCI, C.L., 2005. Clarifying Business Models: Origins, Present,
and Future of the Concept. Communications of the Association for Information Systems, 16, pp. 1.
RICHARDSON, J., 2008. The business model. Strategic change, 17(5/6), pp. 133.
SENGUPTA, R. and NOETH, B., 2012. Global European banks and the financial crisis. Review, 94(6),
pp. 457.
SHAFER, S.M., SMITH, H.J. and LINDER, J.C., 2005. The power of business models. Elsevier Inc;
Elsevier Science Ltd - LA English.
STULZ, R.M. and WILLIAMSON, R., 2003. Culture, openness, and finance. Journal of Financial
Economics, 70(3), pp. 313.
THAKOR, A.V. and BOOT, A.W.A., 2010. The accelerating integration of banks and markets and its
implications for regulation. Oxford University Press - LA English, .
THAKOR, A.V. and BOOT, A.W.A., 2010. The accelerating integration of banks and markets and its
implications for regulation. Oxford University Press - LA English, .
WARD, J.H., 1963. Hierarchical Grouping to Optimize an Objective Function. Journal of the American
Statistical Association, 58(301), pp. 236.
WEHINGER, G., 2008. Lessons from the Financial Market Turmoil: Challenges ahead for the Financial
Industry and Policy Makers. Organisation for Economic Cooperation and Development (OECD) - LA
English.
ZOTT, C. and AMIT, R., 2008. The fit between product market strategy and business model:
implications for firm performance. Strategic Management Journal, 29(1), pp. 1.
ZOTT, C. and AMIT, R., 2007. Business Model Design and the Performance of Entrepreneurial Firms.
Organization Science 18(2) pp 181